evaluation of the fire hazard of ashrae class a3 ... · this study evaluated the flammability...
TRANSCRIPT

© 2017 Fire Protection Research Foundation
1 Batterymarch Park, Quincy, MA 02169-7417, USA Email: [email protected] | Web: nfpa.org/foundation
Evaluation of the Fire Hazard of ASHRAE Class A3 Refrigerants in Commercial Refrigeration Applications FINAL REPORT BY: Scott G. Davis, Ph.D., P.E., CFEI Gexcon US, Inc. 4833 Rugby Avenue, Suite 100 Bethesda, MD 20814 October 2017

—— Page ii ——

—— Page iii ——
FOREWORD Due to the potential environmental impact, there has been a shift to consider use of natural
refrigerants, which have a lower Global Warming Potential (GWP) than traditional fluorocarbon-
based refrigerants. One type of natural refrigerant are hydrocarbons (e.g. propane), which are
classified as Class A3 refrigerants per ASHRAE Standard 34. The Environmental Protection
Agency (EPA) has a charge limit of 150g of hydrocarbon per appliance, which is defined as a
closed loop refrigeration circuit. Previous work has been completed on Class A2L refrigerants,
but Class A3 refrigerants need more study to provide technical basis for any changes to the
current limits for use in refrigerator units. There is a need to assess the fire hazard of Class A3
refrigerants, and specifically propane, in larger volumes to evaluate their viability as alternatives
to traditional refrigerants in more applications.
The Fire Protection Research Foundation expresses gratitude to the report author Dr. Scott G.
Davis and the research team at Gexcon, whose US headquarters is located at 4833 Rugby
Avenue, Suite 100, Bethesda, MD 20814. The Research Foundation appreciates the guidance
provided by the Project Technical Panelists, the funding provided by the project sponsors, and all
others that contributed to this research effort.
The content, opinions and conclusions contained in this report are solely those of the authors and
do not necessarily represent the views of the Fire Protection Research Foundation, NFPA,
Technical Panel or Sponsors. The Foundation makes no guaranty or warranty as to the accuracy
or completeness of any information published herein.
About the Fire Protection Research Foundation
The Fire Protection Research Foundation plans,
manages, and communicates research on a broad
range of fire safety issues in collaboration with
scientists and laboratories around the world. The Foundation is an affiliate of NFPA.
About the National Fire Protection Association (NFPA)
Founded in 1896, NFPA is a global, nonprofit organization devoted to eliminating death, injury, property and economic loss due to fire, electrical and related hazards. The association delivers information and knowledge through more than 300 consensus codes and standards, research, training, education, outreach and advocacy; and by partnering with others who share an interest in furthering the NFPA mission. All NFPA codes and standards can be viewed online for free. NFPA's membership totals more than 65,000 individuals around the world.
Keywords: R-290, propane, refrigerant flammability, ASHRAE class A3, risk assessment, ignition consequences of A3 refrigerants, charge size, LFL, UFL, accidental releases.
Report number: FPRF-2017-15

—— Page iv ——
This page intentionally blank
—— Page v ——
PROJECT TECHNICAL PANEL
Mark Adams, Johnson Controls (PA)
Denise Beach, FM Global (MA)
Stephen Benton, Cool Concerns (UK)
Susan Bershad, NFPA 55 Staff Liaison (MA)
Michael Deru, NREL (CO)
Manny Ehrlich, CSB (NJ)
Predrag Hrnjak, University of Illinois (IL)
Diana Parks, State of Alaska Department of Public Safety (Retd.) (AK)
Doug Reindl, University of Wisconsin (WI)
Mark Skierkiewicz, UL LLC (IL)
Bruce Swiecicki, NPGA (IL)
Keilly Witman, KW Refrigerant Management Strategy (CA)
Xudong Wang, AHRI (VA)
TECHNICAL LIAISON
Dave Godwin (DC)

—— Page vi ——
This page intentionally blank
—— Page vii ——
PROJECT SPONSORS
Principal Sponsors:
AHT Ron Soban; Andreas Schachner
Bitzer Peter Narreau; Joe Sanchez
Carter (UK) Andrew Santer; Steve MacWilliams;
Darren Russell; Neil Moss
Delhaize Harrison Horning
Emerson Kurt Knapke; Marc Scancarello
Heatcraft Sean Rainsford; Brian Hawthorne
Hillphoenix Scott Martin; Jules Choueifati;
Dustan Atkinson; Jeff Newel
Hussmann Dan Conrad
Target Paul Anderson; Karen Rebman;
Erich Schwab
Participating Sponsors:
Chemours Mary Koban; Stephen Spletzer
Energy Squared Consulting
Engineers Allan Samuels; Clive Samuels
CTA Architects Engineers Rob Arthur

—— Page viii ——
This page intentionally blank

—— Page ix ——
RESEARCH TEAM MEMBERS
Gexcon US:
Principal Investigator Dr. Scott Davis, PE
Investigator Dr. John Pagliaro
Investigator Drew Botwinick
Team member Derek Engel
Gexcon AS:
Experimental director Kees van Wingerden
Experimental member Matthijs van Wingerden
Experimental member Morten Holme

—— Page x ——
This page intentionally blank
Evaluation of the Fire Hazard of ASHRAE Class A3 Refrigerants in
Commercial Refrigeration Applications
October 16, 2017
Prepared for:
The Fire Protection Research Foundation
1 Batterymarch Park
Quincy, MA 02169
Prepared by:
Gexcon US, Inc.
4833 Rugby Avenue, Suite 100
Bethesda, MD 20814
Ph. (301) 915 -9940
www.gexconus.com

i
DISCLAIMER
This report was prepared by Gexcon US, Inc. for the Fire Protection Research Foundation. The
material in it reflects Gexcon’s best engineering judgment in light of the information available to
it at the time of preparation. Any use which a third party makes of this report, or any reliance on
or decisions to be made based on it, are the responsibility of such third party. In no event shall
Gexcon, or its respective officers, employees be liable for any indirect, incidental, special, punitive
or consequential damages arising out of or relating in any way to decisions made or actions taken
or not taken based on this report.

ii
Table of Contents Executive Summary ....................................................................................................................... iii
1 Introduction ............................................................................................................................. 1
1.1 Background ................................................................................................................... 1
1.2 Objectives ..................................................................................................................... 1
1.3 Approach ...................................................................................................................... 1
2 Analysis................................................................................................................................... 2
2.1 Current Standards and R-290 Charge Size Limits ........................................................ 2
2.2 Introduction to Hazard Analysis and Risk .................................................................... 2
2.3 Factors Affecting the Outcome of a Leak .................................................................... 7
2.4 Establishing Rulesets for the Risk Assessment .......................................................... 19
2.5 Leak Mass Flow Rate vs Leak Hole Size ................................................................... 22
2.6 Gap Analysis............................................................................................................... 23
2.7 Environmental Settings and Sources of Ignition ........................................................ 24
3 Full-Scale Testing ................................................................................................................. 26
3.1 Design of Experiments ............................................................................................... 26
3.2 Test Room and Display Case ...................................................................................... 26
3.3 Instrumentation and Data Collection .......................................................................... 27
3.4 Dispersion Tests ......................................................................................................... 28
3.5 Ignition Tests .............................................................................................................. 36
4 Comparison of CFD Dispersion Predictions to Measurements ............................................ 46
5 Risk Assessment ................................................................................................................... 48
5.1 Method ........................................................................................................................ 48
5.2 Scenarios / Geometries ............................................................................................... 49
5.3 Consequence Analysis ................................................................................................ 59
5.4 Frequency Analysis .................................................................................................... 68
5.5 Uncertainty, Assumptions, and Relative Risk ............................................................ 76
5.6 Results ........................................................................................................................ 78
5.7 Discussion ................................................................................................................... 90
6 Summary and Recommendations ......................................................................................... 96
6.1 Main Findings from the Risk Study ........................................................................... 96
6.2 Leaks ........................................................................................................................... 97
6.3 Preliminary Recommendations to Reduce Risks........................................................ 98
7 Future Work ........................................................................................................................ 100
8 References ........................................................................................................................... 102
Appendix A - FLACS Dispersion Predictions Versus Measurements ....................................... 104
Appendix B - Failure Mode Effects Analysis ............................................................................. 108

iii
Executive Summary
This study evaluated the flammability hazard of R-290 propane in refrigeration appliances used in
commercial retail and kitchen settings. The specific objectives were to: (1) assess the flammability
risk versus charge size; and (2) develop recommendations on how to prevent or mitigate the risks
when using R-290 in commercial retail and kitchen applications. This type of study is needed to
establish a technical basis for any changes to the current charge limits and to help determine
whether A3 refrigerants can replace non-flammable refrigerants in a broader range of refrigeration
applications that require larger charges than currently allowed by standards.
When a flammable refrigerant is released from a refrigeration cycle, there are several factors that
affect the potential severity of the event including properties of the refrigerant, characteristics of
the leak, properties of the equipment, and aspects of the environment. Two very important factors
that must be considered are: (1) the increased release rates associated with leaks in the liquid lines
and (2) whether releases in confined areas, like the condensing unit housing, impinge on adjacent
surfaces and lose their momentum. The present study considered these two main factors, along
with many others, and used computational fluid dynamics (CFD) to examine in detail how each
factor influenced the outcome of a leak.
Full-scale testing quantified the severity of various refrigerant releases and associated post-ignition
events for different charge sizes. Coupling the experimental results with CFD simulations revealed
that severity (in terms of thermal exposure and overpressure) was related to the mass of R-290 that
participated in the combustion event once ignited. While this variable was limited by the charge
size, it was also strongly dependent on how well R-290 mixed with air in the room during the
release. This was because better mixing with air resulted in more dilution of R-290 below the
lower flammability limit and therefore less R-290 participating in the combustion event once
ignited.
A quantitative assessment of relative risk versus charge size was performed using inputs from the
full-scale experiments, CFD dispersion simulations, and an analysis of the likelihood of various
outcomes. The assumptions of this study were intended to establish an upper bound for the absolute
risk. As such, conservative assumptions were employed in the present study to maximize
accumulated fuel volumes and ignition consequences. Considering the conservatism in the
approach and the inherent uncertainty associated with the leak frequencies, it is more appropriate
to discuss relative risk in the present analysis. The focus of the assessment was to examine larger
charge sizes and possible mitigation effects that could be implemented as part of the design and
installation of refrigeration units. The approach of using relative risk facilitates investigation of
these effects with reduced sensitivity to some sources of uncertainty, e.g. leak frequencies.
Summarized below are the main findings:
• As charge size increases, the probability of an ignition event increases as the mass of R-
290 available to accumulate within the space also increases.
• Servicing generally represents a small contribution to the overall frequency of an ignition
event assuming that the refrigerant is either recovered or vented prior to servicing and that
proper procedures are followed.
iv
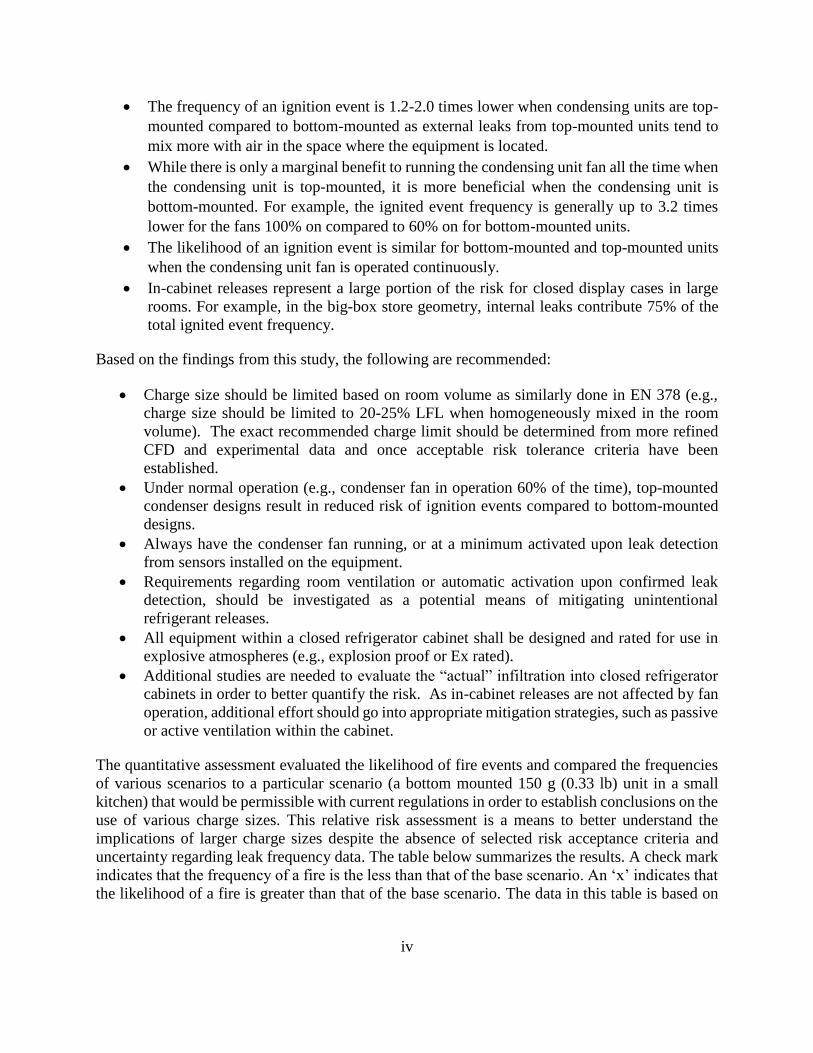
• The frequency of an ignition event is 1.2-2.0 times lower when condensing units are top-
mounted compared to bottom-mounted as external leaks from top-mounted units tend to
mix more with air in the space where the equipment is located.
• While there is only a marginal benefit to running the condensing unit fan all the time when
the condensing unit is top-mounted, it is more beneficial when the condensing unit is
bottom-mounted. For example, the ignited event frequency is generally up to 3.2 times
lower for the fans 100% on compared to 60% on for bottom-mounted units.
• The likelihood of an ignition event is similar for bottom-mounted and top-mounted units
when the condensing unit fan is operated continuously.
• In-cabinet releases represent a large portion of the risk for closed display cases in large
rooms. For example, in the big-box store geometry, internal leaks contribute 75% of the
total ignited event frequency.
Based on the findings from this study, the following are recommended:
• Charge size should be limited based on room volume as similarly done in EN 378 (e.g.,
charge size should be limited to 20-25% LFL when homogeneously mixed in the room
volume). The exact recommended charge limit should be determined from more refined
CFD and experimental data and once acceptable risk tolerance criteria have been
established.
• Under normal operation (e.g., condenser fan in operation 60% of the time), top-mounted
condenser designs result in reduced risk of ignition events compared to bottom-mounted
designs.
• Always have the condenser fan running, or at a minimum activated upon leak detection
from sensors installed on the equipment.
• Requirements regarding room ventilation or automatic activation upon confirmed leak
detection, should be investigated as a potential means of mitigating unintentional
refrigerant releases.
• All equipment within a closed refrigerator cabinet shall be designed and rated for use in
explosive atmospheres (e.g., explosion proof or Ex rated).
• Additional studies are needed to evaluate the “actual” infiltration into closed refrigerator
cabinets in order to better quantify the risk. As in-cabinet releases are not affected by fan
operation, additional effort should go into appropriate mitigation strategies, such as passive
or active ventilation within the cabinet.
The quantitative assessment evaluated the likelihood of fire events and compared the frequencies
of various scenarios to a particular scenario (a bottom mounted 150 g (0.33 lb) unit in a small
kitchen) that would be permissible with current regulations in order to establish conclusions on the
use of various charge sizes. This relative risk assessment is a means to better understand the
implications of larger charge sizes despite the absence of selected risk acceptance criteria and
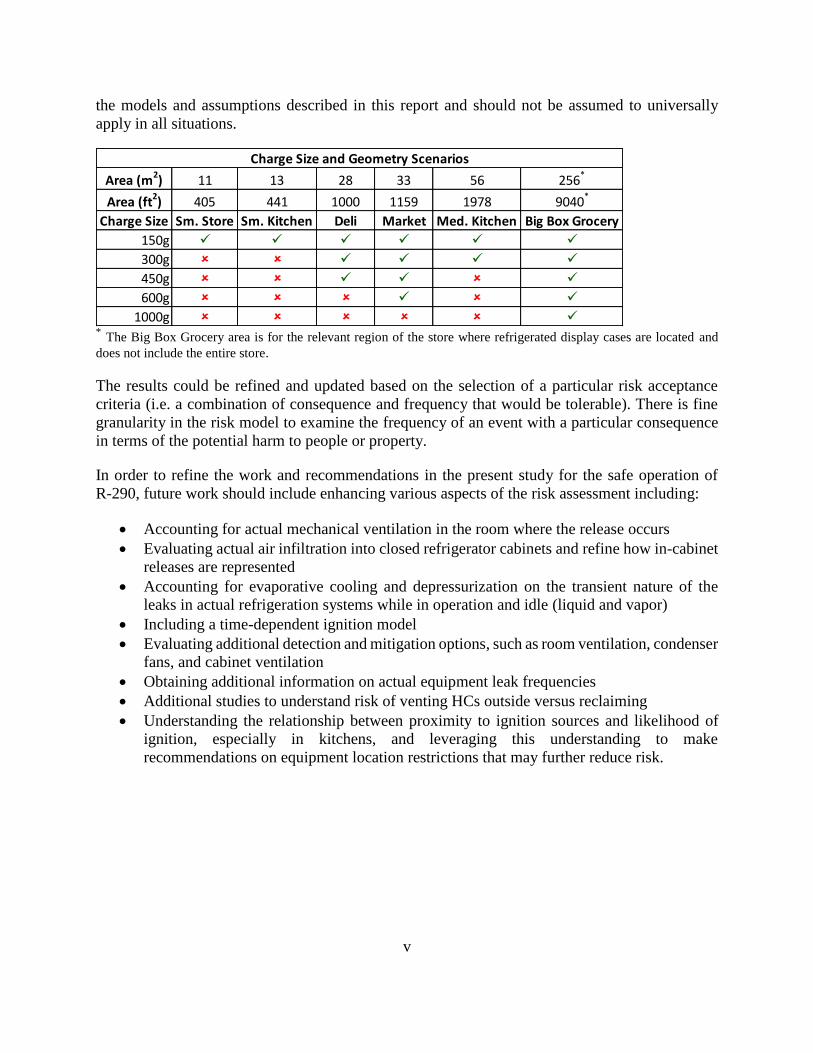
uncertainty regarding leak frequency data. The table below summarizes the results. A check mark
indicates that the frequency of a fire is the less than that of the base scenario. An ‘x’ indicates that
the likelihood of a fire is greater than that of the base scenario. The data in this table is based on
v
the models and assumptions described in this report and should not be assumed to universally
apply in all situations.
* The Big Box Grocery area is for the relevant region of the store where refrigerated display cases are located and
does not include the entire store.
The results could be refined and updated based on the selection of a particular risk acceptance
criteria (i.e. a combination of consequence and frequency that would be tolerable). There is fine
granularity in the risk model to examine the frequency of an event with a particular consequence
in terms of the potential harm to people or property.
In order to refine the work and recommendations in the present study for the safe operation of
R-290, future work should include enhancing various aspects of the risk assessment including:
• Accounting for actual mechanical ventilation in the room where the release occurs
• Evaluating actual air infiltration into closed refrigerator cabinets and refine how in-cabinet
releases are represented
• Accounting for evaporative cooling and depressurization on the transient nature of the
leaks in actual refrigeration systems while in operation and idle (liquid and vapor)
• Including a time-dependent ignition model
• Evaluating additional detection and mitigation options, such as room ventilation, condenser
fans, and cabinet ventilation
• Obtaining additional information on actual equipment leak frequencies
• Additional studies to understand risk of venting HCs outside versus reclaiming
• Understanding the relationship between proximity to ignition sources and likelihood of
ignition, especially in kitchens, and leveraging this understanding to make
recommendations on equipment location restrictions that may further reduce risk.
Area (m2) 11 13 28 33 56 256*
Area (ft2) 405 441 1000 1159 1978 9040*
Charge Size Sm. Store Sm. Kitchen Deli Market Med. Kitchen Big Box Grocery
150g ✓ ✓ ✓ ✓ ✓ ✓
300g ✓ ✓ ✓ ✓
450g ✓ ✓ ✓
600g ✓ ✓
1000g ✓
Charge Size and Geometry Scenarios
1
1 Introduction
1.1 Background
Hydrocarbons, including R-290 (propane), are viable refrigerant working fluids with zero ozone
depleting potential (ODP) and minimal global warming potential (GWP). The current barrier to
more widespread application of hydrocarbons as refrigerants, and A3 refrigerants in general, is
their flammability. While fundamental flammability characteristics are well established for most
hydrocarbons, there is a need to assess the risks associated with their use as refrigerants and
evaluate methods to mitigate such risks, specifically when charge sizes are larger than the currently
mandated limits. Further studies are needed to establish a technical basis for any changes to the
current charge limits in refrigeration appliances. Furthermore, assessing the risk for larger charge
sizes than currently allowed by standards will help determine whether A3 refrigerants can replace
hydrofluorocarbons (HFCs) in a broader range of refrigeration and heating, ventilation, and air
conditioning (HVAC) applications.
1.2 Objectives
The primary goal of the present study is to evaluate the fire hazard of R-290 (propane) in
refrigeration appliances used in commercial retail and kitchen settings. The specific objectives are
to: (1) perform a risk assessment to evaluate risk versus charge size; and (2) develop
recommendations on how to prevent or mitigate the risks of using R-290 in commercial retail and
kitchen applications.
1.3 Approach
Outlined below is the approach followed in the present study:
1) Identify flammability hazards associated with R-290 in commercial refrigeration
applications
2) Identify parameters that influence likelihood and severity of these hazards
a. Literature review
b. CFD to confirm previous findings and dominating factors
c. CFD to establish rulesets
3) Understand the environmental settings
a. Geometries
b. Ignition sources
4) Identify research gaps
5) Perform experiments to:
a. Confirm the factors that impact the outcome of a leak
b. Quantify severity
c. Fill research gaps
d. Test mitigation methods
e. Validate CFD models
6) Assess risk quantitatively by:
2
a. Establishing failure modes and their effects
b. Establishing leak frequencies and ignition probabilities for different environments
c. Determining severity of events with CFD
7) Provide recommendations based on:
a. Experimental and numerical findings
b. Risk assessment results
2 Analysis
2.1 Current Standards and R-290 Charge Size Limits
It is helpful to review current charge size limits in relevant standards given that a primary objective
of the present study is to evaluate risk versus R-290 charge size. Table 2.1 lists the standards
providing guidance on the use of flammable refrigerants in commercial refrigeration appliances.
ISO 5149 and EN378 provide charge size limits for use of A3 refrigerants in commercial
refrigerated display cases in occupied spaces. Permissible charge sizes are based on the room
volume where the display case is located and the lower flammability limit (LFL) of the refrigerant,
and charge sizes are capped at a maximum of 1.5 kg (3.3 lb). UL 471 and IEC 60335-2-89 allow
R-290 charges sizes up to 150 g (0.33 lb) for commercial refrigeration applications regardless of
the volume of the room where the equipment is located. As such, the EPA has granted SNAP
approval for R-290 charges up to 150 g (0.33 lb).
Table 2.1: International, domestic, and European Standards with guidance on the use of A3 refrigerants in
commercial refrigeration applications.
2.2 Introduction to Hazard Analysis and Risk
Risk is the combination of likelihood of an event occurring and severity of this event. The
likelihood of a combustion event is the likelihood of having the release and accumulation of fuel
within a given space and a competent ignition source at the same time the fuel mixture is present.
Standard Title Application HC charge size limits
UL 471 Standard for Commercial
Refrigerators and
Freezers
Commercial
refrigeration appliances
Up to 150 g (0.33 lb)
IEC 60335-2-89 Particular requirements
for commercial
refrigerating appliances
with an incorporated or
remote refrigerant unit of
compressor
Commercial
refrigeration appliances
Up to 150 g (0.33 lb)
ISO 5149
and EN 378
Refrigerating systems
and heat pumps - Safety
and environmental
requirements
All refrigeration, air
conditioning, and heat
pump applications;
domestic, commercial,
and industrial
Varies by access category and location
classification:
M max = 0.20 * LFL * A room * h room
up to 1.5 kg (3.3 lb) in normally occupied
spaces

3
The consequence of a combustion event is what happens after the fuel is ignited, and its severity
can be rated by the degree of damage it causes to the facility/property or injury to humans.
One of the first steps in assessing the risk of R-290 in commercial refrigeration appliances is
identifying the potential hazards associated with an accidental release of the refrigerant. Leaks
can occur inside the conditioned space of a closed unit or external to the conditioned space of
either an open or closed unit (i.e., in the room where the unit is located), and therefore the potential
hazards when R-290 is released and ignited include:
1) Overpressures generated by the rapid expansion of the combustion products
2) Thermal radiation exposure
3) Direct flame exposure
4) Fragmentation of a glass or metal display case door due to internal deflagration
When there is a leak of a pressurized flammable fluid, such as R-290, there are two general
outcomes that can result in the flammability hazards identified above: (1) when the flammable
fluid is ignited and burns in the immediate plume of the leaking fluid, sometimes referred to as a
flammable jet or a jet fire; or (2) when the flammable fluid builds up in regions remote from the
leak and also burns in regions remote from the jet plume.
A flammable jet or jet fire is a turbulent diffusion flame, whereby the leaking fluid and air are not
intimately mixed where the flame is burning. R-290 is stored and operated at elevated pressures
within the equipment, hence when there is a loss of containment (e.g., hole), the fluid (vapor or
liquid) is released at high velocity and momentum resulting in a “plume” of vapor. Air is entrained
into the jet due to the high velocity and momentum of the released fluid relative to the air, and the
plume is gradually diluted at a certain distance downstream the release. The left image in Figure
2.1 shows a pure fluid (represented as red) released horizontally that gradually dilutes to green
then further to blue downstream from the release. The right image in Figure 2.1 shows an example
of R-290 vapor being released horizontally from a 6-mm diameter hole forming a jet and a plume
of fuel; the figure also includes a legend providing concentration, where red presents
concentrations above the upper flammability limit (UFL or too fuel rich to burn) and blue at the
LFL.
Figure 2.1: Left image is a sonic horizontal jet release, where the density of the pure fluid is red near the release,
and gradually gets diluated with air as it goes to green then blue. The right image is the simulated concentration
of a R-290 sonic release from a 6 mm (0.24 in) diamter hole, where dark red represents concentrations above
the UFL and blue is at the LFL.
4
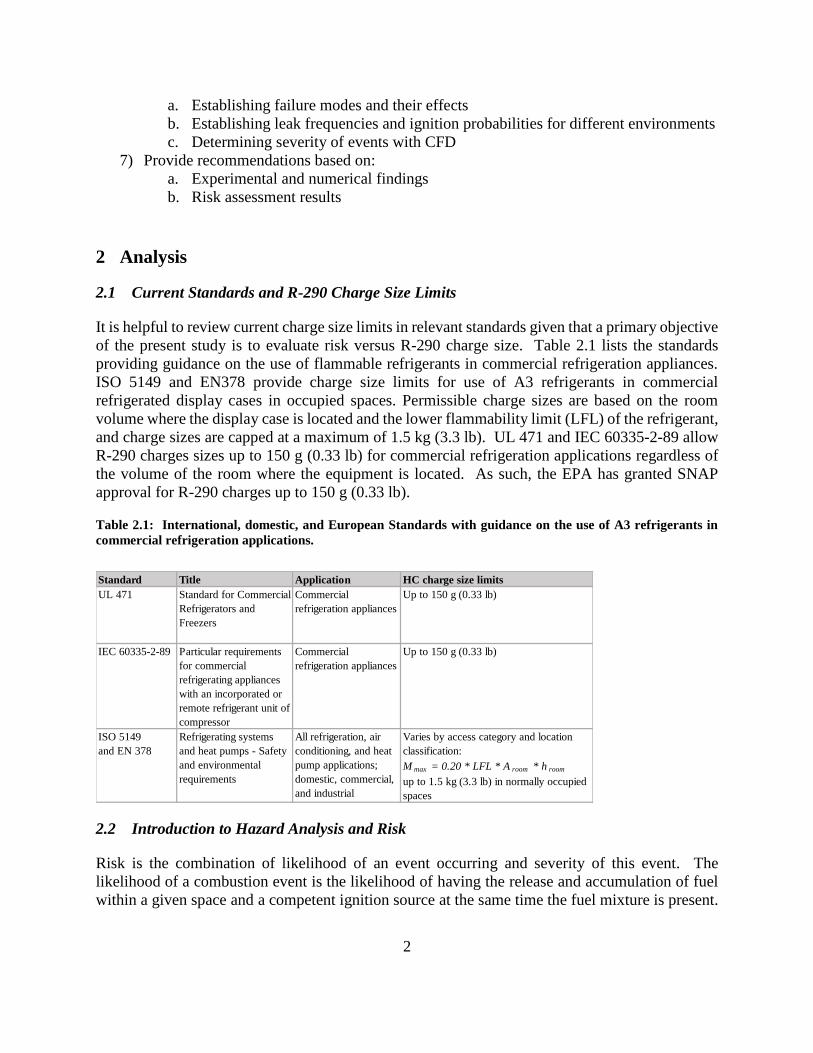
At the point of the release, the mixture is almost entirely fuel (seen as red in the images above).
Downstream from the leak, the concentration of R-290 in the jet passes within its flammability
limits and can be ignited. The flame will stabilize near this location, where the fuel and air can
diffuse and combust at the flame front (see Figure 2.2). The volume of the R-290 plume, where
the concentrations of the plume are greater than the LFL, is referred to the as the jet plume volume.
As the leak rate is increased, the jet plume volume increases resulting in larger flammable jets.
Flammable jets can only exist while a leak is occurring.
Figure 2.2: Jet flame example.
There are also times when a R-290 leak can build up to levels above the LFL in the space where
the refrigerated display case is installed or inside the display case. The consequences of this
flammability hazard are directly related to how the refrigerant disperses into a given space, or more
specifically, how the released refrigerant mixes with the air in the space where the refrigerant is
leaked. At one end of the spectrum, there may be releases for which the R-290 does not mix
readily with air, resulting in “fuel rich” layers that are above the UFL. For example, if a high-
pressure narrow jet is released and immediately impacts a surface (e.g., a release in the condensing
unit housing that hits the housing wall), the fuel jet will lose its momentum and disperse away
from the leak at a relatively low velocity. An example of these “fuel rich” layers is provided in
Figure 2.3, which shows the R-290 concentration in a room while R-290 is leaked with low
momentum at the bottom of a display case.

5
Figure 2.3: Example of a fuel rich layer resulting from a low momentum leak at the bottom of a display case
(display case not shown). The left and middle images show the layer spreading across the floor, while the right
image is the final fuel-rich layer.
These layers will have a region that is flammable near the interface of the fuel rich layer and air
that, when ignited, will burn across the surface and then continue to burn the fuel in the layer below
as a non-premixed diffusion flame (similar to a pool fire) as illustrated in Figure 2.4. The top
images in the figure show a premixed flame (blue) propagating through the flammable layer
(orange) after ignition. The bottom images show the rich layer (red) burning as a diffusion flame
and entraining air once the premixed layer is consumed. The color bar at the bottom indicates the
concentrations of the flue layers in the images on the left, with yellow, orange, and red representing
layers with R-290 concentrations below, within, and above the flammability limits. The color box
lengths are scaled to the concentration range of R-290 in each regime.
Figure 2.4: Example of how a “fuel rich” layer burns, where the top images show the blue flame burning across
the flammable layer at the interface shortly after ignition and the bottom images show the rich lower layer
subsequently burning as a diffusion flame.
RichLean Flammable
0-2.1% 2.1%-9.5% vol 9.5%-100% vol
6
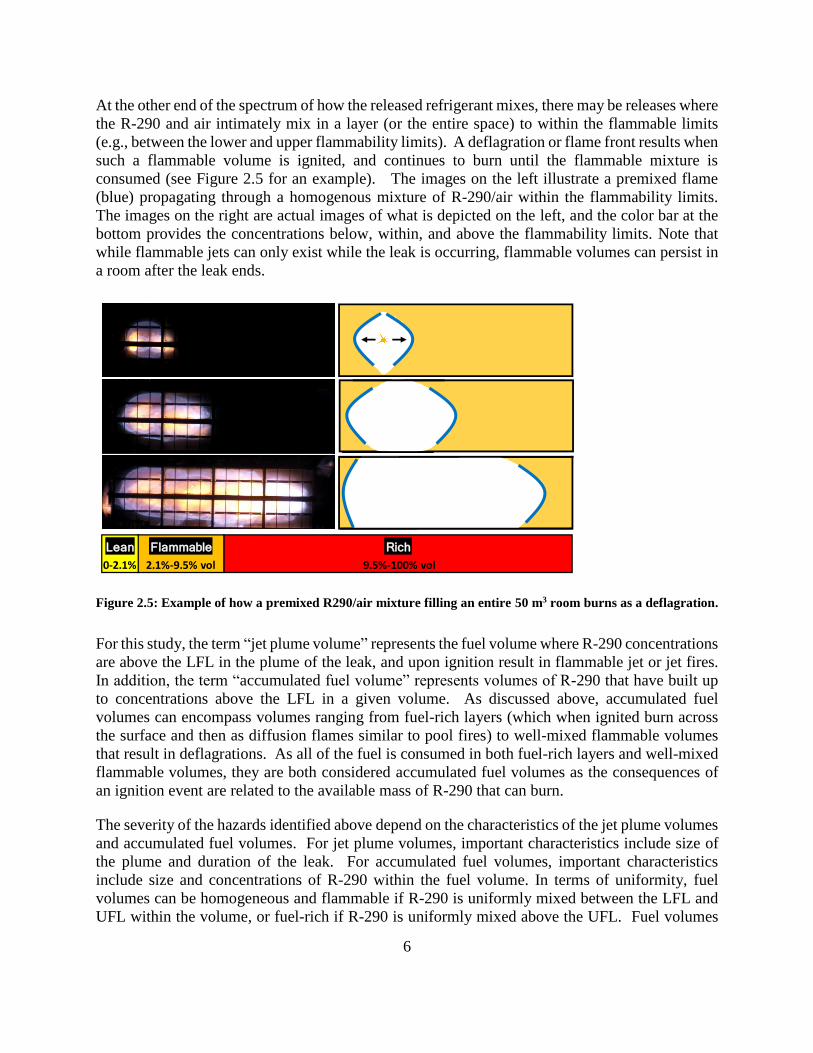
At the other end of the spectrum of how the released refrigerant mixes, there may be releases where
the R-290 and air intimately mix in a layer (or the entire space) to within the flammable limits
(e.g., between the lower and upper flammability limits). A deflagration or flame front results when
such a flammable volume is ignited, and continues to burn until the flammable mixture is
consumed (see Figure 2.5 for an example). The images on the left illustrate a premixed flame
(blue) propagating through a homogenous mixture of R-290/air within the flammability limits.
The images on the right are actual images of what is depicted on the left, and the color bar at the
bottom provides the concentrations below, within, and above the flammability limits. Note that
while flammable jets can only exist while the leak is occurring, flammable volumes can persist in
a room after the leak ends.
Figure 2.5: Example of how a premixed R290/air mixture filling an entire 50 m3 room burns as a deflagration.
For this study, the term “jet plume volume” represents the fuel volume where R-290 concentrations
are above the LFL in the plume of the leak, and upon ignition result in flammable jet or jet fires.
In addition, the term “accumulated fuel volume” represents volumes of R-290 that have built up
to concentrations above the LFL in a given volume. As discussed above, accumulated fuel
volumes can encompass volumes ranging from fuel-rich layers (which when ignited burn across
the surface and then as diffusion flames similar to pool fires) to well-mixed flammable volumes
that result in deflagrations. As all of the fuel is consumed in both fuel-rich layers and well-mixed
flammable volumes, they are both considered accumulated fuel volumes as the consequences of
an ignition event are related to the available mass of R-290 that can burn.
The severity of the hazards identified above depend on the characteristics of the jet plume volumes
and accumulated fuel volumes. For jet plume volumes, important characteristics include size of
the plume and duration of the leak. For accumulated fuel volumes, important characteristics
include size and concentrations of R-290 within the fuel volume. In terms of uniformity, fuel
volumes can be homogeneous and flammable if R-290 is uniformly mixed between the LFL and
UFL within the volume, or fuel-rich if R-290 is uniformly mixed above the UFL. Fuel volumes
RichLean Flammable
0-2.1% 2.1%-9.5% vol 9.5%-100% vol

7
can be inhomogeneous, or layered, if R-290 does not mix uniformly in the space where it is leaked.
Layered volumes contain varying concentrations of refrigerant and air, with R-290 concentration
decreasing with height because it is denser than air. Both homogeneous and layered fuel volumes
can range is size (or height) up to the entire volume of the space where the refrigerant is released.
Figure 2.6 outlines release scenarios, whether they form accumulated fuel volumes or jet plume
volumes, and the hazards that exist when each is ignited. Note that while overpressures are
typically associated with ignition of premixed clouds, they may also occur when fuel-rich layers
are ignited as flame fronts can establish and accelerate through the upper refrigerant/air layer.
Figure 2.6: Types of releases (blue), types of flammable clouds or jets that can form from a release (orange),
and the hazards that exist when the flammable clouds or jets are ignited (grey).
Assessing the risk of R-290 in commercial refrigeration applications requires an assessment of the
likelihood of each release scenario, the likelihood of the formation and ignition of each fuel volume
or jet plume, and the severity of each hazard associated with the ignition of each fuel volume or
jet plume. Furthermore, it requires the identification of parameters that influence the likelihood
and severity of these events. Important parameters have been identified in previous studies, thus
the next section provides an overview of past findings.
2.3 Factors Affecting the Outcome of a Leak
Previous studies [1-13] have shown that the outcome of a leak depends on: (1) the properties of
the leaked refrigerant; (2) leak conditions; (3) equipment properties; and (4) environmental
aspects. CFD simulations were performed to further evaluate how certain of these properties affect
how the fuel disperses and the resulting flammable hazard. This section introduces the important
parameters and illustrates how they affect the outcome of a leak using results from CFD
simulations.
Release inside a closed display case
Accumulated fuel volume
Internal overpressures
Fragmentation of display case
Thermal radiation
Direct flame exposure
Release outside a display case or inside an open display case
Accumulated fuel volume
Overpressure
Thermal radiation
Direct flame exposure
Flammable jet
Thermal radiation
Direct flame exposure

8
Refrigerant properties
Density
The density of a refrigerant compared to the density of air dictates whether the leaked refrigerant
will tend to migrate upward or downward under certain leak conditions. The larger the refrigerant
density to air density, the higher the buoyant force driving the refrigerant toward the floor. R-290
is denser than air and therefore can accumulate near the floor for certain leak conditions.
Leak conditions
Leak velocity / momentum
R-290 leaks from a closed-loop vapor compression cycle will almost always initially have high
velocity and momentum due to the high pressures within the system. The vapor pressure of R-290
even at ambient conditions is high enough to create sonic vapor jets and high velocity liquid jets.
If a leak creates a free jet, which is a jet that does not impact a surface, then the velocity will remain
sufficiently high to entrain air into the refrigerant jet, enhancing mixing with air and increasing
dilution. In the present study, these types of releases are called jet or high momentum releases. In
contrast, if a leak impinges on a nearby surface or obstruction, the velocity and momentum of the
jet will be significantly reduced, resulting in inhomogeneous mixing in the space (since the release
itself results in less mixing between refrigerant and air). For example, when leaks occur inside the
condensing unit housing, the released jet can impinge on nearby surfaces or on the housing walls
thus reducing the momentum of the release. In the present study, these type of impinged jet
releases, which result in significant reduction of the release momentum, are referred to as a low
momentum releases and are considered more likely than free jet releases since refrigerant
containing parts are enclosed in most units.
Leak velocity affects how well the leaked refrigerant mixes with air in the space where it is
released, and therefore affects the likelihood of a leak creating accumulated fuel volumes above
the LFL. For example, high velocity leaks (high momentum) will more readily mix with air and
increase dilution of the release. If the total quantities of fuel or charge sizes are properly limited
for a given room volume, the homogeneous premixed environment resulting from a high
momentum jet will not be flammable. In contrast, during low velocity leaks (low momentum), it
is less likely that R-290 will mix with air and more likely that higher concentration fuel layers will
form along the floor. These layers can have R-290 concentrations within or above the flammability
limits, even when small charge sizes are used in large rooms, as the refrigerant spreads along the
floor and only mixes with a small amount of the total room volume.
Figure 2.7 demonstrates how differently R-290 disperses during a high momentum (upper images)
and low momentum (lower images) leak of 800 g from the bottom of a display case into a 48 m3
(1695 ft3) room. Images from left to right show the leaks progressing in time, specifically once
50 g (0.11 lb), 500 g (1.1 lb), and 800 g (1.76 lb) have been released.

9
Figure 2.7: Dispersion of R-290 during a high momentum (top) and low momentum (bottom) release.
Leak location in the refrigeration cycle
Leak location dictates the phase of the refrigerant at the leak site since the refrigerant in a vapor
compression cycle exists as a vapor, liquid, and two-phase mixture depending on where it is in the
cycle (see Figure 2.8). For example, the refrigerant is a liquid between the condenser and expansion
valve and is a vapor between the evaporator and compressor.
Figure 2.8: Simplified diagram of a vapor compression cycle illustrating the refrigerant phase at different
stages of the cycle.
Compressor
Expansion Valve
Evaporator Condenser
Liquid
Vapor
Two-phase
Vapor
Hig
h-p
ressu
re sid
e
Lo
w-p
ress
ure
sid
e
Conditioned space Condensing unit
10
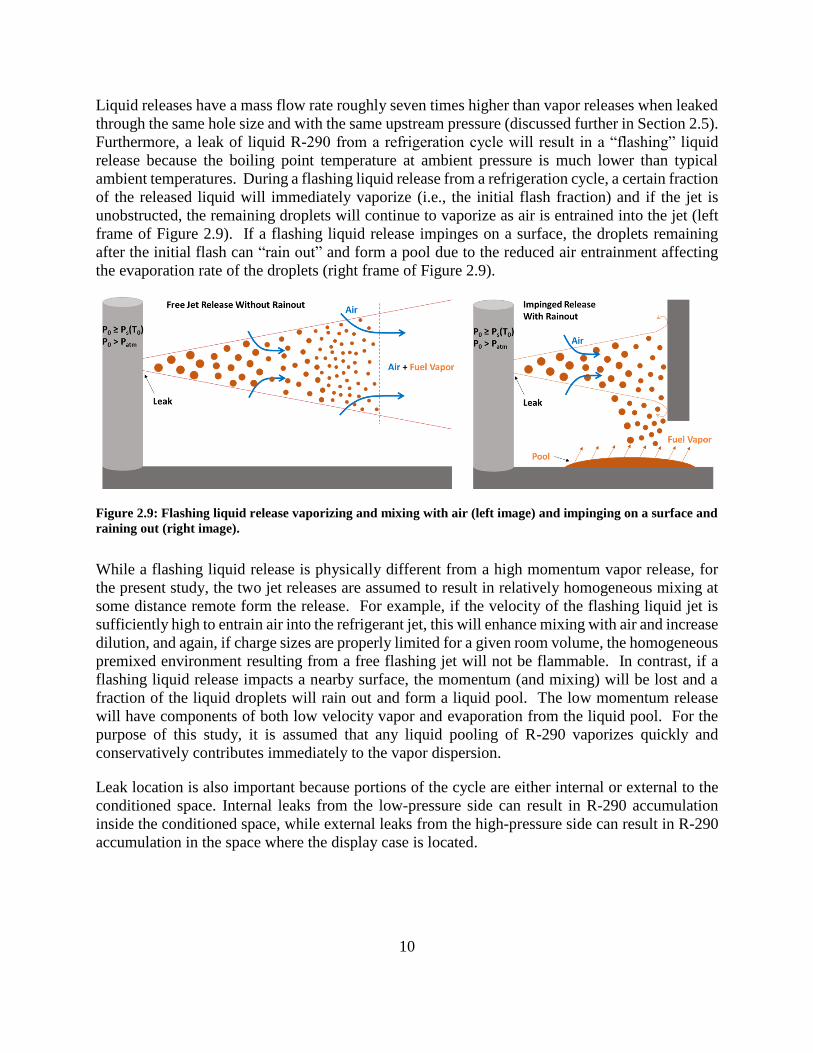
Liquid releases have a mass flow rate roughly seven times higher than vapor releases when leaked
through the same hole size and with the same upstream pressure (discussed further in Section 2.5).
Furthermore, a leak of liquid R-290 from a refrigeration cycle will result in a “flashing” liquid
release because the boiling point temperature at ambient pressure is much lower than typical
ambient temperatures. During a flashing liquid release from a refrigeration cycle, a certain fraction
of the released liquid will immediately vaporize (i.e., the initial flash fraction) and if the jet is
unobstructed, the remaining droplets will continue to vaporize as air is entrained into the jet (left
frame of Figure 2.9). If a flashing liquid release impinges on a surface, the droplets remaining
after the initial flash can “rain out” and form a pool due to the reduced air entrainment affecting
the evaporation rate of the droplets (right frame of Figure 2.9).
Figure 2.9: Flashing liquid release vaporizing and mixing with air (left image) and impinging on a surface and
raining out (right image).
While a flashing liquid release is physically different from a high momentum vapor release, for
the present study, the two jet releases are assumed to result in relatively homogeneous mixing at
some distance remote form the release. For example, if the velocity of the flashing liquid jet is
sufficiently high to entrain air into the refrigerant jet, this will enhance mixing with air and increase
dilution, and again, if charge sizes are properly limited for a given room volume, the homogeneous
premixed environment resulting from a free flashing jet will not be flammable. In contrast, if a
flashing liquid release impacts a nearby surface, the momentum (and mixing) will be lost and a
fraction of the liquid droplets will rain out and form a liquid pool. The low momentum release
will have components of both low velocity vapor and evaporation from the liquid pool. For the
purpose of this study, it is assumed that any liquid pooling of R-290 vaporizes quickly and
conservatively contributes immediately to the vapor dispersion.
Leak location is also important because portions of the cycle are either internal or external to the
conditioned space. Internal leaks from the low-pressure side can result in R-290 accumulation
inside the conditioned space, while external leaks from the high-pressure side can result in R-290
accumulation in the space where the display case is located.

11
Physical leak location – condensing unit location
The location of the condenser portion of the circuit influences the likely height of a leak at this
part of the circuit. Condensing units can be located at the top or bottom of a display case. Leak
location is important in terms of height from the ground especially for low momentum external
leaks. For low momentum releases that are located near floor level, R-290 will tend to form high
concentration layers that spread radially from the leak source along the floor (see Figure 2.10). As
the height of the release location increases, so does the distance the heavier-than-air R-290 must
travel as it “falls” toward the floor. When the R-290 travels downward, it mixes to some degree
with the air (see Figure 2.10) and tends to form layers at the ground with lower concentrations than
releases near ground level. In each column of images the elapsed time from the start of the leak
and the amount of mass released are the same.
Figure 2.10: Low momentum release at the top of display case (top images) falling toward the floor and mixing
with air and low momentum release at the bottom of a display case spreading along the floor (bottom images).
Figure 2.11 demonstrates the different fuel layers that form when a low momentum leak of 600 g
(1.32 lb) occurs at the condenser when mounted at the bottom (left image) or top (right image) of
a display case in a 60 m3 (2119 ft3) room when the condenser fan is off with a leak rate of 120
g/min (0.26 lb/min). The figures show the R-290 concentration along an elevation cut-plane
through the leak. The leak near the floor creates significantly higher R-290 concentrations along
the floor up to a height of 0.5 m (1.64 ft), whereas the leak above the display case creates
concentrations above the LFL only at the top of the unit and along the sides because the R-290
mixes with air as it “falls” downward toward the floor creating a more diluted layer with a height
of over 1.0 m (3.28 ft) for the displayed concentration range. Note that both frames in Figure 2.11
show the concentration of R-290 at the end of the leak.
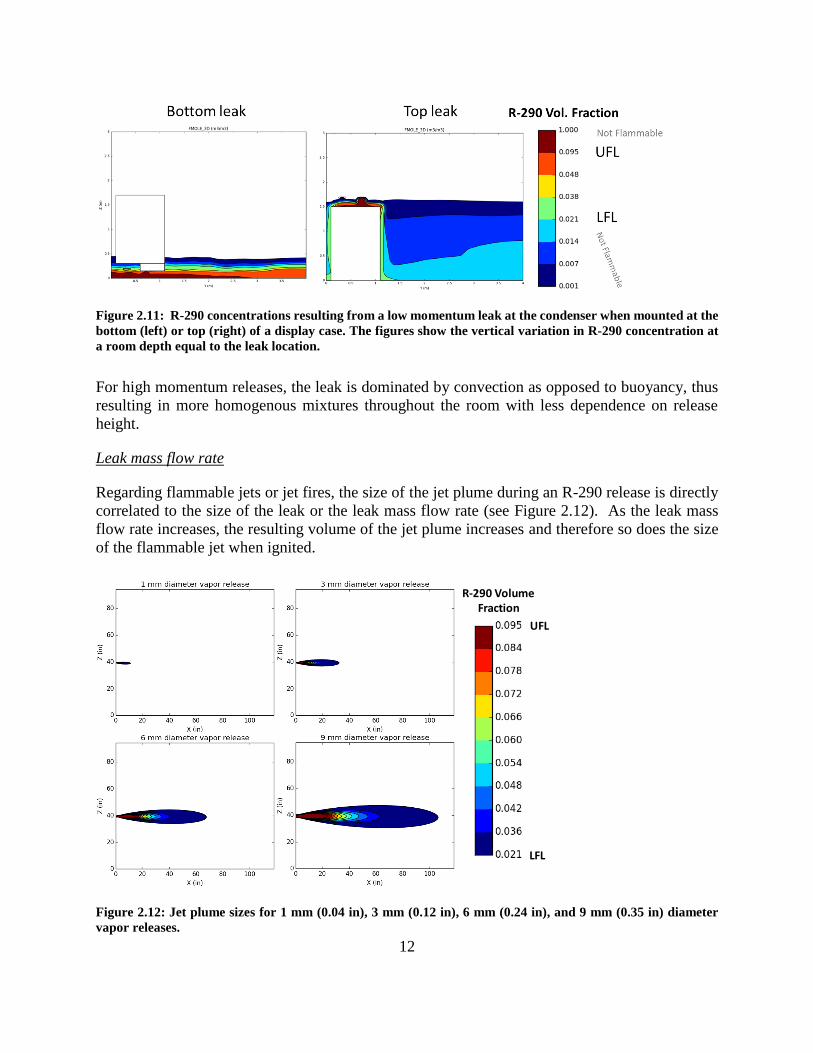
12
Figure 2.11: R-290 concentrations resulting from a low momentum leak at the condenser when mounted at the
bottom (left) or top (right) of a display case. The figures show the vertical variation in R-290 concentration at
a room depth equal to the leak location.
For high momentum releases, the leak is dominated by convection as opposed to buoyancy, thus
resulting in more homogenous mixtures throughout the room with less dependence on release
height.
Leak mass flow rate
Regarding flammable jets or jet fires, the size of the jet plume during an R-290 release is directly
correlated to the size of the leak or the leak mass flow rate (see Figure 2.12). As the leak mass
flow rate increases, the resulting volume of the jet plume increases and therefore so does the size
of the flammable jet when ignited.
Figure 2.12: Jet plume sizes for 1 mm (0.04 in), 3 mm (0.12 in), 6 mm (0.24 in), and 9 mm (0.35 in) diameter
vapor releases.
R-290 Volume Fraction
LFL
UFL
13
If the total quantities of fuel or charge sizes are properly limited for a given room volume, the
homogeneous premixed environment downstream the localized high momentum jet will not be
flammable, and for all intents and purposes, fairly independent of the potential leak mass flow rate.
Note that there still will be a flammable jet plume local to the leak and the size of the plume is
proportional to the leak rate as discussed in Section 2.2.
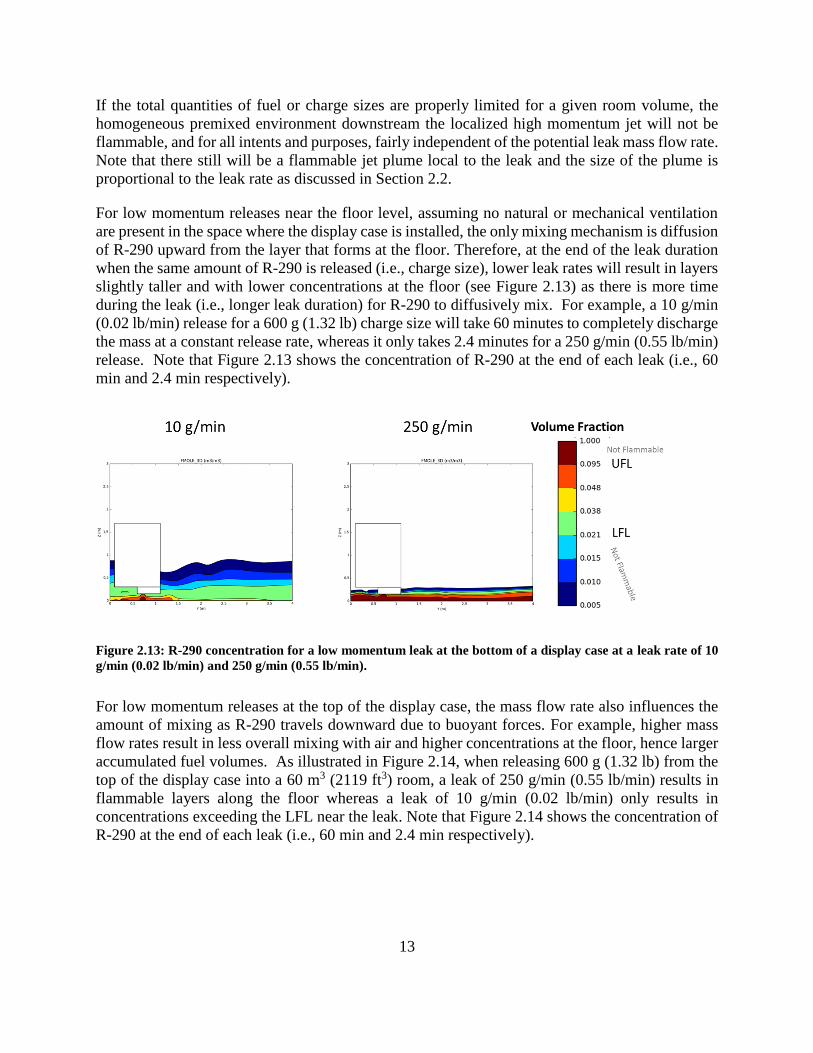
For low momentum releases near the floor level, assuming no natural or mechanical ventilation
are present in the space where the display case is installed, the only mixing mechanism is diffusion
of R-290 upward from the layer that forms at the floor. Therefore, at the end of the leak duration
when the same amount of R-290 is released (i.e., charge size), lower leak rates will result in layers
slightly taller and with lower concentrations at the floor (see Figure 2.13) as there is more time
during the leak (i.e., longer leak duration) for R-290 to diffusively mix. For example, a 10 g/min
(0.02 lb/min) release for a 600 g (1.32 lb) charge size will take 60 minutes to completely discharge
the mass at a constant release rate, whereas it only takes 2.4 minutes for a 250 g/min (0.55 lb/min)
release. Note that Figure 2.13 shows the concentration of R-290 at the end of each leak (i.e., 60
min and 2.4 min respectively).
Figure 2.13: R-290 concentration for a low momentum leak at the bottom of a display case at a leak rate of 10
g/min (0.02 lb/min) and 250 g/min (0.55 lb/min).
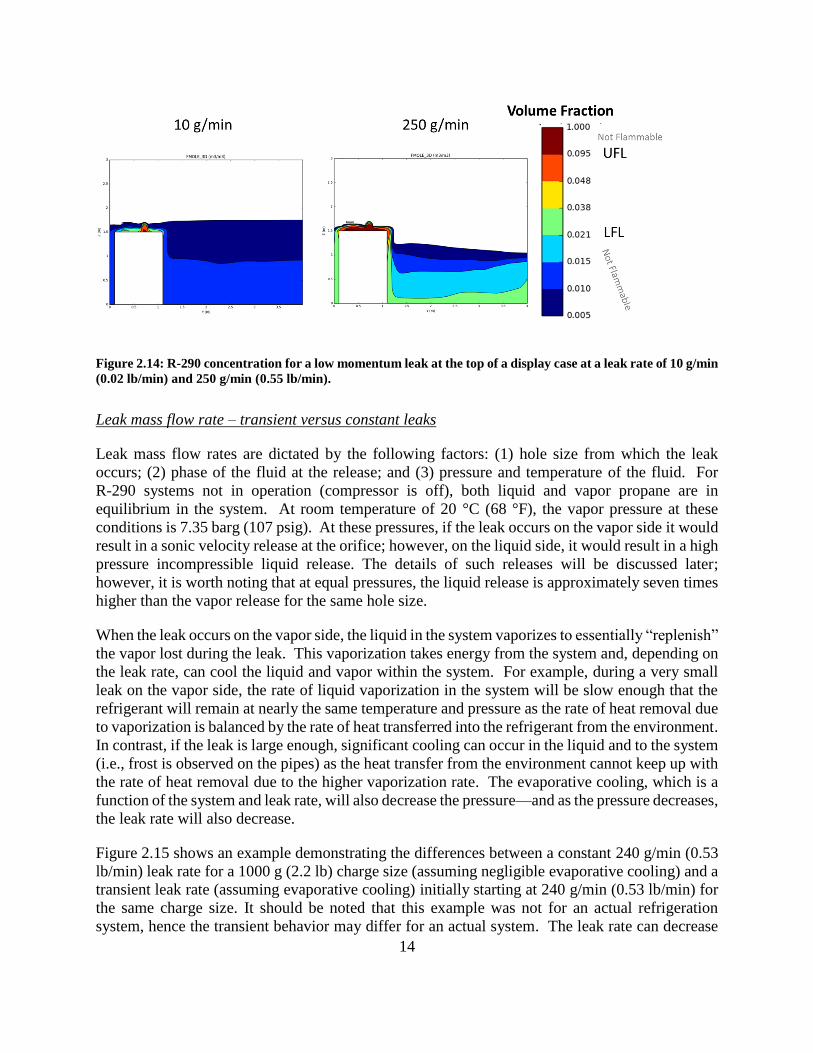
For low momentum releases at the top of the display case, the mass flow rate also influences the
amount of mixing as R-290 travels downward due to buoyant forces. For example, higher mass
flow rates result in less overall mixing with air and higher concentrations at the floor, hence larger
accumulated fuel volumes. As illustrated in Figure 2.14, when releasing 600 g (1.32 lb) from the
top of the display case into a 60 m3 (2119 ft3) room, a leak of 250 g/min (0.55 lb/min) results in
flammable layers along the floor whereas a leak of 10 g/min (0.02 lb/min) only results in
concentrations exceeding the LFL near the leak. Note that Figure 2.14 shows the concentration of
R-290 at the end of each leak (i.e., 60 min and 2.4 min respectively).
14
Figure 2.14: R-290 concentration for a low momentum leak at the top of a display case at a leak rate of 10 g/min
(0.02 lb/min) and 250 g/min (0.55 lb/min).
Leak mass flow rate – transient versus constant leaks
Leak mass flow rates are dictated by the following factors: (1) hole size from which the leak
occurs; (2) phase of the fluid at the release; and (3) pressure and temperature of the fluid. For
R-290 systems not in operation (compressor is off), both liquid and vapor propane are in
equilibrium in the system. At room temperature of 20 °C (68 °F), the vapor pressure at these
conditions is 7.35 barg (107 psig). At these pressures, if the leak occurs on the vapor side it would
result in a sonic velocity release at the orifice; however, on the liquid side, it would result in a high
pressure incompressible liquid release. The details of such releases will be discussed later;
however, it is worth noting that at equal pressures, the liquid release is approximately seven times
higher than the vapor release for the same hole size.
When the leak occurs on the vapor side, the liquid in the system vaporizes to essentially “replenish”
the vapor lost during the leak. This vaporization takes energy from the system and, depending on
the leak rate, can cool the liquid and vapor within the system. For example, during a very small
leak on the vapor side, the rate of liquid vaporization in the system will be slow enough that the
refrigerant will remain at nearly the same temperature and pressure as the rate of heat removal due
to vaporization is balanced by the rate of heat transferred into the refrigerant from the environment.
In contrast, if the leak is large enough, significant cooling can occur in the liquid and to the system
(i.e., frost is observed on the pipes) as the heat transfer from the environment cannot keep up with
the rate of heat removal due to the higher vaporization rate. The evaporative cooling, which is a
function of the system and leak rate, will also decrease the pressure—and as the pressure decreases,
the leak rate will also decrease.
Figure 2.15 shows an example demonstrating the differences between a constant 240 g/min (0.53
lb/min) leak rate for a 1000 g (2.2 lb) charge size (assuming negligible evaporative cooling) and a
transient leak rate (assuming evaporative cooling) initially starting at 240 g/min (0.53 lb/min) for
the same charge size. It should be noted that this example was not for an actual refrigeration
system, hence the transient behavior may differ for an actual system. The leak rate can decrease

15
dramatically during the vapor release as a result of evaporative cooling and hence would affect the
consequences of such a release. This example is for evaporative cooling that occurs during a
release from a tank as opposed to an operating, closed-loop refrigeration system—which is a less
complex example and is likely a less drastic change in leak rate. The effects of evaporative cooling
during leaks in actual refrigeration systems are extremely complex (especially when accounting
for the work done by the compressor when operating), and therefore, for the purposes of this study,
it is conservatively assumed that all vapor leaks remain at a constant leak rate.
Figure 2.15: Decrease in mass flow rate during a 1000 g (2.2 lb) vapor release due to evaporative cooling. Data
from experiment described in ref. [14].
Regarding liquid leaks, the resulting release would be a flashing liquid release and much of the
evaporative cooling would occur external to the system. However, as the quantity of liquid
decreases, natural depressurization of the system can occur. Similar to a vapor release, the effect
of the work performed by the compressor increases the complexity of the problem. Hence, for the
present study, it is conservatively assumed that all liquid leaks remain at a constant leak rate.
Equipment properties
Charge size
As the charge size increases, so does the amount of R-290 that can be released and contained in
accumulated fuel volumes. Therefore, considering all other leak characteristics being equal (e.g.,
leak rate, leak location, momentum, fluid, etc.), leaks from larger charge sizes result in larger
accumulated fuel volumes, which when subsequently ignited, generally result in more severe
consequences.
Refrigerant charge size must be considered in reference to room size so that a leak does not result
in a flammable premixed cloud that fills a large volume of a given room as the potential severity
resulting from a premixed deflagration is high. Based on the density of R-290 and the concentration
0
50
100
150
200
250
300
0 1 2 3 4 5 6
Leak
Mas
s Fl
ow
Rat
e (
g/m
in)
Time (min)
ConstantTransient

16
of mass per unit volume at the LFL (0.038 kg/m3 or 0.00237 lb/ft3), charge sizes can be limited to
avoid premixed flammable clouds from filling an entire room or a significant fraction of the room
(e.g., ¼ room volume). Figure 2.16 shows the results of two jet releases that homogenously mixed
in the entire volume of a 48 m3 (1695 ft3) room, where one is the release of 2.7 kg (5.95 lb) resulting
in a flammable mixture above the LFL (left image), and the other is the release of 455 g (1.0 lb)
resulting in a non-flammable mixture at approximately ¼ LFL (right image).
Figure 2.16: Left and right frame show the homogeneously mixed environment from a jet release of 2.7 kg (5.95
lb) and 445 g (1.0 lb).
Similarly, the left and right frames of Figure 2.17 demonstrate the significant increase of the fuel-
rich layer when the charge size of a low momentum R-290 release at the bottom of a display case
in a 60 m3 (2119 ft3) room was increased from 150 g (0.33 lb) to 1000 g (2.2 lb).
Figure 2.17: Difference in accumulated fuel volumes for a 150 g (0.33 lb) and 1000 g (2.2 lb) release from the
bottom of a display case in a 60 m3 (2119 ft3) room.
Whether the display case is open or closed
Open display cases have no physical barrier between the conditioned space and the environment
whereas closed cases do. Open display cases typically require a larger charge size than closed
cases to cool the same amount of internal volume due to the higher air change rate in the
UFL
LFL
¼ LFL
½ LFL
R-290 Vol. Fraction
17
conditioned space. Free jet releases inside an open display case will have similar outcomes to free
jet releases outside of the conditioned space. Low momentum releases inside an open display case
could cause R-290 to accumulate in the lower section of the conditioned space. The likelihood of
R-290 accumulating in an open display case depends on the design (i.e., the depth of the
conditioned space compared to the height of the containing walls) and also the amount of items in
the display case.
When a high or low momentum leaks occur in a closed display case, the entire released charge can
accumulate in the case and disperse all at once into the room where the case is located once it is
opened. This is a potentially high severity scenario exclusive to closed display cases and therefore
the experimental work and risk assessment that follow focus on closed display cases.
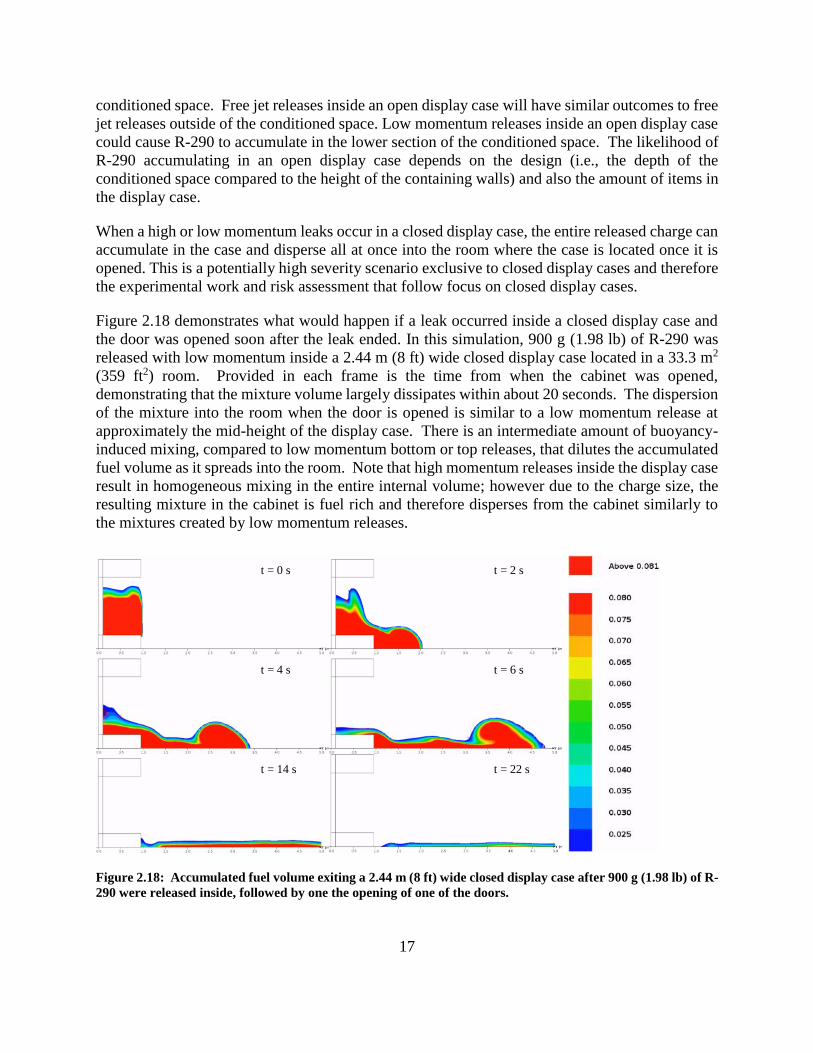
Figure 2.18 demonstrates what would happen if a leak occurred inside a closed display case and
the door was opened soon after the leak ended. In this simulation, 900 g (1.98 lb) of R-290 was
released with low momentum inside a 2.44 m (8 ft) wide closed display case located in a 33.3 m2
(359 ft2) room. Provided in each frame is the time from when the cabinet was opened,
demonstrating that the mixture volume largely dissipates within about 20 seconds. The dispersion
of the mixture into the room when the door is opened is similar to a low momentum release at
approximately the mid-height of the display case. There is an intermediate amount of buoyancy-
induced mixing, compared to low momentum bottom or top releases, that dilutes the accumulated
fuel volume as it spreads into the room. Note that high momentum releases inside the display case
result in homogeneous mixing in the entire internal volume; however due to the charge size, the
resulting mixture in the cabinet is fuel rich and therefore disperses from the cabinet similarly to
the mixtures created by low momentum releases.
Figure 2.18: Accumulated fuel volume exiting a 2.44 m (8 ft) wide closed display case after 900 g (1.98 lb) of R-
290 were released inside, followed by one the opening of one of the doors.
t = 0 s
t = 4 s
t = 14 s
t = 2 s
t = 6 s
t = 22 s
18
Whether the condenser or evaporator fan is on when a leak occurs
Unit airflow is created by the condenser fan and/or the evaporator fan. Mechanically driven air
circulation from a fan housed within a display case can result in additional mixing, more
homogeneous environments, and lower peak concentrations. This is especially true for low
momentum releases that tend to minimally mix with air and form fuel-rich layers. The presence
of the mechanically driven airflow induces mixing and can help maintain fuel levels below the
LFL (assuming that the charge was appropriately sized for the room volume).
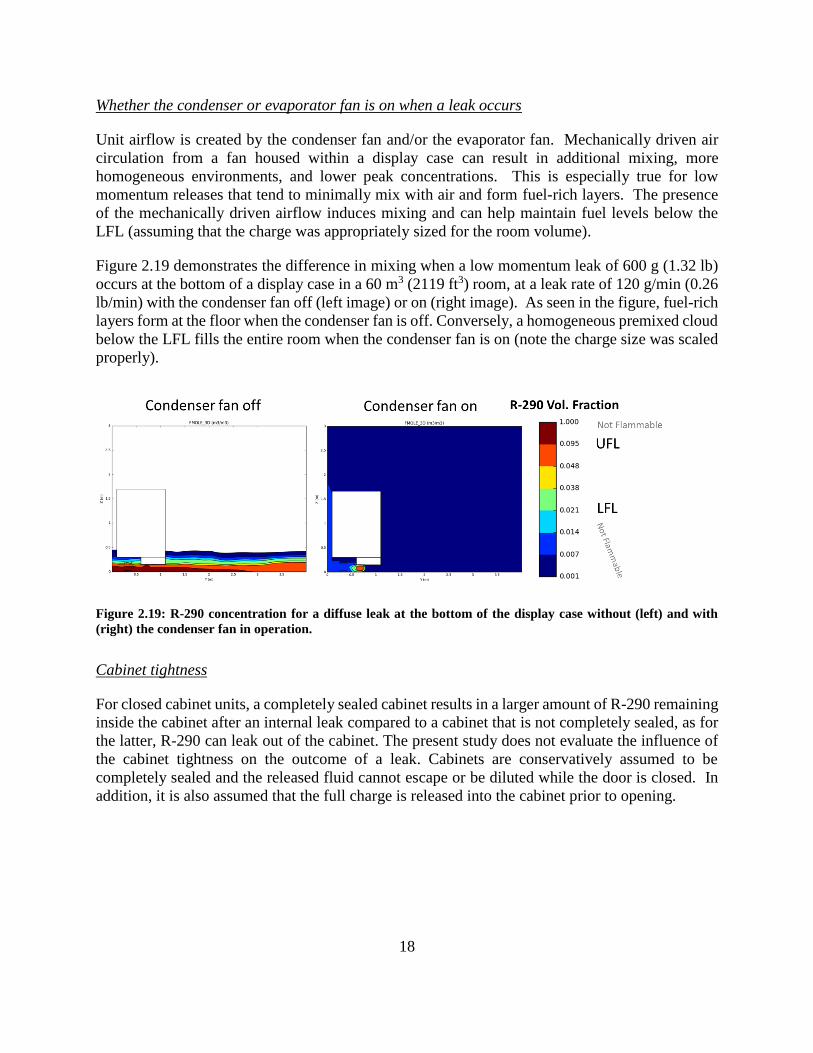
Figure 2.19 demonstrates the difference in mixing when a low momentum leak of 600 g (1.32 lb)
occurs at the bottom of a display case in a 60 m3 (2119 ft3) room, at a leak rate of 120 g/min (0.26
lb/min) with the condenser fan off (left image) or on (right image). As seen in the figure, fuel-rich
layers form at the floor when the condenser fan is off. Conversely, a homogeneous premixed cloud
below the LFL fills the entire room when the condenser fan is on (note the charge size was scaled
properly).
Figure 2.19: R-290 concentration for a diffuse leak at the bottom of the display case without (left) and with
(right) the condenser fan in operation.
Cabinet tightness
For closed cabinet units, a completely sealed cabinet results in a larger amount of R-290 remaining
inside the cabinet after an internal leak compared to a cabinet that is not completely sealed, as for
the latter, R-290 can leak out of the cabinet. The present study does not evaluate the influence of
the cabinet tightness on the outcome of a leak. Cabinets are conservatively assumed to be
completely sealed and the released fluid cannot escape or be diluted while the door is closed. In
addition, it is also assumed that the full charge is released into the cabinet prior to opening.

19
Environmental aspects
Room size
For the same amount of refrigerant released, smaller room sizes generally result in higher
concentrations since there is less volume of air to mix with and dilute the released refrigerant
vapors.
Room tightness
A completely sealed room results in higher concentrations compared to, for example, a room with
a gap beneath a door. Less air infiltration results in less available air to mix with and dilute the
released refrigerant vapors. The present study does not evaluate the influence of room tightness
on the outcome of a leak. Rooms are conservatively assumed to be completely sealed.
Room ventilation
In many commercial structures, mechanical ventilation and airflow (typically measured in air
changes per hour) are required in occupied spaces to assure acceptable indoor air quality. This is
especially true in commercial kitchens. Room ventilation results in lower concentrations by
enhancing mixing with air to dilute the released refrigerant vapors. For example, it is expected
that mechanical ventilation would have a significant impact on low momentum releases with low
leak rates occurring from refrigerated display cases as mechanically induced airflow will have a
higher impact on diluting such releases. In addition, for large releases, mechanical ventilation can
help decrease the time that the accumulated fuel volumes remain present in a room.
The present study does not consider the influence of room ventilation on the outcome of a leak as
this is outside the current scope of the project and would be outside of the control of cabinet
manufacturers to ensure proper room ventilation levels. Therefore, rooms are conservatively
assumed to have no ventilation.
2.4 Establishing Rulesets for the Risk Assessment
Preliminary CFD simulations confirmed how certain factors affect the outcome of a leak and
identified leak conditions and scenarios that do not create flammable plumes and ignitable
volumes. Based on the extensive simulations performed and discussed above, certain rulesets can
be established to more efficiently perform the risk assessment.
Ruling out risk of homogeneous premixed atmospheres exceeding the LFL
Limiting charge size based on room volume is an effective technique to mitigate the formation of
homogeneously mixed flammable volumes that fill the entire room where a leak occurs. Based on
the density of R-290 and the concentration of mass per unit volume at the LFL (0.038 kg/m3 or
0.00237 lb/ft3), the charge size necessary to avoid premixed flammable clouds from filling an
entire room can be determined. If this technique is followed, homogeneously mixed room
environments will remain below the LFL. Moreover, impinged jets may result in partial mixing

20
and accumulated fuel layers (as opposed to mixing within the entire room), hence a factor of safety
such as ¼ LFL may be used or equivalently 0.0095 kg/m3 (0.00059 lb/ft3) for R-290.
Ruling out the formation of accumulated fuel layers above LFL from free jet releases
Free jet or high momentum releases create enough mixing to yield near-homogeneous
environments when leaked into a room, and thus fuel volumes do not accumulate at the floor, even
when a release occurs near the floor.
This is demonstrated in Figure 2.20, which provides CFD results of R-290 concentrations in a
room when leaked near floor level through a 3 mm (0.12 in) and 9 mm (0.35 in) orifice. The
leftmost and center images are while the leaks are still occurring and thus higher concentrations
are seen in the respective jet plumes near the floor. The rightmost images are shortly after the 455g
(1.0 lb) release ends (mass corresponding to 25% LFL for the entire room volume).
Figure 2.20: Top and bottom frames show a vapor jet release through a 9 mm (0.35 in) and 3 mm (0.12 in)
diameter orifice. The entire room volume is homogeneously mixed at approximately ¼ LFL.
Ruling out jet fire risk for small diameter vapor releases
The size of the jet plume volume depends on the leak diameter as previously shown in Figure 2.12,
the phase of the refrigerant at the leak, and the pressure difference across the leak. Free jet or high
momentum releases with a high enough leak rate or large enough leak diameter may create non-
negligible jet plume volumes during a release. As discussed in Section 2.2, the hazard associated
with these volumes is a flammable jet or jet fire, and is distinct from accumulated fuel volumes
forming in the space where a refrigerant is leaked.

21
Free jet or high momentum releases through small diameter holes have flammable jet volumes that
extend no more than a few inches from the leak. CFD simulations show (see Figure 2.12) that a
free jet vapor release through a leak diameter of 1 mm (0.04 in) creates a flammable jet volume
that extends 28 cm (11 in) from the leak during the release. Once ignited, the flame will stabilize
somewhat closer to the leak location where the R-290 and oxygen from the air diffuse to near
stoichiometric concentrations. Therefore, small vapor leaks of 1 mm (0.04 in) or less in diameter
do not create jet fire hazards. Note that our estimations indicate that 99% of all leaks occur through
hole sizes less than or equal to 1 mm (0.04 in), as discussed further in Section 5.4.1.
Ruling out a jet fire hazard during impinged releases
When a leak impinges on a surface, there is no flammable jet that forms and therefore there is no
possibility of a jet flame, hence accumulated fuel volumes are the only resulting hazards.
Graphical Illustration of Ruled-out Hazards
Figure 2.21 provides a graphical illustration of the scenarios and hazards ruled out by preliminary
CFD simulations. In the figure, the hazard analysis of Section 2.2 is extended to include free jet
and impinged jet releases in the different identified scenarios. The accumulated fuel volumes and
jet plumes ruled out are crossed out in red and flammable jets from free releases now only need to
be considered for all liquid releases and vapor releases when leak diameters are ≥ 1 mm (0.04 in).
Figure 2.21: Extension of Hazard Analysis to include free jet and impinged releases in the different identified
scenarios. Flammable cloud/jet types ruled out for different scenarios are crossed out in red. Flammable jet
hazards have been ruled out for vapor leaks with ≤ 1 mm (0.04 in) diameter.
Free jet release outside a display case or inside an
open display case
Flammable jet
Thermal radiation
Direct flame exposure
Accumulated fuel volume
Overpressure
Thermal radiation
Direct flame exposure
Impinged jet release outside a display case or inside an
open display case
Accumulated fuel volume
Overpressure
Thermal radiation
Direct flame exposure
Flammable jet
Thermal radiation
Direct flame exposure
Free jet or impinged jet release inside a closed display case
Accumulated fuel volume
Internal overpressures
Fragmentation of display case
Thermal radiation
Direct flame exposure
For vapor releases, ≤ 1 mm dia.
represented as 1 mm in risk model

22
These preliminary findings limit the scenarios remaining in Figure 2.21 that need to be studied in
further detail as part of the risk assessment in Section 5.
2.5 Leak Mass Flow Rate vs Leak Hole Size
As previously discussed, mass flow rate is an important parameter that influences the outcome of
a leak and can be determined based on the hole size and the refrigerant phase, temperature, and
pressure at the leak site.
ISO 5149 establishes conservative maximum pressures in the high- and low-pressure sides of a
refrigeration cycle operating on R-290 (see Table 2.2). The pressures are equivalent to the vapor
pressure of R-290 at the conceivably highest temperatures the refrigerant could reach on the high-
and low-pressure sides (dependent on external temperatures). The high-pressure side temperature
is during operation and the low-pressure side temperature is during idle conditions.
Table 2.2: Table of maximum pressures and temperature recommended in BRA Code of Practice 2014 and in
accordance with EN378-1:2008 A2:2012.
When establishing leak rates as a function of hole size, vapor releases are considered on the high-
and low-pressure sides (condenser and evaporator sides respectively) and liquid releases are
considered on the high-pressure side (condenser side). Two phase releases on the low-pressure
side are assumed to have the mass flow rate of pure liquid releases (as discussed in further detail
below, the outcome of leaks on the low-pressure side, inside the cabinet, is relatively insensitive
to mass flow rate thus this assumption minimally impacts the results of the risk study). Vapor
mass flow rates are determined using Eq. 1, which is the equation for choked flow of a gas through
an orifice:
�̇� = 𝐶𝑑𝐴0√𝛾𝜌𝑔𝑃1 (
2
𝛾+1)
𝛾+1
𝛾−1 (1)
where Cd is discharge coefficient (assumed to be 0.85 for vapor phase releases), A0 is the area of
the orifice, γ is the specific heat ratio, ρg is the upstream gas density, and P1 is the upstream
pressure.
Liquid mass flow rates are determined using Eq. 2, which is the equation for incompressible flow
through an orifice:
�̇� = 𝐶𝑑𝐴0√2𝜌𝑙𝑖𝑞(𝑃1 − 𝑃𝑎𝑡𝑚) (2)
Low side High side Low side High side
10.3 (149) 18.1 (263) 32 (90) 55 (131)
Max Pressure, barg (psig) Max Temperature, °C (°F)
23
where Cd is discharge coefficient (assumed to be 0.62 for liquid phase releases), A0 is the area of
the orifice, ρliq is the liquid density, and P1 is the upstream pressure. Note that when a leak occurs
on the liquid side, R-290 begins to flash evaporate just upstream of the orifice, thus the estimation
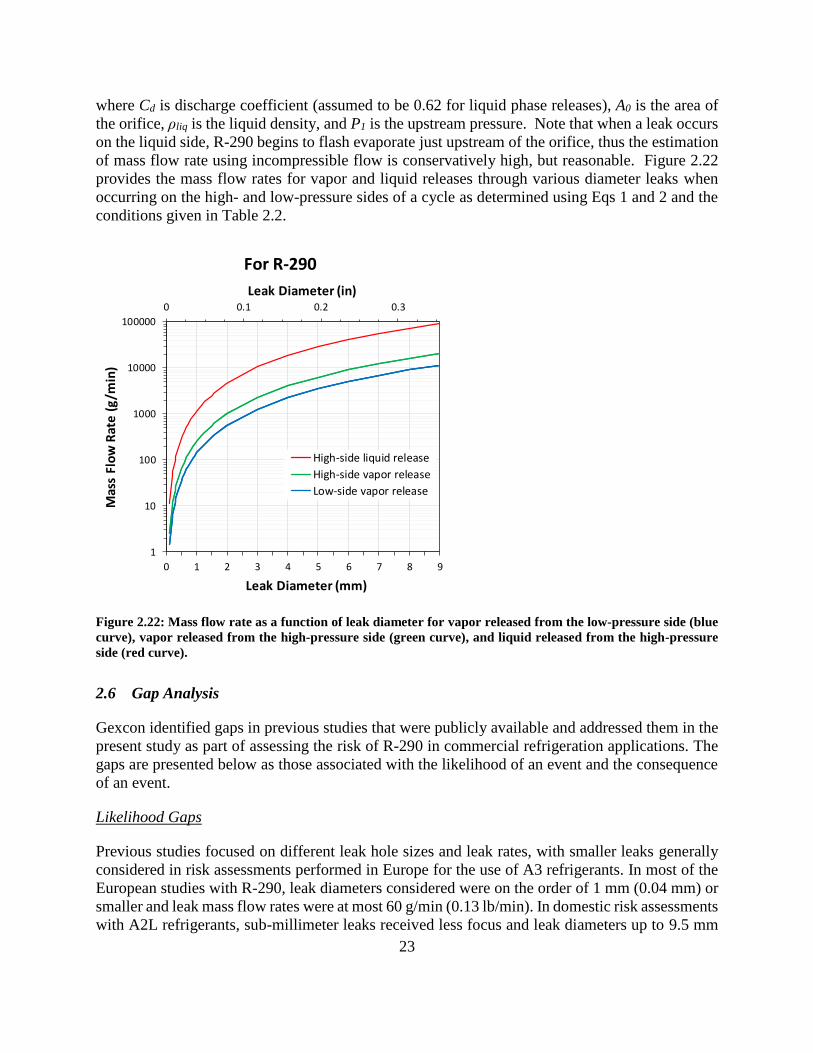
of mass flow rate using incompressible flow is conservatively high, but reasonable. Figure 2.22
provides the mass flow rates for vapor and liquid releases through various diameter leaks when
occurring on the high- and low-pressure sides of a cycle as determined using Eqs 1 and 2 and the
conditions given in Table 2.2.
Figure 2.22: Mass flow rate as a function of leak diameter for vapor released from the low-pressure side (blue
curve), vapor released from the high-pressure side (green curve), and liquid released from the high-pressure
side (red curve).
2.6 Gap Analysis
Gexcon identified gaps in previous studies that were publicly available and addressed them in the
present study as part of assessing the risk of R-290 in commercial refrigeration applications. The
gaps are presented below as those associated with the likelihood of an event and the consequence
of an event.
Likelihood Gaps
Previous studies focused on different leak hole sizes and leak rates, with smaller leaks generally
considered in risk assessments performed in Europe for the use of A3 refrigerants. In most of the
European studies with R-290, leak diameters considered were on the order of 1 mm (0.04 mm) or
smaller and leak mass flow rates were at most 60 g/min (0.13 lb/min). In domestic risk assessments
with A2L refrigerants, sub-millimeter leaks received less focus and leak diameters up to 9.5 mm
0 0.1 0.2 0.3
1
10
100
1000
10000
100000
0 1 2 3 4 5 6 7 8 9
Leak Diameter (in)
Mas
s Fl
ow
Rat
e (
g/m
in)
Leak Diameter (mm)
High-side liquid release
High-side vapor release
Low-side vapor release
For R-290

24
(0.37 in) were considered with flow rates as high as 1800 g/min (3.97 lb/min). In principle, leak
sizes and their corresponding frequencies of occurrence are independent of the refrigerant working
fluid and dependent on equipment details, such as length and diameter of piping and the number
of flanges, valves, etc. in the system. Therefore, the current study applies a more unified approach
that builds on previous domestic risk assessments on the use of A2L refrigerants and previous
European risk assessments on the use of A3 refrigerants.
While only considering small hole sizes is partially justified from a frequency standpoint
(discussed further in Section 5.4.1), a complete risk assessment should:
• Include larger leaks despite their lower likelihood of occurring because of their severity, and
• Demonstrate that despite the higher consequences of larger leaks, the overall risk may still be
very low after accounting for the likelihood of those leaks and their ignition.
Another aspect receiving limited attention in past studies is the refrigerant phase when leaking
from a unit. In general, previous studies have not established differences in risk for a vapor release
and a flashing liquid release. As discussed above, the state of the refrigerant as it is leaked (i.e.,
where the leak occurs in the cycle) dictates the mass flow rate of the leak. This is an important
parameter that influences the dispersion and likelihood of the formation of accumulated fuel
volumes or jet plumes.
A gap outside the scope of the present study, but worth mentioning, is the limited amount of data
available on leak frequencies for commercial refrigeration equipment. As discussed below in
Section 5.4.1, the leak frequencies applied in the risk assessment are derived from a single dataset
and therefore the uncertainty is higher than if derived from multiple datasets.
Consequence Gaps
The quantitative ignition consequences of leaked R-290 are not well-established. Out of the studies
identified in the available literature, only two explored the post-ignition consequences of simulated
R-290 leaks. Ref. [3] made visual observations of post-ignition severity, and ref. [5] measured
overpressures. Hazards such as thermal radiative exposure direct flame contact exist during post-
ignition events, in addition to overpressures, and their severity need to be quantified to fully assess
risk. Furthermore, past studies did not consider leaks into closed refrigerated display cases, thus
the hazards and their severity for this scenario have not been confirmed or quantified.
The relationship between charge size and consequence has not been fully established either. The
available experimental and numerical data show that larger charge sizes can result in larger
accumulated fuel volumes, but more data is needed to demonstrate how severity changes with
charge size and/or fuel volume size.
2.7 Environmental Settings and Sources of Ignition
The scope of the present project is to evaluate the hazards of A3 refrigerants in commercial retail
and kitchen settings. Both commercial retail and commercial kitchen settings can vary in size and
layout. Based on our own experience with CFD dispersion modeling, as well as the experimental
25
findings outlined above, the room layout will have some impact on the likelihood of flammable
cloud formation; however, the room size will be an important factor, especially in terms of
maximum permissible charge size.
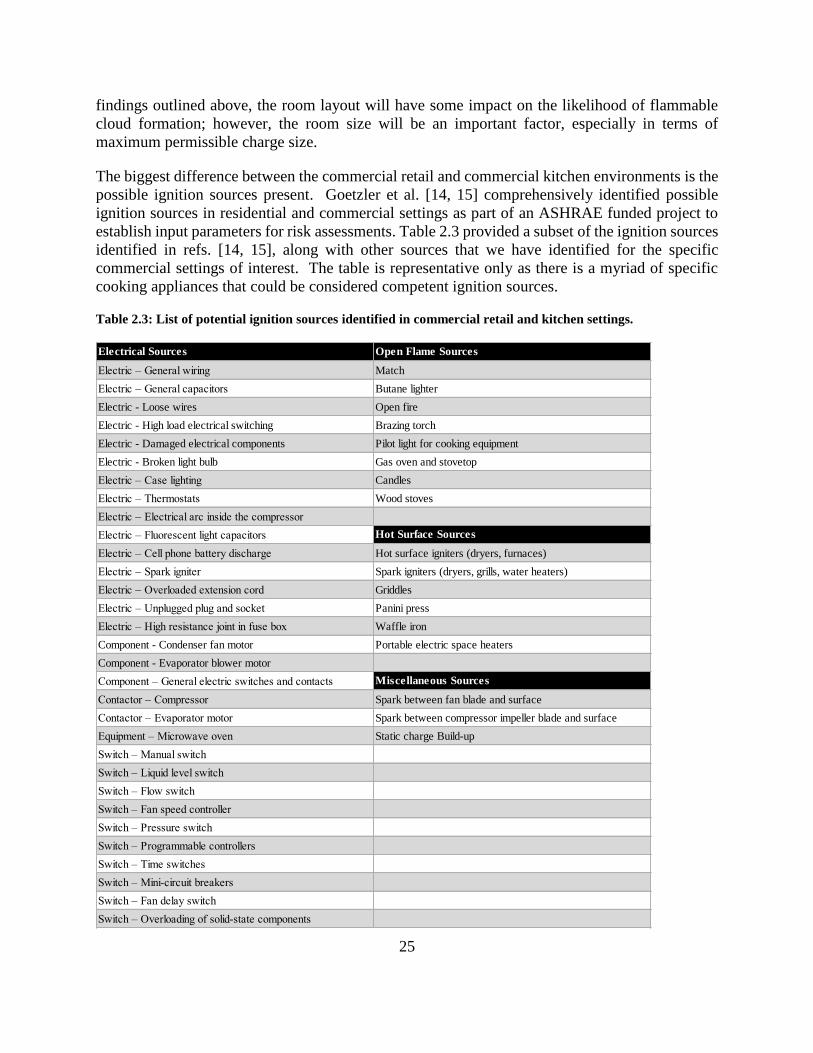
The biggest difference between the commercial retail and commercial kitchen environments is the
possible ignition sources present. Goetzler et al. [14, 15] comprehensively identified possible
ignition sources in residential and commercial settings as part of an ASHRAE funded project to
establish input parameters for risk assessments. Table 2.3 provided a subset of the ignition sources
identified in refs. [14, 15], along with other sources that we have identified for the specific
commercial settings of interest. The table is representative only as there is a myriad of specific
cooking appliances that could be considered competent ignition sources.
Table 2.3: List of potential ignition sources identified in commercial retail and kitchen settings.
Electrical Sources Open Flame Sources
Electric – General wiring Match
Electric – General capacitors Butane lighter
Electric - Loose wires Open fire
Electric - High load electrical switching Brazing torch
Electric - Damaged electrical components Pilot light for cooking equipment
Electric - Broken light bulb Gas oven and stovetop
Electric – Case lighting Candles
Electric – Thermostats Wood stoves
Electric – Electrical arc inside the compressor
Electric – Fluorescent light capacitors Hot Surface Sources
Electric – Cell phone battery discharge Hot surface igniters (dryers, furnaces)
Electric – Spark igniter Spark igniters (dryers, grills, water heaters)
Electric – Overloaded extension cord Griddles
Electric – Unplugged plug and socket Panini press
Electric – High resistance joint in fuse box Waffle iron
Component - Condenser fan motor Portable electric space heaters
Component - Evaporator blower motor
Component – General electric switches and contacts Miscellaneous Sources
Contactor – Compressor Spark between fan blade and surface
Contactor – Evaporator motor Spark between compressor impeller blade and surface
Equipment – Microwave oven Static charge Build-up
Switch – Manual switch
Switch – Liquid level switch
Switch – Flow switch
Switch – Fan speed controller
Switch – Pressure switch
Switch – Programmable controllers
Switch – Time switches
Switch – Mini-circuit breakers
Switch – Fan delay switch
Switch – Overloading of solid-state components

26
Risk assessments for A2L refrigerants typically identify which ignition sources are strong enough
to ignite the refrigerant/air mixtures in question, but in this case, propane/air has a very low
minimum ignition energy of 0.25 mJ (5.97x10⁻³ cal) and a low auto-ignition temperature of 470
°C (878 °F)1 and therefore all sources listed above are considered viable. Section 5.4.3 provides
further discussion and analysis of ignition probability in commercial kitchen and retail
environments.
3 Full-Scale Testing
Gexcon conducted full-scale testing to: (1) Confirm the factors that affect the properties of
accumulated fuel volumes and jet plumes; (2) Quantify severity of ignition events for the various
fuel volumes and jet fires; (3) Fill research gaps and gaps in the current understanding; (4) Test
potential mitigation methods; and (5) Verify FLACS dispersion predictions.
3.1 Design of Experiments
When verifying what factors affect the properties of accumulated fuel volumes, Gexcon had to
either limit the range of certain parameters, or fix them at a single condition. When doing so,
parameters were fixed or limited to conditions that ensured testing would conservatively quantify
event severity. Fixed parameters included low momentum releases (i.e., impinged jets) into a
completely sealed room with no room ventilation. With these parameters fixed, other important
parameters including charge size, leak rate, leak height, and condenser fan operation could each
take on more than one value/condition in the test matrix (e.g., several charge sizes).
To quantify post-ignition event severity, the various accumulated fuel volumes and jet plumes that
may form from a leak were created and ignited. Preliminary CFD simulations identified release
scenarios and conditions that would yield accumulated fuel volumes and jet plumes with a range
of characteristics.
To fill the research gaps previously discussed, higher mass flow rates were considered in
comparison to previous studies, corresponding to larger leak sizes and liquid releases. To evaluate
risk versus charge size and test mitigation methods, various charge sizes were released and tests
were performed with and without a mock-up condenser fan in operation. To enable comparison to
CFD predictions, experimental conditions were well-established (e.g., exact leak height and
position) so that initial conditions and boundary conditions could be accurately specified in the
CFD model.
3.2 Test Room and Display Case
The test room was fabricated from two shipping containers. Gexcon removed one of the walls
from each container and joined the two together to create a double-wide container (see Figure 3.1).
1 National Refrigerants SDS for R-290.
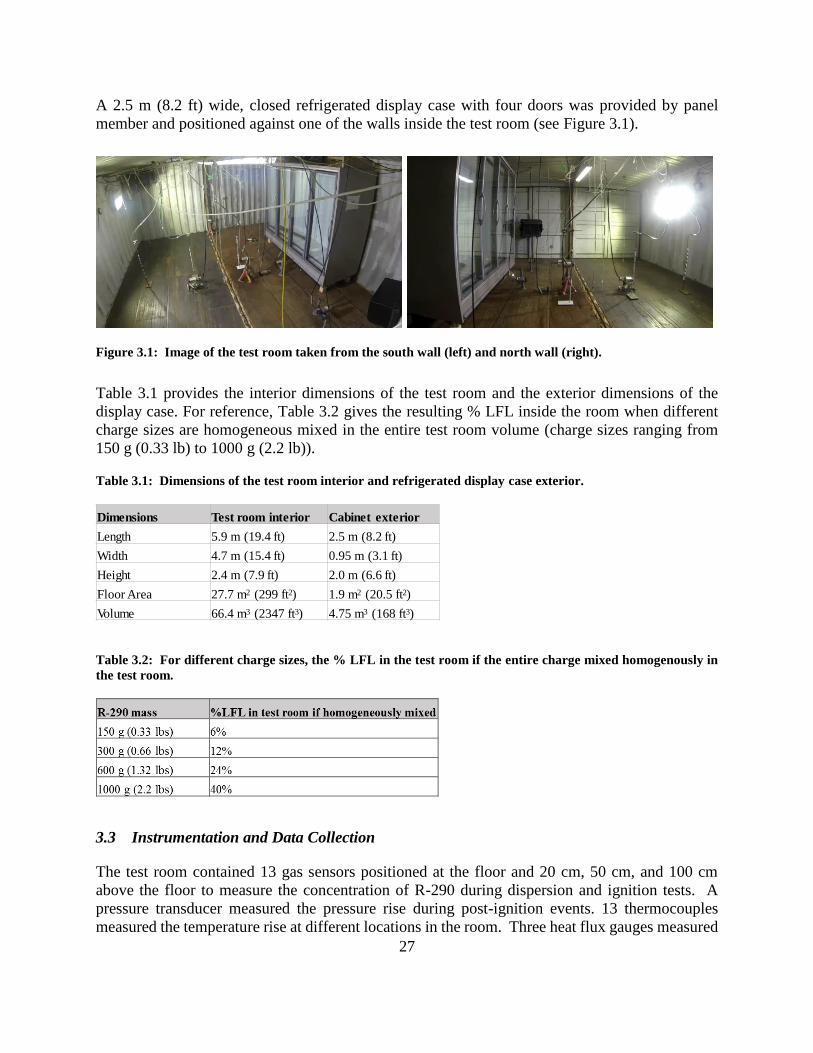
27
A 2.5 m (8.2 ft) wide, closed refrigerated display case with four doors was provided by panel
member and positioned against one of the walls inside the test room (see Figure 3.1).
Figure 3.1: Image of the test room taken from the south wall (left) and north wall (right).
Table 3.1 provides the interior dimensions of the test room and the exterior dimensions of the
display case. For reference, Table 3.2 gives the resulting % LFL inside the room when different
charge sizes are homogeneous mixed in the entire test room volume (charge sizes ranging from
150 g (0.33 lb) to 1000 g (2.2 lb)).
Table 3.1: Dimensions of the test room interior and refrigerated display case exterior.
Table 3.2: For different charge sizes, the % LFL in the test room if the entire charge mixed homogenously in
the test room.
3.3 Instrumentation and Data Collection
The test room contained 13 gas sensors positioned at the floor and 20 cm, 50 cm, and 100 cm
above the floor to measure the concentration of R-290 during dispersion and ignition tests. A
pressure transducer measured the pressure rise during post-ignition events. 13 thermocouples
measured the temperature rise at different locations in the room. Three heat flux gauges measured
Dimensions Test room interior Cabinet exterior
Length 5.9 m (19.4 ft) 2.5 m (8.2 ft)
Width 4.7 m (15.4 ft) 0.95 m (3.1 ft)
Height 2.4 m (7.9 ft) 2.0 m (6.6 ft)
Floor Area 27.7 m2 (299 ft2) 1.9 m2 (20.5 ft2)
Volume 66.4 m3 (2347 ft3) 4.75 m3 (168 ft3)

28
the radiative heat flux, and lastly, two high-speed cameras and two standard-speed cameras
recorded the flame propagation. Sensor wiring was hung from the ceiling so that cables minimally
interfered with the R-290 dispersion along the floor. Figure 3.2 gives the locations of all the
instrumentation in the test room, including the ignitors.
Figure 3.2: Instrumentation and locations in the test room during dispersion and ignition tests. Ignition source
locations during ignition tests.
3.4 Dispersion Tests
Dispersion tests were performed to evaluate the outcome of R-290 leaks inside a condensing unit
(i.e., outside the closed display case). Table 3.3 provides the different leak parameters and
conditions tested for each parameter. All combinations were considered, resulting in a total of 48
tests. Note that charge size and released mass are synonymous as it was assumed the entire charge
would be released in the event of a leak.
Table 3.3: Test conditions during leaks from the condensing unit.
During dispersion tests, R-290 was released into the test room at constant mass flow rates of 12
g/min, 120 g/min, and 335 g/min. Depressurization within the refrigerant system was not
considered to conservatively estimate the highest leak rate for the entire leak duration. The display
case remained off during all testing. Leaks did not originate from the closed-loop cycle of the
Display Case
2.5 m
0.95 m
10
13
6
12
1
23
4
5
8
9
11
7
1
2
3
D
C
B
A
Thermocouple trees
30 cm
5 cm
15 cm
Ignitor tree
Floor ignitor
Parameters Count Conditions
Charge size / released mass 4 150 g (0.33 lbs), 300 g (0.66 lbs), 600 g (1.32 lbs), 1000 g (2.21 lbs)
Leak position 2 Top, Bottom
Leak rate 3 12 g/min (0.03 lb/min), 120 (0.26 lb/min) , 335 g/min (0.74 lb/min)
Condenser fan operation 2 On, Off

29
display case, rather ambient temperature vapor R-290 was released from a supply cylinder and the
mass flow rate was set using a flow meter. For reference, Table 3.4 provides the leak diameters
that would result in the tested mass flow rates assuming a vapor or liquid release from the high-
pressure side of the cycle (i.e. the condenser side). As discussed further in Section 5.4.1, leak
frequency data indicates that 96% of leaks that are likely to occur will be smaller than the largest
leak considered during testing.
Table 3.4: Experimental leak rates and corresponding leak diameters for vapor and liquid leaks on the high-
pressure side (i.e., the condenser side).
Recall that leaks were not created in the closed-loop cycle of the display case, but instead a cylinder
outside the test room supplied R-290. A hose from the cylinder delivered R-290 in the vapor phase
at either the top or bottom of the display case to represent leaks from top- and bottom-mounted
units. During releases with the condenser fan off, the end of the supply hose was placed inside a
small box to reduce the leak momentum by forcing the released jet to impact the wall of the box.
As shown in Figure 3.3, the box volume and outlet area varied depending on the release mass flow
rate so that the velocity of R-290 releases were similar in all tests. Furthermore, the openings in
the boxes were positioned downward (opposite as shown in Figure 3.3) to further ensure leak
momentum was conservatively low. The release boxes were located 2 m from the floor during top
releases and on the floor during bottom releases.
Figure 3.3: R-290 was released inside small boxes varying in size depending on the release mass flow rate to
ensure release momentum was conservatively low.
For leak tests with the condenser fan in operation, the R-290 release nozzle was placed in a mock-
up condensing unit positioned above or below the display case. A 20.3 cm (8 in) diameter variable-
speed fan was mounted in the mock-up condensing unit (see Figure 3.4). For display cases, the
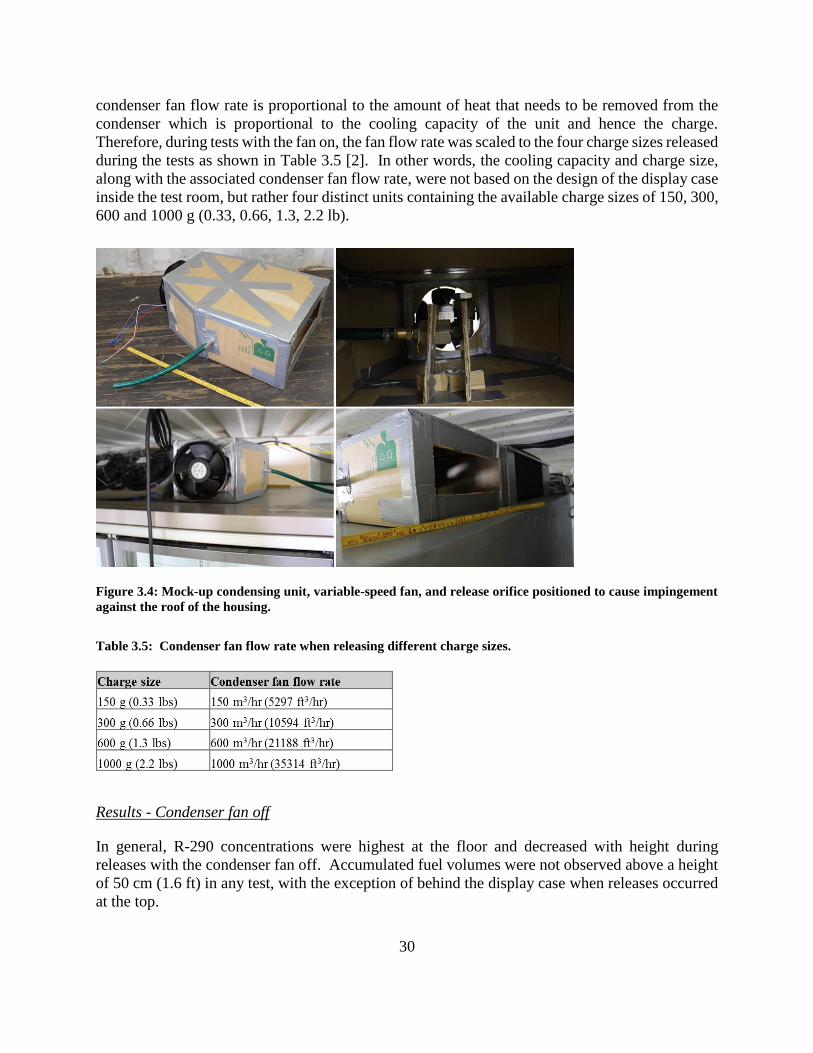
30
condenser fan flow rate is proportional to the amount of heat that needs to be removed from the
condenser which is proportional to the cooling capacity of the unit and hence the charge.
Therefore, during tests with the fan on, the fan flow rate was scaled to the four charge sizes released
during the tests as shown in Table 3.5 [2]. In other words, the cooling capacity and charge size,
along with the associated condenser fan flow rate, were not based on the design of the display case
inside the test room, but rather four distinct units containing the available charge sizes of 150, 300,
600 and 1000 g (0.33, 0.66, 1.3, 2.2 lb).
Figure 3.4: Mock-up condensing unit, variable-speed fan, and release orifice positioned to cause impingement
against the roof of the housing.
Table 3.5: Condenser fan flow rate when releasing different charge sizes.
Results - Condenser fan off
In general, R-290 concentrations were highest at the floor and decreased with height during
releases with the condenser fan off. Accumulated fuel volumes were not observed above a height
of 50 cm (1.6 ft) in any test, with the exception of behind the display case when releases occurred
at the top.

31
Figure 3.5 provides measured R-290 concentrations at the different floor sensors for top and
bottom leaks of 150 g (0.33 lb) at leak rates of 12 g/min (0.03 lb/min), 120 g/min (0.26 lb/min),
and 335 g/min (0.74 lb/min). Note that the numbers in the legends correspond to sensor positions
established in Figure 3.2. As shown in the figure, when releasing 150 g (0.33 lb) from the bottom
of the display case, R-290 concentrations exceeded LFL at the floor, even when the release rate
was 12 g/min (0.03 lb/min) (i.e., the lowest leak rate tested). When releasing 150 g (0.33 lb) from
the top of the case, concentrations exceeded LFL at the floor, but only when the release rate was
120 g/min (0.26 lb/min) or 335 g/min (0.74 lb/min). Note the horizontal dotted red lines at 2.1%
and 9.5% represent the LFL and UFL of R-290 respectively.
Figure 3.5: R-290 concentrations measured at the floor sensors for bottom (bottom frames) and top (top frames)
releases of 150 g (0.33 lb) with the condenser fan off, at leak rates of 12 g/min (0.03 lb/min), 120 g/min (0.26
lb/min), and 335 g/min (0.74 lb/min). Refer to Figure 3.2 for sensor locations based on the numbers provided
in the legends.
12 g/min 120 g/min 335 g/min
Top leaks, 150 g, fan off, floor level sensors
12 g/min 120 g/min 335 g/min
Bottom leaks, 150 g, fan off, floor level sensors
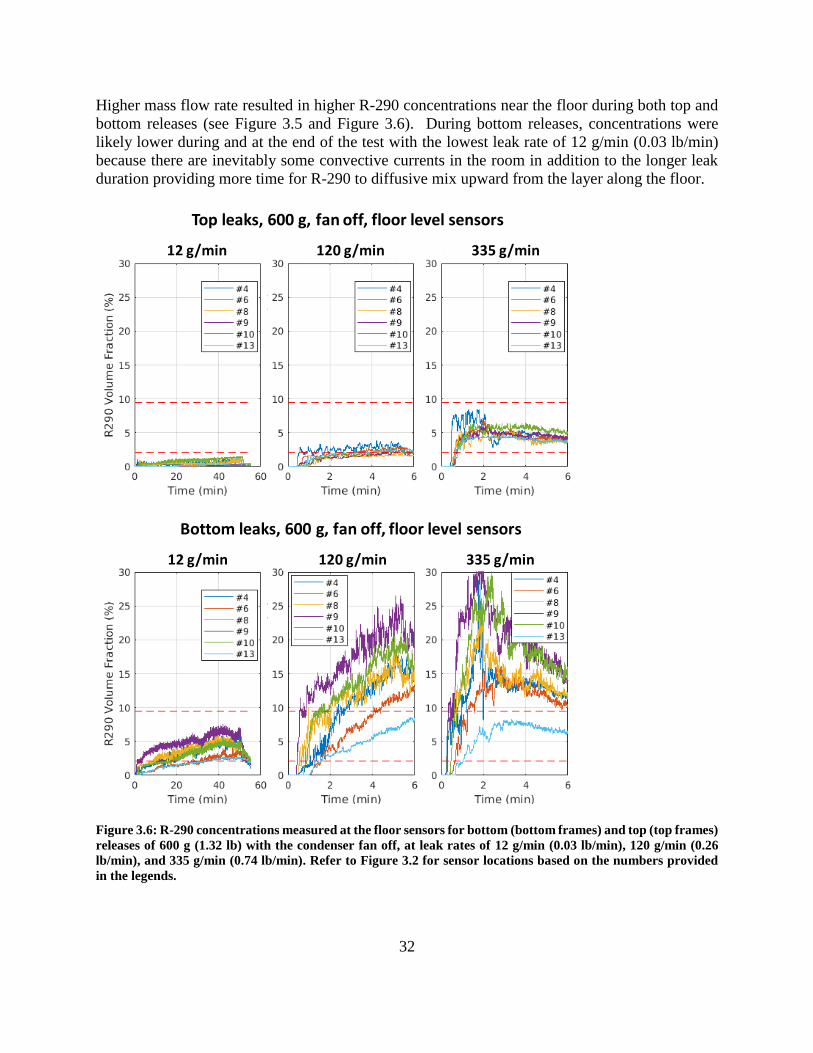
32
Higher mass flow rate resulted in higher R-290 concentrations near the floor during both top and
bottom releases (see Figure 3.5 and Figure 3.6). During bottom releases, concentrations were
likely lower during and at the end of the test with the lowest leak rate of 12 g/min (0.03 lb/min)
because there are inevitably some convective currents in the room in addition to the longer leak
duration providing more time for R-290 to diffusive mix upward from the layer along the floor.
Figure 3.6: R-290 concentrations measured at the floor sensors for bottom (bottom frames) and top (top frames)
releases of 600 g (1.32 lb) with the condenser fan off, at leak rates of 12 g/min (0.03 lb/min), 120 g/min (0.26
lb/min), and 335 g/min (0.74 lb/min). Refer to Figure 3.2 for sensor locations based on the numbers provided
in the legends.
12 g/min 120 g/min 335 g/min
Top leaks, 600 g, fan off, floor level sensors
12 g/min 120 g/min 335 g/min
Bottom leaks, 600 g, fan off, floor level sensors

33
Mass flow rates of 120 g/min (0.26 lb/min) or higher from the top always caused R-290
concentrations to exceed the LFL at the floor. This is a significant result that was not observed in
previous studies because testing was done with leak rates of 60 g/min (0.13 lb/min) or lower [1, 7,
9]. While larger leaks are less likely, they need to be accounted for when assessing risk as they can
result in different outcomes compared to the smaller, more likely leaks.
Top and bottom releases can create layers at the floor with different characteristics. Figure 3.7
shows the concentrations at the floor and at 20 cm (0.66 ft) and 50 cm (1.64 ft) above the floor
during the bottom (left frames) and top (right frames) release of 1000 g (2.2 lb). The bottom
release created a thin rich layer at the floor, whereas the top release created a taller layer with R-
290 concentrations within the flammability limits.
Figure 3.7: R-290 concentrations measured at the floor and at 20 cm (0.66 ft) and 50 cm (1.64 ft) above the floor
during a bottom (left) and top (right) release of 1000 g (2.2 lb), with the condenser fan off, and with a leak rate
of 120 g/min (0.26 lb/min). Refer to Figure 3.2 for sensor locations based on the numbers provided in the
legends.
The main findings from the dispersion tests with the condenser fan off are summarized below:
1) Low momentum releases created accumulated fuel layers near the floor.
2) R-290 concentrations were the highest at the floor and decreased with height.
3) Accumulated fuel volumes were not observed above a height of 50 cm (1.64 ft), except for
behind the display case during top releases.
4) Concentrations at the floor increased with leak rate.
5) Low momentum releases of 150 g (0.33 lb) resulted in accumulated fuel volumes near the
floor, even for 12 g/min (0.03 lb/min) releases at the bottom of the display case.
6) Releases at the top of the display case resulted in accumulated fuel volumes when the leak
rate was 120 g/min (0.26 lb/min) or higher.
7) Top and bottom releases formed accumulated fuel layers with different characteristics
a. Top releases resulted in a taller layer with flammable R-290 concentrations
extending up to a height of 50 cm (1.64 ft).
b. Bottom releases resulted in much higher concentrations well above the UFL at the
floor and minimal concentrations at a height of 50 cm (1.64 ft).

34
Results - Condenser fan on
Condenser fan operation significantly reduced peak R-290 concentrations in the test room and
resulted in more uniform mixing. Examples are provided in Figure 3.8, which compares R-290
concentrations with the fan off (left frames) and on (right frames) during bottom the release of 600
g (1.32 lb) at 12 g/min (0.03 lb/min). Figure 3.9 provides the same comparison during the top
release of 600 g (1.32 lb) at 335 g/min (0.74 lb/min).
Figure 3.8: R-290 concentrations measured at the floor and at 20 cm (0.66 ft) and 50 cm (1.64 ft) above the floor
during a bottom release of 600 g (1.32 lb) at 12 g/min (0.03 lb/min) with the condenser fan off (left) and on
(right). Refer to Figure 3.2 for sensor locations based on the numbers provided in the legends.
Figure 3.9: R-290 concentrations measured at the floor and at 20 cm (0.66 ft) and 50 cm (1.64 ft) above the floor
during a top release of 600 g (1.32 lb) at 335 g/min (0.74 lb/min) with the condenser fan off (left) and on (right).
Refer to Figure 3.2 for sensor locations based on the numbers provided in the legends.
As the leak rate increases, higher fan flow rates are needed to maintain dilution and prevent fuel
volumes from accumulating at the floor (see Figure 3.10). R-290 concentrations remained below
the LFL in all tests with the fan on except for the top and bottom release of 150 g (0.33 lb) at the
highest leak rate of 335 g/min (0.74 lb/min). These tests had the lowest fan flow rate of 150 m3/hr
(5297 ft3/hr) (scaled to charge size), and thus not enough mixing and dilution occurred during the
335 g/min (0.74 lb/min) release to prevent R-290 concentrations from exceeding the LFL at floor.
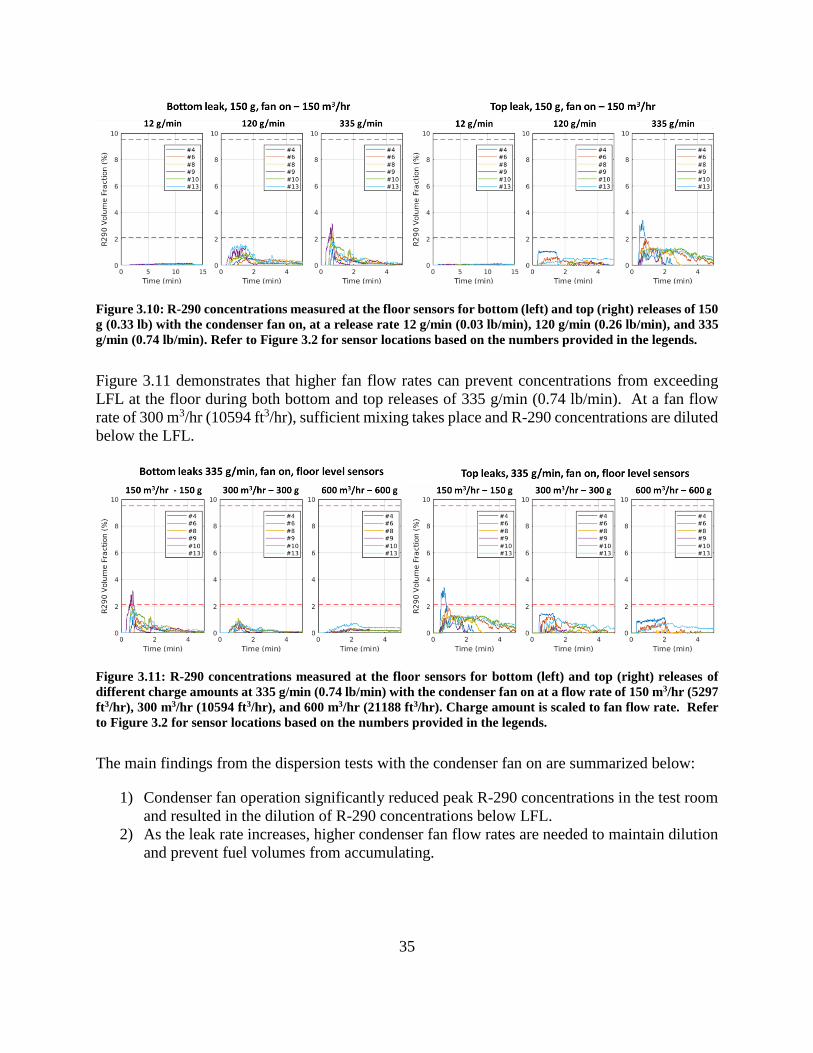
35
Figure 3.10: R-290 concentrations measured at the floor sensors for bottom (left) and top (right) releases of 150
g (0.33 lb) with the condenser fan on, at a release rate 12 g/min (0.03 lb/min), 120 g/min (0.26 lb/min), and 335
g/min (0.74 lb/min). Refer to Figure 3.2 for sensor locations based on the numbers provided in the legends.
Figure 3.11 demonstrates that higher fan flow rates can prevent concentrations from exceeding
LFL at the floor during both bottom and top releases of 335 g/min (0.74 lb/min). At a fan flow
rate of 300 m3/hr (10594 ft3/hr), sufficient mixing takes place and R-290 concentrations are diluted
below the LFL.
Figure 3.11: R-290 concentrations measured at the floor sensors for bottom (left) and top (right) releases of
different charge amounts at 335 g/min (0.74 lb/min) with the condenser fan on at a flow rate of 150 m3/hr (5297
ft3/hr), 300 m3/hr (10594 ft3/hr), and 600 m3/hr (21188 ft3/hr). Charge amount is scaled to fan flow rate. Refer
to Figure 3.2 for sensor locations based on the numbers provided in the legends.
The main findings from the dispersion tests with the condenser fan on are summarized below:
1) Condenser fan operation significantly reduced peak R-290 concentrations in the test room
and resulted in the dilution of R-290 concentrations below LFL.
2) As the leak rate increases, higher condenser fan flow rates are needed to maintain dilution
and prevent fuel volumes from accumulating.

36
3.5 Ignition Tests
Gexcon ignited: (1) R-290 releases outside the display case; (2) R-290/air mixtures exiting the
display case after an internal leak; and (3) vapor and liquid jet flames external to the display case.
During each test, cameras filmed the post-ignition event and sensors measured temperature,
pressure, and thermal flux.
Twelve of the dispersion tests (leaks from the mock-up condensing unit) were repeated with
ignition sources inside the test room. Sensors measured the concentration of R-290 up to the point
of ignition, and for all tests, concentrations were similar to those observed during the dispersion
tests. Ignition sources were activated at the end of the leak. High-voltage AC transformers created
continuous sparks at the two lowest ignition locations and hot-wires were positioned at the two
upper ignition locations (ignition locations shown in Figure 3.2).
Gexcon performed two additional tests with 900 g (1.98 lb) charges leaked inside the closed
display case. Since the concentration of R-290 within the display case after a leak depends on the
internal volume, the actual charge size of 900 g (1.98 lb) for the exemplar display case was released
in both tests. In one test, R-290 was released into the display case as a free jet so that the contents
inside the display case would mix uniformly. Due to the intimate mixing of the R-290 and air
from the jet, this scenario also represents a leak in the display case while the evaporator fan is on
and mixes the released fuel. In the second test, R-290 was released with low momentum to create
a smaller, yet higher average concentration of R-290, accumulated fuel volume inside the display
case. Once the leaks ended, a door on the unit was opened, allowing the fuel volume to exit into
the room. For these tests, ignition sources were also placed outside the display case in the locations
shown in Figure 3.2.
In the last two tests, free jet releases of R-290 were ignited to create jet fires. A charge size of
1000 g (2.20 lb) of both vapor and liquid were released through a 2 mm (0.08 in) diameter orifice
located in front of the display case at a height of 1 m (3.3 ft). The position was not chosen to be
representative of a likely release location, but so that the flame length could be easily filmed and
the heat flux could be measured with only minor changes to the sensor positions. During these
tests, the sensors were positioned axially along the floor, 0.61 m (2 ft), 1.22 m (4 ft), and 1.83 m
(6 ft) from the release orifice, and with the sensor elements facing upward. Pressure and
temperature sensors were not active for these two tests. The mass flow rate was not controlled with
a mass flow meter like in the previous tests, but instead dictated by the size of the orifice (2 mm
(0.08 in) diameter) and the delivery pressure of R-290 (vapor pressure at 17.2 °C (63 °F)). The
estimated mass flow rate was 380 g/min (0.84 lb/min) and 3050 g/min (6.72 lb/min) during the
vapor and liquid release, respectively. An ignitor was placed downstream of the release orifice to
initiate a jet flame.
Table 3.6 provides the conditions for each test along with the main results. The table includes
release location, leak mass flow rate, whether the condenser fan was active, released charge size,
whether ignition was observed, maximum pressure rise, maximum temperature recorded at any
thermocouple, and peak heat flux measured by the three sensors (all measurement device positions
are provided in Figure 3.2).

37
Table 3.6: Conditions and main results of each ignition test.
Ignition occurred in all tests except for #7 and #8. During test #6, R-290 migrated under the
floorboards and the high-speed video clearly showed a confined deflagration below the floorboards
that damaged the floor and contributed to the severity of the event. The confined deflagration
below the floorboards also knocked out the data acquisition equipment for the sensors, hence the
lack of data presented in the table. After test #6, the floor was repaired and all floorboard seams
were covered with heat resistant tape to prevent R-290 from migrating below again.
Ignition occurred in test #5 when 600 g (1.32 lb) were released at 120 g/min (0.26 lb/min) from
the bottom of the unit. Test #7 was a repeat of test #5, but with the condenser fan on. Ignition did
not occur during this test confirming that the fan operation prevents concentrations from exceeding
LFL along the floor and results in more homogeneous mixing.
Figure 3.12 provides snapshots from tests #3 and #5 with 150 g (0.33 lb) and 600 g (1.32 lb)
charges released at 120 g/min (0.26 lb/min) from the bottom of the unit while the condenser fan
was off. The left image shows the flames shortly after ignition, the center image shows the flames
at their most intense state, and the right image shows the flames just prior to extinction. As seen
in the figure, ignition after leaking larger charge sizes resulted in more intense flames that were
taller and extended throughout a large portion of the test room. Note that the enclosure door was
left open in test #3 and sealed with a 4 mil plastic sheet which did not yield during the ignition
event. Therefore, the comparison of test #3 in Figure 3.12 (and in Figure 3.14) to a test with the
door closed is valid.
Sensor #1 Sensor #2 Sensor #3
1 Bottom 12 Off 150 840 13 3.0 1.4
2 Bottom 12 Off 600 0.95 1400 82 41 28
3 Bottom 120 Off 150 0.15 950 19 13 7.1
4 Bottom 120 Off 300 0.8 820 38 30 13
5 Bottom 120 Off 600 0.9 1500 97 63 23
6 Bottom 120 Off 1000 0.2 1000 - - -
7 Bottom 120 On 600 - - - - -
8 Top 12 Off 600 - - - - -
9 Top 120 Off 150 0.35 850 24 7.0 4.4
10 Top 120 Off 300 0.5 720 19 13 13
11 Top 120 Off 600 0.67 1100 110 72 84
12 Top 120 Off 1000 1.11 1620 120 120 93
13 Inside 120 Off 900 0.59 1450 90 58 28
14 Inside 240 Off 900 0.86 1472 120 91 34
15 Vapor Jet 380 Off 1000 - - 0.62 0.36 0.16
16 Liquid Jet 3050 Off 1000 - - 5.6 6.8 6.0
Charge
size (g)
Peak heat flux (kW/m2)Ingition
test #
Release
location
Leak rate
(g/min)
Ventilation
(off/on)
Δpmax
(psig)
Tmax
(°F)
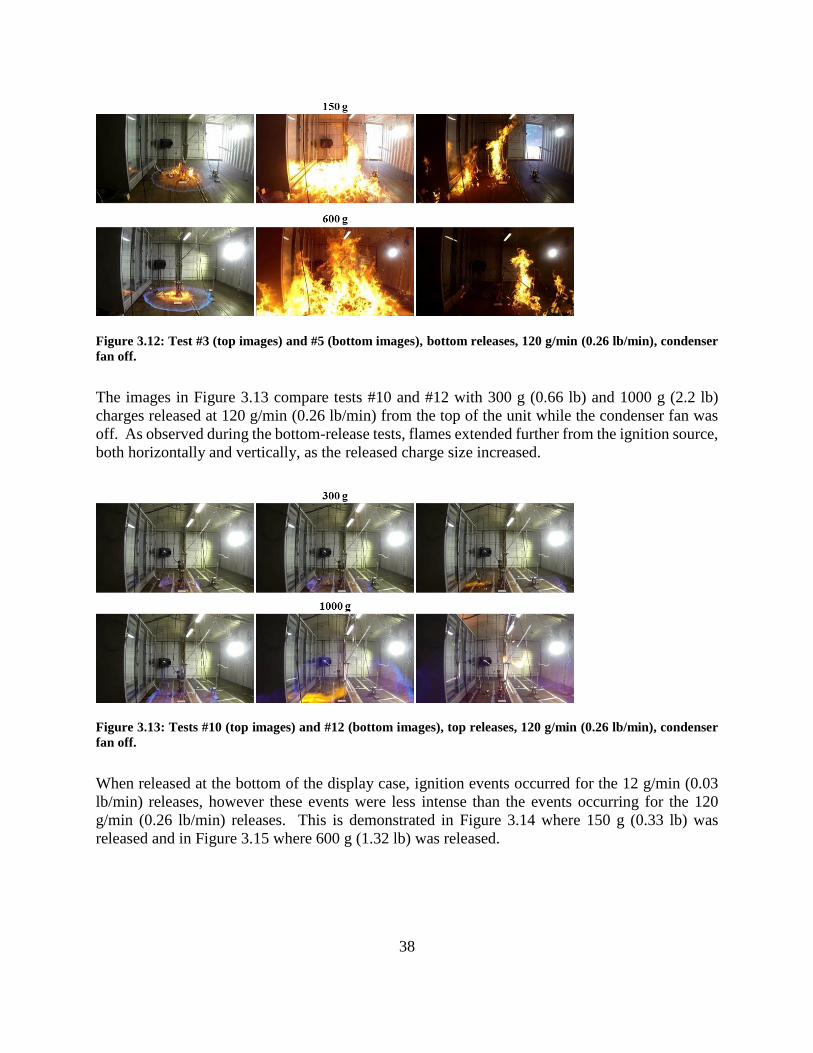
38
Figure 3.12: Test #3 (top images) and #5 (bottom images), bottom releases, 120 g/min (0.26 lb/min), condenser
fan off.
The images in Figure 3.13 compare tests #10 and #12 with 300 g (0.66 lb) and 1000 g (2.2 lb)
charges released at 120 g/min (0.26 lb/min) from the top of the unit while the condenser fan was
off. As observed during the bottom-release tests, flames extended further from the ignition source,
both horizontally and vertically, as the released charge size increased.
Figure 3.13: Tests #10 (top images) and #12 (bottom images), top releases, 120 g/min (0.26 lb/min), condenser
fan off.
When released at the bottom of the display case, ignition events occurred for the 12 g/min (0.03
lb/min) releases, however these events were less intense than the events occurring for the 120
g/min (0.26 lb/min) releases. This is demonstrated in Figure 3.14 where 150 g (0.33 lb) was
released and in Figure 3.15 where 600 g (1.32 lb) was released.

39
Figure 3.14: Test #1 (top images) and #3 (bottom images), bottom release, 150 g (0.33 lb), condenser fan off.
Figure 3.15: Test #2 (top images) and #5 (bottom images), bottom release, 600 g (1.32 lb), condenser fan off.
In the ignition tests, event severity increased with the release mass flow rate. For example, the
12 g/min (0.03 lb/min) release of 600 g (1.32 lb) from the top of the display case (test #8) did not
result in ignition. When leaked at 12 g/min (0.03 lb/min), the leaked R-290 was able to sufficiently
mix as it migrated toward the floor such that concentrations remained below the LFL. Conversely,
the 120 g/min (0.26 lb/min) release of the same charge amount and at the same location (test #11)
resulted in intense flames almost throughout the entire test room.
As illustrated in Figure 3.16, the combustion events were different when igniting releases from the
top and bottom of the display case. Top leaks created a taller layer within the flammability limits,
resulting in more of a premixed flame propagation upon ignition. Bottom leaks created thin rich
layers above the UFL at the floor resulting in large diffusion flames more typical of pool fires. As
noted above, in test #6 (see the top images of Figure 3.16), R-290 migrated under the floorboards
and the high-speed video clearly showed a confined deflagration originating under the floor that
damaged the floor and contributed to the severity of the event.
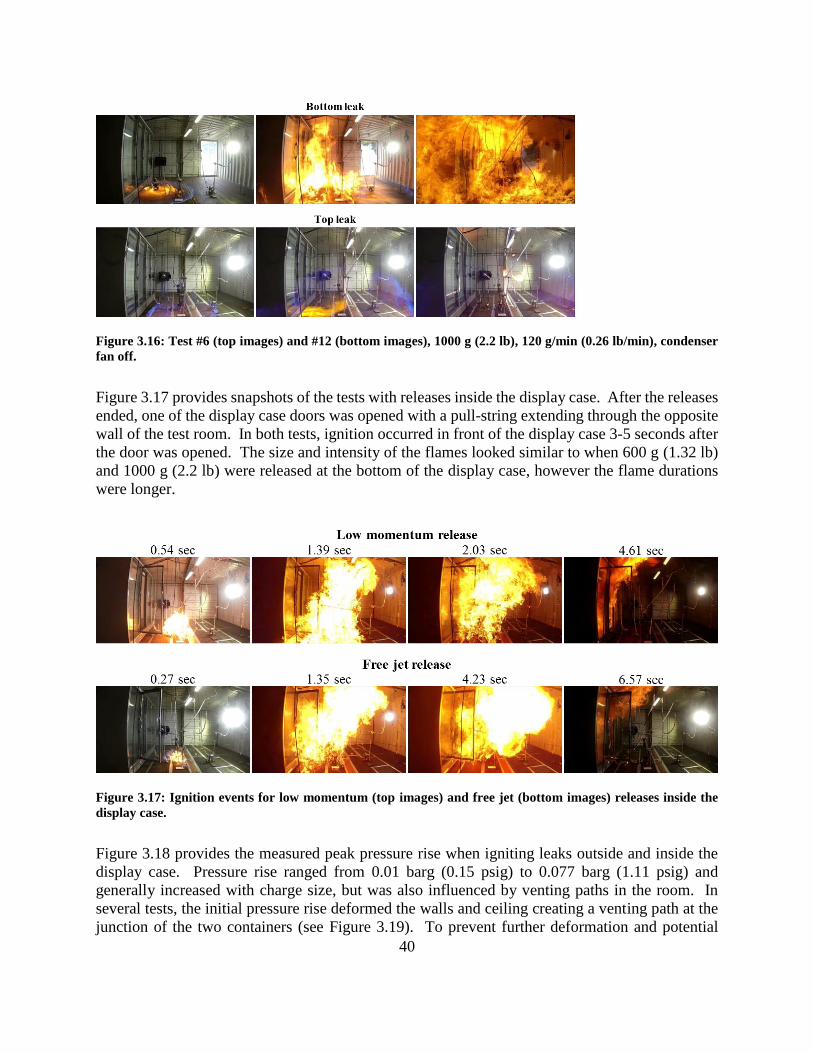
40
Figure 3.16: Test #6 (top images) and #12 (bottom images), 1000 g (2.2 lb), 120 g/min (0.26 lb/min), condenser
fan off.
Figure 3.17 provides snapshots of the tests with releases inside the display case. After the releases
ended, one of the display case doors was opened with a pull-string extending through the opposite
wall of the test room. In both tests, ignition occurred in front of the display case 3-5 seconds after
the door was opened. The size and intensity of the flames looked similar to when 600 g (1.32 lb)
and 1000 g (2.2 lb) were released at the bottom of the display case, however the flame durations
were longer.
Figure 3.17: Ignition events for low momentum (top images) and free jet (bottom images) releases inside the
display case.
Figure 3.18 provides the measured peak pressure rise when igniting leaks outside and inside the
display case. Pressure rise ranged from 0.01 barg (0.15 psig) to 0.077 barg (1.11 psig) and
generally increased with charge size, but was also influenced by venting paths in the room. In
several tests, the initial pressure rise deformed the walls and ceiling creating a venting path at the
junction of the two containers (see Figure 3.19). To prevent further deformation and potential
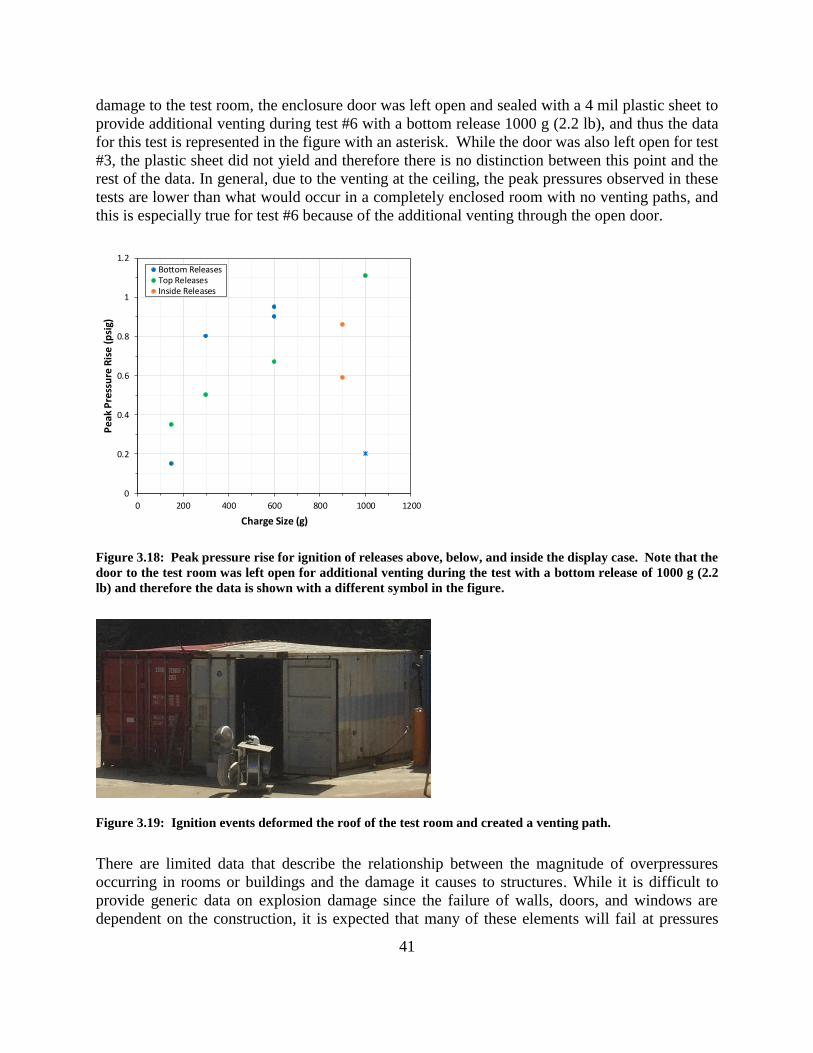
41
damage to the test room, the enclosure door was left open and sealed with a 4 mil plastic sheet to
provide additional venting during test #6 with a bottom release 1000 g (2.2 lb), and thus the data
for this test is represented in the figure with an asterisk. While the door was also left open for test
#3, the plastic sheet did not yield and therefore there is no distinction between this point and the
rest of the data. In general, due to the venting at the ceiling, the peak pressures observed in these
tests are lower than what would occur in a completely enclosed room with no venting paths, and
this is especially true for test #6 because of the additional venting through the open door.
Figure 3.18: Peak pressure rise for ignition of releases above, below, and inside the display case. Note that the
door to the test room was left open for additional venting during the test with a bottom release of 1000 g (2.2
lb) and therefore the data is shown with a different symbol in the figure.
Figure 3.19: Ignition events deformed the roof of the test room and created a venting path.
There are limited data that describe the relationship between the magnitude of overpressures
occurring in rooms or buildings and the damage it causes to structures. While it is difficult to
provide generic data on explosion damage since the failure of walls, doors, and windows are
dependent on the construction, it is expected that many of these elements will fail at pressures
0
0.2
0.4
0.6
0.8
1
1.2
0 200 400 600 800 1000 1200
Pea
k P
ress
ure
Ris
e (
psi
g)
Charge Size (g)
Bottom ReleasesTop ReleasesInside Releases
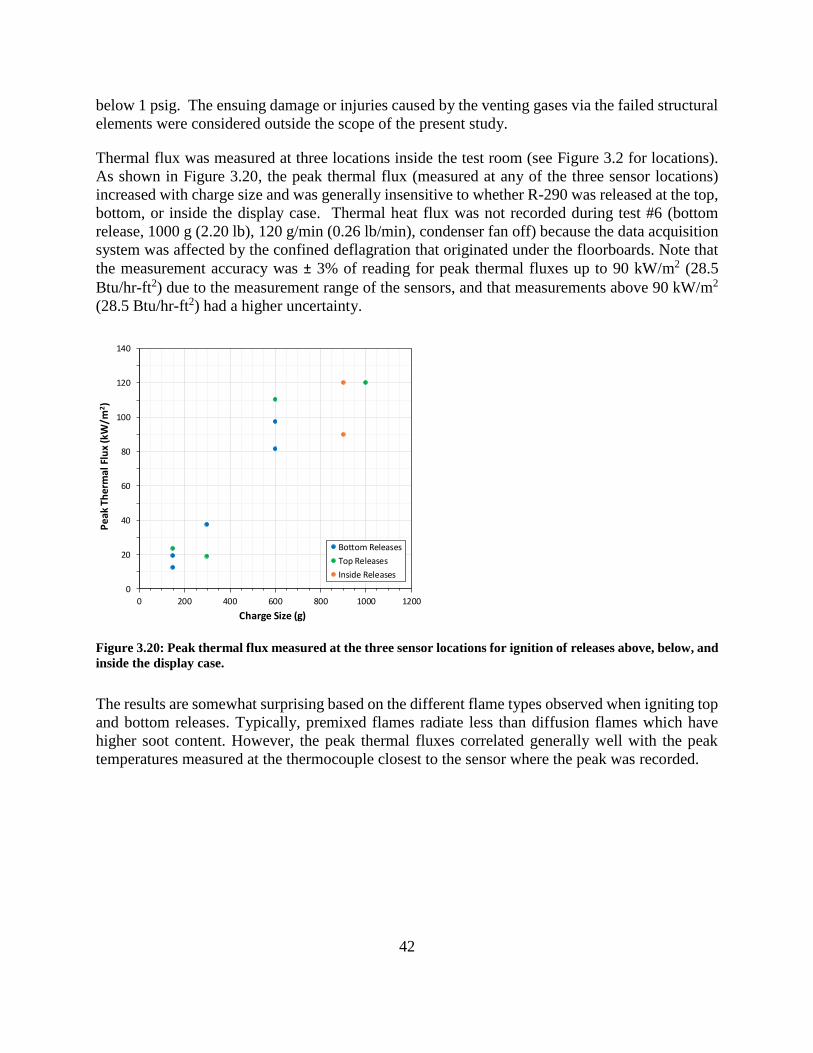
42
below 1 psig. The ensuing damage or injuries caused by the venting gases via the failed structural
elements were considered outside the scope of the present study.
Thermal flux was measured at three locations inside the test room (see Figure 3.2 for locations).
As shown in Figure 3.20, the peak thermal flux (measured at any of the three sensor locations)
increased with charge size and was generally insensitive to whether R-290 was released at the top,
bottom, or inside the display case. Thermal heat flux was not recorded during test #6 (bottom
release, 1000 g (2.20 lb), 120 g/min (0.26 lb/min), condenser fan off) because the data acquisition
system was affected by the confined deflagration that originated under the floorboards. Note that
the measurement accuracy was ± 3% of reading for peak thermal fluxes up to 90 kW/m2 (28.5
Btu/hr-ft2) due to the measurement range of the sensors, and that measurements above 90 kW/m2
(28.5 Btu/hr-ft2) had a higher uncertainty.
Figure 3.20: Peak thermal flux measured at the three sensor locations for ignition of releases above, below, and
inside the display case.
The results are somewhat surprising based on the different flame types observed when igniting top
and bottom releases. Typically, premixed flames radiate less than diffusion flames which have
higher soot content. However, the peak thermal fluxes correlated generally well with the peak
temperatures measured at the thermocouple closest to the sensor where the peak was recorded.
0
20
40
60
80
100
120
140
0 200 400 600 800 1000 1200
Pea
k Th
erm
al F
lux
(kW
/m2)
Charge Size (g)
Bottom Releases
Top Releases
Inside Releases
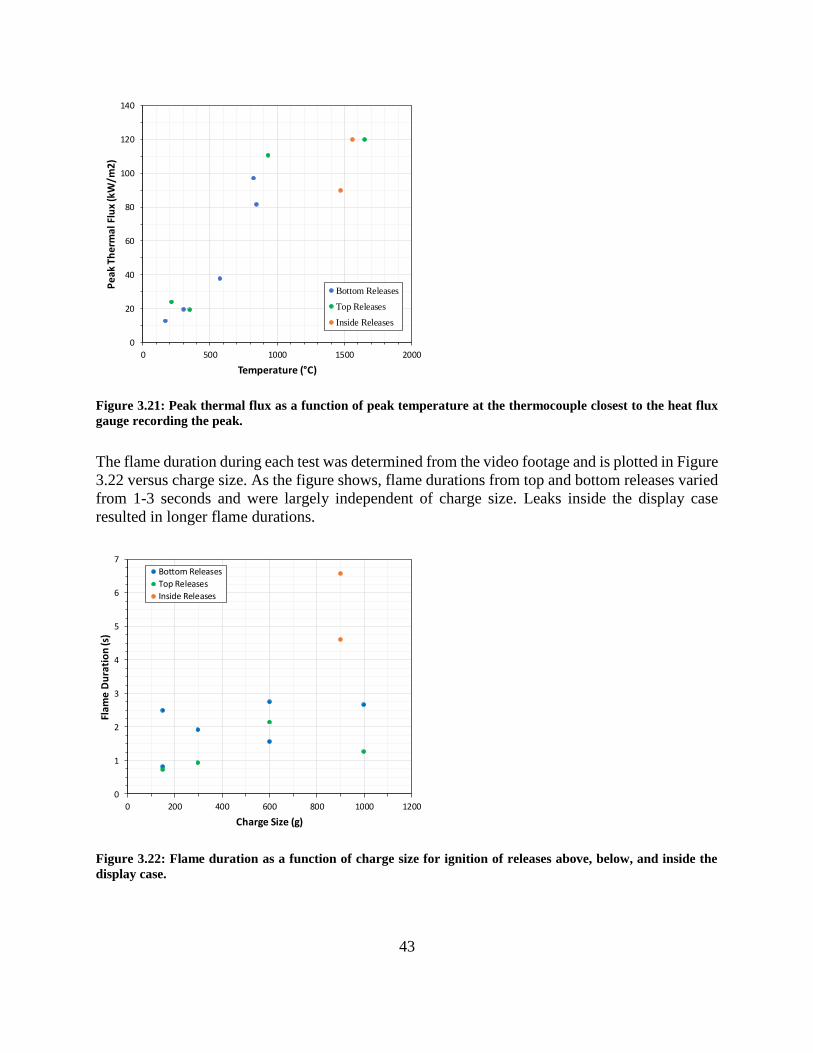
43
Figure 3.21: Peak thermal flux as a function of peak temperature at the thermocouple closest to the heat flux
gauge recording the peak.
The flame duration during each test was determined from the video footage and is plotted in Figure
3.22 versus charge size. As the figure shows, flame durations from top and bottom releases varied
from 1-3 seconds and were largely independent of charge size. Leaks inside the display case
resulted in longer flame durations.
Figure 3.22: Flame duration as a function of charge size for ignition of releases above, below, and inside the
display case.
0
20
40
60
80
100
120
140
0 500 1000 1500 2000
Pe
ak T
he
rma
l Flu
x (k
W/m
2)
Temperature (°C)
Bottom Releases
Top Releases
Inside Releases
0
1
2
3
4
5
6
7
0 200 400 600 800 1000 1200
Flam
e D
ura
tio
n (s
)
Charge Size (g)
Bottom Releases
Top Releases
Inside Releases
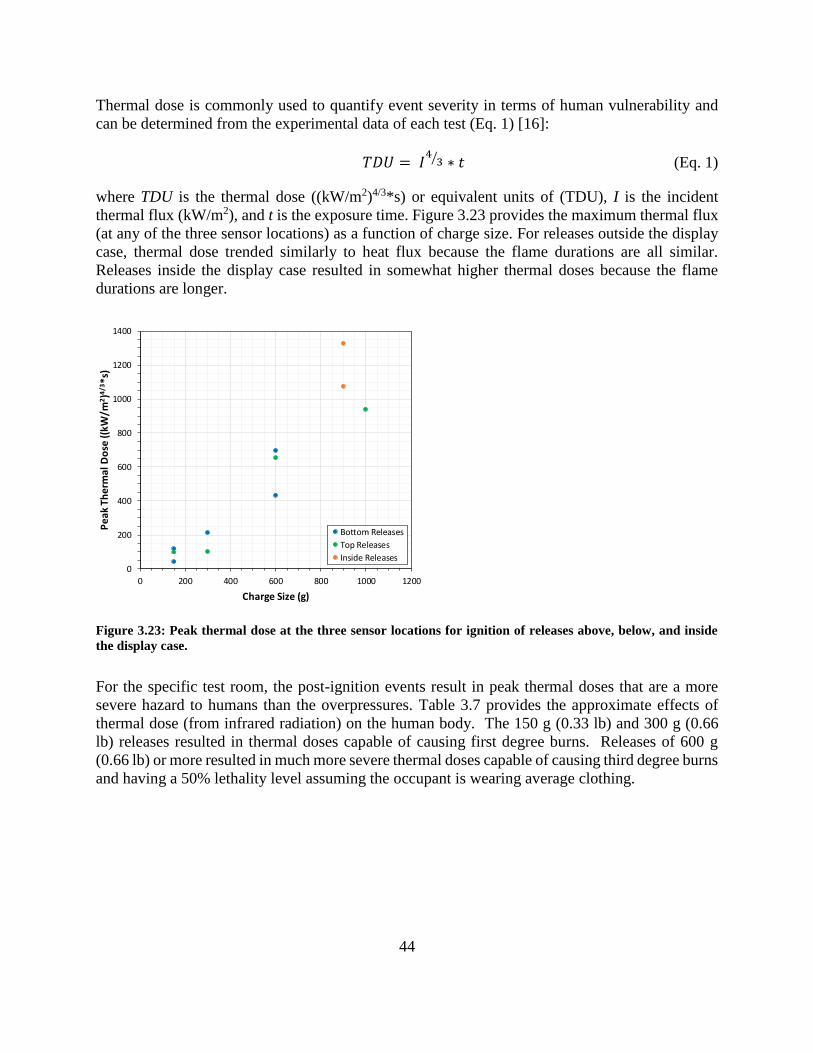
44
Thermal dose is commonly used to quantify event severity in terms of human vulnerability and
can be determined from the experimental data of each test (Eq. 1) [16]:
𝑇𝐷𝑈 = 𝐼4
3⁄ ∗ 𝑡 (Eq. 1)
where TDU is the thermal dose ((kW/m2)4/3*s) or equivalent units of (TDU), I is the incident
thermal flux (kW/m2), and t is the exposure time. Figure 3.23 provides the maximum thermal flux
(at any of the three sensor locations) as a function of charge size. For releases outside the display
case, thermal dose trended similarly to heat flux because the flame durations are all similar.
Releases inside the display case resulted in somewhat higher thermal doses because the flame
durations are longer.
Figure 3.23: Peak thermal dose at the three sensor locations for ignition of releases above, below, and inside
the display case.
For the specific test room, the post-ignition events result in peak thermal doses that are a more
severe hazard to humans than the overpressures. Table 3.7 provides the approximate effects of
thermal dose (from infrared radiation) on the human body. The 150 g (0.33 lb) and 300 g (0.66
lb) releases resulted in thermal doses capable of causing first degree burns. Releases of 600 g
(0.66 lb) or more resulted in much more severe thermal doses capable of causing third degree burns
and having a 50% lethality level assuming the occupant is wearing average clothing.
0
200
400
600
800
1000
1200
1400
0 200 400 600 800 1000 1200
Pe
ak T
he
rmal
Do
se ((
kW/m
2)4
/3*s
)
Charge Size (g)
Bottom Releases
Top Releases
Inside Releases
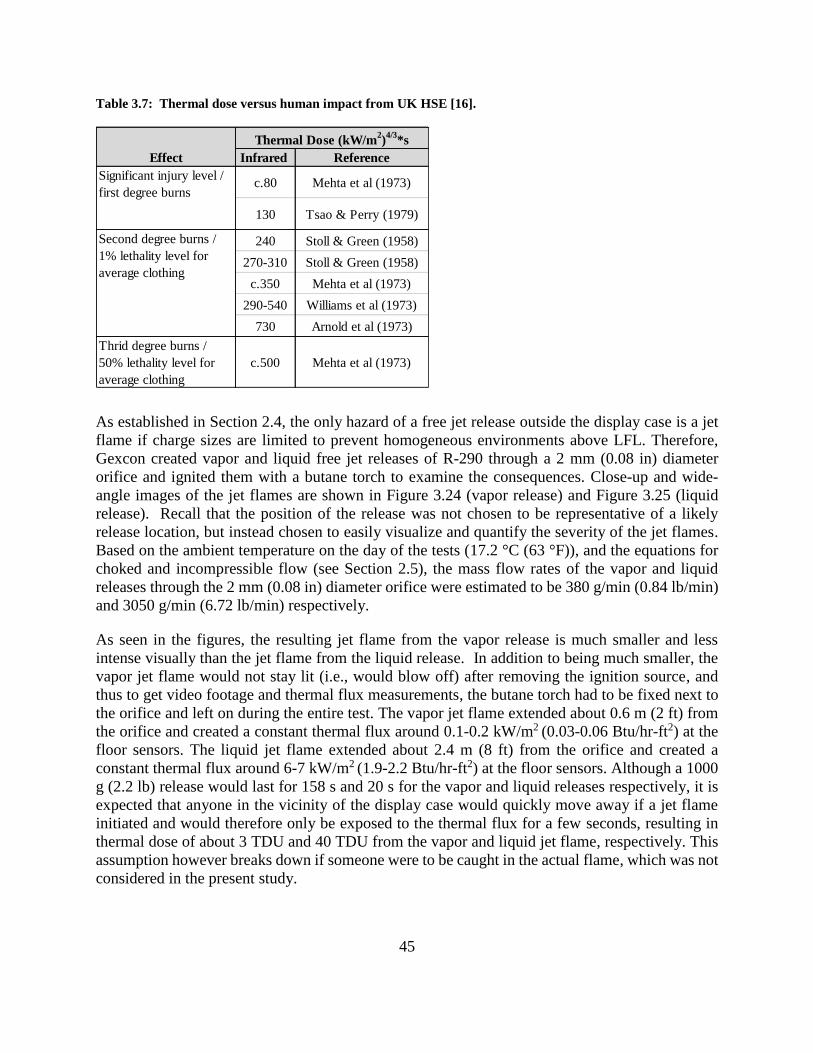
45
Table 3.7: Thermal dose versus human impact from UK HSE [16].
As established in Section 2.4, the only hazard of a free jet release outside the display case is a jet
flame if charge sizes are limited to prevent homogeneous environments above LFL. Therefore,
Gexcon created vapor and liquid free jet releases of R-290 through a 2 mm (0.08 in) diameter
orifice and ignited them with a butane torch to examine the consequences. Close-up and wide-
angle images of the jet flames are shown in Figure 3.24 (vapor release) and Figure 3.25 (liquid
release). Recall that the position of the release was not chosen to be representative of a likely
release location, but instead chosen to easily visualize and quantify the severity of the jet flames.
Based on the ambient temperature on the day of the tests (17.2 °C (63 °F)), and the equations for
choked and incompressible flow (see Section 2.5), the mass flow rates of the vapor and liquid
releases through the 2 mm (0.08 in) diameter orifice were estimated to be 380 g/min (0.84 lb/min)
and 3050 g/min (6.72 lb/min) respectively.
As seen in the figures, the resulting jet flame from the vapor release is much smaller and less
intense visually than the jet flame from the liquid release. In addition to being much smaller, the
vapor jet flame would not stay lit (i.e., would blow off) after removing the ignition source, and
thus to get video footage and thermal flux measurements, the butane torch had to be fixed next to
the orifice and left on during the entire test. The vapor jet flame extended about 0.6 m (2 ft) from
the orifice and created a constant thermal flux around 0.1-0.2 kW/m2 (0.03-0.06 Btu/hr-ft2) at the
floor sensors. The liquid jet flame extended about 2.4 m (8 ft) from the orifice and created a
constant thermal flux around 6-7 kW/m2 (1.9-2.2 Btu/hr-ft2) at the floor sensors. Although a 1000
g (2.2 lb) release would last for 158 s and 20 s for the vapor and liquid releases respectively, it is
expected that anyone in the vicinity of the display case would quickly move away if a jet flame
initiated and would therefore only be exposed to the thermal flux for a few seconds, resulting in
thermal dose of about 3 TDU and 40 TDU from the vapor and liquid jet flame, respectively. This
assumption however breaks down if someone were to be caught in the actual flame, which was not
considered in the present study.
Infrared Reference
c.80 Mehta et al (1973)
130 Tsao & Perry (1979)
240 Stoll & Green (1958)
270-310 Stoll & Green (1958)
c.350 Mehta et al (1973)
290-540 Williams et al (1973)
730 Arnold et al (1973)
Thrid degree burns /
50% lethality level for
average clothing
c.500 Mehta et al (1973)
Thermal Dose (kW/m2)
4/3*s
Significant injury level /
first degree burns
Second degree burns /
1% lethality level for
average clothing
Effect

46
Figure 3.24: Jet flame of a vapor release through a 2 mm (0.08 in) diameter orifice.
Figure 3.25: Jet flame of a liquid release through a 2 mm (0.08 in) diameter orifice.
The main findings from the ignition tests are summarized below:
1) Post-ignition event severity increased with charge size and mass flow rate.
a. Increased flame intensity observed in videos
b. Increased pressure rise
c. Increased thermal dose
2) Condenser fan operation prevented ignition.
3) Different flame structures were observed when igniting top and bottom releases.
4) Releases inside the display case resulted in similar post-ignition events as releases outside
the display case with similar charge sizes.
5) When leaked through the same diameter orifice, the liquid release created a significantly
bigger jet flame compared to the vapor release.
4 Comparison of CFD Dispersion Predictions to Measurements
One method of assessing risk, which is adopted in the present study and discussed further below,
is to incorporate advanced CFD to predict the dispersion process for different leak scenarios. CFD
models such as FLACS have been extensively validated for predicting dispersion processes in
many applications. Furthermore, the room-scale dispersion tests offer an excellent means of
additionally confirming the suitability of FLACS for predicting the dispersion of R-290 from leaks
in refrigerated display cases.
To enable comparison, the dispersion tests discussed in Section 3.4 were simulated in FLACS and
the predicted R-290 concentrations were compared to measurements. Comparisons were
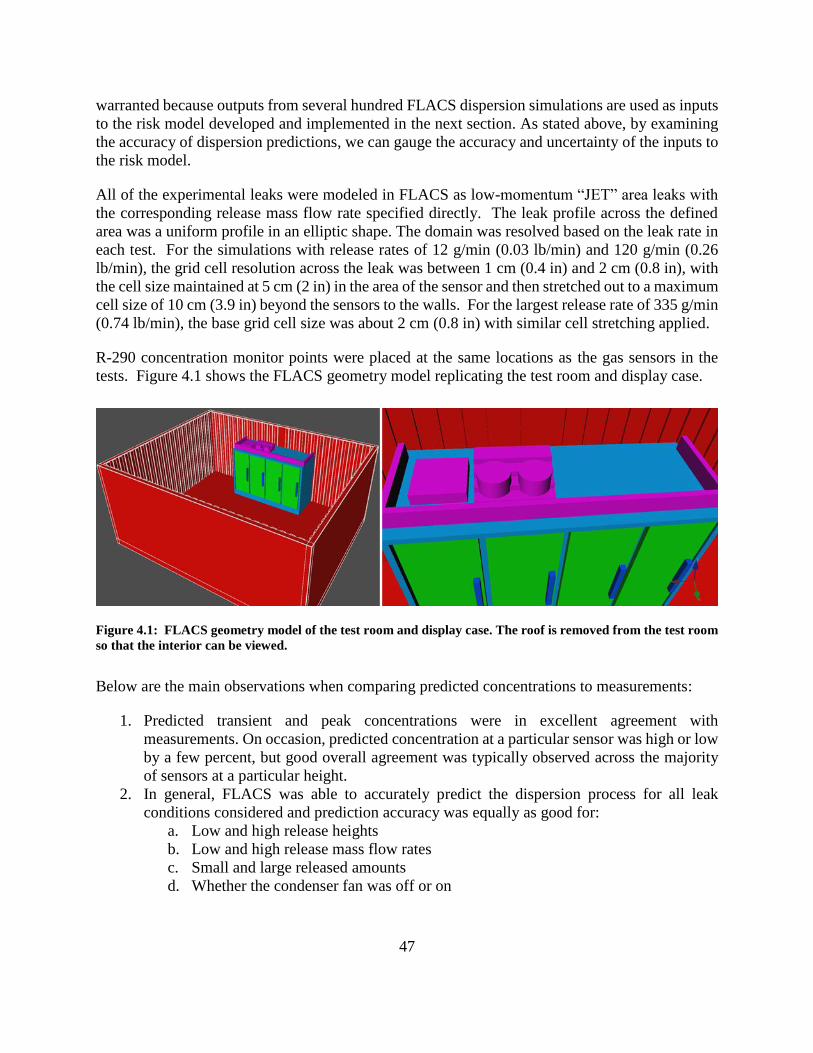
47
warranted because outputs from several hundred FLACS dispersion simulations are used as inputs
to the risk model developed and implemented in the next section. As stated above, by examining
the accuracy of dispersion predictions, we can gauge the accuracy and uncertainty of the inputs to
the risk model.
All of the experimental leaks were modeled in FLACS as low-momentum “JET” area leaks with
the corresponding release mass flow rate specified directly. The leak profile across the defined
area was a uniform profile in an elliptic shape. The domain was resolved based on the leak rate in
each test. For the simulations with release rates of 12 g/min (0.03 lb/min) and 120 g/min (0.26
lb/min), the grid cell resolution across the leak was between 1 cm (0.4 in) and 2 cm (0.8 in), with
the cell size maintained at 5 cm (2 in) in the area of the sensor and then stretched out to a maximum
cell size of 10 cm (3.9 in) beyond the sensors to the walls. For the largest release rate of 335 g/min
(0.74 lb/min), the base grid cell size was about 2 cm (0.8 in) with similar cell stretching applied.
R-290 concentration monitor points were placed at the same locations as the gas sensors in the
tests. Figure 4.1 shows the FLACS geometry model replicating the test room and display case.
Figure 4.1: FLACS geometry model of the test room and display case. The roof is removed from the test room
so that the interior can be viewed.
Below are the main observations when comparing predicted concentrations to measurements:
1. Predicted transient and peak concentrations were in excellent agreement with
measurements. On occasion, predicted concentration at a particular sensor was high or low
by a few percent, but good overall agreement was typically observed across the majority
of sensors at a particular height.
2. In general, FLACS was able to accurately predict the dispersion process for all leak
conditions considered and prediction accuracy was equally as good for:
a. Low and high release heights
b. Low and high release mass flow rates
c. Small and large released amounts
d. Whether the condenser fan was off or on

48
Provided in Appendix A are comparisons between FLACS predictions and measurements that
support the above observations and demonstrate the agreement between the two for the wide range
of leak conditions considered during testing. Overall, the results confirm that FLACS is suitable
for predicting R-290 dispersion and that using FLACS outputs as inputs in the risk model is a valid
approach.
5 Risk Assessment
The quantitative assessment of risk combines much of the information in the previous sections
(full-scale experiments, CFD simulations) with additional CFD simulations and a risk-based
approach to understand how various aspects of the use of refrigerated cabinets interact to evaluate
flammable hazards.
At its simplest, risk is the combination of likelihood of an event occurring and the consequence of
the event. For the application of interest, the consequence of an ignited event is directly related to
how the refrigerant disperses into a given space, or more specifically, how it mixes with air and
accumulates in the space where it is leaked. This aspect dictates the characteristics of the
accumulated fuel volumes that forms. The focus of the assessment was to examine larger charge
sizes and some possible mitigation effects that could be implemented as part of the design and
installation of refrigeration units.
Conservative assumptions were generally employed in the present study to maximize the
accumulated fuel volumes and ignition consequences. The purpose of using conservative
assumptions is to identify the most effective mitigation effects. That is, a sufficiently effective
mitigation measure for such conditions would also apply when such constraints are relaxed. The
converse is not true—mitigation options that are effective under certain specific and extremely
detailed conditions may not be effective in alternative situations. As such, analysis of mitigation
options using a conservative approach is most useful when trying to make generic
recommendations. This approach also provides a foundation for future work in which actual
conditions are available. As such, the absolute risk determined in the present study likely
represented an upper bound and will likely be reduced when considering details such as the
transient nature of the leak and room ventilation. Therefore, due to the conservative assumptions
and certain uncertainties associated with the leak frequencies, it is more appropriate to evaluate
scenarios from a relative risk point of view as opposed to absolute risk. Absolute risk is still
provided for some cases for informational purposes only, but the results should be used with
caution.
5.1 Method
The general method of the risk assessment (Figure 5.1) is to:
1) Identify the assessment context including: operating modes, failure modes, and variables
to evaluate (including charge sizes, hole sizes, condenser location, etc.)
2) Perform dispersion simulations to establish consequence results

49
3) Establish leak frequencies for various combinations of charges, hole sizes, and operating
mode
4) Establish an ignited event frequency to be associated with each possible incident (or unique
combination of variables and hazard) that results in a consequence
5) Calculate the risk by combing the incident frequencies with the associated consequences
Figure 5.1: General Method of a Risk Assessment
The literature review, FMEA (see Appendix B), experiments, and CFD performed before the risk
assessment work itself provided the context for determining the variables and inputs into the risk
assessment itself.
5.2 Scenarios / Geometries
In order to ensure that the risk assessment has a wide applicability to many situations, the risk
assessment was performed for six different scenarios that represented a variety of real-world
situations relevant to the use of refrigerated display cases. The scenarios were selected to represent
a cross-section in purpose, room size, aspect ratio (the ratio of the length to the width of the room
floor area), and congestion characteristics.
The six scenarios are shown in Table 5.1. The maximum charge size range in the table is based on
EN-378, which allows 20% LFL times the room volume, up to 1.5 kg (3.3 lb).

50
Table 5.1: Risk Assessment Scenarios / Geometries
No. Description Area m2
(ft2)
Volume m3 (ft3) Aspect
Ratio
EN-378 Maximum
Charge Size (g)
1 Small Convenience Store 11 (402) 30 (1059) 1.19:1 227
2 Small Kitchen 13 (441) 31 (1095) 0.50:1 238
3 Deli 28 (1000) 71 (2507) 3.75:1 538
4 Market 33 (1159) 90 (3178) 1.37:1 686
5 Medium Kitchen 56 (1978) 196 (6922) 0.88:1 1490
6 Big Box Grocery 256 (9041)* 1023 (36,127)* 1.00:1 1500 *
The Big Box Grocery area and volume are for the relevant region of the store where refrigerated display cases are
located and do not include the entire store.
The representations of refrigerated display cases in the scenarios are based on manufacturer
information and details of the test unit provided for the full-scale testing (see Section3.2).
The first scenario is a small convenience store. Figure 5.2 shows images of the geometry for the
small convenience store and relevant refrigerated cabinet from which releases were evaluated. The
small convenience store is not quite square with an aspect ratio of 1.19:1 but is relatively square
when compared to some of the other scenarios. A noteworthy feature of the small convenience
store is that there is a counter that divides the room. It is also noteworthy that it is expected that
there would be sparse ignition sources inside the convenience store. Figure 5.3 and Figure 5.4
show an additional view of the geometry and a view of the bottom of the refrigerated display case.
Figure 5.2: Risk Assessment Scenario #1 – Small Convenience Store
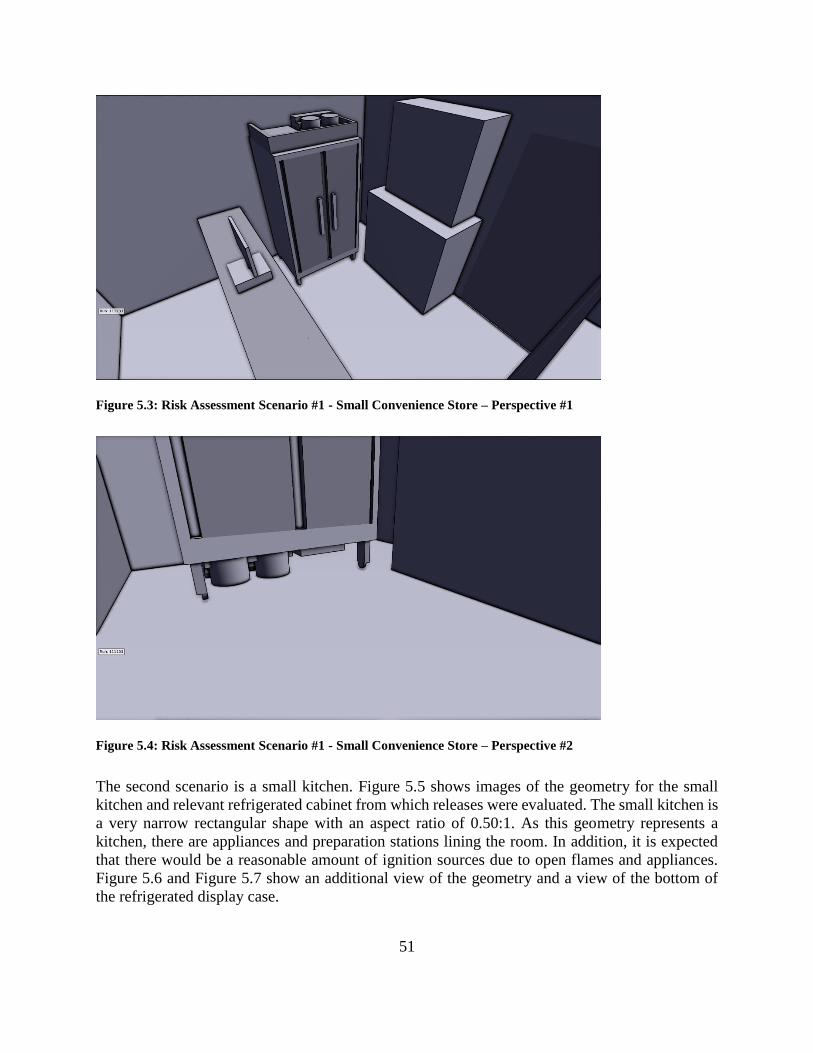
51
Figure 5.3: Risk Assessment Scenario #1 - Small Convenience Store – Perspective #1
Figure 5.4: Risk Assessment Scenario #1 - Small Convenience Store – Perspective #2
The second scenario is a small kitchen. Figure 5.5 shows images of the geometry for the small
kitchen and relevant refrigerated cabinet from which releases were evaluated. The small kitchen is
a very narrow rectangular shape with an aspect ratio of 0.50:1. As this geometry represents a
kitchen, there are appliances and preparation stations lining the room. In addition, it is expected
that there would be a reasonable amount of ignition sources due to open flames and appliances.
Figure 5.6 and Figure 5.7 show an additional view of the geometry and a view of the bottom of
the refrigerated display case.
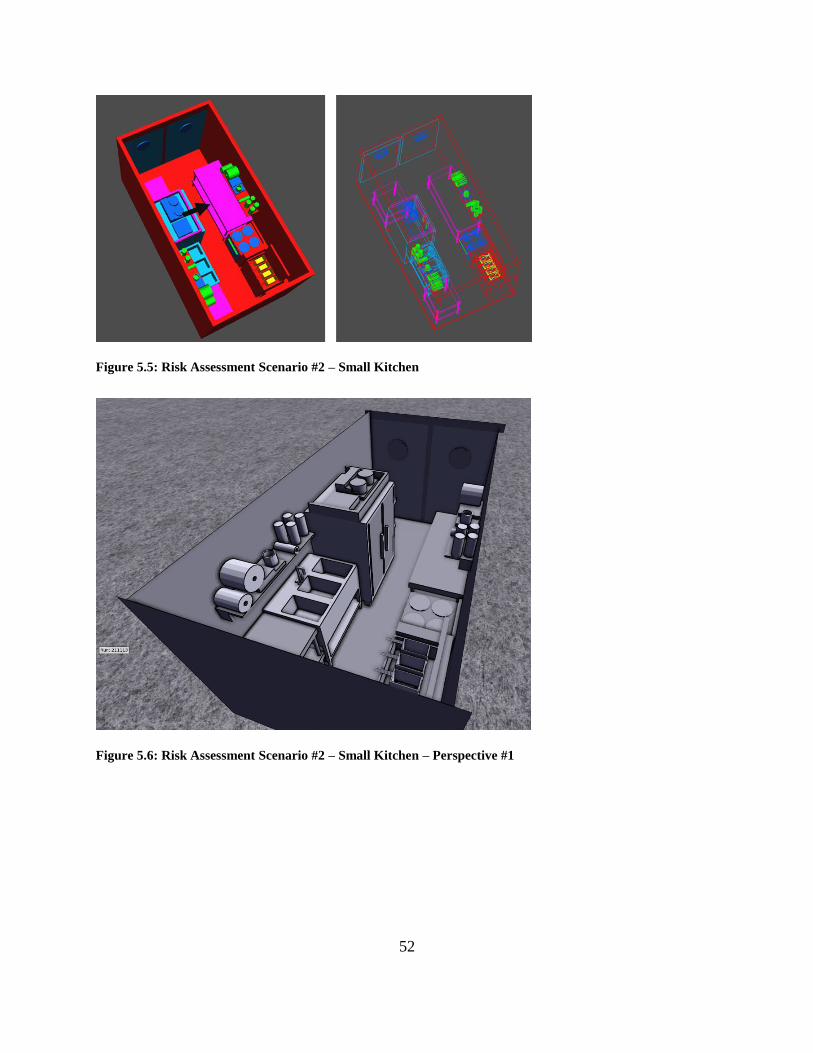
52
Figure 5.5: Risk Assessment Scenario #2 – Small Kitchen
Figure 5.6: Risk Assessment Scenario #2 – Small Kitchen – Perspective #1
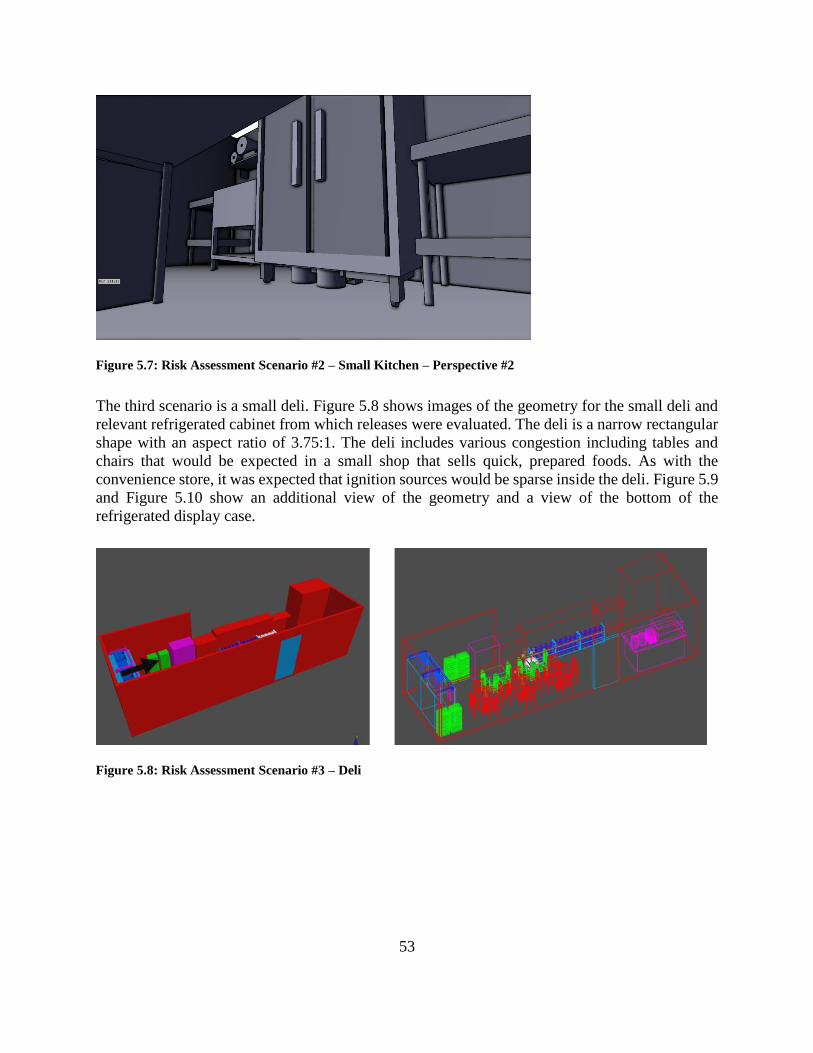
53
Figure 5.7: Risk Assessment Scenario #2 – Small Kitchen – Perspective #2
The third scenario is a small deli. Figure 5.8 shows images of the geometry for the small deli and
relevant refrigerated cabinet from which releases were evaluated. The deli is a narrow rectangular
shape with an aspect ratio of 3.75:1. The deli includes various congestion including tables and
chairs that would be expected in a small shop that sells quick, prepared foods. As with the
convenience store, it was expected that ignition sources would be sparse inside the deli. Figure 5.9
and Figure 5.10 show an additional view of the geometry and a view of the bottom of the
refrigerated display case.
Figure 5.8: Risk Assessment Scenario #3 – Deli
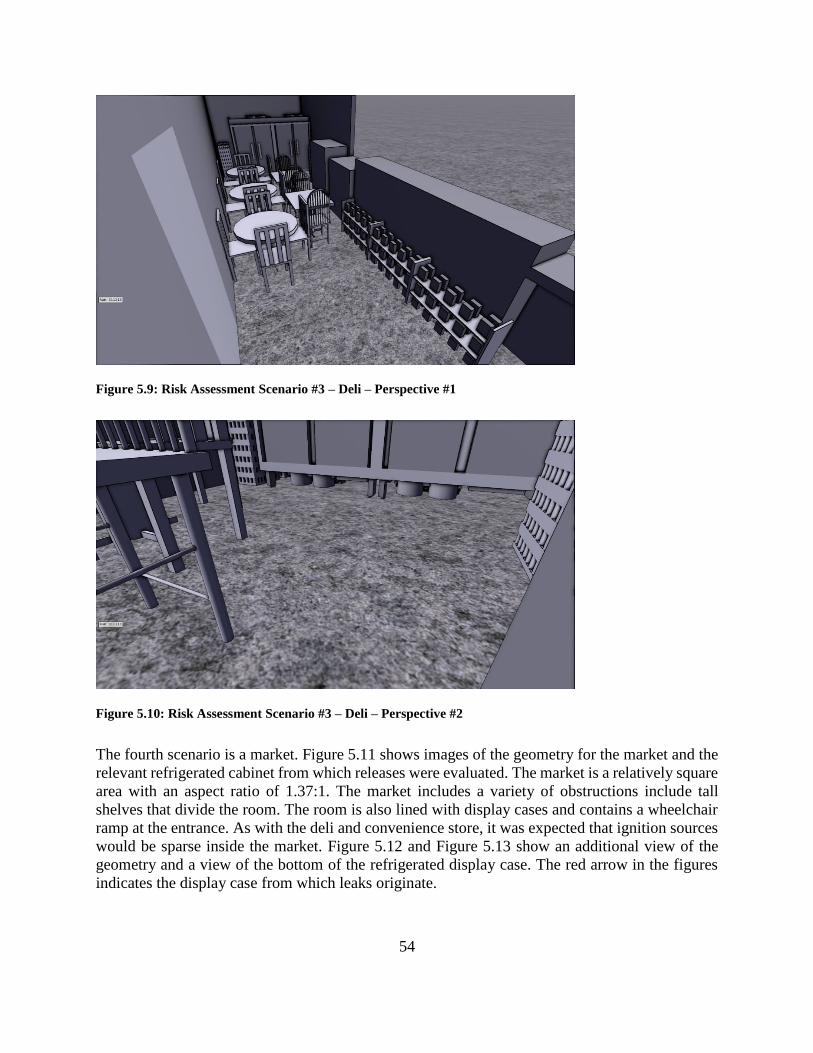
54
Figure 5.9: Risk Assessment Scenario #3 – Deli – Perspective #1
Figure 5.10: Risk Assessment Scenario #3 – Deli – Perspective #2
The fourth scenario is a market. Figure 5.11 shows images of the geometry for the market and the
relevant refrigerated cabinet from which releases were evaluated. The market is a relatively square
area with an aspect ratio of 1.37:1. The market includes a variety of obstructions include tall
shelves that divide the room. The room is also lined with display cases and contains a wheelchair
ramp at the entrance. As with the deli and convenience store, it was expected that ignition sources
would be sparse inside the market. Figure 5.12 and Figure 5.13 show an additional view of the
geometry and a view of the bottom of the refrigerated display case. The red arrow in the figures
indicates the display case from which leaks originate.
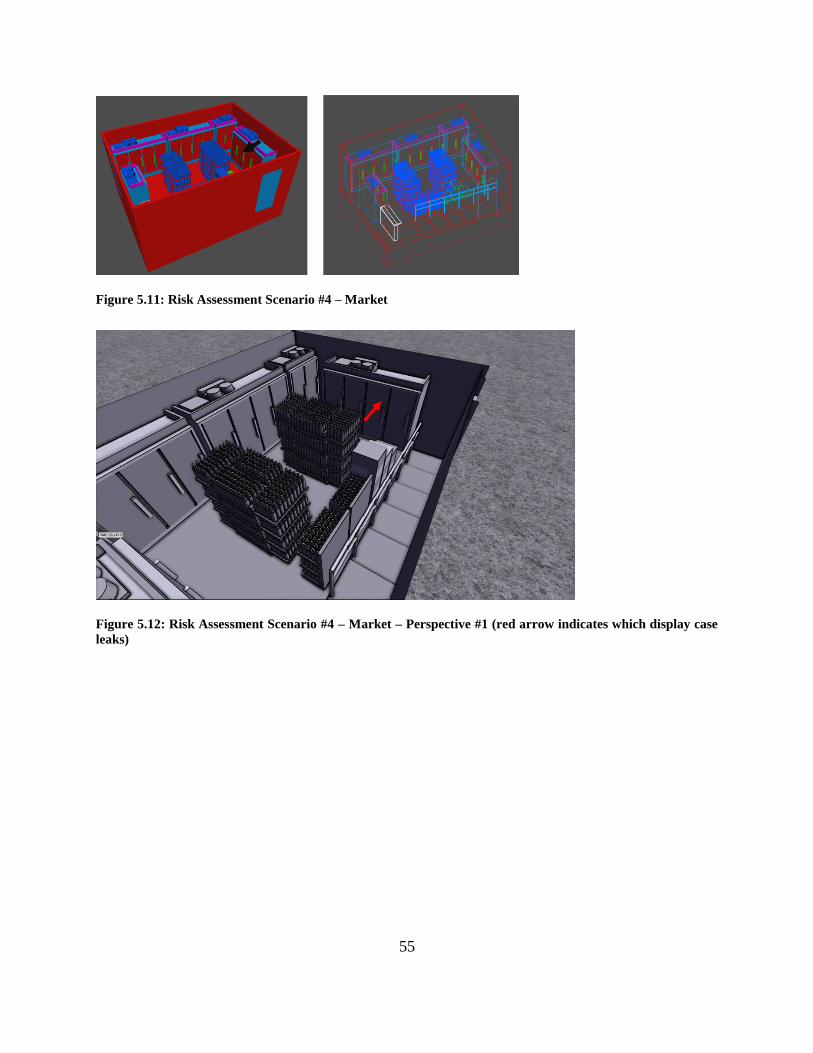
55
Figure 5.11: Risk Assessment Scenario #4 – Market
Figure 5.12: Risk Assessment Scenario #4 – Market – Perspective #1 (red arrow indicates which display case
leaks)
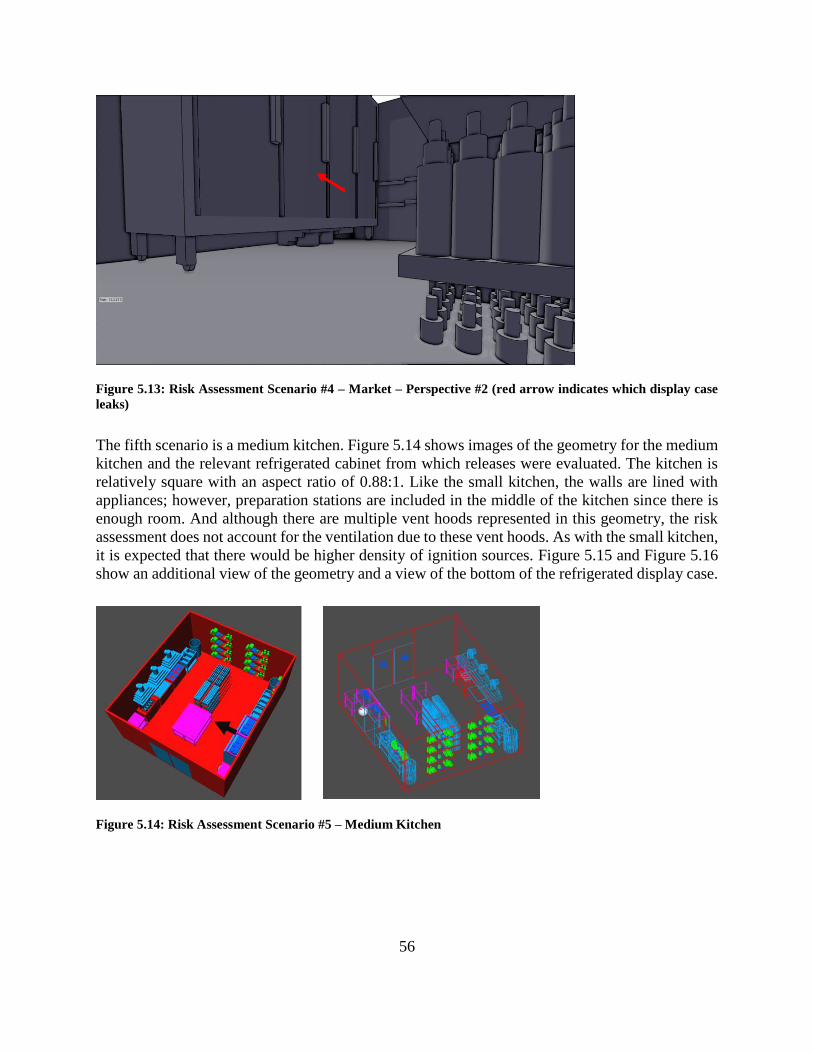
56
Figure 5.13: Risk Assessment Scenario #4 – Market – Perspective #2 (red arrow indicates which display case
leaks)
The fifth scenario is a medium kitchen. Figure 5.14 shows images of the geometry for the medium
kitchen and the relevant refrigerated cabinet from which releases were evaluated. The kitchen is
relatively square with an aspect ratio of 0.88:1. Like the small kitchen, the walls are lined with
appliances; however, preparation stations are included in the middle of the kitchen since there is
enough room. And although there are multiple vent hoods represented in this geometry, the risk
assessment does not account for the ventilation due to these vent hoods. As with the small kitchen,
it is expected that there would be higher density of ignition sources. Figure 5.15 and Figure 5.16
show an additional view of the geometry and a view of the bottom of the refrigerated display case.
Figure 5.14: Risk Assessment Scenario #5 – Medium Kitchen
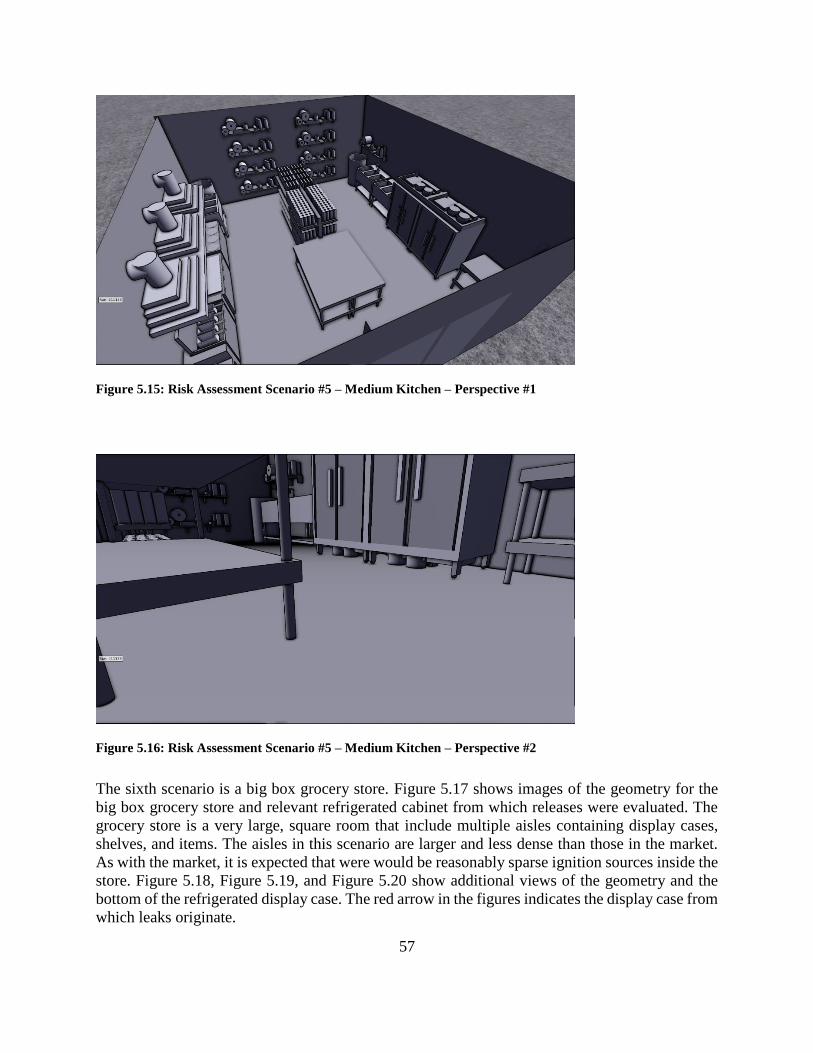
57
Figure 5.15: Risk Assessment Scenario #5 – Medium Kitchen – Perspective #1
Figure 5.16: Risk Assessment Scenario #5 – Medium Kitchen – Perspective #2
The sixth scenario is a big box grocery store. Figure 5.17 shows images of the geometry for the
big box grocery store and relevant refrigerated cabinet from which releases were evaluated. The
grocery store is a very large, square room that include multiple aisles containing display cases,
shelves, and items. The aisles in this scenario are larger and less dense than those in the market.
As with the market, it is expected that were would be reasonably sparse ignition sources inside the
store. Figure 5.18, Figure 5.19, and Figure 5.20 show additional views of the geometry and the
bottom of the refrigerated display case. The red arrow in the figures indicates the display case from
which leaks originate.
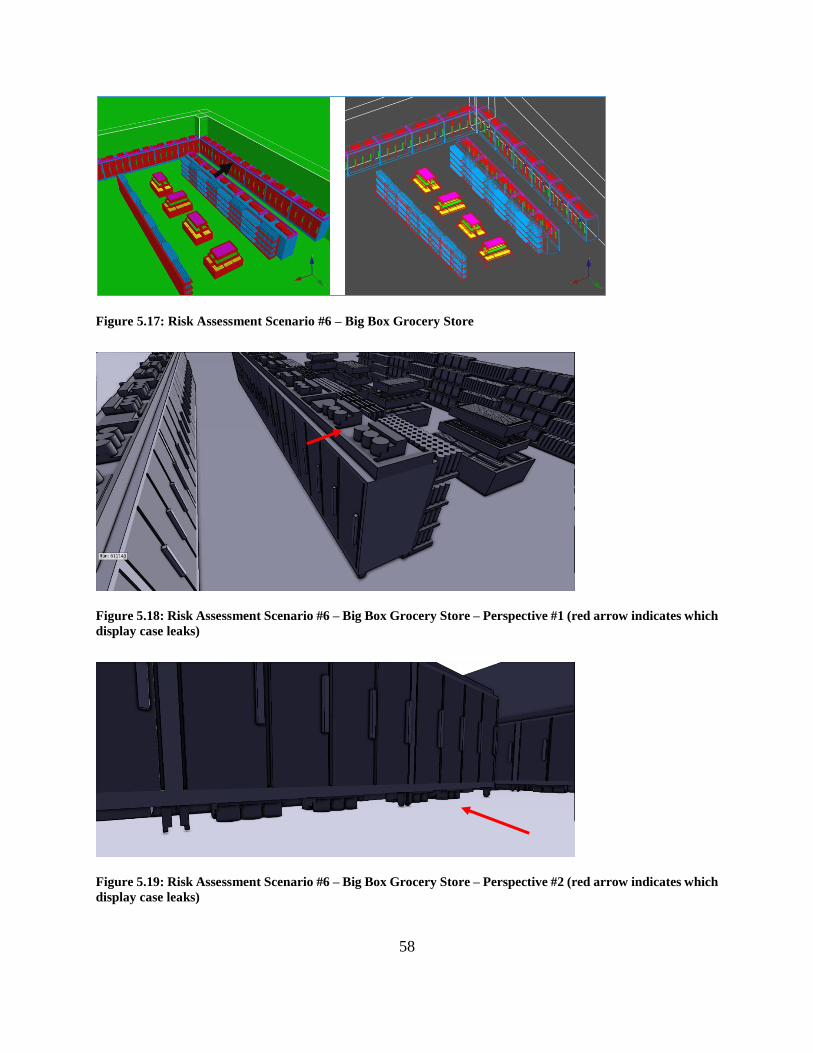
58
Figure 5.17: Risk Assessment Scenario #6 – Big Box Grocery Store
Figure 5.18: Risk Assessment Scenario #6 – Big Box Grocery Store – Perspective #1 (red arrow indicates which
display case leaks)
Figure 5.19: Risk Assessment Scenario #6 – Big Box Grocery Store – Perspective #2 (red arrow indicates which
display case leaks)
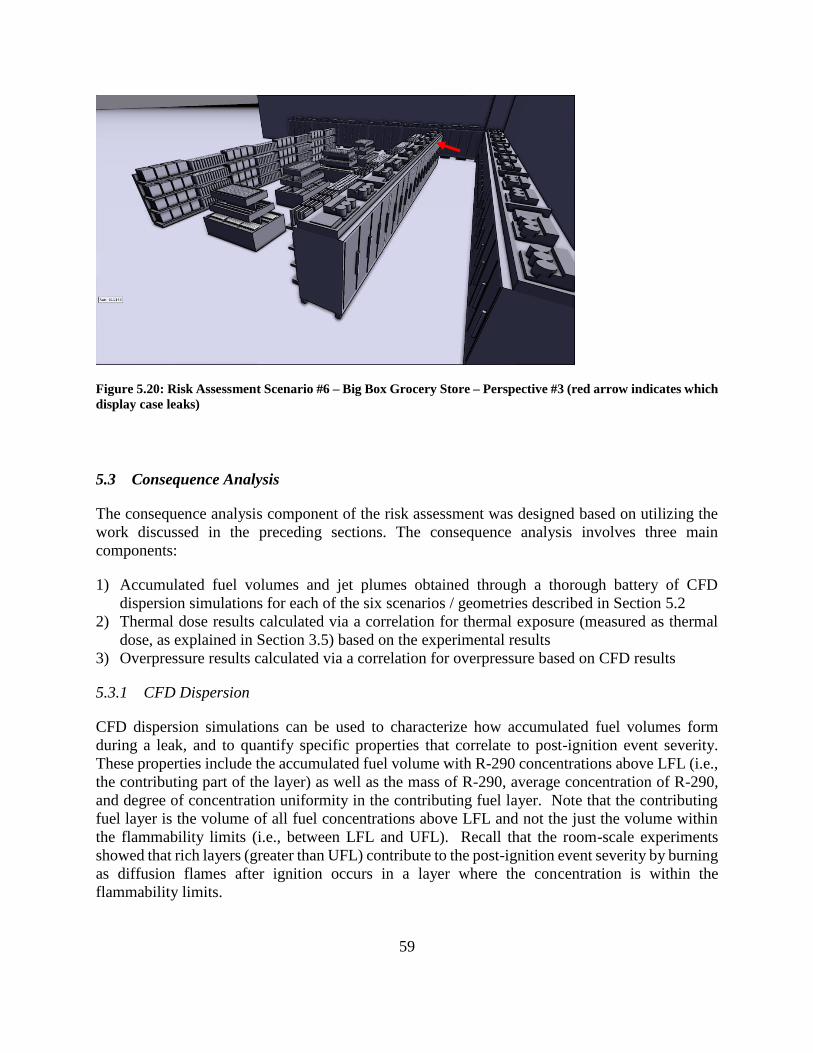
59
Figure 5.20: Risk Assessment Scenario #6 – Big Box Grocery Store – Perspective #3 (red arrow indicates which
display case leaks)
5.3 Consequence Analysis
The consequence analysis component of the risk assessment was designed based on utilizing the
work discussed in the preceding sections. The consequence analysis involves three main
components:
1) Accumulated fuel volumes and jet plumes obtained through a thorough battery of CFD
dispersion simulations for each of the six scenarios / geometries described in Section 5.2
2) Thermal dose results calculated via a correlation for thermal exposure (measured as thermal
dose, as explained in Section 3.5) based on the experimental results
3) Overpressure results calculated via a correlation for overpressure based on CFD results
5.3.1 CFD Dispersion
CFD dispersion simulations can be used to characterize how accumulated fuel volumes form
during a leak, and to quantify specific properties that correlate to post-ignition event severity.
These properties include the accumulated fuel volume with R-290 concentrations above LFL (i.e.,
the contributing part of the layer) as well as the mass of R-290, average concentration of R-290,
and degree of concentration uniformity in the contributing fuel layer. Note that the contributing
fuel layer is the volume of all fuel concentrations above LFL and not the just the volume within
the flammability limits (i.e., between LFL and UFL). Recall that the room-scale experiments
showed that rich layers (greater than UFL) contribute to the post-ignition event severity by burning
as diffusion flames after ignition occurs in a layer where the concentration is within the
flammability limits.

60
A series of more than 600 CFD simulations were run to establish the following variables for the
risk assessment:
1) The size of the accumulated fuel volume (as defined in Section 2.2)
2) The average concentration of R-290 in the accumulated fuel volume
There were essentially three groups of dispersion simulations that were used as input to the risk
assessment:
1) Representative jet leaks (as discussed in Section 2.4)
2) Impinged / diffuse leaks
3) In-cabinet releases
The representative jet leaks were not considered to result in accumulated fuel volumes provided
the charge size was appropriately selected for the room—as discussed in Section 2.4—and
therefore do not accumulate in regions remote to the leak source.
Table 5.2 describes the various parameters for the diffuse leaks. Diffuse leaks represent the most
common leak scenarios and therefore cover a wide range of data. Diffuse leaks were simulated for
all geometries, top and bottom-mounted condenser refrigeration units, five leak rates, and five
charge sizes. The simulations that included fans used a fan flow rate of 1 m3 / hour for every 1 g
of charge, and it was assumed that the fans remained either on or off for the duration of the leak.
As these leaks were represented as diffuse leaks, they represented conservative, worst-case leaks
that did not include any effect of mixing due to the momentum of the leak itself.
Table 5.2: Risk CFD Dispersion Simulation Matrix – Diffuse Leaks
Parameter Count Variations
Geometry 6 Six geometries as described in Section 5.2
Condenser Location 2 Top, Bottom
Leak Rate 5 10, 60, 120, 250, 500 g/min (0.02, 0.13, 0.26, 0.55, 1.1 lb/min)
Charge Size 5 150, 300, 450, 600, 1000 g (0.33, 0.66, 0.99, 1.32, 2.2 lb)
Fan Status 2 On, Off
The general trends of the dispersion results are aligned with the findings discussed in the previous
sections.
Figure 5.21 shows an example that there is generally better mixing for leaks from the top of a unit,
even without fans, when compared to leaks from the bottom. The figure shows a comparison
between a top and bottom leak of a 600 g (1.32 lb) charge in geometry No. 4 at 120 g/min (0.26
lb/min) without fans. For the top leak (top half of figure), the leak is able to spread reasonably far
with a concentration near LFL. However, the bottom leak (bottom half of figure) covers a similar
footprint but with a higher concentration at the floor level since there is less mixing due to the leak
height.

61
Figure 5.21: Risk Simulations - 120 g/min (0.26 lb/min) leak of 600 g (1.32 lb) in Geometry No. 4 from top (top
half of figure) compared with bottom (bottom half of figure)
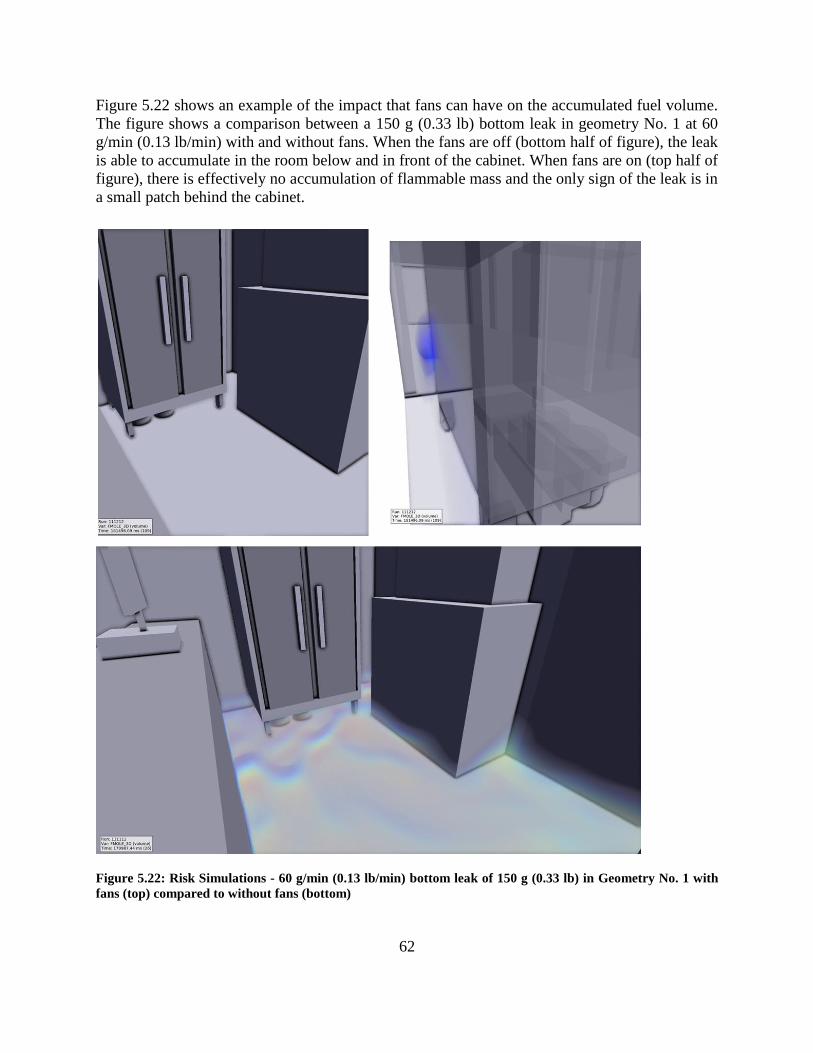
62
Figure 5.22 shows an example of the impact that fans can have on the accumulated fuel volume.
The figure shows a comparison between a 150 g (0.33 lb) bottom leak in geometry No. 1 at 60
g/min (0.13 lb/min) with and without fans. When the fans are off (bottom half of figure), the leak
is able to accumulate in the room below and in front of the cabinet. When fans are on (top half of
figure), there is effectively no accumulation of flammable mass and the only sign of the leak is in
a small patch behind the cabinet.
Figure 5.22: Risk Simulations - 60 g/min (0.13 lb/min) bottom leak of 150 g (0.33 lb) in Geometry No. 1 with
fans (top) compared to without fans (bottom)

63
In-cabinet releases were represented by a series of varying cabinet volumes that varied with charge
size. Table 5.3 describes the parameters for the in-cabinet leaks. In-cabinet leaks were taken to be
either impinged (diffuse) or a jet. Diffuse leaks were simulated at 10 g/min (0.02 lb/min) inside
the cabinet because the layering inside of a closed cabinet were generally insensitive to leak rates
(when the whole charge was leaked) and lower leak rates would be more likely. Jet leaks were
represented as a homogeneous mixture containing the entire charge contained inside the cabinet
before the door was opened. The results for in-cabinet releases were established by simulating the
dispersion that occurred after opening the door of a filled cabinet and taking the results at the time
with the maximum accumulated fuel volume size.
Table 5.3: Risk CFD Dispersion Simulation Matrix – In-cabinet Leaks
Parameter Count Variations
Geometry 5 / 10 Five geometries to represent different size display cases per charge
size (with variations of both the door open and closed)
Leak Rate 2 10 g/min (diffuse), jet
Charge Size 5 150, 300, 450, 600, 1000 g (0.33, 0.66, 0.99, 1.32, 2.2 lb)
The internal dimensions of the cabinets for in-cabinet leaks were scaled based on the charge and
shown in Table 5.4. These dimensions and internal volumes were based on manufacturer
specifications provided by the panel that related charge size with dimensions of a product line of
real cabinets.
Table 5.4: Risk CFD Dispersion Simulations – In-cabinet Leaks – Representative Cabinet Dimensions
Charge Size Internal Volume m3 (ft3) Dimensions m (ft)
150g 0.54 (19.1) 0.85m x 0.85m x 0.75m (2.8' x 2.8' x 2.5')
300g 0.80 (28.1) 0.85m x 0.85m x 1.10m (2.8' x 2.8' x 3.6')
450g 1.12 (39.5) 0.85m x 0.85m x 1.55m (2.8' x 2.8' x 5.1')
600g 1.51 (53.5) 1.15m x 0.85m x 1.55m (3.8' x 2.8' x 5.1')
1000g 4.59 (165.2) 3.55m x 0.85m x 1.55m (11.6' x 2.8' x 5.1')
Table 5.5 summarizes the simulation results for volume above LFL in the domain (i.e., the
accumulated fuel volume) and the average R-290 concentration calculated in the accumulated fuel
volume for in-cabinet leak simulations after the door is opened.
Table 5.5: Risk CFD Dispersion Simulations – In-cabinet Leaks – Results Summary
Charge Size Diffuse Leaks Jet Leaks
Volume > LFL (m3) Avg. Conc. Volume > LFL (m3) Avg. Conc.
150g 1.12 6.9% 1.20 6.4%
300g 1.78 8.4% 1.97 8.0%
450g 2.42 9.3% 2.70 8.7%
600g 3.14 9.6% 3.10 10.3%
1000g 4.84 11.3% 9.26 5.3%

64
Figure 5.23 shows the varying display case sizes for the in-cabinet releases as well as the maximum
accumulated fuel volumes for the diffuse releases after the doors are opened. The scale is from
blue representing LFL through red representing UFL or greater.
Figure 5.23: In-cabinet Release Geometries with Largest Clouds (Diffuse Leaks)
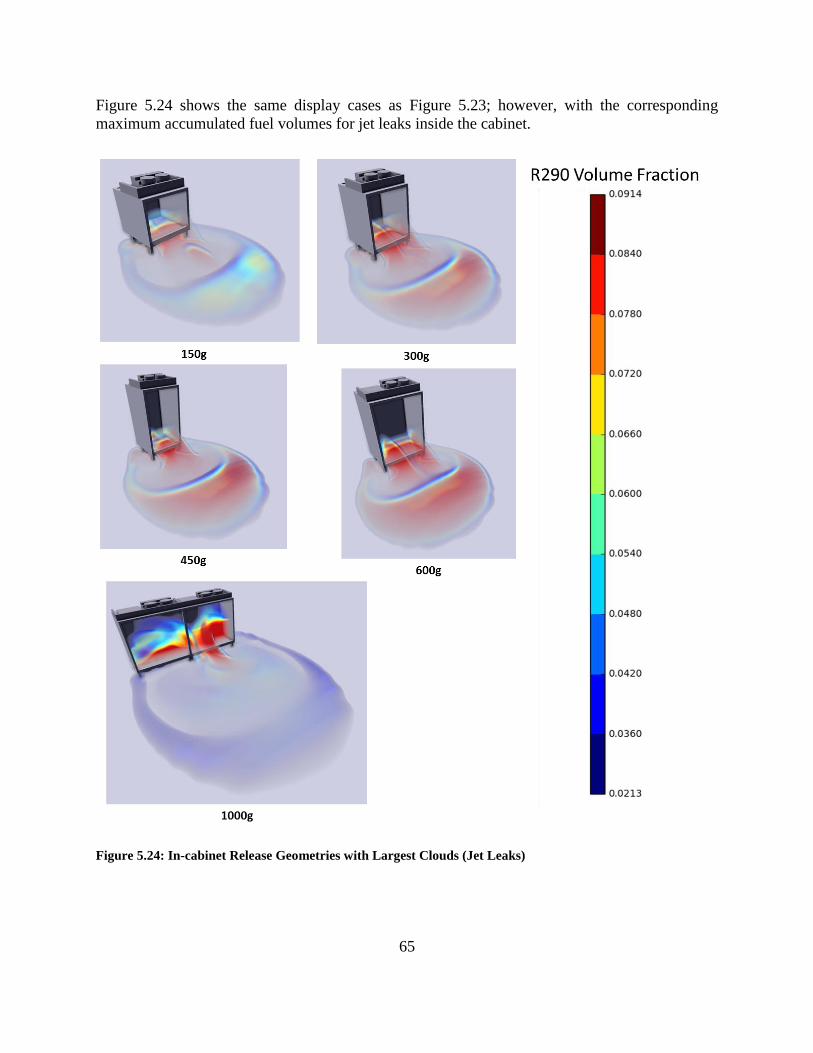
65
Figure 5.24 shows the same display cases as Figure 5.23; however, with the corresponding
maximum accumulated fuel volumes for jet leaks inside the cabinet.
Figure 5.24: In-cabinet Release Geometries with Largest Clouds (Jet Leaks)
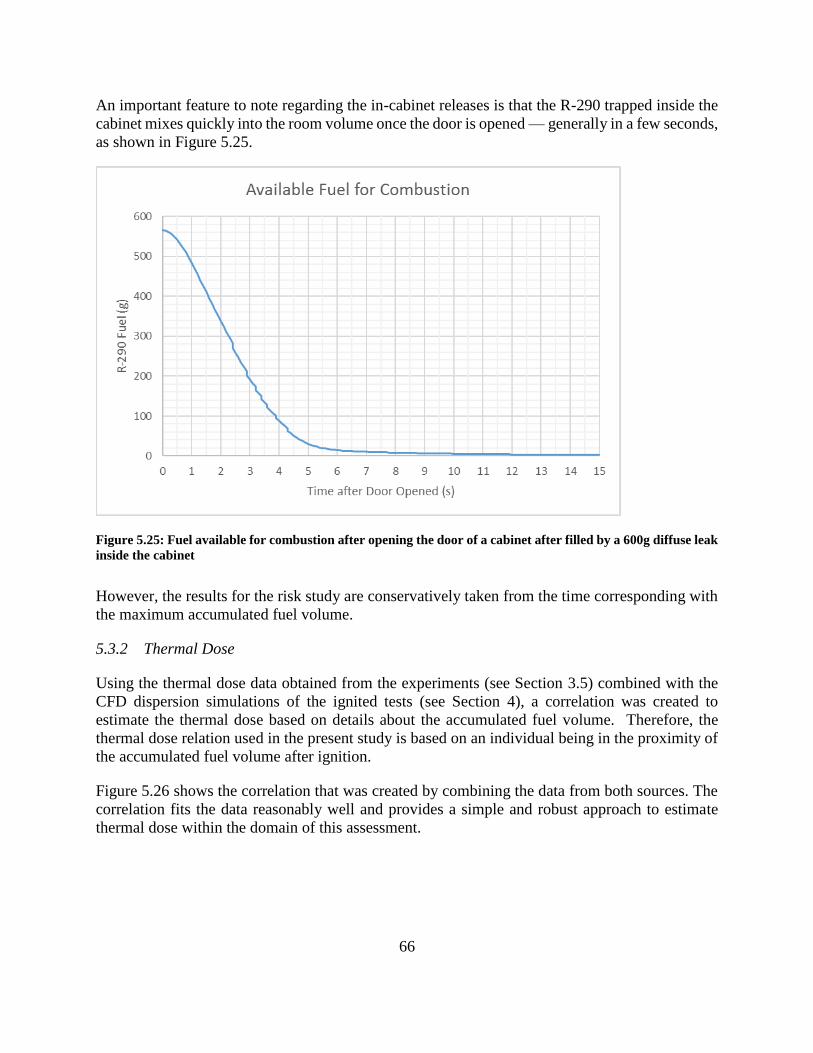
66
An important feature to note regarding the in-cabinet releases is that the R-290 trapped inside the
cabinet mixes quickly into the room volume once the door is opened — generally in a few seconds,
as shown in Figure 5.25.
Figure 5.25: Fuel available for combustion after opening the door of a cabinet after filled by a 600g diffuse leak
inside the cabinet
However, the results for the risk study are conservatively taken from the time corresponding with
the maximum accumulated fuel volume.
5.3.2 Thermal Dose
Using the thermal dose data obtained from the experiments (see Section 3.5) combined with the
CFD dispersion simulations of the ignited tests (see Section 4), a correlation was created to
estimate the thermal dose based on details about the accumulated fuel volume. Therefore, the
thermal dose relation used in the present study is based on an individual being in the proximity of
the accumulated fuel volume after ignition.
Figure 5.26 shows the correlation that was created by combining the data from both sources. The
correlation fits the data reasonably well and provides a simple and robust approach to estimate
thermal dose within the domain of this assessment.

67
Figure 5.26: Correlation between peak thermal dose measured in the experiments and contributing volume
(the product of accumulated fuel volume and the average concentration) at the time of ignition determined
from FLACS dispersion simulations of the experiments.
5.3.3 Overpressure
The following approach was used to establish a relationship between overpressure and the results
of the dispersion simulations:
1. Perform several hundred explosion simulations with defined accumulated fuel volumes
varying:
a. Heights
b. Concentration gradients
c. Amount of R-290 mass
d. Different geometries, all without venting paths and with non-yielding walls
e. Ignition locations
2. Extracted peak pressure rise from each simulation
3. For each scenario, only considered the maximum pressure rise from all ignition locations
4. Extracted volume above LFL (i.e., accumulated fuel volume), and average concentration
within the volume above LFL
5. Determined the ratio of accumulated fuel volume to room volume
6. Determined the expansion factor as a function of R-290 concentration from constant pressure
equilibrium calculations
7. Based on the idea that accumulated fuel volumes are uniform at the average concentration,
apply the expansion factor to the ratio of accumulated fuel volume to room volume
y = 850.43x2 + 1890.7xR² = 0.9523
0
200
400
600
800
1000
1200
1400
0.0 0.1 0.2 0.3 0.4 0.5 0.6
Pea
k Th
erm
al D
ose
(td
u)
Accumulated Fuel Volume * Average Concentration

68
8. This approach resulted in two distinct correlations because high gradient clouds with fuel-rich
layers above the UFL at the floor are not well represented by uniform layers at the average
concentration
9. FLACS simulates the pool fire nature of the rich layers and therefore for a given value on the
x-axis, the pressures are lower for the fuel-rich layers above the UFL compared to the
flammable layers.
Figure 5.27: Correlations for pressure rise based on the accumulated fuel volume, room volume, and average
concentration of R-290 in the accumulated fuel volume.
5.4 Frequency Analysis
5.4.1 Leak Frequencies
The base data and approach for the leak frequencies were derived from industry sources [17, 18].
Accounting for the connections based on the descriptions in both sources, the leak frequency for
small, medium, and catastrophic leaks per cabinet-year were calculated to be 5.70E-04, 3.45E-05,
and 4.32E-06 respectively. However, the base data source accounted for compressor always on,
so the base leak frequencies had to be adjusted to account for the compressor on/off time.
Leak frequencies were calculated assuming that the compressor was on 60% of the time and that
the likelihood of leaks due to medium and large hole sizes were reduced while the compressor was
idle. Based on the FMEA, there is a reduction in the possible failure modes that result in leaks
while the compressor is idle. When the compressor is idle, the dominating failure modes are fatigue
and stress/corrosion/cracking which are skewed towards smaller hole sizes. As such, the likelihood
of small leaks remained the same regardless of the compressor status, but the likelihood of large
leaks was reduced by 50% while the compressor is idle. Taking this into account, the adjusted leak
y = 84.977x2 + 36.806xR² = 0.9791
y = 76.549x2 + 12.968xR² = 0.9853
0
5
10
15
20
25
30
0.0 0.1 0.2 0.3 0.4
Pm
ax
(psi
g)
Flammable layers
Layers predominantlyabove UFL
(Volume above LFL / Room Volume) * Expansion Factor Adjustment
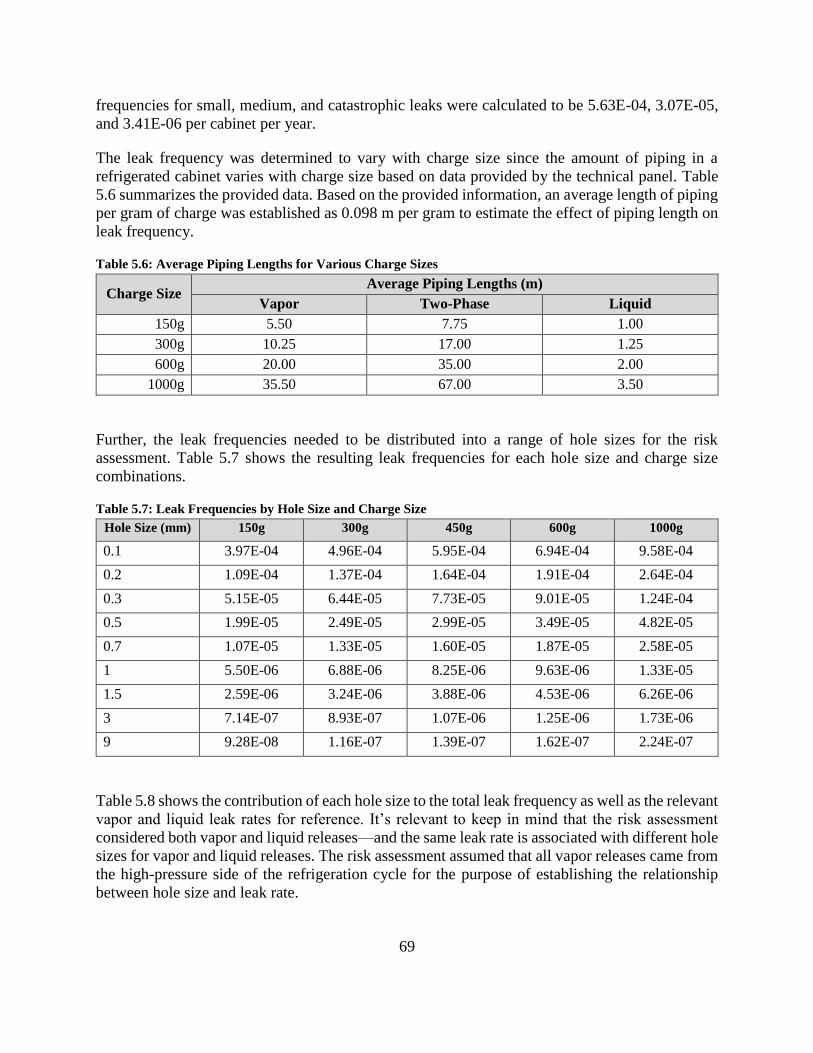
69
frequencies for small, medium, and catastrophic leaks were calculated to be 5.63E-04, 3.07E-05,
and 3.41E-06 per cabinet per year.
The leak frequency was determined to vary with charge size since the amount of piping in a
refrigerated cabinet varies with charge size based on data provided by the technical panel. Table
5.6 summarizes the provided data. Based on the provided information, an average length of piping
per gram of charge was established as 0.098 m per gram to estimate the effect of piping length on
leak frequency.
Table 5.6: Average Piping Lengths for Various Charge Sizes
Charge Size Average Piping Lengths (m)
Vapor Two-Phase Liquid
150g 5.50 7.75 1.00
300g 10.25 17.00 1.25
600g 20.00 35.00 2.00
1000g 35.50 67.00 3.50
Further, the leak frequencies needed to be distributed into a range of hole sizes for the risk
assessment. Table 5.7 shows the resulting leak frequencies for each hole size and charge size
combinations.
Table 5.7: Leak Frequencies by Hole Size and Charge Size
Hole Size (mm) 150g 300g 450g 600g 1000g
0.1 3.97E-04 4.96E-04 5.95E-04 6.94E-04 9.58E-04
0.2 1.09E-04 1.37E-04 1.64E-04 1.91E-04 2.64E-04
0.3 5.15E-05 6.44E-05 7.73E-05 9.01E-05 1.24E-04
0.5 1.99E-05 2.49E-05 2.99E-05 3.49E-05 4.82E-05
0.7 1.07E-05 1.33E-05 1.60E-05 1.87E-05 2.58E-05
1 5.50E-06 6.88E-06 8.25E-06 9.63E-06 1.33E-05
1.5 2.59E-06 3.24E-06 3.88E-06 4.53E-06 6.26E-06
3 7.14E-07 8.93E-07 1.07E-06 1.25E-06 1.73E-06
9 9.28E-08 1.16E-07 1.39E-07 1.62E-07 2.24E-07
Table 5.8 shows the contribution of each hole size to the total leak frequency as well as the relevant
vapor and liquid leak rates for reference. It’s relevant to keep in mind that the risk assessment
considered both vapor and liquid releases—and the same leak rate is associated with different hole
sizes for vapor and liquid releases. The risk assessment assumed that all vapor releases came from
the high-pressure side of the refrigeration cycle for the purpose of establishing the relationship
between hole size and leak rate.
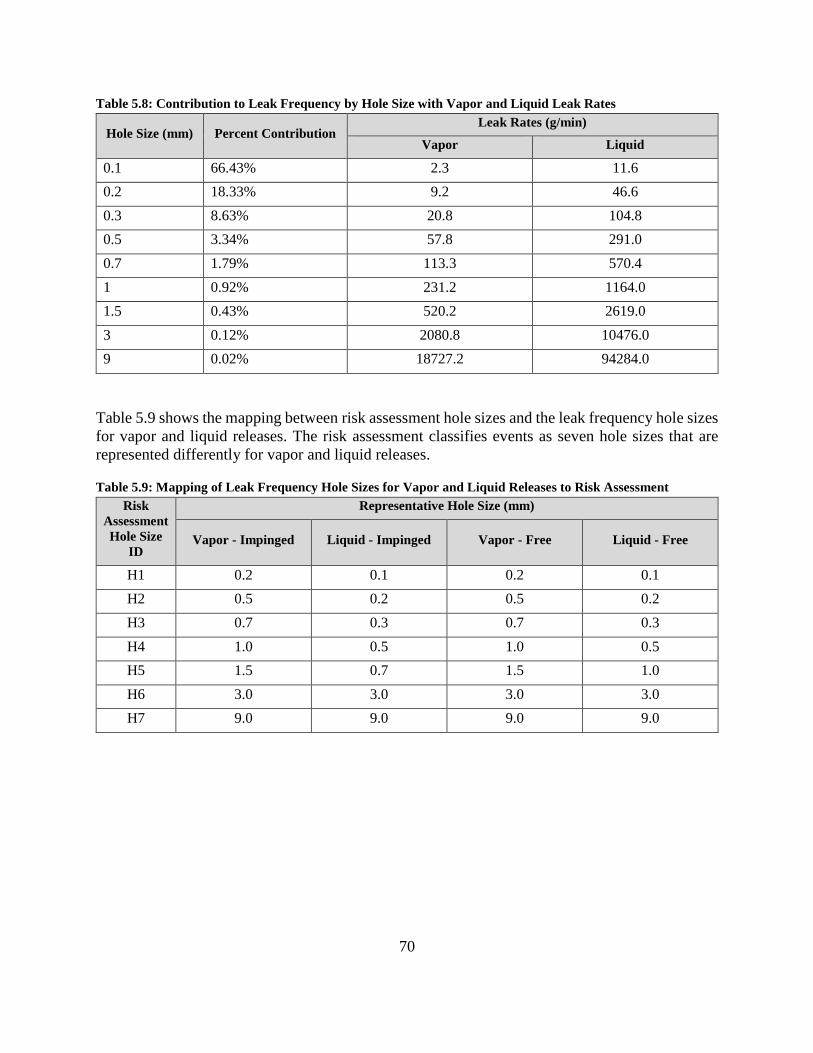
70
Table 5.8: Contribution to Leak Frequency by Hole Size with Vapor and Liquid Leak Rates
Hole Size (mm) Percent Contribution Leak Rates (g/min)
Vapor Liquid
0.1 66.43% 2.3 11.6
0.2 18.33% 9.2 46.6
0.3 8.63% 20.8 104.8
0.5 3.34% 57.8 291.0
0.7 1.79% 113.3 570.4
1 0.92% 231.2 1164.0
1.5 0.43% 520.2 2619.0
3 0.12% 2080.8 10476.0
9 0.02% 18727.2 94284.0
Table 5.9 shows the mapping between risk assessment hole sizes and the leak frequency hole sizes
for vapor and liquid releases. The risk assessment classifies events as seven hole sizes that are
represented differently for vapor and liquid releases.
Table 5.9: Mapping of Leak Frequency Hole Sizes for Vapor and Liquid Releases to Risk Assessment
Risk
Assessment
Hole Size
ID
Representative Hole Size (mm)
Vapor - Impinged Liquid - Impinged Vapor - Free Liquid - Free
H1 0.2 0.1 0.2 0.1
H2 0.5 0.2 0.5 0.2
H3 0.7 0.3 0.7 0.3
H4 1.0 0.5 1.0 0.5
H5 1.5 0.7 1.5 1.0
H6 3.0 3.0 3.0 3.0
H7 9.0 9.0 9.0 9.0
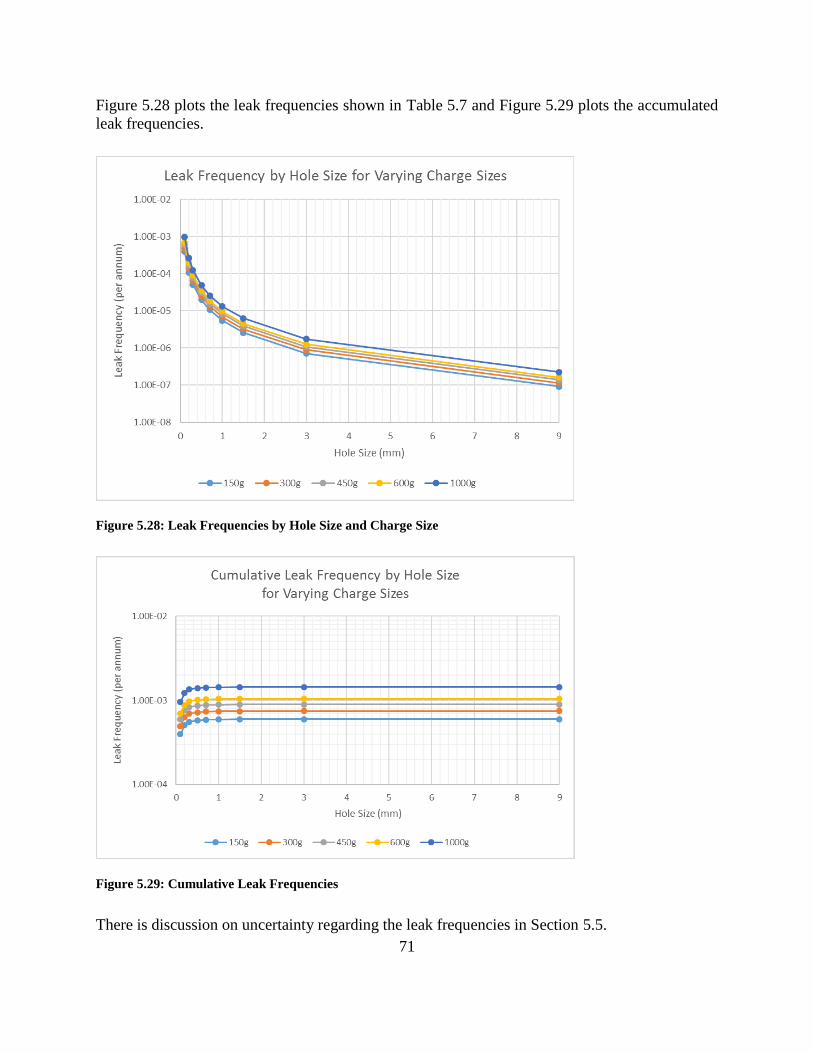
71
Figure 5.28 plots the leak frequencies shown in Table 5.7 and Figure 5.29 plots the accumulated
leak frequencies.
Figure 5.28: Leak Frequencies by Hole Size and Charge Size
Figure 5.29: Cumulative Leak Frequencies
There is discussion on uncertainty regarding the leak frequencies in Section 5.5.

72
5.4.2 Event Trees
The risk assessment is based on calculating the frequency of many particular events and combing
the results of these events to develop insight. In this case, these events are essentially unique
combinations of variables.
Figure 5.30 shows a sample event tree for dispersion scenarios in the risk model. The event tree
provides a visual illustration of how various variables interact in the model as part of calculating
the frequency of various possible events. The variables included in the dispersion event tree are:
• Operating mode (normal operation or in-service)
• Leak frequency from Table 5.7 (which is a function of charge size and hole size and
determined based on historical data)
• Whether the leak ends up inside or outside the cabinet
• Whether the leak is impinged or free
• Whether the leak is located at the condensing unit
• Whether the fans are on at the time of the leak
Expanding on the combinations of those variables yields the branches of the event tree for
dispersion scenarios account for the following scenarios:
1) Impinged leak to the outside of the cabinet from condensing unit while fan(s) are on during
normal operation of the cabinet
2) Impinged leak to the outside of the cabinet from condensing unit while fan(s) are off during
normal operation of the cabinet
3) Impinged leak to the outside of the cabinet that does not come from the condensing unit
during normal operation of the cabinet
4) Free jet leak to the outside of the cabinet during normal operation of the cabinet
5) Impinged leak to the inside of the cabinet during normal operation of the cabinet
6) Free jet leak to the inside of the cabinet during normal operation of the cabinet
7) Null branch that covers when a leak does not occur during normal operations
8) Impinged leak to the outside of the cabinet from condensing unit during servicing of the
cabinet (fans are assumed off during servicing)
9) Impinged leak to the outside of the cabinet that does not come from the condensing unit
during servicing of the cabinet (fans are assumed off during servicing)
10) Free jet leak to the outside of the cabinet during servicing of the cabinet
11) Impinged leak to the inside of the cabinet during servicing of the cabinet
12) Free jet leak to the inside of the cabinet during normal operation of the cabinet
13) Null branch that covers when a leak does not occur during servicing
For branch #3, fans are taken to have no effect on the leak because the leak occurs away from the
condensing unit while the fans are located at the condensing unit. For branch #4, jet leaks are
considered to not result in accumulate fuel volumes aside from the jet plume itself and are also
assumed to be unaffected by fans. For branch #8, it is assumed that fans will be off or unavailable
during servicing.
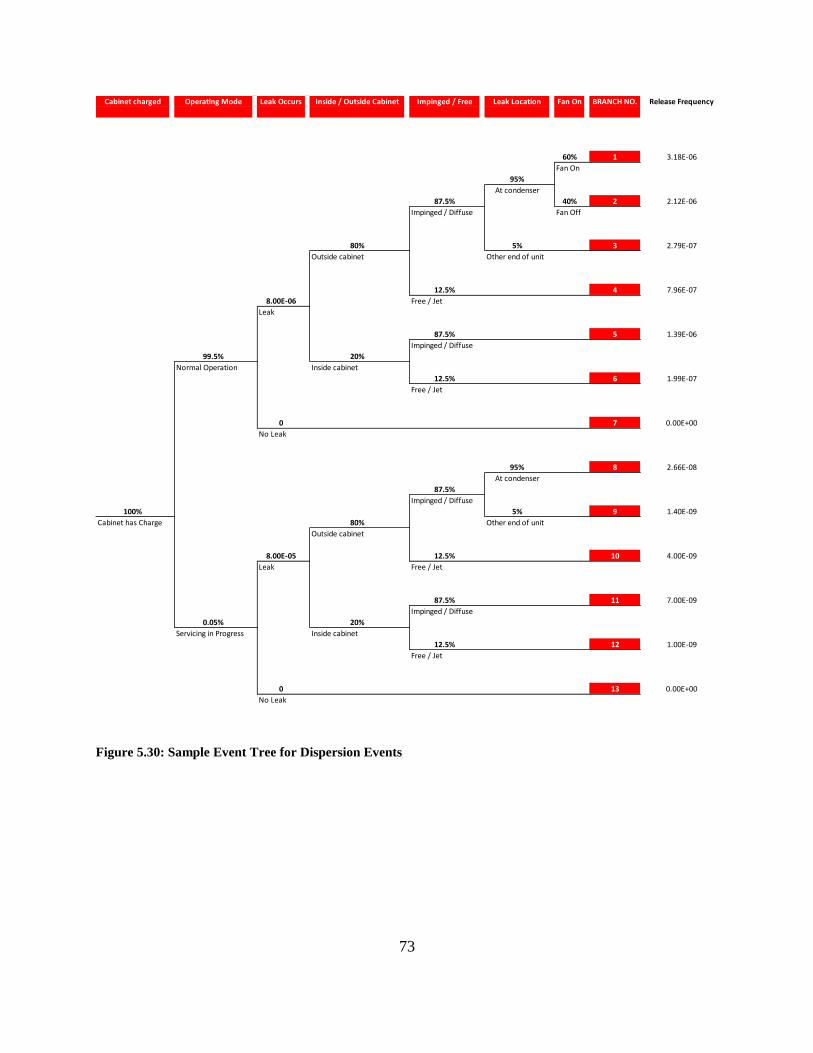
73
Figure 5.30: Sample Event Tree for Dispersion Events
Cabinet charged Operating Mode Leak Occurs Inside / Outside Cabinet Impinged / Free Leak Location Fan On BRANCH NO. Release Frequency
60% 1 3.18E-06
Fan On
95%
At condenser
87.5% 40% 2 2.12E-06
Impinged / Diffuse Fan Off
80% 5% 3 2.79E-07
Outside cabinet Other end of unit
12.5% 4 7.96E-07
8.00E-06 Free / Jet
Leak
87.5% 5 1.39E-06
Impinged / Diffuse
99.5% 20%
Normal Operation Inside cabinet
12.5% 6 1.99E-07
Free / Jet
0 7 0.00E+00
No Leak
95% 8 2.66E-08
At condenser
87.5%
Impinged / Diffuse
100% 5% 9 1.40E-09
Cabinet has Charge 80% Other end of unit
Outside cabinet
8.00E-05 12.5% 10 4.00E-09
Leak Free / Jet
87.5% 11 7.00E-09
Impinged / Diffuse
0.05% 20%
Servicing in Progress Inside cabinet
12.5% 12 1.00E-09
Free / Jet
0 13 0.00E+00
No Leak
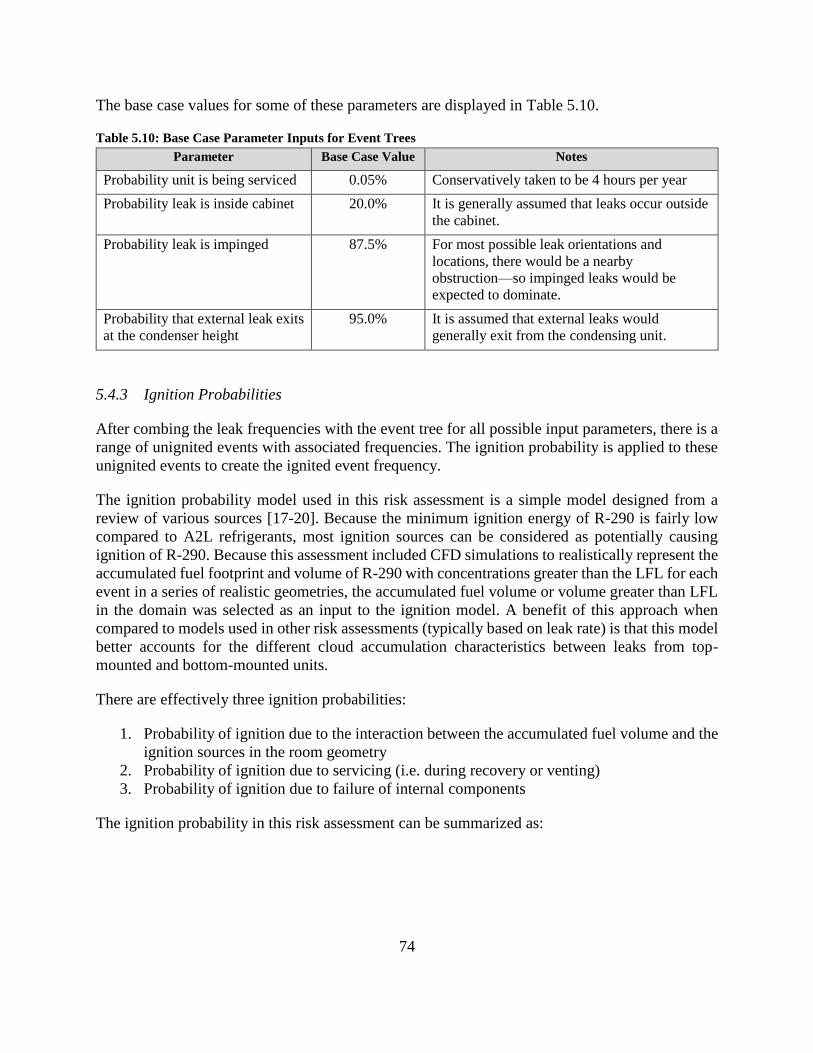
74
The base case values for some of these parameters are displayed in Table 5.10.
Table 5.10: Base Case Parameter Inputs for Event Trees
Parameter Base Case Value Notes
Probability unit is being serviced 0.05% Conservatively taken to be 4 hours per year
Probability leak is inside cabinet 20.0% It is generally assumed that leaks occur outside
the cabinet.
Probability leak is impinged 87.5% For most possible leak orientations and
locations, there would be a nearby
obstruction—so impinged leaks would be
expected to dominate.
Probability that external leak exits
at the condenser height
95.0% It is assumed that external leaks would
generally exit from the condensing unit.
5.4.3 Ignition Probabilities
After combing the leak frequencies with the event tree for all possible input parameters, there is a
range of unignited events with associated frequencies. The ignition probability is applied to these
unignited events to create the ignited event frequency.
The ignition probability model used in this risk assessment is a simple model designed from a
review of various sources [17-20]. Because the minimum ignition energy of R-290 is fairly low
compared to A2L refrigerants, most ignition sources can be considered as potentially causing
ignition of R-290. Because this assessment included CFD simulations to realistically represent the
accumulated fuel footprint and volume of R-290 with concentrations greater than the LFL for each
event in a series of realistic geometries, the accumulated fuel volume or volume greater than LFL
in the domain was selected as an input to the ignition model. A benefit of this approach when
compared to models used in other risk assessments (typically based on leak rate) is that this model
better accounts for the different cloud accumulation characteristics between leaks from top-
mounted and bottom-mounted units.
There are effectively three ignition probabilities:
1. Probability of ignition due to the interaction between the accumulated fuel volume and the
ignition sources in the room geometry
2. Probability of ignition due to servicing (i.e. during recovery or venting)
3. Probability of ignition due to failure of internal components
The ignition probability in this risk assessment can be summarized as:
75
Pign = Pi + Pv∙V∙D + Ps
where:
Pi = Probability of ignition due to internal components
Pv = Probability of ignition per cubic meter of R-290 greater than LFL
V = Accumulated fuel volume or volume of R-290 at concentrations greater than LFL in the
dispersion results,
D = Density factor to account for density of ignition sources in scenario
Ps = Probability of ignition during servicing
The following values were used as inputs to the ignition model for the risk assessment:
• Pi = 0.1% to account for the likelihood of ignition due to internal components of the cabinet
• Pv = 0.1% per cubic meter of the accumulated fuel volume having concentrations greater than
the LFL
• Ps = 5% if the event occurs during servicing
• D = 1 for all non-kitchen scenarios;
• D = 20 for kitchen scenarios
An important note regarding the calculation of ignition probability is that although jet plumes were
not considered to result in flammable clouds remote from the leak and therefore have minimal
accumulation (see Section 2.4), the contribution of the plume itself to accumulated fuel volume
was accounted for when calculating the ignition probability for the various scenarios. By
accounting for the effect of the jet plume in the ignition probability, that means that any evaluation
of the total ignited event frequency would account for jet fires as ignited events even if those jet
fires did not result in flammable cloud accumulation remote from the leak in the room volume.
5.4.4 Servicing: Reclaiming versus Venting
There was a particular focus on the difference between reclaiming (recovery) and venting R-290
as part of the servicing process. The risks associated with reclamation and venting are similar
assuming that all processes are properly followed. A full fault tree analysis evaluating the degree
to which procedural steps are properly followed for reclaiming versus venting was beyond the
scope of the present project.
The most likely event during either the reclamation process or venting is a jet plume resulting from
a leak in the piping that is transferring the refrigerant. If the cabinet is serviced in its original
position, there is still a significant likelihood of the jet impinging as assumed for leaks during
normal operations (although it would be somewhat less if the condensing unit is open or exposed).
The primary difference between reclamation and venting versus normal operations in terms of
accounting for it in the risk model is that the likelihood of human error and/or missing procedural
steps. For the risk model, the likelihood of a release during servicing is accounted for by
multiplying a factor of 10 to the leak frequency during servicing scenarios.

76
Reclaiming and venting are not treated separately in the model because depending on the
technician’s quality of following the procedure, the failure results are similar. For venting, there
may be an accidental release into the room via either piping failure or human error. It’s also
uncertain whether the technician would flush the system with oxygen-free nitrogen. For
reclamation, piping or the reclamation machine may leak or fail also leading to an accidental
release in the space.
In order to quantify the difference between reclaiming and venting in a detailed fashion, a full fault
tree analysis would have to be performed evaluating the degree to which procedural steps are
followed. It would also be beneficial to evaluate the steps from a human factors perspective as part
of identifying how to better ensure that procedures are easily followed.
5.5 Uncertainty, Assumptions, and Relative Risk
There is a certain degree of uncertainty inherent to risk assessments, and therefore assumptions
must be made to fill in the gaps.
Particular to evaluations of leaks in the refrigeration cycle, it is difficult to establish appropriate
leak frequencies due to the inconsistent historical data on leaks. Various research has been done
on leak causes and their likelihood in various HVAC and refrigeration contexts; however, there is
no consistent historical database of leaks because of the wide range of different systems,
maintenance records, etc.
The data used in this report from Colbourne et al. [17, 18] is derived from a report published by
Parasense in 2000 based on leak detection in UK supermarkets. That single data source has been
used in many risk assessments because it is one of the most complete records available for
refrigerant leak data. This data is coupled with methods from the oil and gas industry which has a
longer history of utilizing historical leak data to perform quantitative risk assessments. There is a
lack of properly standardized data sources to establish any region-specific trends or trends that
account for the effects of equipment aging and/or maintenance programs on leak frequencies.
Because of the uncertainty regarding the leak frequencies (which form the basis of the event
frequencies and risk results), the general approach of this report is to focus on relative evaluations
of risk. By focusing on relative evaluations of risk, the importance of the leak frequencies when
interpreting the results decreases significantly. The primary input from the leak frequencies to
evaluating relative risk is the distribution of the likelihood of different hole sizes. From that
perspective, the distribution of the hole sizes in the leak frequencies calculated for this study are
generally in-line with industry expectations and available data sources.
The term “relative risk” means that evaluations of risk are performed relative to other results
performed in this same study to analyze the implications of particular variables. For example, the
total ignited event frequency for cabinets with either top-mounted or bottom-mounted condenser
units could be compared to determine the relative benefit or drawback to selecting top-mounted or
bottom-mounted units. This relative benefit (or drawback) is somewhat insensitive to leak
frequency since the same leak frequency data is applied to both calculations. If we were to change
the leak frequency data (but preserve the distribution between hole sizes), the results would be the

77
same. So as a result of focusing on relative risk, the primary input from the leak frequencies is the
distribution of the likelihood of different hole sizes.
Although the focus is on relative risk to reduce the reliance on the absolute values of the leak
frequencies, the uncertainty regarding the leak frequencies does not necessarily mean that the leak
frequencies are inaccurate or not representative. However, without sufficient data sources for
comparison, it is difficult to establish the quality of the leak frequencies.
In addition to the uncertainty regarding the leak frequencies, a number of assumptions were made
in order to complete the study. Assumptions were selected to be conservative to avoid
underestimating the risk. As a result, it is expected that the study represents conservatively high
risk because of some key assumptions:
• The risk assessment does not account for room ventilation from either room tightness (door
gaps, etc.) or mechanical ventilation (HVAC, etc.). Although this does make for a conservative
study, it would be more realistic to account for some degree of ventilation since these
refrigeration cabinets would never be expected to be used in environments devoid of
ventilation. Accounting for ventilation would likely reduce the consequences of some of the
smaller (but more frequent) leak rates, especially in kitchens where air change rates are high.
• The risk assessment CFD simulations used diffuse leaks to represent impinging leaks. Diffuse
leaks mean minimum momentum and represent the worst-case of possible leaks. This
representation is essentially the opposite of high momentum jets that result in homogeneously
mixed environments—however, there could be intermediate steps between leaks that result in
a homogeneously mixed environment and leaks that have no momentum. The selection of
diffuse leaks is intended to be conservative as it represents the worst-case; however, in reality,
not all cases would be the worst-case.
• In-cabinet releases are represented in an extremely conservative way.
o The entire charge is first released into a completely sealed cabinet prior to opening the
door
o When the door is opened, the ignition occurs at the time when the accumulated fuel
volume is the largest.
▪ Modeling shows that the accumulated fuel volume from these in-cabinet
releases quickly disperses within a room, especially when the room footprint is
large.
▪ Closed display cases likely have some air exchange with the environment even
when the doors are closed, and given that most leaks would take on the order
of hours to release the entire charge, any small air change rate inside a closed
cabinet will significantly reduce the maximum accumulated fuel volume.
While we could not find any information on infiltration rates for closed display
cases, an experimental study [21] measured air changes rates of 2-12 ACH in
domestic refrigerators with magnetic seals.
o Therefore, the worst-possible in-cabinet release of the whole charge is being used as a
representative case for all in-cabinet releases.
78
o Further, the likelihood of ignition for these cases does not account for the considerably
transient nature of the cloud.
• That the ignition model does not account for the transient nature of accumulated fuel volumes
during leaks external to display case (in addition to inside as mentioned above). The refrigerant
accumulates in the domain over time as it is being released and mixes with air. When the leak
has ended, the mixing will continue and the accumulated volume will decrease over time. The
current ignition model effectively evaluates the likelihood of ignition at the time of maximum
accumulated volume; however, the likelihood of igniting that cloud would be more realistic if
dependent on dispersion characteristics of the refrigerant in the geometry over time.
• All leaks are assumed to be at a constant flow rate for the duration of the leak. Although this
may be reasonable for liquid leaks at the beginning, it is conservative for vapor leaks where
the effect of evaporative cooling would reduce the flow rate. It addition, it does not take
depressurization into account, which will also reduce the leak rate and may result in some of
the refrigerant remaining inside of the system rather than escaping as the pressure equalizes.
• It is always assumed that the whole charge is leaked. Sources indicate that a portion of the
refrigerant would be dissolved in the compressor oil—reducing the total mass released.
5.6 Results
5.6.1 Charge Size and Geometry Assumptions
Figure 5.31 shows the total ignited event frequency for all geometries and charge sizes assuming
top-mounted condenser units with the fans on 60% of the time. Table 5.11 shows the same data
from the figure as a table. As expected, as the charge size increases so does the ignited event
frequency as the mass of R-290 available to accumulate within the space also increases. Also,
geometries two and five are kitchens and the risk assessment assumes a higher ignition source
density per unit volume than the other geometries. Lastly, the largest geometry (six) has the lowest
overall ignition event frequency for each charge size due to increased dilution for any released
mass.
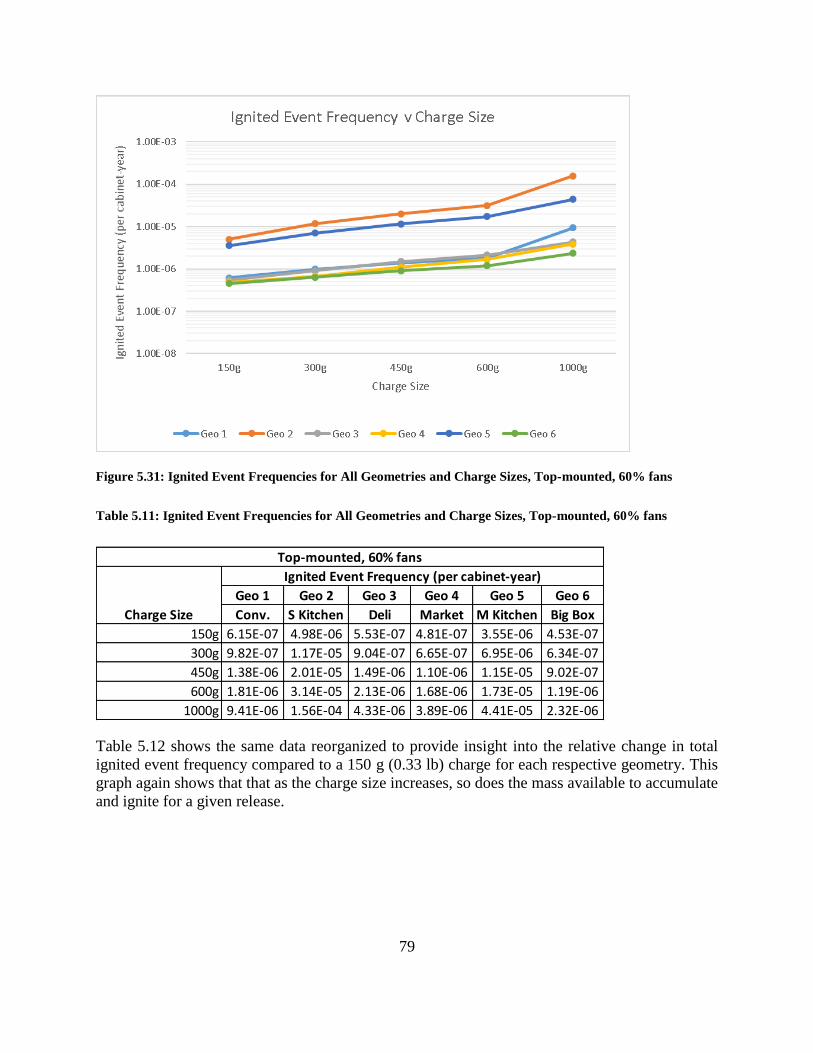
79
Figure 5.31: Ignited Event Frequencies for All Geometries and Charge Sizes, Top-mounted, 60% fans
Table 5.11: Ignited Event Frequencies for All Geometries and Charge Sizes, Top-mounted, 60% fans
Table 5.12 shows the same data reorganized to provide insight into the relative change in total
ignited event frequency compared to a 150 g (0.33 lb) charge for each respective geometry. This
graph again shows that that as the charge size increases, so does the mass available to accumulate
and ignite for a given release.
Geo 1 Geo 2 Geo 3 Geo 4 Geo 5 Geo 6
Conv. S Kitchen Deli Market M Kitchen Big Box
150g 6.15E-07 4.98E-06 5.53E-07 4.81E-07 3.55E-06 4.53E-07
300g 9.82E-07 1.17E-05 9.04E-07 6.65E-07 6.95E-06 6.34E-07
450g 1.38E-06 2.01E-05 1.49E-06 1.10E-06 1.15E-05 9.02E-07
600g 1.81E-06 3.14E-05 2.13E-06 1.68E-06 1.73E-05 1.19E-06
1000g 9.41E-06 1.56E-04 4.33E-06 3.89E-06 4.41E-05 2.32E-06
Top-mounted, 60% fans
Ignited Event Frequency (per cabinet-year)
Charge Size
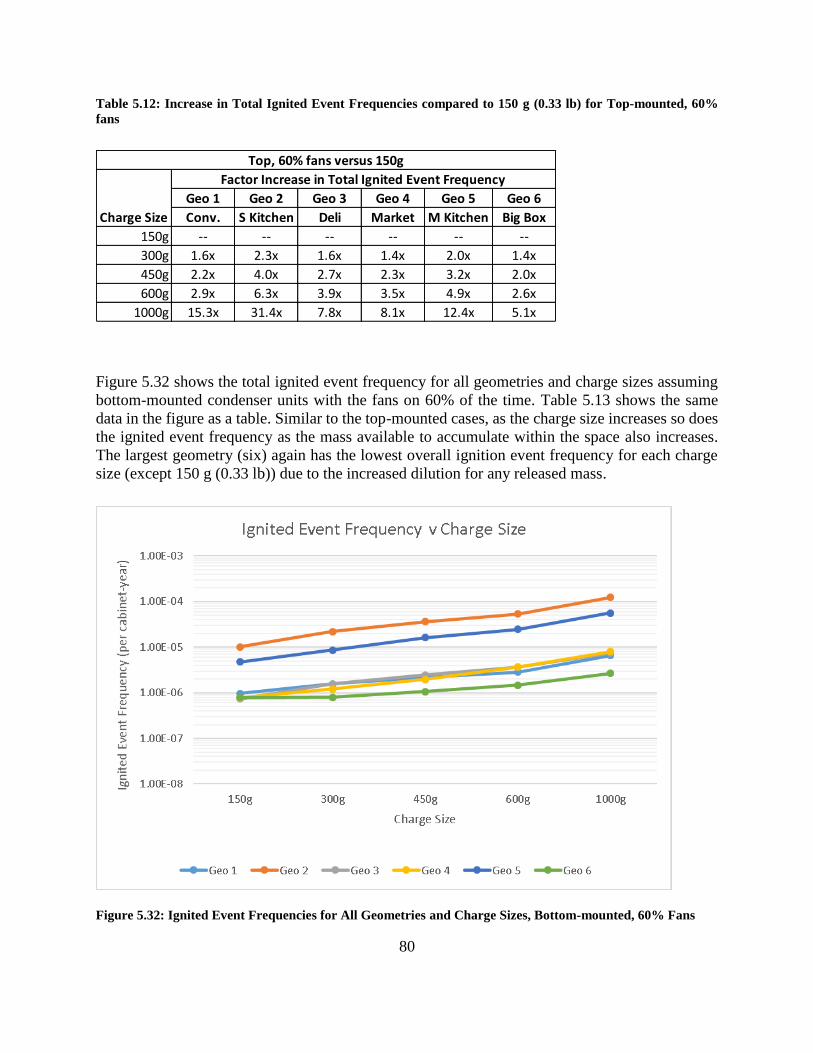
80
Table 5.12: Increase in Total Ignited Event Frequencies compared to 150 g (0.33 lb) for Top-mounted, 60%
fans
Figure 5.32 shows the total ignited event frequency for all geometries and charge sizes assuming
bottom-mounted condenser units with the fans on 60% of the time. Table 5.13 shows the same
data in the figure as a table. Similar to the top-mounted cases, as the charge size increases so does
the ignited event frequency as the mass available to accumulate within the space also increases.
The largest geometry (six) again has the lowest overall ignition event frequency for each charge
size (except 150 g (0.33 lb)) due to the increased dilution for any released mass.
Figure 5.32: Ignited Event Frequencies for All Geometries and Charge Sizes, Bottom-mounted, 60% Fans
Geo 1 Geo 2 Geo 3 Geo 4 Geo 5 Geo 6
Conv. S Kitchen Deli Market M Kitchen Big Box
150g -- -- -- -- -- --
300g 1.6x 2.3x 1.6x 1.4x 2.0x 1.4x
450g 2.2x 4.0x 2.7x 2.3x 3.2x 2.0x
600g 2.9x 6.3x 3.9x 3.5x 4.9x 2.6x
1000g 15.3x 31.4x 7.8x 8.1x 12.4x 5.1x
Top, 60% fans versus 150g
Factor Increase in Total Ignited Event Frequency
Charge Size
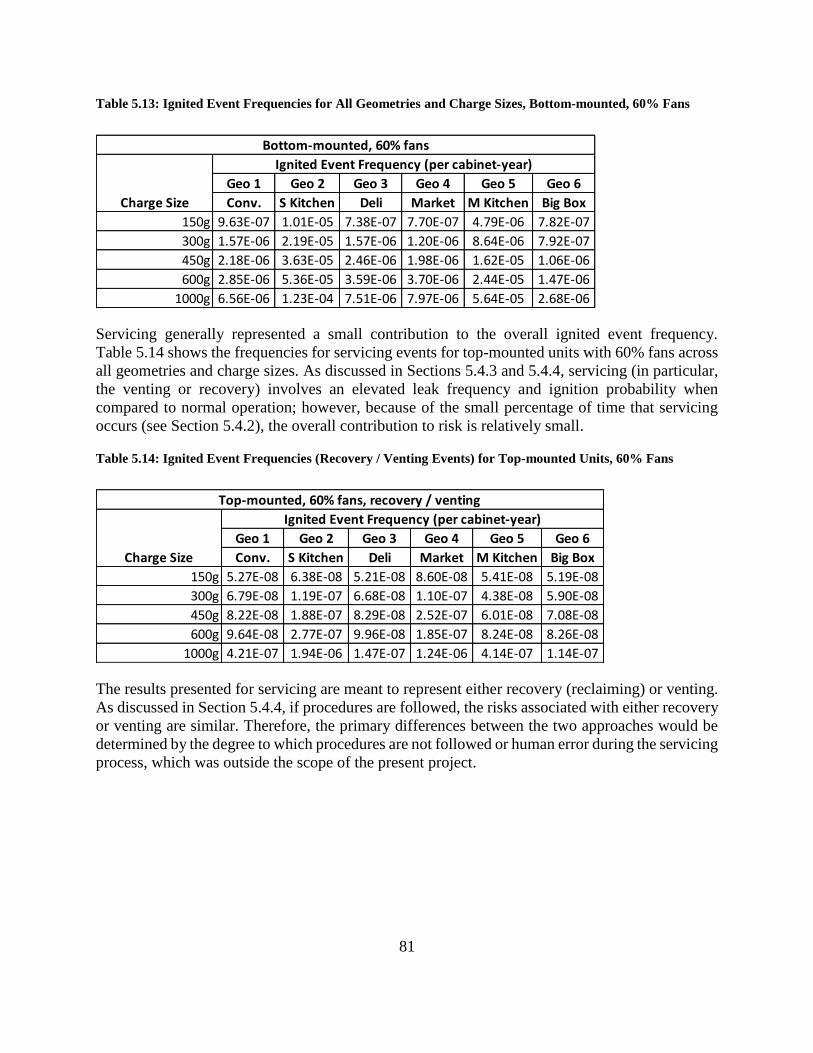
81
Table 5.13: Ignited Event Frequencies for All Geometries and Charge Sizes, Bottom-mounted, 60% Fans
Servicing generally represented a small contribution to the overall ignited event frequency.
Table 5.14 shows the frequencies for servicing events for top-mounted units with 60% fans across
all geometries and charge sizes. As discussed in Sections 5.4.3 and 5.4.4, servicing (in particular,
the venting or recovery) involves an elevated leak frequency and ignition probability when
compared to normal operation; however, because of the small percentage of time that servicing
occurs (see Section 5.4.2), the overall contribution to risk is relatively small.
Table 5.14: Ignited Event Frequencies (Recovery / Venting Events) for Top-mounted Units, 60% Fans
The results presented for servicing are meant to represent either recovery (reclaiming) or venting.
As discussed in Section 5.4.4, if procedures are followed, the risks associated with either recovery
or venting are similar. Therefore, the primary differences between the two approaches would be
determined by the degree to which procedures are not followed or human error during the servicing
process, which was outside the scope of the present project.
Geo 1 Geo 2 Geo 3 Geo 4 Geo 5 Geo 6
Conv. S Kitchen Deli Market M Kitchen Big Box
150g 9.63E-07 1.01E-05 7.38E-07 7.70E-07 4.79E-06 7.82E-07
300g 1.57E-06 2.19E-05 1.57E-06 1.20E-06 8.64E-06 7.92E-07
450g 2.18E-06 3.63E-05 2.46E-06 1.98E-06 1.62E-05 1.06E-06
600g 2.85E-06 5.36E-05 3.59E-06 3.70E-06 2.44E-05 1.47E-06
1000g 6.56E-06 1.23E-04 7.51E-06 7.97E-06 5.64E-05 2.68E-06
Bottom-mounted, 60% fans
Ignited Event Frequency (per cabinet-year)
Charge Size
Geo 1 Geo 2 Geo 3 Geo 4 Geo 5 Geo 6
Conv. S Kitchen Deli Market M Kitchen Big Box
150g 5.27E-08 6.38E-08 5.21E-08 8.60E-08 5.41E-08 5.19E-08
300g 6.79E-08 1.19E-07 6.68E-08 1.10E-07 4.38E-08 5.90E-08
450g 8.22E-08 1.88E-07 8.29E-08 2.52E-07 6.01E-08 7.08E-08
600g 9.64E-08 2.77E-07 9.96E-08 1.85E-07 8.24E-08 8.26E-08
1000g 4.21E-07 1.94E-06 1.47E-07 1.24E-06 4.14E-07 1.14E-07
Charge Size
Top-mounted, 60% fans, recovery / venting
Ignited Event Frequency (per cabinet-year)
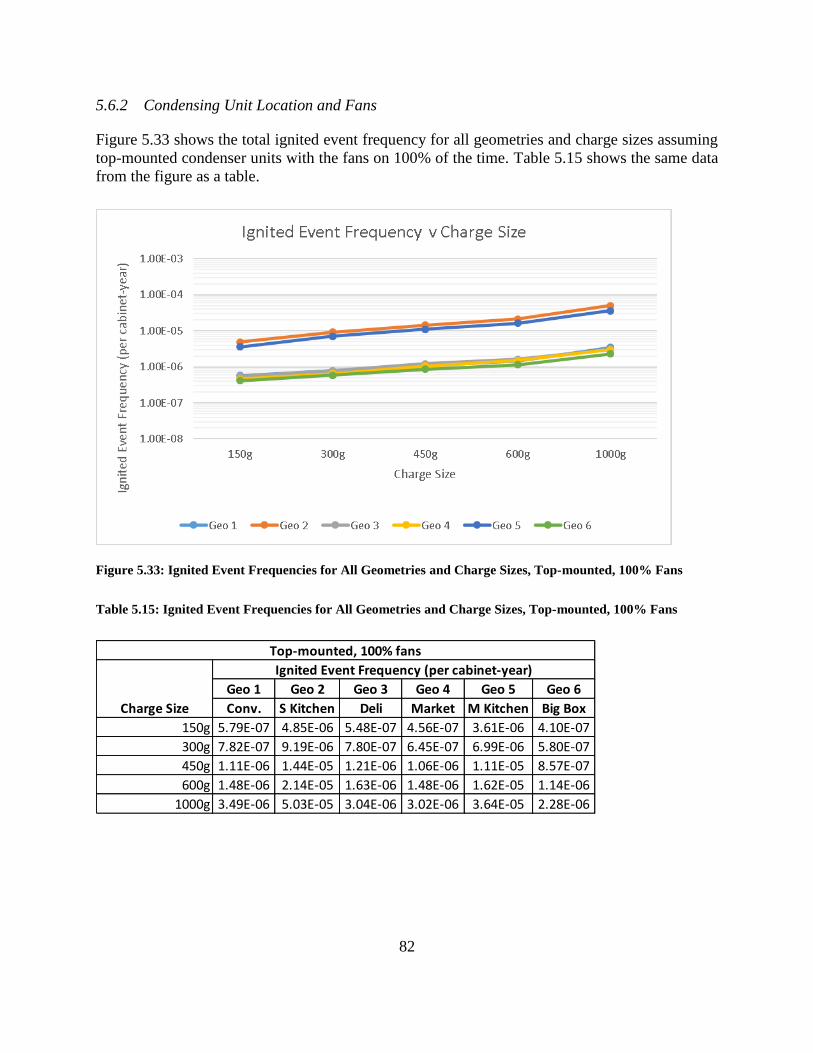
82
5.6.2 Condensing Unit Location and Fans
Figure 5.33 shows the total ignited event frequency for all geometries and charge sizes assuming
top-mounted condenser units with the fans on 100% of the time. Table 5.15 shows the same data
from the figure as a table.
Figure 5.33: Ignited Event Frequencies for All Geometries and Charge Sizes, Top-mounted, 100% Fans
Table 5.15: Ignited Event Frequencies for All Geometries and Charge Sizes, Top-mounted, 100% Fans
Geo 1 Geo 2 Geo 3 Geo 4 Geo 5 Geo 6
Conv. S Kitchen Deli Market M Kitchen Big Box
150g 5.79E-07 4.85E-06 5.48E-07 4.56E-07 3.61E-06 4.10E-07
300g 7.82E-07 9.19E-06 7.80E-07 6.45E-07 6.99E-06 5.80E-07
450g 1.11E-06 1.44E-05 1.21E-06 1.06E-06 1.11E-05 8.57E-07
600g 1.48E-06 2.14E-05 1.63E-06 1.48E-06 1.62E-05 1.14E-06
1000g 3.49E-06 5.03E-05 3.04E-06 3.02E-06 3.64E-05 2.28E-06
Top-mounted, 100% fans
Ignited Event Frequency (per cabinet-year)
Charge Size

83
Figure 5.34 shows the total ignited event frequency for all geometries and charge sizes assuming
bottom-mounted condenser units with the fans on 100% of the time. Table 5.16 shows the same
data from the figure as a table.
Figure 5.34: Ignited Event Frequencies for All Geometries and Charge Sizes, Bottom-mounted, 100% fans
Table 5.16: Ignited Event Frequencies for All Geometries and Charge Sizes, Bottom-mounted, 100% fans
The data from the preceding figures and tables can be combined to evaluate the relative change in
frequency between changing the variables: bottom-mounted versus top-mounted and fans on 60%
versus 100% of the time. Table 5.17 shows the relative change in the ignited event frequency
Geo 1 Geo 2 Geo 3 Geo 4 Geo 5 Geo 6
Conv. S Kitchen Deli Market M Kitchen Big Box
150g 5.69E-07 3.82E-06 5.65E-07 6.01E-07 4.56E-06 6.51E-07
300g 8.35E-07 7.69E-06 8.31E-07 7.61E-07 6.50E-06 7.16E-07
450g 1.04E-06 1.20E-05 1.05E-06 1.01E-06 1.10E-05 9.62E-07
600g 1.38E-06 1.68E-05 1.40E-06 1.33E-06 1.51E-05 1.41E-06
1000g 3.41E-06 5.28E-05 2.67E-06 2.59E-06 3.37E-05 2.60E-06
Bottom-mounted, 100% fans
Ignited Event Frequency (per cabinet-year)
Charge Size

84
between top and bottom mounted condenser units—i.e. the ratio of bottom-mounted to top-
mounted ignited event frequency. A value greater than 1 indicates that the top mounted unit has a
lower frequency (shown in green), and a value less than 1 indicates that the bottom mounted unit
has a lower frequency (shown in red).
Table 5.17: Relative Comparison of Ignited Event Frequency for Top vs Bottom units, 60% Fans
Generally speaking, there are reasonable gains in using a top-mounted unit when compared to a
bottom-mounted unit. For example, the ignited event frequency is 1.2-2.0 times lower for a top-
mounted unit when compared to a bottom-mounted unit.
For the 1000 g (2.2 lb) charge in the smallest geometries, the trend doesn’t hold true due to the
better mixing being less beneficial; however, 1000 g (2.2 lb) charges should never be used in those
size rooms because the cloud would reach LFL if homogeneously mixed (as discussed in Section
2.3 - 2.4).
Table 5.18 shows the relative change in the ignited event frequency between 60% and 100% fans
for top-mounted condenser units. Table 5.19 shows the relative change in the ignited event
frequency between 60% and 100% fans for bottom-mounted condenser units. A positive value
(shown in green) indicates that the ignited release frequency decreased when changing the fan time
percentage from 60% to 100%, while a negative value (shown in red) indicates that the frequency
increased for the same change.
Table 5.18: Relative Comparison of Ignited Event Frequency for Top-mounted Units, 60% vs 100% Fans
Geo 1 Geo 2 Geo 3 Geo 4 Geo 5 Geo 6
Conv. S Kitchen Deli Market M Kitchen Big Box
150g 1.06 1.03 1.01 1.05 0.98 1.10
300g 1.25 1.27 1.16 1.03 0.99 1.09
450g 1.25 1.40 1.23 1.03 1.03 1.05
600g 1.23 1.47 1.30 1.13 1.07 1.04
1000g 2.70 3.11 1.43 1.29 1.21 1.02
Charge Size
Top, 60% vs 100% fans
Relative Ignited Event Frequency (60% Fans / 100% Fans)
Geo 1 Geo 2 Geo 3 Geo 4 Geo 5 Geo 6
Conv. S Kitchen Deli Market M Kitchen Big Box
150g 1.57 2.02 1.33 1.60 1.35 1.73
300g 1.60 1.88 1.73 1.81 1.24 1.25
450g 1.58 1.80 1.65 1.80 1.41 1.17
600g 1.57 1.70 1.68 2.21 1.41 1.23
1000g 0.70 0.79 1.73 2.05 1.28 1.15
Charge Size
Bottom vs Top, 60% fans
Relative Ignited Event Frequency (Bottom / Top)

85
Table 5.19: Relative Comparison of Ignited Event Frequency for Bottom-mounted Units, 60% vs 100% Fans
With the top-mounted condenser units, there is a marginal benefit to running the fans all the time,
especially for the larger geometries. This is due to the increased dilution created by the leaking
refrigerant falling to the floor, hence there is only minor additional dilution created by the fan air
flow. There is somewhat of a benefit in the smaller volumes, even when the charge size is properly
sized to say 20-25% of the LFL if mixed in the entire room volume (around 0.0095 kg/m3 (0.00059
lb/ft3)).
In contrast, there are reasonable gains to running the fans all the time for bottom-mounted units.
For example, the ignited event frequency is up to 3.2 times lower for the fans 100% on when
compared 60% operation for bottom-mounted units. As there is limited mixing with air for the
bottom-mounted low momentum releases, the increased fan operation can increase the dilution of
releases near floor level for bottom-mounted units more so than for top-mounted units.
In fact, the likelihood of ignition becomes very similar for both bottom-mounted and top-mounted
units with 100% fan operation as shown in Table 5.20. Although there are some outliers caused
by specifics in the geometry, generally the results are similar (near one) for top-mounted and
bottom-mounted units provided the fans are always on. In other words, the likelihood of a fire is
about the same for top-mounted and bottom-mounted units when the fans are always running.
Table 5.20: Relative Ignited Event Frequency for 100% fans, top-mounted vs bottom-mounted
Geo 1 Geo 2 Geo 3 Geo 4 Geo 5 Geo 6
Conv. S Kitchen Deli Market M Kitchen Big Box
150g 1.69 2.64 1.30 1.28 1.05 1.20
300g 1.88 2.85 1.89 1.58 1.33 1.11
450g 2.09 3.02 2.34 1.96 1.47 1.10
600g 2.07 3.19 2.56 2.77 1.62 1.04
1000g 1.92 2.34 2.82 3.08 1.67 1.03
Charge Size
Bottom, 60% vs 100% fans
Relative Ignited Event Frequency (60% Fans / 100% Fans)
Geo 1 Geo 2 Geo 3 Geo 4 Geo 5 Geo 6
Conv. S Kitchen Deli Market M Kitchen Big Box
150g 0.98 0.79 1.03 1.32 1.26 1.59
300g 1.07 0.84 1.07 1.18 0.93 1.23
450g 0.94 0.84 0.87 0.95 0.98 1.12
600g 0.93 0.79 0.86 0.90 0.93 1.23
1000g 0.98 1.05 0.88 0.86 0.93 1.14
Bottom vs Top, 100% fans
Relative Ignited Event Frequency (Bottom / Top)
Charge Size

86
There are two main things to consider with these results. The results demonstrate that:
1. When condenser fans are operated normally during the leak, an ignition event in top-mounted
units are 1.2-2.0 times less likely than bottom-mounted units
2. When the condenser fan is always on, there is not a significant difference between the total
ignited event frequency of cabinets with top-mounted and bottom-mounted condensing units.
This is because when the fans are always on, the ignited event frequency is only marginally
improved for top-mounted units while the reduction can be up to 3.2 times for bottom-mounted
units.
The model is however sensitive to the selection of probability of in-cabinet releases (discussed
next). In addition, the metric being evaluated is total ignited event frequency and accounts for all
fires as opposed to a particular consequence severity (e.g. 80 TDU or overpressure of 0.1 psi).
5.6.3 In-cabinet Releases
Table 5.21 shows the frequency contribution of in-cabinet leaks when the likelihood of in-cabinet
leaks is assumed to be 20% for a top-mounted unit with fans on 60% of the time. Recall that the
ignition model is based on the accumulated fuel volume and is therefore dependent on the
dispersion results / consequences, meaning there is a frequency impact to the dispersion results.
Table 5.21: Frequency Contribution of In-cabinet Leaks to Top-mounted, 60% fans, 20% In-cabinet Leaks
The table draws attention to the relatively high frequency contribution from in-cabinet releases.
The in-cabinet leaks generally represent 40-50% of the total ignited event frequency for the smaller
geometries assuming a 20% likelihood of in-cabinet releases, and even larger 50-80% of the total
ignited event frequency for the larger geometries. This is driven by the generally lower
consequences of external leaks in the larger geometries because of the large room volume
contributing to dilution of external releases; however, the in-cabinet results are represented with
the same conservative severity—resulting in the effective contribution from the in-cabinet releases
being higher.
Recall that the ignition model is based on the accumulated fuel volume and is therefore dependent
on the dispersion results / consequences—which means there is a frequency impact to the
dispersion results. As such, it is relevant that the in-cabinet leaks are represented very
conservatively (discussed in Section 5.5) and generally contribute to over 40% of all ignited event
Geo 1 Geo 2 Geo 3 Geo 4 Geo 5 Geo 6
Conv. S Kitchen Deli Market M Kitchen Big Box
150g 41.3% 56.4% 45.9% 53.0% 79.1% 56.0%
300g 42.6% 47.4% 46.2% 63.3% 79.6% 66.0%
450g 44.8% 44.6% 41.5% 61.1% 78.4% 68.6%
600g 47.6% 42.3% 40.5% 56.0% 77.0% 72.3%
1000g 19.6% 20.1% 42.6% 47.8% 71.1% 79.4%
Charge Size
Top-mounted, 60% fans
Frequency Contribution from In-cabinet Leaks
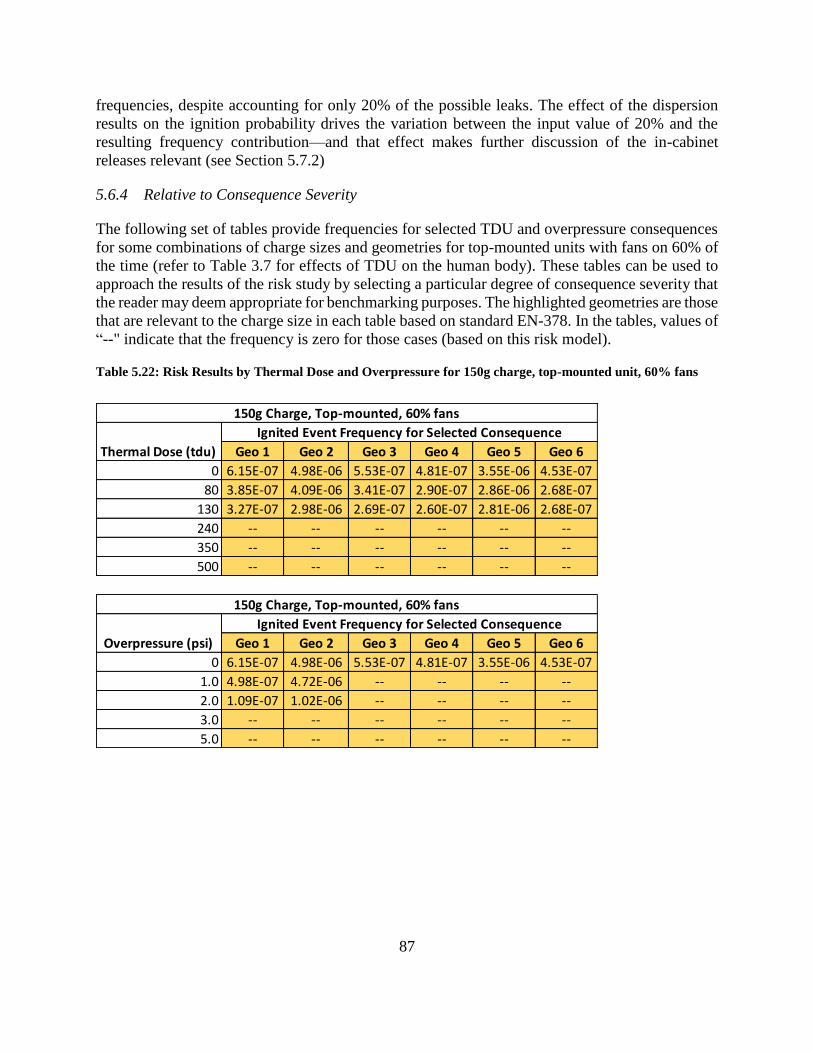
87
frequencies, despite accounting for only 20% of the possible leaks. The effect of the dispersion
results on the ignition probability drives the variation between the input value of 20% and the
resulting frequency contribution—and that effect makes further discussion of the in-cabinet
releases relevant (see Section 5.7.2)
5.6.4 Relative to Consequence Severity
The following set of tables provide frequencies for selected TDU and overpressure consequences
for some combinations of charge sizes and geometries for top-mounted units with fans on 60% of
the time (refer to Table 3.7 for effects of TDU on the human body). These tables can be used to
approach the results of the risk study by selecting a particular degree of consequence severity that
the reader may deem appropriate for benchmarking purposes. The highlighted geometries are those
that are relevant to the charge size in each table based on standard EN-378. In the tables, values of
“--" indicate that the frequency is zero for those cases (based on this risk model).
Table 5.22: Risk Results by Thermal Dose and Overpressure for 150g charge, top-mounted unit, 60% fans
Geo 1 Geo 2 Geo 3 Geo 4 Geo 5 Geo 6
0 6.15E-07 4.98E-06 5.53E-07 4.81E-07 3.55E-06 4.53E-07
80 3.85E-07 4.09E-06 3.41E-07 2.90E-07 2.86E-06 2.68E-07
130 3.27E-07 2.98E-06 2.69E-07 2.60E-07 2.81E-06 2.68E-07
240 -- -- -- -- -- --
350 -- -- -- -- -- --
500 -- -- -- -- -- --
Geo 1 Geo 2 Geo 3 Geo 4 Geo 5 Geo 6
0 6.15E-07 4.98E-06 5.53E-07 4.81E-07 3.55E-06 4.53E-07
1.0 4.98E-07 4.72E-06 -- -- -- --
2.0 1.09E-07 1.02E-06 -- -- -- --
3.0 -- -- -- -- -- --
5.0 -- -- -- -- -- --
150g Charge, Top-mounted, 60% fans
Thermal Dose (tdu)
Overpressure (psi)
Ignited Event Frequency for Selected Consequence
150g Charge, Top-mounted, 60% fans
Ignited Event Frequency for Selected Consequence
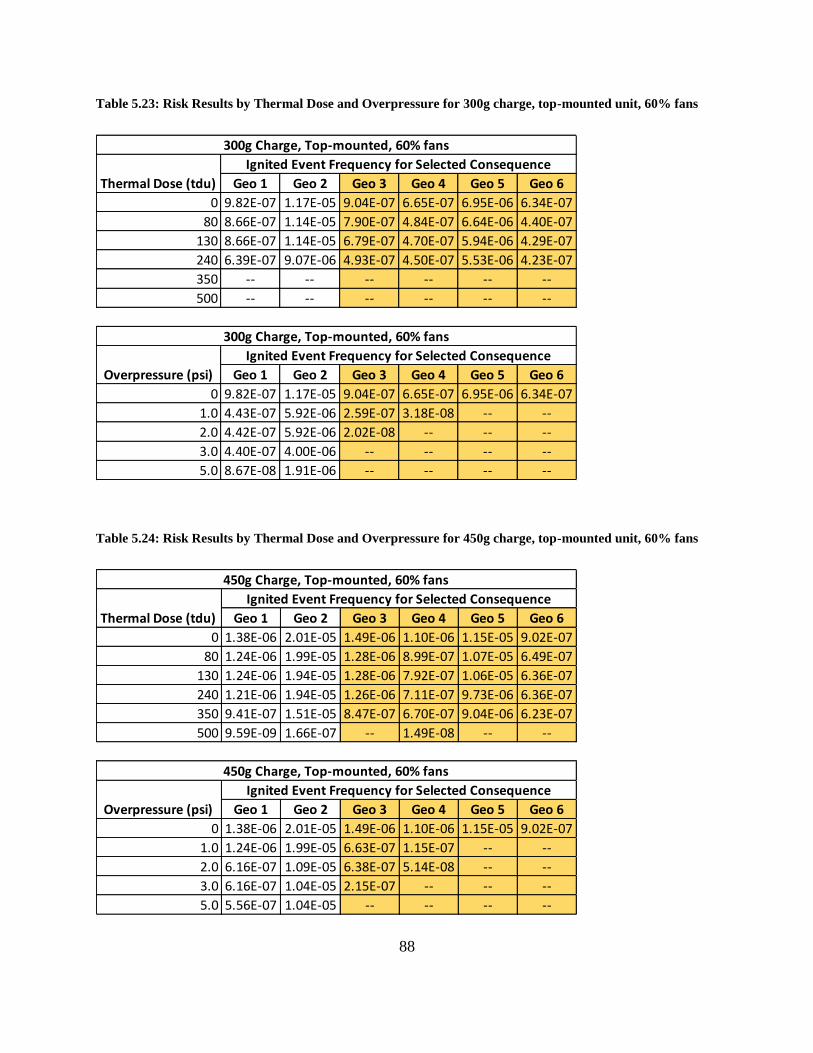
88
Table 5.23: Risk Results by Thermal Dose and Overpressure for 300g charge, top-mounted unit, 60% fans
Table 5.24: Risk Results by Thermal Dose and Overpressure for 450g charge, top-mounted unit, 60% fans
Geo 1 Geo 2 Geo 3 Geo 4 Geo 5 Geo 6
0 9.82E-07 1.17E-05 9.04E-07 6.65E-07 6.95E-06 6.34E-07
80 8.66E-07 1.14E-05 7.90E-07 4.84E-07 6.64E-06 4.40E-07
130 8.66E-07 1.14E-05 6.79E-07 4.70E-07 5.94E-06 4.29E-07
240 6.39E-07 9.07E-06 4.93E-07 4.50E-07 5.53E-06 4.23E-07
350 -- -- -- -- -- --
500 -- -- -- -- -- --
Geo 1 Geo 2 Geo 3 Geo 4 Geo 5 Geo 6
0 9.82E-07 1.17E-05 9.04E-07 6.65E-07 6.95E-06 6.34E-07
1.0 4.43E-07 5.92E-06 2.59E-07 3.18E-08 -- --
2.0 4.42E-07 5.92E-06 2.02E-08 -- -- --
3.0 4.40E-07 4.00E-06 -- -- -- --
5.0 8.67E-08 1.91E-06 -- -- -- --
Overpressure (psi)
Ignited Event Frequency for Selected Consequence
300g Charge, Top-mounted, 60% fans
Ignited Event Frequency for Selected Consequence
300g Charge, Top-mounted, 60% fans
Thermal Dose (tdu)
Geo 1 Geo 2 Geo 3 Geo 4 Geo 5 Geo 6
0 1.38E-06 2.01E-05 1.49E-06 1.10E-06 1.15E-05 9.02E-07
80 1.24E-06 1.99E-05 1.28E-06 8.99E-07 1.07E-05 6.49E-07
130 1.24E-06 1.94E-05 1.28E-06 7.92E-07 1.06E-05 6.36E-07
240 1.21E-06 1.94E-05 1.26E-06 7.11E-07 9.73E-06 6.36E-07
350 9.41E-07 1.51E-05 8.47E-07 6.70E-07 9.04E-06 6.23E-07
500 9.59E-09 1.66E-07 -- 1.49E-08 -- --
Geo 1 Geo 2 Geo 3 Geo 4 Geo 5 Geo 6
0 1.38E-06 2.01E-05 1.49E-06 1.10E-06 1.15E-05 9.02E-07
1.0 1.24E-06 1.99E-05 6.63E-07 1.15E-07 -- --
2.0 6.16E-07 1.09E-05 6.38E-07 5.14E-08 -- --
3.0 6.16E-07 1.04E-05 2.15E-07 -- -- --
5.0 5.56E-07 1.04E-05 -- -- -- --
Thermal Dose (tdu)
Overpressure (psi)
450g Charge, Top-mounted, 60% fans
Ignited Event Frequency for Selected Consequence
450g Charge, Top-mounted, 60% fans
Ignited Event Frequency for Selected Consequence
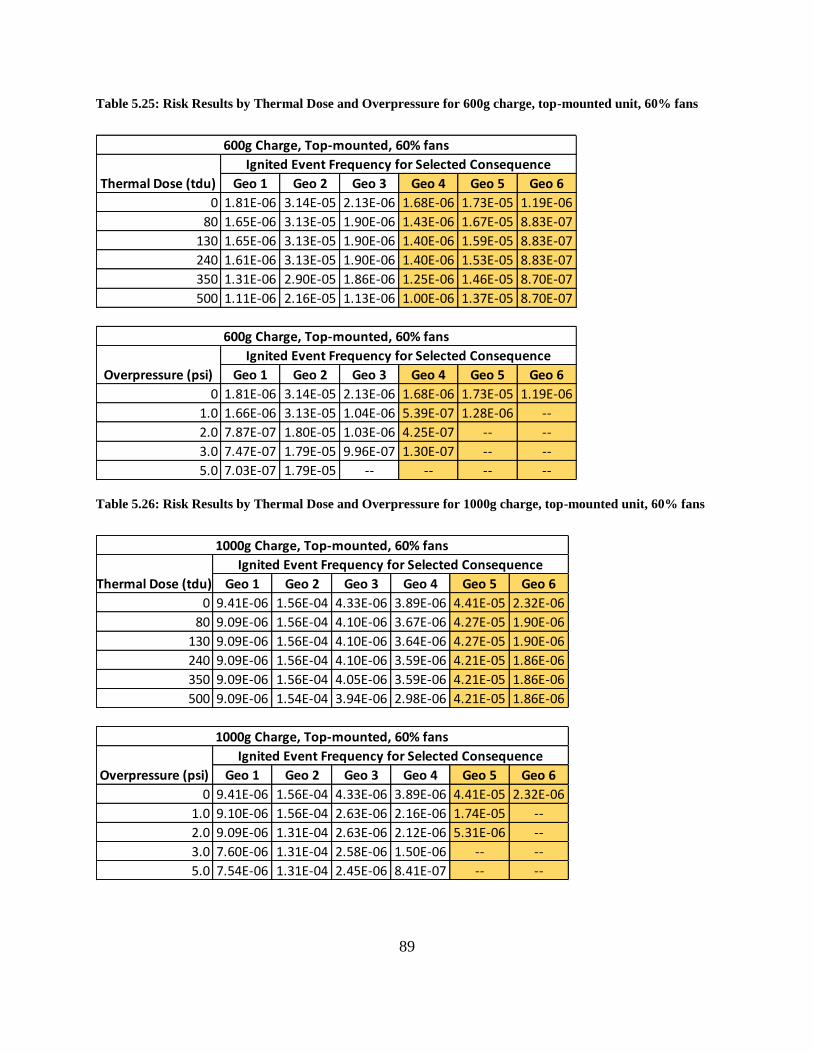
89
Table 5.25: Risk Results by Thermal Dose and Overpressure for 600g charge, top-mounted unit, 60% fans
Table 5.26: Risk Results by Thermal Dose and Overpressure for 1000g charge, top-mounted unit, 60% fans
Geo 1 Geo 2 Geo 3 Geo 4 Geo 5 Geo 6
0 1.81E-06 3.14E-05 2.13E-06 1.68E-06 1.73E-05 1.19E-06
80 1.65E-06 3.13E-05 1.90E-06 1.43E-06 1.67E-05 8.83E-07
130 1.65E-06 3.13E-05 1.90E-06 1.40E-06 1.59E-05 8.83E-07
240 1.61E-06 3.13E-05 1.90E-06 1.40E-06 1.53E-05 8.83E-07
350 1.31E-06 2.90E-05 1.86E-06 1.25E-06 1.46E-05 8.70E-07
500 1.11E-06 2.16E-05 1.13E-06 1.00E-06 1.37E-05 8.70E-07
Geo 1 Geo 2 Geo 3 Geo 4 Geo 5 Geo 6
0 1.81E-06 3.14E-05 2.13E-06 1.68E-06 1.73E-05 1.19E-06
1.0 1.66E-06 3.13E-05 1.04E-06 5.39E-07 1.28E-06 --
2.0 7.87E-07 1.80E-05 1.03E-06 4.25E-07 -- --
3.0 7.47E-07 1.79E-05 9.96E-07 1.30E-07 -- --
5.0 7.03E-07 1.79E-05 -- -- -- --
Thermal Dose (tdu)
Overpressure (psi)
600g Charge, Top-mounted, 60% fans
Ignited Event Frequency for Selected Consequence
600g Charge, Top-mounted, 60% fans
Ignited Event Frequency for Selected Consequence
Geo 1 Geo 2 Geo 3 Geo 4 Geo 5 Geo 6
0 9.41E-06 1.56E-04 4.33E-06 3.89E-06 4.41E-05 2.32E-06
80 9.09E-06 1.56E-04 4.10E-06 3.67E-06 4.27E-05 1.90E-06
130 9.09E-06 1.56E-04 4.10E-06 3.64E-06 4.27E-05 1.90E-06
240 9.09E-06 1.56E-04 4.10E-06 3.59E-06 4.21E-05 1.86E-06
350 9.09E-06 1.56E-04 4.05E-06 3.59E-06 4.21E-05 1.86E-06
500 9.09E-06 1.54E-04 3.94E-06 2.98E-06 4.21E-05 1.86E-06
Geo 1 Geo 2 Geo 3 Geo 4 Geo 5 Geo 6
0 9.41E-06 1.56E-04 4.33E-06 3.89E-06 4.41E-05 2.32E-06
1.0 9.10E-06 1.56E-04 2.63E-06 2.16E-06 1.74E-05 --
2.0 9.09E-06 1.31E-04 2.63E-06 2.12E-06 5.31E-06 --
3.0 7.60E-06 1.31E-04 2.58E-06 1.50E-06 -- --
5.0 7.54E-06 1.31E-04 2.45E-06 8.41E-07 -- --
Thermal Dose (tdu)
Overpressure (psi)
1000g Charge, Top-mounted, 60% fans
Ignited Event Frequency for Selected Consequence
1000g Charge, Top-mounted, 60% fans
Ignited Event Frequency for Selected Consequence

90
5.6.5 Context
To put the risk results in context, the range of ignited event frequencies were on the order of 10-6
to 10-7, except for the large kitchen (geometry 5) whose ignited event frequencies were an order
of magnitude larger (10-5 to 10-6). These frequencies represent all possible fire events—including
those that would result in no harm. An interesting comparison is that the average annual frequency
of being involved in a motor vehicle accident reported to the police is on the order of 10-6 per mile
based on 2015 NHTSA statistics.
Other frequency statistics can be used to get a sense of what these frequencies mean in context.
The frequency of a person getting injured due to a slip, trip, or fall is on the order of 10-2 whereas
the likelihood of building fires originating from televisions is on the order of 10-5.
The table below includes a few additional examples from various sources.
Hazard Risk per Person or
Building per Year
Source
Slip/fall injury requiring medical treatment 3E-02 CDC via Gradient [19]
Commercial building fire significant enough to
warrant fire department response
2E-02 NFDC via Gradient [19]
Commercial building fire resulting from cooking
activity
3E-03 NFDC via Gradient [19]
Fatal injury at work (all occupations) 4E-05 NSC via Gradient [19]
Injury at work due to fires or explosions 8E-06 NSC via Gradient [19]
Fires due to washing machines (UK) 1.3E-05 Waterson via Colbourne [17]
Fires due to televisions (UK) 2.7E-05 Waterson via Colbourne [17]
5.7 Discussion
In the absence of particular risk acceptance criteria (i.e. a frequency for a particular consequence—
e.g. 150 TDU at a frequency of 1x10⁻⁶), the results are presented in such a way as to provide insight
into the risk of various charge sizes relative to what is currently acceptable. As such, it was decided
to benchmark the frequency of any fire event (ignited event frequency) relative to a particular
scenario evaluated in the risk study that would be acceptable under current regulations.
5.7.1 Charge Size, Condensing Unit Location and Fan Operation
For the purposes of drawing conclusions on the risk of differing charge sizes, the scenario of a
bottom-mounted 150 g cabinet with fans on 60% of the time in the small kitchen (geometry two)
was selected as the basis for benchmarking. This benchmarking scenario represents a scenario that
would be acceptable by current regulations.
Table 5.27 shows the relative change in total ignited event frequency for top-mounted units with
fans on 60% of the time for all charge sizes and geometries compared to our benchmarking

91
scenario. Table 5.28 shows the similar results for the bottom-mounted units. The values in the
table represent the factor by which the ignited event frequency would need to be multiplied to
reach the level of the benchmarking scenario. As such, values between 0 and 1 mean that the
ignited event frequency is reduced when compared to the original scenario. Values greater than 1
mean that the ignited event frequency is greater than that of the original scenario. For example, a
value of “0.5x” means that the frequency is half that of the benchmarking scenario. The green
entries in the table represent values for which the charge size is less than 25% of the LFL when
homogeneously mixed in the room volume and the frequency of an ignition event is less than that
of the benchmarking scenario. The white (non-shaded) entries in the table are those for which the
frequency is less than that of the benchmarking scenario but the charge size would be more than
20-25% of the LFL when homogeneously mixed in the room volume. The red entries in the table
are those for which the total ignited event frequency is greater than the benchmarking scenario.
Table 5.27: Relative Change in Total Ignited Event Frequency for Top 60% vs Geo 2, bottom, 150g, 60%
Table 5.28: Relative Change in Total Ignited Event Frequency for Bottom 60% vs Geo 2, bottom, 150g, 60%
The general trend is that the total ignited event frequency of larger charge sizes is not higher than
the benchmarking scenario (which is allowed by current EPA regulations) provided that the charge
size is also limited by the room volume. The medium kitchen (geometry five) stands out in this
regard in that the kitchen is large enough from a volume perspective to have charge sizes of up to
1000 g with the homogeneously mixed concentration not exceeding 20-25% of the LFL. However,
there are various conservative assumptions of this study (discussed in Section 5.5) that if modified
or evaluated differently might change that result.
Geo 1 Geo 2 Geo 3 Geo 4 Geo 5 Geo 6
Conv. S Kitchen Deli Market M Kitchen Big Box
150g 0.1x 0.5x 0.1x 0.0x 0.4x 0.0x
300g 0.1x 1.2x 0.1x 0.1x 0.7x 0.1x
450g 0.1x 2.0x 0.1x 0.1x 1.1x 0.1x
600g 0.2x 3.1x 0.2x 0.2x 1.7x 0.1x
1000g 0.9x 15.5x 0.4x 0.4x 4.4x 0.2x
Top, 60% fans versus Geo 2, Bottom, 150g, 60% fans
Relative Change in Total Ignited Event Frequency
Charge Size
Geo 1 Geo 2 Geo 3 Geo 4 Geo 5 Geo 6
Conv. S Kitchen Deli Market M Kitchen Big Box
150g 0.1x -- 0.1x 0.1x 0.5x 0.1x
300g 0.2x 2.2x 0.2x 0.1x 0.9x 0.1x
450g 0.2x 3.6x 0.2x 0.2x 1.6x 0.1x
600g 0.3x 5.3x 0.4x 0.4x 2.4x 0.1x
1000g 0.7x 12.3x 0.7x 0.8x 5.6x 0.3x
Bottom, 60% fans versus Geo 2, Bottom, 150g, 60% fans
Relative Change in Total Ignited Event Frequency
Charge Size

92
Table 5.29 shows the relative change in total ignited event frequency for top-mounted units with
fans on 100% of the time for all charge sizes and geometries compared to our benchmarking
scenario. Table 5.30 shows similar results for bottom-mounted units. The green entries in the table
represent values for which the charge size is less than 25% of the LFL when homogeneously mixed
in the room volume and the frequency is less than that of the benchmarking scenario. The white
(non-shaded) entries in the table are those for which the frequency is less than that of the
benchmarking scenario but the charge size would be more than 25% of the LFL when
homogeneously mixed in the room volume. The red entries in the table are those for which the
total ignited event frequency is greater than the benchmarking scenario.
Table 5.29: Relative Change in Total Ignited Event Frequency for Top 100% vs Geo 2, bottom, 150g, 60%
Table 5.30: Relative Change in Total Ignited Event Frequency for Bottom 100% vs Geo 2, bottom, 150g, 60%
When changing the fans to always be on, there is some improvement to the results (as discussed
earlier); however, the general trend with respect to risk of various charge sizes is about the same.
One area of note is whether a 300g charge can be used in the small kitchen (geometry two).
Technically the charge size is just above the 20-25% LFL constraint which limits the charge size
to 238-297g; however, when the fans are on 100% of the time, the total ignited event frequency
has dropped enough to fall under that of the benchmarking scenario.
All of the results discussed so far are based on the input parameters described in Section 5.4.2. The
primary prevention and mitigation measures evaluated as part of the risk assessment are the
location of the condensing unit (top-mounted or bottom-mounted) and the fan time percentage
(fans on with compressor or always on). Neither of these measures affect one of the critical input
Geo 1 Geo 2 Geo 3 Geo 4 Geo 5 Geo 6
Conv. S Kitchen Deli Market M Kitchen Big Box
150g 0.1x 0.5x 0.1x 0.0x 0.4x 0.0x
300g 0.1x 0.9x 0.1x 0.1x 0.7x 0.1x
450g 0.1x 1.4x 0.1x 0.1x 1.1x 0.1x
600g 0.1x 2.1x 0.2x 0.1x 1.6x 0.1x
1000g 0.3x 5.0x 0.3x 0.3x 3.6x 0.2x
Charge Size
Top, 100% fans versus Geo 2, Bottom, 150g, 60% fans
Relative Change in Total Ignited Event Frequency
Geo 1 Geo 2 Geo 3 Geo 4 Geo 5 Geo 6
Conv. S Kitchen Deli Market M Kitchen Big Box
150g 0.1x 0.4x 0.1x 0.1x 0.5x 0.1x
300g 0.1x 0.8x 0.1x 0.1x 0.6x 0.1x
450g 0.1x 1.2x 0.1x 0.1x 1.1x 0.1x
600g 0.1x 1.7x 0.1x 0.1x 1.5x 0.1x
1000g 0.3x 5.2x 0.3x 0.3x 3.3x 0.3x
Charge Size
Bottom, 100% fans versus Geo 2, Bottom, 150g, 60% fans
Relative Change in Total Ignited Event Frequency
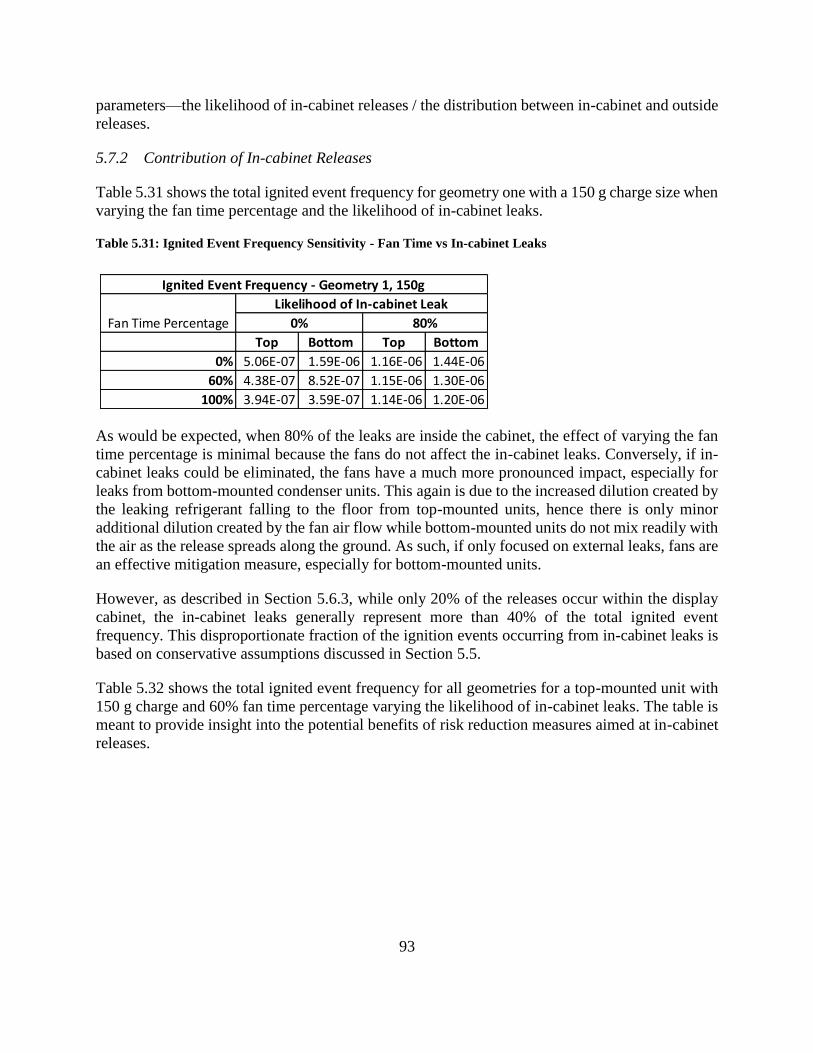
93
parameters—the likelihood of in-cabinet releases / the distribution between in-cabinet and outside
releases.
5.7.2 Contribution of In-cabinet Releases
Table 5.31 shows the total ignited event frequency for geometry one with a 150 g charge size when
varying the fan time percentage and the likelihood of in-cabinet leaks.
Table 5.31: Ignited Event Frequency Sensitivity - Fan Time vs In-cabinet Leaks
As would be expected, when 80% of the leaks are inside the cabinet, the effect of varying the fan
time percentage is minimal because the fans do not affect the in-cabinet leaks. Conversely, if in-
cabinet leaks could be eliminated, the fans have a much more pronounced impact, especially for
leaks from bottom-mounted condenser units. This again is due to the increased dilution created by
the leaking refrigerant falling to the floor from top-mounted units, hence there is only minor
additional dilution created by the fan air flow while bottom-mounted units do not mix readily with
the air as the release spreads along the ground. As such, if only focused on external leaks, fans are
an effective mitigation measure, especially for bottom-mounted units.
However, as described in Section 5.6.3, while only 20% of the releases occur within the display
cabinet, the in-cabinet leaks generally represent more than 40% of the total ignited event
frequency. This disproportionate fraction of the ignition events occurring from in-cabinet leaks is
based on conservative assumptions discussed in Section 5.5.
Table 5.32 shows the total ignited event frequency for all geometries for a top-mounted unit with
150 g charge and 60% fan time percentage varying the likelihood of in-cabinet leaks. The table is
meant to provide insight into the potential benefits of risk reduction measures aimed at in-cabinet
releases.
Top Bottom Top Bottom
0% 5.06E-07 1.59E-06 1.16E-06 1.44E-06
60% 4.38E-07 8.52E-07 1.15E-06 1.30E-06
100% 3.94E-07 3.59E-07 1.14E-06 1.20E-06
Ignited Event Frequency - Geometry 1, 150g
Likelihood of In-cabinet Leak
0% 80%Fan Time Percentage

94
Table 5.32: Sensitivity of Ignited Event Frequency to Likelihood of In-cabinet Leaks, 150g, Top, 60% fans
Geo 1 Geo 2 Geo 3 Geo 4 Geo 5 Geo 6
Conv. S Kitchen Deli Market M Kitchen Big Box
0% 4.38E-07 2.70E-06 3.61E-07 2.70E-07 9.14E-07 2.36E-07
5% 4.83E-07 3.27E-06 4.09E-07 3.23E-07 1.57E-06 2.90E-07
10% 5.27E-07 3.84E-06 4.57E-07 3.76E-07 2.23E-06 3.45E-07
20% 6.15E-07 4.98E-06 5.53E-07 4.81E-07 3.55E-06 4.53E-07
40% 7.92E-07 7.26E-06 7.45E-07 6.91E-07 6.19E-06 6.70E-07
80% 1.15E-06 1.18E-05 1.13E-06 1.11E-06 1.15E-05 1.10E-06
100% 1.32E-06 1.41E-05 1.32E-06 1.32E-06 1.41E-05 1.32E-06
Geo 1 Geo 2 Geo 3 Geo 4 Geo 5 Geo 6
0% 0.71x 0.54x 0.65x 0.56x 0.26x 0.52x
5% 0.78x 0.66x 0.74x 0.67x 0.44x 0.64x
10% 0.86x 0.77x 0.83x 0.78x 0.63x 0.76x
20% -- -- -- -- -- --
40% 1.29x 1.46x 1.35x 1.44x 1.74x 1.48x
80% 1.86x 2.37x 2.04x 2.31x 3.23x 2.44x
100% 2.15x 2.83x 2.39x 2.75x 3.97x 2.92x
Top-mounted, 60% fans, 150g charge
Relative Difference in Total Frequency compared to 20%
Probability of
In-cabinet Leaks
Ignited Event Frequency
Probability of
In-cabinet Leaks

95
Table 5.33 presents similar data but for a 1000g charge size.
Table 5.33: Sensitivity of Ignited Event Frequency to Likelihood of In-cabinet Leaks, 150g, Top, 60% fans
When the comparison is made for the 1000 g charge, one of the first things to notice is that the two
smallest geometries are not sensitive to this variable because the consequences of the external
releases catch up to the consequences of the in-cabinet releases. This is aligned with that 1000 g
is too much charge for the room size regardless of the details of the release mechanism. When
looking at a geometry more appropriately sized for the charge size, e.g. geometry six (the big box
grocery store), there is a 75% reduction in the ignited event frequency when changing the in-
cabinet leak percentage from 20% to 0%. The purpose of the example is to demonstrate the
sensitivity of the model to in-cabinet leaks and that mitigating in-cabinet leaks (and accounting for
that in the risk model) would result in a sizable effect on the overall risk. The example also
demonstrates that in-cabinet leaks are a significant risk driver for very large rooms since external
leaks can more readily disperse and mix below the LFL.
5.7.3 Conservatism
As discussed in Section 5.5, the complexity of the study necessitated making conservative
assumptions. Consequently, it is expected that the risk results in this study are conservatively
higher, mostly because:
Geo 1 Geo 2 Geo 3 Geo 4 Geo 5 Geo 6
Conv. S Kitchen Deli Market M Kitchen Big Box
0% 9.35E-06 1.56E-04 3.07E-06 2.52E-06 1.58E-05 5.71E-07
5% 9.36E-06 1.56E-04 3.39E-06 2.86E-06 2.29E-05 1.01E-06
10% 9.38E-06 1.56E-04 3.70E-06 3.20E-06 3.00E-05 1.45E-06
20% 9.41E-06 1.56E-04 4.33E-06 3.89E-06 4.41E-05 2.32E-06
40% 9.46E-06 1.57E-04 5.59E-06 5.25E-06 7.25E-05 4.08E-06
80% 9.58E-06 1.58E-04 8.11E-06 7.99E-06 1.29E-04 7.58E-06
100% 9.64E-06 1.59E-04 9.37E-06 9.36E-06 1.57E-04 9.33E-06
Geo 1 Geo 2 Geo 3 Geo 4 Geo 5 Geo 6
0% 0.99x 1.00x 0.71x 0.65x 0.36x 0.25x
5% 1.00x 1.00x 0.78x 0.74x 0.52x 0.43x
10% 1.00x 1.00x 0.85x 0.82x 0.68x 0.62x
20% -- -- -- -- -- --
40% 1.01x 1.00x 1.29x 1.35x 1.64x 1.75x
80% 1.02x 1.01x 1.87x 2.06x 2.92x 3.26x
100% 1.02x 1.02x 2.16x 2.41x 3.57x 4.02x
Top-mounted, 60% fans, 1000g charge
Ignited Event Frequency
Relative Difference in Total Frequency compared to 20%
Probability of
In-cabinet Leaks
Probability of
In-cabinet Leaks
96
• All geometries were assumed to be air-tight (i.e. no ventilation due to doors, windows, or
other passive ventilation) with no HVAC or mechanical ventilation
• All impinging leaks were represented as diffuse leaks (having near-zero momentum)
• In-cabinet releases were always represented by the worst-case of releasing the entire charge
into a completely sealed cabinet prior to opening the door and taking the cloud
characteristics at the point in time for which the accumulated fuel volume is maximized
• Ignition likelihood is based on the peak accumulated fuel volume without accounting for
how quickly the volumes mix with air and dissipate.
• All leaks resulted in the entire charge being leaked
• All leaks were assumed to be at a constant flow rate (leak rates did not include effects of
depressurization and/or evaporative cooling)
6 Summary and Recommendations
6.1 Main Findings from the Risk Study
• As charge size increases, the frequency of an ignition event increases since the mass of
R-290 available to accumulate within the space also increases.
• Servicing generally represents a small contribution to the overall ignited event frequency
assuming that the refrigerant is either recovered or vented prior to servicing and that proper
procedures are followed.
• The ignited event frequency is 1.2-2.0 times lower when condensing units are top-mounted
compared to bottom-mounted.
• There is only a marginal benefit to running the condensing unit fan all the time when the
condensing unit is top-mounted.
• It is more beneficial to run the condensing unit fan all the time for bottom-mounted units.
For example, the ignited event frequency is up to 3.2 times lower for the fans 100% on
compared to 60% on for bottom-mounted units.
• The likelihood of fire events becomes similar for bottom-mounted and top-mounted units
when the condensing unit fan is operated continuously.
• Current regulations allow the use of 150 g charge sizes in retail environments, which
includes small kitchens. As the surface area of the commercial space increased, the study
showed it was possible to scale up to larger charge sizes while maintaining the total ignited
event frequency equivalent to or less than that obtained for small kitchens using 150 g
charges. The scaling was somewhat inhibited for larger kitchens due to the high density
of ignition sources.
• In-cabinet releases represent a large portion of the risk for closed display cases in large
rooms.
97
6.2 Leaks
Loss of containment - external leaks
R-290 leaks from a closed-loop vapor compression cycle will almost always initially have high
velocity and momentum due to the high pressures within the system. The velocity from the jet will
remain sufficiently high to entrain air into the refrigerant jet, enhancing mixing with air and
increasing dilution. If the charge is sized properly relative the room, and a free jet release occurs,
the concentration of R-290 homogeneously mixed within the entire room volume will remain
below flammable levels. In contrast, if a jet impinges on a nearby surface or obstruction, the
velocity and momentum of the jet will be significantly reduced. For example, when leaks occur
inside the condenser unit housing, the released jet can impinge on nearby surfaces or on the
housing walls thus reducing the momentum of the release. These low momentum leaks will have
only limited mixing with air and can result in R-290 accumulation above the LFL in volumes
remote from the leak, particularly along the floor.
Condensing unit location – external leaks
The results of the current study show that risk from leaks external to refrigerated display cases in
the vicinity of the condensing unit are dominated by “low momentum” releases, which occur when
high pressure releases impinge on a surface in the vicinity of the release. Low momentum releases
result in reduced mixing with air and the accumulation of refrigerant fuel layers in the space where
the display case is installed. Low momentum leaks from bottom-mounted condensers can create
fuel-rich layers that spread across the floor, whereas such leaks from top-mounted condensers tend
to mix slightly more with air as the released fluid falls to the ground, which results in accumulated
fuel layers being taller and having lower fuel concentrations. When the leak rate is small, and there
is no external ventilation, releases from bottom-mounted condensing units can still form fuel-rich
layers whereas releases from top-mounted condensing units will generally dilute below flammable
levels. In contrast, free jet releases have enough momentum to homogeneously mix the released
refrigerant with air, thus diluting concentrations below flammable levels if the room is sized
properly.
The results demonstrate that under normal operation (compressor/condensing unit fan in operation
60% of the time), the likelihood of having an ignition event with a display case having a bottom-
mounted condensing unit is 1.2-2.0 times higher than one with a top-mounted condensing unit.
When condensing units are top-mounted, components of the refrigeration circuit are located higher
up from the floor. Therefore, external leaks will typically occur higher up which is beneficial in
terms of facilitating mixing and reducing the accumulated fuel volumes, especially for the smaller,
more frequent leaks.
The results further show that when the condensing unit fan is continuously operated, external low
momentum leaks are less likely to result in accumulated fuel volumes in the space where a display
case is located. Fan operation provides additional mixing and helps dilute the refrigerant
concentrations to below flammable levels for leaks at both top- and bottom-mounted condensing
units. Since there is very limited mixing from low momentum leaks at a bottom-mounted

98
condensing unit, the dilution effect from the fan is especially notable. In fact, if the condenser fan
is in constant operation there is essentially no difference in the likelihood of an ignition event for
display cases with top- or bottom-mounted condensing units.
Internal leaks
Refrigerant charges are sized for the required cooling of the display case and will scale with the
size of the display case. In most cases, if the entire charge is released into a closed display case
the resulting concentrations will be right near the upper limit of flammability for R-290. Hence,
the type of release (jet or low momentum) or whether the evaporator fan is in operation will have
little effect on the resulting accumulated volume of refrigerant in the display case. In addition,
this further confirms that all equipment within the cabinet should be rated for explosive
atmospheres (explosion proof or Ex proof). For open refrigerated display cases (not evaluated in
the present study), this will not be the case and internal releases will be more like external leaks.
Under ideal conditions where there is no external air infiltration into a closed display case, the
resulting accumulated fuel volume is only dependent on the charge size and volume of the display
case. In addition, the current analysis shows that the risk associated with the use of R-290 in closed
display cases can be very sensitive to internal releases due to their potentially severe consequences.
For example, the likelihood of an ignition event is reduced by a factor of 4 if the current assumption
that 20% of all leaks occur within the display case is reduced to 0%. This however is largely due
to the assumptions resulting in conservatively larger risk, namely that the probability and severity
of an ignition event are based on the maximum accumulated fuel volume and do not account for
the transient nature of the release. For example, a 12 g/min external bottom release will take
approximately 50 minutes to release 600 g of R-290 charge and result in a similar accumulated
mass as a release in the cabinet, which, when suddenly released as the door is open, remains only
for 10-20 seconds before diluting.
6.3 Preliminary Recommendations to Reduce Risks
One way of reducing risk is to reduce the likelihood of having a release altogether. While this
aspect is beyond the scope of the present study, one recommendation may include continuing the
practice of joining components in the refrigeration circuit using brazed connections to reduce the
likelihood of leaks and improve the quality of brazed connections.
Methods of Reducing Risk of External Leaks
Condensing unit fan operation
It is recommended to operate the condensing unit fan continuously or near continuously to reduce
the likelihood of external low momentum leaks resulting in accumulated fuel volume in the space
where the display case is located. As the fan provides additional mixing and dilution, it is
recommended that it be operational at a minimum during the leak itself. Therefore, if it is not
possible to keep the condensing unit fan continuously operational, an alternate design would be to
activate the fan on leak detection. The effectiveness of such systems should be thoroughly tested
with advanced CFD or experimental studies.

99
Another possible mitigation measure that was outside scope of the present study, would be the use
mechanical ventilation in the commercial space to help dilute any external release of R-290. For
example, installations may require that the use of such a unit requires a minimum level of air-
changes-per hour within the space or upon confirmed gas detection, mechanical ventilation is
activated.
Condensing unit location
The risk assessment has shown that top-mounted condenser location results in reduced ignited
event frequencies due to the mixing benefit of the height of the condenser. Assuming the fans are
always running, there is not a significant difference between the results for top and bottom-
mounted condensing unit locations; however, the top-mounted condensing unit location should be
preferred. The reason for this is that the selection of condensing unit location is a passive safety
measure that in and of itself cannot fail. Although fan failure rates are relatively low, a fan failure
would result in the loss of a critical safety measure, and the failed fan may act as a potential ignition
source.
By selecting top-mounted condensing unit location when possible, it acts as a passive safety
measure on its own.
Maximum charge size
Charge size limits should be based on display case design and the size of the room where the
display case is to be located. Important equipment design aspects include whether the condensing
unit is bottom- or top-mounted and whether the condenser fan (if equipped) is set to continuously
operate or operate upon leak detection. Units without fans might require smaller maximum charge
sizes without demonstrating that sufficient mixing occurs—which may require further design
changes and testing.
Smaller charge sizes should be used if fan operation is not continuous. If the condensing unit fan
can be continuously operated, then both top-mounted and bottom-mounted units can be designed
with larger charges, yet should be limited by some threshold value of the LFL (e.g., 20-25% LFL).
Methods of Reducing Risk of Internal Leaks
The potential consequences of a leak inside a closed display case are independent of condensing
unit location and condenser fan operation. In both open and closed display cases, use only
equipment components rated for explosive environments (e.g., ATEX or NEC explosion certified)
to reduce the likelihood of ignition. Use equipment components rated for hazardous locations
involving flammable gas in accordance with nationally recognized standards.
Based on equipment specifications provided by the technical panel, a leak of the entire charge that
mixes homogenously inside a closed cabinet results in R-290 concentrations near the UFL. One
method to reduce the risk is to ensure that the accumulated fuel volume is diluted prior to the door
being opened. This could possibly be accomplished by passive or active mitigation methods. One
possible passive method is to design passive venting near the base of the cabinet that provides a

100
low air change rate within the cabinet, which could help dilute refrigerant levels especially for
smaller leaks that are more likely.
A possible active method would be to install a leak detection mechanism, and upon confirmed leak
detection, activate an extraction fan that exhaust the contents within the cabinet into the room
where the display case is located. Ideally, the contents should be vented out of the conditioned
space upward to ensure maximum mixing and dilution in the room. This can reduce the likelihood
and severity of ignition events inside the cabinet and when a closed display case cabinet is opened
after an internal leak has occurred. The possibility of locking the cabinet doors and shutting down
all electronics upon confirmed leak detection could also be explored. However, these and
additional possible mitigation mechanisms are a topic for further study.
7 Future Work
The present risk results are conservative because we assume: (1) rooms are completely sealed
with no infiltration; (2) no mechanical ventilation; (3) the leak rate remains constant at the
maximum initial value and does not decrease due to depressurization or evaporative cooling within
the system; (4) the entire charge is released during the event; and (5) ignition occurs after the entire
charge has been released at the time when the cloud size is maximized. Under these assumptions,
flammable volumes can form from small leaks that would otherwise dissipate and disperse if there
were additional mixing due to room ventilation. This is particularly true in commercial kitchens
as they generally have high air change rates (suggested sufficient ventilation is 20-40 ACH in ref.
[22]). In addition, the resulting accumulated fuel volumes will be larger due to the constant leak
rates that do not diminish with time.
Follow-on work could include establishing realistic air change rates for the commercial
environments of interest and incorporating them into CFD simulations to see the influence on
accumulated fuel volumes from low momentum releases. The CFD model used in the present study
can simulate refrigerant leaks while also simulating room infiltration. In addition, if room
ventilation cannot be guaranteed, an installation may require that confirmed gas detection
automatically activates mechanical ventilation within the volume. Future work may be to ensure
this approach is most effective, by thoroughly testing gas detection systems with advanced CFD
or through experimentation. There are several important design aspects that can be evaluated with
these methods, such as optimized sensor placement, activation thresholds, and timing of activated
mitigation methods. Additional work should also aim to evaluate the effect of proximity to ignition
sources in scenarios that include realistic ventilation.
The risk study has shown that the consequences of an external leak are lower when the condensing
unit fan is on during the leak. A way to accomplish this would be to ensure the condensing unit
fan remains in operation or to detect leaks and activate the fans upon detection of a leak. Similar
to mechanical ventilation, in order for this approach to be most effective, leak detection systems
should be thoroughly tested with advanced CFD or through experimentation. There are several
important design aspects that can be evaluated with these methods including optimized sensor
placement, activation thresholds, and timing of activated mitigation methods.

101
Another area of future work could be to reduce the conservativeness of how the consequences of
in-cabinet releases are modeled. As discussed above, conservative accumulated fuel volumes are
likely considered in the present study as all closed display cases are assumed to be air tight, hence
the same accumulated cloud regardless of the leak rate. This assumption means that a 0.1 g/min
leak will have the same consequences as a 100 g/min release and will not hold true when there is
some air exchange rate with the environment, which reduces the size of the accumulated fuel
volume, especially for small leak rates. As mentioned previously, air infiltration rates for
magnetically sealed domestic refrigerators have been experimentally determined in other studies.
The conservatism in ignited consequences for in-cabinet leaks can be further reduced by
accounting for the considerably fast transient decay in accumulated fuel volume after the cabinet
door is opened. In the current model, it is assumed the that the maximum accumulated fuel volume
is always ignited. Incorporating a time dependent ignition model would also likely reduce the
degree of conservativism of the risk model for external leaks.
Follow-on work should also include dispersion experiments with leaks from an operating and idle
refrigerant compression cycle. This would help establish transient leak rates both in the vapor and
liquid segments of the cycle for a range of cooling capacity units (i.e., with varying charge sizes).
Tests could be performed to not only quantify the transient leak while in operation and while idle,
but also to evaluate the influence transient leak rates have on the outcome of a leak and subsequent
consequences.
The risk assessment assumed all impinged releases had essentially no momentum. Depending on
several details, such as how far from the leak a release impinges on a surface, leaks can have
different reduced momentums compared to a free jet. Real releases could be modeled or examined
through experimentation to establish a probability for more intermediate levels of leak momentum
than considered in the present study.

102
References
1. Colbourne, D., Interpretation of results from DUH/DMT tests in relation to proposed
requirements, IEC SC 61C WG4. Berlin, April 2016.
2. Colbourne, D. and K. Suen. R290 Concentration arising from leaks in commercial
refrigeration cabinets. in Gustav Lorentzen Natural Working Fluids Conference. 2016.
Edinburgh.
3. Jabbour, T. and D. Clodic. Ignition Tests of flammable refrigerant leaks in ventilated and
unventilated rooms. in Gustav Lorentzen Conference on Natural Working Fluids. 2002.
Guangzhou, China.
4. Li, T., Indoor leakage test for safety of R-290 split type room air conditioner. International
Journal of Refrigeration, 2014. 40: p. 380-389.
5. Zhang, W., et al., Research on the flammability hazards of an air conditioner using
refrigerant R-290. International Journal of Refrigeration, 2013. 36(5): p. 1483-1494.
6. Colbourne, D. and K. Suen, Equipment design and installation features to disperse
refrigerant releases in rooms—part I: experiments and analysis. International journal of
refrigeration, 2003. 26(6): p. 667-673.
7. Kataoka, O., et al., Experimental and numerical analyses of refrigerant leaks in a closed
room. ASHRAE transactions, 1999. 105: p. 1151.
8. Laughman, C., P. Grover, and S. Nabi. A study of refrigerant dispersion in occupied spaces
under parametric variation. in ASHRAE Annual Conference. 2015.
9. Kataoka, O., M. Yoshizawa, and T. Hirakawa. Allowable charge calculation method for
flammable refrigerants. in International Refrigeration and Air Conditioning Conference.
2000. Purdue University.
10. Zhang, W., et al., Study of the explosion characteristics and combustion products of air
conditioner using flammable refrigerants. Journal of Fire Sciences, 2015. 33(5): p. 405-424.
11. Zhang, W., et al., Experimental research on the explosion characteristics in the indoor and
outdoor units of a split air conditioner using the R290 refrigerant. International Journal of
Refrigeration, 2016. 67: p. 408-417.
12. Cleaver, R., M. Marshal, and P. Linden, The build-up of concentration within a single
enclosed volume following a release of natural gas. Journal of hazardous materials, 1994.
36(3): p. 209-226.
13. Nagaosa, R.S., A new numerical formulation of gas leakage and spread into a residential
space in terms of hazard analysis. Journal of hazardous materials, 2014. 271: p. 266-274.
14. Goetzler, W. and J. Burgos, Study of Input Parameters for Risk Assessment of 2L Flammable
Refrigerants in Residential Air Conditioning and Commercial Refrigeration Applications.
ASHRAE 1580. 2012.
15. Goetzler, W. and J. Burgos, Study of Input Parameters for Risk Assessment of 2L Flammable
Refrigerants in Residential Air-Conditioning and Commercial Refrigeration Applications.
ASHRAE Transactions, 2014. 120: p. 437.
16. HSE, Methods of approximation and determination of human vulnerability for offshore
major accident hazard assessment. 2011.
17. Colbourne, D. and K. Suen, Appraising the flammability hazards of hydrocarbon
refrigerants using quantitative risk assessment model. Part II. Model evaluation and
analysis. International journal of refrigeration, 2004. 27(7): p. 784-793.
103
18. Colbourne, D. and L. Espersen, Quantitative risk assessment of R290 in ice cream cabinets.
International Journal of Refrigeration, 2013. 36(4): p. 1208-1219.
19. Lewandowski, T.A., Risk Assessment of Refrigeration Systems Using A2L Flammable
Refrigerants. AHRI 8009. 2015.
20. De Haag, P.U. and B. Ale, Guidelines for Quantitative Risk Assessment: Purple Book. 2005:
Ministerie van Volkshuisvesting en Ruimtelijke Ordening (VROM).
21. Afonso, C. and M. Castro, Air infiltration in domestic refrigerators: The influence of the
magnetic seals conservation. international journal of refrigeration, 2010. 33(4): p. 856-867.
22. McMullan, R., Environmental science in building. 2012: Palgrave macmillan.

104
Appendix A - FLACS Dispersion Predictions Versus Measurements
Figure A.1 through Figure A.8 demonstrate the agreement between FLACS predictions and
measurements for the wide range of leak conditions specified during testing. In each figure, solid
lines of the same color represent the experimental data (solid lines) and predictions (dashed lines)
at a specific sensor. The data are separated into four figures corresponding to the height of the
sensors.
Example prediction agreement for releases below the display case
Figure A.1: Typical agreement for bottom releases - 600 g, 120 g/min, condenser fan off.
Example prediction agreement for releases above the display case
Figure A.2: Top release, 1000 g, 120 g/min, condenser fan off.
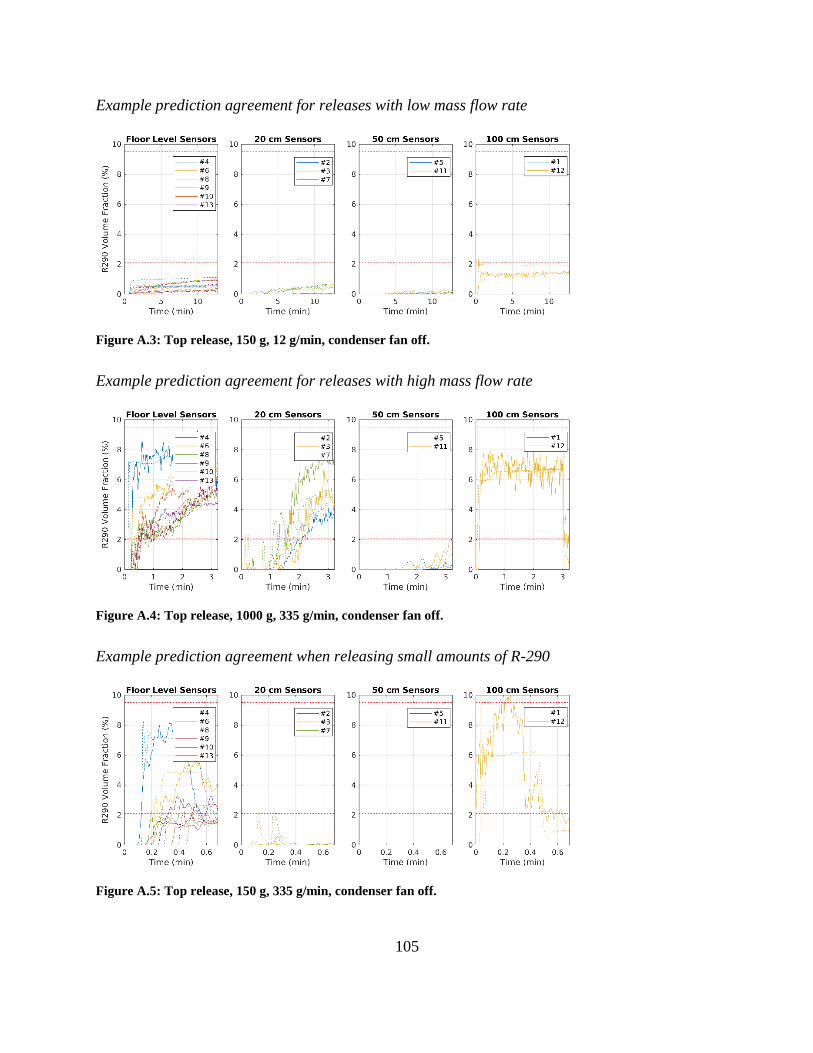
105
Example prediction agreement for releases with low mass flow rate
Figure A.3: Top release, 150 g, 12 g/min, condenser fan off.
Example prediction agreement for releases with high mass flow rate
Figure A.4: Top release, 1000 g, 335 g/min, condenser fan off.
Example prediction agreement when releasing small amounts of R-290
Figure A.5: Top release, 150 g, 335 g/min, condenser fan off.

106
Example prediction agreement when releasing large amounts of R-290
Figure A.6: Bottom release, 1000 g, 120 g/min, condenser fan off.
Example prediction agreement when condenser fan flow rate is low and the R-290 release mass
flow rate is high
Figure A.7: Bottom release, 150 g, 335 g/min, condenser fan on at 150 m3/hr.
Example prediction agreement when condenser fan flow rate is high and the R-290 release mass
flow rate is low
Figure A.8: Bottom release, 1000 g, 12 g/min, condenser fan on at 1000 m3/hr.

107
Figure A.9 and Figure A.10 show the largest observed discrepancies between the predictions and
measurements to further demonstrate the suitability of FLACS for predicting R-290 releases from
a display case. As seen in the figures, predictions are roughly a factor of two or three higher at a
few sensors at the floor, however much closer agreement is still observed for the majority of the
sensors, and for all sensors located above the floor.
Largest observed discrepancy when the condenser fan was off
Figure A.9: Top release, 300 g, 120 g/min, condenser fan off.
Largest observed discrepancy when the condenser fan was on
Figure A.10: Bottom release, 150 g, 120 g/min, condenser fans on.

108
Appendix B - Failure Mode Effects Analysis
Gexcon performed a Failure Modes and Effect Analysis (FMEA) to assess the mechanisms by
which refrigerant charges may be accidentally released to the surrounding environment. The
FMEA assists in identifying the critical causes and areas associated with releases.
The FMEA is organized by component areas or systems. Instead of looking at each individual
component of a refrigeration system, the components expected in a commercial refrigeration unit
were grouped into systems or areas as shown in Figure B.1 and listed in Table B.1. For example,
the compressor compartment area consists of over a dozen individual components. As such, a
failure of any subcomponent is captured as part of the compressor compartment rather than as an
individual line item in the FMEA. However, there is significant detail as the impact of many failure
modes were applied to each of these areas and their corresponding components.
Figure B.1: Area classification diagram showing the six groupings used in the FMEA. Selected components of
a typical refrigeration system are shown within the general schematic.

109
Table B.1: Area classification and components within each area.
System / Area
Consists of the following components (systems vary
and some components listed may not exist in certain
applications):
Compressor Compartment compressor motor
compressor
shaft
shaft seals
hermetic enclosure
suction and discharge fittings
internal piping / castings
electrical connections / wiring
structural elements and mounting provisions
oil reservoir system
crankcase pressure regulator (CPR) valve
pressure relief valve
ventilation fan
Discharge Vapor Line tube length to condenser
fill and monitor valve
mechanical connection to compressor discharge
mechanical connection to condenser
brazed or welded connections
oil separator
Condenser coiled tube length
cooling fins
structure
fan system
mechanical joints
brazed joints
Discharge liquid Line tube length to evaporator
fill and monitor valve
mechanical connection to condenser discharge
mechanical connection to expansion valve
brazed or welded connections
sight glass
receiver
drier
discharge gas bypass
discharge gas bypass solenoid valve
shut-off valve
moisture indicator
solenoid valve
Evaporator expansion valve
mechanical connections
brazed connections
structure
fan system
coiled tube length
cooling fins
equalizer line

110
System / Area
Consists of the following components (systems vary
and some components listed may not exist in certain
applications):
Suction Line tube length to compressor
fill and monitor valve
mechanical connection to compressor suction
mechanical connection to evaporator discharge
brazed or welded connections
suction accumulator
EPR valve
With the component areas defined, each one is considered with regard to the failure modes as
defined in Table B.2. The approach is such that every component within the area (e.g., compressor
shaft seals within the compressor compartment area) is considered against every possible failure
mode. It should be noted that in many self-contained refrigeration systems, the first three areas are
co-located (Compressor Compartment, Discharge Vapor Line and the Condenser); however, in the
interest of a comprehensive and more generally applicable FMEA, these were considered
individually.
Table B.2: Established failure modes considered.
Failure Modes Description
Leaking Pipe (hole) Line pipe runs, holes and other leaks occurring at the pipe walls, includes brazed joints
Seal / Gland / Core Failure Leaking valves and shaft seals, other gaskets
Fracture / Rupture / Crack Pressure relief valve blowing open, cracked receivers, fractured valve bodies
Mechanical Component Failure Complete major component failure, such as a compressor bearing
Ancillary Component Failure Sub-systems such as fans or pumps
Leaking Flange / Union / Joint Mechanical joints, flare connections, compression connections, quick connections
Wall / Case / Housing Thinning Wall thinning includes abrasion, wear, and general material loss
Monitor / Control hardware Pressure switches, transducers, gages, etc.
If a failure mode exists for a given area, a cause is specifically identified. The possible causes are
applicable to the failure mode under consideration. It is frequent for a cause to be identified across
several failure modes (e.g., corrosion). For a more specific example, wall thinning can be caused
from an internal source (e.g., contaminant in the refrigerant) or external one (e.g., rubbing).
With the failure modes and potential causes captured, the associated effects were determined. As
discussed, the effects appropriate for this research program were limited to refrigerant releases and
ignitions sources. If a failure could lead to either of these effects, it was entered into the FMEA. If
a failure mode could potentially result in effects beyond loss of refrigerant charge and/or potential
source of ignition, those additional effects were not entered.
This process was repeated for every operational mode of a refrigeration system, which are
presented in Table B.3.
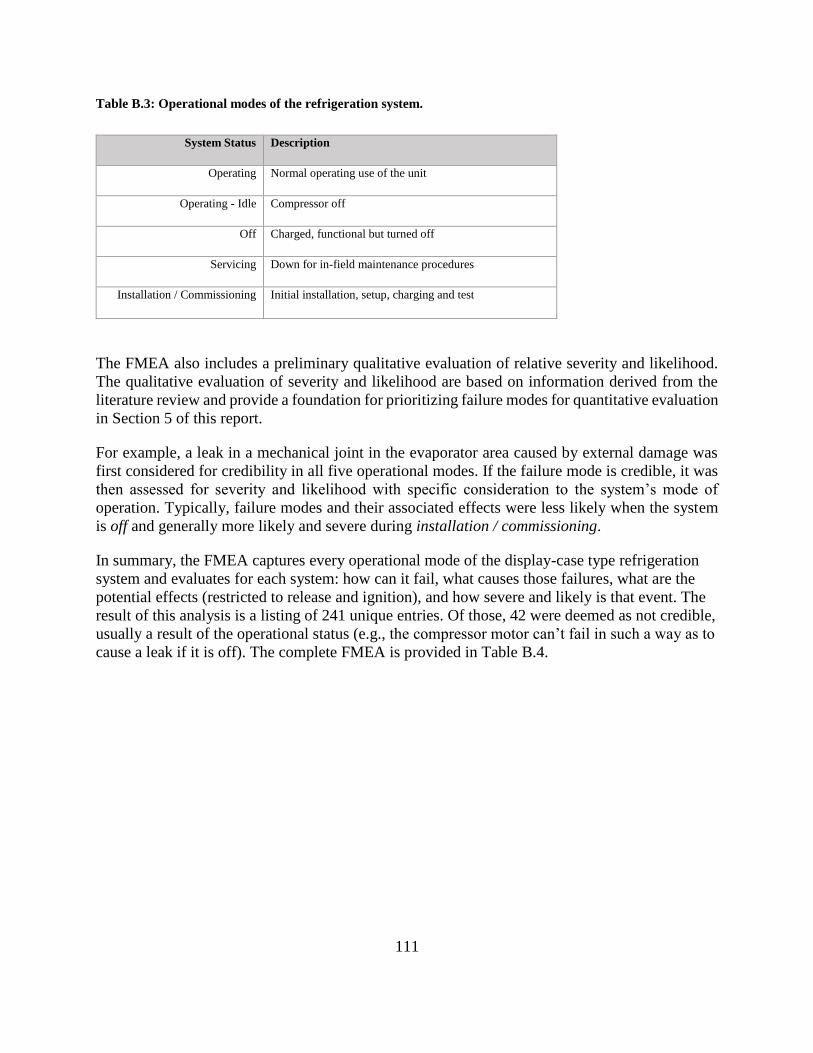
111
Table B.3: Operational modes of the refrigeration system.
System Status Description
Operating Normal operating use of the unit
Operating - Idle Compressor off
Off Charged, functional but turned off
Servicing Down for in-field maintenance procedures
Installation / Commissioning Initial installation, setup, charging and test
The FMEA also includes a preliminary qualitative evaluation of relative severity and likelihood.
The qualitative evaluation of severity and likelihood are based on information derived from the
literature review and provide a foundation for prioritizing failure modes for quantitative evaluation
in Section 5 of this report.
For example, a leak in a mechanical joint in the evaporator area caused by external damage was
first considered for credibility in all five operational modes. If the failure mode is credible, it was
then assessed for severity and likelihood with specific consideration to the system’s mode of
operation. Typically, failure modes and their associated effects were less likely when the system
is off and generally more likely and severe during installation / commissioning.
In summary, the FMEA captures every operational mode of the display-case type refrigeration
system and evaluates for each system: how can it fail, what causes those failures, what are the
potential effects (restricted to release and ignition), and how severe and likely is that event. The
result of this analysis is a listing of 241 unique entries. Of those, 42 were deemed as not credible,
usually a result of the operational status (e.g., the compressor motor can’t fail in such a way as to
cause a leak if it is off). The complete FMEA is provided in Table B.4.

112
Table B.4: List of potential failures.
No. Component
Area
Failure Mode Potential Cause(s) Effect(s) State Severity Likelihood
1.01 Compressor
Compartment
Seal / Gland /
Core Failure
seal blow-by due to
a) excessive pressure cycling b) excessive wear
c) motor runaway causing over-pressurization
Seal wear / degradation due to
d) age, cycles, use
e) loss of resiliency in flexible seals
a) moderate release of R290 charge into the
compressor compartment
Operating III I
1.02 Compressor
Compartment
Leaking Pipe
(hole)
pipe wall integrity degradation due to
a) over-pressurization
b) external damage c) corrosion
brazed joint failure due to
d) stress cracking e) filler metal voids / porosity
f) base metal erosion in brazed joint
a) slow to rapid release of R290 charge into
the compressor compartment
Operating III II
1.03 Compressor
Compartment
Fracture /
Rupture / Crack
compressor enclosure crack due to
a) excessive thermal cycles
b) excessive vibrations c) external damage
over-pressurization leading to
d) PSV actuation e) breached hermetic seal
a) slow to rapid release of R290 charge into
the compressor compartment
Operating III I
1.04 Compressor Compartment
Mechanical Component
Failure
Compressor failure sufficient to breach hermetic seal (not including shaft seal failures
which are considered elsewhere)
a) electric motor failure
b) bearing failure
c) shaft failure
d) support structure failure e) compressor impeller / rotator failure
a) moderate to rapid release of R290 charge into the compressor compartment
b) potential source of ignition
Operating II I
1.05 Compressor Compartment
Ancillary Component
Failure
complete subsystem failure (excluding cracked or fractured case which is considered
elsewhere)
a) PSV failure b) compressor compartment ventilation fan
failure
c) oil reservoir and separator failure
a) slow to rapid release of R290 charge into the compressor compartment
b) potential source of ignition
c) reduced ventilation in compressor compartment (if fan failure)
d) release of oil into compressor
compartment
Operating III III

113
No. Component
Area
Failure Mode Potential Cause(s) Effect(s) State Severity Likelihood
1.06 Compressor
Compartment
Leaking Flange
/ Union / Joint
mechanical connection failure due to
a) excessive stress
b) external damage c) corrosion
d) seal deterioration (ferrule, flare or face seal
as applicable)
a) slow to moderate release of R290 charge
into the compressor compartment
Operating II IV
1.07 Compressor
Compartment
Abrasion / Wear
/ Wall Thinning
specific pipe/tube failure due to wall thinning
(excludes hole failure modes addressed
elsewhere). External thinning due to
a) contact abrasion (rubbing)
b) atmospheric debris (such as sand) pitting and abrasion
Internal thinning due to
c) flow abrasion / contaminate in refrigerant d) cavitation
e) high speed flow
f) excessively cold flow causing embrittlement
a) slow to moderate release of R290 charge
into the compressor compartment
Operating II III
1.08 Compressor
Compartment
Monitor /
Control
hardware
gauge / switch failure due to
a) over-pressurization
b) excessive cycles (amplitude or frequency)
fatigue c) extreme temperature / pressure conditions
d) corrosion
e) seal failure f) external damage
g) high voltage
a) slow to rapid release of R290 charge into
the compressor compartment
Operating III II
1.09 Compressor
Compartment
Leaking Pipe
(hole)
pipe wall integrity degradation due to
a) over-pressurization b) external damage
c) corrosion
brazed joint failure due to d) stress cracking
e) filler metal voids / porosity
f) base metal erosion in brazed joint
a) slow release of R290 charge into the
compressor compartment
Operating - idle II I
1.10 Compressor
Compartment
Seal / Gland /
Core Failure
seal blow-by due to
a) excessive pressure cycling b) excessive wear
c) motor runaway causing over-pressurization
Seal wear / degradation due to d) age, cycles, use
e) loss of resiliency in flexible seals
a) slow release of R290 charge into the
compressor compartment
Operating - idle II II

114
No. Component
Area
Failure Mode Potential Cause(s) Effect(s) State Severity Likelihood
1.11 Compressor
Compartment
Fracture /
Rupture / Crack
compressor enclosure crack due to
a) excessive thermal cycles
b) excessive vibrations c) external damage
over-pressurization leading to
d) PSV actuation e) breached hermetic seal
a) slow to moderate release of R290 charge
into the compressor compartment
Operating - idle II I
1.12 Compressor
Compartment
Mechanical
Component
Failure
Compressor failure sufficient to breach
hermetic seal (not including shaft seal failures
which are considered elsewhere) a) electric motor failure
b) bearing failure
c) shaft failure d) support structure failure
e) compressor impeller / rotator failure
a) moderate to rapid release of R290 charge
into the compressor compartment
b) potential source of ignition
Operating - idle I I
1.13 Compressor Compartment
Ancillary Component
Failure
complete subsystem failure (excluding cracked or fractured case which is considered
elsewhere)
a) PSV failure b) compressor compartment ventilation fan
failure
c) oil reservoir and separator failure
a) slow to rapid release of R290 charge into the compressor compartment
b) potential source of ignition
c) reduced ventilation in compressor compartment (if fan failure)
d) release of oil into compressor
compartment
Operating - idle III III
1.14 Compressor
Compartment
Leaking Flange
/ Union / Joint
mechanical connection failure due to
a) excessive stress
b) external damage c) corrosion
d) seal deterioration (ferrule, flare or face seal
as applicable)
a) slow to moderate release of R290 charge
into the compressor compartment
Operating - idle II III
1.15 Compressor
Compartment
Abrasion / Wear
/ Wall Thinning
specific pipe/tube failure due to wall thinning
(excludes hole failure modes addressed
elsewhere).
External thinning due to a) contact abrasion (rubbing)
b) atmospheric debris (such as sand) pitting and
abrasion Internal thinning due to
c) flow abrasion / contaminate in refrigerant
d) cavitation e) high speed flow
f) excessively cold flow causing embrittlement
a) slow release of R290 charge into the
compressor compartment
Operating - idle II I

115
No. Component
Area
Failure Mode Potential Cause(s) Effect(s) State Severity Likelihood
1.16 Compressor
Compartment
Monitor /
Control
hardware
gauge / switch failure due to
a) over-pressurization
b) excessive cycles (amplitude or frequency) fatigue
c) extreme temperature / pressure conditions
e) corrosion f) seal failure
g) external damage
h) high voltage
a) slow to moderate release of R290 charge
into the compressor compartment
Operating - idle II I
1.17 Compressor
Compartment
Seal / Gland /
Core Failure
Not credible Not credible Servicing I I
1.18 Compressor Compartment
Leaking Pipe (hole)
pipe wall integrity degradation due to a) over-pressurization
b) external damage
c) corrosion brazed joint failure due to
d) stress cracking
e) filler metal voids / porosity f) base metal erosion in brazed joint
a) slow release of R290 charge into the compressor compartment
Servicing II I
1.19 Compressor Compartment
Fracture / Rupture / Crack
compressor enclosure crack due to a) excessive thermal cycles
b) excessive vibrations
c) external damage over-pressurization leading to
d) PSV actuation
e) breached hermetic seal
a) slow to moderate release of R290 charge into the compressor compartment
Servicing II I
1.20 Compressor
Compartment
Mechanical
Component Failure
Not credible Not credible Servicing I I
1.21 Compressor
Compartment
Ancillary
Component Failure
Not credible Not credible Servicing I I
1.22 Compressor
Compartment
Leaking Flange
/ Union / Joint
mechanical connection (including service
connections) failure due to
a) excessive stress b) external damage
c) corrosion
d) seal deterioration (ferrule, flare or face seal as applicable)
e) poor mechanical connection at charge and monitor points
a) slow to moderate release of R290 charge
into the compressor compartment
Servicing III V

116
No. Component
Area
Failure Mode Potential Cause(s) Effect(s) State Severity Likelihood
1.23 Compressor
Compartment
Abrasion / Wear
/ Wall Thinning
specific pipe/tube failure due to wall thinning
(excludes hole failure modes addressed
elsewhere). External thinning due to
a) contact abrasion (rubbing)
b) atmospheric debris (such as sand) pitting and abrasion
Internal thinning due to
c) flow abrasion / contaminate in refrigerant d) cavitation
e) high speed flow
f) excessively cold flow causing embrittlement
a) slow to moderate release of R290 charge
into the compressor compartment
Servicing II III
1.24 Compressor
Compartment
Monitor /
Control
hardware
gauge / switch failure (including servicing
equipment) due to
a) over-pressurization b) excessive cycles (amplitude or frequency)
fatigue
c) extreme temperature / pressure conditions d) corrosion
e) seal failure
f) external damage g) high voltage
a) slow to moderate release of R290 charge
into the compressor compartment
Servicing II III
1.25 Compressor
Compartment
Seal / Gland /
Core Failure
seal blow-by due to
a) excessive pressure cycling
b) excessive wear c) motor runaway causing over-pressurization
Seal wear / degradation due to
d) age, cycles, use e) loss of resiliency in flexible seals
a) moderate release of R290 charge into the
compressor compartment
Installation /
Commissioning
IV I
1.26 Compressor
Compartment
Leaking Pipe
(hole)
pipe wall integrity degradation due to
a) over-pressurization
b) external damage c) corrosion (storage / warehouse related)
brazed joint failure due to
d) weak brazing (un-melted filler) e) filler metal voids / porosity
f) base metal erosion in brazed joint
g) etched surface in brazing processh) other improper brazing in manufacturing (e.g. wetting
and flow)
a) slow to rapid release of R290 charge into
the compressor compartment
Installation /
Commissioning
III II

117
No. Component
Area
Failure Mode Potential Cause(s) Effect(s) State Severity Likelihood
1.27 Compressor
Compartment
Fracture /
Rupture / Crack
compressor enclosure crack due to
a) initial pressure cycle
b) initial operating environment c) external damage
initial pressurized refrigerant charge leading to
d) PSV actuation e) breached hermetic seal from assembly
a) slow to rapid release of R290 charge into
the compressor compartment
Installation /
Commissioning
III II
1.28 Compressor
Compartment
Mechanical
Component
Failure
Compressor failure upon startup sufficient to
breach hermetic seal (not including shaft seal
failures which are considered elsewhere) a) electric motor failure
b) bearing failure
c) shaft failure d) support structure failure
e) compressor impeller / rotator failure
f) over or under-charging of refrigerant
a) moderate to rapid release of R290 charge
into the compressor compartment
b) potential source of ignition
Installation /
Commissioning
II II
1.29 Compressor Compartment
Ancillary Component
Failure
complete subsystem failure (excluding cracked or fractured case which is considered
elsewhere)
a) PSV failure b) compressor compartment ventilation fan
failure
c) oil reservoir and separator failure
a) slow to rapid release of R290 charge into the compressor compartment
b) potential source of ignition
c) reduced ventilation in compressor compartment (if fan failure)
Installation / Commissioning
III III
1.30 Compressor
Compartment
Leaking Flange
/ Union / Joint
mechanical connection (including service
connections) failure due to
a) excessive stress b) external damage
c) corrosion (storage / warehouse related)
d) seal deterioration (ferrule, flare or face seal as applicable)
e) poor mechanical connection at charge and
monitor points
a) slow to moderate release of R290 charge
into the compressor compartment
Installation /
Commissioning
III V
1.31 Compressor Compartment
Abrasion / Wear / Wall Thinning
specific pipe/tube failure due to wall thinning (excludes hole failure modes addressed
elsewhere).
External thinning due to a) contact abrasion (rubbing)
b) atmospheric debris (such as sand) pitting and
abrasion Internal thinning due to
c) flow abrasion / contaminate in refrigerant
d) cavitation e) high speed flow
f) excessively cold flow causing embrittlement
a) slow to moderate release of R290 charge into the compressor compartment
Installation / Commissioning
II III

118
No. Component
Area
Failure Mode Potential Cause(s) Effect(s) State Severity Likelihood
1.32 Compressor
Compartment
Monitor /
Control
hardware
gauge / switch failure (including servicing
equipment) due to
a) over-pressurization b) excessive cycles (amplitude or frequency)
fatigue
c) extreme temperature / pressure conditions d) corrosion (storage / warehouse related)
e) seal failure
f) external damage g) high voltage
a) slow to rapid release of R290 charge into
the compressor compartment
Installation /
Commissioning
III III
1.33 Compressor
Compartment
Seal / Gland /
Core Failure
seal blow-by due to
a) excessive pressure cycling b) excessive wear
c) motor runaway causing over-pressurization
Seal wear / degradation due to d) age, cycles, use
e) loss of resiliency in flexible seals
a) slow release of R290 charge into the
compressor compartment
Off I I
1.34 Compressor
Compartment
Leaking Pipe
(hole)
pipe wall integrity degradation due to
a) over-pressurization
b) external damage c) corrosion
brazed joint failure due to
d) stress cracking e) filler metal voids / porosity
f) base metal erosion in brazed joint
a) slow release of R290 charge into the
compressor compartment
Off II I
1.35 Compressor
Compartment
Fracture /
Rupture / Crack
compressor enclosure crack due to
a) excessive thermal cycles
b) excessive vibrations c) external damage
over-pressurization leading to
d) PSV actuation e) breached hermetic seal
a) slow to moderate release of R290 charge
into the compressor compartment
Off II I
1.36 Compressor Compartment
Mechanical Component
Failure
Not credible Not credible Off I I
1.37 Compressor Compartment
Ancillary Component
Failure
Not credible Not credible Off I I

119
No. Component
Area
Failure Mode Potential Cause(s) Effect(s) State Severity Likelihood
1.38 Compressor
Compartment
Leaking Flange
/ Union / Joint
mechanical connection failure due to
a) excessive stress
b) external damage c) corrosion
d) seal deterioration (ferrule, flare or face seal
as applicable)
a) slow release of R290 charge into the
compressor compartment
Off II III
1.39 Compressor
Compartment
Abrasion / Wear
/ Wall Thinning
Not credible Not credible Off II III
1.40 Compressor Compartment
Monitor / Control
hardware
gauge / switch failure due to a) corrosion
b) seal failure
c) external damage
a) slow to moderate release of R290 charge into the compressor compartment
Off II III
2.01 Discharge Vapor Line
Seal / Gland / Core Failure
seal blow-by due to a) excessive pressure cycling
b) excessive wear
c) motor runaway causing over-pressurization Seal wear / degradation due to
d) age, cycles, use
e) loss of resiliency in flexible seals
a) moderate release of R290 charge into the compressor compartment and/or condenser
area (if applicable)
Operating III I
2.02 Discharge Vapor
Line
Leaking Pipe
(hole)
pipe wall integrity degradation due to
a) over-pressurization b) external damage
c) corrosion
brazed joint failure due to d) stress cracking
e) filler metal voids / porosity
f) base metal erosion in brazed joint
a) slow to rapid release of R290 charge into
the compressor compartment and/or condenser area (if applicable)
Operating III II
2.03 Discharge Vapor
Line
Fracture /
Rupture / Crack
separator housing crack due to
a) excessive thermal cycles
b) excessive vibrations
c) external damage
over-pressurization leading to d) PSV actuation
a) slow to rapid release of R290 charge into
the compressor compartment and/or
condenser area (if applicable)
Operating III I
2.04 Discharge Vapor
Line
Mechanical
Component
Failure
Not credible Not credible Operating I I
2.05 Discharge Vapor
Line
Ancillary
Component
Failure
complete subsystem failure (excluding cracked
or fractured case which is considered
elsewhere) a) over-pressurization
b) corrosion
c) external damage
a) slow to rapid release of R290 charge into
the compressor compartment and/or
condenser area (if applicable) b) potential source of ignition
c) rapid release of hot oil into condenser or
compressor areas
Operating III III

120
No. Component
Area
Failure Mode Potential Cause(s) Effect(s) State Severity Likelihood
2.06 Discharge Vapor
Line
Leaking Flange
/ Union / Joint
mechanical connection failure due to
a) excessive stress
b) external damage c) corrosion
d) seal deterioration (ferrule, flare or face seal
as applicable)
a) slow to moderate release of R290 charge
into the compressor compartment and/or
condenser area (if applicable)
Operating II IV
2.07 Discharge Vapor
Line
Abrasion / Wear
/ Wall Thinning
specific pipe/tube failure due to wall thinning
(excludes hole failure modes addressed
elsewhere). External thinning due to
a) contact abrasion (rubbing)
b) atmospheric debris (such as sand) pitting and abrasion
Internal thinning due to
c) flow abrasion / contaminate in refrigerant d) cavitation (entrained oil or impurities)
e) high speed flow
f) excessively cold flow causing embrittlement
a) slow to moderate release of R290 charge
into the compressor compartment and/or
condenser area (if applicable)
Operating II III
2.08 Discharge Vapor
Line
Monitor /
Control
hardware
gauge / switch failure due to
a) over-pressurization
b) excessive cycles (amplitude or frequency)
fatigue c) extreme temperature / pressure conditions
d) corrosion
e) seal failure f) external damage
g) high voltage
a) slow to rapid release of R290 charge into
the compressor compartment and/or
condenser area (if applicable)
Operating II II
2.09 Discharge Vapor Line
Leaking Pipe (hole)
pipe wall integrity degradation due to a) over-pressurization
b) external damage
c) corrosion
brazed joint failure due to
d) stress cracking
e) filler metal voids / porosity f) base metal erosion in brazed joint
a) slow release of R290 charge into the compressor compartment and/or condenser
area (if applicable)
Operating - idle II I
2.10 Discharge Vapor
Line
Seal / Gland /
Core Failure
seal blow-by due to
a) excessive pressure cycling b) excessive wear
c) motor runaway causing over-pressurization
Seal wear / degradation due to d) age, cycles, use
e) loss of resiliency in flexible seals
a) slow release of R290 charge into the
compressor compartment and/or condenser area (if applicable)
Operating - idle II II
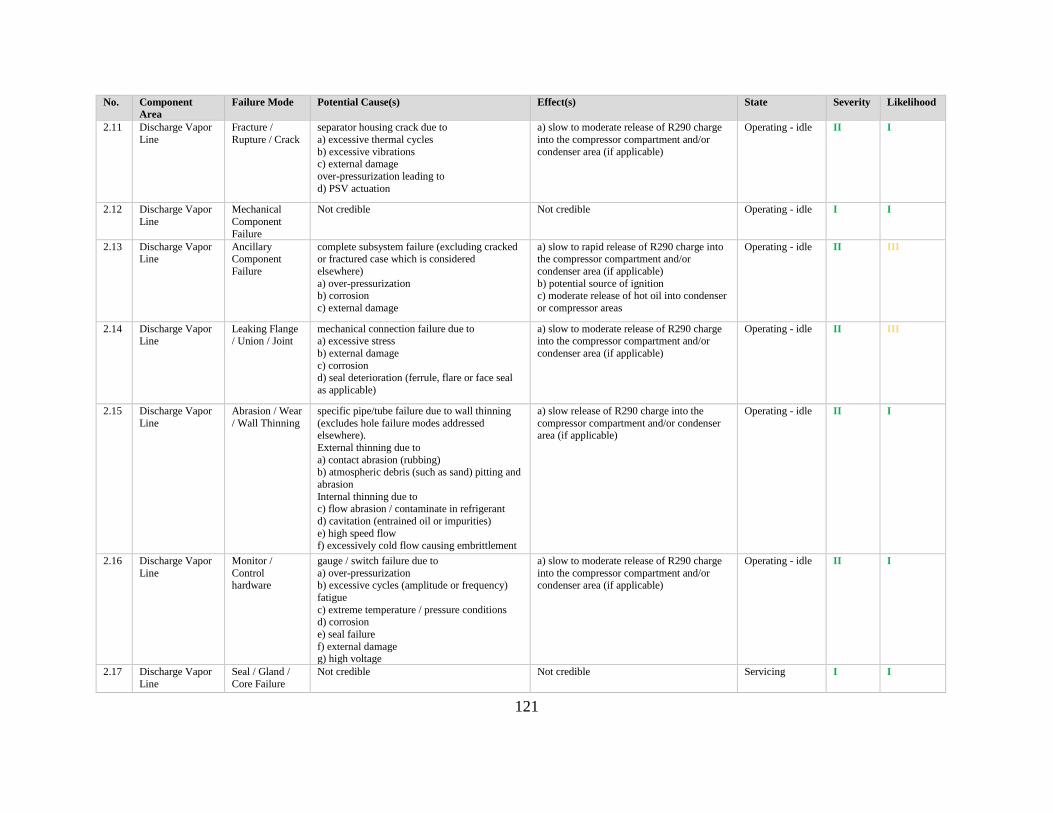
121
No. Component
Area
Failure Mode Potential Cause(s) Effect(s) State Severity Likelihood
2.11 Discharge Vapor
Line
Fracture /
Rupture / Crack
separator housing crack due to
a) excessive thermal cycles
b) excessive vibrations c) external damage
over-pressurization leading to
d) PSV actuation
a) slow to moderate release of R290 charge
into the compressor compartment and/or
condenser area (if applicable)
Operating - idle II I
2.12 Discharge Vapor
Line
Mechanical
Component
Failure
Not credible Not credible Operating - idle I I
2.13 Discharge Vapor Line
Ancillary Component
Failure
complete subsystem failure (excluding cracked or fractured case which is considered
elsewhere)
a) over-pressurization b) corrosion
c) external damage
a) slow to rapid release of R290 charge into the compressor compartment and/or
condenser area (if applicable)
b) potential source of ignition c) moderate release of hot oil into condenser
or compressor areas
Operating - idle II III
2.14 Discharge Vapor Line
Leaking Flange / Union / Joint
mechanical connection failure due to a) excessive stress
b) external damage
c) corrosion d) seal deterioration (ferrule, flare or face seal
as applicable)
a) slow to moderate release of R290 charge into the compressor compartment and/or
condenser area (if applicable)
Operating - idle II III
2.15 Discharge Vapor
Line
Abrasion / Wear
/ Wall Thinning
specific pipe/tube failure due to wall thinning
(excludes hole failure modes addressed elsewhere).
External thinning due to
a) contact abrasion (rubbing) b) atmospheric debris (such as sand) pitting and
abrasion
Internal thinning due to c) flow abrasion / contaminate in refrigerant
d) cavitation (entrained oil or impurities)
e) high speed flow f) excessively cold flow causing embrittlement
a) slow release of R290 charge into the
compressor compartment and/or condenser area (if applicable)
Operating - idle II I
2.16 Discharge Vapor
Line
Monitor /
Control hardware
gauge / switch failure due to
a) over-pressurization b) excessive cycles (amplitude or frequency)
fatigue
c) extreme temperature / pressure conditions d) corrosion
e) seal failure
f) external damage
g) high voltage
a) slow to moderate release of R290 charge
into the compressor compartment and/or condenser area (if applicable)
Operating - idle II I
2.17 Discharge Vapor
Line
Seal / Gland /
Core Failure
Not credible Not credible Servicing I I

122
No. Component
Area
Failure Mode Potential Cause(s) Effect(s) State Severity Likelihood
2.18 Discharge Vapor
Line
Leaking Pipe
(hole)
pipe wall integrity degradation due to
a) over-pressurization
b) external damage c) corrosion
brazed joint failure due to
d) stress cracking e) filler metal voids / porosity
f) base metal erosion in brazed joint
a) slow release of R290 charge into the
compressor compartment and/or condenser
area (if applicable)
Servicing II I
2.19 Discharge Vapor
Line
Fracture /
Rupture / Crack
separator housing crack due to
a) excessive thermal cycles
b) excessive vibrations c) external damage
over-pressurization leading to
d) PSV actuation
a) slow to moderate release of R290 charge
into the compressor compartment and/or
condenser area (if applicable)
Servicing II I
2.20 Discharge Vapor Line
Mechanical Component
Failure
Not credible Not credible Servicing I I
2.21 Discharge Vapor
Line
Ancillary
Component
Failure
complete subsystem failure (excluding cracked
or fractured case which is considered
elsewhere)
a) over-pressurization b) corrosion
c) external damage
a) slow to rapid release of R290 charge into
the compressor compartment and/or
condenser area (if applicable)
b) potential source of ignition
Servicing III II
2.22 Discharge Vapor
Line
Leaking Flange
/ Union / Joint
mechanical connection (including service
connections) failure due to a) excessive stress
b) external damage
c) corrosion d) seal deterioration (ferrule, flare or face seal
as applicable)
e) poor mechanical connection at charge and monitor points
a) slow to moderate release of R290 charge
into the compressor compartment and/or condenser area (if applicable)
Servicing III V
2.23 Discharge Vapor
Line
Abrasion / Wear
/ Wall Thinning
specific pipe/tube failure due to wall thinning
(excludes hole failure modes addressed elsewhere).
External thinning due to
a) contact abrasion (rubbing) b) atmospheric debris (such as sand) pitting and
abrasion
Internal thinning due to c) flow abrasion / contaminate in refrigerant
d) cavitation (entrained oil or impurities)
e) high speed flow f) excessively cold flow causing embrittlement
a) slow to moderate release of R290 charge
into the compressor compartment and/or condenser area (if applicable)
Servicing II III
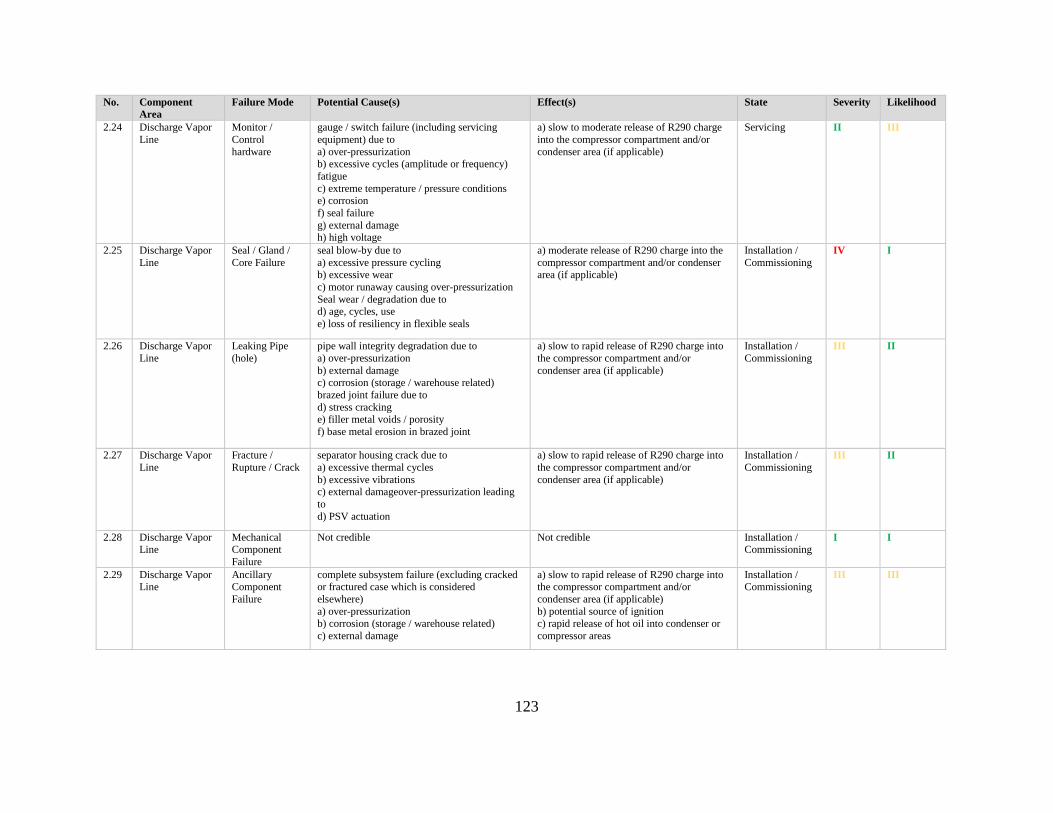
123
No. Component
Area
Failure Mode Potential Cause(s) Effect(s) State Severity Likelihood
2.24 Discharge Vapor
Line
Monitor /
Control
hardware
gauge / switch failure (including servicing
equipment) due to
a) over-pressurization b) excessive cycles (amplitude or frequency)
fatigue
c) extreme temperature / pressure conditions e) corrosion
f) seal failure
g) external damage h) high voltage
a) slow to moderate release of R290 charge
into the compressor compartment and/or
condenser area (if applicable)
Servicing II III
2.25 Discharge Vapor
Line
Seal / Gland /
Core Failure
seal blow-by due to
a) excessive pressure cycling b) excessive wear
c) motor runaway causing over-pressurization
Seal wear / degradation due to d) age, cycles, use
e) loss of resiliency in flexible seals
a) moderate release of R290 charge into the
compressor compartment and/or condenser area (if applicable)
Installation /
Commissioning
IV I
2.26 Discharge Vapor
Line
Leaking Pipe
(hole)
pipe wall integrity degradation due to
a) over-pressurization
b) external damage c) corrosion (storage / warehouse related)
brazed joint failure due to
d) stress cracking e) filler metal voids / porosity
f) base metal erosion in brazed joint
a) slow to rapid release of R290 charge into
the compressor compartment and/or
condenser area (if applicable)
Installation /
Commissioning
III II
2.27 Discharge Vapor
Line
Fracture /
Rupture / Crack
separator housing crack due to
a) excessive thermal cycles
b) excessive vibrations c) external damageover-pressurization leading
to
d) PSV actuation
a) slow to rapid release of R290 charge into
the compressor compartment and/or
condenser area (if applicable)
Installation /
Commissioning
III II
2.28 Discharge Vapor Line
Mechanical Component
Failure
Not credible Not credible Installation / Commissioning
I I
2.29 Discharge Vapor Line
Ancillary Component
Failure
complete subsystem failure (excluding cracked or fractured case which is considered
elsewhere)
a) over-pressurization b) corrosion (storage / warehouse related)
c) external damage
a) slow to rapid release of R290 charge into the compressor compartment and/or
condenser area (if applicable)
b) potential source of ignition c) rapid release of hot oil into condenser or
compressor areas
Installation / Commissioning
III III

124
No. Component
Area
Failure Mode Potential Cause(s) Effect(s) State Severity Likelihood
2.30 Discharge Vapor
Line
Leaking Flange
/ Union / Joint
mechanical connection (including service
connections) failure due to
a) excessive stress b) external damage
c) corrosion (storage / warehouse related)
d) seal deterioration (ferrule, flare or face seal as applicable)
e) poor mechanical connection at charge and
monitor points
a) slow to moderate release of R290 charge
into the compressor compartment and/or
condenser area (if applicable)
Installation /
Commissioning
III V
2.31 Discharge Vapor
Line
Abrasion / Wear
/ Wall Thinning
specific pipe/tube failure due to wall thinning
(excludes hole failure modes addressed
elsewhere). External thinning due to
a) contact abrasion (rubbing)
b) atmospheric debris (such as sand) pitting and abrasion
Internal thinning due to
c) flow abrasion / contaminate in refrigerant d) cavitation (entrained oil or impurities)
e) high speed flow
f) excessively cold flow causing embrittlement
a) slow to moderate release of R290 charge
into the compressor compartment and/or
condenser area (if applicable)
Installation /
Commissioning
II III
2.32 Discharge Vapor Line
Monitor / Control
hardware
gauge / switch failure (including servicing equipment) due to
a) over-pressurization
b) excessive cycles (amplitude or frequency) fatigue
c) extreme temperature / pressure conditions
e) corrosion (storage / warehouse related) f) seal failure
g) external damage
h) high voltage
a) slow to rapid release of R290 charge into the compressor compartment and/or
condenser area (if applicable)
Installation / Commissioning
III III
2.33 Discharge Vapor
Line
Seal / Gland /
Core Failure
seal blow-by due to
a) excessive pressure cycling
b) excessive wear c) motor runaway causing over-
pressurizationSeal wear / degradation due to
d) age, cycles, use e) loss of resiliency in flexible seals
a) slow release of R290 charge into the
compressor compartment and/or condenser
area (if applicable)
Off II I
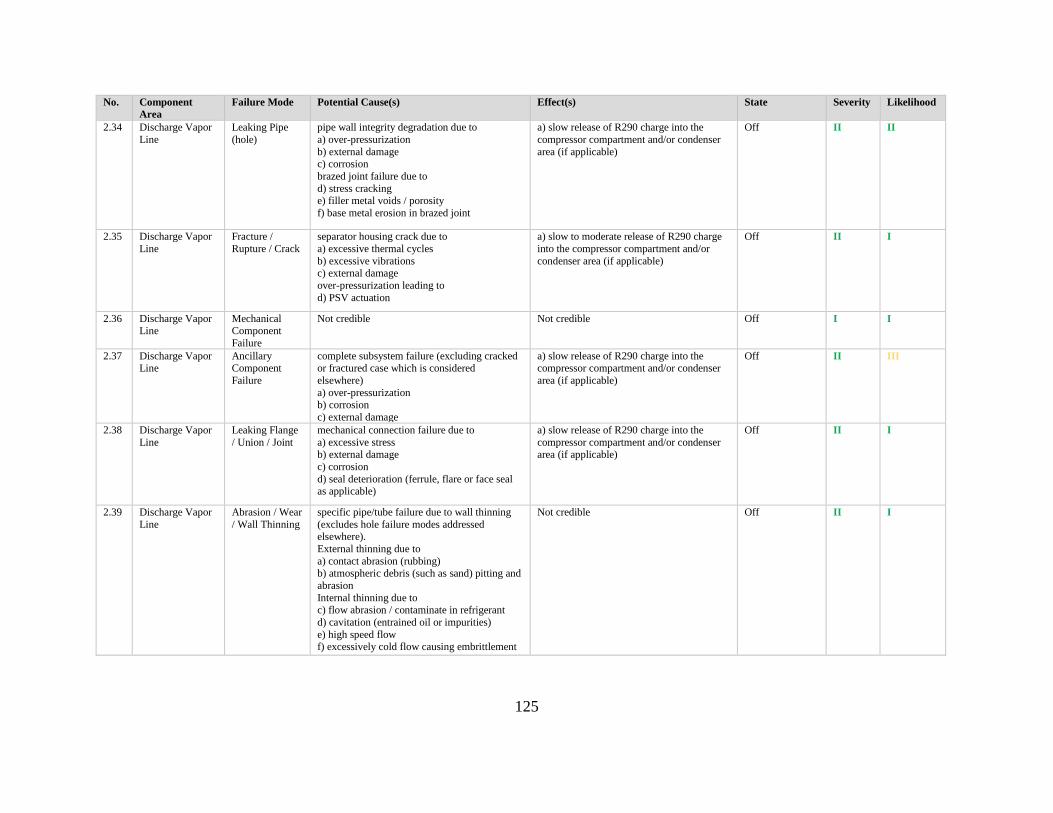
125
No. Component
Area
Failure Mode Potential Cause(s) Effect(s) State Severity Likelihood
2.34 Discharge Vapor
Line
Leaking Pipe
(hole)
pipe wall integrity degradation due to
a) over-pressurization
b) external damage c) corrosion
brazed joint failure due to
d) stress cracking e) filler metal voids / porosity
f) base metal erosion in brazed joint
a) slow release of R290 charge into the
compressor compartment and/or condenser
area (if applicable)
Off II II
2.35 Discharge Vapor
Line
Fracture /
Rupture / Crack
separator housing crack due to
a) excessive thermal cycles
b) excessive vibrations c) external damage
over-pressurization leading to
d) PSV actuation
a) slow to moderate release of R290 charge
into the compressor compartment and/or
condenser area (if applicable)
Off II I
2.36 Discharge Vapor Line
Mechanical Component
Failure
Not credible Not credible Off I I
2.37 Discharge Vapor
Line
Ancillary
Component
Failure
complete subsystem failure (excluding cracked
or fractured case which is considered
elsewhere)
a) over-pressurization b) corrosion
c) external damage
a) slow release of R290 charge into the
compressor compartment and/or condenser
area (if applicable)
Off II III
2.38 Discharge Vapor
Line
Leaking Flange
/ Union / Joint
mechanical connection failure due to
a) excessive stress b) external damage
c) corrosion
d) seal deterioration (ferrule, flare or face seal as applicable)
a) slow release of R290 charge into the
compressor compartment and/or condenser area (if applicable)
Off II I
2.39 Discharge Vapor
Line
Abrasion / Wear
/ Wall Thinning
specific pipe/tube failure due to wall thinning
(excludes hole failure modes addressed elsewhere).
External thinning due to
a) contact abrasion (rubbing) b) atmospheric debris (such as sand) pitting and
abrasion
Internal thinning due to c) flow abrasion / contaminate in refrigerant
d) cavitation (entrained oil or impurities)
e) high speed flow f) excessively cold flow causing embrittlement
Not credible Off II I
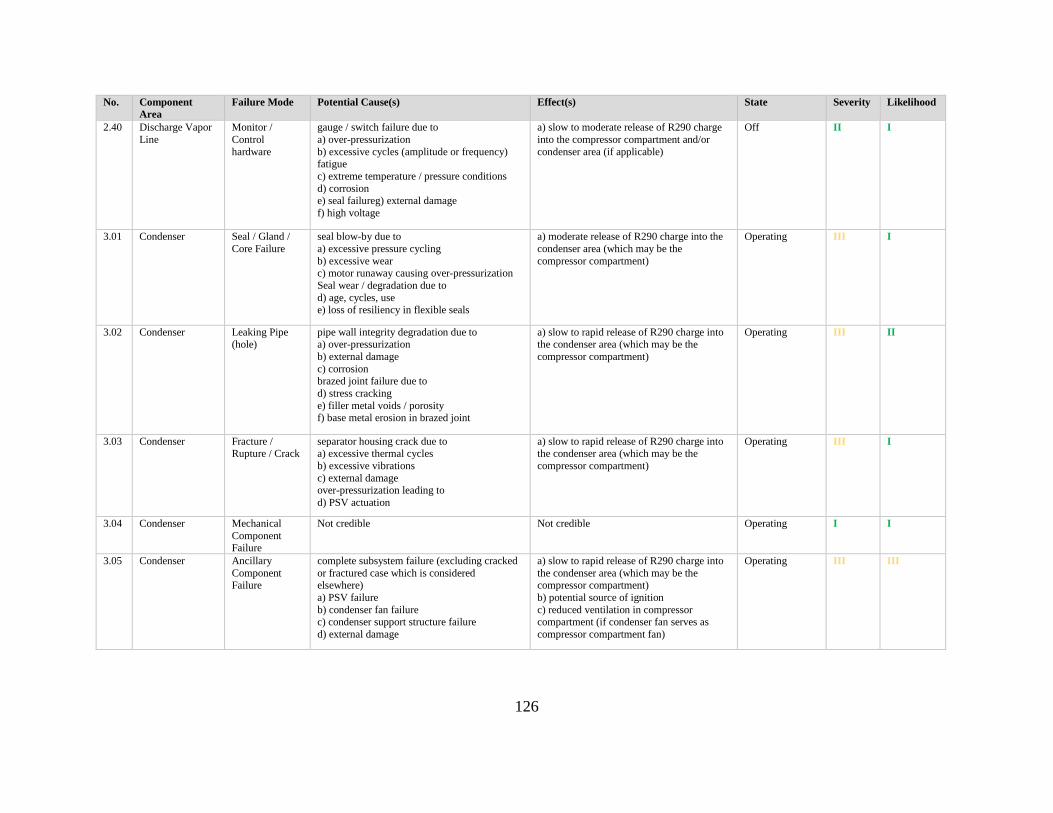
126
No. Component
Area
Failure Mode Potential Cause(s) Effect(s) State Severity Likelihood
2.40 Discharge Vapor
Line
Monitor /
Control
hardware
gauge / switch failure due to
a) over-pressurization
b) excessive cycles (amplitude or frequency) fatigue
c) extreme temperature / pressure conditions
d) corrosion e) seal failureg) external damage
f) high voltage
a) slow to moderate release of R290 charge
into the compressor compartment and/or
condenser area (if applicable)
Off II I
3.01 Condenser Seal / Gland /
Core Failure
seal blow-by due to
a) excessive pressure cycling
b) excessive wear c) motor runaway causing over-pressurization
Seal wear / degradation due to
d) age, cycles, use e) loss of resiliency in flexible seals
a) moderate release of R290 charge into the
condenser area (which may be the
compressor compartment)
Operating III I
3.02 Condenser Leaking Pipe (hole)
pipe wall integrity degradation due to a) over-pressurization
b) external damage
c) corrosion brazed joint failure due to
d) stress cracking
e) filler metal voids / porosity f) base metal erosion in brazed joint
a) slow to rapid release of R290 charge into the condenser area (which may be the
compressor compartment)
Operating III II
3.03 Condenser Fracture / Rupture / Crack
separator housing crack due to a) excessive thermal cycles
b) excessive vibrations
c) external damage over-pressurization leading to
d) PSV actuation
a) slow to rapid release of R290 charge into the condenser area (which may be the
compressor compartment)
Operating III I
3.04 Condenser Mechanical
Component Failure
Not credible Not credible Operating I I
3.05 Condenser Ancillary
Component Failure
complete subsystem failure (excluding cracked
or fractured case which is considered elsewhere)
a) PSV failure
b) condenser fan failure c) condenser support structure failure
d) external damage
a) slow to rapid release of R290 charge into
the condenser area (which may be the compressor compartment)
b) potential source of ignition
c) reduced ventilation in compressor compartment (if condenser fan serves as
compressor compartment fan)
Operating III III

127
No. Component
Area
Failure Mode Potential Cause(s) Effect(s) State Severity Likelihood
3.06 Condenser Leaking Flange
/ Union / Joint
mechanical connection failure due to
a) excessive stress
b) external damage c) corrosion
d) seal deterioration (ferrule, flare or face seal
as applicable)
a) slow to moderate release of R290 charge
into the condenser area (which may be the
compressor compartment)
Operating II IV
3.07 Condenser Abrasion / Wear
/ Wall Thinning
specific pipe/tube failure due to wall thinning
(excludes hole failure modes addressed
elsewhere). External thinning due to
a) contact abrasion (rubbing)
b) atmospheric debris (such as sand) pitting and abrasion
Internal thinning due to
c) flow abrasion / contaminate in refrigerant d) cavitation
e) high speed flow
f) excessively cold flow causing embrittlement
a) slow to moderate release of R290 charge
into the condenser area (which may be the
compressor compartment)
Operating II III
3.08 Condenser Monitor /
Control
hardware
gauge / switch failure due to
a) over-pressurization
b) excessive cycles (amplitude or frequency)
fatigue c) extreme temperature / pressure conditions
e) corrosion
f) seal failure g) external damage
h) high voltage
a) slow to rapid release of R290 charge into
the condenser area (which may be the
compressor compartment)
Operating II II
3.09 Condenser Leaking Pipe (hole)
pipe wall integrity degradation due to a) over-pressurization
b) external damage
c) corrosion
brazed joint failure due to
d) stress cracking
e) filler metal voids / porosity f) base metal erosion in brazed joint
a) slow release of R290 charge into the condenser area (which may be the
compressor compartment)
Operating - idle II I
3.10 Condenser Seal / Gland /
Core Failure
pipe wall integrity degradation due to
a) over-pressurization b) external damage
c) corrosion
brazed joint failure due to d) stress cracking
e) filler metal voids / porosity
f) base metal erosion in brazed joint
a) slow release of R290 charge into the
condenser area (which may be the compressor compartment)
Operating - idle II II

128
No. Component
Area
Failure Mode Potential Cause(s) Effect(s) State Severity Likelihood
3.11 Condenser Fracture /
Rupture / Crack
separator housing crack due to
a) excessive thermal cycles
b) excessive vibrations c) external damage
over-pressurization leading to
d) PSV actuation
a) slow to moderate release of R290 charge
into the condenser area (which may be the
compressor compartment)
Operating - idle II I
3.12 Condenser Mechanical
Component
Failure
Not credible Not credible Operating - idle I I
3.13 Condenser Ancillary Component
Failure
complete subsystem failure (excluding cracked or fractured case which is considered
elsewhere)
a) PSV failure b) condenser fan failure
c) condenser support structure failure
d) external damage
a) slow to rapid release of R290 charge into the condenser area (which may be the
compressor compartment)
b) potential source of ignitionc) reduced ventilation in compressor compartment (if
condenser fan serves as compressor
compartment fan)
Operating - idle II III
3.14 Condenser Leaking Flange / Union / Joint
mechanical connection failure due to a) excessive stress
b) external damage
c) corrosion d) seal deterioration (ferrule, flare or face seal
as applicable)
a) slow to moderate release of R290 charge into the condenser area (which may be the
compressor compartment)
Operating - idle II III
3.15 Condenser Abrasion / Wear
/ Wall Thinning
specific pipe/tube failure due to wall thinning
(excludes hole failure modes addressed elsewhere).
External thinning due to
a) contact abrasion (rubbing) b) atmospheric debris (such as sand) pitting and
abrasion
a) slow release of R290 charge into the
condenser area (which may be the compressor compartment)
Operating - idle I I
3.16 Condenser Monitor / Control
hardware
gauge / switch failure due to a) over-pressurization
b) excessive cycles (amplitude or frequency)
fatigue c) extreme temperature / pressure conditions
d) corrosion
e) seal failure f) external damage
g) high voltage
a) slow to moderate release of R290 charge into the condenser area (which may be the
compressor compartment)
Operating - idle II I
3.17 Condenser Seal / Gland /
Core Failure
Not credible Not credible Servicing I I
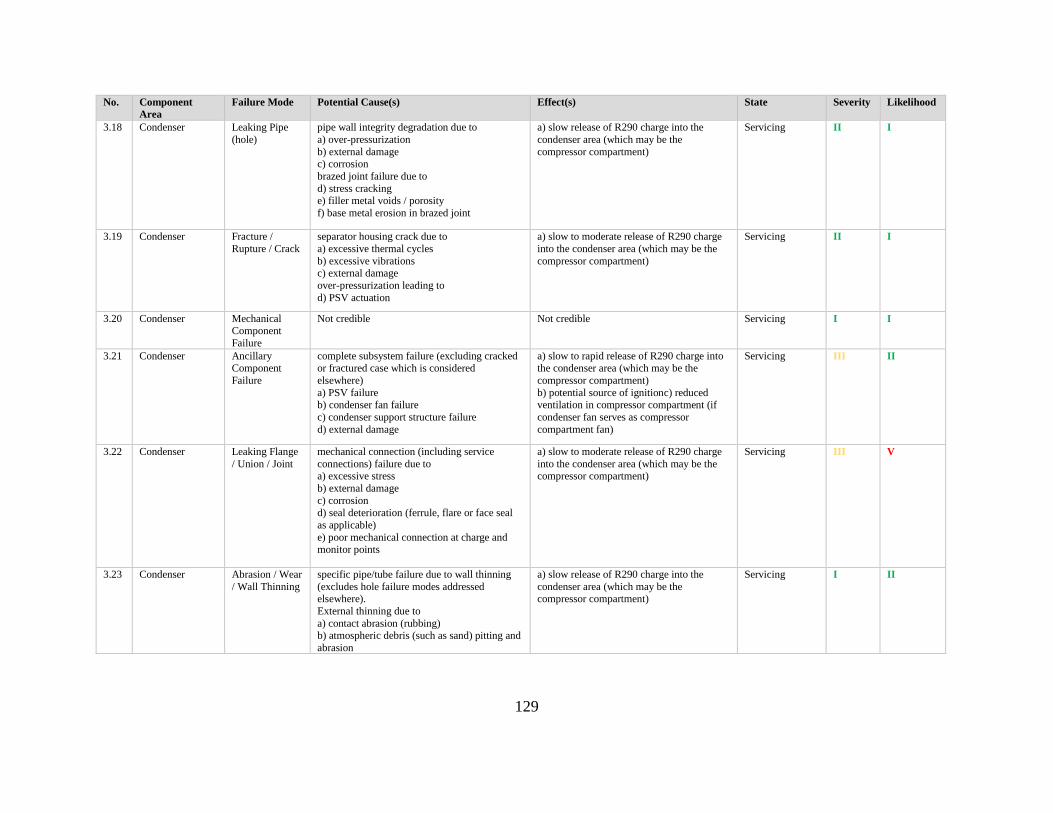
129
No. Component
Area
Failure Mode Potential Cause(s) Effect(s) State Severity Likelihood
3.18 Condenser Leaking Pipe
(hole)
pipe wall integrity degradation due to
a) over-pressurization
b) external damage c) corrosion
brazed joint failure due to
d) stress cracking e) filler metal voids / porosity
f) base metal erosion in brazed joint
a) slow release of R290 charge into the
condenser area (which may be the
compressor compartment)
Servicing II I
3.19 Condenser Fracture /
Rupture / Crack
separator housing crack due to
a) excessive thermal cycles
b) excessive vibrations c) external damage
over-pressurization leading to
d) PSV actuation
a) slow to moderate release of R290 charge
into the condenser area (which may be the
compressor compartment)
Servicing II I
3.20 Condenser Mechanical Component
Failure
Not credible Not credible Servicing I I
3.21 Condenser Ancillary
Component
Failure
complete subsystem failure (excluding cracked
or fractured case which is considered
elsewhere)
a) PSV failure b) condenser fan failure
c) condenser support structure failure
d) external damage
a) slow to rapid release of R290 charge into
the condenser area (which may be the
compressor compartment)
b) potential source of ignitionc) reduced ventilation in compressor compartment (if
condenser fan serves as compressor
compartment fan)
Servicing III II
3.22 Condenser Leaking Flange
/ Union / Joint
mechanical connection (including service
connections) failure due to a) excessive stress
b) external damage
c) corrosion
d) seal deterioration (ferrule, flare or face seal
as applicable)
e) poor mechanical connection at charge and monitor points
a) slow to moderate release of R290 charge
into the condenser area (which may be the compressor compartment)
Servicing III V
3.23 Condenser Abrasion / Wear
/ Wall Thinning
specific pipe/tube failure due to wall thinning
(excludes hole failure modes addressed elsewhere).
External thinning due to
a) contact abrasion (rubbing) b) atmospheric debris (such as sand) pitting and
abrasion
a) slow release of R290 charge into the
condenser area (which may be the compressor compartment)
Servicing I II
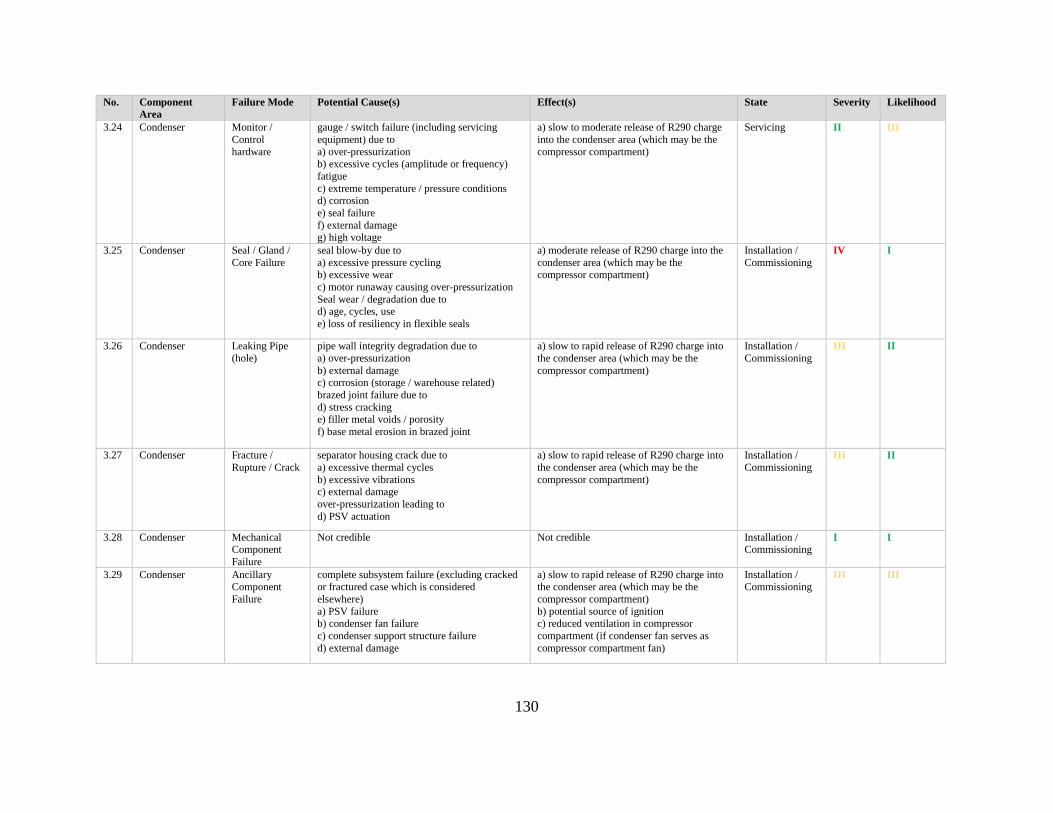
130
No. Component
Area
Failure Mode Potential Cause(s) Effect(s) State Severity Likelihood
3.24 Condenser Monitor /
Control
hardware
gauge / switch failure (including servicing
equipment) due to
a) over-pressurization b) excessive cycles (amplitude or frequency)
fatigue
c) extreme temperature / pressure conditions d) corrosion
e) seal failure
f) external damage g) high voltage
a) slow to moderate release of R290 charge
into the condenser area (which may be the
compressor compartment)
Servicing II III
3.25 Condenser Seal / Gland /
Core Failure
seal blow-by due to
a) excessive pressure cycling b) excessive wear
c) motor runaway causing over-pressurization
Seal wear / degradation due to d) age, cycles, use
e) loss of resiliency in flexible seals
a) moderate release of R290 charge into the
condenser area (which may be the compressor compartment)
Installation /
Commissioning
IV I
3.26 Condenser Leaking Pipe
(hole)
pipe wall integrity degradation due to
a) over-pressurization
b) external damage c) corrosion (storage / warehouse related)
brazed joint failure due to
d) stress cracking e) filler metal voids / porosity
f) base metal erosion in brazed joint
a) slow to rapid release of R290 charge into
the condenser area (which may be the
compressor compartment)
Installation /
Commissioning
III II
3.27 Condenser Fracture /
Rupture / Crack
separator housing crack due to
a) excessive thermal cycles
b) excessive vibrations c) external damage
over-pressurization leading to
d) PSV actuation
a) slow to rapid release of R290 charge into
the condenser area (which may be the
compressor compartment)
Installation /
Commissioning
III II
3.28 Condenser Mechanical Component
Failure
Not credible Not credible Installation / Commissioning
I I
3.29 Condenser Ancillary Component
Failure
complete subsystem failure (excluding cracked or fractured case which is considered
elsewhere)
a) PSV failure b) condenser fan failure
c) condenser support structure failure
d) external damage
a) slow to rapid release of R290 charge into the condenser area (which may be the
compressor compartment)
b) potential source of ignition c) reduced ventilation in compressor
compartment (if condenser fan serves as
compressor compartment fan)
Installation / Commissioning
III III
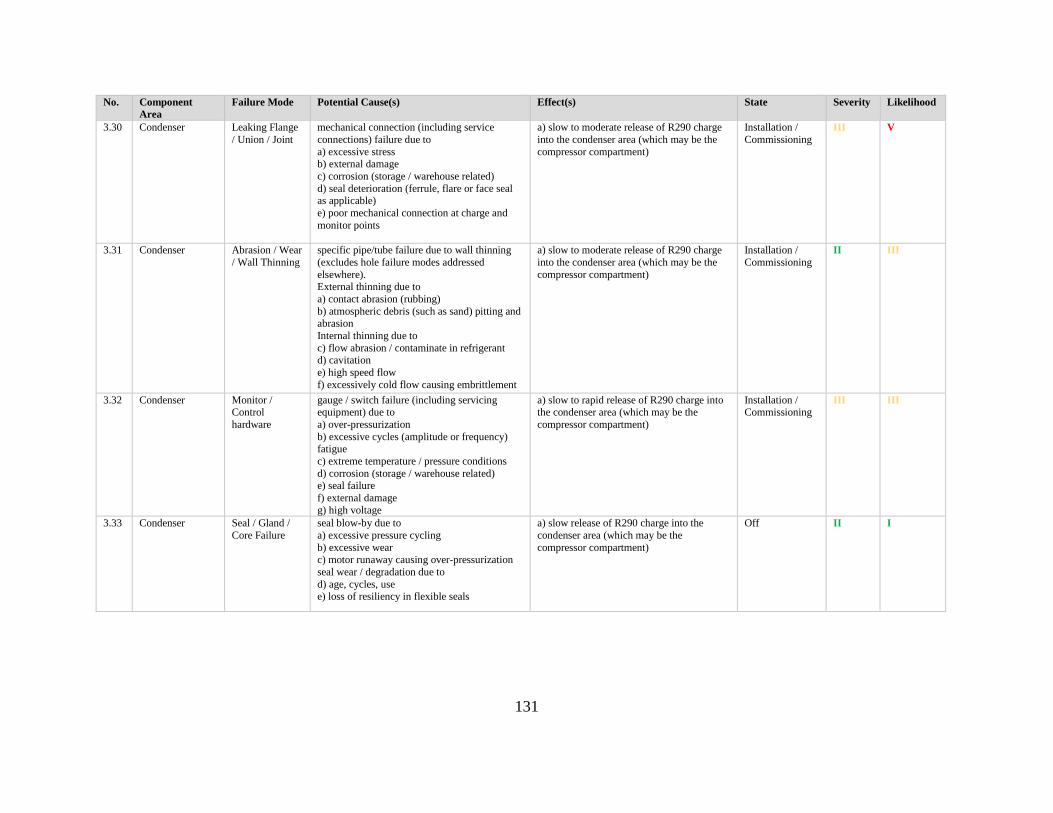
131
No. Component
Area
Failure Mode Potential Cause(s) Effect(s) State Severity Likelihood
3.30 Condenser Leaking Flange
/ Union / Joint
mechanical connection (including service
connections) failure due to
a) excessive stress b) external damage
c) corrosion (storage / warehouse related)
d) seal deterioration (ferrule, flare or face seal as applicable)
e) poor mechanical connection at charge and
monitor points
a) slow to moderate release of R290 charge
into the condenser area (which may be the
compressor compartment)
Installation /
Commissioning
III V
3.31 Condenser Abrasion / Wear
/ Wall Thinning
specific pipe/tube failure due to wall thinning
(excludes hole failure modes addressed
elsewhere). External thinning due to
a) contact abrasion (rubbing)
b) atmospheric debris (such as sand) pitting and abrasion
Internal thinning due to
c) flow abrasion / contaminate in refrigerant d) cavitation
e) high speed flow
f) excessively cold flow causing embrittlement
a) slow to moderate release of R290 charge
into the condenser area (which may be the
compressor compartment)
Installation /
Commissioning
II III
3.32 Condenser Monitor / Control
hardware
gauge / switch failure (including servicing equipment) due to
a) over-pressurization
b) excessive cycles (amplitude or frequency) fatigue
c) extreme temperature / pressure conditions
d) corrosion (storage / warehouse related) e) seal failure
f) external damage
g) high voltage
a) slow to rapid release of R290 charge into the condenser area (which may be the
compressor compartment)
Installation / Commissioning
III III
3.33 Condenser Seal / Gland /
Core Failure
seal blow-by due to
a) excessive pressure cycling
b) excessive wear c) motor runaway causing over-pressurization
seal wear / degradation due to
d) age, cycles, use e) loss of resiliency in flexible seals
a) slow release of R290 charge into the
condenser area (which may be the
compressor compartment)
Off II I
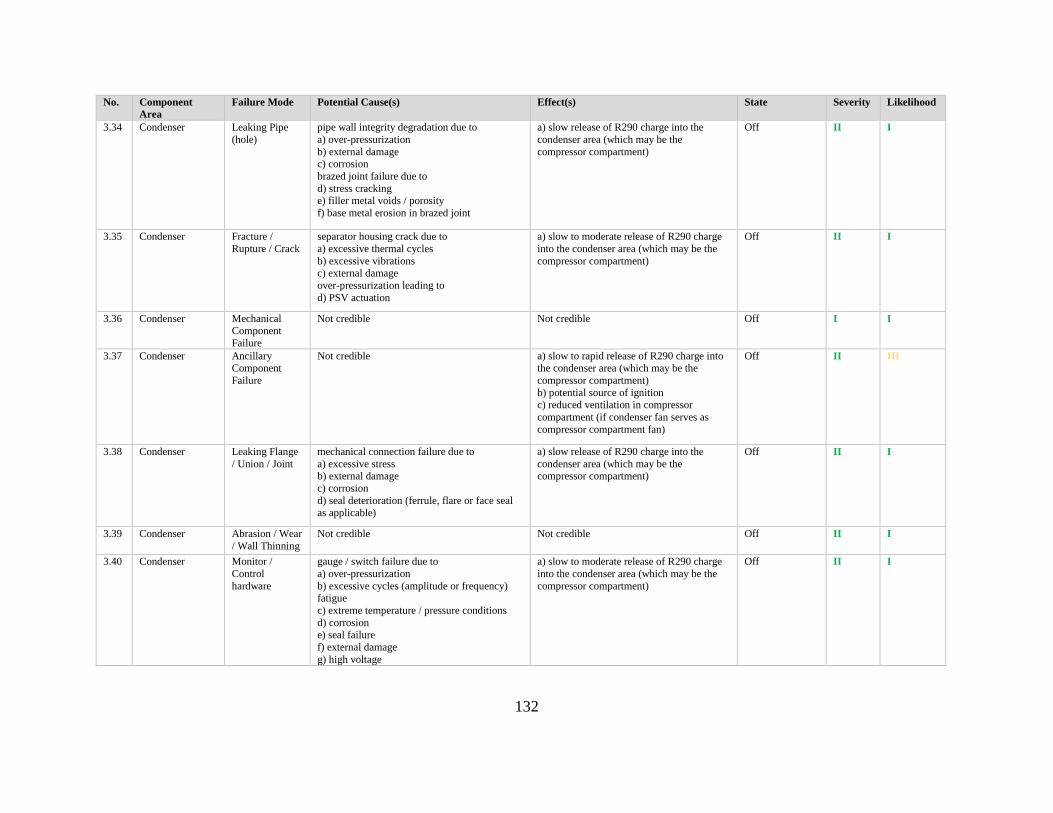
132
No. Component
Area
Failure Mode Potential Cause(s) Effect(s) State Severity Likelihood
3.34 Condenser Leaking Pipe
(hole)
pipe wall integrity degradation due to
a) over-pressurization
b) external damage c) corrosion
brazed joint failure due to
d) stress cracking e) filler metal voids / porosity
f) base metal erosion in brazed joint
a) slow release of R290 charge into the
condenser area (which may be the
compressor compartment)
Off II I
3.35 Condenser Fracture /
Rupture / Crack
separator housing crack due to
a) excessive thermal cycles
b) excessive vibrations c) external damage
over-pressurization leading to
d) PSV actuation
a) slow to moderate release of R290 charge
into the condenser area (which may be the
compressor compartment)
Off II I
3.36 Condenser Mechanical Component
Failure
Not credible Not credible Off I I
3.37 Condenser Ancillary
Component
Failure
Not credible a) slow to rapid release of R290 charge into
the condenser area (which may be the
compressor compartment)
b) potential source of ignition c) reduced ventilation in compressor
compartment (if condenser fan serves as
compressor compartment fan)
Off II III
3.38 Condenser Leaking Flange
/ Union / Joint
mechanical connection failure due to
a) excessive stress b) external damage
c) corrosion
d) seal deterioration (ferrule, flare or face seal
as applicable)
a) slow release of R290 charge into the
condenser area (which may be the compressor compartment)
Off II I
3.39 Condenser Abrasion / Wear
/ Wall Thinning
Not credible Not credible Off II I
3.40 Condenser Monitor /
Control
hardware
gauge / switch failure due to
a) over-pressurization
b) excessive cycles (amplitude or frequency) fatigue
c) extreme temperature / pressure conditions
d) corrosion e) seal failure
f) external damage
g) high voltage
a) slow to moderate release of R290 charge
into the condenser area (which may be the
compressor compartment)
Off II I

133
No. Component
Area
Failure Mode Potential Cause(s) Effect(s) State Severity Likelihood
4.01 Discharge Liquid
Line
Seal / Gland /
Core Failure
liquid receiver gasket / seal degradation due to
a) age, cycles, use
b) corrosionc) embrittlement
a) rapid release of R290 charge into the
compressor compartment and/or condenser
area (if applicable)
Operating IV I
4.02 Discharge Liquid
Line
Leaking Pipe
(hole)
pipe wall integrity degradation due to
a) over-pressurization
b) external damage
c) corrosion
brazed joint failure due to
d) stress cracking e) filler metal voids / porosity
f) base metal erosion in brazed joint
a) moderate to rapid release of R290 charge
into the compressor compartment and/or
condenser area (if applicable)
Operating IV II
4.03 Discharge Liquid Line
Fracture / Rupture / Crack
liquid receiver or drier housing crack due to a) excessive thermal cycles
b) excessive vibrations
c) external damage over-pressurization leading to
d) PSV actuation
sight-glass / shut-off valve / moisture indicator failure due to
e) corrosion
f) external damage g) age, cycles, fatigue
a) moderate to rapid release of R290 charge into the compressor compartment and/or
condenser area (if applicable)
Operating IV I
4.04 Discharge Liquid Line
Mechanical Component
Failure
Not credible Not credible Operating I I
4.05 Discharge Liquid
Line
Ancillary
Component Failure
complete subsystem failure (excluding cracked
or fractured case which is considered elsewhere)
a) over-pressurization
b) corrosion c) external damage
a) moderate to rapid release of R290 charge
into the compressor compartment and/or condenser area (if applicable)
b) potential source of ignition
Operating IV III
4.06 Discharge Liquid
Line
Leaking Flange
/ Union / Joint
mechanical connection failure due to
a) excessive stress b) external damage
c) corrosion
d) seal deterioration (ferrule, flare or face seal as applicable)
a) moderate to rapid release of R290 charge
into the compressor compartment and/or condenser area (if applicable)
Operating III IV

134
No. Component
Area
Failure Mode Potential Cause(s) Effect(s) State Severity Likelihood
4.07 Discharge Liquid
Line
Abrasion / Wear
/ Wall Thinning
specific pipe/tube failure due to wall thinning
(excludes hole failure modes addressed
elsewhere). External thinning due to
a) contact abrasion (rubbing)
b) atmospheric debris (such as sand) pitting and abrasion
Internal thinning due to
c) flow abrasion / contaminate in refrigerant d) cavitation
e) high speed flow
f) excessively cold flow causing embrittlement
a) moderate to rapid release of R290 charge
into the compressor compartment and/or
condenser area (if applicable)
Operating III III
4.08 Discharge Liquid
Line
Monitor /
Control
hardware
gauge / switch failure due to
a) over-pressurization
b) excessive cycles (amplitude or frequency) fatigue
c) extreme temperature / pressure conditions
d) corrosion e) seal failure
f) external damage
g) high voltage
a) moderate to rapid release of R290 charge
into the compressor compartment and/or
condenser area (if applicable)
Operating III II
4.09 Discharge Liquid Line
Leaking Pipe (hole)
liquid receiver gasket / seal degradation due to a) age, cycles, use
b) corrosion
c) embrittlement
a) moderate release of R290 charge into the compressor compartment and/or condenser
area (if applicable)
Operating - idle III I
4.10 Discharge Liquid Line
Seal / Gland / Core Failure
pipe wall integrity degradation due to a) over-pressurization
b) external damage
c) corrosion brazed joint failure due to
d) stress cracking
e) filler metal voids / porosity f) base metal erosion in brazed joint
a) moderate release of R290 charge into the compressor compartment and/or condenser
area (if applicable)
Operating - idle III II
4.11 Discharge Liquid
Line
Fracture /
Rupture / Crack
liquid receiver or drier housing crack due to
a) excessive thermal cycles b) excessive vibrations
c) external damage
over-pressurization leading to d) PSV actuation
sight-glass / shut-off valve / moisture indicator
failure due to e) corrosion
f) external damage
g) age, cycles, fatigue
a) moderate to rapid release of R290 charge
into the compressor compartment and/or condenser area (if applicable)
Operating - idle III I

135
No. Component
Area
Failure Mode Potential Cause(s) Effect(s) State Severity Likelihood
4.12 Discharge Liquid
Line
Mechanical
Component
Failure
Not credible Not credible Operating - idle I I
4.13 Discharge Liquid
Line
Ancillary
Component
Failure
complete subsystem failure (excluding cracked
or fractured case which is considered
elsewhere) a) over-pressurization
b) corrosion
c) external damage
a) moderate to rapid release of R290 charge
into the compressor compartment and/or
condenser area (if applicable) b) potential source of ignition
Operating - idle III III
4.14 Discharge Liquid Line
Leaking Flange / Union / Joint
mechanical connection failure due to a) excessive stress
b) external damage
c) corrosion d) seal deterioration (ferrule, flare or face seal
as applicable)
a) moderate to rapid release of R290 charge into the compressor compartment and/or
condenser area (if applicable)
Operating - idle III III
4.15 Discharge Liquid Line
Abrasion / Wear / Wall Thinning
specific pipe/tube failure due to wall thinning (excludes hole failure modes addressed
elsewhere).External thinning due to
a) contact abrasion (rubbing)
b) atmospheric debris (such as sand) pitting and
abrasion
Internal thinning due to c) flow abrasion / contaminate in refrigerant
d) cavitation
e) high speed flow f) excessively cold flow causing embrittlement
a) moderate release of R290 charge into the compressor compartment and/or condenser
area (if applicable)
Operating - idle II I
4.16 Discharge Liquid
Line
Monitor /
Control hardware
gauge / switch failure due to
a) over-pressurization b) excessive cycles (amplitude or frequency)
fatigue
c) extreme temperature / pressure conditions d) corrosion
e) seal failure
f) external damage g) high voltage
a) moderate to rapid release of R290 charge
into the compressor compartment and/or condenser area (if applicable)
Operating - idle III I
4.17 Discharge Liquid
Line
Seal / Gland /
Core Failure
Not credible Not credible Servicing I I
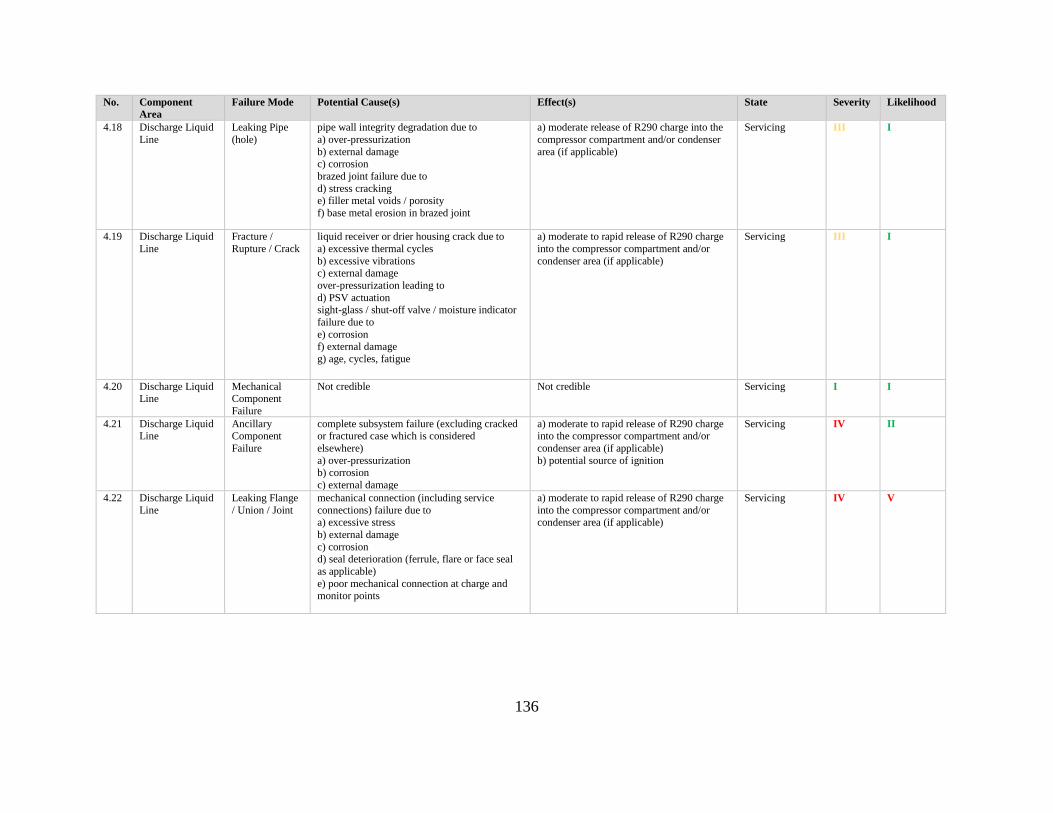
136
No. Component
Area
Failure Mode Potential Cause(s) Effect(s) State Severity Likelihood
4.18 Discharge Liquid
Line
Leaking Pipe
(hole)
pipe wall integrity degradation due to
a) over-pressurization
b) external damage c) corrosion
brazed joint failure due to
d) stress cracking e) filler metal voids / porosity
f) base metal erosion in brazed joint
a) moderate release of R290 charge into the
compressor compartment and/or condenser
area (if applicable)
Servicing III I
4.19 Discharge Liquid
Line
Fracture /
Rupture / Crack
liquid receiver or drier housing crack due to
a) excessive thermal cycles
b) excessive vibrations c) external damage
over-pressurization leading to
d) PSV actuation sight-glass / shut-off valve / moisture indicator
failure due to
e) corrosion f) external damage
g) age, cycles, fatigue
a) moderate to rapid release of R290 charge
into the compressor compartment and/or
condenser area (if applicable)
Servicing III I
4.20 Discharge Liquid Line
Mechanical Component
Failure
Not credible Not credible Servicing I I
4.21 Discharge Liquid Line
Ancillary Component
Failure
complete subsystem failure (excluding cracked or fractured case which is considered
elsewhere)
a) over-pressurization b) corrosion
c) external damage
a) moderate to rapid release of R290 charge into the compressor compartment and/or
condenser area (if applicable)
b) potential source of ignition
Servicing IV II
4.22 Discharge Liquid
Line
Leaking Flange
/ Union / Joint
mechanical connection (including service
connections) failure due to
a) excessive stress
b) external damage
c) corrosion d) seal deterioration (ferrule, flare or face seal
as applicable)
e) poor mechanical connection at charge and monitor points
a) moderate to rapid release of R290 charge
into the compressor compartment and/or
condenser area (if applicable)
Servicing IV V
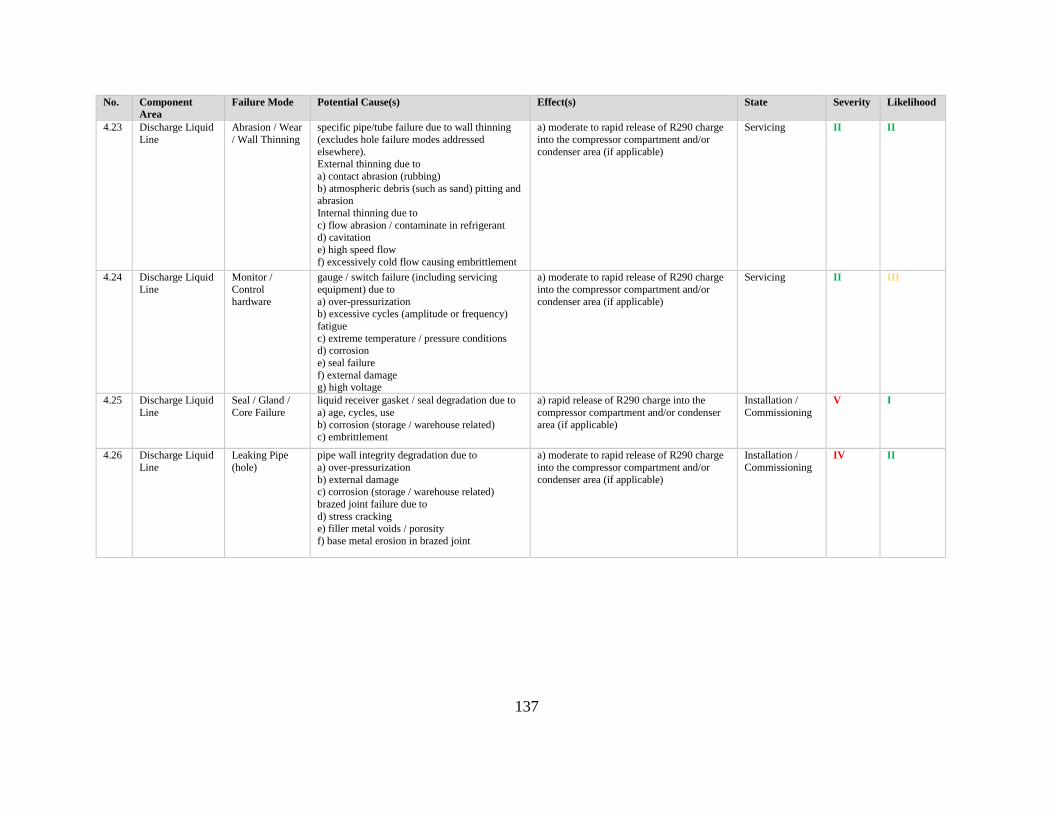
137
No. Component
Area
Failure Mode Potential Cause(s) Effect(s) State Severity Likelihood
4.23 Discharge Liquid
Line
Abrasion / Wear
/ Wall Thinning
specific pipe/tube failure due to wall thinning
(excludes hole failure modes addressed
elsewhere). External thinning due to
a) contact abrasion (rubbing)
b) atmospheric debris (such as sand) pitting and abrasion
Internal thinning due to
c) flow abrasion / contaminate in refrigerant d) cavitation
e) high speed flow
f) excessively cold flow causing embrittlement
a) moderate to rapid release of R290 charge
into the compressor compartment and/or
condenser area (if applicable)
Servicing II II
4.24 Discharge Liquid
Line
Monitor /
Control
hardware
gauge / switch failure (including servicing
equipment) due to
a) over-pressurization b) excessive cycles (amplitude or frequency)
fatigue
c) extreme temperature / pressure conditions d) corrosion
e) seal failure
f) external damage g) high voltage
a) moderate to rapid release of R290 charge
into the compressor compartment and/or
condenser area (if applicable)
Servicing II III
4.25 Discharge Liquid
Line
Seal / Gland /
Core Failure
liquid receiver gasket / seal degradation due to
a) age, cycles, use
b) corrosion (storage / warehouse related) c) embrittlement
a) rapid release of R290 charge into the
compressor compartment and/or condenser
area (if applicable)
Installation /
Commissioning
V I
4.26 Discharge Liquid
Line
Leaking Pipe
(hole)
pipe wall integrity degradation due to
a) over-pressurization
b) external damage c) corrosion (storage / warehouse related)
brazed joint failure due to
d) stress cracking e) filler metal voids / porosity
f) base metal erosion in brazed joint
a) moderate to rapid release of R290 charge
into the compressor compartment and/or
condenser area (if applicable)
Installation /
Commissioning
IV II

138
No. Component
Area
Failure Mode Potential Cause(s) Effect(s) State Severity Likelihood
4.27 Discharge Liquid
Line
Fracture /
Rupture / Crack
liquid receiver or drier housing crack due to a)
excessive thermal cyclesb) excessive
vibrationsc) external damageover-pressurization leading tod) PSV actuationsight-
glass / shut-off valve / moisture indicator failure
due toe) corrosion (storage / warehouse related)f) external damageh) age, cycles, fatigue
a) moderate to rapid release of R290 charge
into the compressor compartment and/or
condenser area (if applicable)
Installation /
Commissioning
IV II
4.28 Discharge Liquid
Line
Mechanical
Component
Failure
Not credible Not credible Installation /
Commissioning
I I
4.29 Discharge Liquid Line
Ancillary Component
Failure
complete subsystem failure (excluding cracked or fractured case which is considered
elsewhere)
a) over-pressurization
b) corrosion (storage / warehouse related)
c) external damage
a) moderate to rapid release of R290 charge into the compressor compartment and/or
condenser area (if applicable)
b) potential source of ignition
Installation / Commissioning
IV III
4.30 Discharge Liquid Line
Leaking Flange / Union / Joint
mechanical connection (including service connections) failure due to
a) excessive stress
b) external damage c) corrosion (storage / warehouse related)
d) seal deterioration (ferrule, flare or face seal
as applicable) e) poor mechanical connection at charge and
monitor points
a) moderate to rapid release of R290 charge into the compressor compartment and/or
condenser area (if applicable)
Installation / Commissioning
IV V
4.31 Discharge Liquid
Line
Abrasion / Wear
/ Wall Thinning
specific pipe/tube failure due to wall thinning
(excludes hole failure modes addressed elsewhere).
External thinning due to
a) contact abrasion (rubbing) b) atmospheric debris (such as sand) pitting and
abrasion
Internal thinning due to c) flow abrasion / contaminate in refrigerant
d) cavitation
e) high speed flow f) excessively cold flow causing embrittlement
a) moderate to rapid release of R290 charge
into the compressor compartment and/or condenser area (if applicable)
Installation /
Commissioning
III III

139
No. Component
Area
Failure Mode Potential Cause(s) Effect(s) State Severity Likelihood
4.32 Discharge Liquid
Line
Monitor /
Control
hardware
gauge / switch failure (including servicing
equipment) due to
a) over-pressurization b) excessive cycles (amplitude or frequency)
fatigue
c) extreme temperature / pressure conditions d) corrosion (storage / warehouse related)
e) seal failure
f) external damage g) high voltage
a) moderate to rapid release of R290 charge
into the compressor compartment and/or
condenser area (if applicable)
Installation /
Commissioning
IV III
4.33 Discharge Liquid
Line
Seal / Gland /
Core Failure
liquid receiver gasket / seal degradation due to
a) age, cycles, use b) corrosion
c) embrittlement
a) moderate release of R290 charge into the
compressor compartment and/or condenser area (if applicable)
Off III I
4.34 Discharge Liquid
Line
Leaking Pipe
(hole)
pipe wall integrity degradation due to
a) over-pressurization
b) external damage c) corrosion
brazed joint failure due to
d) stress cracking e) filler metal voids / porosity
f) base metal erosion in brazed joint
a) moderate release of R290 charge into the
compressor compartment and/or condenser
area (if applicable)
Off III II
4.35 Discharge Liquid
Line
Fracture /
Rupture / Crack
liquid receiver or drier housing crack due to
a) excessive thermal cycles
b) excessive vibrations c) external damage
over-pressurization leading to
d) PSV actuation sight-glass / shut-off valve / moisture indicator
failure due to
e) corrosion f) external damage
g) age, cycles, fatigue
a) moderate to rapid release of R290 charge
into the compressor compartment and/or
condenser area (if applicable)
Off III I
4.36 Discharge Liquid Line
Mechanical Component
Failure
Not credible Not credible Off I I
4.37 Discharge Liquid Line
Ancillary Component
Failure
complete subsystem failure (excluding cracked or fractured case which is considered
elsewhere)
a) over-pressurization b) corrosion
c) external damage
a) moderate to rapid release of R290 charge into the compressor compartment and/or
condenser area (if applicable)
b) potential source of ignition
Off III III

140
No. Component
Area
Failure Mode Potential Cause(s) Effect(s) State Severity Likelihood
4.38 Discharge Liquid
Line
Leaking Flange
/ Union / Joint
mechanical connection failure due to
a) excessive stress
b) external damage c) corrosion
d) seal deterioration (ferrule, flare or face seal
as applicable)
a) moderate release of R290 charge into the
compressor compartment and/or condenser
area (if applicable)
Off III I
4.39 Discharge Liquid
Line
Abrasion / Wear
/ Wall Thinning
specific pipe/tube failure due to wall thinning
(excludes hole failure modes addressed
elsewhere). External thinning due to
a) contact abrasion (rubbing)
b) atmospheric debris (such as sand) pitting and abrasion
Internal thinning due to
c) flow abrasion / contaminate in refrigerant d) cavitation
e) high speed flow
f) excessively cold flow causing embrittlement
a) moderate release of R290 charge into the
compressor compartment and/or condenser
area (if applicable)
Off III I
4.40 Discharge Liquid
Line
Monitor /
Control
hardware
gauge / switch failure due to
a) over-pressurization
b) excessive cycles (amplitude or frequency)
fatigue c) extreme temperature / pressure conditions
d) corrosion
e) seal failure f) external damage
g) high voltage
a) moderate to rapid release of R290 charge
into the compressor compartment and/or
condenser area (if applicable)
Off III I
5.01 Evaporator Seal / Gland / Core Failure
expansion throttling valve gasket / seal degradation due to
a) age, cycles, use
b) corrosion
c) embrittlement
a) moderate release of R290 charge into the refrigerated area via evaporator fan forced
convection
Operating III I
5.02 Evaporator Leaking Pipe
(hole)
pipe wall integrity degradation due to
a) over-pressurization b) external damage
c) corrosion
brazed joint failure due to d) stress cracking
e) filler metal voids / porosity
f) base metal erosion in brazed joint
a) slow to rapid release of R290 charge into
the refrigerated area via evaporator fan forced convection
Operating III II

141
No. Component
Area
Failure Mode Potential Cause(s) Effect(s) State Severity Likelihood
5.03 Evaporator Fracture /
Rupture / Crack
expansion throttling valve housing crack due to
a) excessive thermal cycles
b) excessive vibrations c) external damage
over-pressurization leading to
d) PSV actuation
a) slow to rapid release of R290 charge into
the refrigerated area via evaporator fan
forced convection
Operating III I
5.04 Evaporator Mechanical
Component
Failure
Not credible Not credible Operating I I
5.05 Evaporator Ancillary Component
Failure
complete subsystem failure (excluding cracked or fractured case which is considered
elsewhere)
a) PSV failure b) evaporator fan failure
c) evaporator support structure failure
d) external damage
a) slow to rapid release of R290 charge into the refrigerated area via evaporator fan
forced convection
b) potential source of ignition c) excessively cold operation in evaporator
Operating III III
5.06 Evaporator Leaking Flange
/ Union / Joint
mechanical connection failure due to
a) excessive stress
b) external damage
c) corrosion
d) seal deterioration (ferrule, flare or face seal
as applicable)
a) slow to moderate release of R290 charge
into the refrigerated area via evaporator fan
forced convection
Operating II IV
5.07 Evaporator Abrasion / Wear / Wall Thinning
specific pipe/tube failure due to wall thinning (excludes hole failure modes addressed
elsewhere).
External thinning due to a) contact abrasion (rubbing)
b) atmospheric debris (such as sand) pitting and
abrasion Internal thinning due to
c) flow abrasion / contaminate in refrigerant
d) cavitation e) high speed flow
f) excessively cold flow causing embrittlement
a) slow to moderate release of R290 charge into the refrigerated area via evaporator fan
forced convection
Operating II III
5.08 Evaporator Monitor / Control
hardware
gauge / switch failure due to a) over-pressurization
b) excessive cycles (amplitude or frequency)
fatigue c) extreme temperature / pressure conditions
d) corrosion
e) seal failure f) external damage
g) high voltage
a) slow to rapid release of R290 charge into the refrigerated area via evaporator fan
forced convection
Operating II II

142
No. Component
Area
Failure Mode Potential Cause(s) Effect(s) State Severity Likelihood
5.09 Evaporator Leaking Pipe
(hole)
expansion throttling valve gasket / seal
degradation due to
a) age, cycles, use b) corrosion
c) embrittlement
a) slow release of R290 charge into the
refrigerated area via evaporator fan forced
convection
Operating - idle II I
5.10 Evaporator Seal / Gland /
Core Failure
pipe wall integrity degradation due to
a) over-pressurization
b) external damage c) corrosion
brazed joint failure due to
d) stress cracking e) filler metal voids / porosity
f) base metal erosion in brazed joint
a) slow release of R290 charge into the
refrigerated area via evaporator fan forced
convection
Operating - idle II II
5.11 Evaporator Fracture / Rupture / Crack
expansion throttling valve housing crack due to a) excessive thermal cycles
b) excessive vibrations
c) external damage over-pressurization leading to
d) PSV actuation
a) slow to moderate release of R290 charge into the refrigerated area via evaporator fan
forced convection
Operating - idle II I
5.12 Evaporator Mechanical Component
Failure
Not credible Not credible Operating - idle I I
5.13 Evaporator Ancillary
Component Failure
complete subsystem failure (excluding cracked
or fractured case which is considered elsewhere)
a) PSV failure
b) evaporator fan failure c) evaporator support structure failure
d) external damage
a) slow to rapid release of R290 charge into
the refrigerated area via evaporator fan forced convection
b) potential source of ignition
c) moderate release of hot oil from reservoir / separator into condenser or compressor
areas.
Operating - idle II III
5.14 Evaporator Leaking Flange
/ Union / Joint
mechanical connection failure due to
a) excessive stress b) external damage
c) corrosion
d) seal deterioration (ferrule, flare or face seal as applicable)
a) slow to moderate release of R290 charge
into the refrigerated area via evaporator fan forced convection
Operating - idle II III

143
No. Component
Area
Failure Mode Potential Cause(s) Effect(s) State Severity Likelihood
5.15 Evaporator Abrasion / Wear
/ Wall Thinning
specific pipe/tube failure due to wall thinning
(excludes hole failure modes addressed
elsewhere). External thinning due to
a) contact abrasion (rubbing)
b) atmospheric debris (such as sand) pitting and abrasion
Internal thinning due to
c) flow abrasion / contaminate in refrigerant d) cavitation
e) high speed flow
f) excessively cold flow causing embrittlement
a) slow release of R290 charge into the
refrigerated area via evaporator fan forced
convection
Operating - idle II I
5.16 Evaporator Monitor /
Control
hardware
gauge / switch failure due to
a) over-pressurization
b) excessive cycles (amplitude or frequency) fatigue
c) extreme temperature / pressure conditions
d) corrosion e) seal failure
f) external damage
g) high voltage
a) slow to moderate release of R290 charge
into the refrigerated area via evaporator fan
forced convection
Operating - idle II I
5.17 Evaporator Seal / Gland / Core Failure
Not credible Not credible Servicing I I
5.18 Evaporator Leaking Pipe (hole)
pipe wall integrity degradation due to a) over-pressurization
b) external damage
c) corrosion brazed joint failure due to
d) stress cracking
e) filler metal voids / porosity f) base metal erosion in brazed joint
a) slow release of R290 charge into the refrigerated area via evaporator fan forced
convection
Servicing II I
5.19 Evaporator Fracture /
Rupture / Crack
expansion throttling valve housing crack due to
a) excessive thermal cycles b) excessive vibrations
c) external damage
over-pressurization leading to d) PSV actuation
a) slow to moderate release of R290 charge
into the refrigerated area via evaporator fan forced convection
Servicing II I
5.20 Evaporator Mechanical
Component Failure
Not credible Not credible Servicing I I

144
No. Component
Area
Failure Mode Potential Cause(s) Effect(s) State Severity Likelihood
5.21 Evaporator Ancillary
Component
Failure
complete subsystem failure (excluding cracked
or fractured case which is considered
elsewhere) a) PSV failure
b) evaporator fan failure
c) evaporator support structure failure d) external damage
a) slow to rapid release of R290 charge into
the refrigerated area via evaporator fan
forced convection b) potential source of ignition
c) high fuel concentration in compressor
compartment
Servicing III II
5.22 Evaporator Leaking Flange
/ Union / Joint
mechanical connection (including service
connections) failure due to a) excessive stress
b) external damage
c) corrosion d) seal deterioration (ferrule, flare or face seal
as applicable)
e) poor mechanical connection at charge and monitor points
a) slow to moderate release of R290 charge
into the refrigerated area via evaporator fan forced convection
Servicing III V
5.23 Evaporator Abrasion / Wear
/ Wall Thinning
specific pipe/tube failure due to wall thinning
(excludes hole failure modes addressed
elsewhere).
External thinning due to
a) contact abrasion (rubbing)
b) atmospheric debris (such as sand) pitting and abrasion
Internal thinning due to
c) flow abrasion / contaminate in refrigerant d) cavitation
e) high speed flow
f) excessively cold flow causing embrittlement
a) slow to moderate release of R290 charge
into the refrigerated area via evaporator fan
forced convection
Servicing II III
5.24 Evaporator Monitor /
Control
hardware
gauge / switch failure (including servicing
equipment) due to
a) over-pressurization
b) excessive cycles (amplitude or frequency)
fatigue
c) extreme temperature / pressure conditions d) corrosion
e) seal failure
f) external damage g) high voltage
a) slow to moderate release of R290 charge
into the refrigerated area via evaporator fan
forced convection
Servicing II III
5.25 Evaporator Seal / Gland /
Core Failure
expansion throttling valve gasket / seal
degradation due to a) age, cycles, use
b) corrosion (storage / warehouse related)
c) embrittlement
a) moderate release of R290 charge into the
refrigerated area via evaporator fan forced convection
Installation /
Commissioning
IV I

145
No. Component
Area
Failure Mode Potential Cause(s) Effect(s) State Severity Likelihood
5.26 Evaporator Leaking Pipe
(hole)
pipe wall integrity degradation due to
a) over-pressurization
b) external damage c) corrosion (storage / warehouse related)
brazed joint failure due to
d) stress cracking e) filler metal voids / porosity
f) base metal erosion in brazed joint
a) slow to rapid release of R290 charge into
the refrigerated area via evaporator fan
forced convection
Installation /
Commissioning
III II
5.27 Evaporator Fracture /
Rupture / Crack
expansion throttling valve housing crack due to
a) excessive thermal cycles
b) excessive vibrations c) external damage
over-pressurization leading to
d) PSV actuation
a) slow to rapid release of R290 charge into
the refrigerated area via evaporator fan
forced convection
Installation /
Commissioning
III II
5.28 Evaporator Mechanical Component
Failure
Not credible Not credible Installation / Commissioning
I I
5.29 Evaporator Ancillary
Component
Failure
complete subsystem failure (excluding cracked
or fractured case which is considered
elsewhere)
a) PSV failure b) evaporator fan failure
c) evaporator support structure failure
d) external damage
a) slow to rapid release of R290 charge into
the refrigerated area via evaporator fan
forced convection
b) potential source of ignition c) excessively cold operation in evaporator
Installation /
Commissioning
III III
5.30 Evaporator Leaking Flange / Union / Joint
mechanical connection (including service connections) failure due to
a) excessive stress
b) external damage c) corrosion (storage / warehouse related)
d) seal deterioration (ferrule, flare or face seal
as applicable) e) poor mechanical connection at charge and
monitor points
a) slow to moderate release of R290 charge into the refrigerated area via evaporator fan
forced convection
Installation / Commissioning
III V

146
No. Component
Area
Failure Mode Potential Cause(s) Effect(s) State Severity Likelihood
5.31 Evaporator Abrasion / Wear
/ Wall Thinning
specific pipe/tube failure due to wall thinning
(excludes hole failure modes addressed
elsewhere). External thinning due to
a) contact abrasion (rubbing)
b) atmospheric debris (such as sand) pitting and abrasion
Internal thinning due to
c) flow abrasion / contaminate in refrigerant d) cavitation
e) high speed flow
f) excessively cold flow causing embrittlement
a) slow to moderate release of R290 charge
into the refrigerated area via evaporator fan
forced convection
Installation /
Commissioning
II III
5.32 Evaporator Monitor /
Control
hardware
gauge / switch failure (including servicing
equipment) due to
a) over-pressurization b) excessive cycles (amplitude or frequency)
fatigue
c) extreme temperature / pressure conditions d) corrosion (storage / warehouse related)
e) seal failure
f) external damage g) high voltage
a) slow to rapid release of R290 charge into
the refrigerated area via evaporator fan
forced convection
Installation /
Commissioning
III III
5.33 Evaporator Seal / Gland /
Core Failure
expansion throttling valve gasket / seal
degradation due to
a) age, cycles, use b) corrosion
c) embrittlement
a) slow release of R290 charge into the
refrigerated area via evaporator fan forced
convection
Off II I
5.34 Evaporator Leaking Pipe
(hole)
pipe wall integrity degradation due to
a) over-pressurization
b) external damage c) corrosion
brazed joint failure due to
d) stress cracking e) filler metal voids / porosity
f) base metal erosion in brazed joint
a) slow release of R290 charge into the
refrigerated area via evaporator fan forced
convection
Off II II
5.35 Evaporator Fracture /
Rupture / Crack
expansion throttling valve housing crack due to
a) excessive thermal cycles b) excessive vibrations
c) external damage
over-pressurization leading to d) PSV actuation
a) slow to moderate release of R290 charge
into the refrigerated area via evaporator fan forced convection
Off II I
5.36 Evaporator Mechanical
Component Failure
Not credible Not credible Off I I
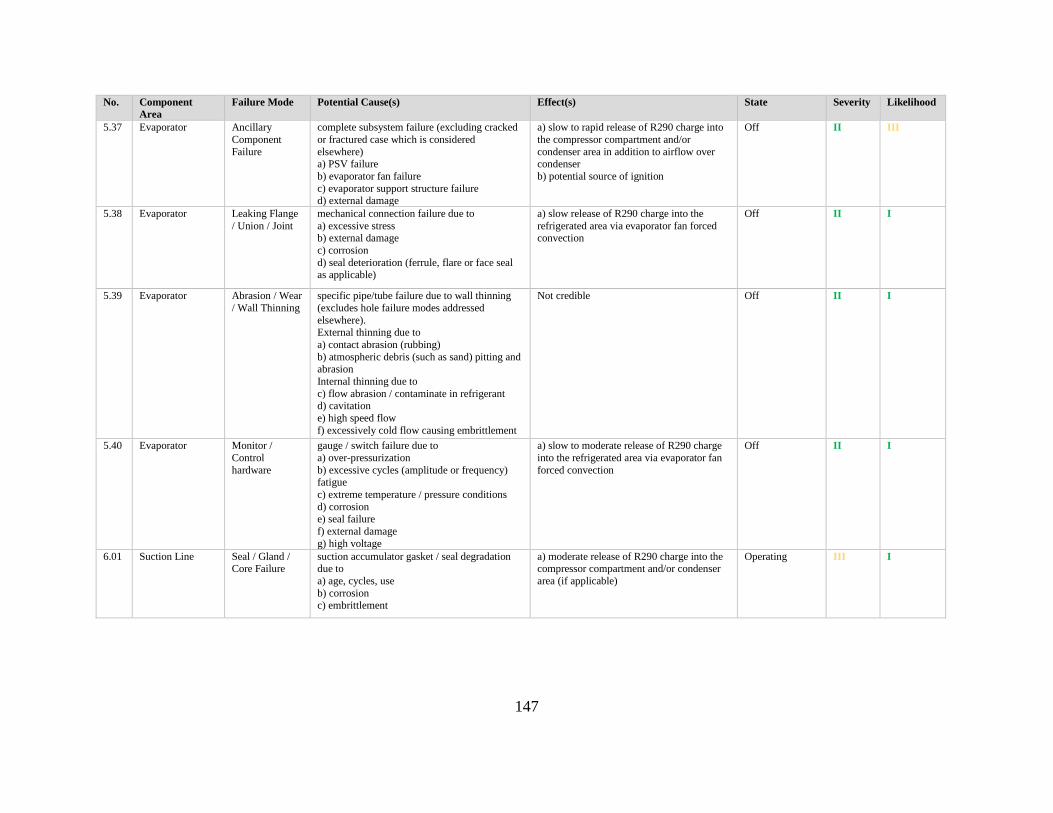
147
No. Component
Area
Failure Mode Potential Cause(s) Effect(s) State Severity Likelihood
5.37 Evaporator Ancillary
Component
Failure
complete subsystem failure (excluding cracked
or fractured case which is considered
elsewhere) a) PSV failure
b) evaporator fan failure
c) evaporator support structure failure d) external damage
a) slow to rapid release of R290 charge into
the compressor compartment and/or
condenser area in addition to airflow over condenser
b) potential source of ignition
Off II III
5.38 Evaporator Leaking Flange
/ Union / Joint
mechanical connection failure due to
a) excessive stress b) external damage
c) corrosion
d) seal deterioration (ferrule, flare or face seal as applicable)
a) slow release of R290 charge into the
refrigerated area via evaporator fan forced convection
Off II I
5.39 Evaporator Abrasion / Wear
/ Wall Thinning
specific pipe/tube failure due to wall thinning
(excludes hole failure modes addressed
elsewhere). External thinning due to
a) contact abrasion (rubbing)
b) atmospheric debris (such as sand) pitting and
abrasion
Internal thinning due to
c) flow abrasion / contaminate in refrigerant d) cavitation
e) high speed flow
f) excessively cold flow causing embrittlement
Not credible Off II I
5.40 Evaporator Monitor /
Control
hardware
gauge / switch failure due to
a) over-pressurization
b) excessive cycles (amplitude or frequency) fatigue
c) extreme temperature / pressure conditions
d) corrosion
e) seal failure
f) external damage
g) high voltage
a) slow to moderate release of R290 charge
into the refrigerated area via evaporator fan
forced convection
Off II I
6.01 Suction Line Seal / Gland / Core Failure
suction accumulator gasket / seal degradation due to
a) age, cycles, use
b) corrosion c) embrittlement
a) moderate release of R290 charge into the compressor compartment and/or condenser
area (if applicable)
Operating III I
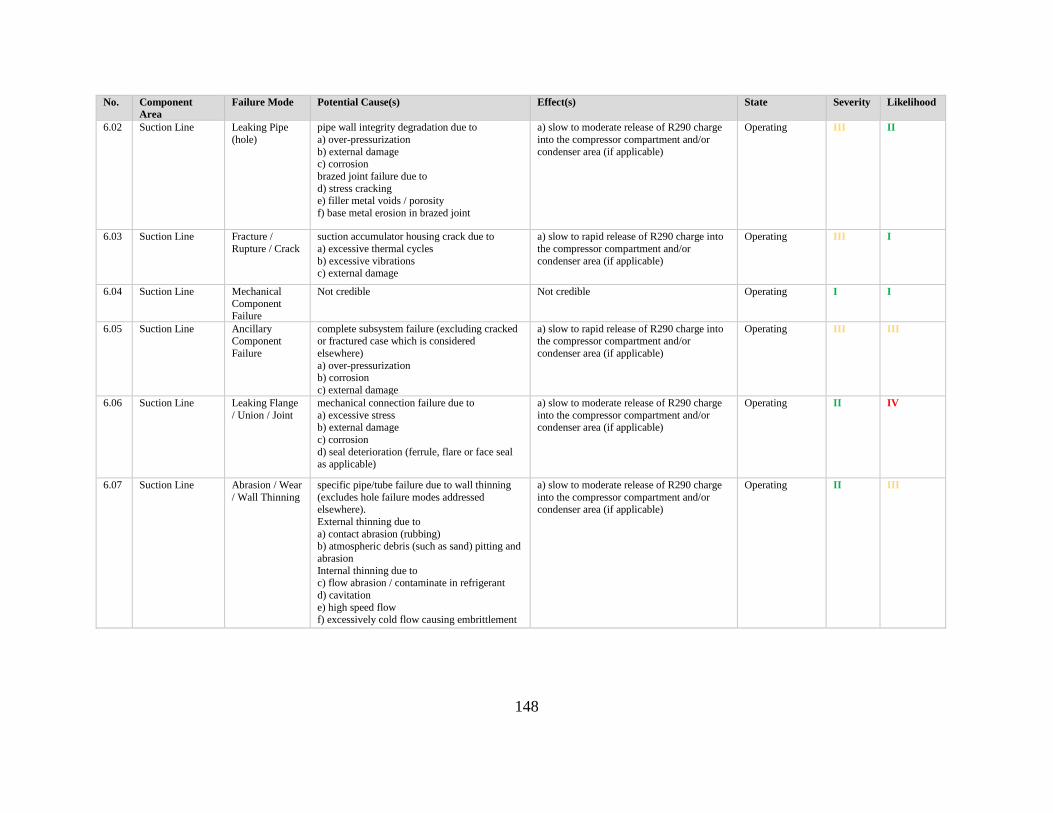
148
No. Component
Area
Failure Mode Potential Cause(s) Effect(s) State Severity Likelihood
6.02 Suction Line Leaking Pipe
(hole)
pipe wall integrity degradation due to
a) over-pressurization
b) external damage c) corrosion
brazed joint failure due to
d) stress cracking e) filler metal voids / porosity
f) base metal erosion in brazed joint
a) slow to moderate release of R290 charge
into the compressor compartment and/or
condenser area (if applicable)
Operating III II
6.03 Suction Line Fracture /
Rupture / Crack
suction accumulator housing crack due to
a) excessive thermal cycles
b) excessive vibrations c) external damage
a) slow to rapid release of R290 charge into
the compressor compartment and/or
condenser area (if applicable)
Operating III I
6.04 Suction Line Mechanical Component
Failure
Not credible Not credible Operating I I
6.05 Suction Line Ancillary Component
Failure
complete subsystem failure (excluding cracked or fractured case which is considered
elsewhere)
a) over-pressurization b) corrosion
c) external damage
a) slow to rapid release of R290 charge into the compressor compartment and/or
condenser area (if applicable)
Operating III III
6.06 Suction Line Leaking Flange
/ Union / Joint
mechanical connection failure due to
a) excessive stress b) external damage
c) corrosion
d) seal deterioration (ferrule, flare or face seal as applicable)
a) slow to moderate release of R290 charge
into the compressor compartment and/or condenser area (if applicable)
Operating II IV
6.07 Suction Line Abrasion / Wear
/ Wall Thinning
specific pipe/tube failure due to wall thinning
(excludes hole failure modes addressed elsewhere).
External thinning due to
a) contact abrasion (rubbing) b) atmospheric debris (such as sand) pitting and
abrasion
Internal thinning due to c) flow abrasion / contaminate in refrigerant
d) cavitation
e) high speed flow f) excessively cold flow causing embrittlement
a) slow to moderate release of R290 charge
into the compressor compartment and/or condenser area (if applicable)
Operating II III
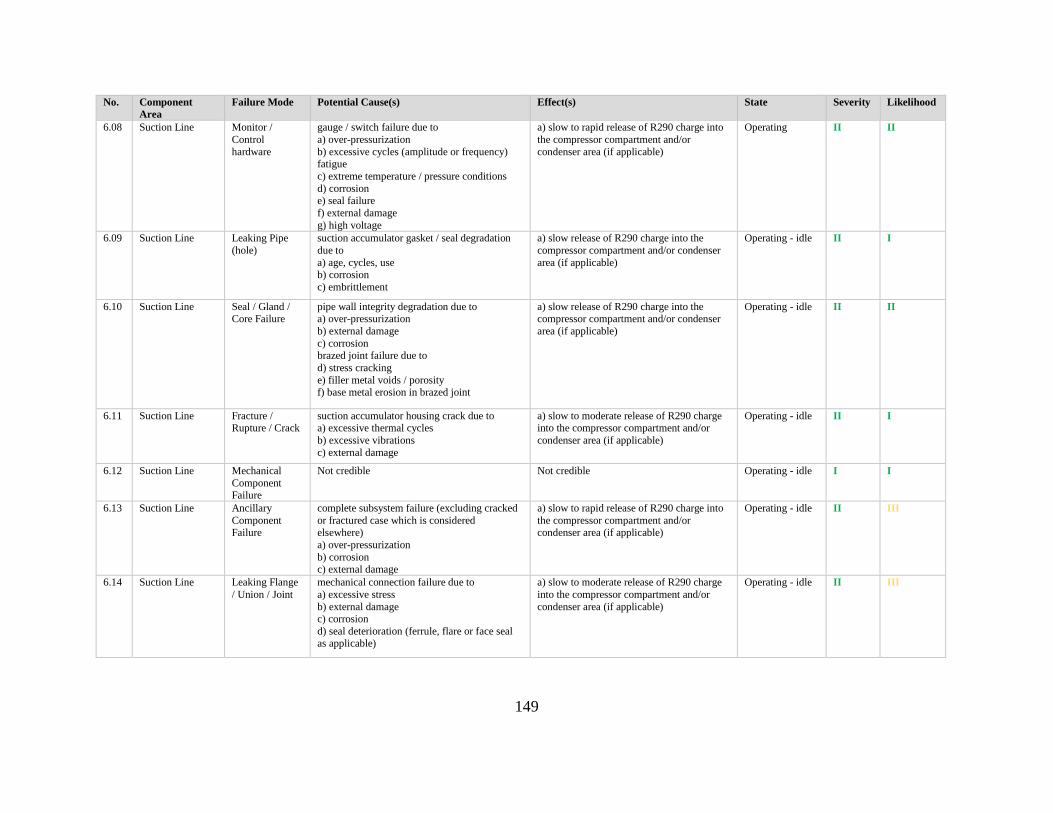
149
No. Component
Area
Failure Mode Potential Cause(s) Effect(s) State Severity Likelihood
6.08 Suction Line Monitor /
Control
hardware
gauge / switch failure due to
a) over-pressurization
b) excessive cycles (amplitude or frequency) fatigue
c) extreme temperature / pressure conditions
d) corrosion e) seal failure
f) external damage
g) high voltage
a) slow to rapid release of R290 charge into
the compressor compartment and/or
condenser area (if applicable)
Operating II II
6.09 Suction Line Leaking Pipe
(hole)
suction accumulator gasket / seal degradation
due to
a) age, cycles, use b) corrosion
c) embrittlement
a) slow release of R290 charge into the
compressor compartment and/or condenser
area (if applicable)
Operating - idle II I
6.10 Suction Line Seal / Gland / Core Failure
pipe wall integrity degradation due to a) over-pressurization
b) external damage
c) corrosion brazed joint failure due to
d) stress cracking
e) filler metal voids / porosity f) base metal erosion in brazed joint
a) slow release of R290 charge into the compressor compartment and/or condenser
area (if applicable)
Operating - idle II II
6.11 Suction Line Fracture / Rupture / Crack
suction accumulator housing crack due to a) excessive thermal cycles
b) excessive vibrations
c) external damage
a) slow to moderate release of R290 charge into the compressor compartment and/or
condenser area (if applicable)
Operating - idle II I
6.12 Suction Line Mechanical
Component Failure
Not credible Not credible Operating - idle I I
6.13 Suction Line Ancillary
Component Failure
complete subsystem failure (excluding cracked
or fractured case which is considered elsewhere)
a) over-pressurization
b) corrosion c) external damage
a) slow to rapid release of R290 charge into
the compressor compartment and/or condenser area (if applicable)
Operating - idle II III
6.14 Suction Line Leaking Flange
/ Union / Joint
mechanical connection failure due to
a) excessive stress
b) external damage c) corrosion
d) seal deterioration (ferrule, flare or face seal as applicable)
a) slow to moderate release of R290 charge
into the compressor compartment and/or
condenser area (if applicable)
Operating - idle II III
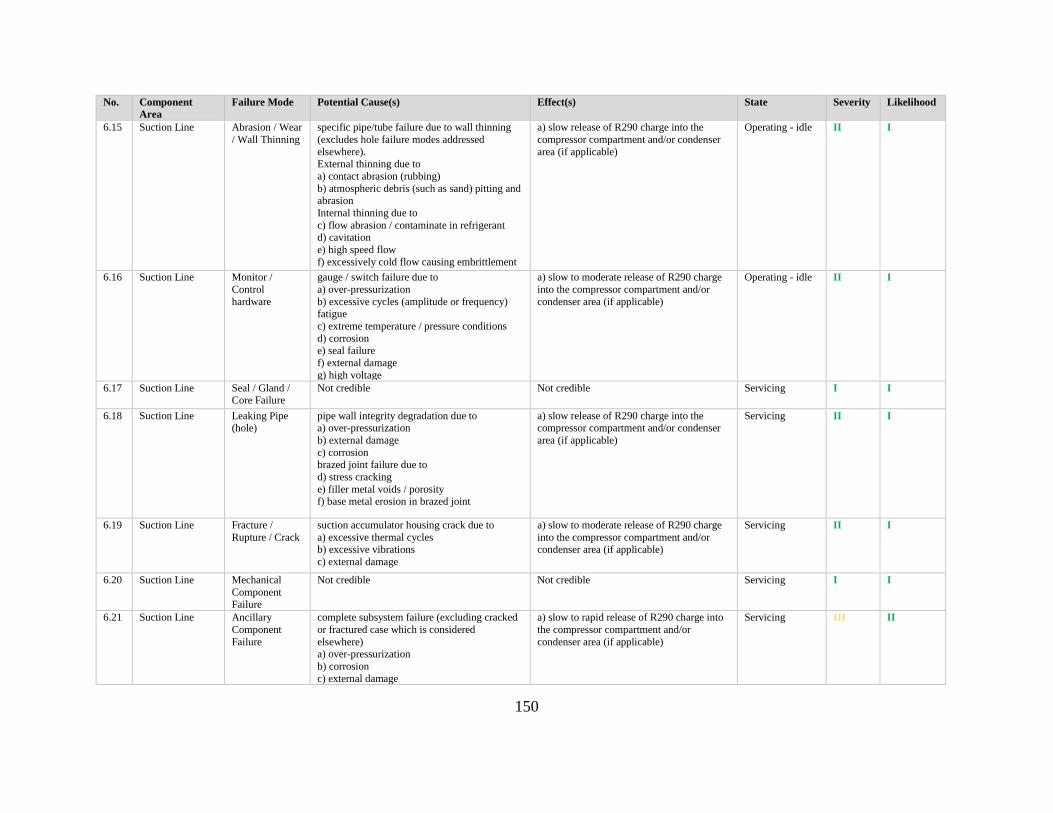
150
No. Component
Area
Failure Mode Potential Cause(s) Effect(s) State Severity Likelihood
6.15 Suction Line Abrasion / Wear
/ Wall Thinning
specific pipe/tube failure due to wall thinning
(excludes hole failure modes addressed
elsewhere). External thinning due to
a) contact abrasion (rubbing)
b) atmospheric debris (such as sand) pitting and abrasion
Internal thinning due to
c) flow abrasion / contaminate in refrigerant d) cavitation
e) high speed flow
f) excessively cold flow causing embrittlement
a) slow release of R290 charge into the
compressor compartment and/or condenser
area (if applicable)
Operating - idle II I
6.16 Suction Line Monitor /
Control
hardware
gauge / switch failure due to
a) over-pressurization
b) excessive cycles (amplitude or frequency) fatigue
c) extreme temperature / pressure conditions
d) corrosion e) seal failure
f) external damage
g) high voltage
a) slow to moderate release of R290 charge
into the compressor compartment and/or
condenser area (if applicable)
Operating - idle II I
6.17 Suction Line Seal / Gland / Core Failure
Not credible Not credible Servicing I I
6.18 Suction Line Leaking Pipe (hole)
pipe wall integrity degradation due to a) over-pressurization
b) external damage
c) corrosion brazed joint failure due to
d) stress cracking
e) filler metal voids / porosity f) base metal erosion in brazed joint
a) slow release of R290 charge into the compressor compartment and/or condenser
area (if applicable)
Servicing II I
6.19 Suction Line Fracture /
Rupture / Crack
suction accumulator housing crack due to
a) excessive thermal cycles b) excessive vibrations
c) external damage
a) slow to moderate release of R290 charge
into the compressor compartment and/or condenser area (if applicable)
Servicing II I
6.20 Suction Line Mechanical
Component Failure
Not credible Not credible Servicing I I
6.21 Suction Line Ancillary
Component
Failure
complete subsystem failure (excluding cracked
or fractured case which is considered
elsewhere) a) over-pressurization
b) corrosion
c) external damage
a) slow to rapid release of R290 charge into
the compressor compartment and/or
condenser area (if applicable)
Servicing III II

151
No. Component
Area
Failure Mode Potential Cause(s) Effect(s) State Severity Likelihood
6.22 Suction Line Leaking Flange
/ Union / Joint
mechanical connection (including service
connections) failure due to
a) excessive stress b) external damage
c) corrosion
d) seal deterioration (ferrule, flare or face seal as applicable)
e) poor mechanical connection at charge and
monitor points
a) slow to moderate release of R290 charge
into the compressor compartment and/or
condenser area (if applicable)
Servicing III V
6.23 Suction Line Abrasion / Wear
/ Wall Thinning
specific pipe/tube failure due to wall thinning
(excludes hole failure modes addressed
elsewhere). External thinning due to
a) contact abrasion (rubbing)
b) atmospheric debris (such as sand) pitting and abrasion
Internal thinning due to
c) flow abrasion / contaminate in refrigerant d) cavitation
e) high speed flow
f) excessively cold flow causing embrittlement
a) slow to moderate release of R290 charge
into the compressor compartment and/or
condenser area (if applicable)
Servicing II III
6.24 Suction Line Monitor / Control
hardware
gauge / switch failure (including servicing equipment) due to
a) over-pressurization
b) excessive cycles (amplitude or frequency) fatigue
c) extreme temperature / pressure conditions
d) corrosion e) seal failure
f) external damage
g) high voltage
a) slow to moderate release of R290 charge into the compressor compartment and/or
condenser area (if applicable)
Servicing II III
6.25 Suction Line Seal / Gland /
Core Failure
suction accumulator gasket / seal degradation
due to
a) age, cycles, use b) corrosion (storage / warehouse related)
c) embrittlement
a) moderate release of R290 charge into the
compressor compartment and/or condenser
area (if applicable)
Installation /
Commissioning
IV I
6.26 Suction Line Leaking Pipe (hole)
pipe wall integrity degradation due to a) over-pressurization
b) external damage
c) corrosion (storage / warehouse related) brazed joint failure due to
d) stress cracking
e) filler metal voids / porosity f) base metal erosion in brazed joint
a) slow to rapid release of R290 charge into the compressor compartment and/or
condenser area (if applicable)
Installation / Commissioning
III II

152
No. Component
Area
Failure Mode Potential Cause(s) Effect(s) State Severity Likelihood
6.27 Suction Line Fracture /
Rupture / Crack
suction accumulator housing crack due to
a) excessive thermal cycles
b) excessive vibrations c) external damage
a) slow to rapid release of R290 charge into
the compressor compartment and/or
condenser area (if applicable)
Installation /
Commissioning
III II
6.28 Suction Line Mechanical
Component
Failure
Not credible Not credible Installation /
Commissioning
I I
6.29 Suction Line Ancillary Component
Failure
complete subsystem failure (excluding cracked or fractured case which is considered
elsewhere)
a) over-pressurization b) corrosion (storage / warehouse related)
c) external damage
a) slow to rapid release of R290 charge into the compressor compartment and/or
condenser area (if applicable)
Installation / Commissioning
III III
6.30 Suction Line Leaking Flange / Union / Joint
mechanical connection (including service connections) failure due to
a) excessive stress
b) external damage c) corrosion (storage / warehouse related)
d) seal deterioration (ferrule, flare or face seal
as applicable) e) poor mechanical connection at charge and
monitor points
a) slow to moderate release of R290 charge into the compressor compartment and/or
condenser area (if applicable)
Installation / Commissioning
III V
6.31 Suction Line Abrasion / Wear
/ Wall Thinning
specific pipe/tube failure due to wall thinning
(excludes hole failure modes addressed elsewhere).
External thinning due to
a) contact abrasion (rubbing) b) atmospheric debris (such as sand) pitting and
abrasion
Internal thinning due to
c) flow abrasion / contaminate in refrigerant
d) cavitation
e) high speed flow f) excessively cold flow causing embrittlement
a) slow to moderate release of R290 charge
into the compressor compartment and/or condenser area (if applicable)
Installation /
Commissioning
II III
6.32 Suction Line Monitor /
Control hardware
gauge / switch failure (including servicing
equipment) due to a) over-pressurization
b) excessive cycles (amplitude or frequency)
fatigue c) extreme temperature / pressure conditions
d) corrosion (storage / warehouse related)
e) seal failure
f) external damage
g) high voltage
a) slow to rapid release of R290 charge into
the compressor compartment and/or condenser area (if applicable)
Installation /
Commissioning
III III
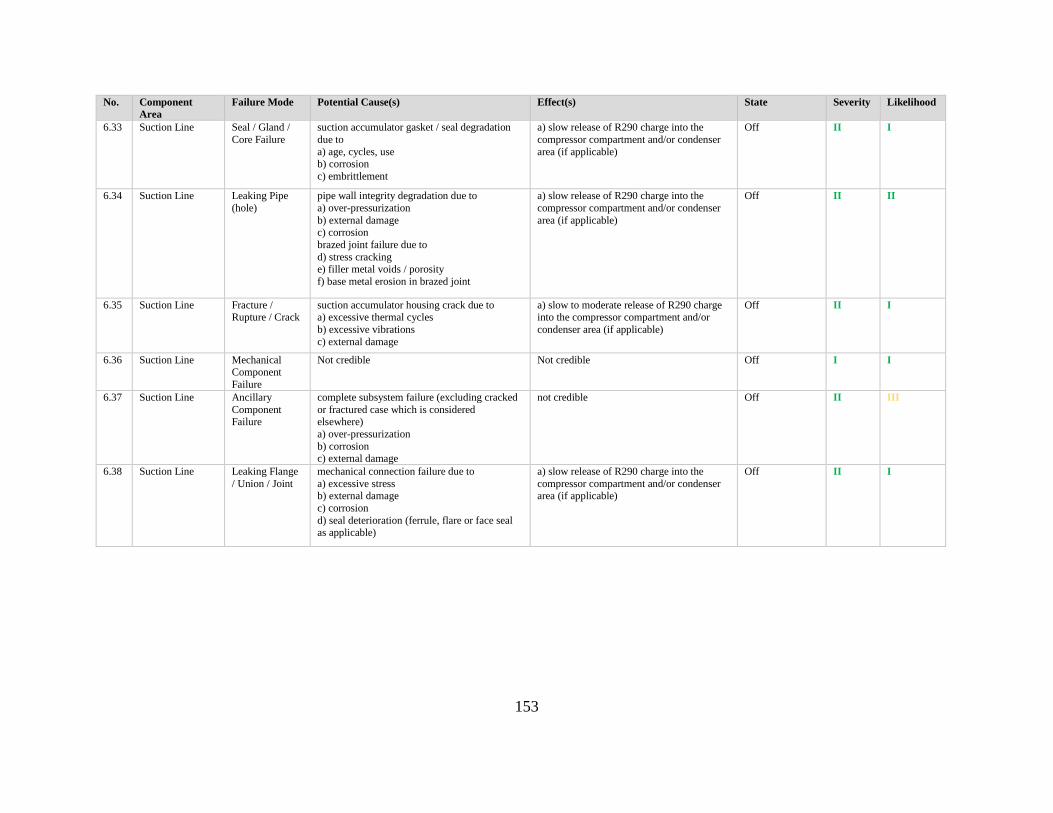
153
No. Component
Area
Failure Mode Potential Cause(s) Effect(s) State Severity Likelihood
6.33 Suction Line Seal / Gland /
Core Failure
suction accumulator gasket / seal degradation
due to
a) age, cycles, use b) corrosion
c) embrittlement
a) slow release of R290 charge into the
compressor compartment and/or condenser
area (if applicable)
Off II I
6.34 Suction Line Leaking Pipe
(hole)
pipe wall integrity degradation due to
a) over-pressurization
b) external damage c) corrosion
brazed joint failure due to
d) stress cracking e) filler metal voids / porosity
f) base metal erosion in brazed joint
a) slow release of R290 charge into the
compressor compartment and/or condenser
area (if applicable)
Off II II
6.35 Suction Line Fracture / Rupture / Crack
suction accumulator housing crack due to a) excessive thermal cycles
b) excessive vibrations
c) external damage
a) slow to moderate release of R290 charge into the compressor compartment and/or
condenser area (if applicable)
Off II I
6.36 Suction Line Mechanical
Component
Failure
Not credible Not credible Off I I
6.37 Suction Line Ancillary
Component Failure
complete subsystem failure (excluding cracked
or fractured case which is considered elsewhere)
a) over-pressurization
b) corrosion c) external damage
not credible Off II III
6.38 Suction Line Leaking Flange
/ Union / Joint
mechanical connection failure due to
a) excessive stress b) external damage
c) corrosion
d) seal deterioration (ferrule, flare or face seal as applicable)
a) slow release of R290 charge into the
compressor compartment and/or condenser area (if applicable)
Off II I

154
No. Component
Area
Failure Mode Potential Cause(s) Effect(s) State Severity Likelihood
6.39 Suction Line Abrasion / Wear
/ Wall Thinning
specific pipe/tube failure due to wall thinning
(excludes hole failure modes addressed
elsewhere). External thinning due to
a) contact abrasion (rubbing)
b) atmospheric debris (such as sand) pitting and abrasion
Internal thinning due to
c) flow abrasion / contaminate in refrigerant d) cavitation
e) high speed flow
f) excessively cold flow causing embrittlement
Not credible Off II I
6.40 Suction Line Monitor /
Control
hardware
gauge / switch failure due to
a) over-pressurization
b) excessive cycles (amplitude or frequency) fatigue
c) extreme temperature / pressure conditions
d) corrosion e) seal failure
f) external damage
g) high voltage
a) slow to moderate release of R290 charge
into the compressor compartment and/or
condenser area (if applicable)
Off II I