evaluation of the rheological behavior of a semi-solid al–sic...
TRANSCRIPT
International Journal of Materials Science and Applications 2014; 3(6): 344-352
Published online November 20, 2014 (http://www.sciencepublishinggroup.com/j/ijmsa)
doi: 10.11648/j.ijmsa.20140306.21
ISSN: 2327-2635 (Print); ISSN: 2327-2643 (Online)
Evaluation of the rheological behavior of a semi-solid Al–SiC composite using a parallel-plate drop-forge viscometer
Yasuyoshi Fukui*, Daisaku Nara, Kazuyo Fushimi, Noriyoshi Kumazawa
Graduate School of Science and Engineering, Kagoshima University, Kagoshima, Japan
Email address: [email protected] (Y. Fukui), [email protected] (D. Nara), [email protected] (K. Fushimi),
[email protected] (N. Kumazawa)
To cite this article: Yasuyoshi Fukui, Daisaku Nara, Kazuyo Fushimi, Noriyoshi Kumazawa. Evaluation of the Rheological Behavior of a Semi-Solid Al–SiC
Composite using a Parallel-Plate Drop-Forge Viscometer. International Journal of Materials Science and Applications.
Vol. 3, No. 6, 2014, pp. 344-352. doi: 10.11648/j.ijmsa.20140306.21
Abstract: This paper presents of studies performed to assess the effect of rheological behavior on the near-net shape forming
of an Al–20 vol% SiC composite of Duralcan F3A.20S and of the mother aluminum alloy A356 for comparison. Isothermal
experiments were conducted using results of a parallel-plate drop-forge viscometer in a temperature range from 849 K (576 ºC)
to 862 K (590 ºC). Each experiment indicated that the viscosity decreased in the early increasing shear rate stage and
subsequently increased with decreasing shear rate. The overall relationship between the viscosity, µ [Pa.s], and the shear rate, ɺγ
[s-1
], can be described by a power-law model of µ = 3.2 × 10⁷ ɺγ -1.5
for Duralcan and µ = 1.6 × 10⁷ ɺγ -1.5
for A356. The power-law
index was the same for both materials, whereas the power-law constant of Duralcan was two times greater than that of the A356
mother alloy because of the distribution of 20 vol% SiC particles. The decrease in the viscosity that accompanied an increase in
the shear rate depended on both the temperature and the applied force. The viscosities of 32 kPa.s for both Duralcan and A356 at
the maximum effective duration of deformation, which obtained from the plot as a function of the viscosity, appeared to be the
points at which the dominant factor governing the visco-plastic flow process transitions from plastic forming to casting. The
viscosity must also represent optimum semi-solid forming conditions, as indicated by the achievement of both a moderate
working time and an adequate deformation. The optimum operating temperature for both materials can be ranged from 855 K
(582 ˚C) to 857 K (584 ˚C), which is just above the melting point.
Keywords: Semi-Solid Forming, Composite Material, Rheology, Visco-Plastic Flow
1. Introduction
Semi-solid forming was conceived by Flemings et al. [1]
in the early 1970’s as a metal forming process for the
production of a near-net shape parts. The semi-solid metal
forming process can be considered as intermediate between
casting and forging (plastic forming) through visco-plastic
deformation; the material is worked in a temperature range
where solid and liquid were coexisting. The method promises
to allow the production of near-net shape parts, thereby
combining the advantages of highly complex shapes and the
possibility of processing high-strength wrought alloys with
excellent mechanical properties [2]. After the work of
Flemings et al., a number of authors have investigated the
behaviors of semi-solid materials from various viewpoints
[3-7]. Authors have also examined near-net shape forming of
Al–Al3Ni and Al–Al3Fe functionally graded materials (FGMs)
at temperatures greater than the eutectic melting temperature
[8, 9].
One of the important properties of semi-solid metals is
their ability to flow under the action of applied load. The
flow behavior of semi-solid metals is evaluated on the basis
of viscosity, which has been measured by various methods
[10, 11]. In general, the viscosity is analyzed under the
assumption of a steady-state condition because of the
difficulty in measuring the viscosity under a dynamic
condition. Data obtained from the steady-state analysis can
form the basis of numerical simulations for designing and
International Journal of Materials Science and Applications 2014; 3(6): 344-352 345
optimizing near-net shape forming processes. In the case of a
fast phenomenon, the assumption of a steady-state becomes
invalid and will lead to erroneous operation. The problem is
broken down by a parallel-plate drop-forge viscometer called
the “MIT model”, which was developed by Yurko and
Flemings [6]. In the MIT model, the top plate of mass for
compression is suspended in the furnace and the specimen is
compressed at shear rates ranging from 10-5
to 104 s
-1.
The application of semi-solid forming considered in this
study is a low-formability material of Al–20 vol % SiC alloy
of Duralcan F3A.20STM
(delivered from Alcan Asia, Ltd.,
Japan) which is a kind of particle-distributed composite. To
enable the visco-plastic flow analysis of near-net forming of
Duralcan F3A.20S, its rheological behavior at high shear
rates must be clarified. Moreover, the analysis must be
meaningful to confirm the results of semi-solid forming of
Al–Al-base intermetallic FGMs reported in our previously
papers [8, 9]. We observed that the semi-solid forming just
above the melting point is adequate to obtain finer
intermetallics in the Al-base FGMs.
The present work was performed to investigate the
rheological behaviors of an Al–20 vol% SiC composite of
Duralcan F3A.20S. For comparison, the mother aluminum
alloy A356 was also examined. The displacement of the
cylindrical specimen was measured using a self-made
parallel-plate drop-forge viscometer to analyze both the
viscosity and shear rate as functions of the duration of
deformation. The effect of distributed SiC particles on the
rheological properties was evaluated over the temperature
range from solid through melting and the optimum semi-solid
forming condition was discussed for use in near-net shape
forming processes.
2. Experimental and Analytical Methods
2.1. Material and Experimental Apparatus
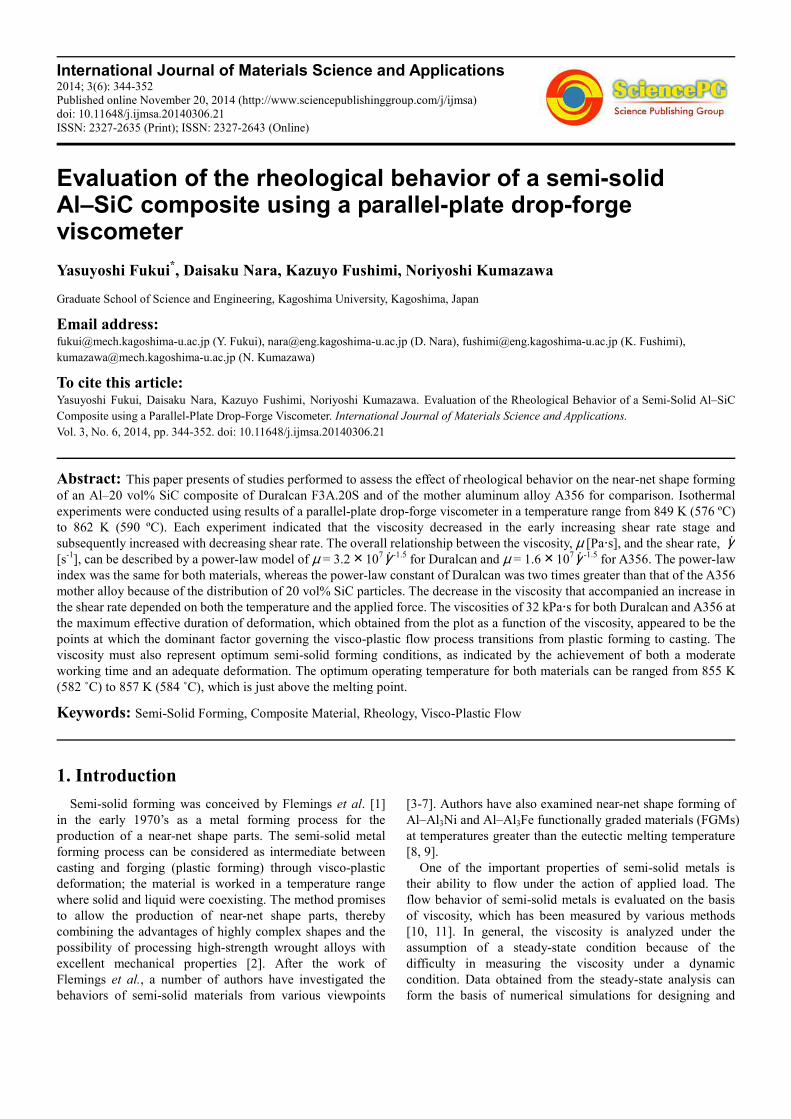
Figure 1. Typical microstructure of Duralcan F3A.20S where black SiC
particles are uniformly distributed in the matrix.
The material used in this study was Al–20 vol% SiC
composite of Duralcan F3A.20S and the commercial purity
aluminum alloy A356, which is the mother alloy of Duralcan,
was also tested for comparison. Hereafter, these materials are
referred to as Duralcan and A356, respectively. Duralcan
contains 20 vol% SiC particles with a size of #500 in an
A356 matrix; the matrix is a hypoeutectic composition and
contains no distributed particles. Fig. 1 shows a typical
microstructure of Duralcan where black SiC spheres are
uniformly distributed in the whity hypoeutectic aluminum
alloy
matrix. Cylindrical specimens of 20 mm in diameter × 15
mm in height were cut from ingots using an electro-discharge
machine. The ingot was prepared in advance using hot
working to remove the blow holes.
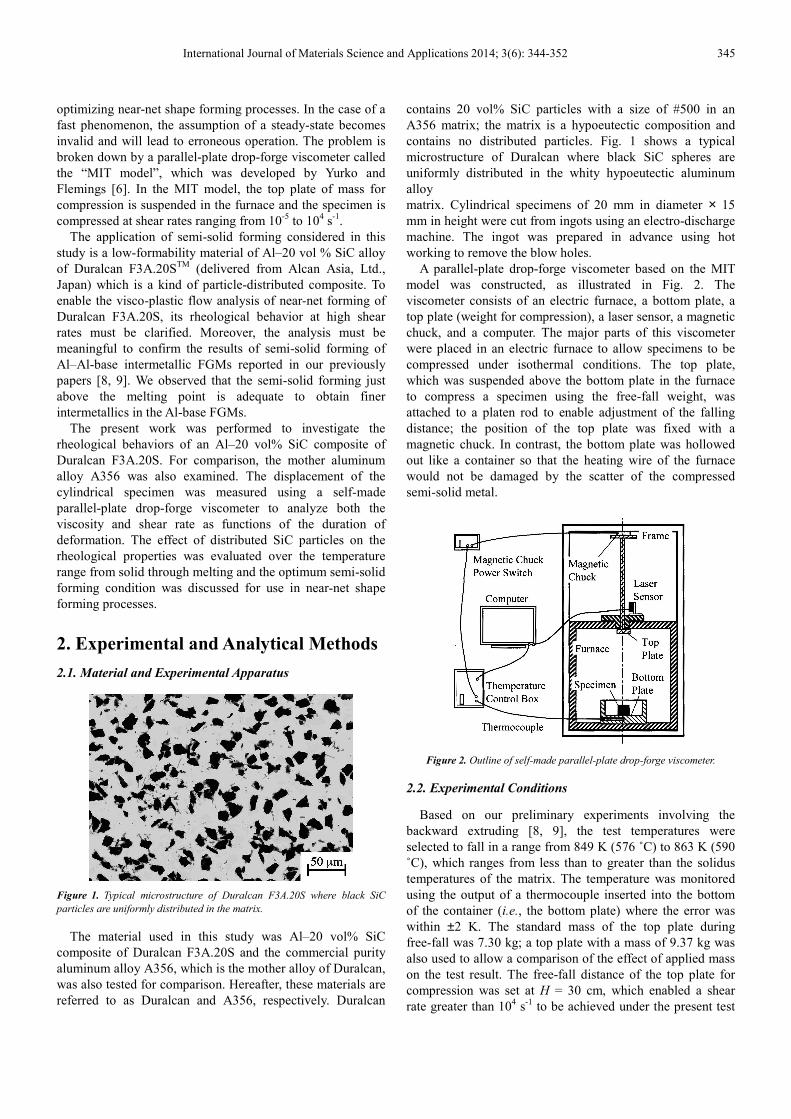
A parallel-plate drop-forge viscometer based on the MIT
model was constructed, as illustrated in Fig. 2. The
viscometer consists of an electric furnace, a bottom plate, a
top plate (weight for compression), a laser sensor, a magnetic
chuck, and a computer. The major parts of this viscometer
were placed in an electric furnace to allow specimens to be
compressed under isothermal conditions. The top plate,
which was suspended above the bottom plate in the furnace
to compress a specimen using the free-fall weight, was
attached to a platen rod to enable adjustment of the falling
distance; the position of the top plate was fixed with a
magnetic chuck. In contrast, the bottom plate was hollowed
out like a container so that the heating wire of the furnace
would not be damaged by the scatter of the compressed
semi-solid metal.
Figure 2. Outline of self-made parallel-plate drop-forge viscometer.
2.2. Experimental Conditions
Based on our preliminary experiments involving the
backward extruding [8, 9], the test temperatures were
selected to fall in a range from 849 K (576 ˚C) to 863 K (590
˚C), which ranges from less than to greater than the solidus
temperatures of the matrix. The temperature was monitored
using the output of a thermocouple inserted into the bottom
of the container (i.e., the bottom plate) where the error was
within ±2 K. The standard mass of the top plate during
free-fall was 7.30 kg; a top plate with a mass of 9.37 kg was
also used to allow a comparison of the effect of applied mass
on the test result. The free-fall distance of the top plate for
compression was set at H = 30 cm, which enabled a shear
rate greater than 104 s
-1 to be achieved under the present test
346 Yasuyoshi Fukui et al.: Evaluation of the Rheological Behavior of a Semi-Solid Al–SiC Composite Using a
Parallel-Plate Drop-Forge Viscometer
conditions. These conditions agree with the observation that
most commercial processes are conducted at shear rates from
102 to 10
4 s
-1 in less than 0.1 s.
The specimen was placed on the center of the bottom plate
such that its alignment coincided with the falling axis of the
top plate; the specimen was maintained at the test
temperature for approximately 30 min. When the magnetic
chuck was released, the top plate in free-fall accelerated
under gravity and compressed the specimen. The reduction in
the specimen height was monitored with a computer through
a laser sensor for a period of 2 s at a sampling time of 0.02
ms. Variation of both the viscosity and shear rate with respect
to the duration of deformation was analyzed from the digital
data. The effective duration of deformation used for analysis
depends on the falling distance, mass of the top plate, and
test temperature.
The experiment starts when the top plate begins to free-fall
and ends when it comes to rest. The effective digital data are
collected in the time interval between the instant when the
top plate touches the specimen surface and when it comes to
rest. Specifically, the duration of deformation is from the
start of deceleration of the top plate to zero speed. However,
determining the interval precisely from the experimental data
is difficult; therefore, the effective duration of deformation is
defined using a two-sided interval estimation, which excludes
a few percent of both sides of the estimated region in the
present experiment. We confirmed that this estimation has
little effect on the analysis results. The related digital data of
the effective compressive displacement and the time were
directly used to evaluate the first and the second derivatives
of dh/dt and d2h/dt
2, respectively, to calculate both the
viscosity and shear rate. These calculations will be explained
in the following section.
2.3. Calculations of Viscosity and Shear Rate
In the case of a parallel-plate drop-forge viscometer, the
viscosity is calculated by applying the Stefan equation [12]
and by referring to the exposition of Yurko and Flemings [6].
The equation is based on the assumptions that the flow is
axisymmetric, the fluid is incompressible, no slip occurs at the
contact surface, and all of the volume of the specimen remains
within the top and bottom plates. A cylindrical coordinate
system (r, θ, z) with an origin of z-up being at the bottom
center of the cylindrical specimen is used.
When the cylindrical specimen is compressed under
pressure, P, and with velocity, v, the equation of motion and
the condition of continuity are reduced to
∂ P
∂r= µ ∂2 νr
∂z2 , (1)
1
r
∂
∂r(rν r ) + ∂ν z
∂ z= 0 , (2)
where µ is the viscosity, vr and vz are the velocity components
of directions r and z, respectively. From the relations (1) and
(2), the Stefan equation is given as
F = − 3µV 2
2πh5(
d h
d t), (3)
where F is the force applied to the specimen, V is the volume
of the specimen, and h is the height of the specimen at time t.
In the parallel-plate drop-forge viscometer, considering the
velocity and acceleration of the top plate, a balance of the
applied force and the viscous force of the specimen is reduced
to the following equation
mp(g + d2 h
d t2) = − 3µV 2
2πh5(dh
d t) , (4)
where mp is the mass of the top plate, and g is the acceleration
due to gravity. From (4), the instantaneous volume-averaged
value of viscosity is given as
µ = − 2mph5(g + d2 h
d t2) (3π R0
4h0
2 dh
d t) . (5)
The first and second derivatives, dh/dt and d2h/dt
2,
respectively, are obtained directly from the relationship
between displacement and time data. The viscosity is then
calculated as a function of time.
The shear rate, ɺγ , of a cylindrical specimen, which is
assumed to be a Newtonian fluid, under compression is given
by
ɺγ = − 6rz
h3
dh
d t. (6)
The volume-averaged shear rate, ˙ γ av , is then given as
ɺγav = 2πV
∫ 0
R ∫ 0
h/2ɺγ r d zdr = − R
2h2
dh
d t, (7)
where R is the outer radius of the specimen at time t, which
can be calculated from the constant-volume condition.
Hereafter, (7) of the instantaneous volume-averaged value is
used to evaluate shear rate.
3. Results and Discussion
3.1. Features of Pressed Specimens
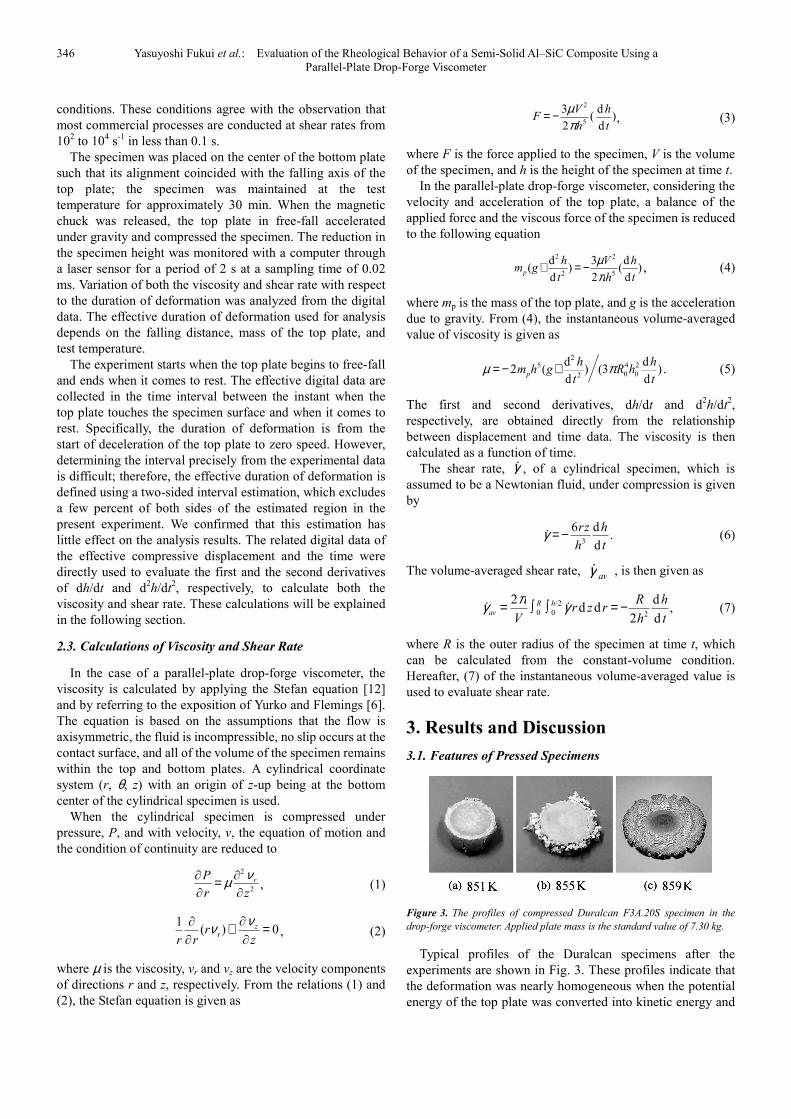
Figure 3. The profiles of compressed Duralcan F3A.20S specimen in the
drop-forge viscometer. Applied plate mass is the standard value of 7.30 kg.
Typical profiles of the Duralcan specimens after the
experiments are shown in Fig. 3. These profiles indicate that
the deformation was nearly homogeneous when the potential
energy of the top plate was converted into kinetic energy and
International Journal of Materials Science and Applications 2014; 3(6): 344-352 347
supplied to the specimen. In Fig. 3 (a), external and
longitudinal cracks are observed over the midheight of the
side surface of the specimen at 851 K (578 ˚C). This
observation indicates that the matrix does not behave as a
semi-solid material. In contrast, no crack was observed in the
specimen tested at 855 K (582 ˚C), as shown in Fig. 3 (b).
This result suggests that the specimen was compressed
uniformly under
semi-solid conditions. We also observed that aluminum melt
seeped through the gaps among solid particles and then
solidified in the form of drops. No cracking was observed in
the specimen tested at 859 K (586 ˚C), as shown in Fig. 3 (c).
These result indicate that the compressed material was
scattered in all directions and collided with the wall of the
bottom plate which was hollowed out like a container.
The features of the compressed specimens indicate that
measurement of viscous data at test temperatures below 851 K
(578 ˚C) was not possible, because the test conditions were
almost the same as those induced by uniaxial compression
under hot working conditions associated with little
deformation. In contrast, the effective duration of deformation
at temperatures beyond 859 K (586 ˚C) was in the range from
0.2 to 0.6 ms and the corresponding sampling points were
from 10 to 30 points, which indicated that the tests at
temperatures beyond 859 K (586˚C) were not satisfactory for
obtaining the derivatives needed to calculate the viscosity.
Moreover, the estimated maximum shear rate of 3 × 10⁴ s
-1 and
the minimum viscosity of a few Pa.s appeared to be
meaningless extreme values. Thus the appropriate test
temperature under the present conditions was confirmed to be
in a range from approximately 855 K (582 ˚C) to 857 K (584
˚C). Here, the temperature measurement error of ±2 K
appeared to be affected the nominal temperature, however the
error did not influence the analytical results because both the
viscosity and the shear rate, which were calculated by (5) and
(7), respectively, were not functions of the test temperature.
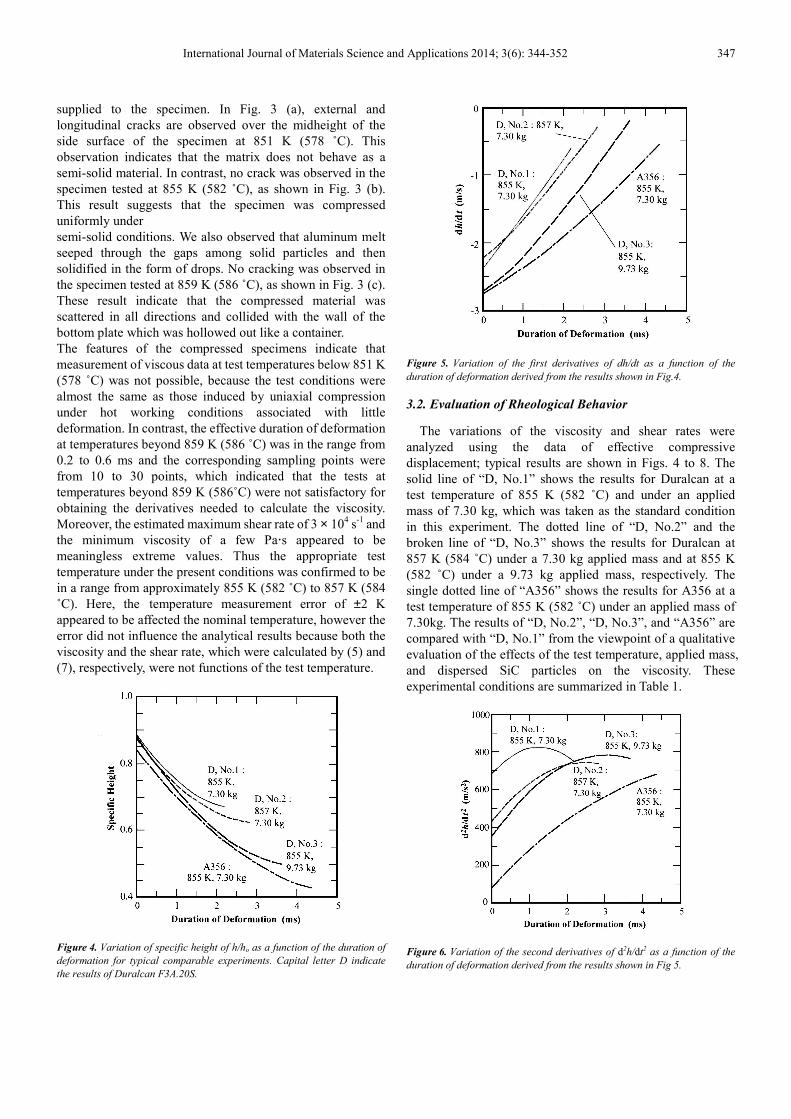
Figure 4. Variation of specific height of h/ho as a function of the duration of
deformation for typical comparable experiments. Capital letter D indicate
the results of Duralcan F3A.20S.
Figure 5. Variation of the first derivatives of dh/dt as a function of the
duration of deformation derived from the results shown in Fig.4.
3.2. Evaluation of Rheological Behavior
The variations of the viscosity and shear rates were
analyzed using the data of effective compressive
displacement; typical results are shown in Figs. 4 to 8. The
solid line of “D, No.1” shows the results for Duralcan at a
test temperature of 855 K (582 ˚C) and under an applied
mass of 7.30 kg, which was taken as the standard condition
in this experiment. The dotted line of “D, No.2” and the
broken line of “D, No.3” shows the results for Duralcan at
857 K (584 ˚C) under a 7.30 kg applied mass and at 855 K
(582 ˚C) under a 9.73 kg applied mass, respectively. The
single dotted line of “A356” shows the results for A356 at a
test temperature of 855 K (582 ˚C) under an applied mass of
7.30kg. The results of “D, No.2”, “D, No.3”, and “A356” are
compared with “D, No.1” from the viewpoint of a qualitative
evaluation of the effects of the test temperature, applied mass,
and dispersed SiC particles on the viscosity. These
experimental conditions are summarized in Table 1.
Figure 6. Variation of the second derivatives of d2h/dt2 as a function of the
duration of deformation derived from the results shown in Fig 5.
348 Yasuyoshi Fukui et al.: Evaluation of the Rheological Behavior of a Semi-Solid Al–SiC Composite Using a
Parallel-Plate Drop-Forge Viscometer
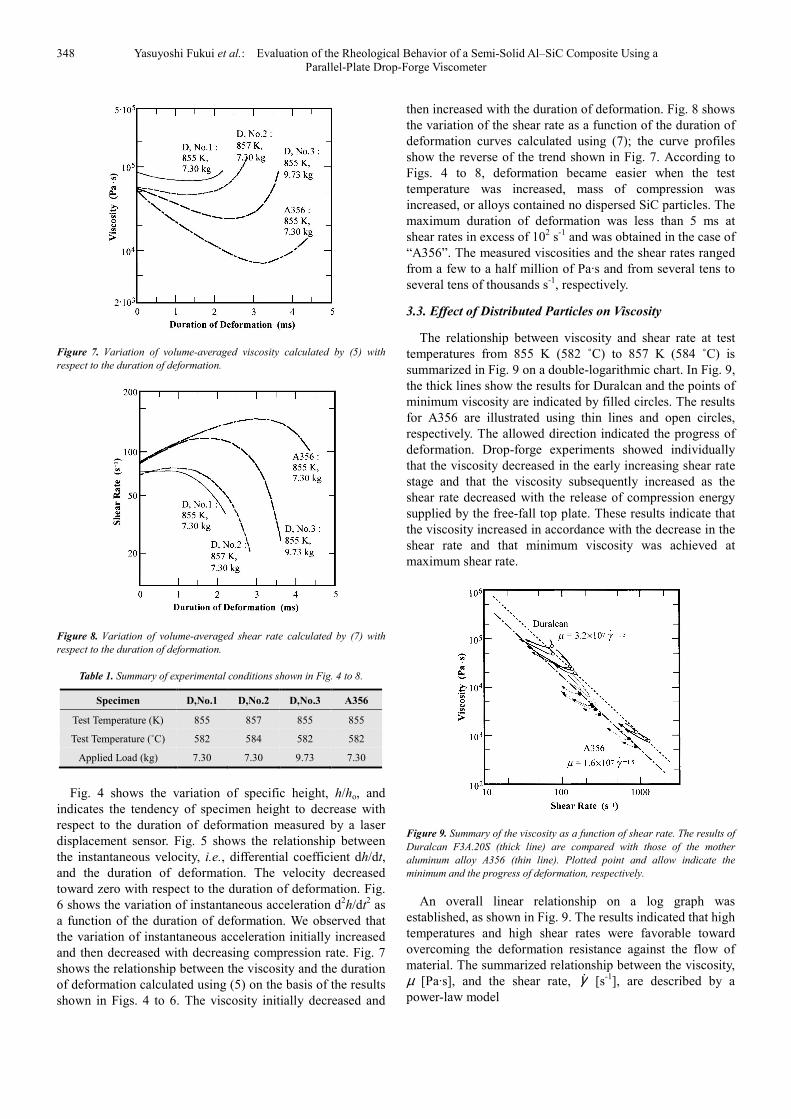
Figure 7. Variation of volume-averaged viscosity calculated by (5) with
respect to the duration of deformation.
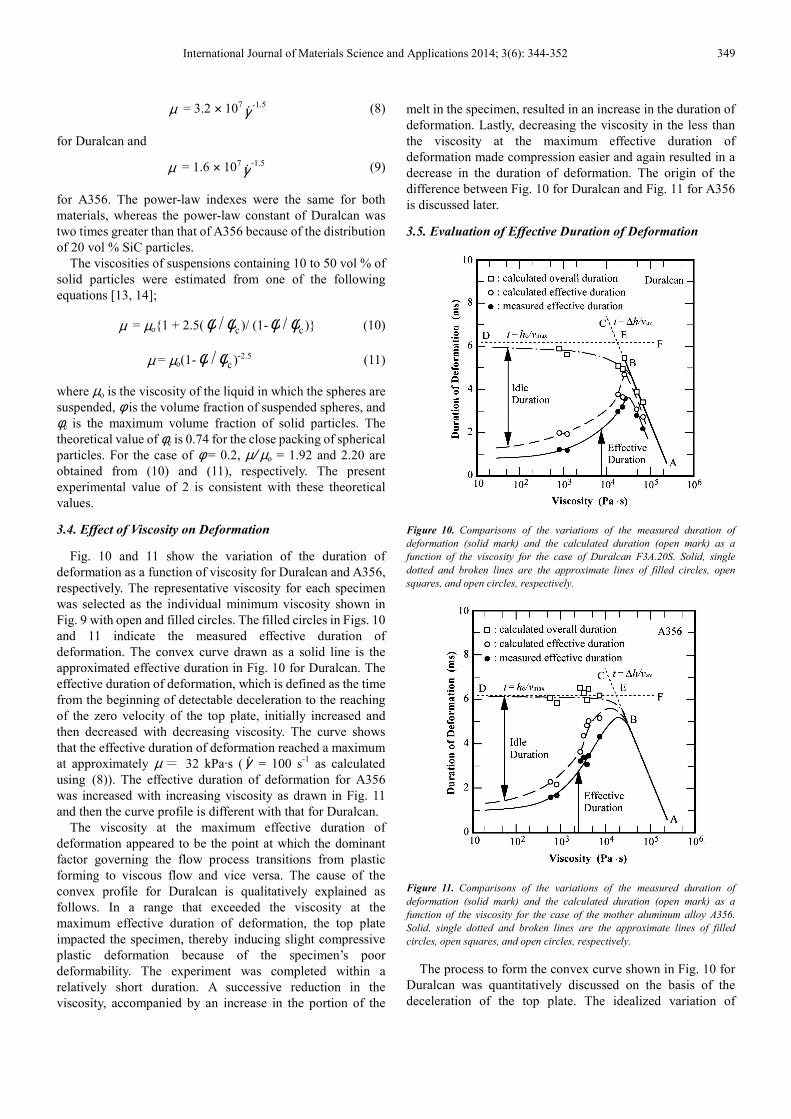
Figure 8. Variation of volume-averaged shear rate calculated by (7) with
respect to the duration of deformation.
Table 1. Summary of experimental conditions shown in Fig. 4 to 8.
Specimen D,No.1 D,No.2 D,No.3 A356
Test Temperature (K) 855 857 855 855
Test Temperature (˚C) 582 584 582 582
Applied Load (kg) 7.30 7.30 9.73 7.30
Fig. 4 shows the variation of specific height, h/ho, and
indicates the tendency of specimen height to decrease with
respect to the duration of deformation measured by a laser
displacement sensor. Fig. 5 shows the relationship between
the instantaneous velocity, i.e., differential coefficient dh/dt,
and the duration of deformation. The velocity decreased
toward zero with respect to the duration of deformation. Fig.
6 shows the variation of instantaneous acceleration d2h/dt
2 as
a function of the duration of deformation. We observed that
the variation of instantaneous acceleration initially increased
and then decreased with decreasing compression rate. Fig. 7
shows the relationship between the viscosity and the duration
of deformation calculated using (5) on the basis of the results
shown in Figs. 4 to 6. The viscosity initially decreased and
then increased with the duration of deformation. Fig. 8 shows
the variation of the shear rate as a function of the duration of
deformation curves calculated using (7); the curve profiles
show the reverse of the trend shown in Fig. 7. According to
Figs. 4 to 8, deformation became easier when the test
temperature was increased, mass of compression was
increased, or alloys contained no dispersed SiC particles. The
maximum duration of deformation was less than 5 ms at
shear rates in excess of 102 s
-1 and was obtained in the case of
“A356”. The measured viscosities and the shear rates ranged
from a few to a half million of Pa.s and from several tens to
several tens of thousands s-1
, respectively.
3.3. Effect of Distributed Particles on Viscosity
The relationship between viscosity and shear rate at test
temperatures from 855 K (582 ˚C) to 857 K (584 ˚C) is
summarized in Fig. 9 on a double-logarithmic chart. In Fig. 9,
the thick lines show the results for Duralcan and the points of
minimum viscosity are indicated by filled circles. The results
for A356 are illustrated using thin lines and open circles,
respectively. The allowed direction indicated the progress of
deformation. Drop-forge experiments showed individually
that the viscosity decreased in the early increasing shear rate
stage and that the viscosity subsequently increased as the
shear rate decreased with the release of compression energy
supplied by the free-fall top plate. These results indicate that
the viscosity increased in accordance with the decrease in the
shear rate and that minimum viscosity was achieved at
maximum shear rate.
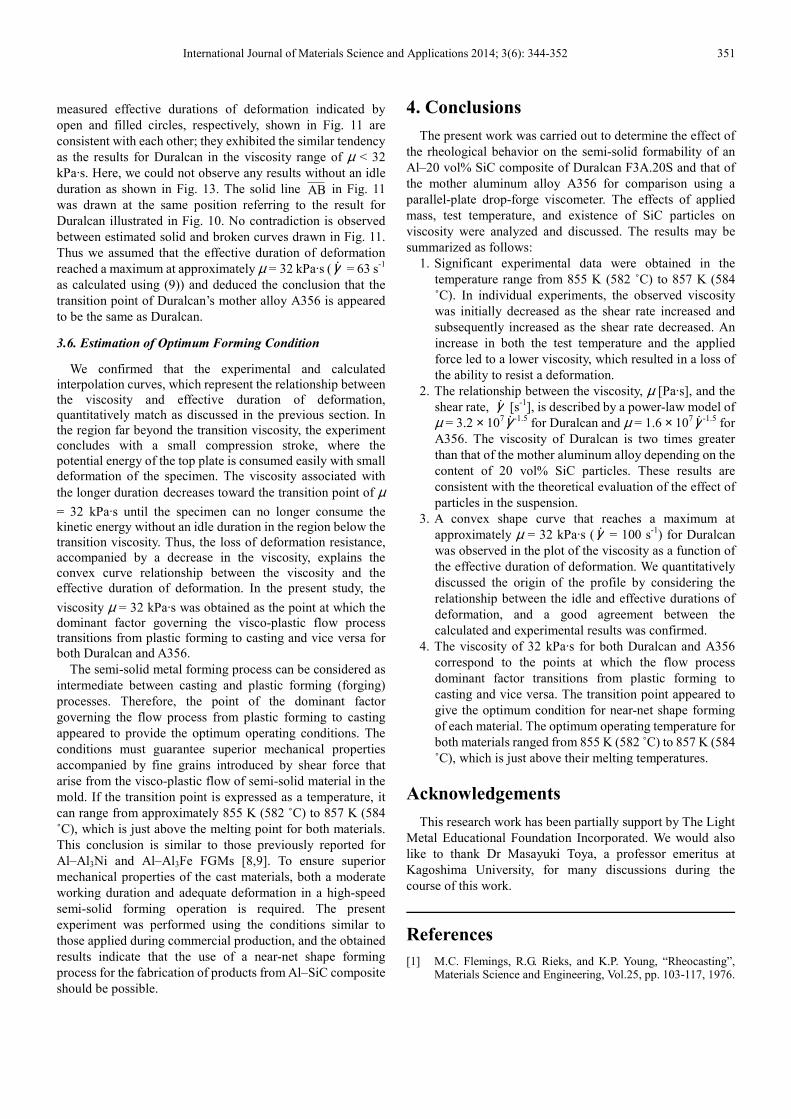
Figure 9. Summary of the viscosity as a function of shear rate. The results of
Duralcan F3A.20S (thick line) are compared with those of the mother
aluminum alloy A356 (thin line). Plotted point and allow indicate the
minimum and the progress of deformation, respectively.
An overall linear relationship on a log graph was
established, as shown in Fig. 9. The results indicated that high
temperatures and high shear rates were favorable toward
overcoming the deformation resistance against the flow of
material. The summarized relationship between the viscosity,
µ [Pa.s], and the shear rate, ɺγ [s-1
], are described by a
power-law model
International Journal of Materials Science and Applications 2014; 3(6): 344-352 349
µ = 3.2 × 10⁷ɺγ -1.5 (8)
for Duralcan and
µ = 1.6 × 10⁷ɺγ -1.5 (9)
for A356. The power-law indexes were the same for both
materials, whereas the power-law constant of Duralcan was
two times greater than that of A356 because of the distribution
of 20 vol % SiC particles.
The viscosities of suspensions containing 10 to 50 vol % of
solid particles were estimated from one of the following
equations [13, 14];
µ = µo{1 + 2.5(φ /φc )/ (1-φ /φc )} (10)
µ = µo(1-φ /φc )-2.5 (11)
where µo is the viscosity of the liquid in which the spheres are
suspended, φ is the volume fraction of suspended spheres, and
φc is the maximum volume fraction of solid particles. The
theoretical value of φc is 0.74 for the close packing of spherical
particles. For the case of φ = 0.2, µ/ µo = 1.92 and 2.20 are
obtained from (10) and (11), respectively. The present
experimental value of 2 is consistent with these theoretical
values.
3.4. Effect of Viscosity on Deformation
Fig. 10 and 11 show the variation of the duration of
deformation as a function of viscosity for Duralcan and A356,
respectively. The representative viscosity for each specimen
was selected as the individual minimum viscosity shown in
Fig. 9 with open and filled circles. The filled circles in Figs. 10
and 11 indicate the measured effective duration of
deformation. The convex curve drawn as a solid line is the
approximated effective duration in Fig. 10 for Duralcan. The
effective duration of deformation, which is defined as the time
from the beginning of detectable deceleration to the reaching
of the zero velocity of the top plate, initially increased and
then decreased with decreasing viscosity. The curve shows
that the effective duration of deformation reached a maximum
at approximately µ = 32 kPa.s ( ɺγ = 100 s-1
as calculated
using (8)). The effective duration of deformation for A356
was increased with increasing viscosity as drawn in Fig. 11
and then the curve profile is different with that for Duralcan.
The viscosity at the maximum effective duration of
deformation appeared to be the point at which the dominant
factor governing the flow process transitions from plastic
forming to viscous flow and vice versa. The cause of the
convex profile for Duralcan is qualitatively explained as
follows. In a range that exceeded the viscosity at the
maximum effective duration of deformation, the top plate
impacted the specimen, thereby inducing slight compressive
plastic deformation because of the specimen’s poor
deformability. The experiment was completed within a
relatively short duration. A successive reduction in the
viscosity, accompanied by an increase in the portion of the
melt in the specimen, resulted in an increase in the duration of
deformation. Lastly, decreasing the viscosity in the less than
the viscosity at the maximum effective duration of
deformation made compression easier and again resulted in a
decrease in the duration of deformation. The origin of the
difference between Fig. 10 for Duralcan and Fig. 11 for A356
is discussed later.
3.5. Evaluation of Effective Duration of Deformation
Figure 10. Comparisons of the variations of the measured duration of
deformation (solid mark) and the calculated duration (open mark) as a
function of the viscosity for the case of Duralcan F3A.20S. Solid, single
dotted and broken lines are the approximate lines of filled circles, open
squares, and open circles, respectively.
Figure 11. Comparisons of the variations of the measured duration of
deformation (solid mark) and the calculated duration (open mark) as a
function of the viscosity for the case of the mother aluminum alloy A356.
Solid, single dotted and broken lines are the approximate lines of filled
circles, open squares, and open circles, respectively.
The process to form the convex curve shown in Fig. 10 for
Duralcan was quantitatively discussed on the basis of the
deceleration of the top plate. The idealized variation of

350 Yasuyoshi Fukui et al.: Evaluation of the Rheological Behavior of a Semi-Solid Al–SiC Composite Using a
Parallel-Plate Drop-Forge Viscometer
velocity of the top plate as a function of the compression
stroke was estimated; the results for Duralcan are shown in
Fig. 12. To simplify the analysis, we assumed that the
relationship between the falling velocity and compression
stroke obeys a linear function, i.e., deceleration is constant
and/or no acceleration occurs, and then expressed the results
as idealized straight lines, as shown in Fig. 12. The effective
duration of deformation initially increased and then decreased;
the transition point was µ = 32 kPa.s as observed in Fig. 10.
The experimental results were divided into two group: those
collected before and after the transition point of µ = 32 kPa.s.
Here, the velocity at the time of contact with a specimen was
simply estimated as
vmax = 2gH = 2 × 9.8× 0.3 = 2.4 (m/s) (12)
in the present condition, where the resistance due to friction
was ignored. The dotted line DF in Fig. 10 indicates the
duration required for a fall of ho = 15 mm with a velocity of 2.4
m/s (approximately 6.2 ms), which was the maximum
duration for full compression of the 15 mm-heigh specimens
used in this study.
In cases where the viscosity was greater than 32 kPa.s, three
specimens (“D, No. 1”, “D, No. 2”, and “D, No. 3”) were
considered to follow the velocity change lines of OA , OB,
and OC in Fig. 12, respectively, and the velocity varied from
vmax = 2.4 m/s to zero in a short period. The average top
velocity of vmax and zero velocity under constant deceleration
was calculated as vav = 1.2 m/s. In this case, the reduction in
specimen height, ∆h (= ho-ha), which was the observed
compression stroke, increased as the viscosity decreased. In
addition, the average velocity, vav, was equivalent; thus, the
effective duration of deformation, t (=∆h/vav), was
proportional to the compression stroke. Moreover, the
effective duration of deformation increased with decreasing
viscosity. A good agreement between the calculated and
experimental results, which are shown by open squares and
filled circles in Fig. 10, respectively, were confirmed, and the
marks were in accordance with the solid line of AB.
Figure 12. Comparisons of the variation of idealized velocity as a function
of the compression stroke for Duralcan.
The viscosity results less than 32 kPa.s did not follow the
dotted line of BED in Fig. 10. In this case, the experimental
duration of deformation, i.e., the overall duration of
deformation, was considered to be a combination of the idle
and effective durations of deformation. The idle duration was
the period where detectable deceleration was not observed
under the free-fall of the top plate during the compression
stroke from ho to hs, where hs is the specimen height at the
beginning of a detected deceleration of the top plate. This
situation is assumed to arise exclusively in the viscosity range
of µ < 32 kPa.s. Based on this assumption, the velocities of top
plate in the case of remaining four specimens changed along
the paths Od − dD , Oe − eE , Of − fF , and Og − gG in Fig.
12, where the sequences accommodated the descending order
of the viscosity. The intervals of Od , Oe , Of , and Og
correspond to the compression stroke from ho to hs that
resulted from the period of undetectable deceleration. Those
of dD , eE , fF , and gG are related to the compression
stroke from hs to ha. The former and latter arose during the idle
and effective durations of deformation, respectively. The
compression velocities during the idle and effective
deformations were assumed to be approximately equal to vmax
and vav, respectively. The overall durations are shown by open
squares and their fitted line is the single dotted line in Fig. 10.
The effective duration of deformation decreased with
decreasing viscosity because of the increase in the idle
duration. The calculated effective durations shown by open
circles are consistent with the measured values as shown in
Fig. 10.
Figure 13. Comparisons of the variation of idealized velocity as a function
of the compression stroke for Duralcan’s mother aluminum alloy A356.
The idealized variation of velocity of the top plate as a
function of the compression stroke for A356 is shown in
Fig.13 where the alphabet sequences accommodated the
descending order of the viscosity. Fig. 13 showed that the
overall duration of deformation was composed of the idle and
effective durations of deformation. The calculated and the
International Journal of Materials Science and Applications 2014; 3(6): 344-352 351
measured effective durations of deformation indicated by
open and filled circles, respectively, shown in Fig. 11 are
consistent with each other; they exhibited the similar tendency
as the results for Duralcan in the viscosity range of µ < 32
kPa.s. Here, we could not observe any results without an idle
duration as shown in Fig. 13. The solid line AB in Fig. 11
was drawn at the same position referring to the result for
Duralcan illustrated in Fig. 10. No contradiction is observed
between estimated solid and broken curves drawn in Fig. 11.
Thus we assumed that the effective duration of deformation
reached a maximum at approximately µ = 32 kPa.s ( ɺγ = 63 s-1
as calculated using (9)) and deduced the conclusion that the
transition point of Duralcan’s mother alloy A356 is appeared
to be the same as Duralcan.
3.6. Estimation of Optimum Forming Condition
We confirmed that the experimental and calculated
interpolation curves, which represent the relationship between
the viscosity and effective duration of deformation,
quantitatively match as discussed in the previous section. In
the region far beyond the transition viscosity, the experiment
concludes with a small compression stroke, where the
potential energy of the top plate is consumed easily with small
deformation of the specimen. The viscosity associated with
the longer duration decreases toward the transition point of µ
= 32 kPa.s until the specimen can no longer consume the
kinetic energy without an idle duration in the region below the
transition viscosity. Thus, the loss of deformation resistance,
accompanied by a decrease in the viscosity, explains the
convex curve relationship between the viscosity and the
effective duration of deformation. In the present study, the
viscosity µ = 32 kPa.s was obtained as the point at which the
dominant factor governing the visco-plastic flow process
transitions from plastic forming to casting and vice versa for
both Duralcan and A356.
The semi-solid metal forming process can be considered as
intermediate between casting and plastic forming (forging)
processes. Therefore, the point of the dominant factor
governing the flow process from plastic forming to casting
appeared to provide the optimum operating conditions. The
conditions must guarantee superior mechanical properties
accompanied by fine grains introduced by shear force that
arise from the visco-plastic flow of semi-solid material in the
mold. If the transition point is expressed as a temperature, it
can range from approximately 855 K (582 ˚C) to 857 K (584
˚C), which is just above the melting point for both materials.
This conclusion is similar to those previously reported for
Al–Al3Ni and Al–Al3Fe FGMs [8,9]. To ensure superior
mechanical properties of the cast materials, both a moderate
working duration and adequate deformation in a high-speed
semi-solid forming operation is required. The present
experiment was performed using the conditions similar to
those applied during commercial production, and the obtained
results indicate that the use of a near-net shape forming
process for the fabrication of products from Al–SiC composite
should be possible.
4. Conclusions
The present work was carried out to determine the effect of
the rheological behavior on the semi-solid formability of an
Al–20 vol% SiC composite of Duralcan F3A.20S and that of
the mother aluminum alloy A356 for comparison using a
parallel-plate drop-forge viscometer. The effects of applied
mass, test temperature, and existence of SiC particles on
viscosity were analyzed and discussed. The results may be
summarized as follows:
1. Significant experimental data were obtained in the
temperature range from 855 K (582 ˚C) to 857 K (584
˚C). In individual experiments, the observed viscosity
was initially decreased as the shear rate increased and
subsequently increased as the shear rate decreased. An
increase in both the test temperature and the applied
force led to a lower viscosity, which resulted in a loss of
the ability to resist a deformation.
2. The relationship between the viscosity, µ [Pa.s], and the
shear rate, ɺγ [s-1
], is described by a power-law model of
µ = 3.2 × 10⁷ ɺγ -1.5
for Duralcan and µ = 1.6 × 10⁷ ɺγ -1.5
for
A356. The viscosity of Duralcan is two times greater
than that of the mother aluminum alloy depending on the
content of 20 vol% SiC particles. These results are
consistent with the theoretical evaluation of the effect of
particles in the suspension.
3. A convex shape curve that reaches a maximum at
approximately µ = 32 kPa.s ( ɺγ = 100 s-1
) for Duralcan
was observed in the plot of the viscosity as a function of
the effective duration of deformation. We quantitatively
discussed the origin of the profile by considering the
relationship between the idle and effective durations of
deformation, and a good agreement between the
calculated and experimental results was confirmed.
4. The viscosity of 32 kPa.s for both Duralcan and A356
correspond to the points at which the flow process
dominant factor transitions from plastic forming to
casting and vice versa. The transition point appeared to
give the optimum condition for near-net shape forming
of each material. The optimum operating temperature for
both materials ranged from 855 K (582 ̊ C) to 857 K (584
˚C), which is just above their melting temperatures.
Acknowledgements
This research work has been partially support by The Light
Metal Educational Foundation Incorporated. We would also
like to thank Dr Masayuki Toya, a professor emeritus at
Kagoshima University, for many discussions during the
course of this work.
References
[1] M.C. Flemings, R.G. Rieks, and K.P. Young, “Rheocasting”, Materials Science and Engineering, Vol.25, pp. 103-117, 1976.

352 Yasuyoshi Fukui et al.: Evaluation of the Rheological Behavior of a Semi-Solid Al–SiC Composite Using a
Parallel-Plate Drop-Forge Viscometer
[2] J.U. Ejiofor, and R.G.Reddy, “Developments in the processing and properties of particulate Al-Si composites”, JOM, Vol. 49, No. 11, pp. 31-37, 1997.
[3] V. Laxmanan and M.C. Flemings, “Deformation of Semi-Solid Sn-15 Pct Pb Alloy”, Metallurgical Transactions A, Vol.11A, No.12, pp. 1927-1937, 1980.
[4] P.J. Ward, H.V. Atkinson, P.R.G. Anderson, L.G. Elias, B. Garcia, L. Kahlen, and J-M. Rodrigues-Ibabe, “Semi-Solid Processing of Novel MMCs Based on Hypereutectic Aluminum-Silicon Alloys”, Acta Metallurgica et Materialia, Vol.44, No.5, pp. 1717-1727, 1996.
[5] H. Iwasaki, T. Mori, M. Mabuchi, and K. Higashi, “Shear Deformation Behavior of Al-5% Mg in a Semi-Solid State”, Acta Metallurgica et Materialia, Vol.46, No.18, pp. 6351-6360, 1998.
[6] J.A. Yurko and M.C. Flemings, “Rheology and Microstructure of Semi-Solid Aluminum Alloys Compressed in the Drop Forge Viscometer”, Metallurgical and Materials Transactions A, Vol.33A, No.8, pp. 2737-2746, 2002.
[7] K. Solek, Z. Mitura, R. Kuzaik, and P. Kapranos, “The use of ADINA software to simulate thixocasting processes”, Solid State Phenomena, Vols. 116-117, pp. 626-629, 2006.
[8] Y. Fukui, H. Okada, N. Kumazawa, and Y. Watanabe, “Near Net Shape Forming of Al-Al3Ni FGM over Eutectic Melting
Temperature”, Metallurgical and Materials Transactions A, Vol. 31A, No. 10, pp. 2627-2636, 2000.
[9] K. Yamagiwa, Y. Watanabe, K. Matsuda, Y. Fukui, and P. Kapranos, “Characteristic of Al-Al3Fe Eco-Functionally Graded Material through Near-Net-Shape Forming over Eutectic Melting Temperature”, Materials Science and Engineering A, Vol. A416, Nos. 1-2, pp. 80-91, 2006.
[10] M.C. Flemings, “Behavior of Metal Alloys in the Semisolid State”, Metallurgical Transactions A, Vol.22A, No.5, pp. 957-981, 1991.
[11] D.H. Kirkwood, “Semisolid metal processing”, International Materials Reviews,Vol.39, pp. 173-189, 1994.
[12] G.J. Dienes and H.F. Klemm, “Theory and Application of the Parallel Plate Plastometer”, Journal of Applied Physics, Vol.17, pp. 458-471, 1946.
[13] J.V. Robinson, “The Viscosity of Suspensions of Spheres”, The Journal of Physical Chemistry, Vol.53, No.7, pp. 1042-1056, 1949.
[14] M. Mooney, “The viscosity of a concentrated suspension of spherical particles”, Journal of Colloid Science, Vol.6, pp. 162-170, 1951.