evaluation of working health services scotland, … of working health services scotland, ... the...
TRANSCRIPT

Evaluation of Working Health Services Scotland, 2010-2014
This report has been prepared by:
Margaret Hanson, WorksOut
Dr Evangelia Demou, MRC/CSO Social and Public Health Sciences Unit, University of Glasgow
Andisheh Bakhshi, Healthy Working Lives, University of Glasgow
Prof Ewan Macdonald, Healthy Working Lives, University of Glasgow
June 2016

The Scottish Government, Edinburgh 2016
Evaluation of Working Health Services Scotland, 2010-2014

© Crown copyright 2016
This publication is licensed under the terms of the Open Government Licence v3.0 except where otherwise stated. To view this licence, visit nationalarchives.gov.uk/doc/open-government-licence/version/3 or write to the Information Policy Team, The National Archives, Kew, London TW9 4DU, or email: [email protected].
Where we have identified any third party copyright information you will need to obtain permission from the copyright holders concerned.
This publication is available at www.gov.scot
Any enquiries regarding this publication should be sent to us at The Scottish GovernmentSt Andrew’s HouseEdinburghEH1 3DG
ISBN: 978-1-78652-251-1
Published by The Scottish Government, June 2016
Produced for The Scottish Government by APS Group Scotland, 21 Tennant Street, Edinburgh EH6 5NAPPDAS72104 (06/16)
1
Contents
Executive summary ........................................................................................................... 3
1 Introduction .............................................................................................................. 8
1.1 WHSS service provision............................................................................................. 8
1.2 Client referral ............................................................................................................. 9
1.3 Data collection ........................................................................................................... 9
1.4 NHS24 MSK pilot study............................................................................................ 10
2 Description of cases .............................................................................................. 12
2.1 Overview .................................................................................................................. 12
2.2 Referrals over time ................................................................................................... 12
2.3 Completion of assessments ..................................................................................... 13
2.4 Demographics of cases............................................................................................ 15
2.5 Time in WHSS ......................................................................................................... 25
3 Service provision by Boards ................................................................................. 26
3.1 Overview of models ................................................................................................. 26
3.2 Cases‟ primary health condition, by Board ............................................................... 28
3.3 Absence status at entry............................................................................................ 28
3.4 Completion of programme ........................................................................................ 29
3.5 Duration in the programme ...................................................................................... 30
3.6 Service delivery ........................................................................................................ 30
4 Discharge ................................................................................................................ 35
4.1 Cases that completed the programme ..................................................................... 35
4.2 Changes in absence status while in programme ...................................................... 36
4.3 Number of lost working days during the programme ................................................ 36
4.4 Association between lost working time while in programme and other factors......... 37
4.5 Health issue resolved ............................................................................................... 39
4.6 Changes in health tool scores at discharge ............................................................. 41
4.7 Changes in medication............................................................................................. 53
4.8 Use of other support services .................................................................................. 54
4.9 Ability to work ........................................................................................................... 54
4.10 Prediction of ability to do job in 6 months‟ time ........................................................ 55
4.11 Impact of the service after discharge ....................................................................... 56
4.12 Qualitative feedback on the service ......................................................................... 58

2
Evaluation of WHSS, 2010-14
5 Discussion .............................................................................................................. 60
5.1 Representativeness of the cases ............................................................................. 60
5.2 Differences in delivery in Board areas ..................................................................... 60
5.3 Duration in the programme ...................................................................................... 61
5.4 Absence related to health condition ......................................................................... 61
5.5 Health improvements ............................................................................................... 61
5.6 Limitations of the study ............................................................................................ 62
6 Conclusions and recommendations .................................................................... 63
6.1 Conclusions ............................................................................................................. 63
6.2 Recommendations ................................................................................................... 63
References ....................................................................................................................... 65

3
Evaluation of WHSS, 2010-14
Executive summary
1. Introduction
1.1 WHSS service provision
The Working Health Services Scotland (WHSS) programme was introduced in order to
provide support to employees in small and medium sized enterprises (SMEs, <250
employees) whose health condition was affecting their ability to work. It was funded by the
Scottish Government and the UK Government‟s Department for Work and Pensions
(DWP). The programme offered telephone based case management and some face-to-
face therapeutic support to those who were either off work due to a health condition, or at
risk of becoming absent due to the condition. The programme developed from the WHSS
pilot programme which had been delivered in 3 NHS Health Boards from 2008-2010.
These Health Boards – Borders, Dundee & Tayside, and Lothian – therefore had
established services at the start of this period of data collection. Other Health Boards were
introducing the programme for the first time.
The service was provided in the following Health Board areas in Scotland: Ayrshire &
Arran, Borders, Dumfries & Galloway, Dundee & Tayside, Fife, Forth Valley, Grampian,
Greater Glasgow & Clyde, Highland, Lanarkshire, and Lothian, with clients from outwith
these areas (Orkney, Shetland and Western Isles) being managed by other Board areas.
This evaluation describes and evaluates the reach and impact of the WHSS programme,
as delivered to clients enrolled into WHSS in the period between 26th March 2010 and 31st
March 2014; discharge data up to 28th July 2014 are included.
1.2 Data collection
Data were collected from clients at the following points while they were in the WHSS
programme:
Enrolment: The client‟s first contact with the service, which assessed their eligibility
for it.
Entry: A detailed telephone assessment by a case manager, concerning health
condition, effect on work ability, absence status and health measures.
Therapy provision: The services received by the client (including case
management, physiotherapy, counselling, occupational therapy, self-help materials
etc.).
Discharge: Health measures, work ability, absence status were collected at the
point the case manager judged the client should be discharged from the service,
either because their condition had improved, or the service was not able to support
them further.
3 month post-discharge follow-up: Recording health measures, work ability and
absence status.

4
Evaluation of WHSS, 2010-14
6 month post-discharge follow-up: A repeat of the data gathered at the 3 month
follow-up.
Data were collected on a range of demographic details, as well as the health conditions
with which the cases were presenting. Data on their employment status (at work / off sick)
were also recorded. They completed up to three standard, validated health questionnaires
at entry and discharge – the EQ-5D, which included a visual analogue scale (VAS), the
Hospital Anxiety and Depression Scale (HADS) and the Canadian Occupational
Performance Measure (COPM).
2. Description of cases
There were a total of 13,463 referrals into the programme in the four year period, of which
11,748 cases (87.3%) were eligible and completed the entry assessment.
Over a quarter (26%) of referrals were from Lanarkshire Health Board; this includes some
clients from other Board areas if they were case managed by the team in Lanarkshire, who
managed the national implementation of the programme. Dundee & Tayside comprised
19% of cases and Lothian had 16%; both these Boards participated in the pilot of WHSS,
and were therefore established services when this period of data collection began.
The majority of cases (92%) were new referrals into the service, while 5% were referring
again with a new health condition; and 3% were referring again with the same health
condition.
The average age of clients in the whole sample is 44 (SD 12) years old. Altogether 43% of
the clients were over 50-year-old, while only 10% are under 30.
There was a statistically significant increase in the number of cases with higher ranked
scores in the Scottish Index of Multiple Deprivation (SIMD) categories (i.e. a greater
proportion of cases were in the less deprived SIMD categories), although this could partly
reflect rates of employment in the SIMD categories.
Almost 20% of cases were self-employed, while 26% worked in organisations with 2-10
employees.
Other demographic data (gender, ethnicity) broadly reflects the population in Scotland.
The majority of cases referred to WHSS due to a musculoskeletal condition (MSK) (84%);
while 12% referred with a mental health (MH) condition (depression, stress, anxiety and
other mental health conditions). Altogether, 16% of cases also reported a secondary
health condition, for which they may have received treatment / support while in the WHSS
programme.
Altogether 25% of cases were absent at their entry assessment; with 22% of MSK cases
being absent at entry, while 41% of MH cases were absent at entry.

5
Evaluation of WHSS, 2010-14
Of those who provided information about how long they had been absent at the point they
came into the programme, 36% (776 cases) had been absent for no longer than 2 weeks
at the time of their entry assessment, while 20% (438 cases) had been absent for more
than 12 weeks.
3. Models of WHSS delivery
The way that WHSS was implemented varied between the participating Boards, and in
some cases varied over time with staffing changes. The case management function was
either in-house (by an individual or a team, and the case manager may have also been a
therapy provider) or contracted to Salus Occupational Health in NHS Lanarkshire (where
case managers were not also therapy providers). Therapy provision (physiotherapy,
counselling / psychological services and occupational therapy) could be provided from
within an in-house WHSS team, provided from within the NHS therapy teams, or
contracted out to private practitioners. Boards that contracted their therapy provision to
external providers were responsible for ensuring that the service provided was
occupationally / vocationally focussed.
The average and maximum number of sessions of therapy provided varied between
Boards, although, because significant amounts of data are missing from some Boards,
care should be taken when considering these differences in service delivery. The average
number of physiotherapy sessions attended varied 2.8 to 5.3; for counselling / CBT /
psychological services the average ranged from 2.6 to 5.2; while for occupational therapy
sessions, the average ranged from 1 to 2.7.
4. Discharge outcomes
4.1 Duration in the programme
The average time between the cases‟ enrolment and their entry assessment was 5.2 (SD
9.8) days.
Overall, 59.8% of those who completed the entry assessment completed at least some of
the discharge paperwork. The average intervention time (i.e. time from entry assessment
to discharge) is 121.0 (SD 81.1) days. 83% of cases were discharged within 6 months of
their entry assessment.
4.2 Changes in absence status while in programme
The majority of cases (75%, N=6,541) were at work both at entry and discharge from the
programme, while 4% were off work at entry and discharge. However, 18% (1,188 cases)
who were absent when they entered the programme were at work on discharge from it.
Altogether, 94% of the cases were at work at discharge and 6% were absent.
4.3 Number of lost working days during the programme
Modelling of the data showed that the number of lost days while in the WHSS programme
was related to a client‟s age, length of absence prior to entering the programme, primary
condition and duration in the programme. The statistical model suggests that older cases
took longer to return to work, with almost 5 more days of absence for every 10 additional

6
Evaluation of WHSS, 2010-14
years of age. The number of days lost due to sickness absence while in the programme is
much higher in MH cases (p<0.001) than MSK cases; 50% of MSK cases are back to work
in 21 days, while this is 46 days for MH cases. The statistical model also suggests that
those who presented with a MSK condition had 10 days less sickness absence while in the
programme than those with MH conditions.
4.4 Health issue resolved
When asked whether their health issue was resolved at discharge, 77% answered
positively (34% fully resolved, 43% partly resolved, N=7,869). This was similar whether
cases presented with an MSK condition (80% positive) or MH condition (83% positive). Of
those who were at work at entry, 81% reported positively; this was less (74% positive) for
those who were absent at entry.
4.5 Changes in health tool scores at discharge
All health assessment tool scores (EQ-5D index, visual analogue scale (VAS), COPM and
HADS) improved statistically significantly from entry to discharge.
4.6 Other support
Over half (53%) of the 340 cases who were using other support services at the time they
entered WHSS (e.g. medical professionals and allied health professionals) were no longer
using these services at discharge, while 15% were still using them, but a reduced amount.
A third of cases (33%) reported at discharge no longer taking the medication for their
condition that they were taking at entry, while 15% had reduced their medication use.
4.7 Work ability
Almost two thirds (64%) of cases (N=6,759) were working their normal hours at both entry
and discharge. However, 19% who were off work at entry were working normal hours at
discharge, while 5% who were on restricted hours at entry were working normal hours at
discharge, meaning an improvement in working hours for almost a quarter of cases.
In terms of ability to do their normal duties, 21% did not have difficulty with work duties at
either entry or discharge (N=4,940). However, 59% improved from struggling with their
normal duties at entry to doing their normal duties without difficulty at discharge, with a
further 4% improving from not able to do their normal duties to being able to do them
without difficulty at discharge.
A fifth (20%, N=5,969) of cases thought at entry that they could not, or were unsure if they
could do their job in 6 months‟ time but thought that they could when they were
discharged. Two thirds (66%) thought they would be able to do their job in 6 months‟ time,
both at entry and discharge.
4.8 Post discharge follow-up
Data collected at 3 and 6 months post discharge indicates that the improvements to health
(EQ-5D index and VAS), and ability to work were maintained following discharge.

7
Evaluation of WHSS, 2010-14
4.9 Qualitative feedback on the service
Cases‟ views of the service were overwhelmingly positive. Over 98% reported „good‟ or
„excellent‟ concerning their overall experience of the service; how helpful it was; how
involved they felt; the treatment they received; and the speed and delivery of the service.
Altogether 99% would use the service again and would recommend it to others. Over 84%
agreed that the service had helped them to return to work more quickly than if they had not
had the support of the service.
5. Discussion and conclusions
The findings of the programme indicate that it has had a positive benefit for cases, with all
health measures showing a significant improvement and the qualitative feedback being
very positive. Of the sample where data are available, 75% of cases were at work at entry
and remained at work throughout the programme, while 18% (1,188) were absent at entry
and had returned to work by the time they were discharged.
The health tool scores all showed significant improvements from entry to discharge. The
extent of the positive change in EQ-5D is striking from a health economic perspective, and
although there is no control group, it cannot be ruled out that the WHSS intervention has
contributed to this health benefit. The benefits appear to be maintained after discharge
from the service.
Recommendations relating to future programme delivery are given.

8
Evaluation of WHSS, 2010-14
1 Introduction
1.1 WHSS service provision
The Working Health Services Scotland (WHSS) programme was introduced in order to
provide support to employees in small and medium sized enterprises (SMEs)1 in Scotland
whose health condition was affecting their ability to work. It was funded by the Scottish
Government and the UK Government‟s Department for Work and Pensions (DWP). The
programme offered telephone based case management and some face-to-face therapeutic
support to those who were either off work due to a health condition or at risk of becoming
absent due to the condition. The programme developed from the WHSS pilot programme
which had been delivered in 3 Health Boards from 2008-2010 (Hanson et al, 2011). These
Health Boards – Borders, Dundee & Tayside, and Lothian – therefore had established
services at the start of this period of data collection. Other Health Boards were introducing
the programme for the first time.
The service was provided in the following Health Board areas in Scotland: Ayrshire &
Arran, Borders, Dumfries & Galloway, Dundee & Tayside, Fife, Forth Valley, Grampian,
Greater Glasgow & Clyde, Highland, Lanarkshire, and Lothian. The small number of cases
from the Western Isles, Orkney and Shetland Health Boards were managed by
Lanarkshire, Grampian and Highland.
The service was coordinated and managed through Salus Occupational Health, a provider
of occupational health and return to work services, based in NHS Lanarkshire. During the
delivery of WHSS individual Health Boards reported to Salus, and the database on which
the records were kept was hosted there. Salus had a team of case managers and were
able to offer support to other Boards delivering the WHSS programme, in some cases
taking over the provision of case management from those Boards part way through the
evaluation period.
In March 2014 the DWP funding of WHSS stopped, although the Scottish Government
funding continued; however, the overall funding for the programme was reduced from
March 2014. In parallel with this, Fit For Work Scotland was introduced in 2014 to support
employees who had been absent from work for 4 weeks or more; this service was for
employees of any size of organisation, except the self-employed.
This evaluation covers cases enrolled into WHSS in the period between 26th March 2010
and 31st March 2014; discharge data up to 28th July 2014 are included.
1 SMEs are defined as those employed in organisations of fewer than 250 employees, including
the self-employed. The Department for Business Innovation and Skills estimated that in 2015,
47.5% of those in employment in Scotland were employed in an SME (including the self-
employed). [https://www.gov.uk/government/statistics/business-population-estimates-2015]

9
Evaluation of WHSS, 2010-14
The terms of reference of this evaluation are to describe and evaluate the reach and
impact of the WHSS programme, as delivered 2010-14.
1.2 Client referral
Clients could be referred into the service by their GP, other health professionals, or partner
organisations, or could self-refer. Those that self-referred may have received information
about the service (and the contact phone number) from their GP, employer, or through the
advertising which promoted the service.
1.3 Data collection
1.3.1 Timing and methods of data collection
Data were collected from clients at the following points in their journey within the WHSS
programme:
Enrolment: The client‟s first contact with the service, which assessed their eligibility
for the service. This was a telephone assessment by an administrator lasting
approximately 5 minutes.
Entry: A detailed telephone assessment by a case manager, lasting approximately
30 minutes, concerning their health condition(s), effect of this on their work ability,
absence status and health measures. This was used by the case manager to
identify appropriate support for the client.
Therapy provision: The services received by the client (including case
management, physiotherapy, counselling, occupational therapy, self-help materials
etc.). Information was recorded on the type of service, the number of sessions and
duration of provision of these services.
Discharge: This was done at the point the case manager judged the client should
be discharged from the service, either because their condition had improved, or the
service was not able to support them further. This was a telephone based
assessment lasting approximately 15 minutes with the case manager. This covered
work ability, absence status and health measures, as well as subjective feedback
about the service.
3 month post-discharge follow-up: A telephone assessment by an administrator,
or a paper based assessment completed by the client, lasting about 5 minutes. It
recorded health measures, work ability and absence status.
6 month post-discharge follow up: This was a repeat of the questionnaire used at
3 month follow up.
The data recorded at enrolment were collected by trained assessors who conducted
interviews with clients over the phone. The data recorded at entry assessment and
discharge was collected by the case managers, who also conducted interviews with clients
over the phone. Records relating to therapeutic provision were recorded by therapeutic
service providers who usually saw clients face to face. The 3 and 6 month post-discharge

10
Evaluation of WHSS, 2010-14
follow-up was undertaken by a trained assessor, or completed by the client on paper
(returned by post) and transcribed onto the database. In some Boards, a therapy provider
also acted as the case manager; in this situation, case management may have been
undertaken face to face.
1.3.2 Data collected
Data were collected on a range of demographic details, as well as the primary (and
secondary, if relevant) health conditions with which the clients were presenting. Data on
their employment status (at work / off sick) were also recorded. They completed up to
three standard, validated health questionnaires during their involvement with the
programme. These were:
EQ-5D. The European Quality of Life – 5 Dimension scale is a standardised
instrument for use as a measure of health outcome. It asks responders to rate their
health on 5 dimensions (mobility, self-care, usual activities, pain/ discomfort, anxiety
/ depression). During the course of the programme the tool was changed from the
3-point scale (March 2010 to end December 2011) to the 5-point scale (January
2012 – March 2014). All clients were asked to complete it at entry, discharge, and 3
month and 6 month follow-up. The EQ-5D also includes a Visual Analogue Scale
(VAS) to help people say how good or bad a health state is; clients were asked to
indicate on a scale from 0 (worst state they could imagine) to 100 (best state they
could imagine) how good or bad “your own health is today in your opinion”.
COPM. The Canadian Occupational Performance Measure asks clients to rate their
ability to perform activities which they identify as important to them, and then to rate
their satisfaction with their ability to perform these activities. Not all the clients were
asked to complete the COPM; a request to complete it was based on the case
manager‟s judgement of the client‟s condition. Those who completed it were asked
to do so at entry and discharge.
HADS. The Hospital Anxiety Depression Scale asks questions concerning feelings
of both anxiety and depression. Again, not all clients were asked to complete it, if it
was judged not to be relevant to their condition. Those who completed it were
asked to do so at entry and discharge.
In addition, data were also recorded by the service providers concerning the number of
services received by clients going through the programme.
1.4 NHS24 MSK pilot study
During the course of the WHSS programme, as part of the National Framework for
Rehabilitation, a pilot of a new pathway to improve the management of musculoskeletal
conditions in the general population was introduced in NHS Lanarkshire and subsequently
extended to some other Health Boards. The revised pathway included telephone access to
triage at NHS 24, and referral to self-management resources or revised treatment
pathways, in the health service. This pilot was introduced in December 2012 and was for
the general population including the employed. It was agreed that clients referred to the
11
Evaluation of WHSS, 2010-14
NHS 24 MSK pilot programme could be referred into WHSS if they met the WHSS
eligibility criterion. This led to a considerable flow of additional cases into the WHSS
service which led to the referral criteria for these NHS 24 patients being reviewed due to
the extra demand this placed on WHSS; the criteria was changed (from 7th February 2013)
so that only those that were absent could refer to WHSS, to make the number of cases
referred via this route manageable within the limited resources.
12
Evaluation of WHSS, 2010-14
2 Description of cases
2.1 Overview
There were a total of 13,463 referrals into the programme in the four year period.
However, some individuals entered the programme more than once, so the number of
unique individuals, (i.e. „clients‟), is less than the number of referrals (i.e. „cases‟) (see
Section 2.3.1). Throughout this evaluation, the cases are the subject of the analysis.
It should be noted that a number of variables were missing in the data records, meaning
that the N value varies in the following presentation of results.
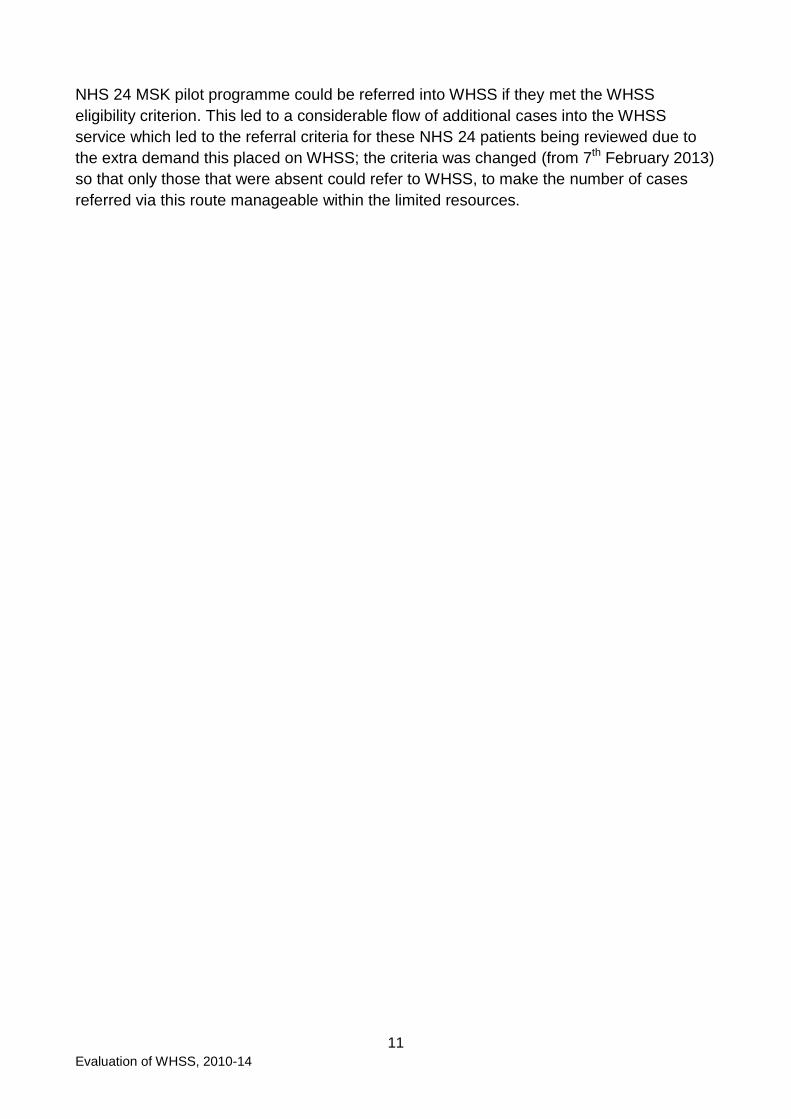
2.2 Referrals over time
The rate of referrals into the WHSS programme from 26th March 2010 to 31st March 2014
is shown in Figure 1. This shows the combined referral rates of self-referral (directly into
the service) and via the NHS 24 MSK pilot study, including those who entered the
programme more than once. The highest referral rates were in October and November
2012 and January 2013. The entry criteria for referral into WHSS via the NHS 24 MSK
pilot programme were subsequently changed (February 2013) following the significant
spike in referral with its introduction; this then reduced the number of referrals via this
route. During the 4 year period, 19% of referrals were via the NHS 24 MSK pilot.
Figure 1: Number of WHSS referrals over the intervention period
(March 2010 to March 2014).
Solid blue: all referrals; dotted purple: self-referred; dashed orange: NHS 24 MSK pilot referrals.

13
Evaluation of WHSS, 2010-14
From autumn 2013, uncertainties about future funding (beyond 2014), and the planned
introduction of the Fit for Work programme may have confused some referrers, and led to
lower referral rates in the last few months of the evaluation period.
The three Boards that had participated in the WHSS pilot maintained their own records
until at least April 2011, and these records are not included in this analysis. This analysis
includes cases from Dundee & Tayside enrolled after 31st March 2011; from Borders
enrolled after 11th April 2011 and from Lothian enrolled after 16th October 2011.
2.3 Completion of assessments
Altogether 13,463 cases completed the enrolment assessment. Of these, 1,715 (12.7%)
did not complete the entry assessment; the reasons for this are given in Table 1. The most
common reasons are the cases being re-routed to a more appropriate service (33%); the
service not being able to contact the client (25%) and the client voluntarily withdrawing
from the service (16%). Reasons cases were not eligible included that they did not work
for an SME, they did not live in the eligible geographical area, or for those coming through
the MSK pathway, that they were not absent from work.
Table 1: Reasons for cases not completing the entry assessment (N=1,715)
Reroute to more appropriate service 32.7%
Unable to contact 25.0%
Voluntary withdrawal 16.3%
Not eligible 11.1%
Being seen elsewhere 8.9%
Unknown 3.4%
Duplicate - already on system 2.5%
Back to work 0.1%
There were therefore 11,748 cases (87.3% of those who enrolled) that completed the entry
assessment. Of these, 4,787 (40.7%) did not complete the discharge paperwork, although
they were discharged from the service. The reasons for not completing the paperwork are
shown in Table 2. The most frequently reported reasons were that the service was not
able to contact the client (60%); clients voluntary withdrawing from the programme (15%);
or not attending appointments (5%).
14
Evaluation of WHSS, 2010-14
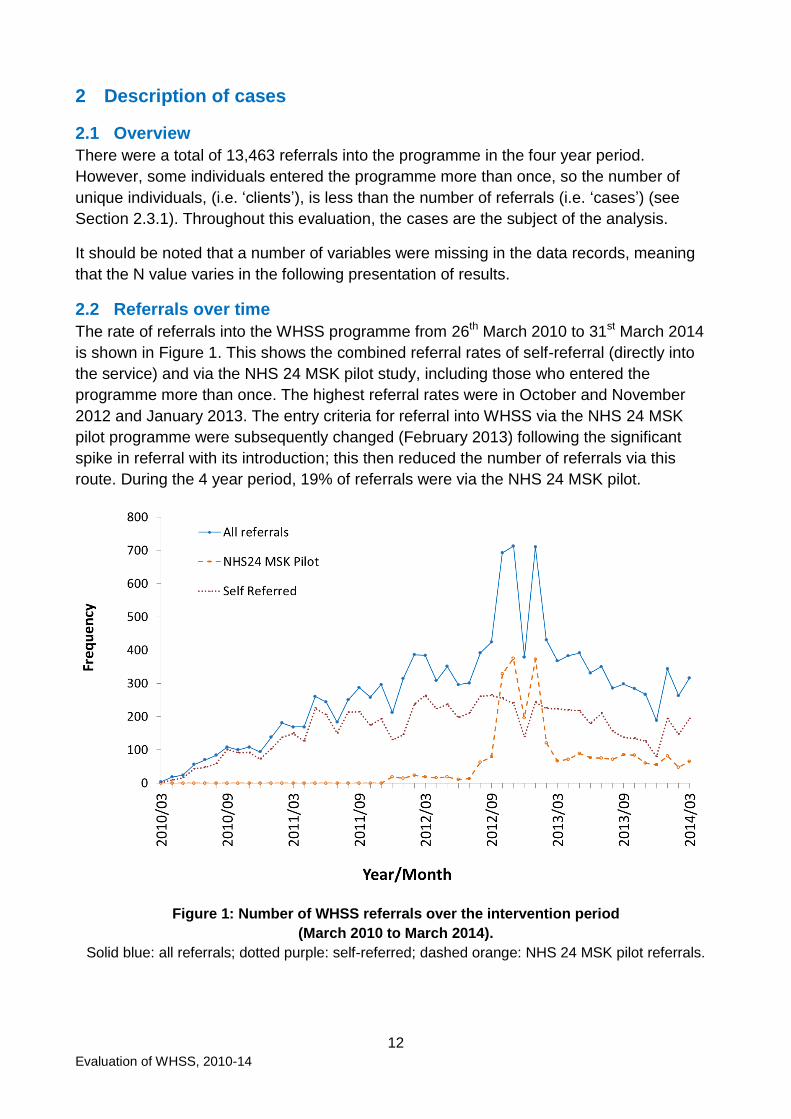
Table 2: Reasons for not completing discharge paperwork (N=4,726)
Unable to contact 60.1%
Voluntary withdrawal 14.6%
No reason given 14.2%
Did not attend appointments 5.1%
Receiving treatment elsewhere / referred elsewhere 3.7%
Other health condition / health condition worsened 0.6%
No longer eligible 0.5%
Not appropriate referral 0.4%
Other 0.7%
This means that discharge paperwork is available for 7,022 cases. All of these had
completed at least some part of the discharge paperwork. However, 1,432 did not
complete the discharge EQ-5D; there are 5,590 cases for which both entry and discharge
EQ-5D are available. This includes 37 cases who were recorded as being discharged as
unable to contact, 16 who voluntary withdraw and 4 who were no longer eligible for the
service. This is summarised in Figure 2.
Figure 2: Number of cases who completed different parts of the programme
5,590
7,022
11,748
13,463
1,432
4,726
1,715
0 2,000 4,000 6,000 8,000 10,000 12,000 14,000
Discharge EQ5D
Discharge assessment
Entry assessment
Enrolment
Completed Did not complete
15
Evaluation of WHSS, 2010-14
2.4 Demographics of cases
2.4.1 Health Board
Lanarkshire Health Board had the highest proportion (26%) of cases enrolling in the
programme, with 3,554 cases (Figure 3). It should be noted that because Lanarkshire
(Salus) were managing the national implementation of the programme, they took on case
management from some Boards where the local case manager was absent; two Boards
(Greater Glasgow & Clyde and Highland) also contracted their services to Lanarkshire
partway through the evaluation period. Due to the constraints of the database, the cases
that were referred to Lanarkshire in this way are recorded as Lanarkshire cases, which
partly accounts for the high proportion of cases seen by Lanarkshire.
Dundee & Tayside, and Lothian follow with 2,601 (19%) and 2,207 (16%) cases enrolled
respectively (Figure 3). Dundee & Tayside, Lothian, and Borders all participated in the pilot
of WHSS, and were therefore established services when this period of data collection
began. However data from these services prior to April 2011 (Dundee & Tayside, and
Borders) and October 2011 (Lothian) isn‟t included in this evaluation, implying that they
saw a greater number of cases over the 4 year period. The evaluation of this pilot
programme (Hanson et al, 2011) showed that these Boards were receiving an average of
between 23 and 28 cases per month (between 2008 and 2010). Assuming the referral
rates remained the same, Borders may have enrolled approximately an additional 280
cases (in 12 months); Dundee approximately an additional 330 cases (in 12 months), and
Lothian approximately an additional 470 cases (in 19 months) before recording on the
WHSS database.
Some Health Boards cover a larger population than others, and the number of eligible
adults (employed in an SME) within each Board area is not known. It is therefore not
possible to say how well Boards recruited from their available potential clients.
2.4.2 New or repeat referral
Of the 11,685 cases for which data are available about whether they had used WHSS
previously, 92% were new referrals into the service; 5% were referring again with a new
health condition; and 3% were referring again with the same health condition.
Considering repeat referrals by Health Board, the greatest number came from Dundee &
Tayside, where 266 (10%) of their 2,601 clients re-entered the programme (green section
of bar). Although the numbers are lower, the greatest proportion of re-entries for a Health
Board was in Borders, where 106 (14%) of their 760 clients entered more than once. In
Greater Glasgow & Clyde, 59 (11%) of their 541 clients re-entered WHSS (see Figure 3).
The blue section of the bar represents cases that entered once, while the green represents
those who entered more than once.
Overall 7% of females and 6% of males re-entered the programme. Those who were older
were more likely to re-enter (3% of those who were under 30 re-entered; 6% of those who
were 30-39; and 8% both of those who were 40-49 and over 50).

16
Evaluation of WHSS, 2010-14
Figure 3: Percentage of WHSS cases by Health Boards. The percentage shown is the total
percentage of the whole sample which came from each Board area. (N=13,462)
Figure 4 shows the differences between Boards in the completion of the entry paperwork.
Figure 4: Proportion of cases from each Board who completed the entry assessment
0% 5% 10% 15% 20% 25% 30%
Lothian
Lanarkshire
Highland
Greater Glasgow & Clyde
Grampian
Forth Valley
Fife
Dundee & Tayside
Dumfries & Galloway
Borders
Ayrshire & Arran
Single entry Repeat enty
16.4%
8.9%
6.3%
5.6%
2.8%
0.3%
4.0%
6.7%
3.2%
19.3%
63.3%
83.3%
92.9%
90.9%
93.8%
98.9%
93.3%
98.8%
95.0%
93.9%
94.0%
87.3%
0% 10% 20% 30% 40% 50% 60% 70% 80% 90% 100%
Lothian (N=2,207)
Lanarkshire (N=3,554)
Highland (N=42)
Greater Glasgow & Clyde (N=541)
Grampian (N=896)
Forth Valley (N=844)
Fife (N=435)
Dundee & Tayside (N=2,601)
Dumfries & Galloway (N=379)
Borders (N=760)
Ayrshire & Arran (N=1,204)
Total (N=13,463)
26.4%

17
Evaluation of WHSS, 2010-14
Most Boards had more than 80% of their enrolled cases entering into the programme
(completing the entry assessment). Lothian had a lower proportion (63%), which is thought
to be due to their way of promoting the service, whereby referrers (GPs and employers)
were encouraged to advise anyone with a need to refer into the service, and the service
then screened them for eligibility, routing them elsewhere if required.
2.4.3 SIMD category
In order to evaluate any inequality in socioeconomic status of those referred, SIMD
categories were calculated, and the number of cases from each SIMD quintile is shown in
Figure 5. The number of cases increases with SIMD category (i.e. the less deprived
clients). This is statistically significant (p=0.007, correlation value r=0.97).
Figure 5: Percentage of WHSS cases based by SIMD quintile deprivation rank
(1: most deprived and 5: least deprived) (N=13,461)
It should be noted that employment is not equally distributed across the SIMD quintiles,
with approximately 28% of working aged people “employment deprived”2 in SIMD 1, 17%
in SIMD 2, 11% in SIMD 3, 7% in SIMD 4 and 4% in SIMD 5 (The Scottish Government,
2012).
Trying to establish whether there are inequalities in access to WHSS due to SIMD is
difficult, as deprivation is not equally distributed across Scotland, the number of cases who
entered the programme from different areas was different, and the proportion of those in
employment in SMEs across the different regions in Scotland is not known. However, 25%
2 The number of people employment deprived is a count of the number of people claiming relevant
benefits (Job Seekers Allowance, Incapacity Benefit, Employment and Support Allowance, or
Severe Disablement Allowance).
14.7%
18.5% 20.8%
22.6% 23.3%
0%
5%
10%
15%
20%
25%
1 2 3 4 5
SIMD

18
Evaluation of WHSS, 2010-14
of WHSS cases are from Dundee and Tayside and Ayrshire and Arran which include 2 of
the 5 highest areas of deprivation in Scotland (North Ayrshire and Dundee City). The
remaining 3 areas of highest deprivation, Glasgow City, Inverclyde, West Dunbartonshire,
fall within Greater Glasgow & Clyde, which makes up 4% of the sample.
Considering the proportion of the sample which came from different SIMD quintiles, and
comparing that with the proportion of that quintile which is not employment deprived shows
that a greater proportion of those in higher SIMD accessed WHSS than those in lower
SIMD. It is estimated that 0.42% of all those in employment (i.e. those employed in large
organisations, SMEs and the self-employed) in SIMD 1 used WHSS; 0.45% of those in
SIMD 2; 0.48% of those in SIMD 3, and 0.50% of those in SIMD 4 and 5. (Note that this is
based on cases which could include the same client entering the programme more than
once). It is possible that the increased use of the service by the less deprived is an
example of the “inverse care law” i.e., those that access services may not be in the
greatest need.
Summary demographic information for cases is presented in Table 3, for those who
completed the entry assessment, and are shown across the SIMD quintiles. This shows
that these demographic data are relatively similar across the SIMD quintiles, with the
exception of age and absence status at entry.
2.4.4 Ethnicity
Of those who provided their ethnicity (10,994), the majority of cases, 9,275 (84%), were
white Scottish, with the total proportion of cases who were white being 96.3%, and 3.7%
being non-white. This is broadly in line with national data on ethnicity and employment
which shows that 97% of those employed in Scotland in 2011-14 are white, while 3% are
non-white (The Office of National Statistics, 2015).
2.4.5 Age
The average age of cases in the whole sample (N=13,463) is 45 (SD 12) years old with
the youngest being 16 years and oldest being 88 years. Altogether 43% of the cases were
over 50-year-old, while only 10% are under 30. Cases aged 30 to 49 year-old account for
47% of the sample (see Figure 6). Note that this includes repeat entries.
These data can broadly be compared with data on employment from the Scottish
Government (Scottish Government, 2014), although the age categories used are different
in Scottish Government figures. However, approximately 35% of the Scottish workforce is
between 16 and 35; 35% is between 35 and 49, and 31% is over 50. While almost a third
of the Scottish workforce is over 50, 43% of referrals into the programme were over 50,
indicating a greater proportion of older workers referring in to WHSS. This is to be
expected, as it is known that, generally, health needs increase with age (Naessens et al,
2011).
Cases with Mental Health (MH) conditions are on average younger (42 [SD 11] years) than
cases with musculoskeletal (MSK) conditions (45 [SD 12] years).

19
Evaluation of WHSS, 2010-14
The average age of cases differs significantly among the SIMD groups (p<0.0001), with
average age going up with increasing SIMD (i.e. those in more deprived categories are
younger (Table 3).
The percentage of each age group who entered the programme more than once goes up
with increasing age, with 3.3% of those aged less than 30 re-entering the programme; 6%
of those aged 30-39; 7.6% of those aged 40-49; and 7.6% of those aged over 50.
Table 3: Demographic details at entry by SIMD quintiles
Cases pre-intervention
SIMD quintiles Whole
sample 1 2 3 4 5
Number 1,718 2,228 2,467 2,626 2,709 11,748
Age
Average age (SD) (years) 43.3 (12) 43.5 (12) 44.6 (12) 45.7 (12) 45.4 (12) 44.6 (12)
Gender
Female (%) 49 47 49 48 48 48
Male (%) 50 52 50 51 51 51
Missing / not specified (%) 0.4 0.8 0.5 0.7 0.8 0.6
Primary health condition
MSK (%) 85 83 83 85 85 84
MH (%) 12 14 13 11 11 12
Other (%) 3 3 4 4 4 4
Employment status
Full time (%) 74 77 75 78 75 76
Part time (%) 26 23 25 22 25 24
Absence status
Off sick at entry (%) 24 22 22 21 19 21

20
Evaluation of WHSS, 2010-14
2.4.6 Gender
Just under half (49%) of enrolled cases were women (6,522) while 6,853 were male, and
this proportion is maintained across the age groups and SIMD groups (Table 3). This
appears to broadly reflect employment rates for men and women, with slightly more men
(75.0%) being employed during the period of the study, than women (67.3%) (The Scottish
Government, 20143).
Figure 6: Percentage of cases by gender for each age group (N=13,375)
There is no significant gender difference between SIMD groups or age groups. The
greatest proportion of cases is men over 50 (Figure 6).
There was no significant difference between the number of men and women re-entering
the programme, with 6% of men and 7% of women entering WHSS more than once.
2.4.7 Standard Occupational Code
The Standard Occupational Code (SOC) was used to categorise cases into the 9 SOC
categories (see Table 4). The greatest proportion of cases (21%) came from SOC 5, the
skilled trades occupations, which includes agriculture, electrical / electronic trades, and
construction and building trades. The smallest proportion (7%) came from SOC 8 Process,
plant and machine operatives (which includes drivers and transport operatives) and SOC
9, elemental occupations, which includes elementary trades and elementary administration
and service occupations.
3 Note, that the figures available from the Scottish Government are for all those in work, not only
those who work in SMEs.
5.4% 9.6%
13.5%
20.2% 4.6%
10.1%
13.8%
22.6%
0%
10%
20%
30%
40%
50%
<30 30-39 40-49 50+
Female Male

21
Evaluation of WHSS, 2010-14
Table 4: Standard Occupational Classification (SOC) [from the Office for National Statistics]
2.4.8 Size of employer
Figure 7 shows that the greatest proportion of cases (30%) came from employers between
11 and 50 employees, while almost 20% were self-employed. Altogether, just over three
quarters (76%) came from organisations with 50 or fewer employees.
Figure 7: Showing the percentage of cases drawn from different sizes of employers
(N=11,608)
Thirty cases reported to be from non-SMEs (with more than 250 employees); these cases
did not meet the WHSS eligibility criteria, but were accepted in a small number of cases.
19.6%
26.3%
30.0%
23.4%
0.3% 0%
5%
10%
15%
20%
25%
30%
35%
1 2 to 10 11 to 50 51 to 250 >251
Standard Occupational Classification % of respondents (N=8,455)
SOC 1: Managers, directors and senior officials 8.6%
SOC 2: Professional occupations 11.9%
SOC 3: Associate professional and technical occupations 9.5%
SOC 4: Administrative and secretarial occupations 11.6%
SOC 5: Skilled trades occupations 21.1%
SOC 6: Caring, leisure and other service occupations 10.9%
SOC 7: Sales and customer service occupations 12.4%
SOC 8: Process, plant and machine operatives 6.8%
SOC 9: Elementary occupations 7.4%

22
Evaluation of WHSS, 2010-14
2.4.9 How cases referred into the programme
The means by which cases referred into the programme is shown in Table 5.
Table 5: The means by which cases referred into the programme (N=13,463)
Self 58.7%
NHS 24 MSK Pilot 19.3%
GP 10.9%
Health professional / AHP 5.2%
Other 1.9%
Line manager / employer 1.3%
NHS physiotherapy waiting list 1.2%
Other / unknown 1.4%
The majority of cases (59%) self-referred into the programme. However, 19.3% (2,594
cases) were referred through the NHS 24 MSK Pilot; furthermore, some Boards worked
closely with their local NHS physiotherapy service and either received cases via health
professional / AHPs (5.2%) or from NHS physiotherapy waiting lists (1.2%). These sources
of referral will have increased the number of MSK cases in the programme. There were no
similar routes for identifying potential cases with a mental health condition, which may
partly account for the higher proportion of cases with a MSK condition than with a mental
health condition.
2.4.10 Primary health condition
Cases‟ primary reason for referring into WHSS is shown in Figure 8.
Figure 8: Primary health condition of cases (N=11,745)
The majority of cases have referred due to a musculoskeletal condition (MSK) (84%);
while 12% have referred with a mental health (MH) condition (depression, stress, anxiety
3.5%
12.1%
84.4%
0% 20% 40% 60% 80% 100%
Other
Mental health (MH)
Musculoskeletal (MSK)

23
Evaluation of WHSS, 2010-14
and other mental health conditions). All other health conditions are categorised as „Other‟
for this analysis and account for 4% of cases. Hereafter, the analysis will be focused on
MSK and MH cases, as they comprise 96% of all cases.
There is an association between deprivation (SIMD) and the primary condition (p=0.04);
cases in SIMD 2 and 3 are 1.2 and 1.1 times more likely, respectively, to have MH as their
primary condition compared to cases in SIMD 5 (least deprived).
Type of occupation was also associated with the primary condition of cases (p<0.0001); all
occupations have higher risks of MH conditions compared to SOC 5 (skilled trades
occupations), with the associate professional and technical occupations group (SOC 3)
having the highest risk overall, being just over 3 times more at risk of MH conditions
compared to cases in SOC 5.
There is also a strong association between gender and primary condition (p<0.0001);
women are twice as likely as men to have a MH condition (RR= 2.00, 95% CI [1.81, 2.22])
(Figure 9).
Figure 9: Proportion of men and women experiencing MSK or mental health conditions at
entry (N=11,317). Those with „other‟ health conditions are not shown (3.5% of the population,
evenly divided between male and female).
2.4.11 Secondary health condition
Altogether, 2,154 of cases (16%) also reported a secondary health condition, for which
they may have received treatment / support while in the WHSS programme. Almost a
quarter (24%) of those with a MH condition had a secondary health condition (most
commonly another MH condition), while 15% of those with an MSK had a secondary
condition (most commonly another MSK). This is shown in Table 6.
38.6% 45.7%
7.9%
4.3%
0%
10%
20%
30%
40%
50%
60%
Female Male
MSK Mental Health

24
Evaluation of WHSS, 2010-14
Table 6: Secondary health conditions of cases
Primary health
condition
Secondary health condition
MSK MH Other Total
MSK (N=9,935) 9% 4% 3% 15%
MH (N=1,434) 6% 14% 4% 24%
2.4.12 Absence status at entry
Altogether 2,902 cases (24.7%) were absent at entry with 8,843 (75.3%) being at work
(N=11,745).
Considering absence by primary health condition shows that 21.4% of MSK cases were
absent at entry (N=9,934), while almost twice as many (41.1%) of MH cases were absent
(N=1,434) (Table 7).
Table 7: Absence status at entry by primary health condition
MSK cases MH cases
N % N %
Off sick at entry 2,125 21.4% 590 41.1%
At work at entry 7,809 78.6% 844 58.9%
Total 9,934 100.0% 1,434 100.0%
2.4.13 Duration of absence at entry
A total of 2,145 cases who were absent from work at their entry assessment provided
information on how long they had been absent up to that point. Of these, 36% (776 cases)
had been absent for no longer than 2 weeks at the time of their entry assessment, while
20% (438 cases) had been absent for more than 12 weeks (Figure 10).
Figure 10: Percentage and number of WHSS cases by the number of weeks on sick leave
before their entry assessment (N=2,145)
776
516
269
146
438
0%
10%
20%
30%
40%
<2 weeks 3-5 weeks 6-8 weeks 9-11 weeks >12 weeks

25
Evaluation of WHSS, 2010-14
2.5 Time in WHSS
2.5.1 Time between enrolment and entry assessment
Among the available sample (11,708), on average there were 5.2 (SD 9.8) days between
the day that cases enrolled into the service and the day they were assessed. The majority
(79%) of cases were assessed within 7 days of their enrolment: 4,232 (36.2%) of cases
had their assessment on the same day as their enrolment; 4,994 (42.7%) were
assessment between 1 to 7 days after being enrolled. 19.5% were assessed between 8
and 30 days after enrolment. A small minority (178 cases, 1.5%) were assessed between
30 and 89 days after enrolment, while this was over 90 days for 19 cases (0.2%).
The waiting time is longer for the cases who were at work at enrolment (5.5 [SD 10] days)
than those cases who were on sick leave (4.4 [SD 9 days]) (p<0.001).
2.5.2 Intervention time (entry assessment to discharge)
Of the 7,022 cases that completed at least some of the discharge paperwork, data on the
duration in the programme are available for 7,008 where the discharge date is after the
assessment date. (Discharge dates prior to the assessment data are considered erroneous
and not included). Of these, the average intervention time was 121.0 days (SD 81.1) days.
The duration of cases in the programme is shown in Table 8. The majority (83%) are
discharged within 6 months of their entry assessment; with 42% being discharged within 90
days and 41% being discharged between 91 and 180 days. Overall, 2% of cases were in
the programme for more than a year.
Table 8: Duration in programme (entry assessment to discharge) (N=7,008)
0 days 0.3%
1 – 30 days 3.8%
31 – 90 days 38.3%
91 – 180 days 41.0%
181 – 365 days 14.6%
Over 365 days 1.8%

26
Evaluation of WHSS, 2010-14
3 Service provision by Boards
3.1 Overview of models
The way that WHSS was implemented varied between the participating Boards, and in
some cases varied over time with staffing changes. A broad overview of the staffing and
models of implementation is given in Table 9. It should be noted that these arrangements
were not fixed and consistent over the duration of the WHSS evaluation period, so
variations across the years are not fully represented. The case management function was
either in-house (by an individual or a team, and the case manager may have also been a
therapy provider) or contracted to Salus (where case managers were not also therapy
providers). Therapy provision (physiotherapy, counselling / psychological services and
occupational therapy) could be provided from within an in-house WHSS team, provided
from within the NHS therapy teams, or contracted out to private practitioners. Boards that
contracted their therapy provision to external providers were responsible for ensuring that
the service provided was occupationally / vocationally focussed.
The models can be summarised as:
A. In-house multidisciplinary team who deliver the case management and
interventions – Borders, Dundee & Tayside, Fife, Forth Valley, Lothian.
B. In-house case management with all interventions delivered by external
contractors – Greater Glasgow & Clyde, Highland, Lanarkshire.
C. In-house case management with interventions delivered through a mix of
external contractors and local NHS arrangements – Ayrshire & Arran, Dumfries
& Galloway, and Grampian.
Note that during the course of the programme Highland and Greater Glasgow & Clyde
changed from having an in-house case manager to their case management being provided
through Salus (NHS Lanarkshire).
There are also significant differences between the Board areas in terms of populations and
geographical coverage (and therefore ease of access for clients to get to therapy
providers). It is therefore difficult to directly compare service delivery between the Boards.
In the subsequent tables and figures, the following abbreviations are used:
A&A Ayrshire and Arran
BD Borders
D&G Dumfries & Galloway
D&T Dundee and Tayside
FF Fife
FV Forth Valley
GGC Greater Glasgow and Clyde
GP Grampian
HL Highland
LK Lanarkshire
LT Lothian

27
Evaluation of WHSS, 2010-14
Table 9: Board arrangements for service provision
Model Case
Manager
(CM)
Physiotherapy Counsellor Occupational Therapy Other
services
Comments
Part of
core
team
Sessions
from NHS
External
Contract
Part of
core
team
Sessions
from NHS
External
Contract
Part of
core
team
Sessions
from NHS
External
Contract
Ayrshire & Arran
C 1 CM Yes Yes Yes Admin Physio is transferred to mainstream if need on-going
Borders A 1 CM Yes Yes For some of program
Admin
Dumfries & Galloway
C 1 CM Yes Yes Yes Admin
Dundee & Tayside
A Team Yes Yes Yes
Fife A 1 CM Yes Yes Yes OH Nurse
Forth Valley A 1 CM Yes Yes Yes
Greater Glasgow & Clyde
B 1 CM / Salus
Yes Yes None Initially own CM & used external contractors; Salus delivery from 2012.
Grampian C 1 CM Yes Yes None Counselling mainly via NHS 24 Living Lives
Highland B 1 CM /
Salus
Yes Yes None Initially own CM; Salus delivery from 2013.
Lanarkshire B Salus Yes Yes Yes Admin
Lothian A Team Yes Yes Yes Admin, welfare & employment rights advice
Previously had a counsellor within the team

28
Evaluation of WHSS, 2010-14
3.2 Cases’ primary health condition, by Board
The primary health condition of cases is shown for each Board in Figure 11; this was
collected at the entry assessment. Fife and Highland have the greatest proportion of cases
with mental health conditions, although the numbers are very small in Highland. Differing
proportions between Boards may be related to the way the services are marketed or
managed in these areas.
Figure 11: Proportion of cases with different primary health conditions by Board
3.3 Absence status at entry
The absence status at entry assessment for cases in the different Board areas are shown
in Figure 12, with the green line showing the average figure (24.7%, N=11,735). Boards
which had a greater proportion of cases entering who were absent include Highland
(although the numbers are very low), Lothian, Ayrshire & Arran, Fife and Grampian.
Figure 12: Proportion of cases who were absent at entry assessment, by Board. The
average for all cases is shown (green line, N=11,735).
83% 85% 81% 88%
72% 85% 87% 86%
62%
87% 75%
14% 15% 16% 10%
22% 11% 8% 11%
26%
10%
16%
3% 1% 3% 2% 5% 3% 5% 4% 13%
3% 9%
0%
20%
40%
60%
80%
100%
MSK MH Other
27.1%
19.6% 20.9% 22.6%
27.1%
18.8%
25.5%
17.9%
39.5%
23.8%
36.7%
0%
10%
20%
30%
40%

29
Evaluation of WHSS, 2010-14
3.4 Completion of programme
There were differences in the full completion of discharge paperwork between Boards
(Figure 13). Completion of the discharge paperwork is classified in two ways: those who
completed at least some of the discharge paperwork („Completed discharge‟); and those
who completed the discharge EQ-5D („Completed discharge EQ-5D‟, i.e. provided a more
complete set of the discharge paperwork for the case – this is a subset of the group who
„completed discharge‟). The percentages shown are of the number of cases who
completed the entry assessment (i.e. were eligible for the service). For example, some
discharge paperwork was received for 28% of cases that entered the Ayrshire and Arran
programme, 36% of Greater Glasgow and Clyde, and 46% of Borders, with Fife and Forth
Valley completing paperwork for 84% and 85% of their cases respectively. Reasons for
this may relate to resources or to staffing issues. It is therefore difficult to compare the
effectiveness of the service provision in different Boards.
Figure 13: Proportion of cases from each Board who completed the discharge
paperwork and EQ-5D
36.8%
58.3%
38.5%
24.6%
56.5%
74.9%
76.1%
40.2%
52.5%
35.6%
23.5%
47.1%
63.4%
62.8%
53.8%
36.2%
58.8%
84.8%
83.7%
64.6%
63.6%
45.9%
28.0%
59.8%
0% 20% 40% 60% 80% 100%
Lothian (N=1,398)
Lanarkshire (N=2,962)
Highland (N=39)
Greater Glasgow & Clyde (N=492)
Grampian (N=840)
Forth Valley (N=835)
Fife (N=406)
Dundee & Tayside (N=2,570)
Dumfries & Galloway (N=360)
Borders (N=714)
Ayrshire & Arran (N=1,132)
Total (N=11,748)
Completed discharge (as % of entry) Completed discharge EQ-5D (as % of entry)

30
Evaluation of WHSS, 2010-14
3.5 Duration in the programme
The average duration of time that cases were in the programme varies between Boards.
Figure 14 shows the average and standard deviation (error bars) of duration in the
programme for those who completed at least some of the discharge paperwork.
Figure 14: Average duration of time that cases were in the programme, by Board, for those
who completed the discharge paperwork
The longest average durations are seen for Dundee and Tayside (163 days), Grampian
(147 days), Borders (142 days) and Forth Valley (127 days). The shortest durations are
seen at Greater Glasgow and Clyde (82 days) and Lanarkshire (88 days). The average for
all these cases is 121 days (SD 81.6).
3.6 Service delivery
Because significant amounts of data are missing from some Boards, care should be taken
when considering the differences in service delivery between them. However, the data
which are available are summarised in Table 10, showing the number of cases that
received that service, and the average and maximum number of sessions attended by a
case. Note the N value is the number of cases for whom there were data showing that they
had been offered at least 1 therapy session (i.e. those recorded as being offered no
sessions, or where these data are missing, are excluded). No comment can be made
about the suitability of the amount or duration of service provision as details on the
differences in the needs of cases are not known.
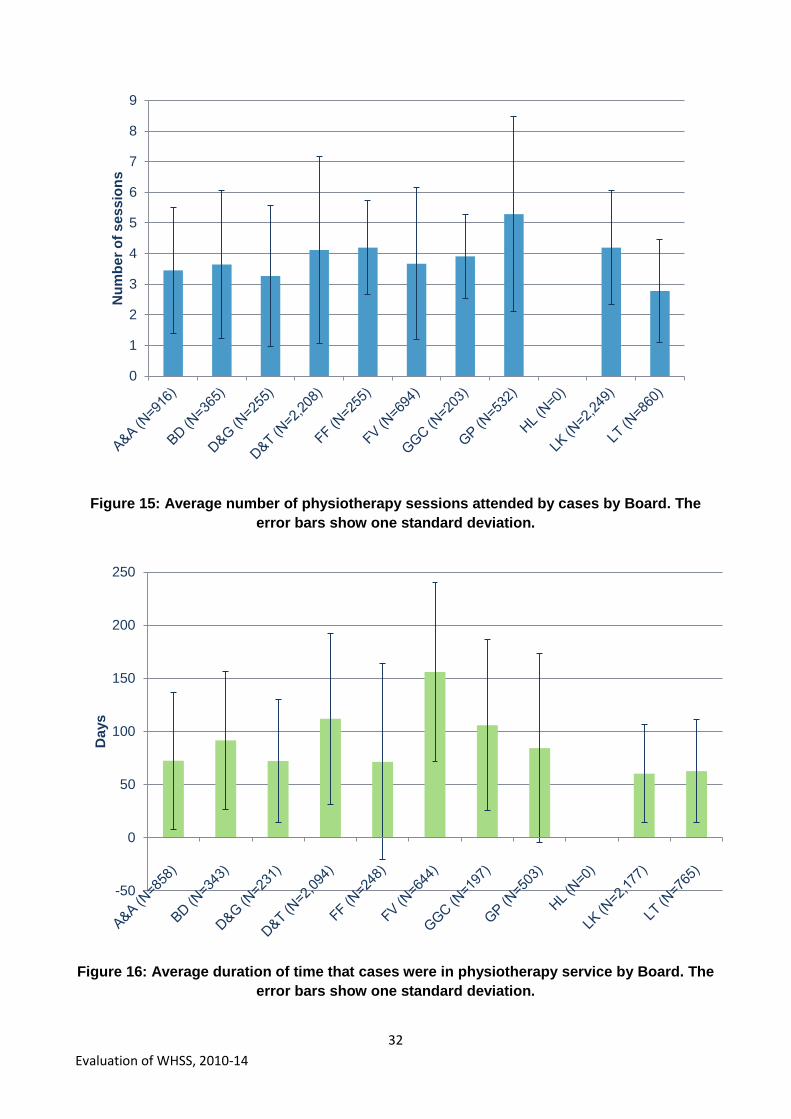
The average number of therapy sessions provided by Board is also shown for
physiotherapy (Figure 15), counselling / CBT / psychology services (Figure 17) and
occupational therapy (Figure 19).
0
50
100
150
200
250
300
Du
rati
on
(d
ays
)
31
Evaluation of WHSS, 2010-14
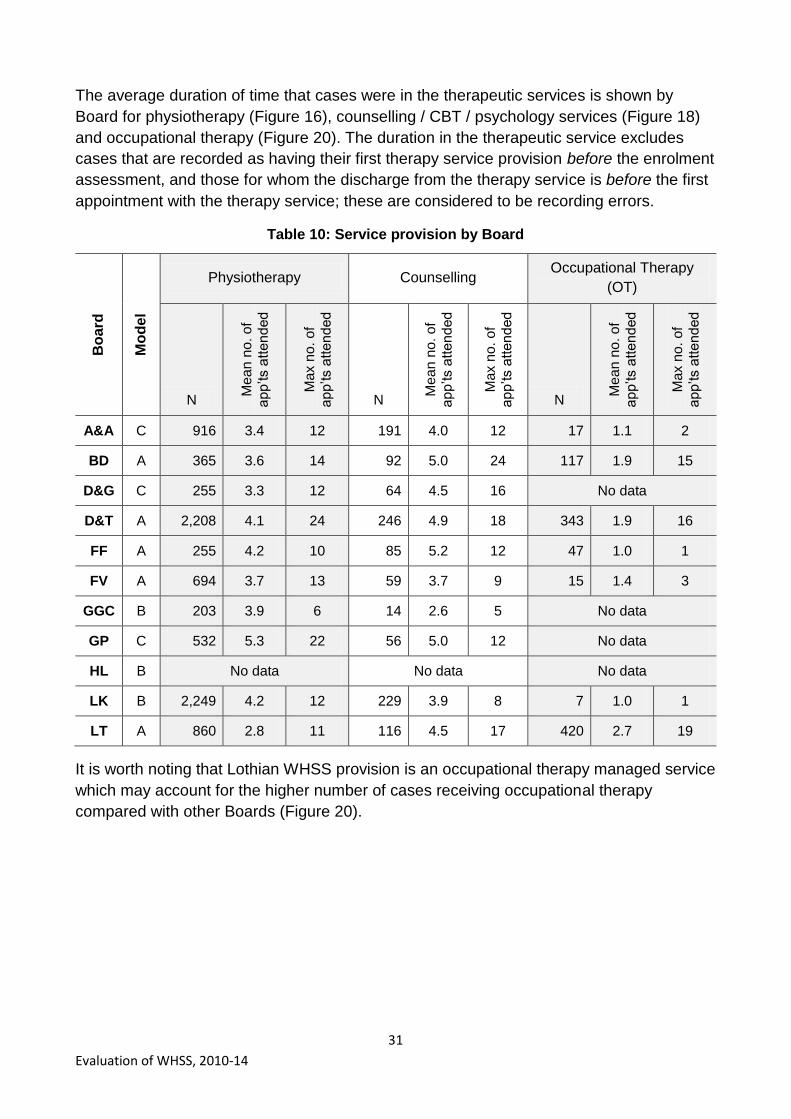
The average duration of time that cases were in the therapeutic services is shown by
Board for physiotherapy (Figure 16), counselling / CBT / psychology services (Figure 18)
and occupational therapy (Figure 20). The duration in the therapeutic service excludes
cases that are recorded as having their first therapy service provision before the enrolment
assessment, and those for whom the discharge from the therapy service is before the first
appointment with the therapy service; these are considered to be recording errors.
Table 10: Service provision by Board
Bo
ard
Mo
de
l
Physiotherapy Counselling Occupational Therapy
(OT)
N
Me
an
no
. o
f a
pp‟ts a
tte
nd
ed
Ma
x n
o. o
f a
pp‟ts a
tte
nd
ed
N
Me
an
no
. o
f a
pp‟ts a
tte
nd
ed
Ma
x n
o. o
f a
pp‟ts a
tte
nd
ed
N
Me
an
no
. o
f a
pp‟ts a
tte
nd
ed
Ma
x n
o. o
f a
pp‟ts a
tte
nd
ed
A&A C 916 3.4 12 191 4.0 12 17 1.1 2
BD A 365 3.6 14 92 5.0 24 117 1.9 15
D&G C 255 3.3 12 64 4.5 16 No data
D&T A 2,208 4.1 24 246 4.9 18 343 1.9 16
FF A 255 4.2 10 85 5.2 12 47 1.0 1
FV A 694 3.7 13 59 3.7 9 15 1.4 3
GGC B 203 3.9 6 14 2.6 5 No data
GP C 532 5.3 22 56 5.0 12 No data
HL B No data No data No data
LK B 2,249 4.2 12 229 3.9 8 7 1.0 1
LT A 860 2.8 11 116 4.5 17 420 2.7 19
It is worth noting that Lothian WHSS provision is an occupational therapy managed service
which may account for the higher number of cases receiving occupational therapy
compared with other Boards (Figure 20).
32
Evaluation of WHSS, 2010-14
Figure 15: Average number of physiotherapy sessions attended by cases by Board. The
error bars show one standard deviation.
Figure 16: Average duration of time that cases were in physiotherapy service by Board. The
error bars show one standard deviation.
0
1
2
3
4
5
6
7
8
9N
um
be
r o
f s
es
sio
ns
-50
0
50
100
150
200
250
Da
ys

33
Evaluation of WHSS, 2010-14
Figure 17: Average number of counselling / CBT / psychology sessions attended by cases
by Board. The error bars show one standard deviation.
Figure 18: Average duration of time that cases were in counselling / CBT / psychology
service by Board. The error bars show one standard deviation.
0
1
2
3
4
5
6
7
8
9
10N
um
be
r o
f s
es
sio
ns
-50
0
50
100
150
200
250
Da
ys

34
Evaluation of WHSS, 2010-14
Figure 19: Average number of occupational therapy sessions attended by cases by Board.
The error bars show one standard deviation.
Figure 20: Average duration of time that cases were in occupational therapy service by
Board. The error bars show one standard deviation.
-1
0
1
2
3
4
5
6N
um
be
r o
f s
es
sio
ns
-50
0
50
100
150
200
250
Da
ys

35
Evaluation of WHSS, 2010-14
4 Discharge
4.1 Cases that completed the programme
As discussed in Section 2.3, two indications can be used for whether cases completed the
programme; whether they had any relevant data in the discharge paperwork (N=7,022);
and whether they had completed the EQ-5D at discharge (which is a subset of the first
group, with a more complete set of discharge paperwork, N=5,590).
Overall, half (50.3%) of the 11,103 cases, for whom entry EQ-5D scores are recorded,
completed the discharge EQ-5D paperwork. This proportion is maintained across gender,
primary health condition, SIMD and absence status at entry (Figure 21). Differences in
recorded completion rate were seen when analysed by age, with the proportion who
completed the programme being 36% among the youngest (<30) and 55% for the oldest
age group (50+). Differences in completion by Board area are discussed in Section 3.4.
Figure 21: Percentage of cases who completed the programme compared to those who
entered WHSS (completed the entry assessment)
50%
51%
50%
37%
46%
50%
55%
50%
51%
52%
50%
51%
50%
48%
52%
51%
49%
0% 10% 20% 30% 40% 50% 60%
All (N=11,103)
Female (N=5,317)
Male (N=5,737)
<30 (N=1,044)
30-39 (N=2,144)
40-49 (N=3,082)
50+ (N=4,833)
MSK (N=9,458)
MH (N=1,261)
Other (N=378)
1 (Most deprived) (N=1,616)
2 (N=2,126)
3 (N=2,329)
4 (N=2,480)
5 (Least deprived) (N=2,552)
At work (N=8,379)
Off sick (N=2,724)
All
Ge
nd
er
Ag
e B
an
d (
Ye
ars
)P
rim
ary
he
alth
con
ditio
nD
ep
riva
tio
n c
ate
go
ry b
yS
IMD
quin
tile
s
Ab
sen
ce
sta
tus a
te
ntr
y
36
Evaluation of WHSS, 2010-14
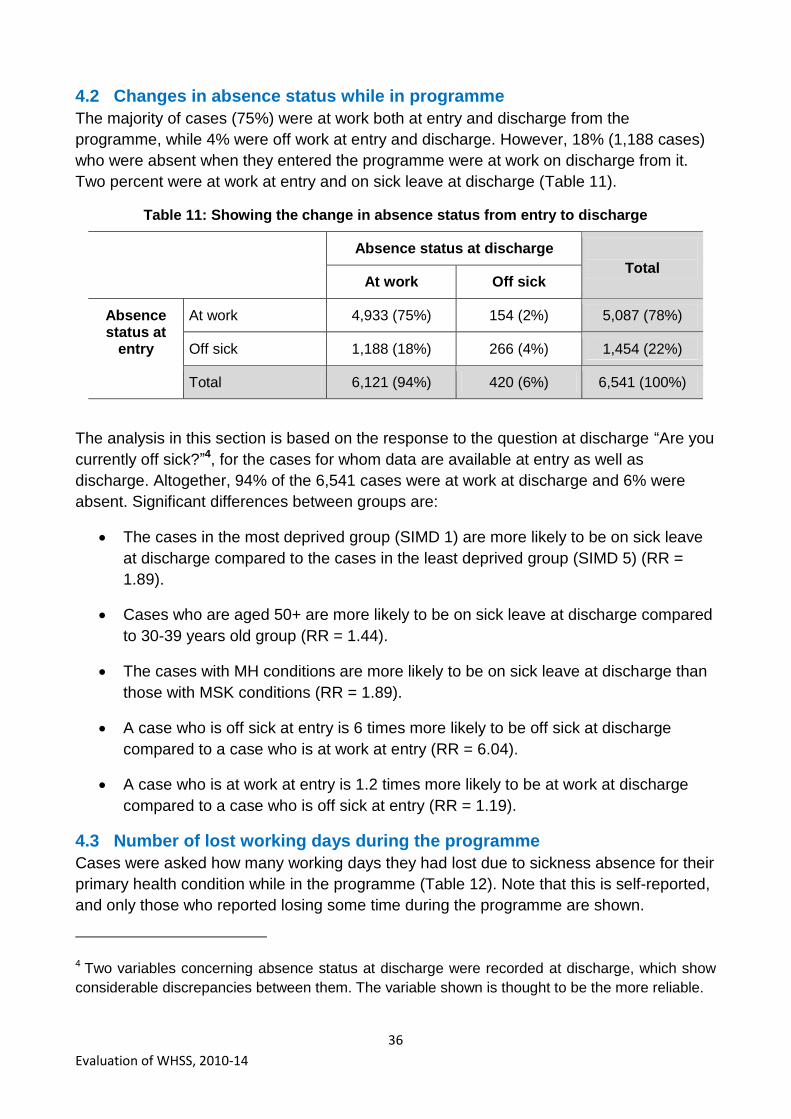
4.2 Changes in absence status while in programme
The majority of cases (75%) were at work both at entry and discharge from the
programme, while 4% were off work at entry and discharge. However, 18% (1,188 cases)
who were absent when they entered the programme were at work on discharge from it.
Two percent were at work at entry and on sick leave at discharge (Table 11).
Table 11: Showing the change in absence status from entry to discharge
Absence status at discharge
Total At work Off sick
Absence status at
entry
At work 4,933 (75%) 154 (2%) 5,087 (78%)
Off sick 1,188 (18%) 266 (4%) 1,454 (22%)
Total 6,121 (94%) 420 (6%) 6,541 (100%)
The analysis in this section is based on the response to the question at discharge “Are you
currently off sick?”4, for the cases for whom data are available at entry as well as
discharge. Altogether, 94% of the 6,541 cases were at work at discharge and 6% were
absent. Significant differences between groups are:
The cases in the most deprived group (SIMD 1) are more likely to be on sick leave
at discharge compared to the cases in the least deprived group (SIMD 5) (RR =
1.89).
Cases who are aged 50+ are more likely to be on sick leave at discharge compared
to 30-39 years old group (RR = 1.44).
The cases with MH conditions are more likely to be on sick leave at discharge than
those with MSK conditions (RR = 1.89).
A case who is off sick at entry is 6 times more likely to be off sick at discharge
compared to a case who is at work at entry (RR = 6.04).
A case who is at work at entry is 1.2 times more likely to be at work at discharge
compared to a case who is off sick at entry (RR = 1.19).
4.3 Number of lost working days during the programme
Cases were asked how many working days they had lost due to sickness absence for their
primary health condition while in the programme (Table 12). Note that this is self-reported,
and only those who reported losing some time during the programme are shown.
4 Two variables concerning absence status at discharge were recorded at discharge, which show
considerable discrepancies between them. The variable shown is thought to be the more reliable.

37
Evaluation of WHSS, 2010-14
Table 12: Average number of working days lost while in WHSS, by absence status at entry
Entry Discharge N Average working days lost while in WHSS
Standard Deviation (working days)
At work At work 489 10.0 17.3
Absent 48 38.5 51.9
Unknown 59 24.8 39.4
Absent At work 616 28.0 34.0
Absent 123 66.0 63.3
Unknown 96 71.1 64.4
Total 1,431 28.2 41.6
A return to work date was provided by 551 cases who were absent at entry; it was
therefore possible to calculate the number of calendar days from their enrolment
assessment to their return to work (i.e. their absence while in the programme). They had
an average absence while in the programme of 51.8 calendar days (SD = 63.8 calendar
days). This same group self-reported that they had lost an average of 31.0 working days
while in the programme (SD = 37.1 working days).
For the 1,431 cases who provided information on the number of working days lost while in
the programme, the average number of working days lost was 28.2 (SD=41.6). For the
1,063 MSK cases, the self-reported number of working days lost while in WHSS was 22.5
(SD=33.1); while it was twice as long for the 291 MH cases, at 44.0 working days
(SD=54.5).
4.4 Association between lost working time while in the programme and other
factors
The results of the time series analytical model on the duration of sickness absence
indicate that age, length of absence prior to entering the programme, primary condition
and duration in the programme are related to the number of lost days while in the
programme; gender and SIMD did not significant influence the number of lost days while in
the programme. The autoregressive model suggests that older cases took longer to return
to work, with almost 5 more days for every 10 additional years of age. The number of days
lost due to sickness absence while in the programme is significantly higher in MH cases
(p<0.001) than MSK cases; 50% of MSK cases are back to work in 21 days, while this is
46 days for MH cases (Figure 22).
In general, those who had been off sick for a longer time prior to entry took longer to go
back to work during the intervention. The time it took for 50% of the cases who had been
on sick leave for up to 2 weeks prior to entering the programme to return to work was 23
days, while it was 63 days for those who had been off sick for 9 to 11 weeks. There is a
significant difference between the cases who were off sick for the shortest time before

38
Evaluation of WHSS, 2010-14
entry assessment (0-2 weeks) and those who were off sick for over 9 weeks (p<0.0001)
(Figure 23).
Figure 22: Kaplan Meier return to work curve by primary condition
[MH=Mental health cases; MSK=musculoskeletal cases]
Figure 23: Median length of time (days) being off sick since assessment by the number of
weeks cases have been off sick before assessment.
The best statistical model to model duration of sickness absence for the cases that were
off sick at entry assessment includes age, length of time between sick leave and entering
the programme, primary health condition and discharge time. Gender (p=0.32), SIMD
(p=0.19), occupation category (p=0.35), and general health status at entry assessment
(EQ-5D index) (p=0.36) were not significant factors and therefore are not included in the

39
Evaluation of WHSS, 2010-14
model. HADS and COPM scores were not included in this analysis, as this would have
reduced the sample size and thus the analysis power of the model.
As seen in Table 13, age is positively correlated to the duration of sickness absence and
adds almost 5 days to the duration of absence for every 10 year age category i.e. older
cases took longer to return to work, with almost 5 more days of absence for every 10
additional years of age. The referrals that had longer sickness absence prior to entering
the programme also had a longer sickness absence during the programme. Duration of
sickness absence prior to entry assessment was re-coded for the analysis (1= 0 to 2
weeks; 2= 3 to 5 weeks; 3= 6 to 8 weeks; 4= 9 to 11 weeks; 5=over 12 weeks). By moving
up in sickness absence prior to entry categories, 10 days are added to the duration of
sickness i.e. the model suggests that those who were absent for less than 2 weeks prior to
entry to the programme, had absences of almost 10 days less than those who had been
off for 3-5 weeks prior to entry, and almost 40 days less than those who had been off for
over 12 weeks prior to entry. The impact of primary health condition was analysed using
mental health as the reference category. The statistical model also suggests that those
who presented with MSK conditions had 10 days less sickness absence while in the
programme than those with MH conditions. Longer periods of sickness absence while in
WHSS were associated with longer durations in the programme; for every 10 additional
days in cases‟ discharge time from the programme, their sickness absence duration while
in the programme increased by 2 days.
Table 13: Model result of ARIMA model for duration of sickness absence of WHSS referrals
Model parameters Estimate
(days)
Standard
error of
estimates
Z-
statistic
P-value
Age (years) 0.49 0.16 3.04 0.003
Duration of sickness absence prior to
entering the programme (ref= 0-2 weeks) 9.91 1.81 5.47 <0.0001
Primary condition (ref= MH) -10.60 3.65 2.90 0.006
Discharge time (days) 0.22 0.03 8.23 <0.0001
4.5 Health issue resolved
Of the 7,869 cases who responded to the question at discharge, on whether the health
issue was resolved, 77% answered positively (34% fully resolved, 43% partly resolved).
The proportion saying that their health issue had resolved was lowest in SIMD 1 (74%)
and highest in SIMD 5 (81%).
Considering this by primary health condition, 80% of those who had a MSK condition at
entry considered that their health condition was either fully or partially resolved at
discharge, while 83% of the MH cases considered the same (Figure 24).

40
Evaluation of WHSS, 2010-14
Figure 24: The percentage of MSK and MH cases who thought their health condition had
resolved at discharge
Considering this by absence status at entry, 81% who were at work at entry (N=5,784)
reported that their health condition was either partly or fully resolved at discharge, while
this was 74% for those who were absent at entry (N=1,863) (Figure 25).
Figure 25: The percentage of those who were absent / at work at entry who thought their
health condition had resolved at discharge
36%
44%
13%
7%
32%
51%
12%
6%
0%
10%
20%
30%
40%
50%
60%
Yes, fully Yes, partially No Don't know
MSK (N=6,399) MH (N=956)
35%
43%
13%
9%
31%
43%
17%
8%
0%
10%
20%
30%
40%
50%
Yes, fully Yes, partially No Don't know
At work (N=6,006) Absent (N=1,863)

41
Evaluation of WHSS, 2010-14
4.6 Changes in health tool scores at discharge
4.6.1 Overview
Entry and discharge health measures were statistically compared for the cases that
completed the programme, for which the EQ-5D scores were available at entry and
discharge. The HADS and COPM scores at entry and discharge were analysed where
these data were available from the group for whom there were completed EQ-5D at entry
and discharge. This is summarised in Table 14.
Table 14: Average changes in health measure scores
Measure Pre intervention mean score
Post-intervention mean score
Average change in
score
Number
EQ-5D index
All completers 0.51 0.81 0.30 5,590
MSK cases 0.50 0.81 0.31 4,749
MH cases 0.58 0.84 0.26 646
EQ-5D VAS score
All completers 59.1 80.0 22.5 5,472
MSK cases 60.6 80.8 22.5 4,653
MH cases 48.8 76.2 30.0 631
COPM Performance score
All completers 3.84 7.54 3.70 3,771
MSK cases 3.91 7.62 3.71 3,182
MH cases 3.27 7.26 3.99 457
COPM Satisfaction score
All completers 2.87 7.44 5.00 3,754
MSK cases 2.91 7.53 5.00 3,166
MH cases 2.46 7.18 5.00 457
HADS anxiety score
All completers 7.36 4.04 -3.32 1,696
MSK cases 5.57 3.26 -2.31 1,203
MH cases 12.67 6.18 -6.50 400
HADS depression score
All completers 5.94 2.80 -3.14 1,696
MSK cases 4.68 2.33 -2.35 1,203
MH cases 9.65 3.98 -5.67 400
42
Evaluation of WHSS, 2010-14
Table 14 shows the mean entry assessment (pre-intervention) and discharge (post-
intervention) scores for the EQ-5D index value; the EQ-5D VAS, COPM Performance and
Satisfaction scores; and HADS Anxiety and Depression scores. The average change in
score is also shown. For all health measures the changes from entry to discharge are
statistically significant (p<0.001), and this remains the case when the changes are
considered by primary health condition (MSK and MH). Note that the figures for „All
completers‟ are similar to the figures for „MSK cases‟ as the „All completers‟ population is
largely made up of MSK cases (approximately 84%).
Note also that a negative change in score for the HADS anxiety and depression scores
indicates an improvement. Not surprisingly, the change in HADS scores for cases with MH
primary condition is greater than for cases with MSK primary condition (as it is measuring
anxiety and depression), while the changes in the other health measures are more similar
when comparing the two health conditions.
A multivariate logistic regression model suggests that the number of services offered to the
cases influences the odds of completing the discharge paperwork (and therefore the
programme); the odds of completing the discharge are reduced if more services are
offered to the cases. Also those cases whose interventions lasted for longer periods were
less likely to complete the discharge. The number of services offered and the duration of
use of these services are likely to indicate a complex health need, which could be a
reason for non-completion of the programme.
4.6.2 Changes in EQ-5D index scores
Changes in EQ-5D index scores were calculated for the 5,590 cases for whom there are
entry and discharge scores. The changes in EQ-5D index range from -0.92 to 1.41
(negative sign means the health got worse from entry to discharge). The average change
in score is 0.30, which is statistically significant from zero (p<0.001). Altogether, 4,920
cases (88%) improved their index score (by an average of 0.35 points); 5% of cases did
not change their index score; 7% had a worse index score (by an average of 0.15 points).
The extent of the positive change is striking from a health economic perspective, and
although there is no control group, it cannot be ruled out that the WHSS intervention has
contributed to this health benefit.
When considering the change in EQ-5D index score by primary health condition, Figure 26
shows that 89% of MSK cases and 84% of MH cases improved their EQ-5D score, with a
slightly greater increase in score for the MSK cases (0.36 compared with 0.33 for MH
cases). Altogether, 6% of MSK cases and 9% of MH cases had a worse score at
discharge, with similar values (-0.15 and -0.13 respectively).
The mean score of MSK cases was 0.50 at entry which rose to 0.81 at discharge
(N=4,749). For MH cases the mean scores rose from 0.58 to 0.84 (N=646).

43
Evaluation of WHSS, 2010-14
Figure 26: Change in EQ-5D index values shown for MSK and MH cases
The EQ-5D index value for those at work and absent at entry is shown in Figure 27.
Figure 27: Change in EQ-5D index values shown for those at work / absent at entry
Figure 27 shows that 88% both of those who were at work and those who were absent at
entry had a better EQ-5D index score at discharge. The improvement was greater for
6.2% 4.6%
89.2%
9.3% 7.1%
83.6%
-0.15
0.36
-0.13
0.33
-20%
0%
20%
40%
60%
80%
100%
Worse Same Better Worse Same Better
MSK (N=4,749) MH (N=646)
% of cases Average change in score
6.6% 5.2%
88.1%
7.9% 4.3%
87.8%
-0.14
0.33
-0.18
0.42
-20%
0%
20%
40%
60%
80%
100%
Worse Same Better Worse Same Better
At work at entry (N=4,267) Absent at entry (N=1,323)
% of cases Average change in score
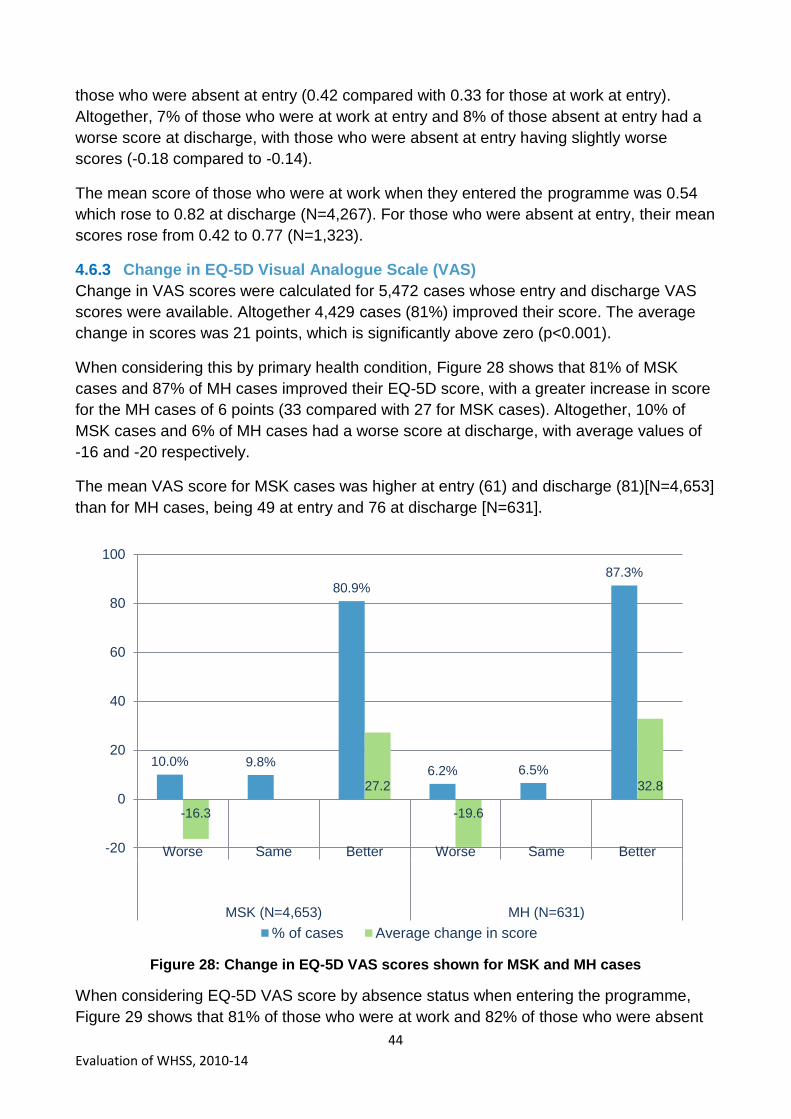
44
Evaluation of WHSS, 2010-14
those who were absent at entry (0.42 compared with 0.33 for those at work at entry).
Altogether, 7% of those who were at work at entry and 8% of those absent at entry had a
worse score at discharge, with those who were absent at entry having slightly worse
scores (-0.18 compared to -0.14).
The mean score of those who were at work when they entered the programme was 0.54
which rose to 0.82 at discharge (N=4,267). For those who were absent at entry, their mean
scores rose from 0.42 to 0.77 (N=1,323).
4.6.3 Change in EQ-5D Visual Analogue Scale (VAS)
Change in VAS scores were calculated for 5,472 cases whose entry and discharge VAS
scores were available. Altogether 4,429 cases (81%) improved their score. The average
change in scores was 21 points, which is significantly above zero (p<0.001).
When considering this by primary health condition, Figure 28 shows that 81% of MSK
cases and 87% of MH cases improved their EQ-5D score, with a greater increase in score
for the MH cases of 6 points (33 compared with 27 for MSK cases). Altogether, 10% of
MSK cases and 6% of MH cases had a worse score at discharge, with average values of
-16 and -20 respectively.
The mean VAS score for MSK cases was higher at entry (61) and discharge (81)[N=4,653]
than for MH cases, being 49 at entry and 76 at discharge [N=631].
Figure 28: Change in EQ-5D VAS scores shown for MSK and MH cases
When considering EQ-5D VAS score by absence status when entering the programme,
Figure 29 shows that 81% of those who were at work and 82% of those who were absent
10.0% 9.8%
80.9%
6.2% 6.5%
87.3%
-16.3
27.2
-19.6
32.8
-20
0
20
40
60
80
100
Worse Same Better Worse Same Better
MSK (N=4,653) MH (N=631)
% of cases Average change in score

45
Evaluation of WHSS, 2010-14
at entry had a better EQ-5D index score at discharge. The improvement was greater for
those who were absent at entry (32 points compared with 26 points for those at work at
entry). Altogether, 10% of both those who were at work and those absent at entry had a
worse score at discharge, with those who were absent at entry having a worse average
score (-21) compared to those who were at work at entry (-16).
The mean score of cases who were at work when they entered the programme was 62.6
which rose to 81.4 at discharge (N=4,189), an increase of 19.8 points. The mean scores of
cases who were absent at entry rose from 51.0 to 75.5 (N=1,283), an increase of 24.5
points.
Figure 29: Change in EQ-5D VAS scores shown for those at work / absent at entry
4.6.4 Overview of HADS scores
HADS anxiety and depression scores are available for 1,696 of the cases who completed
the EQ-5D at discharge; 71% of these are cases with MSK as a primary condition and
24% have an MH condition as a primary condition, while 5% have an „other‟ health
condition. HADS scores range from 0 to 21, while 0-7 is considered normal, 8-10
borderline and 11-21 is „caseness‟. The following sections present the changes in
caseness status and in HADS score for the anxiety scores (section 4.6.5) and the
depression scores (section 4.6.6).
9.5% 10.0%
80.6%
10.0% 7.8%
82.2%
-15.5
26.4
-20.6
32.3
-20
0
20
40
60
80
100
Worse Same Better Worse Same Better
At work at entry (N=4,189) Absent at entry (N=1,283)
% of cases Average change in score

46
Evaluation of WHSS, 2010-14
4.6.5 HADS anxiety scores
The status relating to anxiety of all cases in pre- and post-intervention for the three
categories is given in Table 15.
Table 15: HADS anxiety status at pre- and post-intervention
Post-intervention
Total Normal Borderline Caseness
Pre-
intervention
Normal 926 (54.6%) 29 (1.7%) 13 (0.8%) 968 (57.1%)
Borderline 182 (10.7%) 35 (2.1%) 12 (0.7%) 229 (13.5%)
Caseness 288 (17.0%) 104 (6.1%) 107 (6.3%) 499 (29.4%)
Total 1,396 (82.3%) 168 (9.9%) 132 (7.8%) 1,696 (100%)
Table 15 shows that 29% of cases had „caseness‟ anxiety status at entry to the
programme while only 8% did at discharge. In addition, 574 cases (34%) have moved to a
healthier HADS anxiety category, among which 288 cases (17%) changed from caseness
to normal. However, 54 (3%) moved to a poorer HADS anxiety category. Altogether, 55%
were considered as normal and did not change during intervention.
The changes in HADS anxiety status for the MSK cases are shown in Table 16 and for MH
cases in Table 17. This shows differences between the groups, reflecting the fact that the
HADS measures the mental health issues of anxiety and depression. Altogether 23% of
MSK cases have moved to a healthier HADS anxiety score, while 69% of MH cases have.
A table is not shown for those with an „other‟ primary health condition.
Table 16: HADS anxiety status at pre- and post-intervention for MSK cases
Post-intervention
Total Normal Borderline Caseness
Pre-
intervention
Normal 820 (68.2%) 23 (1.9%) 11 (0.9%) 854 (71.0%)
Borderline 125 (10.4%) 22 (1.8%) 9 (0.7%) 156 (13.0%)
Caseness 101 (8.4%) 48 (4.0%) 44 (3.7%) 193 (16.0%)
Total 1,046 (86.9%) 93 (7.7%) 64 (5.3%) 1,203 (100%)

47
Evaluation of WHSS, 2010-14
Table 17: HADS anxiety status at pre- and post-intervention for MH cases
Post-intervention
Total Normal Borderline Caseness
Pre-
intervention
Normal 56 (14.0%) 3 (0.8%) 1 (0.3%) 60 (15.0%)
Borderline 47 (11.8%) 10 (2.5%) 2 (0.5%) 59 (14.8%)
Caseness 175 (43.8%) 52 (13.0%) 54 (13.5%) 281 (70.3%)
Total 278 (69.5%) 65 (16.3%) 57 (14.3%) 400 (100%)
Table 18 and 19 show these changes in score for cases who were at work at entry (Table
18) and those who were absent at entry (Table 19). Altogether 29% of cases who were at
work at entry have moved to a healthier HADS anxiety score, while 46% of those who
were absent have.
Table 18: HADS anxiety status at pre- and post-intervention for those at work at entry
Post-intervention
Total Normal Borderline Caseness
Pre-
intervention
Normal 746 (61.9%) 23 (1.9%) 8 (0.7%) 777 (64.4%)
Borderline 123 (10.2%) 28 (2.3%) 2 (0.2%) 153 (12.7%)
Caseness 164 (13.5%) 61 (5.1%) 52 (4.3%) 276 (22.9%)
Total 1,032 (85.6%) 112 (9.3%) 62 (5.1%) 1,206 (100%)
Table 19: HADS anxiety status at pre- and post-intervention for those absent at entry
Post-intervention
Total Normal Borderline Caseness
Pre-
intervention
Normal 180 (36.7%) 6 (1.2%) 5 (1.0%) 191 (39.0%)
Borderline 59 (12.0%) 7 (1.4%) 10 (2.0%) 76 (15.5%)
Caseness 125 (25.5%) 43 (8.8%) 55 (11.2%) 223 (45.5%)
Total 364 (74.3%) 56 (11.4%) 70 (14.3%) 490 (100%)
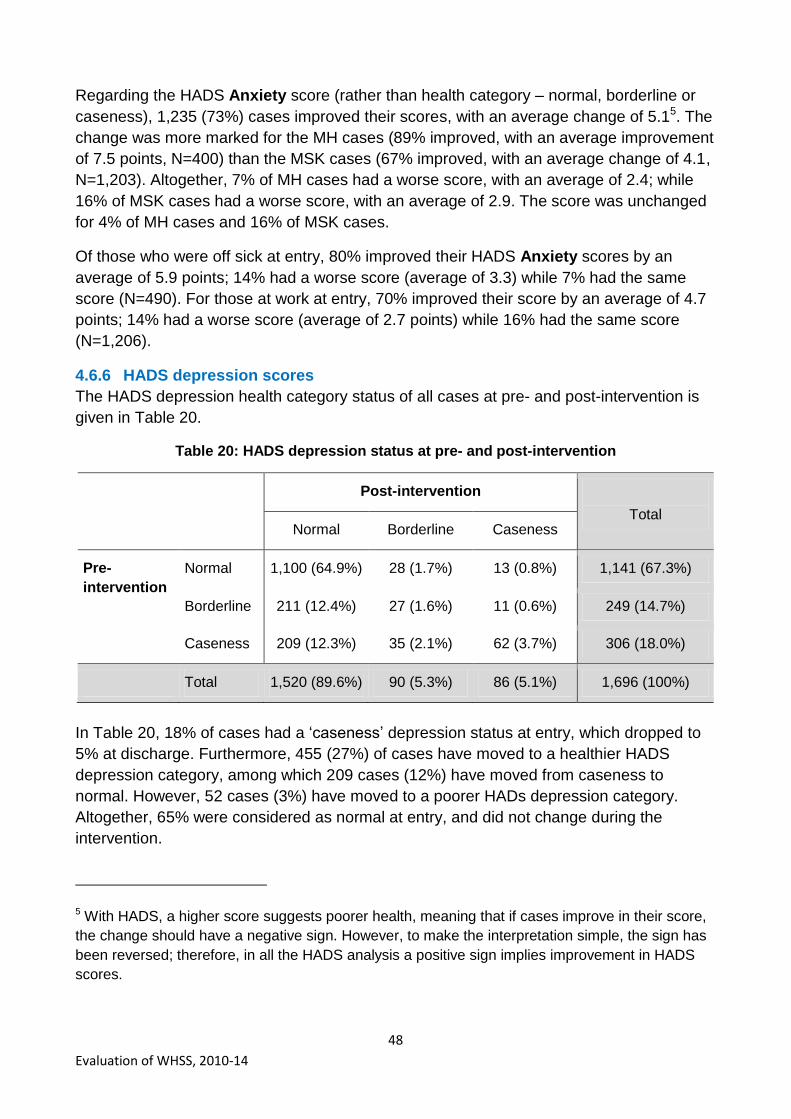
48
Evaluation of WHSS, 2010-14
Regarding the HADS Anxiety score (rather than health category – normal, borderline or
caseness), 1,235 (73%) cases improved their scores, with an average change of 5.15. The
change was more marked for the MH cases (89% improved, with an average improvement
of 7.5 points, N=400) than the MSK cases (67% improved, with an average change of 4.1,
N=1,203). Altogether, 7% of MH cases had a worse score, with an average of 2.4; while
16% of MSK cases had a worse score, with an average of 2.9. The score was unchanged
for 4% of MH cases and 16% of MSK cases.
Of those who were off sick at entry, 80% improved their HADS Anxiety scores by an
average of 5.9 points; 14% had a worse score (average of 3.3) while 7% had the same
score (N=490). For those at work at entry, 70% improved their score by an average of 4.7
points; 14% had a worse score (average of 2.7 points) while 16% had the same score
(N=1,206).
4.6.6 HADS depression scores
The HADS depression health category status of all cases at pre- and post-intervention is
given in Table 20.
Table 20: HADS depression status at pre- and post-intervention
Post-intervention
Total Normal Borderline Caseness
Pre-
intervention
Normal 1,100 (64.9%) 28 (1.7%) 13 (0.8%) 1,141 (67.3%)
Borderline 211 (12.4%) 27 (1.6%) 11 (0.6%) 249 (14.7%)
Caseness 209 (12.3%) 35 (2.1%) 62 (3.7%) 306 (18.0%)
Total 1,520 (89.6%) 90 (5.3%) 86 (5.1%) 1,696 (100%)
In Table 20, 18% of cases had a „caseness‟ depression status at entry, which dropped to
5% at discharge. Furthermore, 455 (27%) of cases have moved to a healthier HADS
depression category, among which 209 cases (12%) have moved from caseness to
normal. However, 52 cases (3%) have moved to a poorer HADs depression category.
Altogether, 65% were considered as normal at entry, and did not change during the
intervention.
5 With HADS, a higher score suggests poorer health, meaning that if cases improve in their score,
the change should have a negative sign. However, to make the interpretation simple, the sign has
been reversed; therefore, in all the HADS analysis a positive sign implies improvement in HADS
scores.

49
Evaluation of WHSS, 2010-14
Table 21 and 22 show these changes in score for cases with MSK (Table 21) and MH as a
primary health condition (Table 22). Altogether 17% of MSK cases have moved to a
healthier HADS depression score, while 55% of MH cases have.
Table 21: HADS depression status at pre- and post-intervention for MSK cases
Post-intervention
Total Normal Borderline Caseness
Pre-
intervention
Normal 916 (76.1%) 19 (1.6%) 6 (0.5%) 941 (78.2%)
Borderline 113 (9.4%) 17 (1.4%) 6 (0.5%) 136 (11.3%)
Caseness 82 (6.8%) 14 (1.2%) 30 (2.5%) 126 (10.5%)
Total 1,111 (92.4%) 50 (4.2%) 42 (3.5%) 1,203 (100%)
Table 22: HADS depression status at pre- and post-intervention for MH cases
Post-intervention
Total Normal Borderline Caseness
Pre-
intervention
Normal 127 (31.8%) 7 (1.8%) 5 (1.3%) 139 (34.8%)
Borderline 85 (21.3%) 8 (2.0%) 3 (0.8%) 96 (24.0%)
Caseness 119 (29.8%) 17 (4.3%) 29 (7.3%) 165 (41.3%)
Total 331 (82.8%) 32 (8.0%) 37 (9.3%) 400 (100%)
Table 23 and 24 show these changes in score for cases who were at work at entry (Table
23) and those who were absent at entry (Table 24). Altogether 20% of cases who were at
work at entry have moved to a healthier HADS depression score, while 43% of those who
were absent have.
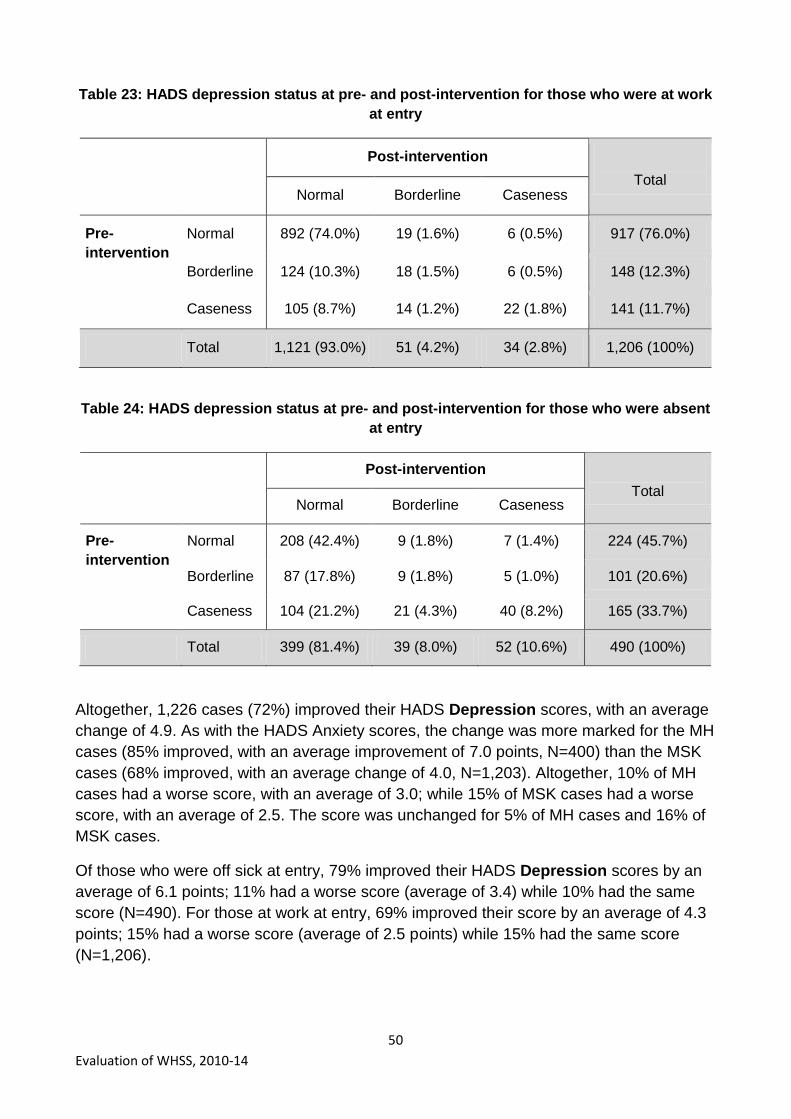
50
Evaluation of WHSS, 2010-14
Table 23: HADS depression status at pre- and post-intervention for those who were at work
at entry
Post-intervention
Total Normal Borderline Caseness
Pre-
intervention
Normal 892 (74.0%) 19 (1.6%) 6 (0.5%) 917 (76.0%)
Borderline 124 (10.3%) 18 (1.5%) 6 (0.5%) 148 (12.3%)
Caseness 105 (8.7%) 14 (1.2%) 22 (1.8%) 141 (11.7%)
Total 1,121 (93.0%) 51 (4.2%) 34 (2.8%) 1,206 (100%)
Table 24: HADS depression status at pre- and post-intervention for those who were absent
at entry
Post-intervention
Total Normal Borderline Caseness
Pre-
intervention
Normal 208 (42.4%) 9 (1.8%) 7 (1.4%) 224 (45.7%)
Borderline 87 (17.8%) 9 (1.8%) 5 (1.0%) 101 (20.6%)
Caseness 104 (21.2%) 21 (4.3%) 40 (8.2%) 165 (33.7%)
Total 399 (81.4%) 39 (8.0%) 52 (10.6%) 490 (100%)
Altogether, 1,226 cases (72%) improved their HADS Depression scores, with an average
change of 4.9. As with the HADS Anxiety scores, the change was more marked for the MH
cases (85% improved, with an average improvement of 7.0 points, N=400) than the MSK
cases (68% improved, with an average change of 4.0, N=1,203). Altogether, 10% of MH
cases had a worse score, with an average of 3.0; while 15% of MSK cases had a worse
score, with an average of 2.5. The score was unchanged for 5% of MH cases and 16% of
MSK cases.
Of those who were off sick at entry, 79% improved their HADS Depression scores by an
average of 6.1 points; 11% had a worse score (average of 3.4) while 10% had the same
score (N=490). For those at work at entry, 69% improved their score by an average of 4.3
points; 15% had a worse score (average of 2.5 points) while 15% had the same score
(N=1,206).

51
Evaluation of WHSS, 2010-14
4.6.7 Change in COPM scores
COPM Performance and Satisfaction scores range from 0 to 10; a higher score represents
better performance, and better satisfaction with performance. COPM scores are
considered for those for whom EQ-5D scores are available at entry and discharge.
Altogether, 89% of cases improved their COPM Performance score (N=3,771), with the
average change score being 4.2 (statistically significant). Only 3% had a worse COPM
Performance score (average of 1.7). The improvements were similar for both MSK and MH
cases: 89% of MSK cases (N=3,182) improved their score by an average of 4.2, and 93%
of MH cases (N=457) improved their score by an average of 4.3 (see Figure 30). The
mean score at entry changed from 3.9 to 7.6 at discharge for MSK cases, while from 3.3 to
7.3 for MH cases.
Figure 30: Change in COPM Performance scores shown for MSK and MH cases
The percentage that improved was also similar when comparing those who were at work
at entry (89%, N=2,843) with those who were absent (90%, N=928), see Figure 31.
However the size of the change of score was greater for those who were absent at entry,
being an average of 5.0, compared with 3.9 for those who were at work at entry. The entry
scores were lower for those who were absent at entry (2.8) and were 7.3 at discharge,
while the entry scores were higher for those who were at work at entry (4.2) and were also
slightly higher at discharge (7.6).
3.1% 7.6%
89.3%
1.3% 6.1%
92.6%
-1.8
4.2
-1.1
4.3
-20
0
20
40
60
80
100
Worse Same Better Worse Same Better
MSK (N=3,182) MH (N=457)
% of cases Average change in score

52
Evaluation of WHSS, 2010-14
Figure 31: Change in COPM Performance scores shown for those at work / absent at entry
Similarly, 90% of cases improved their COPM Satisfaction score (N=3,754), with the
average change in scores being 5.1 (statistically significant). Only 3% had a worse COMP
Satisfaction score (average 1.6). Again the improvements were similar for both MSK and
MH cases: 90% of MSK cases (N=3,166) improved by an average of 5.2, and 94% of MH
cases (N=457) improved by an average of 5.0 (Figure 32). The mean score at entry
changed from 2.9 to 7.5 at discharge for MSK cases, while from 2.5 to 7.2 for MH cases.
Figure 32: Change in COPM Satisfaction scores shown for MSK and MH cases
3.2% 7.8%
89.1%
2.7% 7.8%
89.5%
-1.8
3.9
-1.6
5.0
-20
0
20
40
60
80
100
Worse Same Better Worse Same Better
At work at entry (N=2,843) Absent at entry (N=928)
% of cases Average change in score
2.6% 7.5%
90.0%
0.9% 5.0%
94.1%
-1.5
5.2
-1.6
5.0
-20
0
20
40
60
80
100
Worse Same Better Worse Same Better
MSK (N=3,166) MH (N=457)
% of cases Average change in score

53
Evaluation of WHSS, 2010-14
The percentage that improved was also similar when comparing those who were at work
at entry (90%, N=2,829) with those who were absent (90%, N=925), see Figure 33. The
size of the change of score was also similar for those who were absent at entry (an
average of 5.6) and those who were at work (average of 5.0).
Figure 33: Change in COPM Satisfaction scores shown for those at work / absent at entry
4.6.8 Significant factors in the change in health measures
Multivariate analysis for change in health measures suggests that age is important and
that younger cases had a greater improvement in their health measure scores (EQ-5D
index, HADS and COPM). Also, those cases with poorer health scores at entry, had a
greater improvement in their health score.
The change in EQ-5D index score from entry to discharge is generally higher by 10% for
men compared to women. Although both entry and discharge HADS scores are worse for
MH cases than MSK cases, it is not surprising that MH cases improve their scores more
during the intervention compared to the MSK cases. The change in COPM Satisfaction
score is significantly different by Health Board area. The COPM satisfaction scores
improved most in Dundee & Tayside, while the smallest changes were in Highland and
Dumfries & Galloway. It is not clear whether this is due to improvements in cases‟ health
or clinical variations.
4.7 Changes in medication
On discharge, cases reported whether they were still on the same medication they were
taking for their primary health condition. For those who reported whether they were taking
medication at both entry and discharge (N=4,942), 25% were not taking medication at
either entry or discharge, while 22% were on the same medication as when they entered
the programme. However, a third (33%) who had been taking medication at entry were not
2.3% 7.4%
90.3%
3.0% 7.4%
89.6%
-1.6
5.0
-1.6
5.6
-20
0
20
40
60
80
100
Worse Same Better Worse Same Better
At work at entry (N=2,829) Absent at entry (N=925)
% of cases Average change in score
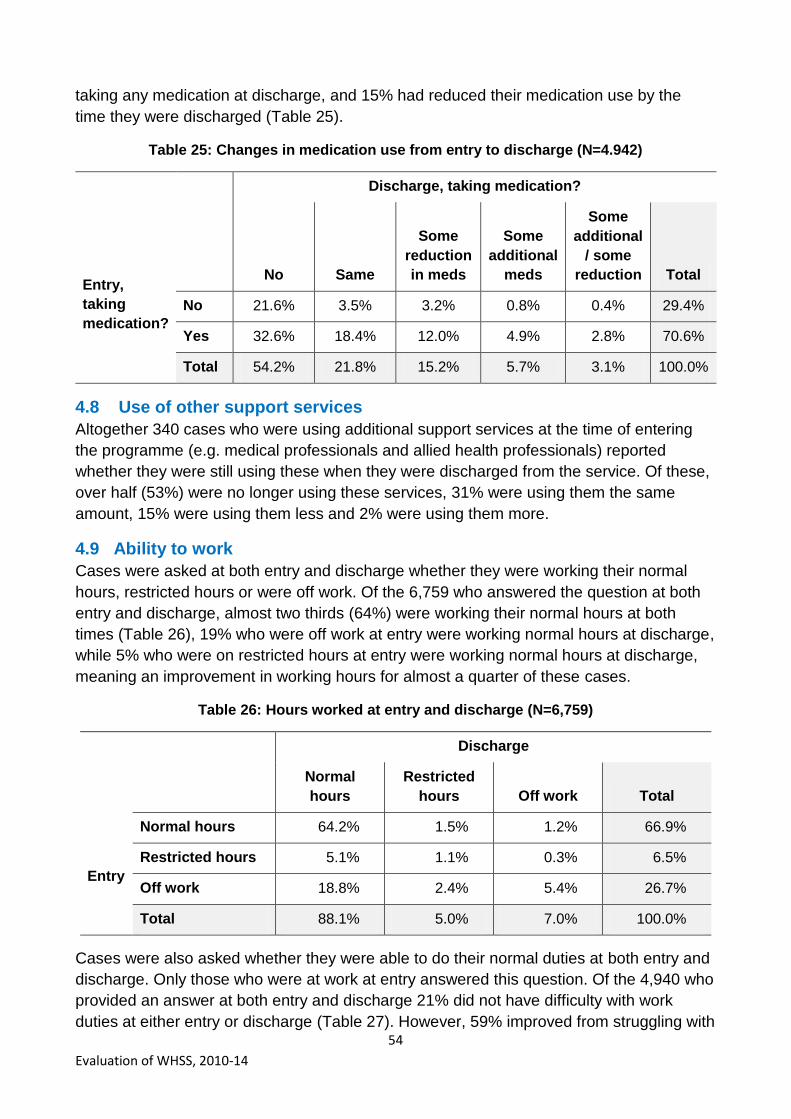
54
Evaluation of WHSS, 2010-14
taking any medication at discharge, and 15% had reduced their medication use by the
time they were discharged (Table 25).
Table 25: Changes in medication use from entry to discharge (N=4.942)
Entry,
taking
medication?
Discharge, taking medication?
No Same
Some
reduction
in meds
Some
additional
meds
Some
additional
/ some
reduction Total
No 21.6% 3.5% 3.2% 0.8% 0.4% 29.4%
Yes 32.6% 18.4% 12.0% 4.9% 2.8% 70.6%
Total 54.2% 21.8% 15.2% 5.7% 3.1% 100.0%
4.8 Use of other support services
Altogether 340 cases who were using additional support services at the time of entering
the programme (e.g. medical professionals and allied health professionals) reported
whether they were still using these when they were discharged from the service. Of these,
over half (53%) were no longer using these services, 31% were using them the same
amount, 15% were using them less and 2% were using them more.
4.9 Ability to work
Cases were asked at both entry and discharge whether they were working their normal
hours, restricted hours or were off work. Of the 6,759 who answered the question at both
entry and discharge, almost two thirds (64%) were working their normal hours at both
times (Table 26), 19% who were off work at entry were working normal hours at discharge,
while 5% who were on restricted hours at entry were working normal hours at discharge,
meaning an improvement in working hours for almost a quarter of these cases.
Table 26: Hours worked at entry and discharge (N=6,759)
Discharge
Normal
hours
Restricted
hours Off work Total
Entry
Normal hours 64.2% 1.5% 1.2% 66.9%
Restricted hours 5.1% 1.1% 0.3% 6.5%
Off work 18.8% 2.4% 5.4% 26.7%
Total 88.1% 5.0% 7.0% 100.0%
Cases were also asked whether they were able to do their normal duties at both entry and
discharge. Only those who were at work at entry answered this question. Of the 4,940 who
provided an answer at both entry and discharge 21% did not have difficulty with work
duties at either entry or discharge (Table 27). However, 59% improved from struggling with

55
Evaluation of WHSS, 2010-14
their normal duties to doing their normal duties without difficulty. Furthermore, 4% also
improved from not able to do their normal duties to being able to do them without difficult
at discharge.
Table 27: Ability to perform work duties (N=4,940)
Discharge
Normal
duties, no
difficulty
Normal
duties, but
struggling
Not able to
do normal
duties Total
Entry
Normal duties, no
difficulty 20.8% 1.9% 0.2% 22.8%
Normal duties, but
struggling 58.7% 12.4% 0.6% 71.7%
Not able to do normal
duties 3.8% 1.4% 0.2% 5.5%
Total 83.3% 15.7% 1.0% 100.0%
4.10 Prediction of ability to do job in 6 months’ time
Cases were asked at entry and discharge whether, considering their health, they thought
they would be able to do their job in 6 months‟ time. Altogether 5,969 provided an answer
at both entry and discharge (Table 28). Two thirds of cases (66%) thought they would be
able to do their job in 6 months‟ time, both at entry and discharge. A fifth (20%) changed
from being unsure at entry (17%) or thinking they could not (3%) to thinking they could
when they were discharged from the programme. There were 4% who at entry thought
they could do their job in 6 months‟ time, but were unsure at discharge.
Table 28: Prediction of ability to do job in 6 months’ time
Entry
Discharge
Yes Don't know No Total
Yes 65.7% 4.0% 1.0% 70.7%
Don't know 17.3% 7.1% 1.2% 25.6%
No 2.5% 0.7% 0.5% 3.7%
Total 85.5% 11.9% 2.6% 100.0%

56
Evaluation of WHSS, 2010-14
4.11 Impact of the service after discharge
4.11.1 EQ-5D index
Altogether 2,033 cases provided EQ-5D data 3 months, 6 months, or both 3 and 6 months
after discharge. The mean EQ-5D index scores were calculated for these cases at the
different time points, and are shown in Figure 34, with those who completed the EQ-5D at
all 4 points (blue), at entry, discharge and 3 months post discharge (green), and at entry,
discharge and 6 months post discharge (yellow). The dates of completion of the follow-up
questionnaires were not available, but it is assumed that they were approximately 3 and 6
months following discharge.
These figures show that the improvement in mean EQ-5D index score from entry to
discharge was maintained at 3 and 6 months.
Figure 34: EQ-5D Index score for entry, discharge, 3 and 6 months post discharge
4.11.2 VAS score
A similar pattern was seen when considering the visual analogue scale scores of overall
health (where a score of 100 represents the best health imaginable) as shown in Figure
35. The improvement in health appears to be largely maintained 3 and 6 months following
discharge from the programme.
0.55 0.85 0.86 0.88 0.53 0.80 0.79 0.51 0.78 0.77 0.0
0.1
0.2
0.3
0.4
0.5
0.6
0.7
0.8
0.9
1.0
1.1
Entry Discharge 3 month follow-up 6 month follow-up
Entry, Discharge, 3m, 6m (N=1,250)
Entry, Discharge, 3m (N=498)
Entry, Discharge, 6m (N=285)

57
Evaluation of WHSS, 2010-14
Figure 35: VAS scores at entry, discharge, 3 months and 6 months post discharge
4.11.3 Ability to work normal hours
Altogether, 1,959 cases answered a question about their ability to work their normal hours
at entry, discharge and 3 and / or 6 months post-discharge. Where a response was
received both at 3 and 6 months post-discharge, the 6 month response was taken, as a
better indication of the durability of the impact of the service. Thus a case‟s ability to work
normal hours is available at 3 time points (entry, discharge and post discharge), and can
be classed as „work‟ (working normal hours), „restricted‟ (working restricted hours) and „off‟
(off work). Figure 36 shows the proportion of respondents falling into the different
categories of work ability at the three time points.
Almost two thirds of cases (65%) were working their normal hours at all three time points,
while a further 23% who were off work or restricted at entry had returned to normal
working hours at discharge and remained working normal hours at follow up.
Of the 1,794 who were working normal hours at discharge, 96.1% were still working
normal hours at follow up; 3.1% were working restricted hours, while 0.8% were off sick at
follow up. It appears that the vast majority have been able to maintain their normal working
hours after leaving the programme.
58.4 82.5 85.2 87.3 59.0 79.4 77.9 62.2 80.1 77.2 0
20
40
60
80
100
120
Entry Discharge 3 month follow-up 6 month follow-up
Entry, Discharge, 3m, 6m (N=1,250)
Entry, Discharge, 3m (N=498)
Entry, Discharge, 6m (N=285)

58
Evaluation of WHSS, 2010-14
Figure 36: Ability to work normal hours at entry, discharge and follow-up (N=1,959)
4.12 Qualitative feedback on the service
Discharged cases‟ views of the service are shown in Table 29. Over 98% of cases made a
positive comment about all dimensions relating to the service delivery (questions 1-8).
Over 99% reported it as a good or excellent experience and good or excellent in terms of
its helpfulness; and 99% would recommend the service to others and would use it again.
The last three questions (9-11) related to the impact of the service on the cases‟ ability to
remain in work or return to work. Altogether 93% agreed with the statement „This
programme has had a positive impact on my current work situation” (question 9).
When asked „Do you think the service had helped you to stay in work or be closer to
getting back to work?‟ 87% replied yes, while 8% were unsure (question 10). There were
just 5% who answered no, implying that the service was seen as beneficial in helping to
maintain the ability to work by the majority of cases.
A second, similar question was also asked (question 11): „Do you feel the service helped
you to return to work more quickly than if you had not had the support of the service?‟.
Unfortunately, neither a „not applicable‟ nor „don‟t know‟ option were not offered for this
question. However, no answer was provided by more than 2,000 cases who had answered
the rest of the feedback questions, implying that the question was not relevant for them. Of
those who did answer this question, 605 cases provided a comment that they had not
been off sick, so their responses were excluded from the analysis. Of the remaining cases
who answered this question (3,042), 85% thought the service helped them to return to
work more quickly than if they had not had the support of the service, which is a very
similar proportion to the responses to question 10.
64.6%
18.3%
5.1%
2.1%
1.7% 1.1%
1.0%
6.1% Work, Work, Work (64.6%)
Off, Work, Work (18.3%)
Restricted, Work, Work (5.1%)
Off, Restricted, Work (2.1%)
Off, Off, Work (1.7%)
Work, Work, Restricted (1.1%)
Off, Work, Restricted (1.0%)
Other (6.1%)

59
Evaluation of WHSS, 2010-14
Table 29: Subjective feedback on service provision
Question Positive
response % N
1. How would you rate your overall experience of the service?
Good or excellent
99.4% 5,708
2. How helpful was the support you received? Good or excellent
99.4% 5,700
3. How involved did you feel throughout the entire process?
Good or excellent
99.3% 5,649
4. How would you rate the treatment you have received?
Good or excellent
98.6% 5,597
5. How would you rate the venue you were seen in?
Good or excellent
98.3% 5,567
6. How would you rate the speed and delivery of this service?
Good or excellent
98.6% 5,665
7. I would recommend this service to others Agree 99.0% 5,599
8. I would use this service again Agree 98.7% 5,638
9. This programme has had a positive impact on my current work situation
Agree 93.4% 5,540
10. Do you think the service has helped you to stay in work or be closer to getting back to work?
Yes
Don‟t know
86.5%
8.1% 5,303
11. Do you feel the service helped you to return to work more quickly than if you had not had the support of the service?
Yes 84.6% 3,042

60
Evaluation of WHSS, 2010-14
5 Discussion
5.1 Representativeness of the cases
Cases broadly represented the demographics of workers in Scotland in terms of gender.
The service supported a greater proportion of older workers (>50 years) than is reflected in
the Scottish employment statistics, as might be expected due to increased health needs of
older people. This is important given that these workers are at the greatest risk of falling
out of employment, and have greater need for such services in light of strategies and
policies which are aimed at extending working lives.
While the distribution of SIMD of employees in SMEs in Scotland is not known it is
possible that there was slightly higher uptake of the service by those in the less deprived
SIMD categories, which may indicate some inequality in uptake, but generally there was
reasonable distribution of SIMD categories among the cases.
Data from the HSE shows that work related MSK conditions account for 44% of all cases
(prevalence) of work related illness; while work related stress accounts for 35% of all work
related ill health cases (HSE, 2015a and 2015b). This implies that there is a need for
services that support those with MSK and mental health conditions which affect their ability
to work. The majority of cases in WHSS had an MSK condition (84%), implying that a
significant proportion of the workforce which has a mental health condition affecting their
work ability did not access this service. Ways of addressing this should be considered in
any future similar programmes. It should be noted that the health improvements and return
to work outcomes for the mental health cases were generally better than for the MSK
cases, although they generally entered the programme with worse health scores and
longer absence durations prior to entry.
The majority of cases were from relatively small companies (2-50 employees, 56%) or the
self-employed (20%) who would be unlikely to have any occupational health provision. The
service therefore appears to fill a gap in service provision.
5.2 Differences in delivery in Board areas
The design of WHSS allowed for flexibility in how Boards provided the standardised
intervention with some providing services in-house, some using externally provided
interventions and / or the NHS, and others used a mixed model. There are clear
differences between the Board areas both in service delivery and in completion of the
paperwork. The most obvious differences relate to the timely and full completion of the
discharge paperwork. The reasons for low completion of the discharge paperwork may be
due to a focus on recruiting cases to the programme rather than completing the discharge
paperwork, or resources.
In terms of the differences in service delivery, large variations are observed in the number
and duration of treatments provided, outcomes, and utilisation of some interventions e.g.
Occupational Therapy which generally was minimal. No comment can be made about the
appropriateness of this as a clinical audit was not part of this evaluation.
61
Evaluation of WHSS, 2010-14
These differences need to be considered when planning any new national programme for
which there needs to be clear quality standards, a uniform approach and more consistency
and equity in provision of service, and completion of discharge paperwork. Any future
programmes should be subject to audit and quality assurance checks.
5.3 Duration in the programme
Most cases (75%) had their entry assessment within a week of their enrolment, with an
average time between the enrolment and entry assessment being 5.2 days; this was
shorter for those absent at entry (4.4 days) than those at work (5.5 days), implying that
delays may relate to ability to access the client.
The time from the entry assessment to discharge was an average of 121 days, and, most
cases (83%) were discharged within 6 months of their entry assessment. This is thought to
be acceptable for the service.
5.4 Absence related to health condition
Health and Safety Executive (HSE) statistics on working days lost due to work related ill
health show that on average 17 working days are lost per worker who reports a work
related MSK (HSE, 2015a). The average number of working days lost per worker who
reports work related stress is 23 days (HSE, 2015b). This is the number of days lost per
case i.e. including those who do not have any sickness absence related to their health
condition.
The data available on sickness absence in WHSS do not allow a direct comparison with
the HSE data, due to the absence data for a case not being collected over a year.
However, for those who were absent at entry (both MSK and MH cases) an average of
28.2 working days were lost while in the programme (being 22.5 for MSK cases and 44.0
days for MH cases). Note that this is only for those who report absence; an average
absence duration for all cases within the programme (including those who are not absent)
would be more closely comparable with the HSE data.
5.5 Health improvements
All health measures show a significant improvement from entry to discharge, indicating
significant improvements in cases‟ health. The extent of the positive change in EQ-5D is
striking from a health economic perspective, and although there is no control group, it
cannot be ruled out that the WHSS intervention has contributed to this health benefit.
The Canadian Occupational Performance Measure (COPM) scores also significantly
improved in 90% of cases, which provides evidence of a positive impact on functional
capacity and coping.
Part of the case management process of WHSS was to identify co-morbidity which was
present in 25% of cases presenting with a mental health condition and 15% of cases with
presenting with an MSK condition. In usual NHS care these secondary conditions may be
unlikely to be recognised and, if so, treated. The fact that this was identified in WHSS will
have helped case managers providing more holistic care.

62
Evaluation of WHSS, 2010-14
This is evident in the HADS scores of individuals with MSK conditions where there was a
23% reduction of anxiety levels and a 17% reduction in depression symptoms confirming
the levels of pre-existing, generally non-caseness morbidity which is not always
recognised in routine care but is likely to influence clinical and functional outcomes.
An important finding was the relationship between age and duration of sickness absence,
with there being on average an additional 5 days of absence while in the programme for
every 10 years of age. It is well recognised that older workers tend to have longer periods
off work, although generally have fewer episodes of absence, but this finding indicates the
need for improved occupational health and NHS care of older workers including
programmes to maintain their functional capacity.
Cases using WHSS reported reduced medication use and use of other support services at
discharge from the programme. Without a control group it is not possible to say that this
was due to the programme, but the evidence is encouraging.
The follow-up questionnaires provide evidence of the durability of the health improvements
seen at discharge, and of clients remaining in work after leaving the programme.
5.6 Limitations of the study
5.6.1 Control group
The main limitation in the evaluation is that, despite efforts to identify a suitable control
population, no control group was available to allow the relative benefits of this programme
to be evaluated. It was not possible to design the service to establish a control group, as it
was not ethical to withhold services from clients with a need. However, for future
evaluation of a similar intervention it will be possible to use these results for comparison
purposes.
Even without a control group the indications are that those within the service have
benefited from it, although it is not possible to say what the health and employment
outcomes would have been for these clients without this service.
5.6.2 Data recording
Discharge data are available for 52% of those who enrolled in the service; it is known that
12.7% did not complete the entry assessment as they could not be contacted or were not
eligible. A further 35.1% did not complete the discharge paperwork, mainly because they
could not be contacted by the service or voluntarily withdrew from it. Reasonable
confidence can be placed on the representativeness of the discharge data as it is a
relatively complete set of those who finished the programme. However, the paperwork was
not fully completed in some cases, and future programmes should seek to ensure that
data collection is recorded as completely as possible.

63
Evaluation of WHSS, 2010-14
6 Conclusions and recommendations
6.1 Conclusions
Over 13,000 cases contacted the service over a 4 year period, with 11,748 actually
entering the programme. Cases are broadly thought to represent the demographics of
workers in Scotland, although there are a greater proportion of older workers (>50) than in
the working population. The number of cases managed in Board areas ranged from over
3,500 in Lanarkshire (although this included some cases from other Board areas) to 52 in
Highland.
The findings of the evaluation indicate that the programme has had a positive benefit for
cases, with all health measures showing a significant improvement and the qualitative
feedback being very positive. Of the sample where data are available, 75% of cases were
at work at entry and remained at work throughout the programme, while 18% (1,188) were
absent at entry and had returned to work by the time they were discharged. At discharge,
85% thought that the service had helped them remain in work or return to work more
quickly than if they had not had the service.
The analysis related to duration of sickness absence showed that older cases and cases
with a mental health condition took longer to return to work. The cases that had been on
sick leave for a longer time prior to entering the programme also took longer to return to
work during the intervention.
The improvements in health and ability to work appear to be sustained at least 6 months
after discharge from the programme.
6.2 Recommendations
The following recommendations are made for any future national service delivery with
similar aims:
1. The continuance of an early intervention case managed service for individuals
struggling at work or off work due to a health condition is supported by the results of
this evaluation.
2. Seek to recruit a greater number of cases with mental health conditions into the
service.
3. Encourage early access to the service, as there is evidence that those with shorter
periods of absence before contacting the service returned to work more quickly.
4. Monitor the number of therapeutic sessions being provided, and refer those
receiving a higher number to other support services.
5. Reduce variability in the service delivery model between Board areas to ensure
equity of evidence based provision across Scotland.
6. Establish quality standards for the intervention process, which are subject to audit
to ensure consistency of service delivery.

64
Evaluation of WHSS, 2010-14
7. Ensuring timely discharge from the service and completion of the full discharge
paperwork would allow the effect of any programme to be better evaluated.
8. Consider phased introduction of a service, which would allow for observing a control
population receiving usual care.
9. Any new service would benefit from continuous quality improvement processes in
place so that improvements in efficiency and effectiveness are introduced on an
ongoing basis.

65
Evaluation of WHSS, 2010-14
References
Hanson M, Wu O and Smith J (2011) Working Health Services: Evaluation of the projects
delivered in the Borders, Dundee and Lothian. NHS Health Scotland.
HSE (2015a) Work-related Musculoskeletal Disorder (WRMSDs) Statistics, Great Britain,
2015. http://www.hse.gov.uk/statistics/causdis/musculoskeletal/msd.pdf
HSE (2015b) Work related Stress, Anxiety and Depression Statistics in Great Britain 2015.
http://www.hse.gov.uk/statistics/causdis/stress/stress.pdf
Naessens JM, Stroebel RJ, Finnie DM, Shah ND, Wagie AE, Litchy WJ, Killinger PJF,
O‟Byrne TJD, Wood DL, and Nesse RE (2011) Effect of Multiple Chronic Conditions
Among Working-Age Adults. Am J Manag Care. 2011;17(2):118-122.
Office for National Statistics (SOC codes) http://www.ons.gov.uk/ons/guide-
method/classifications/current-standard-classifications/soc2010/index.html
Scottish Government (2012) Sottish Index of Multiple Deprivation 2012.
http://22fa0f74501b902c9f11-
8b3fbddfa1e1fab453a8e75cb14f3396.r26.cf3.rackcdn.com/simd_448749_v7_20121217.p
df
Scottish Government (2014) Local Authority Tables
http://www.gov.scot/Topics/Statistics/Browse/Labour-Market/Local-Authority-Tables

© Crown copyright 2016
ISBN: 978-1-78652-251-1
This document is also available on The Scottish Government website:www.gov.scot
Produced for The Scottish Government by APS Group Scotland, 21 Tennant Street, Edinburgh EH6 5NA
PPDAS72104 (06/16)
w w w . g o v . s c o t