evaluationofhaemodynamicchangesofproximalarterialocclusion ... · spectrum of proximal arterial...
TRANSCRIPT
WIMJ Open 2015; 2 (2): 77
INTRODUCTIONLower limb extremity arterial occlusive disease is a majorhealth problem in developed and developing countries, wherelifestyle factors such as smoking (1) and drinking (2) canaccelerate the progression of the disease. Lower extremityarterial occlusive disease, which mainly affects those agedabove 50 years, has become a common peripheral vasculardisease with high morbidity in patients with high bloodpressure (3), high cholesterol (4, 5) and diabetes (6).
For a long time, arterial X-ray digital subtractionangiography (DSA) has been the gold standard for peripheralarterial occlusive disease diagnosis, but DSA has the dis-advantages of being invasive and expensive (7), which limitsits clinical application. With the development of colourDoppler ultrasound, colour Doppler diagnosis for lowerextremity arterial disease has become mainstream (8, 9). Inrecent years, many scholars have conducted research on theoccluded artery spectrum, which is mostly about the distal
segment of occlusion (10). There is little research on thespectrum of proximal arterial occlusion. We used spectrumDoppler ultrasonography to evaluate the haemodynamicchanges of an artery proximal to an occlusion to observe thechanges of spectrum waveform shapes, in order to provide anew reference of lower limb arterial occlusion disease.
SUBJECTS AND METHODSThirty-four patients with lower limb arterial occlusiondisease were enrolled in this study that took place in theChina-Japan Union Hospital of Jilin University from January2012 to January 2013. There were 39 diseased lower limbs.The occlusion sections were located in the superficialfemoral artery and/or popliteal artery, and there was no signi-ficant stenosis proximal to the point of occlusion. In the 34patients, there were 28 males and six females, age range 44–78 years old. They were all diagnosed with lower limb occlu-sive artery disease by computed tomography angiography(CTA). The control group consisted of 10 males and ninefemales who did not smoke, did not have lower limbarteriosclerosis, vascular malformation, stenosis, or arterialexpansion. Blood pressure, blood glucose and lipid levelswere in the normal range. This study was conducted inaccordance with the Declaration of Helsinki and was
Evaluation of Haemodynamic Changes of Proximal Arterial Occlusion in the LowerExtremities by Spectrum Doppler Ultrasonography
Z Wang, W Shi, J Zhou, G Sui, H Wang
ABSTRACT
Objective: The objective is to analyse the changes of haemodynamic and Doppler ultrasonographyspectrum in the proximal arterial occlusion of lower extremities, and to explore the value of spectrumDoppler ultrasonography in the diagnosis of lower extremity arterial occlusive disease.Methods: Thirty-four patients (thirty-nine occlusion arteries) were examined with two-dimensionalultrasound combined with colour Doppler flow imaging (CDFI), and the results were compared.Result: The waveform shape in the artery proximal to the occlusion shows that blood flow velocitybecomes slower, and diastolic reverse wave slowly disappears. Systolic waveform records a steepupstroke, a slow downstroke and a shoulder on the downstroke. The appearance of the shoulder on thedownstroke is earlier than the diastolic upward wave. The differences of peak systolic velocity,acceleration time, deceleration time, systolic acceleration, deceleration, diastolic reverse flow velocity,systolic acceleration time/systolic duration and systolic deceleration time/systolic duration in theproximal occlusion segment compared with the control group are statistically significant (p < 0.05).Conclusion: Artery occlusion can lead to haemodynamic response and spectrum waveform change.Timely discovery of the changes of the spectrum can be of clinical significance in the diagnosis of lowerextremity arterial occlusive disease.
Keywords: Arterial occlusive disease, Doppler spectrum, lower limb extremityWIMJ Open 2015; 2 (2): 77
From: Department of Ultrasonography, China-Japan Union Hospital of JilinUniversity, Changchun 130033, China.
Correspondence: Dr H Wang, Department of Ultrasonography, China-JapanUnion Hospital of Jilin University, No. 126 Xiantai Street, Changchun130033, China. E-mail: [email protected]
DOI: 10.7727/wimjopen.2014.280
ORIGINALARTICLE

78
approved by the Ethics Committee of China-Japan UnionHospital of Jilin University. Written informed consent wasobtained from all participants.
Lower extremity duplex scanningThe device used was an IU22 colour Doppler ultrasonic diag-nostic instrument from Philips (Amsterdam, The Nether-lands). Linear array transducer frequency ranged from 5–12MH, sample volume size was 1–2 mm and the angle ofintonation between the Doppler ultrasound beam and bloodflow was in the lower 60° angle.
The patient should be relaxed and lying in a supineposition with the lower limb fully exposed, the leg rotatedoutward and the knee gently flexed. The femoral artery fromthe level of the groin, the superficial femoral artery, and thenthe profunda femoris artery were scanned. The poplitealartery, with the patient in a prone position, as well as theanterior tibial artery, posterior tibial artery, and the dorsalispedis artery, while the patient sat with the knee flexed, werealso scanned. The transducer was moved along the bloodvessel, from a proximal to a distal position. We used both thetransverse section and longitudinal section to compare andcontrast the scans.
Statistical analysisThe experimental data are presented as a mean ± standarddeviation. Data were analysed using the T test with theStatistical Package for Social Sciences (SPSS). Statisticalsignificance was established with p < 0.05.
RESULTSProximal waveform changes due to artery occlusionWaveform shapes are obvious when the proximal artery isoccluded (11). Blood flow velocity becomes significantlyslower and diastolic reverse waves become slower or mono-phasic. A disordered waveform shape has a spectral windowthat becomes smaller or disappears, spectral broadening, asystolic upward steep slope and a shortened accelerationtime. Furthermore, the acceleration increases, the systolicdownward slope flattens, there is a characteristic shoulder onthe systolic downward slope, the deceleration time extendsand deceleration becomes smaller. The closer the samplingvolume position is to the occlusion area, the more signifi-cantly the waveform shapes change (12). The characteristicshoulder on the systolic downward slope appears beforedisappearance of the diastolic reverse wave.
The sampling volume was placed at the position of 2cm above the occlusion. The waveform shape was observedand compared to the control group. There were 37 arteriesthat had the systolic peak on the downward slope out of atotal of 39 diseased arteries, which is 94.9%. There were 33arteries that had the diastolic second and third wavedisappear [84.6%, 33/39] (13). All disappearances of thediastolic reverse waves come along with the systolic peak onthe downward slope.
Changes of velocityThe peak systolic velocity (PSV) is 78.5 ± 32.6 cm/s, whichis distinctly low compared with the control group [p < 0.05](14). The diastolic reverse flow velocity (DRV) is 1.7 ± 4.3cm/s, which is evidently low compared with the controlgroup [p < 0.05] (Table 1).
Evaluation of Haemodynamic Changes
Table 1: Peak systolic velocity (PSV) and diastolic reverse flow velocity(DRV) (x ± s) in the same position of the occlusion group andcontrol group
Group n PSV (cm/s) DRV (cm/s)
Occlusion 39 78.5 ± 32.6* 1.7 ± 4.3*
Control 38 112.4 ± 18.5 12.6 ± 2. 2
*p < 0.05, vs the control group
Changes of systolic upstrokeSystolic acceleration time (AT) is 68.3 ± 19.8 ms, which isshorter compared with the control group (p < 0.05). Thesystolic acceleration (AC) is 1752.6 ± 1075.7 cm/s2, which isclearly larger than the control group (p < 0.05). The systolicacceleration time/systolic duration (AT/ST) is 0.23 ± 0.06,which is obviously small compared with the control group [p< 0.05] (Table 2).
Table 2: Acceleration time (AT), systolic acceleration (AC) and systolicacceleration time/systolic duration (AT/ST) (x ± s) in the sameposition of the occlusion group and control group
Group n AT (ms) AC (cm/s2) AT/ST
Occlusion 39 68.3 ± 19.8* 1752.6 ± 1075.7* 0.23 ± 0.06*
Control 38 112.4 ± 18.5 816.2 ± 129.3 0.44 ± 0.05*
*p < 0.05, vs the control group
Changes of systolic downstrokeThe deceleration time (DT) is 219.2 ± 24.6 ms, longcompared with the control group (p < 0.05). The deceleration(DC) is 342.3 ± 73.4 cm/s2, which is obviously smaller whencompared with the control group (p < 0.05). The systolicdeceleration time/systolic duration (DT/ST) of 0.77 ± 0.06 islarger compared with the control group [p < 0.01] (Table 3).Table 3: Deceleration time (DT), deceleration (DC) and systolic
deceleration time/systolic duration (DT/ST) (x ± s) in the sameposition of the occlusion group and control group
Group n DT (ms) DC (cm/s2) DT/ST
Occlusion 39 219.2 ± 24.6* 342.3 ± 73.4* 0.77 ± 0.06*
Control 38 140.7 ± 19.9 651.3 ± 168.5 0.56 ± 0.08
*p < 0.05, vs the control group
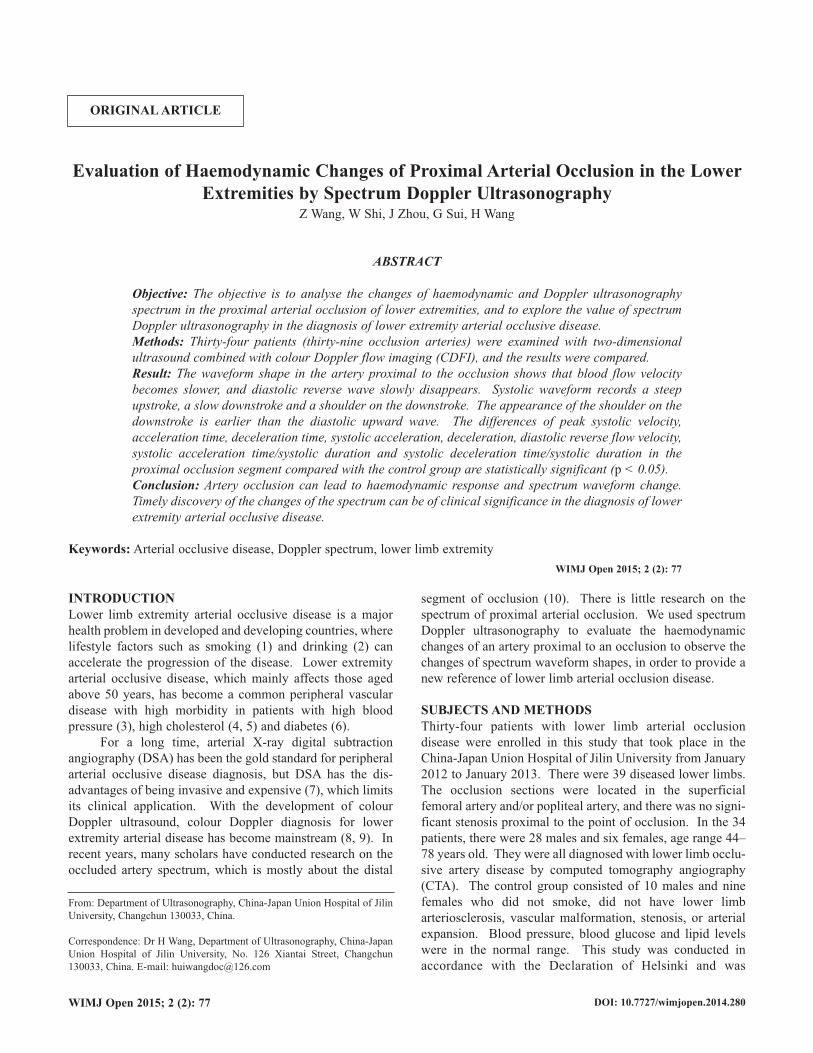
DISCUSSIONThe normal spectral Doppler display recorded from a lowerlimb extremity artery is a triphasic flow pattern with a clearspectral window (Fig. 1). The first phase wave is the sharp
79
would be shortened if no arterial branches existed above theocclusion, where blood returns.
The downstroke shape of the first wave is flat. Thisdownstroke is at the phase of the slow ejection period of thecardiac cycle. The resistance is as large as the distal occlu-sion, which can offset the part of the cardiac systolic bloodpressure. Blood potential energy in the blood vessels fallsslowly, so the downstroke shape of the first wave is flat. Theresult is distinctly different compared to the control group (p< 0.05).
On the spectrum, the diastolic reverse flow velocity measured at the peak of the early diastolic reverse wave can reflect the vessel compliance. Diastolic reverse flow velocity is relevant to the bed resistance of distal blood vessels. Vascular bed resistance increases, and elastic retraction forces decrease when lower limb extremity arteries are occluded. This leads to DRV slow down or disappearance (18) [Fig. 3].
Wang et al
Fig. 1: A normal triphasic waveform.
forward wave, which is caused by the positive blood flow ofthe cardiac systolic ejection. This is characterized by rapidrise and fall strokes. The second phase consists of a reversewave, which is caused by an early diastolic aortic valveclosure and a peripheral vascular elasticity retraction. Thethird phase wave is caused by arterial elasticity leading to theretraction of blood flow to the distal limb again in latediastole. The presence of normal triphasic flow is an indi-cator that the lower segment of the artery before the largebranches has not been occluded or severely stenosed (15).
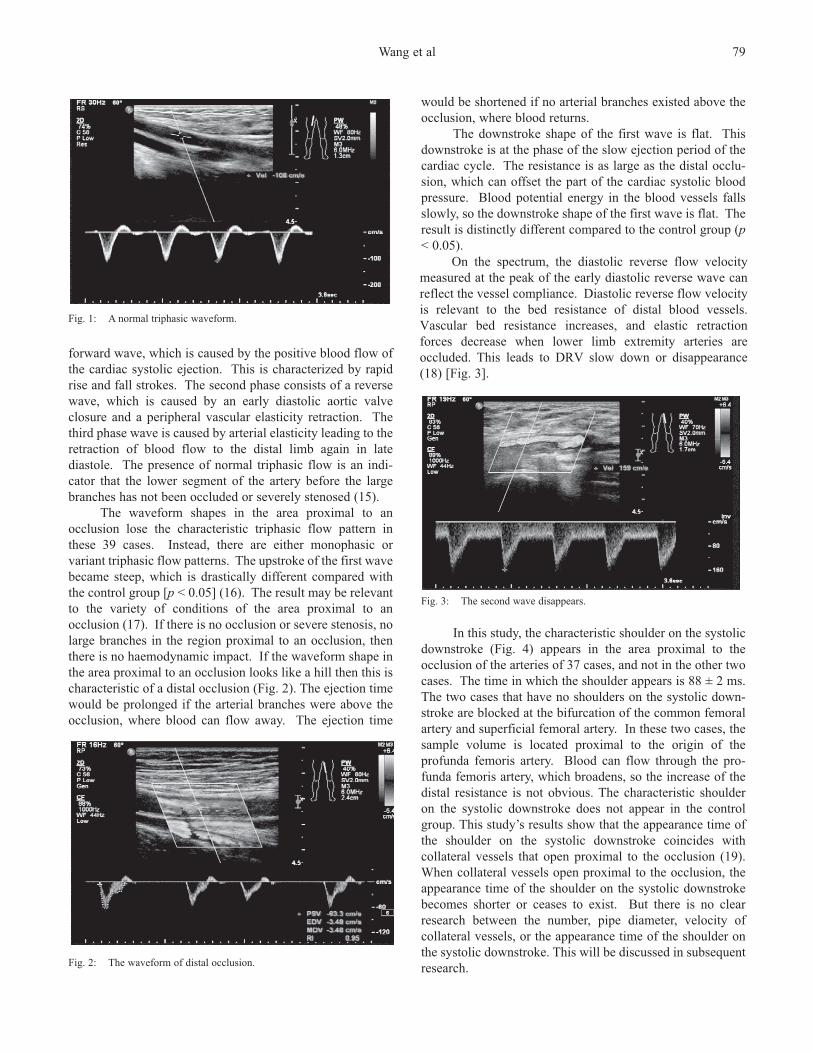
The waveform shapes in the area proximal to anocclusion lose the characteristic triphasic flow pattern inthese 39 cases. Instead, there are either monophasic orvariant triphasic flow patterns. The upstroke of the first wavebecame steep, which is drastically different compared withthe control group [p < 0.05] (16). The result may be relevantto the variety of conditions of the area proximal to anocclusion (17). If there is no occlusion or severe stenosis, nolarge branches in the region proximal to an occlusion, thenthere is no haemodynamic impact. If the waveform shape inthe area proximal to an occlusion looks like a hill then this ischaracteristic of a distal occlusion (Fig. 2). The ejection timewould be prolonged if the arterial branches were above theocclusion, where blood can flow away. The ejection time
Fig. 2: The waveform of distal occlusion.
Fig. 3: The second wave disappears.
In this study, the characteristic shoulder on the systolicdownstroke (Fig. 4) appears in the area proximal to theocclusion of the arteries of 37 cases, and not in the other twocases. The time in which the shoulder appears is 88 ± 2 ms.The two cases that have no shoulders on the systolic down-stroke are blocked at the bifurcation of the common femoralartery and superficial femoral artery. In these two cases, thesample volume is located proximal to the origin of theprofunda femoris artery. Blood can flow through the pro-funda femoris artery, which broadens, so the increase of thedistal resistance is not obvious. The characteristic shoulderon the systolic downstroke does not appear in the controlgroup. This study’s results show that the appearance time ofthe shoulder on the systolic downstroke coincides withcollateral vessels that open proximal to the occlusion (19).When collateral vessels open proximal to the occlusion, theappearance time of the shoulder on the systolic downstrokebecomes shorter or ceases to exist. But there is no clearresearch between the number, pipe diameter, velocity ofcollateral vessels, or the appearance time of the shoulder onthe systolic downstroke. This will be discussed in subsequentresearch.

80
At the same time, we found that the rate of the charac-teristic shoulder appearance on the systolic downstroke is94.9%; the rate of the second and the third wave’s dis-appearance is 84.6%. When observing the waveform shapefrom the upper to the lower area proximal to the occlusion ofthe artery, the shoulder appears before the second wavedisappears. Through the multi-point measurement proximalto the occlusion, we found that the changes of the waveformshape are gradual. In our opinion, the characteristic shoulderon the systolic downstroke suggesting distal disease is moresensitive than the disappearance of the second wave.
The occlusion segment that is located in the blind scanarea, a deep location, or covered with dressing, cannot bedetected easily. We can suspect the distal artery through theproximal waveform shape, which makes up for the limitationof 2D and colour Doppler ultrasound, and which improvesthe diagnostic rate. Through quantitative analysis ofwaveform shape proximal to an occlusion, and the obser-vation of haemodynamic changes, a new reference to clinicaldiagnosis can be made (20).
CONFLICT OF INTERESTAll authors have no conflict of interest regarding this paper.
REFERENCES1. Vicente I, Alves A, Pereira A, Roncon de Albuquerque R. Evaluation of
hemodynamic changes in Buerger’s disease patients. Acta Med Port2012; 25: 156–64.
2. Wakabayashi I, Sotoda Y. Alcohol drinking and peripheral arterialdisease of lower extremity. Nihon Arukoru Yakubutsu Igakkai Zasshi2014; 49: 13–27.
3. He M, Qin X, Cui Y, Cai Y, Sun L, Xu X et al. Prevalence of un-recognized lower extremity peripheral arterial disease and theassociated factors in Chinese hypertensive adults. Am J Cardiol 2012;110: 1692–8.
4. Korneva VA, Kyznetsova TIu, Mandel’shtam MIu, Konstantinov VO,Vasil’ev VB. The clinical manifestations of atherosclerosis in familialhypercholesterolemia. Ter Arkh 2014; 86: 18–22.
5. Shaalan WE, French-Sherry E, Castilla M, Lozanski L, Bassiouny HS.Reliability of common femoral artery hemodynamics in assessing theseverity of aortoiliac inflow disease. J Vasc Surg 2003; 37: 960–9.
6. Yu LB, Shen Y, Li LX, Tu YF, Liu F, Bao YQ et al. Detection rates ofatherosclerosis by carotid versus lower limb ultrasonography in newlydiagnosed type 2 diabetics. Zhonghua Yi Xue Za Zhi 2013; 93: 2143–5.
7. Pomposelli F. Arterial imaging in patients with lower extremityischemia and diabetes mellitus. J Vasc Surg 2010; 52: 81S–91S.
8. Khan SZ, Khan MA, Bradley B, Dayal R, McKinsey JF, Morrissey NJ.Utility of duplex ultrasound in detecting and grading de novofemoropopliteal lesions. J Vasc Surg 2011; 54: 1067–73.
9. Gabriel M, Pawlaczyk K, Szajkowski R, Stefaniak K, DzieciuchowiczL, Krasiński Z. The use of duplex ultrasound arterial mapping (DUAM)and preoperative diagnostics in patients with atherosclerotic ischaemiaof lower extremities. Pol Przegl Chir 2012; 84: 276–84.
10. Sukharev II, Guch AA, Novosad EM, Vlaĭkov GG. Collateralcompensation of blood flow and hemodynamics of the lowerextremities in atheroselerotic occlusion of abdominal aortal. Kiln Khir2001; 12: 14–6.
11. Styczynski G, Szmigielski C, Leszczynski J, Kuch-Wocial A, Szulc M.Abdominal aortic Doppler waveform in patients with aorto-iliacdisease. Eur J Vasc Endovasc Surg 2010; 39: 714–8.
12. Kamran H, Salciccioli L, Prudhvi K, Bastien C, Berman H, Sharma Aet al. Comparison of hyperemic changes in carotid-radial pulse wavevelocity by upper and lower arm cuff occlusion. Angiology 2011; 62:409–14.
13. Tsai CY, Chu SY, Wen YW, Hsu LA, Chen CC, Peng SH et al. Thevalue of Doppler waveform analysis in predicting major lowerextremity amputation among dialysis patients treated for diabetic footulcers. Diabetes Res Clin Pract 2013; 100: 181–8.
14. Okada M, Kitano I, Sugimoto T, Ijiri Y. Functional diagnosis with colorultrasound in occlusion of peripheral arteries. Kongressbd Dtsch GesChir Kongr 2002; 119: 623–6.
15. Legemate DA, Teeuwen C, Hoeneveld H, Ackerstaff RG, EikelboomBC. Spectral analysis criteria in duplex scanning of aortoiliac andfemoropopliteal arterial disease. Ultrasound Med Biol 1991; 17: 769–76.
16. Lee HG, Yum MK. Fourier transformation of arterial Doppler wave-forms of the lower extremity. J Clin Ultrasound 2004; 32: 277–85.
17. Wen XR, Lü XF, Liu CC, Luo Y, Chen DW, Wang C et al. Theultrasound image characteristics of lower extremities arteries in diabeticfoot. Sichuan Da Xue Xue Bao Yi Xue Ban 2012; 43: 739–42.
18. Styczynski G, Szmigielski C, Leszczynski J, Abramczyk P, Kuch-Wocial A, Szulc M. Descending aortic Doppler flow pattern in patientswith proximal peripheral artery disease. Am J Cardiol 2009; 103: 1774–6.
19. Valecchi D, Bacci D, Gulisano M, Conti AA, Sibilio M, Lipoma M etal. Evaluation of the pattern of proximal and distal occlusion andcollateral circulation of lower limb arteries using combined contrastarteriography and color Doppler ecography. Ital J Anat Embryol 2009;114: 121–7.
20. Seige M, Podhaisky H, Hänsgen K. Arterial vascular diagnosis byDoppler pulse curve analysis of the first dorsal metatarsal artery. ZGesamte Inn Med 1993; 48: 484–9.
Received 15 Oct 2014Accepted 24 Oct 2014Published 12 Jun 2015Online: http://www.mona.uwi.edu/wimjopen/article/1632© Wang et al 2015.This is an open access article made freely available under Creative Commons Attribution 4.0 International (CC BY 4.0). Users are free to share, copy and adapt this work as long as the copyright holder (author) is appropriately and correctly credited. See http://creativecommons.org/licences/by/4.0/deed.en_us for more information.
Fig. 4: Characteristic shoulder on the systolic downstroke.
Evaluation of Haemodynamic Changes