evaporation: a new vapour pressure estimation · pdf filesity that a full determination ......
TRANSCRIPT
Atmos. Chem. Phys., 11, 9431–9450, 2011www.atmos-chem-phys.net/11/9431/2011/doi:10.5194/acp-11-9431-2011© Author(s) 2011. CC Attribution 3.0 License.
AtmosphericChemistry
and Physics
EVAPORATION: a new vapour pressure estimationmethodfor organic molecules including non-additivityand intramolecular interactions
S. Compernolle, K. Ceulemans, and J.-F. Muller
Belgian Institute for Space-aeronomy, Ringlaan 3, 1180 Brussels, Belgium
Received: 21 February 2011 – Published in Atmos. Chem. Phys. Discuss.: 29 April 2011Revised: 26 August 2011 – Accepted: 1 September 2011 – Published: 16 September 2011
Abstract. We present EVAPORATION (Estimation ofVApour Pressure of ORganics, Accounting for Tempera-ture, Intramolecular, and Non-additivity effects), a methodto predict (subcooled) liquid pure compound vapour pres-surep0 of organic molecules that requires only molecularstructure as input. The method is applicable to zero-, mono-and polyfunctional molecules. A simple formula to describelog10p
0(T ) is employed, that takes into account both a widetemperature dependence and the non-additivity of functionalgroups. In order to match the recent data on functionaliseddiacids an empirical modification to the method was intro-duced. Contributions due to carbon skeleton, functionalgroups, and intramolecular interaction between groups areincluded. Molecules typically originating from oxidation ofbiogenic molecules are within the scope of this method: alde-hydes, ketones, alcohols, ethers, esters, nitrates, acids, per-oxides, hydroperoxides, peroxy acyl nitrates and peracids.Therefore the method is especially suited to describe com-pounds forming secondary organic aerosol (SOA).
1 Introduction
The (subcooled) liquid pure compound vapour pressurep0 ofa molecule is an important property influencing its distribu-tion between the gas and particulate phase. While the vapourpressure of hydrocarbons and monofunctional molecules fol-lows simple relationships, that of polyfunctional moleculesis more difficult to describe. This is partly because thevapour pressure of such molecules is typically lower andtherefore the experimental error is larger, and partly be-cause there are more complex interactions (inter- and in-tramolecular in the liquid, intramolecular in the gas phase)
Correspondence to:S. Compernolle([email protected])
between the functional groups. The molecules comprisingsecondary organic aerosol (SOA), which is the focus of ourresearch, are typically polyfunctional. These semi- and low-volatility molecules originate from the oxidation of volatileorganic compound (VOC) and they are of such a large diver-sity that a full determination of all species is unrealistic, letalone that for each species a vapour pressure can be mea-sured. Near-explicit volatile organic compound oxidationmechanisms, like the MCM (Master chemical mechanismJenkin et al., 1997; Saunders et al., 2003), BOREAM (Bio-genic compounds Oxidation and RElated Aerosol formationModel Capouet et al., 2008; Ceulemans et al., 2010), or theGECKO-A (Generator for Explicit Chemistry and Kineticsof Organics in the AtmosphereAumont et al., 2005) aim tosimulate the complex chemistry leading to oxygenated semi-volatile and low-volatile species. To simulate SOA forma-tion, such a chemical mechanism can be coupled to a parti-tioning module, where it is typically assumed that these com-pounds partition to the condensed phase as a function of theirvapour pressure. Frequently used is the equilibrium parti-tioning formalism proposed byPankow(1994) where the or-ganic aerosol is considered as a well-mixed liquid; althoughrecent findings (Cappa and Wilson, 2011) suggest that alsoanother mechanism is possible, where the aerosol is rapidlyconverted from an absorptive to a non-absorptive phase. Esti-mation methods are therefore desired, that can quickly but re-liably calculate vapour pressure from basic molecular struc-ture information (e.g. a SMILES (Simplified Molecular InputLine Entry Specification) notation).
For some vapour pressure estimation methods othermolecular properties are required as input, such as the boilingpoint (Nannoolal et al., 2008; Moller et al., 2008; Myrdal andYalkowsky, 1997). This is an advantage if this boiling pointis experimentally known, but it can contribute to the over-all error if it has to be estimated. Several estimation meth-ods were developed primarily for the relatively volatile hy-drocarbons and monofunctional compounds, rather than the
Published by Copernicus Publications on behalf of the European Geosciences Union.
9432 S. Compernolle et al.: EVAPORATION: a new vapour pressure estimation method
low-volatility polyfunctional molecules. For example, forlow-volatility compounds, the method ofJoback and Reid(1987) overpredicts boiling points (Stein and Brown, 1994;Barley and McFiggans, 2010; Compernolle et al., 2010), andthe method ofMyrdal and Yalkowsky(1997) tends to overes-timate vapour pressures (Barley and McFiggans, 2010) whenprovided with an experimental boiling point. Another fre-quently encountered limitation is that not all molecule typesare covered by the method at hand. Therefore, we recentlyextended some estimation methods to cover e.g. hydroperox-ides and peracids (Compernolle et al., 2010). Some meth-ods assume additivity in lnp0 with respect to contributionsfrom different functional groups (Capouet and Muller, 2006;Pankow and Asher, 2008), but this approximation breaksdown especially for hydrogen bonding functional groups.The method ofMoller et al. (2008); Moller (2010) includesa special term for alcohols and acids to address this issue.Both the methods ofNannoolal et al.(2008) andMoller et al.(2008); Moller (2010) include terms to describe group-groupinteractions. However, the number of groups needed to de-scribe these interactions might become very large, with someparameters constrained by only a few molecules. Also thegroup interactions are described in a non-local way, i.e. therelative position of two functional groups does not matter,contrary to chemical intuition. Finally, recently new roomtemperature low vapour pressure data of polyfunctional com-pounds became available – especially diacids and polyfunc-tional diacids (Frosch et al., 2010; Booth et al., 2010, 2011) –and it turned out that the available methods do not predict thisdata well (Booth et al., 2010, 2011). For these reasons, a newestimation method addressing the above issues is desirable.
2 Data set
2.1 Data collection of vapour pressures andboiling points
The data used for the development of EVAPORATION ispresented in Table 1 of the Supplement. Data can be presentas (i) original experimental data, (ii) a pressure-temperature(p0(T )) correlation – e.g. an Antoine equation or a Wagnerequation-, (iii) a boiling point at atmospheric pressure or (iv)a boiling point at reduced pressure. Although original ex-perimental vapour pressure data is preferable over ap0(T )
correlation, the error due to the use of ap0(T ) correlationwithin its appropriate temperature range is minor comparedto other error sources. As collecting all individual points ina data file is time-consuming, this was not pursued in allcases, even when the original experimental data was avail-able. When using ap0(T ) correlation, we took points witha 10 K interval. Forp0(T ) correlations of secondary datasources, we took generally only the vapour pressures above1 kPa (9.87×10⁻³ atm) into account. This follows the rec-ommendations of the secondary data source Engineering Sci-
ences Data Unit (ESDU). We adopted this procedure also forthe other secondary references (such asYaws, 1994; Polinget al., 2001, and the Korean Thermophysical Properties Data-bank,KDB), as we presumed that the lower end of the re-ported temperature range rather referred to the melting point,i.e. where a liquid vapour pressure is applicable but the givenp0(T ) correlation is not necessarily reliable.
Sublimation pressure data was converted to subcooled liq-uid vapour pressure data by taking into account the meltingpoint temperature and enthalpy of fusion (see Sect.2.2).
Boiling points at atmospheric or reduced pressure were as-sembled, mostly from Chemistry Webbook of the NationalInstitute of Standards and Technology (NIST,Linstrom andMallard) – with important contributions from the compila-tions of Weast and Grasselli(1989) and Aldrich (1990) –from Lide (2000) and Sanchez and Myers(2000). Hencemost boiling points were from secondary sources.
The following groups of compounds can be distin-guished: non-functionalized hydrocarbons, monofunctionalcompounds and polyfunctional compounds.
2.1.1 Non-functionalized hydrocarbons (alkanesand alkenes)
As their vapour pressures are generally considered to be wellcharacterised, we made no attempt to retrieve the primaryreferences for these compounds, and considered a single ref-erence source per compound as being sufficient. The mostimportant data sources were the books ofPoling et al.(2001);Yaws(1994); Dykyj et al. (1999) andKDB. The data was al-ways in the form of a pressure-temperature (p0(T )) correla-tion. No aromatic compounds were considered, as they arebeyond the scope of this work.
2.1.2 Monofunctional compounds
These include aldehydes, ketones, ethers, esters, peroxides,nitrates, peroxy acyl nitrates, alcohols, acids, hydroperox-ides and peracids. For these compounds we tried also tocollect the primary reference sources. As a rule, all pri-mary reference sources for the same molecule were takeninto account, and at most one additional secondary ref-erence if (e.g. by chronology) it was clear that the sec-ondary reference was not based on the primary referencesources. In addition to the data sources already mentioned forthe non-functionalized hydrocarbons, important secondarydata sources wereESDU, the compilations of Pankow andco-workers (Asher et al., 2002; Asher and Pankow, 2006;Pankow and Asher, 2008) and NIST. For secondary datasources the data was always in the form of ap0(T ) cor-relation. ESDU is claimed to be of high quality and con-tains error estimations of thep0(T ) correlation. Therefore itwas preferred over other secondary references. If ap0(T )
correlation or original experimental data set was availablefor a molecule, no boiling point or reduced pressure boiling
Atmos. Chem. Phys., 11, 9431–9450, 2011 www.atmos-chem-phys.net/11/9431/2011/
S. Compernolle et al.: EVAPORATION: a new vapour pressure estimation method 9433
point was taken into account, as this point (most frequentlyfrom a secondary data source) would fall most frequentlywithin the range of this correlation or data set. While formost monofunctional compound types data availability is sat-isfactory, for some, especially hydroperoxides, peracids andperoxy acyl nitrates, it is not.
2.1.3 Polyfunctional compounds
For bifunctional compounds the availability of vapour pres-sure data depends strongly on the molecule type. For di-ols and diacids the situation is best, with data for over 30molecules and with often dozens of experimental data pointsper molecule, while for hydroxy nitrates and hydroxy acidsdata availability is very limited, with data for less than sixmolecules and often only in the form of a single data point.Also, not all group combinations are covered, e.g. we do nothave vapour pressure data on carbonyl nitrates. Importantsecondary sources here are ESDU and NIST.
For compounds with more than two functional groups,availability is even a more severe problem, although specifi-cally for functionalised diacids the situation improved in re-cent years thanks to efforts of the atmospheric community(e.g.,Booth et al., 2010, 2011; Chattopadhyay and Ziemann,2005; Soonsin et al., 2010; Cappa et al., 2007).
As opposed to monofunctional compounds, for polyfunc-tional compounds an available boiling point was taken intoaccount even if ap0(T ) correlation or original experimen-tal data set was available, as the boiling point was generallyabove the range of thisp0(T ) correlation.
2.2 Conversion of sublimation pressure to subcooledliquid vapour pressure data
Sublimation pressures are converted to subcooled liquidvapour pressures by (e.g.Prausnitz et al., 1999)
ln
(p0
l
p0s
)=
1Hfus
R
(1
T−
1
Tfus
)−
1Cp,sl
R
(Tfus
T−1− ln
(Tfus
T
))(1)
with p0l ,p
0s the vapour pressures of the liquid and solid state
respectively,R the ideal gas constant,1Hfus the enthalpyof fusion and1Cp,sl the difference between solid and liq-uid heat capacity. Note that in Eq. (1) Tfus is used insteadof the (theoretically correct) triple point temperature, but thisincurs little error. 1Cp,sl is frequently not experimentallyavailable and the estimation1Cp,sl ≈ 1Sfus =
1HfusTfus
is usedhere. The conversion is especially relevant for the recent dataon diacids and functionalised diacids (e.g.,Booth et al., 2010;Chattopadhyay and Ziemann, 2005), where the temperatureof measurement is far belowTfus. In case no experimental1Hfus and/orTfus is available, it can be estimated by the sim-ple method ofCompernolle et al.(2011a). Note that the up-
Table 1. Illustration of the effect of branching on vapour pressure,by comparison of vapour pressure of some example branched hy-drocarbons with their linear isomers. Branched hydrocarbons havea higher vapour pressure than their linear counterparts, except if thebranching occurs on a double bond.
Branched molecule Linear isomer log10
(p0
br/p0lin
)(298 K)
Alkanes or alkenes with branching not on double bond
2-Methyl propane Butane 0.162-Methyl butane Pentane 0.132,2-Dimethyl propane Pentane 0.402-Methyl pentane Hexane 0.153-Methyl pentane Hexane 0.103,3-Dimethyl-1-butene 1-Hexene 0.364-Methyl-1-pentene 1-Hexene 0.16
Alkenes, branching on double bond
2-Methyl-propene 1-Butene 0.0082-Methyl-2-butene 2-Pentene −0.022-Methyl-1-butene 1-Pentene −0.022-Methyl-2-pentene 2-Hexene 0.0072,3-Dimethyl-2-butene 2-Hexene −0.092-Methyl-1-pentene 1-Hexene 0.02
dated version of this method (Compernolle et al., 2011b) isnot yet applied here.
2.3 Data weighting
Optimal parameters are obtained by multiple linear regres-sion, such that
∑i
wi
(log10
(p0
est,i
)− log10
(p0
exp,i
))2(2)
is minimised, withp0exp,i the experimental vapour pressure
data pointi and p0est,i the corresponding modeled vapour
pressure.wi is a weighting factor, introduced such that onemolecule cannot dominate in Eq. (2), e.g. a molecule forwhich a large number ofT ,p0 data points are available, asopposed to a molecule where only a single boiling point isavailable. We set arbitrarily that one molecule cannot weightmore thanη = 3 times more than another one. IfNdata(i) isthe size of the data set of a certain molecule where data pointi belongs to, thenwi is defined as
wi = 1, if Ndata(i) ≤ η
wi =η
Ndata(i), otherwise. (3)
Changingη between one (all compounds have equivalentweight, disregarding their data point number) and∞ (all datapoints have equivalent weight) had only a minor effect on thefinal results.
www.atmos-chem-phys.net/11/9431/2011/ Atmos. Chem. Phys., 11, 9431–9450, 2011
9434 S. Compernolle et al.: EVAPORATION: a new vapour pressure estimation method
2.4 Kovats retention indices from gas chromatography
From NIST, a large quantity of Kovats retention indices (RI)from gas chromatography (GC) are available. For nitratesand functionalised nitrates, collections are available fromFischer(1999); Kastler(1999). RI are calculated from reten-tion times of the target molecule and of a set of linear alkanereference compounds. A simple and often used approach(e.g. Fischer et al., 1992) to calculate vapour pressure at298 K from RI of the target molecule, is to use the correlationlog10p
0(298 K) – RI of the reference compounds. An in-crease in RI by 100 then corresponds theoretically to a∼ 0.5decrease in log10p
0 at 298 K. This approach presumes thattarget compound and reference compounds have the sameaffinity towards the column, which is not generally true. Fur-thermore, RI are measured mostly far above room tempera-ture and – specifically for RI from temperature-programmedGC, as opposed to isothermal RI – not at one single temper-ature. Therefore we did not use RI for the parameter fittingof ourp0 estimation method. However, they are still used todraw qualitative conclusions.
2.5 Notes on specific molecule classes
2.5.1 Monofunctional carboxylic acids
Small carboxylic acids (∼1–5 carbon atoms) can undergosignificant gas-phase dimerization. Acetic acid, for example,is known to be mostly in dimeric form at room temperature,but the effect weakens for larger molecules and higher tem-peratures. As the association effect is not incorporated in ourmodel, the experimental data has to be corrected for this. Theexperimental vapour pressure is the sum of both monomeric(p0
m) and dimeric (p0d) forms.
p0= p0
m+p0d (4)
Kassoc=p0
d(p0
m
)2 (5)
Therefore, the vapour pressure of the monomerp0m can be
calculated from the experimental vapour pressurep0 and theassociation constantKassoc:
p0m =
−1+
√1+4p0Kassoc
2Kassoc(6)
p0m is taken as observational data to fit the model. Asso-
ciation constants of small carboxylic acids are taken fromMiyamoto et al.(1999).
2.5.2 Peroxy acyl nitrates
The only peroxy acyl nitrate for which a measured vapourpressure is available is peroxy acetyl nitrate (Bruckmann andWillner, 1983; Kacmarek et al., 1978). This hampers a cross-validation for this type of compounds. However, it is possi-ble to estimate additional vapour pressures from Henry law’s
2 3 4 5 6 7 8 9 10−13
−12
−11
−10
−9
−8
−7
−6
carbon number
log 10
( p0 /a
tm)
Bilde (2003) (s?)Booth (2010) (s)Cappa (2007) (s)Chattopadhyay (2005) (s)De Wit (s)ESDU (l)Pope (2010) (l)
Ribeiro (1999, 2001) (s)Riipinen (2007) (l)Salo (2010) (s?)Soonsin (2010) (l)Soonsin (2010) (s)Yaws (l)
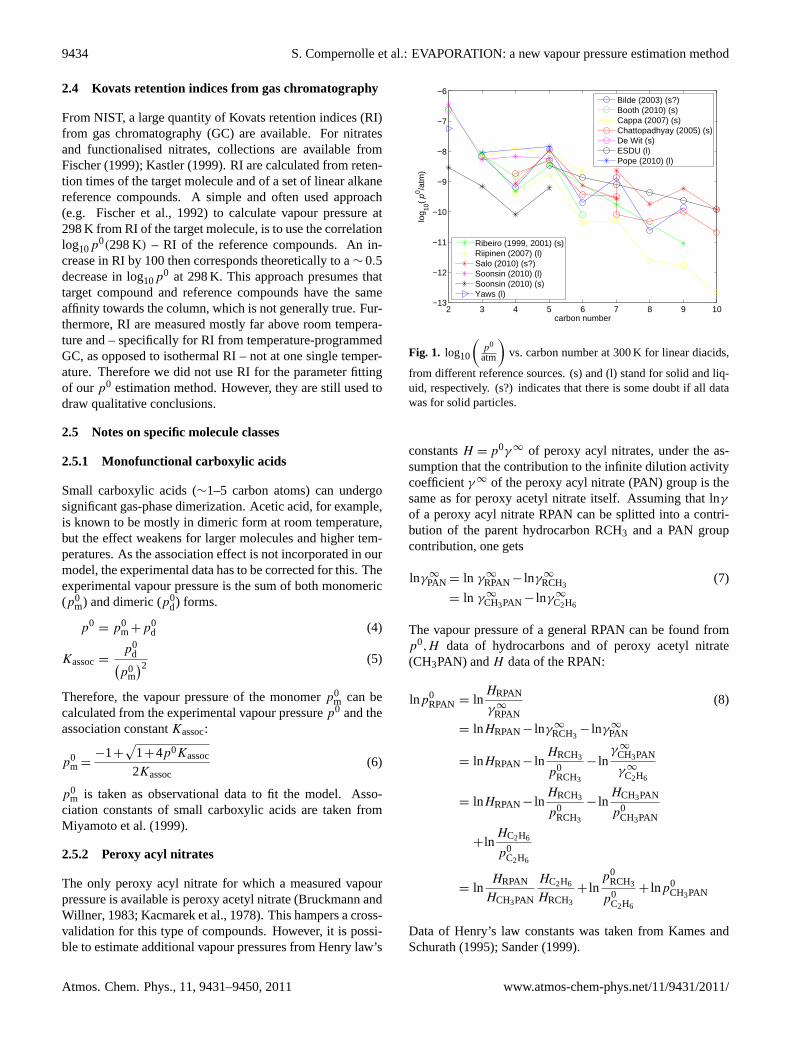
Fig. 1. log10
(p0
atm
)vs. carbon number at 300 K for linear diacids,
from different reference sources. (s) and (l) stand for solid and liq-uid, respectively. (s?) indicates that there is some doubt if all datawas for solid particles.
constantsH = p0γ ∞ of peroxy acyl nitrates, under the as-sumption that the contribution to the infinite dilution activitycoefficientγ ∞ of the peroxy acyl nitrate (PAN) group is thesame as for peroxy acetyl nitrate itself. Assuming that lnγ
of a peroxy acyl nitrate RPAN can be splitted into a contri-bution of the parent hydrocarbon RCH3 and a PAN groupcontribution, one gets
lnγ ∞
PAN = ln γ ∞
RPAN− lnγ ∞
RCH3(7)
= ln γ ∞
CH3PAN− lnγ ∞
C2H6
The vapour pressure of a general RPAN can be found fromp0,H data of hydrocarbons and of peroxy acetyl nitrate(CH3PAN) andH data of the RPAN:
lnp0RPAN = ln
HRPAN
γ ∞
RPAN(8)
= lnHRPAN− lnγ ∞
RCH3− lnγ ∞
PAN
= lnHRPAN− lnHRCH3
p0RCH3
− lnγ ∞
CH3PAN
γ ∞
C2H6
= lnHRPAN− lnHRCH3
p0RCH3
− lnHCH3PAN
p0CH3PAN
+lnHC2H6
p0C2H6
= lnHRPAN
HCH3PAN
HC2H6
HRCH3
+ lnp0
RCH3
p0C2H6
+ lnp0CH3PAN
Data of Henry’s law constants was taken fromKames andSchurath(1995); Sander(1999).
Atmos. Chem. Phys., 11, 9431–9450, 2011 www.atmos-chem-phys.net/11/9431/2011/
S. Compernolle et al.: EVAPORATION: a new vapour pressure estimation method 9435
2.5.3 Diacids and functionalised diacids
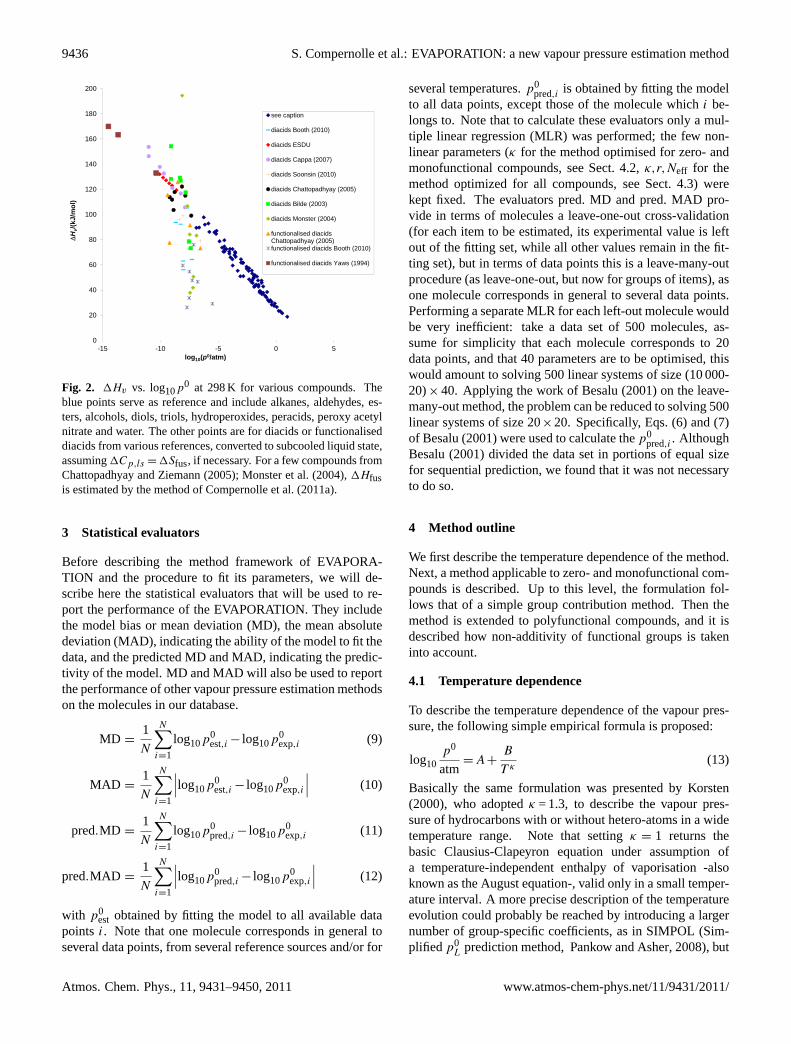
Recently, ambient temperature vapour pressure data of sev-eral research groups on diacids and functionalised diacidsbecame available:Booth et al.(2010, 2011); Pope et al.(2010); Chattopadhyay and Ziemann(2005); Bilde et al.(2003); Monster et al.(2004); Frosch et al.(2010); Soonsinet al.(2010). This data is critical for the development of ourvapour pressure method, primarily intended for polyfunc-tional molecules that are present in SOA. However, there canbe orders of magnitude difference between measurements bydifferent groups for the same compound, way above the re-ported experimental errors (typically 30–50 %). Figure1shows the vapour pressure vs. carbon number at 300 K forlinear diacids calculated fromp0(T ) correlations of differ-ent reference sources, up to 10 carbon atoms. From 11 car-bon atoms on, a departure of the expected vapour pressureor vaporisation enthalpy is observed, probably due to gas-phase cyclization (Ribeiro da Silva et al., 1999; Roux et al.,2005), and therefore this data is not included. Both liquidand solid data sets are present. Note that the shown pointsof ESDU, Yaws(1994) are obtained by bold extrapolation ofp0(T ) correlations from the appropriate temperature range.To a lesser extent this also applies to the data ofRibeiro daSilva et al.(1999, 2001). The data sets of subcooled liquidvapour pressures that are not extrapolations (Soonsin et al.,2010; Pope et al., 2010; Riipinen et al., 2007) agree rela-tively well with one another. Such data is most relevant tothe parameterization of our method, as it is intended to pre-dict liquid vapour pressures. Unfortunately, at room temper-ature liquid data is available only up to 6 carbon atoms, andno data is available for nonlinear or functionalised diacids.
The data for solids on the other hand shows severe dis-agreement, with the most extreme example being three or-ders of magnitude different for sebacic acid (ten carbonatoms) between the data ofSalo et al.(2010) andCappa et al.(2007). It has been speculated that this might be due to theexperimental technique employed (Cappa et al., 2007; Popeet al., 2010) or to the physical nature of the diacids (Zardiniet al., 2006; Soonsin et al., 2010; Salo et al., 2010) (presenceof defects, partially or totally amorphous/liquid behaviour).Soonsin et al.(2010) also present vapour pressures of satu-rated solutions that should in theory equal the sublimationpressure of the corresponding crystalline solid particle, butwithout the complications encountered for solid particles. In-clusion of all available data in our model would lead to largeuncertainties in the fitting parameters. Rather, we did a se-lection, although we are fully aware that the debate – whichvapour pressure data set of diacids is the most reliable? – isnot settled. For linear chains, we selected the liquid data sets(Soonsin et al., 2010; Pope et al., 2010; Riipinen et al., 2007)because of their mutual consistency. Second, the saturatedsolution data ofSoonsin et al.(2010) was selected for mal-onic, succinic and glutaric acid, while we chose their solidparticle data for oxalic acid.Soonsin et al.(2010) cite two
reasons why their data on saturated solutions is more reli-able than their data on solid particles themselves. First, thepossible non-sphericity of solid particles bears uncertaintyon measured vapour pressure, and second, the non-constantevaporation rates, probably due to liquid inclusions, compli-cates their measurements. For oxalic acid the solid particledata was chosen, as the saturated solution data was for thedihydrate rather than anhydrous oxalic acid. Another reasonto choose the data ofSoonsin et al.(2010) was its consis-tency with the corresponding liquid vapour pressure data andthe fusion enthalpy. Finally, the sublimation pressure data ofCappa et al.(2007) was chosen as it is the most consistentwith that of Soonsin et al.(2010) and extends to 10 carbonatoms.
For the nonlinear and functionalised diacids, no data fromthese references is available. We took therefore data fromMonster et al.(2004); Booth et al.(2010, 2011); Ribeiro daSilva et al. (2000, 2001); Bilde and Pandis(2001); Chat-topadhyay and Ziemann(2005); Frosch et al.(2010). Thesublimation pressure data of the group of Bilde and cowork-ers (Bilde and Pandis, 2001; Monster et al., 2004) is rela-tively high, and we assume that they actually correspond toliquid vapour pressure, as it has been suggested before forthe odd-numbered linear chain diacids (Zardini et al., 2006;Soonsin et al., 2010). High temperature (above the meltingpoint) liquid vapour pressure data for diacids and a few func-tionalised diacids is taken from ESDU andYaws(1994).
MacLeod et al.(2007) derived a linear relationship be-tween1Hv and log10p
0 for non-hydrogen bonding com-pounds starting from Trouton’s rule.Epstein et al.(2010)established a more general empirical linear relationship in-cluding also hydrogen-bonding compounds. It is informingto investigate whether the data on diacids and functionaliseddiacids obey this relationship. Figure2 shows that whilesuch a linear correlation is indeed observed for various com-pounds (alkanes, aldehydes, esters, alcohols, diols, hydroper-oxides, peracids, peroxy acetyl nitrate and water were takenhere), this is in general not the case for the diacids and func-tionalised diacids. The data of ESDU on diacids, and ofYaws(1994) on functionalised diacids does obey the correlation,notwithstanding the fact that the data points are bold extrapo-lations from the appropriate temperature range. Also the dataof Cappa et al.(2007) obeys the correlation satisfactorily,and this is an additional argument why we chose their dataas being representative for linear diacids. Many of the otherdata points, especially those ofBooth et al.(2010); Monsteret al.(2004); Bilde et al.(2003) are far from the correlation.This is in itself no proof that these data points are incorrect;for hydrogen-bonding compounds, the1Hv vs. log10p
0 re-lationship is empirical after all. But it does clearly show thatthe measured vapour pressure behaviour of these compoundsstrongly deviates from the expected pattern.
www.atmos-chem-phys.net/11/9431/2011/ Atmos. Chem. Phys., 11, 9431–9450, 2011
9436 S. Compernolle et al.: EVAPORATION: a new vapour pressure estimation method
0
20
40
60
80
100
120
140
160
180
200
-15 -10 -5 0 5
ΔHv/
(kJ/
mo
l)
log10(p0/atm)
see caption
diacids Booth (2010)
diacids ESDU
diacids Cappa (2007)
diacids Soonsin (2010)
diacids Chattopadhyay (2005)
diacids Bilde (2003)
diacids Monster (2004)
functionalised diacidsChattopadhyay (2005)functionalised diacids Booth (2010)
functionalised diacids Yaws (1994)
Fig. 2. 1Hv vs. log10p0 at 298 K for various compounds. Theblue points serve as reference and include alkanes, aldehydes, es-ters, alcohols, diols, triols, hydroperoxides, peracids, peroxy acetylnitrate and water. The other points are for diacids or functionaliseddiacids from various references, converted to subcooled liquid state,assuming1Cp,ls = 1Sfus, if necessary. For a few compounds fromChattopadhyay and Ziemann(2005); Monster et al.(2004), 1Hfusis estimated by the method ofCompernolle et al.(2011a).
3 Statistical evaluators
Before describing the method framework of EVAPORA-TION and the procedure to fit its parameters, we will de-scribe here the statistical evaluators that will be used to re-port the performance of the EVAPORATION. They includethe model bias or mean deviation (MD), the mean absolutedeviation (MAD), indicating the ability of the model to fit thedata, and the predicted MD and MAD, indicating the predic-tivity of the model. MD and MAD will also be used to reportthe performance of other vapour pressure estimation methodson the molecules in our database.
MD =1
N
N∑i=1
log10p0est,i − log10p
0exp,i (9)
MAD =1
N
N∑i=1
∣∣∣log10p0est,i − log10p
0exp,i
∣∣∣ (10)
pred.MD =1
N
N∑i=1
log10p0pred,i − log10p
0exp,i (11)
pred.MAD =1
N
N∑i=1
∣∣∣log10p0pred,i − log10p
0exp,i
∣∣∣ (12)
with p0est obtained by fitting the model to all available data
points i. Note that one molecule corresponds in general toseveral data points, from several reference sources and/or for
several temperatures.p0pred,i is obtained by fitting the model
to all data points, except those of the molecule whichi be-longs to. Note that to calculate these evaluators only a mul-tiple linear regression (MLR) was performed; the few non-linear parameters (κ for the method optimised for zero- andmonofunctional compounds, see Sect.4.2, κ,r,Neff for themethod optimized for all compounds, see Sect.4.3) werekept fixed. The evaluators pred. MD and pred. MAD pro-vide in terms of molecules a leave-one-out cross-validation(for each item to be estimated, its experimental value is leftout of the fitting set, while all other values remain in the fit-ting set), but in terms of data points this is a leave-many-outprocedure (as leave-one-out, but now for groups of items), asone molecule corresponds in general to several data points.Performing a separate MLR for each left-out molecule wouldbe very inefficient: take a data set of 500 molecules, as-sume for simplicity that each molecule corresponds to 20data points, and that 40 parameters are to be optimised, thiswould amount to solving 500 linear systems of size (10 000-20)× 40. Applying the work ofBesalu(2001) on the leave-many-out method, the problem can be reduced to solving 500linear systems of size 20×20. Specifically, Eqs. (6) and (7)of Besalu(2001) were used to calculate thep0
pred,i . AlthoughBesalu(2001) divided the data set in portions of equal sizefor sequential prediction, we found that it was not necessaryto do so.
4 Method outline
We first describe the temperature dependence of the method.Next, a method applicable to zero- and monofunctional com-pounds is described. Up to this level, the formulation fol-lows that of a simple group contribution method. Then themethod is extended to polyfunctional compounds, and it isdescribed how non-additivity of functional groups is takeninto account.
4.1 Temperature dependence
To describe the temperature dependence of the vapour pres-sure, the following simple empirical formula is proposed:
log10p0
atm= A+
B
T κ(13)
Basically the same formulation was presented byKorsten(2000), who adoptedκ = 1.3, to describe the vapour pres-sure of hydrocarbons with or without hetero-atoms in a widetemperature range. Note that settingκ = 1 returns thebasic Clausius-Clapeyron equation under assumption ofa temperature-independent enthalpy of vaporisation -alsoknown as the August equation-, valid only in a small temper-ature interval. A more precise description of the temperatureevolution could probably be reached by introducing a largernumber of group-specific coefficients, as in SIMPOL (Sim-plified p0
L prediction method,Pankow and Asher, 2008), but
Atmos. Chem. Phys., 11, 9431–9450, 2011 www.atmos-chem-phys.net/11/9431/2011/
S. Compernolle et al.: EVAPORATION: a new vapour pressure estimation method 9437
Eq. (13) was chosen for its simplicity and to avoid the possi-bility of overfitting.
The termA is directly related to the entropy of boilingat 1 atm total pressure1Sb ≡ 1Sv(Tb), as from Eq. (13) itfollows
Tb =
(−
B
A
)1/κ
(14)
and, under the assumption of an ideal gas,
d log10p0
d( 1T
)= −
1Hv
ln(10)R=
κB
T κ−1(15)
Hence the enthalpy of vaporisation1Hv and of boiling1Hbis given by:
1Hv = −κ ln(10)R
T κ−1B (16)
1Hb ≡ 1Hv (Tb) = Aκ ln(10)RTb (17)
Combining Eq. (17) with the relation1Hb = 1SbTb resultsin
A =1Sb
κ ln(10)R(18)
4.2 Method for zero- and monofunctional compounds
The most basic group-contribution approach describeslog10p
0 as a sum of group contributions (Capouet andMuller, 2006; Pankow and Asher, 2008). This model is ad-equate for zero- and monofunctional compounds.A andB
are then both divided into a sum of group contributions:
A =
∑k
ckak (19)
B =
∑k
ckbk (20)
whereak,bk can be both first-order group contributions orsecond-order corrections on these group contributions.ck
are the values of a set of molecular descriptors. Thesedescriptors are accountable molecular properties, obtainedfrom molecular structure information. An important exampleis the number of times a certain functional group is present ina molecule. The first-order groups describe the molecule as aset of fragments (carbon atoms and functional groups), whilethe second-order groups take the environment of functionalgroups into account. The parametersak,bk then connect thedescriptor values to the observable estimate (here log10p
0est).
Combining Eqs. (2), (19) and (20) results in∑i
wi
(log10
(p0
est,i
)− log10
(p0
exp,i
))2
=
∑i
wi
(∑k
ckak +
∑k ckbk
T κ− log10(p
0exp,i)
)2
(21)
which is the function to be minimised. The problem is linearin the parametersak,bk and thus can be solved by MLR atfixed κ. We report also the total group contributiongk at298 K, defined as
gk = ak +bk
(298K)κ(22)
and its standard deviation
σk =
√covar(ak)+
covar(bk)
(298K)2κ(23)
with covar(ak),covar(bk) the corresponding diagonal ele-ments of the covariance matrix. To test whether the descrip-tork is statistically significant, a student’st-test is performed:it was checked if
p-value= 1−
∫ u
−u
f (t,df)dt (24)
with u = gk/σk, f (t,df) the student’st probability densitydistribution, df the degrees of freedom, and thep-value theprobability that the null hypothesis is true, i.e. thatgk is notstatistically different from zero. A highp-value (above thesignificance level) indicates that the null hypothesis cannotbe rejected, and hence the descriptor was not retained. A sig-nificance level of 0.05 was taken.
To calculate ap-value from a student’st probability den-sity distribution the degrees of freedom (df) has to be speci-fied. The degrees of freedom are “the number of independentunits of information in a sample relevant to the estimationof a parameter” (Everitt, 2010). Our approach is differentfrom that of e.g.Raventos-Duran et al.(2010), where, df=#species− #parameters (or more generally, #observables−
#parameters). As the number of species is much higher thanthe number of parameters, the distribution would then es-sentially become a normal probability density distribution,with a minimal width. In our opinion, this approach is toooptimistic, probably only true when all observables are im-portant to constrain all parameters. Taking as example theperoxy acyl nitrates, only a limited amount of information,namely data on 5 molecules, is available to constrain the pa-rameter for the peroxy acyl nitrate group, the other data be-ing irrelevant for this purpose. Instead, we define degrees offreedom as
df = #(species where descriptor occurs)−1 (25)
Hence df, as we define it here, is specific for each descriptor.
4.2.1 Size and topology of the molecule, evaluatinghydrocarbons only
Apart from a constant term (c1 = 1), two descriptors are usedto describe hydrocarbons. As a descriptor related to the sizeof the molecule, the number of carbon atoms are counted; forfunctionalised molecules also the number of in-chain oxygen
www.atmos-chem-phys.net/11/9431/2011/ Atmos. Chem. Phys., 11, 9431–9450, 2011
9438 S. Compernolle et al.: EVAPORATION: a new vapour pressure estimation method
atoms is counted. In-chain oxygen atoms are oxygen atomsthat cannot be removed without breaking the carbon skeletonand occur in ethers (COC), esters (C(=O)OC) and peroxides(COOC). As a descriptor for the topology of the molecule,the topological indext is defined as
t = branching number− ring number (26)
where the branching number is defined by taking at eachcarbon the number ofsingle carbon-carbon bonds exceed-ing 2. The notion of single bonds is important as we foundthat branching at double bonds has no impact on the vapourpressure (Table1).
As ring number and branching number have an impact onlog10p
0 that is similar in magnitude but opposite in sign, welumped them into the single descriptort . With the few de-scriptors given above, all non-functionalised hydrocarbonsin our database (130 molecules) can be described. Perform-ing the regression for severalκ an optimal value (smallestSTD) forκ = 1.5 was found, somewhat higher than the valueproposed byKorsten(2000). The method performs well forhydrocarbons, with an MAD of 0.057 and a pred. MAD of0.060.
4.2.2 Including functional groups and local structureeffects, evaluating also monofunctionals
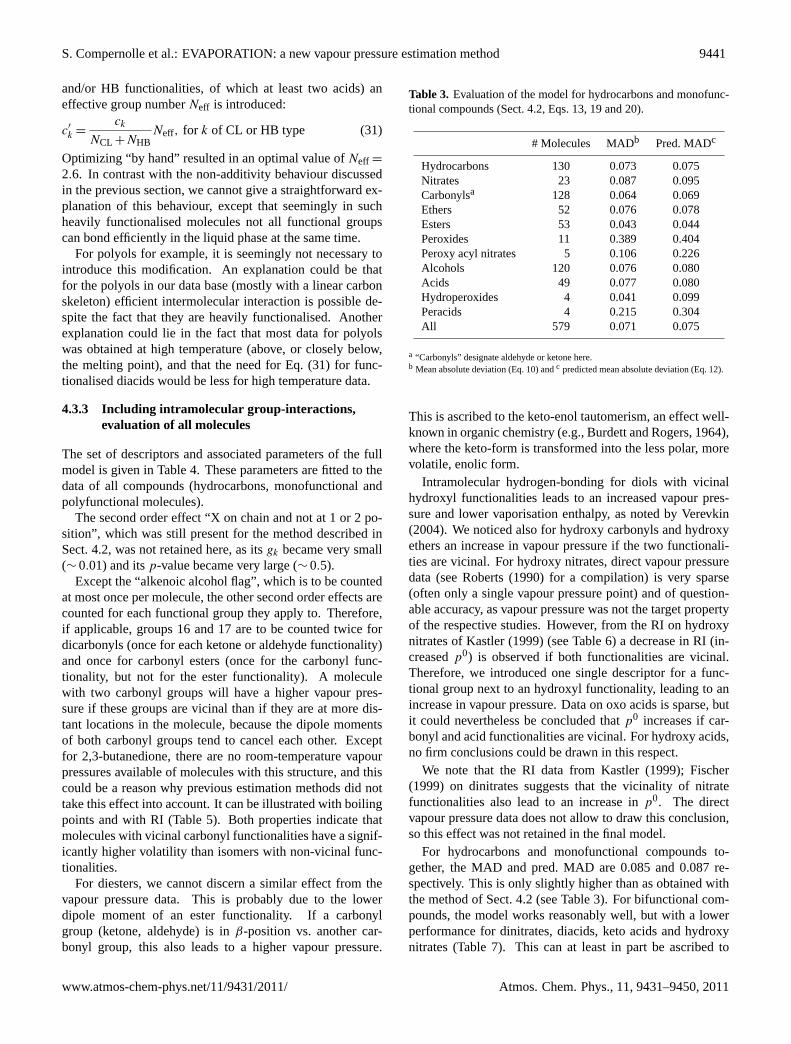
Adding the monofunctional compounds to our fitting set re-sults in a total of 579 species.κ = 1.5 was still the optimalvalue. An overview of the descriptors, together with theiroptimal parametersak,bk for hydrocarbons and monofunc-tional compounds is given in Table2. Also given in Table2is the total group contribution at 298 Kgk, and the combinedstandard deviation.
Parameters are introduced for the functional groups ni-trate, carbonyl (including both aldehydes and ketones sincetheir vapour pressures are very similar), ester, peroxy acylnitrate, hydroxyl, acid, hydroperoxide and peracid. Note thatwith the functional group “carbonyl” we designate aldehy-dic and ketone groups, but not e.g. esters or carboxylic acids.Ethers and peroxides have no separate functional group con-tributions, as they are already accounted for by descriptork = 2. Note that the hydrogen bonding groups (hydroxyl,acid, hydroperoxide, peracid) have about the same higha
value of∼ 1. In other words, they give a similar contributionto the entropy of boiling. The high value is due to the higherordering in the liquid phase compared to non-hydrogen bond-ing liquids. The carbonyl-containing nonhydrogen bondinggroups (carbonyl, ester, peroxy acyl nitrate) have a lowera
value of∼ 0.3.The second order effects can be seen as modifications to
the functional group contributions, and have likely stericand/or inductive causes. If a functional group is placed ona ring (as opposed to a chain), log10p
0 will be lower. On theother hand, if a functional group is placed not at or near theend of a chain (i.e. not at the 1 or 2 position) log10p
0 will be
higher. As is well known, primary alcohols (i.e. where thehydroxyl is placed on a primary carbon) have lower vapourpressures than corresponding secondary alcohols, which inturn have lower vapour pressures than tertiary alcohols. Thedifference in log10p
0 is about the same between primaryand secondary, and between secondary and tertiary alco-hols. A double bond conjugated with a carbonyl function-ality (aldehyde or ketone) lowers the vapour pressure. Thisis probably due to the increased dipole moment.p-values ofthe second order effects are all well below the 0.05 signifi-cance level.
For the hydrocarbons, there is an increase in MAD andpredicted MAD compared to the regression for hydrocarbonsonly (see Sect.4.2.1), but the performance is still satisfactory.For most molecule classes, MAD and pred. MAD are quitelow, indicating the goodness-of-fit and the predictivity. Therelatively lower performance of the model for peroxy acyl ni-trates and peracids can be ascribed to the very limited numberof molecules in the data set and possibly also to experimentaluncertainty, as decomposition can be a problem for this typeof molecules (Egerton et al., 1951; Kacmarek et al., 1978).The bad performance for peroxides, for which the number ofdata points seems acceptable, is more difficult to understand.Either their vapour pressures do not follow a simple group-contribution rule as for example for the ethers, or the dataquality is particularly bad. The peroxide group, as the ethergroup, does not have a separate group contribution, as theyare counted already in descriptork = 2. Inserting a separatedescriptor for peroxides did not improve significantly theirperformance.
We considered also some second order effects that are notretained in the final model. Apart from thep-value, also theirinfluence on the pred. MAD was considered. In our previousmethod (Capouet and Muller, 2006), we distinguished be-tween primary, secondary and tertiary nitrate groups. How-ever, based on our current vapour pressure data set, we donot find this effect significant (p-value not below 0.05) and itis therefore not retained in the current method. On the otherhand, the RI data ofFischer(1999); Kastler(1999) does sug-gest such an effect. More experimental vapour pressure dataon nitrates will hopefully shed light on this issue.
Introducing a descriptor for branching next to perox-ide groups (e.g.−C(C)OOC−), reduced the MAD from0.39 to 0.25, but increased the pred. MAD from 0.40 to0.51, and thep-value of this parameter was 0.08. There-fore, this descriptor was not retained. As opposed to car-bonyl functionalities, no important impact was found fordouble bonds conjugated with acid or ester functionali-ties. Although branching next to hydrogen bonding groups(e.g.−C(C)C(=O)OH, −C(C)C(OH)−) seems to increaselog10p
0(298K) by about 0.06 (p-value of 0.007), its impacton the MAD and pred. MAD of the hydrogen bonding com-pounds is marginal.
Atmos. Chem. Phys., 11, 9431–9450, 2011 www.atmos-chem-phys.net/11/9431/2011/
S. Compernolle et al.: EVAPORATION: a new vapour pressure estimation method 9439
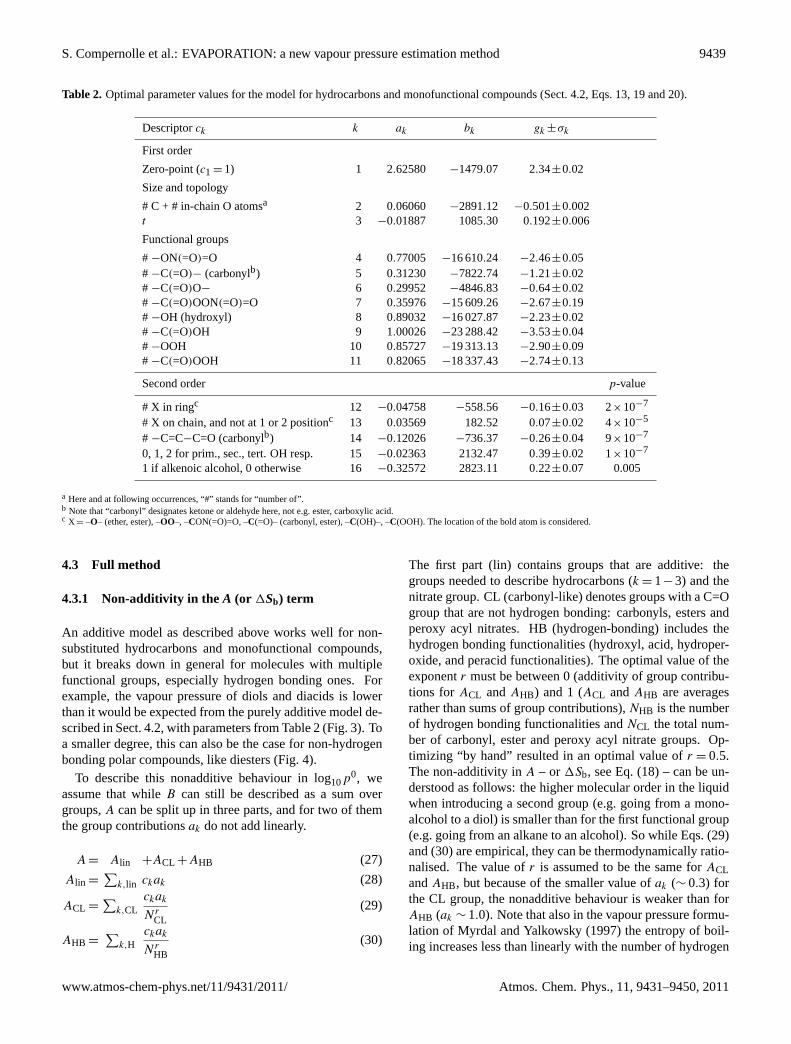
Table 2. Optimal parameter values for the model for hydrocarbons and monofunctional compounds (Sect.4.2, Eqs.13, 19and20).
Descriptorck k ak bk gk ±σk
First order
Zero-point (c1 = 1) 1 2.62580 −1479.07 2.34±0.02
Size and topology
# C + # in-chain O atomsa 2 0.06060 −2891.12 −0.501±0.002t 3 −0.01887 1085.30 0.192±0.006
Functional groups
# −ON(=O)=O 4 0.77005 −16 610.24 −2.46±0.05# −C(=O)− (carbonylb) 5 0.31230 −7822.74 −1.21±0.02# −C(=O)O− 6 0.29952 −4846.83 −0.64±0.02# −C(=O)OON(=O)=O 7 0.35976 −15 609.26 −2.67±0.19# −OH (hydroxyl) 8 0.89032 −16 027.87 −2.23±0.02# −C(=O)OH 9 1.00026 −23 288.42 −3.53±0.04# −OOH 10 0.85727 −19 313.13 −2.90±0.09# −C(=O)OOH 11 0.82065 −18 337.43 −2.74±0.13
Second order p-value
# X in ringc 12 −0.04758 −558.56 −0.16±0.03 2×10⁻⁷
# X on chain, and not at 1 or 2 positionc 13 0.03569 182.52 0.07±0.02 4×10⁻⁵
# −C=C−C=O (carbonylb) 14 −0.12026 −736.37 −0.26±0.04 9×10⁻⁷
0, 1, 2 for prim., sec., tert. OH resp. 15−0.02363 2132.47 0.39±0.02 1×10⁻⁷
1 if alkenoic alcohol, 0 otherwise 16 −0.32572 2823.11 0.22±0.07 0.005
a Here and at following occurrences, “#” stands for “number of”.b Note that “carbonyl” designates ketone or aldehyde here, not e.g. ester, carboxylic acid.c X = –O– (ether, ester), –OO–, –CON(=O)=O, –C(=O)– (carbonyl, ester), –C(OH)–, –C(OOH). The location of the bold atom is considered.
4.3 Full method
4.3.1 Non-additivity in the A (or 1Sb) term
An additive model as described above works well for non-substituted hydrocarbons and monofunctional compounds,but it breaks down in general for molecules with multiplefunctional groups, especially hydrogen bonding ones. Forexample, the vapour pressure of diols and diacids is lowerthan it would be expected from the purely additive model de-scribed in Sect.4.2, with parameters from Table2 (Fig.3). Toa smaller degree, this can also be the case for non-hydrogenbonding polar compounds, like diesters (Fig.4).
To describe this nonadditive behaviour in log10p0, we
assume that whileB can still be described as a sum overgroups,A can be split up in three parts, and for two of themthe group contributionsak do not add linearly.
A = Alin +ACL +AHB (27)
Alin =∑
k,lin ckak (28)
ACL =∑
k,CLckak
N rCL
(29)
AHB =∑
k,Hckak
N rHB
(30)
The first part (lin) contains groups that are additive: thegroups needed to describe hydrocarbons (k = 1−3) and thenitrate group. CL (carbonyl-like) denotes groups with a C=Ogroup that are not hydrogen bonding: carbonyls, esters andperoxy acyl nitrates. HB (hydrogen-bonding) includes thehydrogen bonding functionalities (hydroxyl, acid, hydroper-oxide, and peracid functionalities). The optimal value of theexponentr must be between 0 (additivity of group contribu-tions for ACL andAHB) and 1 (ACL andAHB are averagesrather than sums of group contributions),NHB is the numberof hydrogen bonding functionalities andNCL the total num-ber of carbonyl, ester and peroxy acyl nitrate groups. Op-timizing “by hand” resulted in an optimal value ofr = 0.5.The non-additivity inA – or 1Sb, see Eq. (18) – can be un-derstood as follows: the higher molecular order in the liquidwhen introducing a second group (e.g. going from a mono-alcohol to a diol) is smaller than for the first functional group(e.g. going from an alkane to an alcohol). So while Eqs. (29)and (30) are empirical, they can be thermodynamically ratio-nalised. The value ofr is assumed to be the same forACLandAHB, but because of the smaller value ofak (∼ 0.3) forthe CL group, the nonadditive behaviour is weaker than forAHB (ak ∼ 1.0). Note that also in the vapour pressure formu-lation of Myrdal and Yalkowsky(1997) the entropy of boil-ing increases less than linearly with the number of hydrogen
www.atmos-chem-phys.net/11/9431/2011/ Atmos. Chem. Phys., 11, 9431–9450, 2011
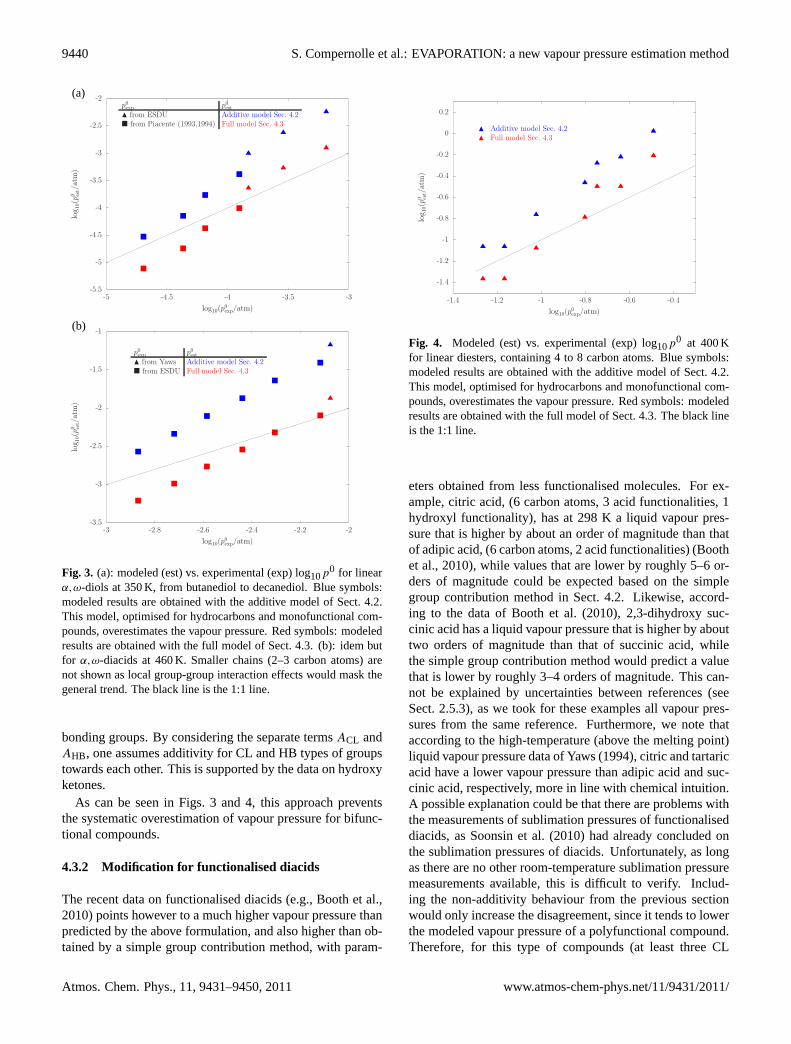
9440 S. Compernolle et al.: EVAPORATION: a new vapour pressure estimation method
-5.5
-5
-4.5
-4
-3.5
-3
-2.5
-2
-5 -4.5 -4 -3.5 -3
log 1
0(p0 es
t/at
m)
log10(p0exp/atm)
p0exp p0
est� from ESDU Additive model Sec. 4.2� from Piacente (1993,1994) Full model Sec. 4.3
(a)
-3.5
-3
-2.5
-2
-1.5
-1
-3 -2.8 -2.6 -2.4 -2.2 -2
log 1
0(p0 es
t/at
m)
log10(p0exp/atm)
p0exp p0
est� from Yaws Additive model Sec. 4.2� from ESDU Full model Sec. 4.3
(b)
Fig. 3. (a): modeled (est) vs. experimental (exp) log10p0 for linearα,ω-diols at 350 K, from butanediol to decanediol. Blue symbols:modeled results are obtained with the additive model of Sect.4.2.This model, optimised for hydrocarbons and monofunctional com-pounds, overestimates the vapour pressure. Red symbols: modeledresults are obtained with the full model of Sect.4.3. (b): idem butfor α,ω-diacids at 460 K. Smaller chains (2–3 carbon atoms) arenot shown as local group-group interaction effects would mask thegeneral trend. The black line is the 1:1 line.
bonding groups. By considering the separate termsACL andAHB, one assumes additivity for CL and HB types of groupstowards each other. This is supported by the data on hydroxyketones.
As can be seen in Figs.3 and 4, this approach preventsthe systematic overestimation of vapour pressure for bifunc-tional compounds.
4.3.2 Modification for functionalised diacids
The recent data on functionalised diacids (e.g.,Booth et al.,2010) points however to a much higher vapour pressure thanpredicted by the above formulation, and also higher than ob-tained by a simple group contribution method, with param-
-1.4
-1.2
-1
-0.8
-0.6
-0.4
-0.2
0
0.2
-1.4 -1.2 -1 -0.8 -0.6 -0.4
log 1
0(p0 es
t/at
m)
log10(p0exp/atm)
� Additive model Sec. 4.2� Full model Sec. 4.3
Fig. 4. Modeled (est) vs. experimental (exp) log10p0 at 400 Kfor linear diesters, containing 4 to 8 carbon atoms. Blue symbols:modeled results are obtained with the additive model of Sect.4.2.This model, optimised for hydrocarbons and monofunctional com-pounds, overestimates the vapour pressure. Red symbols: modeledresults are obtained with the full model of Sect.4.3. The black lineis the 1:1 line.
eters obtained from less functionalised molecules. For ex-ample, citric acid, (6 carbon atoms, 3 acid functionalities, 1hydroxyl functionality), has at 298 K a liquid vapour pres-sure that is higher by about an order of magnitude than thatof adipic acid, (6 carbon atoms, 2 acid functionalities) (Boothet al., 2010), while values that are lower by roughly 5–6 or-ders of magnitude could be expected based on the simplegroup contribution method in Sect.4.2. Likewise, accord-ing to the data ofBooth et al.(2010), 2,3-dihydroxy suc-cinic acid has a liquid vapour pressure that is higher by abouttwo orders of magnitude than that of succinic acid, whilethe simple group contribution method would predict a valuethat is lower by roughly 3–4 orders of magnitude. This can-not be explained by uncertainties between references (seeSect.2.5.3), as we took for these examples all vapour pres-sures from the same reference. Furthermore, we note thataccording to the high-temperature (above the melting point)liquid vapour pressure data ofYaws(1994), citric and tartaricacid have a lower vapour pressure than adipic acid and suc-cinic acid, respectively, more in line with chemical intuition.A possible explanation could be that there are problems withthe measurements of sublimation pressures of functionaliseddiacids, asSoonsin et al.(2010) had already concluded onthe sublimation pressures of diacids. Unfortunately, as longas there are no other room-temperature sublimation pressuremeasurements available, this is difficult to verify. Includ-ing the non-additivity behaviour from the previous sectionwould only increase the disagreement, since it tends to lowerthe modeled vapour pressure of a polyfunctional compound.Therefore, for this type of compounds (at least three CL
Atmos. Chem. Phys., 11, 9431–9450, 2011 www.atmos-chem-phys.net/11/9431/2011/
S. Compernolle et al.: EVAPORATION: a new vapour pressure estimation method 9441
and/or HB functionalities, of which at least two acids) aneffective group numberNeff is introduced:
c′
k =ck
NCL +NHBNeff, for k of CL or HB type (31)
Optimizing “by hand” resulted in an optimal value ofNeff =
2.6. In contrast with the non-additivity behaviour discussedin the previous section, we cannot give a straightforward ex-planation of this behaviour, except that seemingly in suchheavily functionalised molecules not all functional groupscan bond efficiently in the liquid phase at the same time.
For polyols for example, it is seemingly not necessary tointroduce this modification. An explanation could be thatfor the polyols in our data base (mostly with a linear carbonskeleton) efficient intermolecular interaction is possible de-spite the fact that they are heavily functionalised. Anotherexplanation could lie in the fact that most data for polyolswas obtained at high temperature (above, or closely below,the melting point), and that the need for Eq. (31) for func-tionalised diacids would be less for high temperature data.
4.3.3 Including intramolecular group-interactions,evaluation of all molecules
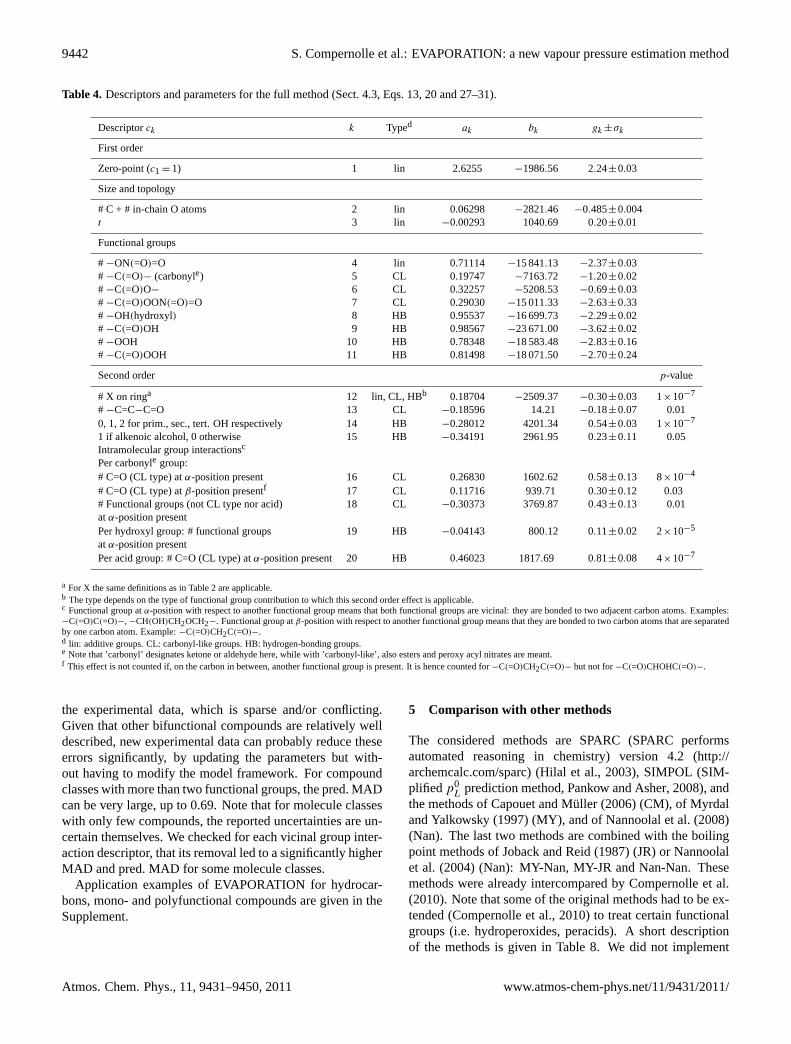
The set of descriptors and associated parameters of the fullmodel is given in Table4. These parameters are fitted to thedata of all compounds (hydrocarbons, monofunctional andpolyfunctional molecules).
The second order effect “X on chain and not at 1 or 2 po-sition”, which was still present for the method described inSect.4.2, was not retained here, as itsgk became very small(∼ 0.01) and itsp-value became very large (∼ 0.5).
Except the “alkenoic alcohol flag”, which is to be countedat most once per molecule, the other second order effects arecounted for each functional group they apply to. Therefore,if applicable, groups 16 and 17 are to be counted twice fordicarbonyls (once for each ketone or aldehyde functionality)and once for carbonyl esters (once for the carbonyl func-tionality, but not for the ester functionality). A moleculewith two carbonyl groups will have a higher vapour pres-sure if these groups are vicinal than if they are at more dis-tant locations in the molecule, because the dipole momentsof both carbonyl groups tend to cancel each other. Exceptfor 2,3-butanedione, there are no room-temperature vapourpressures available of molecules with this structure, and thiscould be a reason why previous estimation methods did nottake this effect into account. It can be illustrated with boilingpoints and with RI (Table5). Both properties indicate thatmolecules with vicinal carbonyl functionalities have a signif-icantly higher volatility than isomers with non-vicinal func-tionalities.
For diesters, we cannot discern a similar effect from thevapour pressure data. This is probably due to the lowerdipole moment of an ester functionality. If a carbonylgroup (ketone, aldehyde) is inβ-position vs. another car-bonyl group, this also leads to a higher vapour pressure.
Table 3. Evaluation of the model for hydrocarbons and monofunc-tional compounds (Sect.4.2, Eqs.13, 19and20).
# Molecules MADb Pred. MADc
Hydrocarbons 130 0.073 0.075Nitrates 23 0.087 0.095Carbonylsa 128 0.064 0.069Ethers 52 0.076 0.078Esters 53 0.043 0.044Peroxides 11 0.389 0.404Peroxy acyl nitrates 5 0.106 0.226Alcohols 120 0.076 0.080Acids 49 0.077 0.080Hydroperoxides 4 0.041 0.099Peracids 4 0.215 0.304All 579 0.071 0.075
a “Carbonyls” designate aldehyde or ketone here.b Mean absolute deviation (Eq.10) andc predicted mean absolute deviation (Eq.12).
This is ascribed to the keto-enol tautomerism, an effect well-known in organic chemistry (e.g.,Burdett and Rogers, 1964),where the keto-form is transformed into the less polar, morevolatile, enolic form.
Intramolecular hydrogen-bonding for diols with vicinalhydroxyl functionalities leads to an increased vapour pres-sure and lower vaporisation enthalpy, as noted byVerevkin(2004). We noticed also for hydroxy carbonyls and hydroxyethers an increase in vapour pressure if the two functionali-ties are vicinal. For hydroxy nitrates, direct vapour pressuredata (seeRoberts(1990) for a compilation) is very sparse(often only a single vapour pressure point) and of question-able accuracy, as vapour pressure was not the target propertyof the respective studies. However, from the RI on hydroxynitrates ofKastler(1999) (see Table6) a decrease in RI (in-creasedp0) is observed if both functionalities are vicinal.Therefore, we introduced one single descriptor for a func-tional group next to an hydroxyl functionality, leading to anincrease in vapour pressure. Data on oxo acids is sparse, butit could nevertheless be concluded thatp0 increases if car-bonyl and acid functionalities are vicinal. For hydroxy acids,no firm conclusions could be drawn in this respect.
We note that the RI data fromKastler (1999); Fischer(1999) on dinitrates suggests that the vicinality of nitratefunctionalities also lead to an increase inp0. The directvapour pressure data does not allow to draw this conclusion,so this effect was not retained in the final model.
For hydrocarbons and monofunctional compounds to-gether, the MAD and pred. MAD are 0.085 and 0.087 re-spectively. This is only slightly higher than as obtained withthe method of Sect.4.2 (see Table3). For bifunctional com-pounds, the model works reasonably well, but with a lowerperformance for dinitrates, diacids, keto acids and hydroxynitrates (Table7). This can at least in part be ascribed to
www.atmos-chem-phys.net/11/9431/2011/ Atmos. Chem. Phys., 11, 9431–9450, 2011
9442 S. Compernolle et al.: EVAPORATION: a new vapour pressure estimation method
Table 4. Descriptors and parameters for the full method (Sect.4.3, Eqs.13, 20and27–31).
Descriptorck k Typed ak bk gk ±σk
First order
Zero-point (c1 = 1) 1 lin 2.6255 −1986.56 2.24±0.03
Size and topology
# C + # in-chain O atoms 2 lin 0.06298 −2821.46 −0.485±0.004t 3 lin −0.00293 1040.69 0.20±0.01
Functional groups
# −ON(=O)=O 4 lin 0.71114 −15 841.13 −2.37±0.03# −C(=O)− (carbonyle) 5 CL 0.19747 −7163.72 −1.20±0.02# −C(=O)O− 6 CL 0.32257 −5208.53 −0.69±0.03# −C(=O)OON(=O)=O 7 CL 0.29030 −15 011.33 −2.63±0.33# −OH(hydroxyl) 8 HB 0.95537 −16 699.73 −2.29±0.02# −C(=O)OH 9 HB 0.98567 −23 671.00 −3.62±0.02# −OOH 10 HB 0.78348 −18 583.48 −2.83±0.16# −C(=O)OOH 11 HB 0.81498 −18 071.50 −2.70±0.24
Second order p-value
# X on ringa 12 lin, CL, HBb 0.18704 −2509.37 −0.30±0.03 1×10⁻⁷
# −C=C−C=O 13 CL −0.18596 14.21 −0.18±0.07 0.010, 1, 2 for prim., sec., tert. OH respectively 14 HB −0.28012 4201.34 0.54±0.03 1×10⁻⁷
1 if alkenoic alcohol, 0 otherwise 15 HB −0.34191 2961.95 0.23±0.11 0.05Intramolecular group interactionsc
Per carbonyle group:# C=O (CL type) atα-position present 16 CL 0.26830 1602.62 0.58±0.13 8×10⁻⁴
# C=O (CL type) atβ-position presentf 17 CL 0.11716 939.71 0.30±0.12 0.03# Functional groups (not CL type nor acid) 18 CL −0.30373 3769.87 0.43±0.13 0.01atα-position presentPer hydroxyl group: # functional groups 19 HB −0.04143 800.12 0.11±0.02 2×10⁻⁵
atα-position presentPer acid group: # C=O (CL type) atα-position present 20 HB 0.46023 1817.69 0.81±0.08 4×10⁻⁷
a For X the same definitions as in Table2 are applicable.b The type depends on the type of functional group contribution to which this second order effect is applicable.c Functional group atα-position with respect to another functional group means that both functional groups are vicinal: they are bonded to two adjacent carbon atoms. Examples:−C(=O)C(=O)−, −CH(OH)CH2OCH2−. Functional group atβ-position with respect to another functional group means that they are bonded to two carbon atoms that are separatedby one carbon atom. Example:−C(=O)CH2C(=O)−.d lin: additive groups. CL: carbonyl-like groups. HB: hydrogen-bonding groups.e Note that ’carbonyl’ designates ketone or aldehyde here, while with ’carbonyl-like’, also esters and peroxy acyl nitrates are meant.f This effect is not counted if, on the carbon in between, another functional group is present. It is hence counted for−C(=O)CH2C(=O)− but not for−C(=O)CHOHC(=O)−.
the experimental data, which is sparse and/or conflicting.Given that other bifunctional compounds are relatively welldescribed, new experimental data can probably reduce theseerrors significantly, by updating the parameters but with-out having to modify the model framework. For compoundclasses with more than two functional groups, the pred. MADcan be very large, up to 0.69. Note that for molecule classeswith only few compounds, the reported uncertainties are un-certain themselves. We checked for each vicinal group inter-action descriptor, that its removal led to a significantly higherMAD and pred. MAD for some molecule classes.
Application examples of EVAPORATION for hydrocar-bons, mono- and polyfunctional compounds are given in theSupplement.
5 Comparison with other methods
The considered methods are SPARC (SPARC performsautomated reasoning in chemistry) version 4.2 (http://archemcalc.com/sparc) (Hilal et al., 2003), SIMPOL (SIM-plified p0
L prediction method,Pankow and Asher, 2008), andthe methods ofCapouet and Muller (2006) (CM), of Myrdaland Yalkowsky(1997) (MY), and ofNannoolal et al.(2008)(Nan). The last two methods are combined with the boilingpoint methods ofJoback and Reid(1987) (JR) orNannoolalet al. (2004) (Nan): MY-Nan, MY-JR and Nan-Nan. Thesemethods were already intercompared byCompernolle et al.(2010). Note that some of the original methods had to be ex-tended (Compernolle et al., 2010) to treat certain functionalgroups (i.e. hydroperoxides, peracids). A short descriptionof the methods is given in Table8. We did not implement
Atmos. Chem. Phys., 11, 9431–9450, 2011 www.atmos-chem-phys.net/11/9431/2011/
S. Compernolle et al.: EVAPORATION: a new vapour pressure estimation method 9443
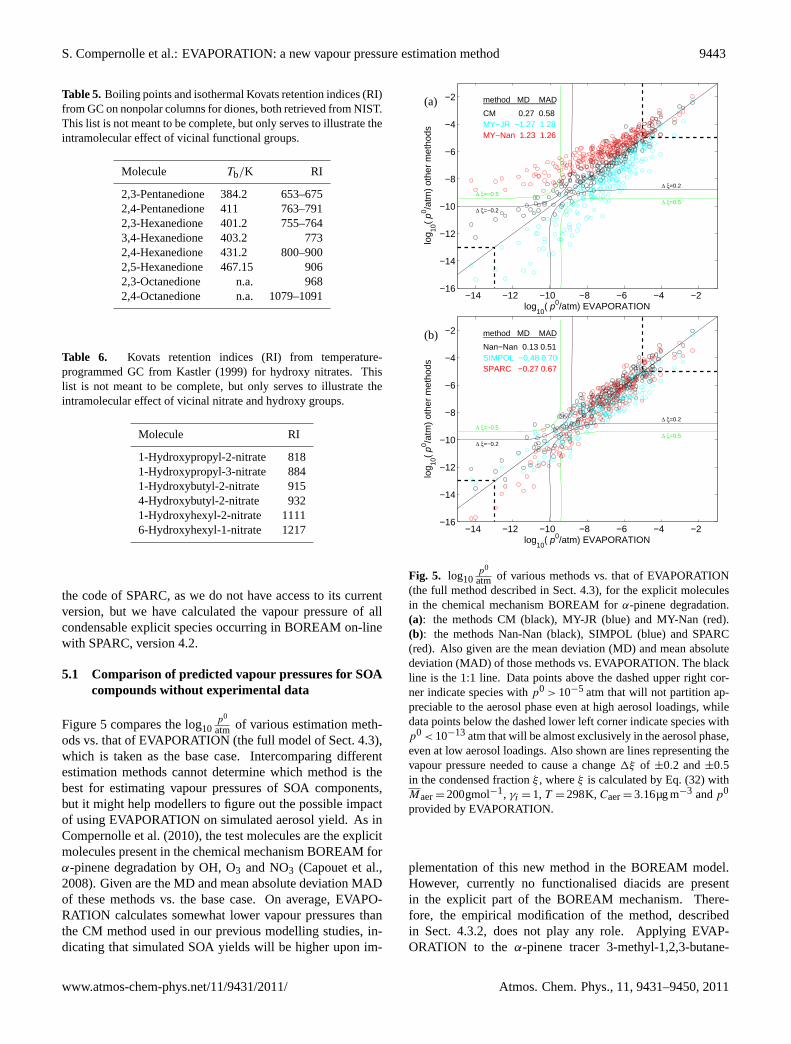
Table 5. Boiling points and isothermal Kovats retention indices (RI)from GC on nonpolar columns for diones, both retrieved from NIST.This list is not meant to be complete, but only serves to illustrate theintramolecular effect of vicinal functional groups.
Molecule Tb/K RI
2,3-Pentanedione 384.2 653–6752,4-Pentanedione 411 763–7912,3-Hexanedione 401.2 755–7643,4-Hexanedione 403.2 7732,4-Hexanedione 431.2 800–9002,5-Hexanedione 467.15 9062,3-Octanedione n.a. 9682,4-Octanedione n.a. 1079–1091
Table 6. Kovats retention indices (RI) from temperature-programmed GC fromKastler (1999) for hydroxy nitrates. Thislist is not meant to be complete, but only serves to illustrate theintramolecular effect of vicinal nitrate and hydroxy groups.
Molecule RI
1-Hydroxypropyl-2-nitrate 8181-Hydroxypropyl-3-nitrate 8841-Hydroxybutyl-2-nitrate 9154-Hydroxybutyl-2-nitrate 9321-Hydroxyhexyl-2-nitrate 11116-Hydroxyhexyl-1-nitrate 1217
the code of SPARC, as we do not have access to its currentversion, but we have calculated the vapour pressure of allcondensable explicit species occurring in BOREAM on-linewith SPARC, version 4.2.
5.1 Comparison of predicted vapour pressures for SOAcompounds without experimental data
Figure5 compares the log10p0
atm of various estimation meth-ods vs. that of EVAPORATION (the full model of Sect.4.3),which is taken as the base case. Intercomparing differentestimation methods cannot determine which method is thebest for estimating vapour pressures of SOA components,but it might help modellers to figure out the possible impactof using EVAPORATION on simulated aerosol yield. As inCompernolle et al.(2010), the test molecules are the explicitmolecules present in the chemical mechanism BOREAM forα-pinene degradation by OH, O3 and NO3 (Capouet et al.,2008). Given are the MD and mean absolute deviation MADof these methods vs. the base case. On average, EVAPO-RATION calculates somewhat lower vapour pressures thanthe CM method used in our previous modelling studies, in-dicating that simulated SOA yields will be higher upon im-
−14 −12 −10 −8 −6 −4 −2−16
−14
−12
−10
−8
−6
−4
−2
log10
( p0/atm) EVAPORATION
log 10
( p0 /a
tm)
othe
r m
etho
ds
method MD MAD________________
CM 0.27 0.58MY−JR −1.27 1.28MY−Nan 1.23 1.26
Δ ξ=0.2
Δ ξ=0.5Δ ξ=−0.2
Δ ξ=−0.5
(a)
−14 −12 −10 −8 −6 −4 −2−16
−14
−12
−10
−8
−6
−4
−2
log10
( p0/atm) EVAPORATION
log 10
( p0 /a
tm)
othe
r m
etho
ds
method MD MAD________________
Nan−Nan 0.13 0.51SIMPOL −0.48 0.70SPARC −0.27 0.67
Δ ξ=0.2
Δ ξ=0.5Δ ξ=−0.2
Δ ξ=−0.5
(b)
Fig. 5. log10p0
atm of various methods vs. that of EVAPORATION(the full method described in Sect.4.3), for the explicit moleculesin the chemical mechanism BOREAM forα-pinene degradation.(a): the methods CM (black), MY-JR (blue) and MY-Nan (red).(b): the methods Nan-Nan (black), SIMPOL (blue) and SPARC(red). Also given are the mean deviation (MD) and mean absolutedeviation (MAD) of those methods vs. EVAPORATION. The blackline is the 1:1 line. Data points above the dashed upper right cor-ner indicate species withp0 > 10−5 atm that will not partition ap-preciable to the aerosol phase even at high aerosol loadings, whiledata points below the dashed lower left corner indicate species withp0 < 10−13atm that will be almost exclusively in the aerosol phase,even at low aerosol loadings. Also shown are lines representing thevapour pressure needed to cause a change1ξ of ±0.2 and±0.5in the condensed fractionξ , whereξ is calculated by Eq. (32) withMaer= 200gmol−1, γi = 1, T = 298K,Caer= 3.16µg m−3 andp0
provided by EVAPORATION.
plementation of this new method in the BOREAM model.However, currently no functionalised diacids are presentin the explicit part of the BOREAM mechanism. There-fore, the empirical modification of the method, describedin Sect. 4.3.2, does not play any role. Applying EVAP-ORATION to the α-pinene tracer 3-methyl-1,2,3-butane-
www.atmos-chem-phys.net/11/9431/2011/ Atmos. Chem. Phys., 11, 9431–9450, 2011
9444 S. Compernolle et al.: EVAPORATION: a new vapour pressure estimation method
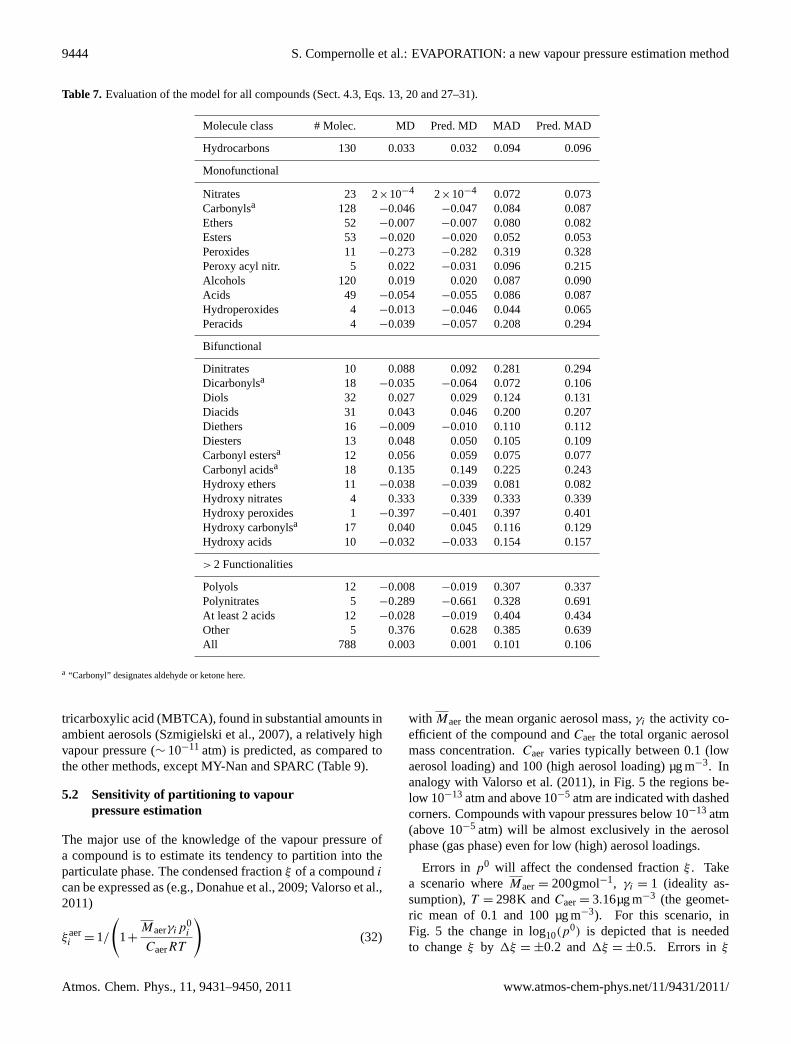
Table 7. Evaluation of the model for all compounds (Sect.4.3, Eqs.13, 20and27–31).
Molecule class # Molec. MD Pred. MD MAD Pred. MAD
Hydrocarbons 130 0.033 0.032 0.094 0.096
Monofunctional
Nitrates 23 2×10⁻⁴ 2×10⁻⁴ 0.072 0.073Carbonylsa 128 −0.046 −0.047 0.084 0.087Ethers 52 −0.007 −0.007 0.080 0.082Esters 53 −0.020 −0.020 0.052 0.053Peroxides 11 −0.273 −0.282 0.319 0.328Peroxy acyl nitr. 5 0.022 −0.031 0.096 0.215Alcohols 120 0.019 0.020 0.087 0.090Acids 49 −0.054 −0.055 0.086 0.087Hydroperoxides 4 −0.013 −0.046 0.044 0.065Peracids 4 −0.039 −0.057 0.208 0.294
Bifunctional
Dinitrates 10 0.088 0.092 0.281 0.294Dicarbonylsa 18 −0.035 −0.064 0.072 0.106Diols 32 0.027 0.029 0.124 0.131Diacids 31 0.043 0.046 0.200 0.207Diethers 16 −0.009 −0.010 0.110 0.112Diesters 13 0.048 0.050 0.105 0.109Carbonyl estersa 12 0.056 0.059 0.075 0.077Carbonyl acidsa 18 0.135 0.149 0.225 0.243Hydroxy ethers 11 −0.038 −0.039 0.081 0.082Hydroxy nitrates 4 0.333 0.339 0.333 0.339Hydroxy peroxides 1 −0.397 −0.401 0.397 0.401Hydroxy carbonylsa 17 0.040 0.045 0.116 0.129Hydroxy acids 10 −0.032 −0.033 0.154 0.157
> 2 Functionalities
Polyols 12 −0.008 −0.019 0.307 0.337Polynitrates 5 −0.289 −0.661 0.328 0.691At least 2 acids 12 −0.028 −0.019 0.404 0.434Other 5 0.376 0.628 0.385 0.639All 788 0.003 0.001 0.101 0.106
a “Carbonyl” designates aldehyde or ketone here.
tricarboxylic acid (MBTCA), found in substantial amounts inambient aerosols (Szmigielski et al., 2007), a relatively highvapour pressure (∼ 10−11 atm) is predicted, as compared tothe other methods, except MY-Nan and SPARC (Table 9).
5.2 Sensitivity of partitioning to vapourpressure estimation
The major use of the knowledge of the vapour pressure ofa compound is to estimate its tendency to partition into theparticulate phase. The condensed fractionξ of a compoundican be expressed as (e.g.,Donahue et al., 2009; Valorso et al.,2011)
ξaeri = 1/
(1+
Maerγip0i
CaerRT
)(32)
with Maer the mean organic aerosol mass,γi the activity co-efficient of the compound andCaer the total organic aerosolmass concentration.Caer varies typically between 0.1 (lowaerosol loading) and 100 (high aerosol loading) µg m−3. Inanalogy withValorso et al.(2011), in Fig. 5 the regions be-low 10−13 atm and above 10−5 atm are indicated with dashedcorners. Compounds with vapour pressures below 10−13 atm(above 10−5 atm) will be almost exclusively in the aerosolphase (gas phase) even for low (high) aerosol loadings.
Errors in p0 will affect the condensed fractionξ . Takea scenario whereMaer= 200gmol−1, γi = 1 (ideality as-sumption),T = 298K andCaer= 3.16µg m−3 (the geomet-ric mean of 0.1 and 100 µg m−3). For this scenario, inFig. 5 the change in log10(p
0) is depicted that is neededto changeξ by 1ξ = ±0.2 and1ξ = ±0.5. Errors inξ
Atmos. Chem. Phys., 11, 9431–9450, 2011 www.atmos-chem-phys.net/11/9431/2011/
S. Compernolle et al.: EVAPORATION: a new vapour pressure estimation method 9445
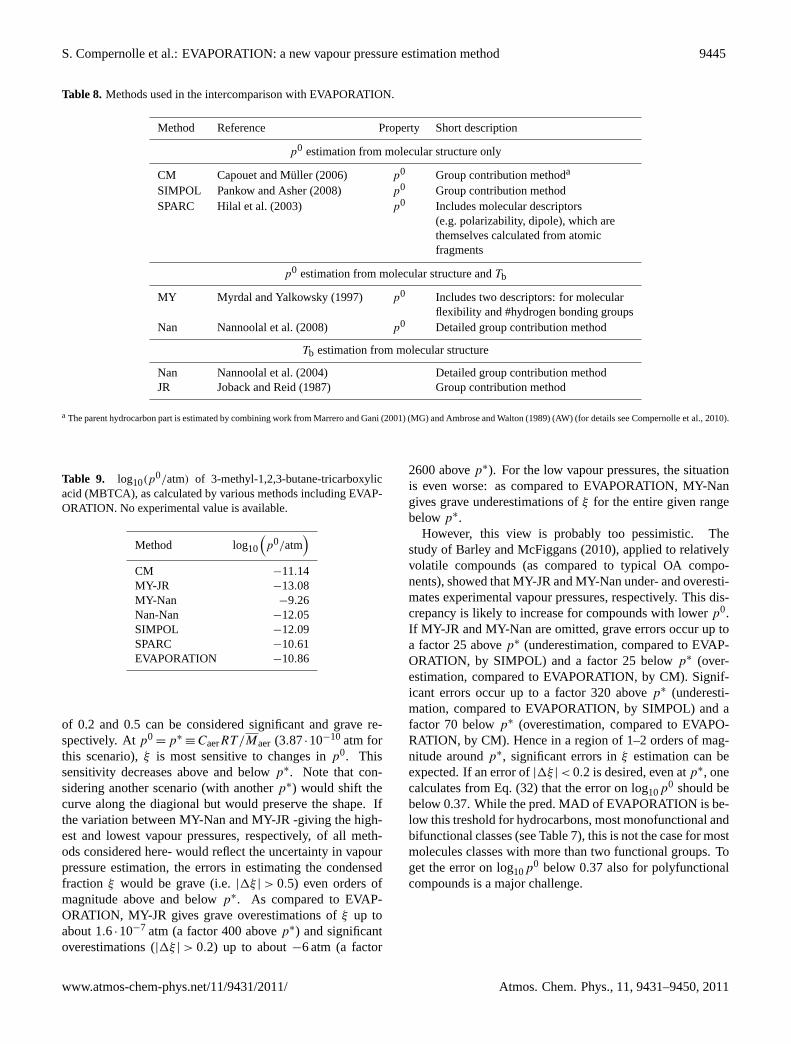
Table 8. Methods used in the intercomparison with EVAPORATION.
Method Reference Property Short description
p0 estimation from molecular structure only
CM Capouet and Muller (2006) p0 Group contribution methoda
SIMPOL Pankow and Asher(2008) p0 Group contribution methodSPARC Hilal et al. (2003) p0 Includes molecular descriptors
(e.g. polarizability, dipole), which arethemselves calculated from atomicfragments
p0 estimation from molecular structure andTb
MY Myrdal and Yalkowsky(1997) p0 Includes two descriptors: for molecularflexibility and #hydrogen bonding groups
Nan Nannoolal et al.(2008) p0 Detailed group contribution method
Tb estimation from molecular structure
Nan Nannoolal et al.(2004) Detailed group contribution methodJR Joback and Reid(1987) Group contribution method
a The parent hydrocarbon part is estimated by combining work fromMarrero and Gani(2001) (MG) andAmbrose and Walton(1989) (AW) (for details seeCompernolle et al., 2010).
Table 9. log10(p0/atm) of 3-methyl-1,2,3-butane-tricarboxylic
acid (MBTCA), as calculated by various methods including EVAP-ORATION. No experimental value is available.
Method log10
(p0/atm
)CM −11.14MY-JR −13.08MY-Nan −9.26Nan-Nan −12.05SIMPOL −12.09SPARC −10.61EVAPORATION −10.86
of 0.2 and 0.5 can be considered significant and grave re-spectively. Atp0
= p∗≡ CaerRT/Maer (3.87·10−10 atm for
this scenario),ξ is most sensitive to changes inp0. Thissensitivity decreases above and belowp∗. Note that con-sidering another scenario (with anotherp∗) would shift thecurve along the diagional but would preserve the shape. Ifthe variation between MY-Nan and MY-JR -giving the high-est and lowest vapour pressures, respectively, of all meth-ods considered here- would reflect the uncertainty in vapourpressure estimation, the errors in estimating the condensedfraction ξ would be grave (i.e.|1ξ | > 0.5) even orders ofmagnitude above and belowp∗. As compared to EVAP-ORATION, MY-JR gives grave overestimations ofξ up toabout 1.6·10−7 atm (a factor 400 abovep∗) and significantoverestimations (|1ξ | > 0.2) up to about−6 atm (a factor
2600 abovep∗). For the low vapour pressures, the situationis even worse: as compared to EVAPORATION, MY-Nangives grave underestimations ofξ for the entire given rangebelowp∗.
However, this view is probably too pessimistic. Thestudy ofBarley and McFiggans(2010), applied to relativelyvolatile compounds (as compared to typical OA compo-nents), showed that MY-JR and MY-Nan under- and overesti-mates experimental vapour pressures, respectively. This dis-crepancy is likely to increase for compounds with lowerp0.If MY-JR and MY-Nan are omitted, grave errors occur up toa factor 25 abovep∗ (underestimation, compared to EVAP-ORATION, by SIMPOL) and a factor 25 belowp∗ (over-estimation, compared to EVAPORATION, by CM). Signif-icant errors occur up to a factor 320 abovep∗ (underesti-mation, compared to EVAPORATION, by SIMPOL) and afactor 70 belowp∗ (overestimation, compared to EVAPO-RATION, by CM). Hence in a region of 1–2 orders of mag-nitude aroundp∗, significant errors inξ estimation can beexpected. If an error of|1ξ | < 0.2 is desired, even atp∗, onecalculates from Eq. (32) that the error on log10p
0 should bebelow 0.37. While the pred. MAD of EVAPORATION is be-low this treshold for hydrocarbons, most monofunctional andbifunctional classes (see Table7), this is not the case for mostmolecules classes with more than two functional groups. Toget the error on log10p
0 below 0.37 also for polyfunctionalcompounds is a major challenge.
www.atmos-chem-phys.net/11/9431/2011/ Atmos. Chem. Phys., 11, 9431–9450, 2011
9446 S. Compernolle et al.: EVAPORATION: a new vapour pressure estimation method
-2
-1
0
1
2MY-JR
SIMPOL
CM
Nan-Nan
MY-Nan
EVAPORATION
(a)
0
0.5
1
1.5
2
MY-JR
SIMPOL
CM
Nan-Nan
MY-Nan
EVAPORATION
(b)
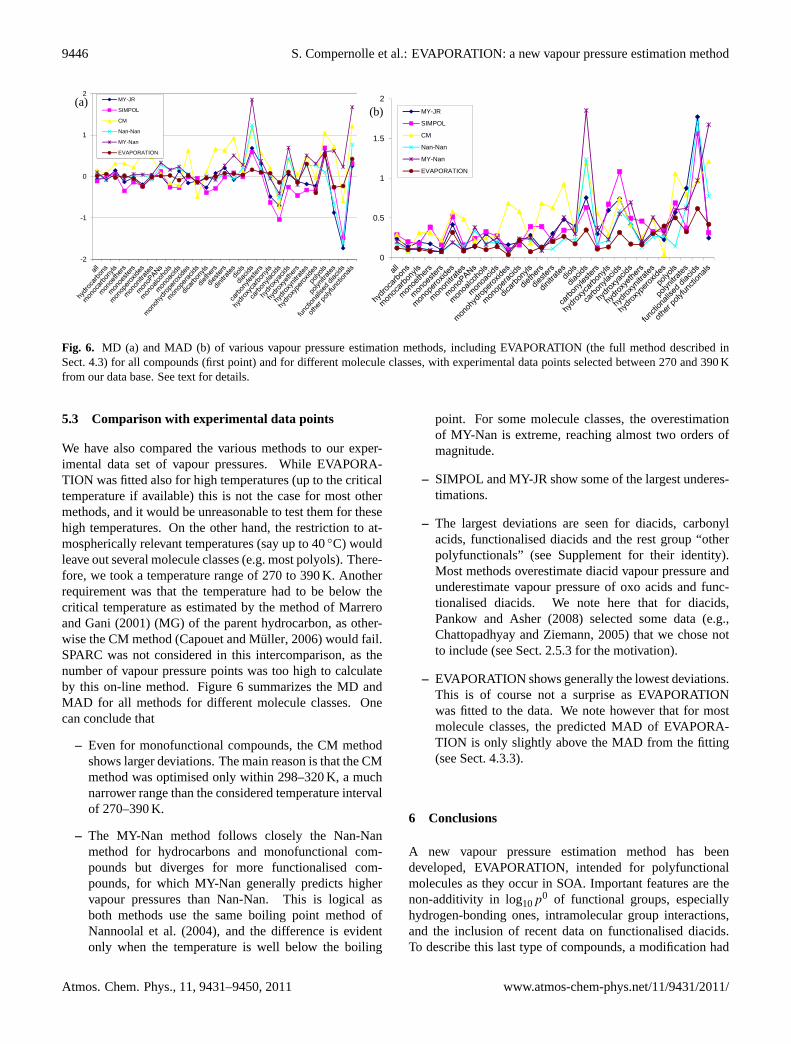
Fig. 6. MD (a) and MAD (b) of various vapour pressure estimation methods, including EVAPORATION (the full method described inSect.4.3) for all compounds (first point) and for different molecule classes, with experimental data points selected between 270 and 390 Kfrom our data base. See text for details.
5.3 Comparison with experimental data points
We have also compared the various methods to our exper-imental data set of vapour pressures. While EVAPORA-TION was fitted also for high temperatures (up to the criticaltemperature if available) this is not the case for most othermethods, and it would be unreasonable to test them for thesehigh temperatures. On the other hand, the restriction to at-mospherically relevant temperatures (say up to 40◦C) wouldleave out several molecule classes (e.g. most polyols). There-fore, we took a temperature range of 270 to 390 K. Anotherrequirement was that the temperature had to be below thecritical temperature as estimated by the method ofMarreroand Gani(2001) (MG) of the parent hydrocarbon, as other-wise the CM method (Capouet and Muller, 2006) would fail.SPARC was not considered in this intercomparison, as thenumber of vapour pressure points was too high to calculateby this on-line method. Figure6 summarizes the MD andMAD for all methods for different molecule classes. Onecan conclude that
– Even for monofunctional compounds, the CM methodshows larger deviations. The main reason is that the CMmethod was optimised only within 298–320 K, a muchnarrower range than the considered temperature intervalof 270–390 K.
– The MY-Nan method follows closely the Nan-Nanmethod for hydrocarbons and monofunctional com-pounds but diverges for more functionalised com-pounds, for which MY-Nan generally predicts highervapour pressures than Nan-Nan. This is logical asboth methods use the same boiling point method ofNannoolal et al.(2004), and the difference is evidentonly when the temperature is well below the boiling
point. For some molecule classes, the overestimationof MY-Nan is extreme, reaching almost two orders ofmagnitude.
– SIMPOL and MY-JR show some of the largest underes-timations.
– The largest deviations are seen for diacids, carbonylacids, functionalised diacids and the rest group “otherpolyfunctionals” (see Supplement for their identity).Most methods overestimate diacid vapour pressure andunderestimate vapour pressure of oxo acids and func-tionalised diacids. We note here that for diacids,Pankow and Asher(2008) selected some data (e.g.,Chattopadhyay and Ziemann, 2005) that we chose notto include (see Sect.2.5.3for the motivation).
– EVAPORATION shows generally the lowest deviations.This is of course not a surprise as EVAPORATIONwas fitted to the data. We note however that for mostmolecule classes, the predicted MAD of EVAPORA-TION is only slightly above the MAD from the fitting(see Sect.4.3.3).
6 Conclusions
A new vapour pressure estimation method has beendeveloped, EVAPORATION, intended for polyfunctionalmolecules as they occur in SOA. Important features are thenon-additivity in log10p
0 of functional groups, especiallyhydrogen-bonding ones, intramolecular group interactions,and the inclusion of recent data on functionalised diacids.To describe this last type of compounds, a modification had
Atmos. Chem. Phys., 11, 9431–9450, 2011 www.atmos-chem-phys.net/11/9431/2011/
S. Compernolle et al.: EVAPORATION: a new vapour pressure estimation method 9447
to be introduced, effectively limiting the number of groupswhich are taken into account. We cannot provide a straight-forward explanation for this behaviour. Although there isless data on functionalised diacids than on diacids, it is alsoin this case clear that important differences exist between dif-ferent reference sources. E.g. sublimation pressure data for2-oxoglutaric acid can differ by almost two orders of magni-tude between different reference sources (Booth et al., 2010;Chattopadhyay and Ziemann, 2005; Frosch et al., 2010).If the experimental methodology ofSoonsin et al.(2010),with the use of mixtures with water, were applied to obtainvapour pressures of functionalised diacids, the divergencewould likely increase, as their sublimation pressure data fordiacids is the lowest available. Counter-intuitively, the sub-cooled liquid data -calculated from sublimation pressures- ofBooth et al.(2010) suggest that citric and tartaric acid havehigher vapour pressures than adipic and succinic acid re-spectively although they have more polar groups. The high-temperature (above the melting point) liquid vapour pressuredata ofYaws(1994) however suggest the reverse. Moreover,the data ofYaws (1994) on functionalised diacids, and ofESDU on diacids, after bold extrapolation, does obey the1Hv vs. log10(p
0) correlation at 298 K already establishedfor a wide variety of compounds (MacLeod et al., 2007; Ep-stein et al., 2010). Most ambient temperature data on diacidsand functionalised diacids does not (except e.g.Cappa et al.,2007). One possible explanation is that there are problemswith the measurements. More light can hopefully be shedon this issue by the measurement of high-temperature (abovethe melting point) liquid vapour pressure of other function-alised diacids. Also confirmation of the data ofYaws(1994)is desired, as this is a secondary source with no details on theexperimental procedure. The high-temperature liquid vapourpressures should be relatively reliable: no solid to subcooledliquid (e.g.,Booth et al., 2010) or mixture to pure liquid con-version (e.g.,Riipinen et al., 2007) would be needed, and thevapour pressure should be more accurately measurable at thishigher temperature. Also room temperature measurement ofsubcooled liquid vapour pressure of functionalised diacids bythe methodology ofSoonsin et al.(2010) can provide moreinsight, by comparing it with the existing solid vapour pres-sure data.
Vapour pressures of zero-, mono- and bifunctional com-pounds can be reasonably well predicted by EVAPORA-TION, while it performs worse for molecules with morefunctional groups but still better than other methods. Thiscan at least in part be attributed to the fact that experi-mental error on the vapour pressures of these compounds ishigher, evidenced by the disagreement between different ref-erence sources in the case of diacids. On the other hand,it is to be expected that our -still relatively simple- modeldoes not grasp completely the complex group-group inter-actions. However, to develop more detailed models, addi-tional and more accurate data is a prerequisite. Within thepresent framework of EVAPORATION, better performance
can be reached if more data is collected for these moleculeclasses with currently limited data availability (e.g. peracids,hydroxy nitrates).
Supplementary material related to thisarticle is available online at:http://www.atmos-chem-phys.net/11/9431/2011/acp-11-9431-2011-supplement.pdf.
Acknowledgements.This work was supported by the projectsIBOOT (SD/AT/03B, 2006–2010) and BIOSOA (SD/CS/05A,2011-2014) funded by the Belgian Science Policy Office.
Edited by: B. Ervens
References
Aldrich: Catalog Handbook of Fine Chemicals, Aldrich ChemicalCompany, Inc., Milwaukee, WI, USA, 1990.
Ambrose, D. and Walton, J.: Vapour pressures up to their criti-cal temperatures of normal alkanes and 1-alkanols, Pure Appl.Chem., 61, 1395–1403, 1989.
Asher, W. E. and Pankow, J. F.: Vapor pressure prediction foralkenoic and aromatic organic compounds by a UNIFAC-basedgroup contribution method, Atmos. Environ., 40, 3588–3600,2006.
Asher, W. E., Pankow, J. F., Erdakos, G. B., and Seinfeld, J. H.:Estimating the vapor pressures of multi-functional oxygen-containing organic compounds using group contribution meth-ods, Atmos. Environ., 36, 1483–1498, 2002.
Aumont, B., Szopa, S., and Madronich, S.: Modelling the evolutionof organic carbon during its gas-phase tropospheric oxidation:development of an explicit model based on a self generating ap-proach, Atmos. Chem. Phys., 5, 2497–2517,doi:10.5194/acp-5-2497-2005, 2005.
Barley, M. H. and McFiggans, G.: The critical assessment of vapourpressure estimation methods for use in modelling the formationof atmospheric organic aerosol, Atmos. Chem. Phys., 10, 749–767,doi:10.5194/acp-10-749-2010, 2010.
Besalu, E.: Fast computation of cross-validated properties in fulllinear leave-many-out procedures, J. Math. Chem., 29, 191–204,2001.
Bilde, M. and Pandis, S. N.: Evaporation rates and vapor pressuresof individual aerosol species formed in the atmospheric oxida-tion of α- andβ-pinene, Environ. Sci. Technol., 35, 3344–3349,2001.
Bilde, M., Svenningsson, B., Monster, J., and Rosenorn, T.: Even-odd alternation of evaporation rates and vapor pressures of C3–C9 dicarboxylic acid aerosols, Environ. Sci. Technol., 37, 1371–1378, 2003.
Booth, A. M., Barley, M. H., Topping, D. O., McFiggans, G.,Garforth, A., and Percival, C. J.: Solid state and sub-cooledliquid vapour pressures of substituted dicarboxylic acids usingKnudsen Effusion Mass Spectrometry (KEMS) and Differential
www.atmos-chem-phys.net/11/9431/2011/ Atmos. Chem. Phys., 11, 9431–9450, 2011
9448 S. Compernolle et al.: EVAPORATION: a new vapour pressure estimation method
Scanning Calorimetry, Atmos. Chem. Phys., 10, 4879–4892,doi:10.5194/acp-10-4879-2010, 2010.
Booth, A. M., Montague, W. J., Barley, M. H., Topping, D. O., Mc-Figgans, G., Garforth, A., and Percival, C. J.: Solid state and sub-cooled liquid vapour pressures of cyclic aliphatic dicarboxylicacids, Atmos. Chem. Phys., 11, 655–665,doi:10.5194/acp-11-655-2011, 2011.
Bruckmann, P. W. and Willner, H.: Infrared spectroscopic studyof peroxyacetyl nitrate (PAN) and its decomposition products,Environ. Sci. Technol., 17, 352–357, 1983.
Burdett, J. L. and Rogers, M. T.: Keto-enol tautomerismin β-dicarbonyls studied by nuclear magnetic resonancespectroscopy.1 I. Proton chemical shifts and equilibrium con-stants of pure compounds, J. Am. Chem. Soc., 86, 2105–2109,1964.
Capouet, M. and Muller, J.-F.: A group contribution method forestimating the vapour pressures ofα-pinene oxidation products,Atmos. Chem. Phys., 6, 1455–1467,doi:10.5194/acp-6-1455-2006, 2006.
Capouet, M., Muller, J.-F., Ceulemans, K., Compernolle, S.,Vereecken, L., and Peeters, J.: Modeling aerosol formation inalpha-pinene photooxidation experiments, J. Geophys. Res., 113,D02308, 2008.
Cappa, C. D. and Wilson, K. R.: Evolution of organic aerosol massspectra upon heating: implications for OA phase and partitioningbehavior, Atmos. Chem. Phys., 11, 1895–1911,doi:10.5194/acp-11-1895-2011, 2011.
Cappa, C. D., Lovejoy, E. R., and Ravishankara, A. R.: Determina-tion of evaporation rates and vapor pressures of very low volatil-ity compounds: A study of the C-4–C-10 and C-12 dicarboxylicacids, J. Phys. Chem. A, 111, 3099–3109, 2007.
Ceulemans, K., Compernolle, S., Peeters, J., and Muller, J.-F.: Eval-uation of a detailed model of secondary organic aerosol forma-tion from [alpha]-pinene against dark ozonolysis experiments,Atmos. Environ., 40, 5434–5442, 2010.
Chattopadhyay, S. and Ziemann, P. J.: Vapor pressures of substi-tuted and unsubstituted monocarboxylic and dicarboxylic acidsmeasured using an improved thermal desorption particle beammass spectrometry method, Aerosol Sci. Technol., 39, 1085–1100, 2005.
Compernolle, S., Ceulemans, K., and Muller, J.-F.: TechnicalNote: Vapor pressure estimation methods applied to secondaryorganic aerosol constituents fromα-pinene oxidation: an in-tercomparison study, Atmos. Chem. Phys., 10, 6271–6282,doi:10.5194/acp-10-6271-2010, 2010.
Compernolle, S., Ceulemans, K., and Muller, J.-F.: Techni-cal Note: Estimating fusion properties for polyacids, Atmos.Chem. Phys. Discuss., 11, 7535–7553,doi:10.5194/acpd-11-7535-2011, 2011a.
Compernolle, S., Ceulemans, K., and Muller, J.-F.: Estimating fu-sion properties for functionalised acids, Atmos. Chem. Phys., 11,8385–8394,doi:10.5194/acp-11-8385-2011, 2011b.
Donahue, N. M., Robinson, A. L., and Pandis, S. N.: Atmosphericorganic particulate matter: From smoke to secondary organicaerosol, Atmos. Environ., 43, 94–106, 2009.
Dykyj, J., Svoboda, J., Wilhoit, R. C., Frenkel, M., and Hall, K. R.:Vapor Pressure and Antoine Constants for Hydrocarbons, and S,Se, Te, and Halogen Containing Organic Compounds Landolt-Bernstein: Numerical Data and Functional Relationships in Sci-
ence and Technology, 20A, Springer, Berlin, Heidelberg, Ger-many, 1999.
Egerton, A. C., Emte, W., and Minkoff, G. J.: Some properties oforganic peroxides, Discuss. Faraday Soc., 10, 278–282, 1951.
Epstein, S. A., Riipinen, I., and Donahue, N. M.: A semiempiricalcorrelation between enthalpy of vaporization and saturation con-centration for organic aerosol, Environ. Sci. Technol., 44, 743–748, 2010.
ESDU: Engineering Sciences Data Unit Ltd: Vapour pressures andcritical points of liquids, ESDU International, 1995, 2001.
Everitt, B. S.: The Cambridge Dictionary of Statistics, CambridgeUniversity Press, Cambridge, UK, 4th edn., 127–128, 2010.
Fischer, R. G.: Vorkommen und Umweltverhalten der C1–C10 or-ganischen Nitrate in kontinentaler und mariner Luft, Ph.D. thesis,Abteilung Analytische Chemie und Umweltchemie, UniversitatUlm, http://vts.uni-ulm.de/docs/1999/355/vts355.pdf, 1999.
Fischer, R. C., Wittlinger, R., and Ballschmiter, K.: Retention-indexbased vapor pressure estimation for polychlorobiphenyl (PCB)by gas chromatography, Fresenius J. Anal. Chem., 342, 421–425,1992.
Frosch, M., Zardini, A. A., Platt, S. M., Muller, L., Reinnig, M.-C., Hoffmann, T., and Bilde, M.: Thermodynamic properties andcloud droplet activation of a series of oxo-acids, Atmos. Chem.Phys., 10, 5873–5890,doi:10.5194/acp-10-5873-2010, 2010.
Hilal, S. H., Karickhoff, S. W., and Carreira, L. A.: Prediction of thevapor pressure boiling point, heat of vaporization and diffusioncoefficient of organic compounds, Qsar Comb. Sci., 22, 565–574,2003.
Jenkin, M. E., Saunders, S. M., and Pilling, M. J.: The troposphericdegradation of volatile organic compounds: a protocol for mech-anism development, Atmos. Environ., 31, 81–104, 1997.
Joback, K. and Reid, R.: Estimation of pure-component propertiesfrom group-contributions, Chem. Eng. Commun., 57, 233–243,1987.
Kacmarek, A. J., Solomon, I. J., and Lustig, M.: Preparation andproperties of peroxyacetyl nitrate, J. Inorg. Nucl. Chem., 40,574–576, 1978.
Kames, J. and Schurath, U.: Henry’s law and hydrolysis-rate con-stants for peroxyacyl nitrates (PANs) using a homogeneous gas-phase source, J. Atmos. Chem., 21, 151–164, 1995.
Kastler, J.: Analytik, Massenspektrometrie und Vorkommen mul-tifunktioneller Alkylnitrate in belasteter und unbelasteter At-mosphare, Ph.D. thesis, Abteilung Analytische Chemie undUmweltchemie, Universitat Ulm, 1999.
KDB: Korean thermophysical properties Data Bank,http://www.cheric.org/kdb/, last access: 2009–2010.
Korsten, H.: Internally consistent prediction of vapor pressure andrelated properties, Ind. Eng. Chem. Res., 39, 813–820, 2000.
Lide, D. R. (Ed.): CRC Handbook of Chemistry and Physics, 80thedn., CRC Press, Boca Raton, FL, USA, 2000.
Linstrom, P. and Mallard, W. (Eds.): NIST Chemistry WebBook,NIST Standard Reference Database Number 69, National In-stitute of Standards and Technology, Gaithersburg MD, 20899,http://webbook.nist.gov/chemistry/, last access: 2009–2010.
MacLeod, M., Scheringer, M., and Hungerbuhler, K.: Estimatingenthalpy of vaporization from vapor pressure using Trouton’srule, Environ. Sci. Technol., 41, 2827–2832, 2007.
Marrero, J. and Gani, R.: Group-contribution based estimation ofpure component properties, Fluid Phase Equilibr., 183–184, 183–
Atmos. Chem. Phys., 11, 9431–9450, 2011 www.atmos-chem-phys.net/11/9431/2011/
S. Compernolle et al.: EVAPORATION: a new vapour pressure estimation method 9449
208, 2001.Miyamoto, S., Nakamura, S., Iwai, Y., and Arai, Y.: Measure-
ment of vapor-phase compressibility factors of monocarboxylicacids using a flow-type apparatus and their association constants,J. Chem. Eng. Data, 44, 48–51, 1999.
Moller, B.: Addendum to the method of Moller et al., in preparation,2011.
Monster, J., Rosenorn, T., Svenningsson, B., and Bilde, M.:Evaporation of methyl- and dimethyl-substituted malonic, suc-cinic, glutaric and adipic acid particles at ambient temperatures,J. Aerosol Sci., 35, 1453–1465, 2004.
Moller, B., Rarey, J., and Ramjugernath, D.: Estimation of thevapour pressure of non-electrolyte organic compounds via groupcontributions and group interactions, J. Mol. Liq., 143, 52–63,2008.
Myrdal, P. B. and Yalkowsky, S. H.: Estimating pure componentvapor pressures of complex organic molecules, Ind. Eng. Chem.Res., 36, 2494–2499, 1997.
Nannoolal, Y., Rarey, J., Ramjugernath, D., and Cordes, W.: Esti-mation of pure component properties: Part 1. Estimation of thenormal boiling point of non-electrolyte organic compounds viagroup contributions and group interactions, Fluid Phase Equilib.,226, 45–63, 2004.
Nannoolal, Y., Rarey, J., and Ramjugernath, D.: Estimation of purecomponent properties: Part 3. Estimation of the vapor pressure ofnon-electrolyte organic compounds via group contributions andgroup interactions, Fluid Phase Equilibr., 269, 117–133, 2008.
Pankow, J. F.: An absorption model of the gas/aerosol partitioninginvolved in the formation of secondary organic aerosol, Atmos.Environ., 28, 189–193, 1994.
Pankow, J. F. and Asher, W. E.: SIMPOL.1: a simple groupcontribution method for predicting vapor pressures and en-thalpies of vaporization of multifunctional organic compounds,Atmos. Chem. Phys., 8, 2773–2796,doi:10.5194/acp-8-2773-2008, 2008.
Poling, B. E., Prausnitz, J. M., and O’Connell, J. P.: The propertiesof gases and liquids, McGraw-Hill, New York, USA, 5th edn.,A.47–A.60, 2001.
Pope, F. D., Tong, H.-J., Dennis-Smither, B. J., Griffiths, P. T.,Clegg, S. L., Reid, J. P., and Cox, R. A.: Studies of single aerosolparticles containing malonic acid, glutaric acid, and their mix-tures with sodium chloride. II. Liquid-state vapor pressures ofthe acids, J. Phys. Chem. A, 114, 10156–10165, 2010.
Prausnitz, J. M., Lichtenthaler, R. N., and de Azevedo, E. G.:Molecular Thermodynamics of Fluid-Phase Equilibria, 3rd edn.,Prentice-Hall PTR, Upper Saddle River, New Jersey 07458,1999.
Raventos-Duran, T., Camredon, M., Valorso, R., Mouchel-Vallon, C., and Aumont, B.: Structure-activity relationshipsto estimate the effective Henry’s law constants of organicsof atmospheric interest, Atmos. Chem. Phys., 10, 7643–7654,doi:10.5194/acp-10-7643-2010, 2010.
Ribeiro da Silva, M. A. V., Monte, M. J. S., and Ribeiro, J. R.:Vapour pressures and the enthalpies and entropies of sublimationof five dicarboxylic acids, J. Chem. Thermodyn., 31, 1093–1107,1999.
Ribeiro da Silva, M. A. V., Monte, M. J. S., and Ribeiro, J. R.:Standard enthalpies, entropies, and Gibbs functions of sublima-tion of four alkyl-substituted malonic acids, J. Chem. Eng. Data,45, 756–759, 2000.
Ribeiro da Silva, M. A. V., Monte, M. J. S., and Ribeiro, J. R.:Thermodynamic study on the sublimation of succinic acid andof methyl- and dimethyl-substituted succinic and glutaric acids,J. Chem. Thermodyn., 33, 23–31, 2001.
Riipinen, I., Koponen, I., Frank, G., Hyvarinen, A.-P., Vanhanen, J.,Lihavainen, H., Lehtinen, K., Bilde, M., and Kulmala, M.:Adipic and malonic acid aqueous solutions: surface tensions andsaturation vapor pressures, J. Phys. Chem. A, 111, 12995–13002,2007.
Roberts, J. M.: The atmospheric chemistry of organic nitrates, At-mos. Environ., 24, 243–287, 1990.
Roux, M. V., Temprado, M., and Chickos, J. S.: Vaporization, fu-sion and sublimation enthalpies of the dicarboxylic acids fromC4 to C14 and C16, J. Chem. Thermodyn., 37, 941–953, 2005.
Salo, K., Jonsson,A. M., Andersson, P. U., and Hallquist, M.:Aerosol volatility and enthalpy of sublimation of carboxylicacids, J. Phys. Chem. A, 114, 4586–4594, 2010.
Sanchez, J. and Myers, T. N.: Peroxides and Peroxide Compounds,Organic Peroxides, vol. 18 of Kirk-Othmer Encyclopedia ofChemical Technology, 4th edn., Wiley, New York, USA, 2000.
Sander, R.: Compilation of Henry’s Law Constants for Inorganicand Organic Species of Potential Importance in Environmen-tal Chemistry, Public Report,http://www.rolf-sander.net/henry/henry.pdf, 1999.
Saunders, S. M., Jenkin, M. E., Derwent, R. G., and Pilling, M. J.:Protocol for the development of the Master Chemical Mech-anism, MCM v3 (Part A): tropospheric degradation of non-aromatic volatile organic compounds, Atmos. Chem. Phys., 3,161–180,doi:10.5194/acp-3-161-2003, 2003.
Soonsin, V., Zardini, A. A., Marcolli, C., Zuend, A., andKrieger, U. K.: The vapor pressures and activities of di-carboxylic acids reconsidered: the impact of the physicalstate of the aerosol, Atmos. Chem. Phys., 10, 11753–11767,doi:10.5194/acp-10-11753-2010, 2010.
Stein, S. E. and Brown, R. L.: Estimation of normal boiling pointsfrom group contributions, J. Chem. Inf. Comput. Sci., 34, 581–587, 1994.
Szmigielski, R., Surratt, J. D., Gomez-Gonzalez, Y., Van derVeken, P., Kourtchev, I., Vermeylen, R., Blockhuys, F., Jaoui, M.,Kleindienst, T. E., Lewandowski, M., Offenberg, J. H., Ed-ney, E. O., Seinfeld, J. H., Maenhaut, W., and Claeys, M.: 3-methyl-1,2,3-butanetricarboxylic acid: An atmospheric tracerfor terpene secondary organic aerosol, Geophys. Res. Lett., 34,L24811,doi:10.1029/2007GL031338, 2007.
Valorso, R., Aumont, B., Camredon, M., Raventos-Duran, T.,Mouchel-Vallon, C., Ng, N. L., Seinfeld, J. H., Lee-Taylor, J.,and Madronich, S.: Explicit modelling of SOA formation fromα-pinene photooxidation: sensitivity to vapour pressure estima-tion, Atmos. Chem. Phys., 11, 6895–6910,doi:10.5194/acp-11-6895-2011, 2011.
Verevkin, S. P.: Determination of vapor pressures and enthalpies ofvaporization of 1,2-alkanediols, Fluid Phase Equilibr., 224, 23–29, 2004.
www.atmos-chem-phys.net/11/9431/2011/ Atmos. Chem. Phys., 11, 9431–9450, 2011

9450 S. Compernolle et al.: EVAPORATION: a new vapour pressure estimation method
Weast, R. and Grasselli, J.: CRC Handbook of Data on OrganicCompounds, CRC Press, Inc., Boca Raton, FL, 2nd edn., 1989.
Yaws, C. L.: Handbook of Vapor Pressure, Gulf Publishing Com-pany, Houston, USA, 1994.
Zardini, A. A., Krieger, U. K., and Marcolli, C.: White light Mieresonance spectroscopy used to measure very low vapor ressuresof substances in aqueous solution aerosol particles, Opt. Express,14, 6951–6962, 2006.
Atmos. Chem. Phys., 11, 9431–9450, 2011 www.atmos-chem-phys.net/11/9431/2011/