evapotranspiration measurements in an oasis cropland · (li et al., 2013; kool et al., 2014;...
TRANSCRIPT

Em
Xa
Sb
c
d
a
ARR2AA
KEHIIS
1
iCwTRt2Vader
h0
Agricultural and Forest Meteorology 230–231 (2016) 89–96
Contents lists available at ScienceDirect
Agricultural and Forest Meteorology
j our na l ho me page: www.elsev ier .com/ locate /agr formet
vapotranspiration partitioning through in-situ oxygen isotopeeasurements in an oasis cropland
uefa Wena,∗, Bin Yanga,b, Xiaomin Suna, Xuhui Leec,d
Key Laboratory of Ecosystem Network Observation and Modeling, Institute of Geographic Sciences and Natural Resources Research, Chinese Academy ofciences, Beijing 100101, ChinaUniversity of Chinese Academy of Sciences, Beijing 100049, ChinaYale-NUIST Center on Atmospheric Environment, Nanjing University of Information Science & Technology, Nanjing 210044, ChinaSchool of Forestry and Environmental Studies, Yale University, New Haven, CT 06511, USA
r t i c l e i n f o
rticle history:eceived 9 July 2015eceived in revised form5 November 2015ccepted 6 December 2015vailable online 24 December 2015
eywords:vapotranspiration partitioningiWATER program
sotope ratio infrared spectroscopy (IRIS)sotopic steady state (ISS)
a b s t r a c t
The oxygen isotope compositions of ecosystem water pools and fluxes are useful tracers in the watercycle. As part of the Heihe Watershed Allied Telemetry Experimental Research (HiWATER) program,high-frequency and near-continuous in situ measurements of 18O composition of atmospheric vapor(ıv) and of evapotranspiration (ıET) were made with the flux-gradient method using a cavity ring-downspectroscopy water vapor isotope analyzer. At the sub-daily scale, we found, in conjunction with intensiveisotopic measurements of other ecosystem water pools, that the differences between 18O composition oftranspiration (ıT) and of xylem water (ıx) were negligible in early afternoon (13:00–15:00 Beijing time)when ET approached the daytime maximum, indicating isotopic steady state. At the daily scale, for thepurpose of flux partitioning, ıT was approximated by ıx at early afternoon hours, and the 18O compositionof soil evaporation (ıE) was obtained from the Craig-Gordon model with a moisture-dependent soilresistance. The relative contribution of transpiration to evapotranspiration ranged from 0.71 to 0.96 with a
table oxygen isotope mean of 0.87 ± 0.052 for the growing season according to the isotopic labeling, which was good agreementwith soil lysimeter measurements showing a mean transpiration fraction of 0.86 ± 0.058. At the growingseason scale, the predicted 18O composition of runoff water was within the range of precipitation andirrigation water according to the isotopic mass conservation. The 18O mass conservation requires thatthe decreased ı18O of ET should be balanced by enhanced ı18O of runoff water.
. Introduction
Heihe River, the second longest inland river of China, is locatedn the continental arid climate in the inland region of northwesthina, in the transition zone between the westerlies and the south-est (summer) monsoon (Huang and Wen, 2014; Guo et al., 2015).
he oasis agriculture in the middle and lower reaches of the Heiheiver Basin is supported by the precipitation and snowmelt fromhe Qilian Mountains, where Heihe River originates (Yang et al.,015). Water conservation is a top priority for scientific research.egetation transpiration (T), through the stomata of plants andssociated with plant productivity, and soil evaporation (E), not
irectly contributing to production, are the two components ofvapotranspiration (ET). Research on the partitioning of ET in thisegion is of great interest to water resource managers. In addition,∗ Corresponding author.E-mail address: [email protected] (X. Wen).
ttp://dx.doi.org/10.1016/j.agrformet.2015.12.003168-1923/© 2015 Elsevier B.V. All rights reserved.
© 2015 Elsevier B.V. All rights reserved.
data on E and T are needed for validation of ecosystem models.Because E and T are controlled by different processes, the ability toseparate ET into its components should improve the prediction ofclimatic responses of ecosystem functions and processes and ourunderstanding of surface-atmosphere water and energy exchange(Li et al., 2013; Kool et al., 2014; Sutanto et al., 2014).
Although partitioning of ET has been performed for decades,using either isotopic or non-isotope approaches, the accuracy ofthe partitioned fluxes is still not satisfactory (Kool et al., 2014;Sutanto et al., 2014). The sources of errors mainly include assump-tion used in the analyses and instrument inaccuracy (Sutanto et al.,2014). In isotope-based approaches, water vapor fluxes producedby soil evaporation and plant transpiration have different oxygenand hydrogen isotope compositions because soil evaporation ismuch more fractionated than plant transpiration. The isotopic end-
member difference provides the basis for ET partitioning (Yakirand Sternberg, 2000). Most partitioning studies focus on forest(Moreira et al., 1997; Wang and Yakir, 2000; Yepez et al., 2003,2007; Williams et al., 2004; Lai et al., 2006; Robertson and Gazis,
9 est Me
2aWHlamleilos
oflA(tiTecetemttvS
tbıcMd(aIccmTH(Ffl
pCWtieifd
(m2dat
0 X. Wen et al. / Agricultural and For
006; Xu et al., 2008; Dubbert et al., 2014b; Sun et al., 2014)nd grassland ecosystems (Ferretti et al., 2003; Yepez et al., 2005;enninger et al., 2010; Sutanto et al., 2012; Dubbert et al., 2013;
u et al., 2014), but few studies have been performed on crop-and ecosystems (Wang and Yakir, 2000; Zhang et al., 2011). Andvantage of cropland systems is that conventional non-isotopeethods for the ET partitioning, such as the combination of micro-
ysimeters to measure evaporation and eddy covariance to measurevapotranspiration (Kool et al., 2014; Sutanto et al., 2014), can bemplemented to check the isotopic results. However, the micro-ysimeters have drawbacks of inability to measure during irrigationr rain, time consuming, and limited representation due to smallample size (Kool et al., 2014).
Combined with the eddy covariance technique, measurementf the oxygen isotope compositions of ecosystem water pools anduxes can be used to partition the ET flux into its component fluxes.
key challenge is to precisely determine the 18O composition of ETıET) (Yakir and Sternberg, 2000; Sutanto et al., 2014). At the presentime, most investigations have used the Keeling mixing model tonfer ıET indirectly (Wang and Yakir, 2000; Williams et al., 2004).he Keeling method is unreliable for water vapor because of a largentrainment effect caused by strong gradients in the vapor isotopeomposition across the top of the atmospheric boundary layer (Leet al., 2012). Other limitations of the Keeling method to water iso-opes include the assumption that the isotopic composition of thevaporation and transpiration do not change during the measure-ent interval (typically 30–60 min), the loss of water vapor from
he ecosystem only by turbulent mixing, and the varied concentra-ion of atmospheric water vapor only resulting from backgroundapor and local evapotranspiration (Lee et al., 2007; Hu et al., 2014;utanto et al., 2014).
The second challenge is how to best capture dynamic varia-ions of the 18O composition of transpiration (ıT). To date, ıT cane determined with four approaches. In isotopic steady state (ISS),T is equal to the isotopic composition of plant source water andan be derived from direct measurements of xylem water (ıx) (e.g.,oreira et al., 1997; Williams et al., 2004). In nonsteady state con-
itions, ıT can be estimated by models such as the Craig-GordonCraig and Gordon, 1965), the Dongmann (Dongmann et al., 1974),nd the Farquhar-Cernusak model (Farquhar and Cernusak, 2005).n addition, ıT can be also directly measured with leaf and branchhambers (Wang et al., 2010; Dubbert et al., 2014a). Finally, ıTan be calculated from the isotopic mass balance using measure-ent of the foliage water pool changes over time (Hu et al., 2014).
he ISS assumption is frequently used in flux partitioning studies.owever, model results demonstrate that ISS is only met for short
hourly) timescales at noon or in early afternoon (Welp et al., 2008).ew studies have evaluated the ISS assumption via water pool andux measurements (Hu et al., 2014).
The third challenge is related to quantification of the 18O com-osition of evaporation (ıE). Generally, ıE is calculated with theraig-Gordon model (Craig and Gordon, 1965; Yepez et al., 2003;illiams et al., 2004; Hu et al., 2014), whose input variables include
he isotopic composition of soil water at the evaporation front,sotopic composition of water vapor (ıv), relative humidity, andquilibrium and kinetic fractionation factors. The model calculations most sensitive to ıv and the determination of soil evaporationront (Sutanto et al., 2014). The endmember ıE can be also measuredirectly with soil chambers (Dubbert et al., 2013, 2014b).
Over the last several years, isotope ratio infrared spectroscopyIRIS) has permitted high-frequency and near-continuous in situ
easurements of atmospheric ıv (Lee et al., 2005; Wen et al., 2008,
012b; Griffis, 2013), providing an attractive alternative to the tra-itional method involving collection of samples with cold trapsnd subsequent measurement by isotope ratio mass spectrome-ry (IRMS) (Helliker et al., 2002). The ıv measurements of mostteorology 230–231 (2016) 89–96
previous studies (i.e., cold traps) are discrete and labor intensive(Moreira et al., 1997; Wang and Yakir, 2000; Yepez et al., 2003; Xuet al., 2008). Advances in measuring the atmospheric ıv, togetherwith the flux-gradient or eddy covariance technique, enables toquantification of ıET (Wen et al., 2012a; Huang and Wen, 2014).To date, only a few studies have deployed ıET measured with themicrometeorological methods for ET partitioning (Lee et al., 2007;Hu et al., 2014).
This study is concerned with the partitioning of ET into itscomponents of E and T in an irrigated cropland. The experimentwas conducted as part of the Heihe Watershed Allied TelemetryExperimental Research (HiWATER) program (Li et al., 2013). The18O signals of the three flux endmembers (ıET, ıE and ıT) weredetermined during the growing season of a maize crop, in themiddle reaches of Heihe River Watershed in 2012 using the fluxgradient approach. The specific objectives of this study are: (1) tocharacterize, in conjunction with intensive measurements of 18Ocomposition of the ecosystem water pools, isotopic steady stateusing isotopic mass balance at the sub-daily scale, (2) to charac-terize the temporal dynamics of the 18O signals of ET, E and T atthe daily to seasonal scale, and quantify the contribution of T to ETusing isotopic labeling and lysimeter measurements.
2. Materials and methods
2.1. Site description
The study site in Zhangye, Gansu Province was part of the HeiheWatershed Allied Telemetry Experimental Research (HiWATER)program (Li et al., 2013). This sites had good fetch (>200 m). Theexperiment was conducted in an arid artificial oasis spring maizein the middle reaches of the Heihe River Watershed (38◦51′N,100◦22′E, 1550 m asl) in northwest China. Over the past fivedecades (1961–2010), the daily mean temperature was 7.4 ◦C andthe mean annual precipitation was 128.7 mm. The experiment wasconducted from May 27 to September 22 (DOY 148–265) in 2012.Plastic films were used for water conservation, covering rate about60% of the soil surface. Flood irrigation water was applied fourtimes (DOY 158, 184, 210 and 238) during the growing season.Spring maize was planted on April 20 and harvested on September22, 2012. The maximum LAI and maximum canopy height were5.6 m2 m−2 and 2.1 m, respectively. Additional details concerningsite information and data acquisition are described by Huang andWen (2014) and Yang et al. (2015).
2.2. In-situ measurement of water vapor and evapotranspirationisotope ratios
The isotopic composition of water vapor in surface air (ıv) wasmeasured using a cavity ring-down spectroscopy (CRDS) watervapor isotope analyzer (Model L1102-i, Picarro Inc.). The schematicdiagram of the CRDS analyzer, its principle of operation, and itscalibration procedure were described in Huang and Wen (2014).Briefly, air was pumped from two heights above the crop throughheated tubes to the analyzer for analysis. The heights of the twointakes were 0.5 and 1.5 m higher than the canopy and increasedover the season from 0.6 m and 1.6 m above the ground at thebeginning to 2.6 m and 3.6 m by the end of the maize season toadjust for canopy growth. The air samples were pumped throughthe analyzer sequentially with 120 s spent on each measurement.The step changes in the HDO, H2
18O and H216O mixing ratios
in response to valve switching between two air sample intakesare given in Fig. 1, indicating that the measurement approachedsteady state in less than 30 s after each switching. For safety, 10data points (∼50 s) after switching was discarded in this study. The

X. Wen et al. / Agricultural and Forest Me
Fv
ı2iTocwT
dtec
R
wmdia1d
ı
2p
eeasbTabam(0oi1
1
ig. 1. Step changes in the H218O (a) and H2
16O (b) mixing ratios in response toalve switching between two air sample intakes.
v was calibrated in every 3 h using three span gases (Wen et al.,008, 2012a; Huang and Wen, 2014). Three span gases with same
sotopic ratios were generated by the liquid vaporization module.wo of three were used to span the atmospheric concentrationf water vapor for calibrating the measurements. The isotopicompositions of the calibration water were measured by a liquidater isotope analyzer (Model DLT-100, Los Gatos Research Inc.).
he data reported were block-averaged to hourly intervals.The molar flux isotope ratio (RET) of evapotranspiration (ET) was
etermined by the flux-gradient technique using measurements athe two sampling heights above the canopy (Lee et al., 2007; Went al., 2012a; Hu et al., 2014; Huang and Wen, 2014). Here, RET wasalculated hourly as
ET = Rd
x16s,2 − x16
s,1
x18s,2 − x18
s,1
x18a,2 − x18
a,1
x16a,2 − x16
a,1
(1)
here Rd is the molar ratio of the calibration water, x is the hourlyean mixing ratio of water isotopologues, superscripts 16 and 18
enote the 16O and 18O molecules in water, subscripts s,1 and s,2ndicate span calibration vapor streams of 1 (lower) and 2 (higher),nd subscripts a,1 and a,2 represent ambient air sampled at heights
(upper) and 2 (lower). The molar ratio RET was converted to theelta notation in reference to the VSMOW standard as
ET =(
RET
RVSMOW− 1
)× 1000 ‰ (2)
.3. Measurement of isotopic compositions of ecosystem waterools
Leaf, stem, and soil samples were collected during 13:00–15:00very 2–3 days from one sampling plot except after irrigationvents. Distances of sampling plot from the micrometeorologicalnd isotopic towers were within the 30 m. Previous studies hadhown that the oxygen isotopic composition of leaf water coulde pronounced enrichment along the leaf (e.g., Affek et al., 2006).herefore, leaf samples from the upper and the lower canopy wererchived separately, with main leaf vein removed, each sampleeing a mixture of small leaf sections cut from the upper, middlend bottom positions of the leaf. The root crown of one selectedaize plant was sampled to represent the 18O of the xylem water
Yang et al., 2015). Soil samples were collected from the depth of–5, 5–10, 10–20, 20–30 and 30–40 cm, but also from the depthf 40–50, 50–60, 60–70, and 70–80 cm every 9 days. After each
rrigation event, sampling of leaf, stem and soil was made during3:00–15:00 for 7 consecutive days.Four intensive campaigns were conducted during August 1–2,7, 19–20, and 29–30 on sunny days. Collection of leaf, xylem and
teorology 230–231 (2016) 89–96 91
soil samples, and measurement of leaf water content were madeevery 3 h during the daytime (6:00–18:00) and 4 h during the night-time (18:00–6:00). Leaf water content was determined with leafsamples from the upper and lower canopy.
A polyethylene bottle and a funnel were connected together tocollect rain water. To prevent evaporation, a ping-pang ball was putinto the funnel. We also collected dew water with a cotton swabbefore sunrise. After each irrigation event, irrigation water was col-lected from both sides of the field. All of these samples were placedin bottles, sealed with Parafilm and kept frozen in a refrigerator(−15 to −20 ◦C) prior to water extraction.
Water in these solid samples was extracted cryogenically usinga vacuum line. The liquid samples (soil, xylem, leaf, precipitation,dew and irrigation water) were analyzed for their isotope ratios on aliquid water isotope analyzer (Model DLT-100, Los Gatos Research).18O of xylem and leaf water were corrected for organic contaminantfollowing the procedure Xiao et al. (2012), and cross-checked withthe analysis by pyrolysis with a continuous flow method on a massspectrometer (MAT 253, Finnigan Inc.). The bias error (IRIS minusIRMS) was −0.11 ± 0.12‰ after the correction. The precision of theliquid water isotope analyzer was typical better than 0.3‰ for Dand 0.1‰ for 18O.
2.4. Auxiliary measurement
Supporting measurement consisted of an eddy covariancesystem (Model LI-7500, Licor Inc., Lincoln, NB; Model CSAT-3,Campbell Scientific Inc., Logan, UT; Model CR3000, Campbell Scien-tific Inc., Logan, UT), which was installed at the 4.5 m height abovethe ground. All raw data were recorded at 10 Hz, and the 30 minmean CO2/H2O fluxes were calculated and stored by the CR5000data logger. In brief, double coordination rotation, and the Webb-Pearman-Leuning correction were performed, detail in Huang andWen (2014). Micrometeorological variables (air temperature, rela-tive humidity, wind speed, precipitation, soil temperature, and soilmoisture) were recorded at 1 Hz, with 30 min averages through asuite of micrometeorological sensors mounted above the canopyand in the soil. Additional details concerning data acquisition arefurther described in the literature (Xu et al., 2013; Liu et al., 2011,2013). Nine homemade micro-lysimeters (10 cm in diameter, and15 cm in depth) were pushed into the non-mulched soil to retrievean undisturbed soil sample. Then, they were sealed at the bottoms,weighed manually and placed back into the soil. After a period ofone day, they were re-weighed to provide daily measurement ofsoil evaporation.
2.5. Theoretical considerations
2.5.1. Flux isotope endmembersThe evapotranspiration flux (ET) consists of the plant transpi-
ration (T) and the soil evaporation (E). Their sign convention issuch that a positive value indicates flux upward toward the atmo-sphere and a negative value indicates downward flux toward theecosystem. Conservation principles require
ET = E + T (3)
ıETET = ıEE + ıTT (4)
where ıET, ıE and ıT are the isotopic compositions of ET, E, and T,respectively. Here ıET was measured with the gradient diffusionmethod, ıE was calculated according to the Craig-Gordon model,
and ıT was determined according to the isotopic mass balance of theleaf water pool during the intensive campaigns or approximated bythe isotopic composition of the xylem water at midday under theISS assumption.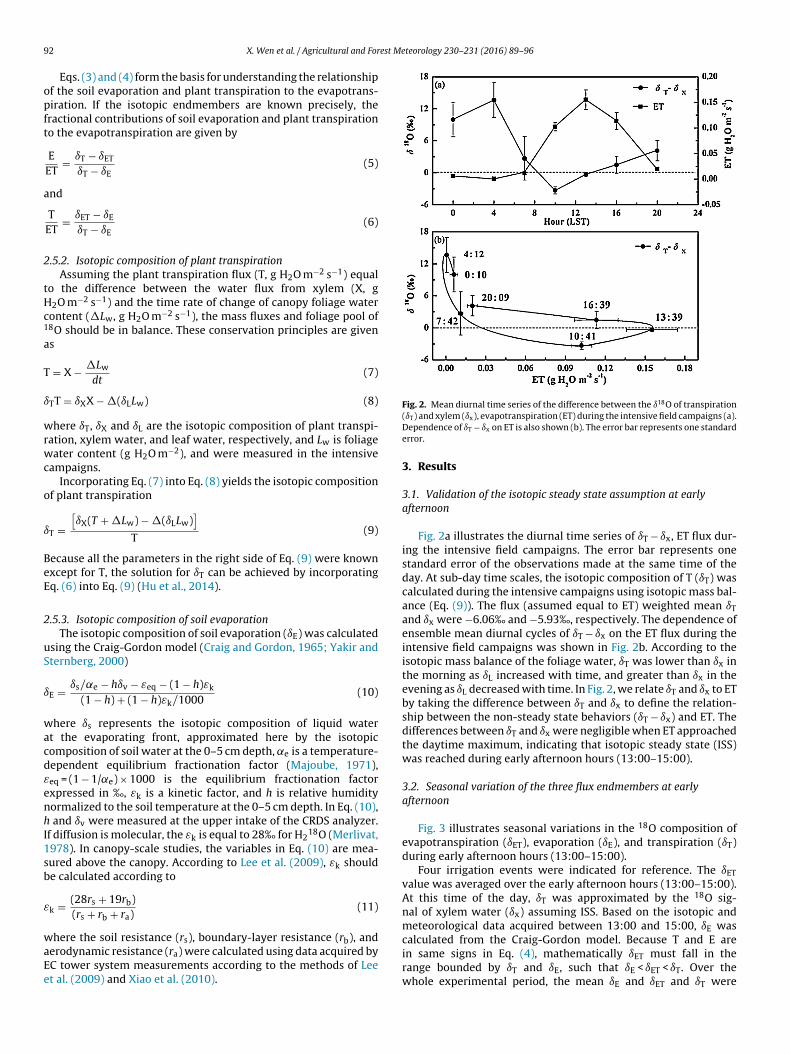
9 est Meteorology 230–231 (2016) 89–96
opft
a
2
tHc1
a
T
ı
wrwc
o
ı
BeE
2
uS
ı
wacdεenhI1sb
ε
waEe
Fig. 2. Mean diurnal time series of the difference between the ı18O of transpiration
2 X. Wen et al. / Agricultural and For
Eqs. (3) and (4) form the basis for understanding the relationshipf the soil evaporation and plant transpiration to the evapotrans-iration. If the isotopic endmembers are known precisely, theractional contributions of soil evaporation and plant transpirationo the evapotranspiration are given by
EET
= ıT − ıET
ıT − ıE(5)
nd
TET
= ıET − ıE
ıT − ıE(6)
.5.2. Isotopic composition of plant transpirationAssuming the plant transpiration flux (T, g H2O m−2 s−1) equal
o the difference between the water flux from xylem (X, g2O m−2 s−1) and the time rate of change of canopy foliage waterontent (�Lw, g H2O m−2 s−1), the mass fluxes and foliage pool of8O should be in balance. These conservation principles are givens
= X − �Lw
dt(7)
TT = ıXX − �(ıLLw) (8)
here ıT, ıX and ıL are the isotopic composition of plant transpi-ation, xylem water, and leaf water, respectively, and Lw is foliageater content (g H2O m−2), and were measured in the intensive
ampaigns.Incorporating Eq. (7) into Eq. (8) yields the isotopic composition
f plant transpiration
T =[ıX(T + �Lw) − �(ıLLw)
]T
(9)
ecause all the parameters in the right side of Eq. (9) were knownxcept for T, the solution for ıT can be achieved by incorporatingq. (6) into Eq. (9) (Hu et al., 2014).
.5.3. Isotopic composition of soil evaporationThe isotopic composition of soil evaporation (ıE) was calculated
sing the Craig-Gordon model (Craig and Gordon, 1965; Yakir andternberg, 2000)
E = ıs/˛e − hıv − εeq − (1 − h)εk
(1 − h) + (1 − h)εk/1000(10)
here ıs represents the isotopic composition of liquid watert the evaporating front, approximated here by the isotopicomposition of soil water at the 0–5 cm depth, ˛e is a temperature-ependent equilibrium fractionation factor (Majoube, 1971),eq = (1 − 1/˛e) × 1000 is the equilibrium fractionation factorxpressed in ‰, εk is a kinetic factor, and h is relative humidityormalized to the soil temperature at the 0–5 cm depth. In Eq. (10),
and ıv were measured at the upper intake of the CRDS analyzer.f diffusion is molecular, the εk is equal to 28‰ for H2
18O (Merlivat,978). In canopy-scale studies, the variables in Eq. (10) are mea-ured above the canopy. According to Lee et al. (2009), εk shoulde calculated according to
k = (28rs + 19rb)(rs + rb + ra)
(11)
here the soil resistance (rs), boundary-layer resistance (rb), anderodynamic resistance (ra) were calculated using data acquired byC tower system measurements according to the methods of Leet al. (2009) and Xiao et al. (2010).
(ıT) and xylem (ıx), evapotranspiration (ET) during the intensive field campaigns (a).Dependence of ıT − ıx on ET is also shown (b). The error bar represents one standarderror.
3. Results
3.1. Validation of the isotopic steady state assumption at earlyafternoon
Fig. 2a illustrates the diurnal time series of ıT − ıx, ET flux dur-ing the intensive field campaigns. The error bar represents onestandard error of the observations made at the same time of theday. At sub-day time scales, the isotopic composition of T (ıT) wascalculated during the intensive campaigns using isotopic mass bal-ance (Eq. (9)). The flux (assumed equal to ET) weighted mean ıTand ıx were −6.06‰ and −5.93‰, respectively. The dependence ofensemble mean diurnal cycles of ıT − ıx on the ET flux during theintensive field campaigns was shown in Fig. 2b. According to theisotopic mass balance of the foliage water, ıT was lower than ıx inthe morning as ıL increased with time, and greater than ıx in theevening as ıL decreased with time. In Fig. 2, we relate ıT and ıx to ETby taking the difference between ıT and ıx to define the relation-ship between the non-steady state behaviors (ıT − ıx) and ET. Thedifferences between ıT and ıx were negligible when ET approachedthe daytime maximum, indicating that isotopic steady state (ISS)was reached during early afternoon hours (13:00–15:00).
3.2. Seasonal variation of the three flux endmembers at earlyafternoon
Fig. 3 illustrates seasonal variations in the 18O composition ofevapotranspiration (ıET), evaporation (ıE), and transpiration (ıT)during early afternoon hours (13:00–15:00).
Four irrigation events were indicated for reference. The ıETvalue was averaged over the early afternoon hours (13:00–15:00).At this time of the day, ıT was approximated by the 18O sig-nal of xylem water (ıx) assuming ISS. Based on the isotopic andmeteorological data acquired between 13:00 and 15:00, ıE was
calculated from the Craig-Gordon model. Because T and E arein same signs in Eq. (4), mathematically ıET must fall in therange bounded by ıT and ıE, such that ıE < ıET < ıT. Over thewhole experimental period, the mean ıE and ıET and ıT were
X. Wen et al. / Agricultural and Forest Meteorology 230–231 (2016) 89–96 93
FaF
(−122uwebt
3
(ttatutomtfceaee
Fiae
ig. 3. Seasonal variation of the ı18O of evapotranspiration (ıET), evaporation (ıE),nd transpiration (ıT, equal to xylem water, ıx) at early afternoon (13:00–15:00).our irrigation event is also indicated for reference.
mean ± 1 standard deviation) −38.48 ± 3.18‰, −9.77 ± 1.91‰ and5.74 ± 0.92‰, respectively. The irrigation dates were 6 June (DOY58, irrigation amount 111.6 mm), 2 July (DOY 184, 141.9 mm),8 July (DOY 210, 149.7 mm) and 25 August (DOY 238, 149.7 mm)012. Because 80–90% of the Heihe River water originates from thepper mountainous area, the isotopic composition of the irrigationater (−8.66 ± 0.30‰) was more depleted than the soil water (Yang
t al., 2015). After each irrigation event, the three isotopic endmem-ers fluctuated obviously. Furthermore, ıE decreased more sharplyhan ıET and ıT.
.3. Isotopic partitioning at early afternoon
The isotopic data were used to constrain the component fluxesFig. 3). Fig. 4 illustrates the relative contribution of transpiration (T)o evapotranspiration (ET) using isotopic labeling and the lysime-er/eddy covariance measurements. Also shown in Fig. 4 are leafrea index (LAI) and four irrigation events. In Fig. 4, the relative con-ribution of T to ET was evaluated in early afternoon (13:00–15:00)sing isotopic labeling and at the whole day (0:00–24:00) usinghe lysimeter/eddy covariance measurement. Generally, the resultf isotopic labeling was consistent with soil lysimeter measure-ents. During the growing season, the relative contribution of T
o ET was 0.88 ± 0.056 and 0.85 ± 0.088 from isotopic labeling androm the lysimeter observation, respectively. However, a large dis-repancy (0.36 ± 0.078) was observed right after the first irrigation
vent (DOY 158). The discrepancy for other irrigation events hasmean value of 0.04 ± 0.012. The lysimeter method could gen-rally serve as a validation for other ET partition methods (Koolt al., 2014). The discrepancy after the first irrigation event was
ig. 4. Relative contribution of transpiration (T) to evapotranspiration (ET) usingsotopic labeling and lysimeter/eddy covariance measurement. Leaf area index (LAI)nd four irrigation events are also shown for reference. The error bar (one standardrror) is also shown.
Fig. 5. A schematic representation of average isotopic signals (ı18O) of variousecosystem water pools and fluxes during the growing season. Numbers in paren-theses indicate total fluxes in mm.
likely due to no canopy closure in the field. In this case, the isotopiccomposition of liquid water at the evaporating front was unreason-ably approximated by the isotopic composition of soil water at the0–5 cm depth. Excluding the result after the first irrigation event,the T/ET ratio varied from 0.71 to 0.96, with the mean (±1 standarddeviation) of 0.87 (±0.052) from isotopic labeling, and from 0.66to 0.95 with the mean of 0.86 (±0.058) from the lysimeter obser-vation, suggesting that our isotopic labeling approach was robust.The relative high contribution of soil evaporation was out of ourexpectation, because about 60% of the field was covered with plas-tic films. This might be due to the fact that the field was irrigatedfrequently during the growing season. Therefore, the available soilwater for evaporation was always plentiful in the non-mulched soil.LAI decreased abruptly on DOY 218 due to removal of male maizeplants. It also steeply dropped on DOY 257 because heavy frostsoccurred in the late growing season. Wang et al. (2014) synthesizedprevious published papers and concluded that LAI has predominantimpacts on T/ET. However, the percentage of T/ET declined slightlyaccording to both the isotopic labeling and the lysimeter method(Fig. 4). This could be because of the high maize density of this fieldfor seed production.
3.4. Isotopic partitioning at the growing season scale
Fig. 5 is a schematic representation of the average isotopicsignals of various ecosystem water pools and fluxes during thegrowing season (DOY 148–265). Numbers in parentheses indicatetotal fluxes in mm. The analysis was restricted to seasonal timescale. The 18O composition of ET, precipitation, dew and soil waterwere the mean values weighted by water vapor flux, precipitation
amount, dew amount and soil water content, respectively. ıT wasassumed to be the same as mean ıx weighted by water vapor fluxin early afternoon (13:00-15:00). ıi was the algebraic mean of allthe valid observations during the 4 irrigation events.
9 est Me
aflf−wgtt−mitw(a1twfl
tdalt1
sw
4
mMdet
watEei2wttWeh2ıtsei(Otutwru
4 X. Wen et al. / Agricultural and For
The seasonal total ET was 425.7 mm based on the eddy covari-nce. Giving the T/ET ratio of 0.87 for the growing season, thisux was partitioned as 56.0 mm for soil evaporation and 369.7 mm
or plant transpiration. The mean ıET and ıT were −8.57‰ and5.83‰, respectively. According to the isotopic mass balance, ıEas −26.93‰ during the growing season. As for the influxes during
rowing season, the total precipitation amount was 103.2 mm withhe amount-weighted average isotopic composition of −5.70‰. Theotal irrigation amount was 552.9 mm, with an isotopic value of8.66‰. The amount of dewfall, calculated with the flux-profileethod, was 9.9 mm, equivalent to about 10% of the precipitation
nput. The frequency of dew formation was 59% in this site, andhe amount-weighted average isotopic composition of dew wateras −4.05‰. The 18O composition of the surface (0–5 cm), shallow
5–40 cm) and deep (40–80 cm) soil water were −5.40‰, −7.64‰,nd −7.81‰, respectively. The net change in soil water storage were.9 mm, −4.7 mm, and 7.4 mm between DOY 148 and DOY 265 inhese soil layers. Over the growing season, the net change in soilater storage was negligible (4.6 mm) in comparison to the wateruxes.
According to isotopic mass conservation, 18O composition ofhe deep percolation or runoff (−7.37‰) was a little higher thaneep soil water (−7.81‰), and within the range of precipitationnd irrigation water. This is probably because it was calcu-ated based on the 18O mass conservation without consideringhe evaporation of dew water and intercepted rain. Overall, the8O mass conservation requires that the decreased 18O compo-ition of ET be balanced by enhanced 18O composition of runoffater.
. Discussion
In order to use the isotopic labeling approach to partition ET, weust first quantify the three end endmembers of ıT and ıE and ıET.ethods for determining these three end members have varying
egrees of uncertainty (Kool et al., 2014; Sutanto et al., 2014). Sev-ral assumptions in the isotope mass balance model may contributeo uncertainty in the ET partitioning.
Traditionally, ıET is inferred by fitting the ıv to the inverse ofater vapor mixing ratio with the Keeling plot approach (Yakir
nd Sternberg, 2000). The Keeling plot approach implicitly assumeshat the observed temporal variations of ıv are attributable only toT. In reality, ıv in the atmospheric surface layer are also influ-nced by processes unrelated to surface ET. For this reason, thentercept of Keeling plot is an ambiguous quantity (Lee et al., 2006,007, 2012; Griffis et al., 2007). Measuring the atmospheric ıv
ith IRIS technique (Lee et al., 2005; Wen et al., 2008, 2012a),ogether with the flux-gradient technique, enabled us to quan-ify ıET (Lee et al., 2007; Wang et al., 2010; Good et al., 2012;
en et al., 2012b; Hu et al., 2014; Huang and Wen, 2014). How-ver, the flux-gradient and Keeling plot methods were shown toave similar uncertainty of 5.83‰ and 5.89‰ for 18O (Good et al.,012). Lee et al. (2007) reported an hourly precision of 1.4‰ forET with the flux-gradient approach through a series of labora-ory tests. The uncertainty of ıET could also be indicated by thetandard error of ıET within each hour in field implementation (Hut al., 2014; Huang and Wen, 2014). For all the hourly data dur-ng the growing season, the average uncertainty of ıET was 4.6‰ranging from 0.2‰ to 35.2‰) in our site (Huang and Wen, 2014).ver a temperate grassland, the ıET uncertainty varies from 0.8‰
o 53‰, with an average of 7.9‰ (Hu et al., 2014). Although thencertainty of ıET was huge for the entire day, it would approach
o the minimum of uncertainty in early afternoon (13:00–15:00)hen the water vapor gradient between the two sampling intakeseaches its maximum. Good et al. (2012) suggested that potentialncertainties of ıET by the flux-gradient method mainly results
teorology 230–231 (2016) 89–96
from different footprints at the two intake heights, variability inatmospheric conditions, instrument precision, and the averagingmethod to calculate hourly ıET. At the sub-daily scale, the uncer-tainty is relatively small from ıT and ıE but quite large from ıET, soimproving the precision of ıET should be a priority (Hu et al., 2014).However, the uncertainty of ıET (Fig. 3) was small in early afternoon(13:00–15:00) when the water vapor gradient between the twosampling intakes approached the maximum value of the diurnalcycle.
It is very challenging to capture the dynamic variations of ıT,therefore, most of previous studies partitioning ET under steadystate assumption (e.g., Moreira et al., 1997; Wang and Yakir, 2000;Ferretti et al., 2003; Williams et al., 2004). As an alternative to theISS assumption, ıT can be estimated with the non-steady state leafisotopic models (Dongmann et al., 1974; Farquhar and Cernusak,2005). Estimating the water isotopic composition at the leaf evap-orating front (ıL,e) is critical to resolve ıT (Xiao et al., 2012). Manyparameters are required for estimating ıL,e. One such parameter isthe Péclet number, which is difficult to constrain at the canopy scale(Xiao et al., 2012; Hu et al., 2014). Because stomatal conductanceis used for the leaf water balance calculation, meaningful resultsrequire that the conductance be measured hourly in the field or becomputed with a robust photosynthesis model. In absence of dataon these parameters, we were forced to adopt the ISS assumption,that ıT assume is the same as that of the xylem water (ıx). Our iso-topic mass balance results illustrate that ıT at this site was not atISS in the morning but rapidly approached and remained near ISSduring the early afternoon (Fig. 2). Sutanto et al. (2014) reviewedthat the ISS assumption is only valid at midday for short timescale(hourly) due to rapidly changing environmental conditions. Recentmodels studies show that the ISS assumption is satisfied duringvery limited midday hours (Farquhar and Cernusak, 2005; Yepezet al., 2005; Lai et al., 2006; Xiao et al., 2012). Our study is one ofthe few studies that evaluated ISS by measuring the foliage waterpools and the flux in field conditions (Hu et al., 2014). The isotopicsignal of plant transpiration (ıT) was so heavy and similar to sur-face soil water (0–5 cm) in this study. This was consistent with theresults that more than 71% of the plant water was acquired from 0to 5 cm soil layer in this plot (Yang et al., 2015). In addition, ıT canbe also measured with chambers (Wang et al., 2010; Dubbert et al.,2014a).
The isotopic signal of soil evaporation (ıE) is generally estimatedwith the Craig-Gordon model. Key parameters in the model includeıv, the isotopic composition of water at the soil evaporating front,and the kinetic fractionation factor appropriate for ambient condi-tions (Craig and Gordon, 1965; Yakir and Sternberg, 2000; Braudet al., 2009). In the present study, ıv was measured at fine (hourly)time scale resolutions. Recent studies have showed that ıv is vari-able at hourly, diurnal, and seasonal time scales due to influences byhydrological events such as precipitation, dew formation, and dewevaporation (Welp et al., 2008; Wen et al., 2012a). The determina-tion of the evaporation front at the soil surface in case of saturationfor determination of ıs should be considered carefully (Rothfusset al., 2010). In this site, ıs was approximated here by the isotopiccomposition of soil water at the 0–5 cm depth. The kinetic fraction-ation factor associated with soil evaporation, εk, was calculated as aweighted mean according to the soil resistance (rs), the boundary-layer resistance (rb), and the aerodynamic resistance (ra) (Lee et al.,2009; Xiao et al., 2012). In this formulation, εk is a variable quan-tity, having lower values observed under moisture soil conditions.For the data shown in Fig. 3, εk varied between 22.3‰ and 27.5‰.However, during the first flood irrigation event, ıs was unreason-
ably approximated by the isotopic composition of soil water atthe 0–5 cm depth because of quick change of the soil evaporationfront in the exposed sunny conditions. In addition, the ıE can bealso measured directly with soil chambers (Dubbert et al., 2013,
est Me
2a
iipmeolsmTmTdsihs
5
dtbtr
ewtTw
(tts(ıw
A
eANNtSbsdm
R
A
B
X. Wen et al. / Agricultural and For
014b). However, the chamber method would disturb the kineticsssociated with evaporation.
To date, there is no consensus as to which ET partition methods most accurate, so an absolute validation of the isotopic methods not possible (Kool et al., 2014; Sutanto et al., 2014). In someartition methods, soil evaporation and plant transpiration areeasured at different spatial scales. Micro-lysimeters are consid-
red a reliable method to measure E and often serve, in conjunctionf eddy covariance measurement, as validation for the isotopicabeling method (Kool et al., 2014). In a review of isotope-basedtudies, Sutanto et al. (2014) found that T contributes generallyore than 70% to the ET, while other techniques lead to smaller
/ET. In this study, the result of isotopic labeling was in good agree-ent with soil lysimeter/eddy covariance measurements (Fig. 4).
he E/ET ratio is expected to be greater when the atmosphericemand or water availability in the soil is higher. Kool et al. (2014)howed that E/ET seems to be particularly high (50–60%) in floodrrigated systems. In their study, soil evaporation rates initially areigh following the wetting event, but decline rapidly as the soilurface dries.
. Conclusions
At the sub-daily scale, we relate ıT and ıx to ET by taking theifference between ıT and ıx to define the relationship betweenhe non-steady state behaviors (ıT − ıx) and ET. The differencesetween ıT and ıx were negligible when ET approached the day-ime maximum, indicating that isotopic steady state (ISS) waseached during the early afternoon (13:00–15:00).
At the daily scale, excluding the result after the first irrigationvent, the relative contribution of T to ET varied from 0.71 to 0.96ith the mean of 0.87 ± 0.052 for isotopic labeling, and from 0.66
o 0.95 with the mean of 0.86 ± 0.058 for lysimeter observations.he consistent results suggested that our isotopic labeling approachas robust (p = 0.446).
At the growing season scale (DOY 148-265), deep percolationrunoff water, ıR = −7.37‰) has ı18O within the range of precipi-ation (ıp = −5.70‰) and irrigation water (ıi = −8.66‰) accordingo the prediction of isotopic mass conservation. Over the growingeason, when net change in soil water storage become negligible4.6 mm), the 18O mass conservation requires that the decreased18O of ET (ıET = −8.57‰) be balanced by enhanced ı18O of runoffater.
cknowledgements
This study was supported by the National Natural Sci-nce Foundation of China (Grant 91125002) and the Chinesecademy of Sciences Strategic Priority Research Program (Granto. XDA05050601). XL also acknowledges support by the USational Science Foundation (Grant EAR-1520684). The data for
his paper are available at the Data Center for Cold and Arid Regionciences (http://westdc.westgis.ac.cn). Data set 1: Data set of sta-le isotopic observation (doi:10.3972/hiwater.108.2013.db). Dataet 2: Data set of flux observation matrix (Daman Superstation,oi:10.3972/hiwater.073.2013.db). Data set 3: Data set of measure-ents of channel flow (doi:10.3972/hiwater.123.2013.db).
eferences
ffek, H.P., Krisch, M.J., Yakir, D., 2006. Effects of intraleaf variations in carbonic
anhydrase activity and gas exchange on leaf C18OO isoflux in Zea mays. NewPhytol. 169 (2), 321–329.raud, I., Biron, P., Bariac, T., Richard, P., Canale, L., Gaudet, J.P., Vauclin, M., 2009.Isotopic composition of bare soil evaporated water vapor. Part I: RUBIC IVexperimental setup and results. J. Hydrol. 369 (1–2), 1–16.
teorology 230–231 (2016) 89–96 95
Craig, H., Gordon, L., 1965. Deuterium and oxygen 18 variations in the ocean andthe marine atmosphere. In: Tongiorgi, E. (Ed.), Stable Isotopes inOceanographic Studies and Paleotemperatures. Laboratory of Geology andNuclear Science, Pisa, Italy, pp. 9–130.
Dongmann, G., Nürnberg, H., Förstel, H., Wagener, K., 1974. On the enrichment ofH2
18O in the leaves of transpiring plants. Radiat. Environ. Biophys. 11 (1),41–52.
Dubbert, M., Cuntz, M., Piayda, A., Maguas, C., Werner, C., 2013. Partitioningevapotranspiration – testing the Craig and Gordon model with fieldmeasurements of oxygen isotope ratios of evaporative fluxes. J. Hydrol. 496,142–153.
Dubbert, M., Cuntz, M., Piayda, A., Werner, C., 2014a. Oxygen isotope signatures oftranspired water vapor: the role of isotopic non-steady-state transpirationunder natural conditions. New Phytol. 203 (4), 1242–1252.
Dubbert, M., Piayda, A., Cuntz, M., Correia, A.C., Silva, F.C.E., Pereira, J.S., Werner, C.,2014b. Stable oxygen isotope and flux partitioning demonstrates understory ofan oak savanna contributes up to half of ecosystem carbon and waterexchange. Front. Plant Sci. 5, 530, http://dx.doi.org/10.3389/fpls.2014.00530.
Farquhar, G., Cernusak, L., 2005. On the isotopic composition of leaf water in thenon-steady state. Funct. Plant Biol. 32 (4), 293–303.
Ferretti, D.F., Pendall, E., Morgan, J.A., Nelson, J.A., LeCain, D., Mosier, A.R., 2003.Partitioning evapotranspiration fluxes from a Colorado grassland using stableisotopes: seasonal variations and ecosystem implications of elevatedatmospheric CO2. Plant Soil 254 (2), 291–303.
Good, S.P., Soderberg, K., Wang, L.X., Caylor, K.K., 2012. Uncertainties in theassessment of the isotopic composition of surface fluxes: a direct comparisonof techniques using laser-based water vapor isotope analyzers. J. Geophys. Res.117, D15301, http://dx.doi.org/10.1029/2011JD017168.
Griffis, T.J., Zhang, J., Baker, J.M., Kljun, N., Billmark, K., 2007. Determining carbonisotope signatures from micrometeorological measurements: implications forstudying biosphere-atmosphere exchange processes. Bound. Lay. Meteorol.123 (2), 295–316.
Griffis, T.J., 2013. Tracing the flow of carbon dioxide and water vapor between thebiosphere and atmosphere: a review of optical isotope techniques and theirapplication. Agric. For. Meteorol. 174, 85–109.
Guo, X.Y., Feng, Q., Wei, Y.P., Li, Z.X., Liu, W., 2015. An overview of precipitationisotopes over the Extensive Hexi Region in NW China. Arab. J. Geosci. 8 (7),4365–4378.
Helliker, B., Roden, J., Cook, C., Ehleringer, J., 2002. A rapid and precise method forsampling and determining the oxygen isotope ratio of atmospheric watervapor. Rapid Commun. Mass Spectrom. 16 (10), 929–932.
Hu, Z.M., Wen, X.F., Sun, X.M., Li, L.H., Yu, G.R., Lee, X.H., Li, S.G., 2014. Partitioningof evapotranspiration through oxygen isotopic measurements of water poolsand fluxes in a temperate grassland. J. Geophys. Res. 119 (3),358–371.
Huang, L.J., Wen, X.F., 2014. Temporal variations of atmospheric water vapor ıD
and ı18O above an arid artificial oasis cropland in the Heihe River Basin. J.Geophys. Res. 119 (19), 11456–11476.
Kool, D., Agam, N., Lazarovitch, N., Heitman, J.L., Sauer, T.J., Ben-Gal, A., 2014. Areview of approaches for evapotranspiration partitioning. Agric. For. Meteorol.184, 56–70.
Lai, C.T., Ehleringer, J.R., Bond, B.J., Paw U, K.T., 2006. Contributions of evaporation,isotopic non-steady state transpiration and atmospheric mixing on the ı18O ofwater vapour in Pacific Northwest coniferous forests. Plant Cell Environ. 29 (1),77–94.
Lee, X., Sargent, S., Smith, R., Tanner, B., 2005. In situ measurement of the watervapor 18O/16O isotope ratio for atmospheric and ecological applications. J.Atmos. Ocean. Tech. 22 (5), 555–565.
Lee, X., Smith, R., Williams, J., 2006. Water vapour 18O/16O isotope ratio in surfaceair in New England, USA. Tellus B 58 (4), 293–304.
Lee, X., Kim, K., Smith, R., 2007. Temporal variations of the 18O/16O signal of thewhole-canopy transpiration in a temperate forest. Global Biogeochem. Cycles21 (3), GB3013, http://dx.doi.org/10.1029/2006GB002871.
Lee, X., Griffis, T., Baker, J., Billmark, K., Kim, K., Welp, L., 2009. Canopy-scale kineticfractionation of atmospheric carbon dioxide and water vapor isotopes. GlobalBiogeochem. Cycles 23 (1), GB1002, http://dx.doi.org/10.1029/2008GB003331.
Lee, X., Huang, J.P., Patton, E.G., 2012. A large-eddy simulation study of watervapour and carbon dioxide isotopes in the atmospheric boundary layer. Bound.Lay. Meteorol. 145 (1), 229–248.
Li, X., Cheng, G.D., Liu, S.M., Xiao, Q., Ma, M.G., Jin, R., Che, T., Liu, Q.H., Wang, W.Z.,Qi, Y., Wen, J.G., Li, H.Y., Zhu, G.F., Guo, J.W., Ran, Y.H., Wang, S.G., Zhu, Z.L.,Zhou, J., Hu, X.L., Xu, Z.W., 2013. Heihe watershed allied telemetryexperimental research (HiWATER): scientific objectives and experimentaldesign. B. Am. Meteorol. Soc. 94 (8), 1145–1160.
Liu, S.M., Xu, Z.M., Zhu, Z.L., Jia, Z.Z., Zhu, M.J., 2013. Measurements ofevapotranspiration from eddy-covariance systems and large aperturescintillometers in the Hai River Basin, China. J. Hydrol. 487,24–38.
Liu, S.M., Xu, Z.M., Wang, W.Z., Jia, Z.Z., Zhu, M.J., Wang, J.M., 2011. A comparison ofeddy-covariance and large aperture scintillometer measurements with respectto the energy balance closure problem. Hydrol. Earth Syst. Sci. 15,
1291–1306.Majoube, M., 1971. Oxygen-18 and deuterium fractionation between water andsteam. J. Chim. Phys. Chim. Biol. 68 (10), 1423–1436.
Merlivat, L., 1978. Molecular diffusivities of H216O, HD16O and H2
18O in gases. J.Chem. Phys. 69 (6), 2864–2871.

9 est Me
M
R
R
S
S
S
W
W
W
W
W
W
6 X. Wen et al. / Agricultural and For
oreira, M.Z., Sternberg, L.D.L., Martinelli, L.A., Victoria, R.L., Barbosa, E.M.,Bonates, L.C.M., Nepstad, D.C., 1997. Contribution of transpiration to forestambient vapour based on isotopic measurements. Global Change Biol. 3 (5),439–450.
obertson, J.A., Gazis, C.A., 2006. An oxygen isotope study of seasonal trends in soilwater fluxes at two sites along a climate gradient in Washington state (USA). J.Hydrol. 328 (1–2), 375–387.
othfuss, Y., Biron, P., Braud, I., Canale, L., Durand, J.L., Gaudet, J.P., Richard, P.,Vauclin, M., Bariac, T., 2010. Partitioning evapotranspiration fluxes into soilevaporation and plant transpiration using water stable isotopes undercontrolled conditions. Hydrol. Process. 24 (22), 3177–3194.
un, S.J., Meng, P., Zhang, J.S., Wan, X.C., Zheng, N., He, C.X., 2014. Partitioning oakwoodland evapotranspiration in the rocky mountainous area of North Chinawas disturbed by foreign vapor, as estimated based on non-steady-state O-18isotopic composition. Agric. For. Meteorol. 184, 36–47.
utanto, S.J., Wenninger, J., Coenders-Gerrits, A.M.J., Uhlenbrook, S., 2012.Partitioning of evaporation into transpiration, soil evaporation andinterception: a comparison between isotope measurements and a HYDRUS-1Dmodel (vol 16, pg 2605, 2012). Hydrol. Earth Syst. Sci. 16 (9), 3261.
utanto, S.J., van den Hurk, B., Dirmeyer, P.A., Seneviratne, S.I., Rockmann, T.,Trenberth, K.E., Blyth, E.M., Wenninger, J., Hoffmann, G., 2014. HESS Opinions“A perspective on isotope versus non-isotope approaches to determine thecontribution of transpiration to total evaporation”. Hydrol. Earth Syst. Sci. 18(8), 2815–2827.
ang, L.X., Caylor, K.K., Villegas, J.C., Barron-Gafford, G.A., Breshears, D.D.,Huxman, T.E., 2010. Partitioning evapotranspiration across gradients of woodyplant cover: assessment of a stable isotope technique. Geophys. Res. Lett. 37,L09401, http://dx.doi.org/10.1029/2010GL043228.
ang, L.X., Good, S.P., Caylor, K.K., 2014. Global synthesis of vegetation control onevapotranspiration partitioning. Geophys. Res. Lett. 41,6753–6757.
ang, X.F., Yakir, D., 2000. Using stable isotopes of water in evapotranspirationstudies. Hydrol. Process. 14 (8), 1407–1421.
elp, L., Lee, X., Kim, K., Griffis, T., Billmark, K., Baker, J., 2008. ı18O of watervapour, evapotranspiration and the sites of leaf water evaporation in a soybeancanopy. Plant Cell Environ. 31 (9), 1214–1228.
en, X., Sun, X., Zhang, S., Yu, G., Sargent, S., Lee, X., 2008. Continuous
measurement of water vapor D/H and 18O/16O isotope ratios in theatmosphere. J. Hydrol. 349 (3–4), 489–500.en, X., Lee, X., Sun, X., Wang, J., Hu, Z., Li, S., Yu, G., 2012a. Dew water isotopicratios and their relationships to ecosystem water pools and fluxes in acropland and a grassland in China. Oecologia, 549–561.
teorology 230–231 (2016) 89–96
Wen, X., Lee, X., Sun, X., Wang, J., Tang, Y., Li, S., Yu, G., 2012b. Intercomparison offour commercial analyzers for water vapor isotope measurement. J. Atmos.Ocean. Tech. 29 (2), 235–247.
Wenninger, J., Beza, D.T., Uhlenbrook, S., 2010. Experimental investigations ofwater fluxes within the soil-vegetation-atmosphere system: stable isotopemass-balance approach to partition evaporation and transpiration. Phys.Chem. Earth 35 (13–14), 565–570.
Williams, D.G., Cable, W., Hultine, K., Hoedjes, J.C.B., Yepez, E.A., Simonneaux, V.,Er-Raki, S., Boulet, G., de Bruin, H.A.R., Chehbouni, A., Hartogensis, O.K., Timouk,F., 2004. Evapotranspiration components determined by stable isotope, sapflow and eddy covariance techniques. Agric. For. Meteorol. 125 (3–4), 241–258.
Xiao, W., Lee, X., Griffis, T.J., Kim, K., Welp, L.R., Yu, Q., 2010. A modelinginvestigation of canopy-air oxygen isotopic exchange of water vapor andcarbon dioxide in a soybean field. J. Geophys. Res. 115, G01004, http://dx.doi.org/10.1029/2009JG001163.
Xiao, W., Lee, X., Wen, X., Sun, X., Zhang, S., 2012. Modeling biophysical controls oncanopy foliage water 18O enrichment in wheat and corn. Global Change Biol.18 (5), 1769–1780.
Xu, Z., Yang, H.B., Liu, F.D., An, S.Q., Cui, J., Wang, Z.S., Liu, S.R., 2008. Partitioningevapotranspiration flux components in a subalpine shrubland based on stableisotopic measurements. Bot. Stud. 49 (4), 351–361.
Xu, Z.W., Liu, S.M., Li, X., Shi, S.J., Wang, J.M., Zhu, Z.L., Xu, T.R., Wang, W.Z., Ma,M.G., 2013. Intercomparison of surface energy flux measurement systems usedduring the HiWATER-MUSOEXE. J. Geophys. Res. Atmos. 118, 13140–13157.
Yakir, D., Sternberg, L.S.L., 2000. The use of stable isotopes to study ecosystem gasexchange. Oecologia 123 (3), 297–311.
Yang, B., Wen, X.F., Sun, X.M., 2015. Irrigation depth far exceeds water uptakedepth in an oasis cropland in the middle reaches of Heihe River Basin. Sci. Rep.5, 15206, http://dx.doi.org/10.1038/srep15206.
Yepez, E.A., Williams, D.G., Scott, R.L., Lin, G.H., 2003. Partitioning overstory andunderstory evapotranspiration in a semiarid savanna woodland from theisotopic composition of water vapor. Agric. For. Meteorol. 119 (1–2), 53–68.
Yepez, E.A., Huxman, T.E., Ignace, D.D., English, N.B., Weltzin, J.F., Castellanos, A.E.,Williams, D.G., 2005. Dynamics of transpiration and evaporation following amoisture pulse in semiarid grassland: a chamber-based isotope method forpartitioning flux components. Agric. For. Meteorol. 132 (3–4), 359–376.
Yepez, E.A., Scott, R.L., Cable, W.L., Williams, D.G., 2007. Intraseasonal variation in
water and carbon dioxide flux components in a semiarid riparian woodland.Ecosystems 10 (7), 1100–1115.Zhang, Y.C., Shen, Y.J., Sun, H.Y., Gates, J.B., 2011. Evapotranspiration and itspartitioning in an irrigated winter wheat field: a combined isotopic andmicrometeorologic approach. J. Hydrol. 408 (3–4), 203–211.