evapotranspiration partitioning through in-situ oxygen ... · 64 (kool et al., 2014; sutanto et...
TRANSCRIPT

Evapotranspiration partitioning through in-situ oxygen isotope 1
measurements in an oasis cropland 2
3
Xuefa Wen a*, Bin Yang a,b, Xiaomin Sun a, Xuhui Lee c,d 4
5
a Key Laboratory of Ecosystem Network Observation and Modeling, Institute of Geographic 6
Sciences and Natural Resources Research, Chinese Academy of Sciences, Beijing 100101, China 7
b University of Chinese Academy of Sciences, Beijing 100049, China 8
c Yale-NUIST Center on Atmospheric Environment, Nanjing University of Information Science & 9
Technology, Nanjing 210044, China 10
d School of Forestry and Environmental Studies, Yale University, New Haven, Connecticut 06511, 11
USA 12
13
14
15
* Corresponding author 16
Prof. Xuefa Wen, E-mail: [email protected]; Tel: 86-10-64889272; Fax: 86-10-64858099 17
18
19
Submitted to Agricultural and Forest Meteorology (July 2015). 20
21

Abstract: The oxygen isotope compositions of ecosystem water pools and fluxes are 22
useful tracers in the water cycle. As part of the Heihe Watershed Allied Telemetry 23
Experimental Research (HiWATER) program, high-frequency and near-continuous in 24
situ measurements of 18O composition of atmospheric vapor (δv) and of 25
evapotranspiration (δET) were made with the flux-gradient method using a cavity 26
ring-down spectroscopy water vapor isotope analyzer. At the sub-daily scale, we 27
found, in conjunction with intensive isotopic measurements of other ecosystem water 28
pools, that the differences between 18O composition of transpiration (δT) and of xylem 29
water (δx) were negligible in early afternoon (13:00-15:00 Beijing time) when ET 30
approached the daytime maximum, indicating isotopic steady state. At the daily scale, 31
for the purpose of flux partitioning, δT was approximated by δx at early afternoon 32
hours, and the 18O composition of soil evaporation (δE) was obtained from the 33
Craig-Gordon model with a moisture-dependent soil resistance. The relative 34
contribution of transpiration to evapotranspiration ranged from 0.71 to 0.96 with a 35
mean of 0.87 ± 0.052 for the growing season according to the isotopic labeling, which 36
was good agreement with soil lysimeter measurements showing a mean transpiration 37
fraction of 0.86 ± 0.058. At the growing season scale, the predicted 18O composition 38
of runoff water was within the range of precipitation and irrigation water according to 39
the isotopic mass conservation. The 18O mass conservation requires that the decreased 40
δ18O of ET should be balanced by enhanced δ18O of runoff water. 41
Keywords: Evapotranspiration partitioning; HiWATER program; Isotope Ratio 42
Infrared Spectroscopy (IRIS); Isotopic Steady State (ISS); Stable oxygen isotope 43
44

1. Introduction 45
Heihe River, the second longest inland river of China, is located in the continental 46
arid climate in the inland region of northwest China, in the transition zone between 47
the westerlies and the southwest (summer) monsoon (Huang and Wen, 2014; Guo et 48
al., 2015). The oasis agriculture in the middle and lower reaches of the Heihe River 49
Basin is supported by the precipitation and snowmelt from the Qilian Mountains, 50
where Heihe River originates (Yang et al., 2015). Water conservation is a top priority 51
for scientific research. Vegetation transpiration (T), through the stomata of plants and 52
associated with plant productivity, and soil evaporation (E), not directly contributing 53
to production, are the two components of evapotranspiration (ET). Research on the 54
partitioning of ET in this region is of great interest to water resource managers. In 55
addition, data on E and T are needed for validation of ecosystem models. Because E 56
and T are controlled by different processes, the ability to separate ET into its 57
components should improve the prediction of climatic responses of ecosystem 58
functions and processes and our understanding of surface-atmosphere water and 59
energy exchange (Li et al., 2013; Kool et al., 2014; Sutanto et al., 2014). 60
61
Although partitioning of ET has been performed for decades, using either isotopic or 62
non-isotope approaches, the accuracy of the partitioned fluxes is still not satisfactory 63
(Kool et al., 2014; Sutanto et al., 2014). The sources of errors mainly include 64
assumption used in the analyses and instrument inaccuracy (Sutanto et al., 2014). In 65
isotope-based approaches, water vapor fluxes produced by soil evaporation and plant 66
transpiration have different oxygen and hydrogen isotope compositions because soil 67
evaporation is much more fractionated than plant transpiration. The isotopic 68
endmember difference provides the basis for ET partitioning (Yakir and Sternberg, 69
2000). Most partitioning studies focus on forest (Moreira et al., 1997; Wang and 70
Yakir, 2000; Yepez et al., 2003, 2007; Williams et al., 2004; Lai et al., 2006; 71
Robertson and Gazis, 2006; Xu et al., 2008; Dubbert et al., 2014b; Sun et al., 2014) 72
and grassland ecosystems (Ferretti et al., 2003; Yepez et al., 2005; Wenninger et al., 73
2010; Sutanto et al., 2012; Dubbert et al., 2013; Hu et al., 2014), but few studies have 74
been performed on cropland ecosystems (Wang and Yakir, 2000; Zhang et al., 2011). 75
An advantage of cropland systems is that conventional non-isotope methods for the 76
ET partitioning, such as the combination of micro-lysimeters to measure evaporation 77
and eddy covariance to measure evapotranspiration (Kool et al., 2014; Sutanto et al., 78
2014), can be implemented to check the isotopic results. However, the 79
micro-lysimeters have drawbacks of inability to measure during irrigation or rain, 80
time consuming, and limited representation due to small sample size (Kool et al., 81
2014). 82
83
Combined with the eddy covariance technique, measurement of the oxygen isotope 84
compositions of ecosystem water pools and fluxes can be used to partition the ET flux 85
into its component fluxes. A key challenge is to precisely determine the 18O 86
composition of ET (δET) (Yakir and Sternberg, 2000; Sutanto et al., 2014). At the 87
present time, most investigations have used the Keeling mixing model to infer δET 88

indirectly (Wang et al., 2000;Williams et al., 2004). The Keeling method is unreliable 89
for water vapor because of a large entrainment effect caused by strong gradients in the 90
vapor isotope composition across the top of the atmospheric boundary layer (Lee et al., 91
2012). Other limitations of the Keeling method to water isotopes include the 92
assumption that the isotopic composition of the evaporation and transpiration do not 93
change during the measurement interval (typically 30-60 minutes), the loss of water 94
vapor from the ecosystem only by turbulent mixing, and the varied concentration of 95
atmospheric water vapor only resulting from background vapor and local 96
evapotranspiration (Lee et al., 2007; Hu et al., 2014; Sutanto et al., 2014). 97
The second challenge is how to best capture dynamic variations of the 18O 98
composition of transpiration (δT). To date, δT can be determined with four approaches. 99
In isotopic steady state (ISS), δT is equal to the isotopic composition of plant source 100
water and can be derived from direct measurements of xylem water (δx) (e.g. Moreira 101
et al., 1997; Williams et al., 2004). In nonsteady state conditions, δT can be estimated 102
by models such as the Craig-Gordon (Craig and Gordon, 1965), the Dongman 103
(Dongmann et al., 1974), and the Farquhar-Cernusak model (Farquhar and Cernusak, 104
2005). In addition, δT can be also directly measured with leaf and branch chambers 105
(Wang et al., 2010; Dubbert et al., 2014a). Finally, δT can be calculated from the 106
isotopic mass balance using measurement of the foliage water pool changes over time 107
(Hu et al., 2014). The ISS assumption is frequently used in flux partitioning studies. 108
However, model results demonstrate that ISS is only met for short (hourly) timescales 109
at noon or in early afternoon (Welp et al., 2008). Few studies have evaluated the ISS 110
assumption via water pool and flux measurements (Hu et al., 2014). 111
112
The third challenge is related to quantification of the 18O composition of evaporation 113
(δE). Generally, δE is calculated with the Craig-Gordon model (Craig and Gordon, 114
1965; Yepez et al., 2003; Williams et al., 2004; Hu et al., 2014), whose input 115
variables include the isotopic composition of soil water at the evaporation front, 116
isotopic composition of water vapor (δv), relative humidity, and equilibrium and 117
kinetic fractionation factors. The model calculation is most sensitive to δv and the 118
determination of soil evaporation front (Sutanto et al., 2014). The endmember δE can 119
be also measured directly with soil chambers (Dubbert et al., 2013; Dubbert et al., 120
2014b). 121
122
Over the last several years, isotope ratio infrared spectroscopy (IRIS) has permitted 123
high-frequency and near-continuous in situ measurements of atmospheric δv (Lee et 124
al., 2005; Wen et al., 2008, 2012b; Griffis, 2013), providing an attractive alternative to 125
the traditional method involving collection of samples with cold traps and subsequent 126
measurement by isotope ratio mass spectrometry (IRMS) (Helliker et al., 2002).The 127
δv measurements of most previous studies (i.e., cold traps) are discrete and labor 128
intensive (Moreira et al., 1997; Wang and Yakir, 2000; Yepez et al., 2003; Xu et al., 129
2008). Advances in measuring the atmospheric δv, together with the flux-gradient or 130
eddy covariance technique, enables to quantification of δET (Wen et al., 2012a; Huang 131

and Wen, 2014). To date, only a few studies have deployed δET measured with the 132
micrometeorological methods for ET partitioning (Lee et al., 2007; Hu et al., 2014). 133
134
This study is concerned with the partitioning of ET into its components of E and T in 135
an irrigated cropland. The experiment was conducted as part of the Heihe Watershed 136
Allied Telemetry Experimental Research (HiWATER) program (Li et al., 2013). The 137
18O signals of the three flux endmembers (δET, δE and δT) were determined during the 138
growing season of a maize crop, in the middle reaches of Heihe River Watershed in 139
2012 using the flux gradient approach. The specific objectives of this study are: (1) to 140
characterize, in conjunction with intensive measurements of 18O composition of the 141
ecosystem water pools, isotopic steady state using isotopic mass balance at the 142
sub-daily scale, (2) to characterize the temporal dynamics of the 18O signals of ET, E 143
and T at the daily to seasonal scale, and quantify the contribution of T to ET using 144
isotopic labeling and lysimeter measurements. 145
146
2. Materials and Methods 147
2.1. Site description 148
The study site in Zhangye, Gansu Province was part of the Heihe Watershed Allied 149
Telemetry Experimental Research (HiWATER) program (Li et al., 2013). This sites 150
had good fetch (>200 m). The experiment was conducted in an arid artificial oasis 151
spring maize in the middle reaches of the Heihe River Watershed (38°51′ N, 100°22′ 152
E, 1550m asl) in northwest China. Over the past five decades (1961~2010), the daily 153
mean temperature was 7.4 ºC and the mean annual precipitation was 128.7 mm. The 154
experiment was conducted from May 27 to September 22 (DOY 148-265) in 2012. 155
Plastic films were used for water conservation, covering rate about 60% of the soil 156
surface. Flood irrigation water was applied four times (DOY 158, 184, 210 and 238) 157
during the growing season. Spring maize was planted on April 20 and harvested on 158
September 22, 2012. The maximum LAI and maximum canopy height were 5.6 m2 159
m-2 and 2.1 m, respectively. Additional details concerning site information and data 160
acquisition are described by Huang and Wen (2014) and Yang et al. (2015). 161
162
2.2. In-situ measurement of water vapor and evapotranspiration isotope ratios 163
The isotopic composition of water vapor in surface air (δv) was measured using a 164
cavity ring-down spectroscopy (CRDS) water vapor isotope analyzer (Model L1102-i, 165
Picarro Inc). The schematic diagram of the CRDS analyzer, its principle of operation, 166
and its calibration procedure were described in Huang and Wen (Huang and Wen, 167
2014). Briefly, air was pumped from two heights above the crop through heated tubes 168
to the analyzer for analysis. The heights of the two intakes were 0.5 and 1.5m higher 169
than the canopy and increased over the season from 0.6 m and 1.6 m above the ground 170
at the beginning to 2.6 m and 3.6 m by the end of the maize season to adjust for 171
canopy growth. The air samples were pumped through the analyzer sequentially with 172
120 sec spent on each measurement. The step changes in the HDO, H218O and H2
16O 173
mixing ratios in response to valve switching between two air sample intakes are given 174
in Fig. 1, indicating that the measurement approached steady state in less than 30 s 175

after each switching. For safety, 10 data points (~50s) after switching was discarded in 176
this study. The δv was calibrated in every 3 h using three span gases (Wen et al. 2008, 177
2012a; Huang and Wen, 2014). Three span gases with same isotopic ratios were 178
generated by the liquid vaporization module. Two of three were used to span the 179
atmospheric concentration of water vapor for calibrating the measurements. The 180
isotopic compositions of the calibration water were measured by a liquid water 181
isotope analyzer (Model DLT-100, Los Gatos Research Inc.). The data reported were 182
block-averaged to hourly intervals. 183
184
The molar flux isotope ratio (RET) of evapotranspiration (ET) was determined by the 185
flux-gradient technique using measurements at the two sampling heights above the 186
canopy (Lee et al., 2007; Wen et al., 2012a; Hu et al., 2014; Huang and Wen, 2014). 187
Here, RET was calculated hourly as 188
, ,
, ,
, ,
, , (1) 189
where Rd is the molar ratio of the calibration water, x is the hourly mean mixing ratio 190
of water isotopologues, superscripts 16 and 18 denote the 16O and 18O molecules in 191
water, subscripts s,1 and s,2 indicate span calibration vapor streams of 1 (lower) and 192
2 (higher), and subscripts a,1 and a,2 represent ambient air sampled at heights 1 193
(upper) and 2 (lower). The molar ratio RET was converted to the delta notation in 194
reference to the VSMOW standard as 195
1 1000‰ (2) 196
197
2.3 Measurement of isotopic compositions of ecosystem water pools 198
Leaf, and stem, and soil samples were collected during 13:00~15:00 every 2-3 days 199
from one sampling plot except after irrigation events. Distances of sampling plot from 200
the micrometeorological and isotopic towers were within the 30 m. Previous studies 201
had shown that the oxygen isotopic composition of leaf water could be pronounced 202
enrichment along the leaf (e.g., Affek et al., 2006). Therefore, leaf samples from the 203
upper and the lower canopy were archived separately, with main leaf vein removed, 204
each sample being a mixture of small leaf sections cut from the upper, middle and 205
bottom positions of the leaf. The root crown of one selected maize plant was sampled 206
to represent the 18O of the xylem water (Yang et al., 2015). Soil samples were 207
collected from the depth of 0-5, 5-10, 10-20, 20-30 and 30-40 cm, but also from the 208
depth of 40-50, 50-60, 60-70, and 70-80 cm every 9 days. After each irrigation event, 209
sampling of leaf, stem and soil was made during 13:00~15:00 for 7 consecutive days. 210
211
Four intensive campaigns were conducted during August 1-2, 17, 19-20, and 29-30 on 212
sunny days. Collection of leaf, xylem and soil samples, and measurement of leaf 213
water content were made every 3 h during the daytime (6:00 to 18:00) and 4 h during 214
the nighttime (18:00 to 6:00). Leaf water content was determined with leaf samples 215
from the upper and lower canopy. 216
217
A polyethylene bottle and a funnel were connected together to collect rain water. To 218
prevent evaporation, a ping-pang ball was put into the funnel. We also collected dew 219

water with a cotton swab before sunrise. After each irrigation event, irrigation water 220
was collected from both sides of the field. All of these samples were placed in bottles, 221
sealed with Parafilm and kept frozen in a refrigerator (−15 to −20 ◦C) prior to water 222
extraction. 223
224
Water in these solid samples was extracted cryogenically using a vacuum line. The 225
liquid samples (soil, xylem, leaf, precipitation, dew and irrigation water) were 226
analyzed for their isotope ratios on a liquid water isotope analyzer (Model DLT-100, 227
Los Gatos Research). 18O of xylem and leaf water were corrected for organic 228
contaminant following the procedure following the procedure of Xiao et al. (2012), 229
and cross-checked with the analysis by pyrolysis with a continuous flow method on a 230
mass spectrometer (MAT 253, Finnigan Inc.). The bias error (IRIS minus IRMS) was 231
-0.11±0.12‰ after the correction. The precision of the liquid water isotope analyzer 232
was typical better than 0.3‰ for D and 0.1‰ for 18O. 233
234
2.4 Auxiliary measurement 235
Supporting measurement consisted of an eddy covariance system (Model LI-7500, 236
Licor Inc., Lincoln, NB; Model CSAT-3, Campbell Scientific Inc., Logan, UT; Model 237
CR3000, Campbell Scientific Inc., Logan, UT), which was installed at the 4.5 m 238
height above the ground. All raw data were recorded at 10 Hz, and the 30min mean 239
CO2/H2O fluxes were calculated and stored by the CR5000 data logger. In brief, 240
double coordination rotation, and the Webb-Pearman-Leuning correction were 241

performed, detail in Huang and Wen (2014). Micrometeorological variables (air 242
temperature, relative humidity, wind speed, precipitation, soil temperature, and soil 243
moisture) were recorded at 1 Hz, with 30 min averages through a suite of 244
micrometeorological sensors mounted above the canopy and in the soil. Additional 245
details concerning data acquisition are further described in the literature (Xu et al., 246
2013; Liu et al., 2001, 2013). Nine homemade micro-lysimeters (10 cm in diameter, 247
and 15 cm in depth) were pushed into the non-mulched soil to retrieve an undisturbed 248
soil sample. Then, they were sealed at the bottoms, weighed manually and placed 249
back into the soil. After a period of one day, they were re-weighed to provide daily 250
measurement of soil evaporation. 251
252
2.5 Theoretical considerations 253
2.5.1. Flux isotope endmembers 254
The evapotranspiration flux (ET) consists of the plant transpiration (T) and the soil 255
evaporation (E). Their sign convention is such that a positive value indicates flux 256
upward toward the atmosphere and a negative value indicates downward flux toward 257
the ecosystem. Conservation principles require 258
(3) 259
(4) 260
where δET, δE and δT are the isotopic compositions of ET, E, and T, respectively. Here 261
δET was measured with the gradient diffusion method, δE was calculated according to 262
the Craig-Gordon model, and δT was determined according to the isotopic mass 263
balance of the leaf water pool during the intensive campaigns or approximated by the 264
isotopic composition of the xylem water at midday under the ISS assumption. 265
266
Equations (3) and (4) form the basis for understanding the relationship of the soil 267
evaporation and plant transpiration to the evapotranspiration. If the isotopic 268
endmembers are known precisely, the fractional contributions of soil evaporation and 269
plant transpiration to the evapotranspiration are given by 270
(5) 271
and 272
(6) 273
274
2.5.2 Isotopic composition of plant transpiration 275
Assuming the plant transpiration flux (T, g H2O m-2 s-1) equal to the difference 276
between the water flux from xylem (X, g H2O m-2 s-1) and the time rate of change of 277
canopy foliage water content (ΔLw, g H2O m-2 s-1), the mass fluxes and foliage pool of 278
18O should be in balance. These conservation principles are given as 279
T X ∆ /dt (7) 280
T X ∆ (8) 281
where δT, δX and δL are the isotopic composition of plant transpiration, xylem water, 282
and leaf water, respectively, and Lw is foliage water content (g H2O m-2), and were 283
measured in the intensive campaigns. 284
Incorporating Equation (7) into equation (8) yields the isotopic composition of plant 285

transpiration 286
∆ ∆ / (9) 287
Because all the parameters in the right side of Equation (9) were known except for T, 288
the solution for δT can be achieved by incorporating Equation (6) into equation (9) 289
(Hu et al., 2014). 290
291
2.5.3 Isotopic composition of soil evaporation 292
The isotopic composition of soil evaporation (δE) was calculated using the 293
Craig-Gordon model (Craig and Gordon, 1965; Yakir and Sternberg, 2000) 294
1000/)1()1(
)1(/
k
keqvesE
hh
hha
(10) 295
where δs represents the isotopic composition of liquid water at the evaporating front, 296
approximated here by the isotopic composition of soil water at the 0-5 cm depth, αe is 297
a temperature-dependent the equilibrium fractionation factor (Majoube, 1971),298
1000)/11( eeq is the equilibrium fractionation factor expressed in ‰, k is 299
a kinetic factor, and h is relative humidity normalized to the soil temperature at the 300
0-5 cm depth. In Equation (10), h and δv were measured at the upper intake of the 301
CRDS analyzer. If diffusion is molecular, th k is equal to 28‰ for H218O (Merlivat, 302
1978). In canopy-scale studies, the variables in Equations (10) are measured above the 303
canopy. According to Lee et al. (2009), k should be calculated according to 304
)/()1928( absbsk rrrrr (11) 305
where the soil resistance (rs), boundary-layer resistance (rb), and aerodynamic 306
resistance (ra) and were calculated using data acquired by EC tower system 307
measurements according to the methods of Lee et al. (2009) and Xiao et al. (2010). 308
309
3. Results 310
3.1 Validation of the isotopic steady state assumption at early afternoon 311
Fig. 2a illustrates the diurnal time series of δT – δx, ET flux during the intensive field 312
campaigns. The error bar represents one standard error of the observations made at the 313
same time of the day. At sub-day time scales, the isotopic composition of T (δT) was 314
calculated during the intensive campaigns using isotopic mass balance (Equation 9). 315
The flux (assumed equal to ET) weighted mean δT and δx were -6.06‰ and -5.93‰, 316
respectively. The dependence of ensemble mean diurnal cycles of δT – δx on the ET 317
flux during the intensive field campaigns was shown in Fig. 2b. According to the 318
isotopic mass balance of the foliage water, δT was lower than δx in the morning as δL 319
increased with time, and greater than δx in the evening as δL decreased with time. In 320
Fig. 2, we relate δT and δx to ET by taking the difference between δT and δx to define 321
the relationship between the non-steady state behaviors (δT - δx) and ET. The 322
differences between δT and δx were negligible when ET approached the daytime 323
maximum, indicating that isotopic steady state (ISS) was reached during early 324
afternoon hours (13:00-15:00). 325
326
3.2 Seasonal variation of the three flux endmembers at early afternoon 327
Fig. 3 illustrates seasonal variations in the 18O composition of evapotranspiration (δET), 328
evaporation (δE), and transpiration (δT) during early afternoon hours (13:00-15:00). 329

Four irrigation events were indicated for reference. The δET value was averaged over 330
the early afternoon hours (13:00-15:00). At this time of the day, δT was approximated 331
by the 18O signal of xylem water (δx) assuming ISS. Based on the isotopic and 332
meteorological data acquired between 13:00-15:00, δE was calculated from the 333
Craig-Gordon model. Because T and E are in same signs in Equation (4), 334
mathematically δET must fall in the range bounded by δT and δE, such that δE < δET < 335
δT. Over the whole experimental period, the mean δE and δET and δT were (mean ± one 336
standard deviation) -38.48 ± 3.18‰, -9.77 ± 1.91‰ and -5.74 ± 0.92‰, respectively. 337
The irrigation dates were 6 June (DOY 158, irrigation amount 111.6 mm), 2 July 338
(DOY 184, 141.9 mm), 28 July (DOY 210, 149.7 mm) and 25 August (DOY 238, 339
149.7 mm) 2012. Because 80–90% of the Heihe River water originates from the upper 340
mountainous area, the isotopic composition of the irrigation water (-8.66 ± 0.30‰) 341
was more depleted than the soil water (Yang et al., 2015). After each irrigation event, 342
the three isotopic endmembers fluctuated obviously. Furthermore, δE decreased more 343
sharply than δET and δT. 344
345
3.3 Isotopic partitioning at early afternoon 346
The isotopic data were used to constrain the component fluxes (Fig. 3). Fig. 4 347
illustrates the relative contribution of transpiration (T) to evapotranspiration (ET) 348
using isotopic labeling and the lysimeter/eddy covariance measurements. Also shown 349
in Fig. 4 are leaf area index (LAI) and four irrigation events. In Fig. 4, the relative 350
contribution of T to ET was evaluated in early afternoon (13:00-15:00) using isotopic 351

labeling and at the whole day (0:00-24:00) using the lysimeter/eddy covariance 352
measurement. Generally, the result of isotopic labeling was consistent with soil 353
lysimeter measurements. During the growing season, the relative contribution of T to 354
ET was 0.88 ± 0.056 and 0.85 ± 0.088 from isotopic labeling and from the lysimeter 355
observation, respectively. However, a large discrepancy (0.36 ± 0.078) was observed 356
right after the first irrigation event (DOY 158). The discrepancy for other irrigation 357
events has a mean value of 0.04 ± 0.012. The lysimeter method could generally serve 358
as a validation for other ET partition methods (Kool et al., 2014). The discrepancy 359
after the first irrigation event was likely due to no canopy closure in the field. In this 360
case, the isotopic composition of liquid water at the evaporating front was 361
unreasonably approximated by the isotopic composition of soil water at the 0-5 cm 362
depth. Excluding the result after the first irrigation event, the T/ET ratio varied from 363
0.71 to 0.96, with the mean (± one standard deviation) of 0.87 (± 0.052) from isotopic 364
labeling, and from 0.66 to 0.95 with the mean of 0.86 (± 0.058) from the lysimeter 365
observation, suggesting that our isotopic labeling approach was robust. The relative 366
high contribution of soil evaporation was out of our expectation, because about 60% 367
of the field was covered with plastic films. This might be due to the fact that the field 368
was irrigated frequently during the growing season. Therefore, the available soil water 369
for evaporation was always plentiful in the non-mulched soil. LAI decreased abruptly 370
on DOY 218 due to removal of male maize plants. It also steeply dropped on DOY 371
257 because heavy frosts occurred in the late growing season. Wang et al. (2014) 372
synthesized previous published papers and concluded that LAI has predominant 373

impacts on T/ET. However, the percentage of T/ET declined slightly according to 374
both the isotopic labeling and the lysimeter method (Fig. 4). This could be because of 375
the high maize density of this field for seed production. 376
377
3.4 Isotopic partitioning at the growing season scale 378
Fig. 5 is a schematic representation of the average isotopic signals of various 379
ecosystem water pools and fluxes during the growing season (DOY 148-265). 380
Numbers in parentheses indicate total fluxes in mm. The analysis was restricted to 381
seasonal time scale. The 18O composition of ET, precipitation, dew and soil water 382
were the mean values weighted by water vapor flux, precipitation amount, dew 383
amount and soil water content, respectively. δT was assumed to be the same as mean δx 384
weighted by water vapor flux in early afternoon (13:00-15:00). δi was the algebraic 385
mean of all the valid observations during the 4 irrigation events. 386
387
The seasonal total ET was 425.7 mm based on the eddy covariance. Giving the T/ET 388
ratio of 0.87 for the growing season, this flux was partitioned as 56.0 mm for soil 389
evaporation and 369.7 mm for plant transpiration. The mean δET and δT were -8.57‰ 390
and -5.83‰, respectively. According to the isotopic mass balance, δE was -26.93‰ 391
during the growing season. As for the influxes during growing season, the total 392
precipitation amount was 103.2 mm with the amount-weighted average isotopic 393
composition of -5.70‰. The total irrigation amount was 552.9 mm, with an isotopic 394
value of -8.66‰. The amount of dewfall, calculated with the flux-profile method, was 395
9.9 mm, equivalent to about 10% of the precipitation input. The frequency of dew 396
formation was 59% in this site, and the amount-weighted average isotopic 397
composition of dew water was -4.05‰. The 18O composition of the surface (0-5 cm), 398
shallow (5-40 cm) and deep (40-80 cm) soil water were -5.40‰, -7.64‰, and -7.81‰, 399
respectively. The net change in soil water storage were 1.9 mm, -4.7 mm, and 7.4 mm 400
between DOY 148 and DOY 265 in these soil layers. Over the growing season, the 401
net change in soil water storage was negligible (4.6 mm) in comparison to the water 402
fluxes. 403
404
According to isotopic mass conservation, 18O composition of the deep percolation or 405
runoff (-7.37‰) was a little higher than deep soil water (-7.81‰), and within the 406
range of precipitation and irrigation water. This is probably because it was calculated 407
based on the 18O mass conservation without considering the evaporation of dew water 408
and intercepted rain. Overall, the 18O mass conservation requires that the decreased 409
18O composition of ET be balanced by enhanced 18O composition of runoff water. 410
411
4. Discussion 412
In order to use the isotopic labeling approach to partition ET, we must first quantify 413
the three end endmembers of δT and δE and δET. Methods for determining these three 414
end members have varying degrees of uncertainty (Kool et al., 2014; Sutanto et al., 415
2014). Several assumptions in the isotope mass balance model may contribute to 416
uncertainty in the ET partitioning. 417
418
Traditionally, δET is inferred by fitting the δv to the inverse of water vapor mixing 419
ratio with the Keeling plot approach (Yakir and Sternberg, 2000). The Keeling plot 420
approach implicitly assumes that the observed temporal variations of δv are 421
attributable only to ET. In reality, δv in the atmospheric surface layer are also 422
influenced by processes unrelated to surface ET. For this reason, the intercept of 423
Keeling plot is an ambiguous quantity (Lee et al., 2006 , 2007 , 2012; Griffis et al., 424
2007). Measuring the atmospheric δv with IRIS technique (Lee et al., 2005; Wen et al., 425
2008, 2012a), together with the flux-gradient technique, enabled us to quantify δET 426
(Lee et al., 2007; Wang et al., 2010; Good et al., 2012; Wen et al., 2012b; Hu et al., 427
2014; Huang and Wen, 2014). However, the flux-gradient and Keeling plot methods 428
were shown to have similar uncertainty of 5.83‰ and 5.89‰ for 18O (Good et al., 429
2012). Lee et al. (2007) reported an hourly precision of 1.4‰ for δET with the 430
flux-gradient approach through a series of laboratory tests. The uncertainty of δET 431
could also be indicated by the standard error of δET within each hour in field 432
implementation (Hu et al., 2014; Huang and Wen, 2014). For all the hourly data 433
during the growing season, the average uncertainty of δET was 4.6‰ (ranging from 434
0.2‰ to 35.2‰) in our site (Huang et al., 2014). Over a temperate grassland, the δET 435
uncertainty varies from 0.8‰ to 53‰, with an average of 7.9‰ (Hu et al., 2014). 436
Although the uncertainty of δET was huge for the entire day, it would approach to the 437
minimum of uncertainty in early afternoon (13:00-15:00) when the water vapor 438
gradient between the two sampling intakes reaches its maximum. Good et al. (2012) 439
suggested that potential uncertainties of δET by the flux-gradient method mainly 440
results from different footprints at the two intake heights, variability in atmospheric 441
conditions, instrument precision, and the averaging method to calculate hourly δET. At 442
the sub-daily scale, the uncertainty is relatively small from δT and δE but quite large 443
from δET, so improving the precision of δET should be a priority (Hu et al., 2014). 444
However, the uncertainty of δET (Fig. 3) was small in early afternoon (13:00-15:00) 445
when the water vapor gradient between the two sampling intakes approached the 446
maximum value of the diurnal cycle. 447
448
It is very challenging to capture the dynamic variations of δT, therefore, most of 449
previous studies partitioning ET under steady state assumption (e.g. Moreira et al., 450
1997; Wang and Yakir, 2000; Ferretti et al., 2003; Williams et al., 2004). As an 451
alternative to the ISS assumption, δT can be estimated with the non-steady state leaf 452
isotopic models (Dongmann et al., 1974; Farquhar and Cernusak, 2005). Estimating 453
the water isotopic composition at the leaf evaporating front (δL,e) is critical to resolve 454
δT (Xiao et al., 2012). Many parameters are required for estimating δL,e. One such 455
parameter is the Péclet number, which is difficult to constrain at the canopy scale 456
(Xiao et al., 2012; Hu et al., 2014). Because stomatal conductance is used for the leaf 457
water balance calculation, meaningful results require that the conductance be 458
measured hourly in the field or be computed with a robust photosynthesis model. In 459
absence of data on these parameters, we were forced to adopt the ISS assumption, that 460
δT assume is the same as that of the xylem water (δx). Our isotopic mass balance 461

results illustrate that δT at this site was not at ISS in the morning but rapidly 462
approached and remained near ISS during the early afternoon (Fig. 2). Sutanto et al. 463
(2014) reviewed that the ISS assumption is only valid at midday for short timescale 464
(hourly) due to rapidly changing environmental conditions. Recent models studies 465
show that the ISS assumption is satisfied during very limited midday hours (Farquhar 466
and Cernusak, 2005; Yepez et al., 2005; Lai et al., 2006; Xiao et al., 2012). Our study 467
is one of the few studies that evaluated ISS by measuring the foliage water pools and 468
the flux in field conditions (Hu et al., 2014). The isotopic signal of plant transpiration 469
(δT) was so heavy and similar to surface soil water (0-5 cm) in this study. This was 470
consistent with the results that more than 71% of the plant water was acquired from 471
0-5 cm soil layer in this plot (Yang et al., 2015). In addition, δT can be also measured 472
with chambers (Wang et al., 2010; Dubbert et al., 2014a). 473
474
The isotopic signal of soil evaporation (δE) is generally estimated with the 475
Craig-Gordon model. Key parameters in the model include δv, the isotopic 476
composition of water at the soil evaporating front, and the kinetic fractionation factor 477
appropriate for ambient conditions (Craig and Gordon, 1965; Yakir and Sternberg, 478
2000; Braud et al., 2009). In the present study, δv was measured at fine (hourly) time 479
scale resolutions. Recent studies have showed that δv is variable at hourly, diurnal, 480
and seasonal time scales due to influences by hydrological events such as 481
precipitation, dew formation, and dew evaporation (Welp et al., 2008; Wen et al., 482
2012a). The determination of the evaporation front at the soil surface in case of 483

saturation for determination of δs should be considered carefully (Rothfuss et al., 484
2010). In this site, δs was approximated here by the isotopic composition of soil water 485
at the 0-5 cm depth. The kinetic fractionation factor associated with soil evaporation, 486
k , was calculated as a weighted mean according to the soil resistance (rs), the 487
boundary-layer resistance (rb), and the aerodynamic resistance (ra) (Lee et al., 2009; 488
Xiao et al., 2012). In this formulation, k is a variable quantity, having lower values 489
observed under moister soil conditions. For the data shown in Fig. 3, k varied 490
between 22.3‰ and 27.5‰. However, during the first flood irrigation event, δs was 491
unreasonably approximated by the isotopic composition of soil water at the 0-5 cm 492
depth because of quickly change of the soil evaporation front in the exposed sunny 493
conditions. In addition, the δE can be also measured directly with soil chambers 494
(Dubbert et al., 2013; Dubbert et al., 2014b). However, the chamber method would 495
disturb the kinetics associated with evaporation. 496
497
To date, there is no consensus as to which ET partition method is most accurate, so an 498
absolute validation of the isotopic method is not possible (Kool et al., 2014; Sutanto et 499
al., 2014). In some partition methods, soil evaporation and plant transpiration are 500
measured at different spatial scales. Micro-lysimeters are considered a reliable 501
method to measure E and often serve, in conjunction of eddy covariance measurement, 502
as validation for the isotopic labeling method (Kool et al., 2014). In a review of 503
isotope-based studies, Sutanto et al. (2014) found that T contributes generally more 504
than 70% to the ET, while other techniques lead to smaller T/ET. In this study, the 505

result of isotopic labeling was in good agreement with soil lysimeter/eddy covariance 506
measurements (Fig. 4). The E/ET ratio is expected to be greater when the atmospheric 507
demand or water availability in the soil is higher. Kool et al. (2014) showed that E/ET 508
seems to be particularly high (50–60%) in flood irrigated systems. In their study, soil 509
evaporation rates initially are high following the wetting event, but decline rapidly as 510
the soil surface dries. 511
512
5. Conclusions 513
At the sub-daily scale, we relate δT and δx to ET by taking the difference between δT 514
and δx to define the relationship between the non-steady state behaviors (δT - δx) and 515
ET. The differences between δT and δx were negligible when ET approached the 516
daytime maximum, indicating that isotopic steady state (ISS) was reached during the 517
early afternoon (13:00 - 15:00). 518
519
At the daily scale, excluding the result after the first irrigation event, the relative 520
contribution of T to ET varied from 0.71 to 0.96 with the mean of 0.87 ± 0.052 for 521
isotopic labeling, and from 0.66 to 0.95 with the mean of 0.86 ± 0.058 for lysimeter 522
observations. The consistent results suggested that our isotopic labeling approach was 523
robust (p = 0.446). 524
525
At the growing season scale (DOY 148-265), deep percolation (runoff water, δR = 526
-7.37‰) has δ18O within the range of precipitation (δp = -5.70‰) and irrigation water 527

(δi = -8.66‰) according to the prediction of isotopic mass conservation. Over the 528
growing season, when net change in soil water storage become negligible (4.6 mm), 529
the 18O mass conservation requires that the decreased δ18O of ET (δET = -8.57‰) be 530
balanced by enhanced δ18O of runoff water. 531
532
Acknowledgements 533
This study was supported by the National Natural Science Foundation of China 534
(Grant 91125002) and the Chinese Academy of Sciences Strategic Priority Research 535
Program (Grant No. XDA05050601). XL also acknowledges support by the US 536
National Science Foundation (Grant EAR-1520684). The data for this paper are 537
available at the Data Center for Cold and Arid Region Sciences 538
(http://westdc.westgis.ac.cn). Data set 1: Data set of stable isotopic observation 539
(doi:10.3972/hiwater.108.2013.db). Data set 2: Data set of flux observation matrix 540
(Daman Superstation, doi:10.3972/hiwater.073.2013.db). Data set 3: Data set of 541
measurements of channel flow (doi: 10.3972/hiwater.123.2013.db). 542
543
References 544
Affek, H.P., Krisch, M.J., Yakir, D., 2006. Effects of intraleaf variations in carbonic anhydrase activity 545
and gas exchange on leaf C18OO isoflux in Zea mays. New Phytol.169(2), 321-329. 546
Braud, I., Biron, P., Bariac, T., Richard, P., Canale, L., Gaudet, J.P.,Vauclin, M., 2009. Isotopic 547
composition of bare soil evaporated water vapor. Part I: RUBIC IV experimental setup and results. 548
J.Hydrol. 369 (1-2), 1-16. 549

Craig, H.,Gordon, L., 1965. Deuterium and oxygen 18 variations in the ocean and the marine 550
atmosphere. In: Tongiorgi E (ed). Stable Isotopes in Oceanographic Studies and Paleotemperatures. 551
Laboratory of Geology and Nuclear Science, Pisa, Italy, 9-130. 552
Dongmann, G., Nürnberg, H., Förstel, H.,Wagener, K., 1974. On the enrichment of H218O in the leaves 553
of transpiring plants. Radiat. Environ. Bioph. 11 (1), 41-52. 554
Dubbert, M., Cuntz, M., Piayda, A., Maguas, C.,Werner, C., 2013. Partitioning evapotranspiration - 555
Testing the Craig and Gordon model with field measurements of oxygen isotope ratios of 556
evaporative fluxes. J. Hydrol. 496, 142-153. 557
Dubbert, M., Cuntz, M., Piayda, A.,Werner, C., 2014a. Oxygen isotope signatures of transpired water 558
vapor: the role of isotopic non-steady-state transpiration under natural conditions. New Phytol. 203 559
(4), 1242-1252. 560
Dubbert, M., Piayda, A., Cuntz, M., Correia, A.C., Silva, F.C.E., Pereira, J.S.,Werner, C., 2014b. 561
Stable oxygen isotope and flux partitioning demonstrates understory of an oak savanna contributes 562
up to half of ecosystem carbon and water exchange. Front. Plant Sci. 5: 530. doi: 563
10.3389/fpls.2014.00530. 564
Farquhar, G.,Cernusak, L., 2005. On the isotopic composition of leaf water in the non-steady state. 565
Funct. Plant Biol. 32 (4), 293-303. 566
Ferretti, D.F., Pendall, E., Morgan, J.A., Nelson, J.A., LeCain, D.,Mosier, A.R., 2003. Partitioning 567
evapotranspiration fluxes from a Colorado grassland using stable isotopes: Seasonal variations and 568
ecosystem implications of elevated atmospheric CO2. Plant Soil 254 (2), 291-303. 569
Good, S.P., Soderberg, K., Wang, L.X.,Caylor, K.K., 2012. Uncertainties in the assessment of the 570
isotopic composition of surface fluxes: A direct comparison of techniques using laser-based water 571

vapor isotope analyzers. J. Geophys. Res. 117. D15301, doi: 10.1029/2011JD017168. 572
Griffis, T.J., Zhang, J., Baker, J.M., Kljun, N.,Billmark, K., 2007. Determining carbon isotope 573
signatures from micrometeorological measurements: Implications for studying 574
biosphere-atmosphere exchange processes. Bound. Lay. Meteorol. 123 (2), 295-316. 575
Griffis, T.J., 2013. Tracing the flow of carbon dioxide and water vapor between the biosphere and 576
atmosphere: A review of optical isotope techniques and their application. Agric. For. Meteorol. 174, 577
85-109. 578
Guo, X.Y., Feng, Q., Wei, Y.P., Li, Z.X.,Liu, W., 2015. An overview of precipitation isotopes over the 579
Extensive Hexi Region in NW China. Arab. J. Geosci. 8 (7), 4365-4378. 580
Helliker, B., Roden, J., Cook, C.,Ehleringer, J., 2002. A rapid and precise method for sampling and 581
determining the oxygen isotope ratio of atmospheric water vapor. Rapid Commun. Mass Spectrom. 582
16 (10), 929-932. 583
Hu, Z.M., Wen, X.F., Sun, X.M., Li, L.H., Yu, G.R., Lee, X.H.,Li, S.G., 2014. Partitioning of 584
evapotranspiration through oxygen isotopic measurements of water pools and fluxes in a temperate 585
grassland. J. Geophys. Res. 119 (3), 358-371. 586
Huang, L.J.,Wen, X.F., 2014. Temporal variations of atmospheric water vapor δD and δ18O above an 587
arid artificial oasis cropland in the Heihe River Basin. J. Geophys. Res. 119 (19), 11456-11476. 588
Keeling, C.D., 1958. The concentration and isotopic abundances of atmospheric carbon dioxide in rural 589
areas. Geochim. Cosmochim. Ac. 13 (4), 322-334. 590
Kool, D., Agam, N., Lazarovitch, N., Heitman, J.L., Sauer, T.J.,Ben-Gal, A., 2014. A review of 591
approaches for evapotranspiration partitioning. Agric. For. Meteorol. 184, 56-70. 592
Lai, C.T., Ehleringer, J.R., Bond, B.J.,U, K.T.P., 2006. Contributions of evaporation, isotopic 593
non-steady state transpiration and atmospheric mixing on the δ18O of water vapour in Pacific 594
Northwest coniferous forests. Plant Cell Environ. 29 (1), 77-94. 595
Lee, X., Sargent, S., Smith, R.,Tanner, B., 2005. In situ measurement of the water vapor 18O/16O 596
isotope ratio for atmospheric and ecological applications. J. Atmos. Ocean. Tech. 22 (5), 555-565. 597
Lee, X., Smith, R.,Williams, J., 2006. Water vapour 18O/16O isotope ratio in surface air in New England, 598
USA. Tellus B 58 (4), 293-304. 599
Lee, X., Kim, K.,Smith, R., 2007. Temporal variations of the 18O/16O signal of the whole-canopy 600
transpiration in a temperate forest. Global Biogeochem. Cycles, 21 (3), GB3013, 601
doi:10.1029/2006GB002871. 602
Lee, X., Griffis, T., Baker, J., Billmark, K., Kim, K.,Welp, L., 2009. Canopy-scale kinetic fractionation 603
of atmospheric carbon dioxide and water vapor isotopes. Global Biogeochem. Cycles, 23 (1), 604
GB1002, doi:10.1029/2008GB003331. 605
Lee, X., Huang, J.P.,Patton, E.G., 2012. A large-eddy simulation study of water vapour and carbon 606
dioxide isotopes in the atmospheric boundary layer. Bound. Lay. Meteorol. 145 (1), 229-248. 607
Li, X., Cheng, G.D., Liu, S.M., Xiao, Q., Ma, M.G., Jin, R., Che, T., Liu, Q.H., Wang, W.Z., Qi, Y., 608
Wen, J.G., Li, H.Y., Zhu, G.F., Guo, J.W., Ran, Y.H., Wang, S.G., Zhu, Z.L., Zhou, J., Hu, 609
X.L.,Xu, Z.W., 2013. Heihe watershed allied telemetry experimental research (HiWATER): 610
scientific objectives and experimental design. B. Am. Meteorol. Soc. 94 (8), 1145-1160. 611
Liu, S.M., Xu, Z.M., Zhu, Z.L., Jia, Z.Z., Zhu. M.J., 2013. Measurements of evapotranspiration from 612
eddy-covariance systems and large aperture scintillometers in the Hai River Basin, China. Journal 613
of Hydrology. 487, 24-38. 614
Liu, S.M., Xu, Z.M., Wang, W.Z., Jia, Z.Z., Zhu, M.J., Wang, J.M., 2011. A comparison of 615

eddy-covariance and large aperture scintillometer measurements with respect to the energy balance 616
closure problem. Hydrol. Earth Syst. Sci. 15, 1291-1306. 617
Majoube, M., 1971. Oxygen-18 and deuterium fractionation between water and steam. J. Chim.Phys. 618
Chim. Biolo. 68 (10), 1423-1436. 619
Merlivat, L., 1978. Molecular diffusivities of H216O, HD16O and H2
18O in gases. J. Chem. Phys. 69(6), 620
2864–2871. 621
Moreira, M.Z., Sternberg, L.D.L., Martinelli, L.A., Victoria, R.L., Barbosa, E.M., Bonates, 622
L.C.M.,Nepstad, D.C., 1997. Contribution of transpiration to forest ambient vapour based on 623
isotopic measurements. Global Change Biol. 3 (5), 439-450. 624
Robertson, J.A.,Gazis, C.A., 2006. An oxygen isotope study of seasonal trends in soil water fluxes at 625
two sites along a climate gradient in Washington state (USA). J. Hydrol. 328 (1-2), 375-387. 626
Rothfuss, Y., Biron, P., Braud, I., Canale, L., Durand, J.L., Gaudet, J.P., Richard, P., Vauclin, 627
M.,Bariac, T., 2010. Partitioning evapotranspiration fluxes into soil evaporation and plant 628
transpiration using water stable isotopes under controlled conditions. Hydrol. Process. 24 (22), 629
3177-3194. 630
Sun, S.J., Meng, P., Zhang, J.S., Wan, X.C., Zheng, N.,He, C.X., 2014. Partitioning oak woodland 631
evapotranspiration in the rocky mountainous area of North China was disturbed by foreign vapor, 632
as estimated based on non-steady-state O-18 isotopic composition. Agric. For. Meteorol. 184, 633
36-47. 634
Sutanto, S.J., Wenninger, J., Coenders-Gerrits, A.M.J.,Uhlenbrook, S., 2012. Partitioning of 635
evaporation into transpiration, soil evaporation and interception: A comparison between isotope 636
measurements and a HYDRUS-1D model (vol 16, pg 2605, 2012). Hydrol. Earth Syst. Sci. 16 (9), 637

3261-3261. 638
Sutanto, S.J., van den Hurk, B., Dirmeyer, P.A., Seneviratne, S.I., Rockmann, T., Trenberth, K.E., 639
Blyth, E.M., Wenninger, J.,Hoffmann, G., 2014. HESS Opinions "A perspective on isotope versus 640
non-isotope approaches to determine the contribution of transpiration to total evaporation". Hydrol. 641
Earth Syst. Sci. 18 (8), 2815-2827. 642
Wang, L.X., Caylor, K.K., Villegas, J.C., Barron-Gafford, G.A., Breshears, D.D.,Huxman, T.E., 2010. 643
Partitioning evapotranspiration across gradients of woody plant cover: Assessment of a stable 644
isotope technique. Geophys. Res. Lett. 37, L09401, doi: 10.1029/2010GL043228. 645
Wang, L.X., Good, S.P., Caylor, K.K., 2014. Global synthesis of vegetation control on 646
evapotranspiration partitioning. Geophy. Res. Let., 41, 6753- 6757. 647
Wang, X.F.,Yakir, D., 2000. Using stable isotopes of water in evapotranspiration studies. Hydrol. 648
Process. 14 (8), 1407-1421. 649
Welp, L., Lee, X., Kim, K., Griffis, T., Billmark, K.,Baker, J., 2008. δ18O of water vapour, 650
evapotranspiration and the sites of leaf water evaporation in a soybean canopy. Plant cell environ. 651
31 (9), 1214-1228. 652
Wen, X., Sun, X., Zhang, S., Yu, G., Sargent, S.,Lee, X., 2008. Continuous measurement of water 653
vapor D/H and 18O/16O isotope ratios in the atmosphere. J. Hydrol. 349 (3-4), 489-500. 654
Wen, X., Lee, X., Sun, X., Wang, J., Hu, Z., Li, S.,Yu, G., 2012a. Dew water isotopic ratios and their 655
relationships to ecosystem water pools and fluxes in a cropland and a grassland in China. Oecologia, 656
549-561. 657
Wen, X., Lee, X., Sun, X., Wang, J., Tang, Y., Li, S.,Yu, G., 2012b. Intercomparison of four 658
commercial analyzers for water vapor isotope measurement. J. Atmos. Ocean. Tech. 29 (2), 659

235-247. 660
Wenninger, J., Beza, D.T.,Uhlenbrook, S., 2010. Experimental investigations of water fluxes within the 661
soil-vegetation-atmosphere system: Stable isotope mass-balance approach to partition evaporation 662
and transpiration. Phys. Chem. Earth 35 (13-14), 565-570. 663
Williams, D.G., Cable, W., Hultine, K., Hoedjes, J.C.B., Yepez, E.A., Simonneaux, V., Er-Raki, S., 664
Boulet, G., de Bruin, H.A.R., Chehbouni, A., Hartogensis, O.K.,Timouk, F., 2004. 665
Evapotranspiration components determined by stable isotope, sap flow and eddy covariance 666
techniques. Agric. For. Meteorol. 125 (3-4), 241-258. 667
Xiao, W., Lee, X., Griffis, T.J., Kim, K., Welp, L.R.,Yu, Q., 2010. A modeling investigation of 668
canopy-air oxygen isotopic exchange of water vapor and carbon dioxide in a soybean field. J. 669
Geophys. Res. 115, G01004, doi: 10.1029/2009JG001163. 670
Xiao, W., Lee, X., Wen, X., Sun, X.,Zhang, S., 2012. Modeling biophysical controls on canopy foliage 671
water 18O enrichment in wheat and corn. Global Change Biol. 18 (5), 1769-1780. 672
Xu, Z., Yang, H.B., Liu, F.D., An, S.Q., Cui, J., Wang, Z.S.,Liu, S.R., 2008. Partitioning 673
evapotranspiration flux components in a subalpine shrubland based on stable isotopic 674
measurements. Bot. Stud. 49 (4), 351-361. 675
Xu, Z.W., Liu, S.M., Li, X., Shi, S.J., Wang, J.M., Zhu, Z.L., Xu, T.R., Wang, W.Z., and Ma, M.G. 676
2013. Intercomparison of surface energy flux measurement systems used during the 677
HiWATER-MUSOEXE, J. Geophys. Res. Atmos. 118, 13140-13157. 678
Yakir, D.,Sternberg, L.S.L., 2000. The use of stable isotopes to study ecosystem gas exchange. 679
Oecologia, 123 (3), 297-311. 680
Yang, B., Wen, X.F.,Sun, X.M., 2015. Irrigation depth far exceeds water uptake depth in an oasis 681

cropland in the middle reaches of Heihe River Basin. Sci. Rep. 5: 15206, doi: 10.1038/srep15206. 682
Yepez, E.A., Williams, D.G., Scott, R.L.,Lin, G.H., 2003. Partitioning overstory and understory 683
evapotranspiration in a semiarid savanna woodland from the isotopic composition of water vapor. 684
Agric. For. Meteorol. 119 (1-2), 53-68. 685
Yepez, E.A., Huxman, T.E., Ignace, D.D., English, N.B., Weltzin, J.F., Castellanos, A.E.,Williams, 686
D.G., 2005. Dynamics of transpiration and evaporation following a moisture pulse in semiarid 687
grassland: A chamber-based isotope method for partitioning flux components. Agric. For. Meteorol. 688
132 (3-4), 359-376. 689
Yepez, E.A., Scott, R.L., Cable, W.L.,Williams, D.G., 2007. Intraseasonal variation in water and 690
carbon dioxide flux components in a semiarid riparian woodland. Ecosystems, 10 (7), 1100-1115. 691
Zhang, Y.C., Shen, Y.J., Sun, H.Y.,Gates, J.B., 2011. Evapotranspiration and its partitioning in an 692
irrigated winter wheat field: A combined isotopic and micrometeorologic approach. J. Hydrol. 408 693
(3-4), 203-211. 694
695
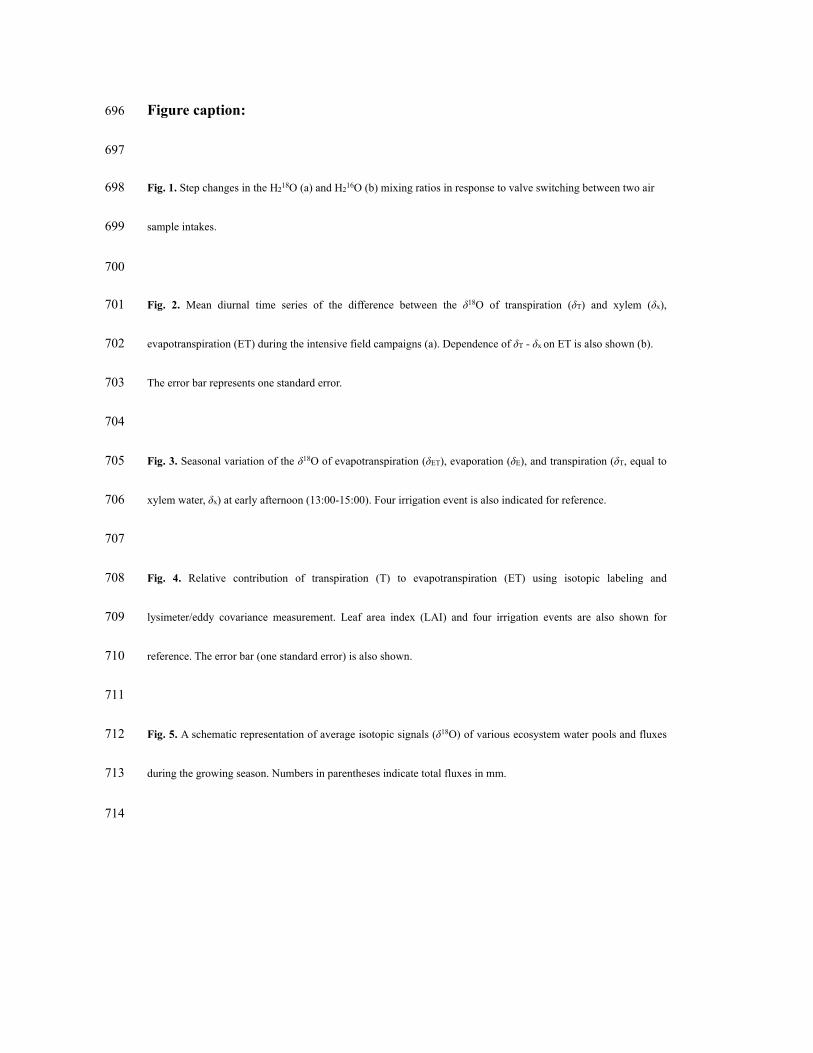
Figure caption: 696
697
Fig. 1. Step changes in the H218O (a) and H2
16O (b) mixing ratios in response to valve switching between two air 698
sample intakes. 699
700
Fig. 2. Mean diurnal time series of the difference between the δ18O of transpiration (δT) and xylem (δx), 701
evapotranspiration (ET) during the intensive field campaigns (a). Dependence of δT - δx on ET is also shown (b). 702
The error bar represents one standard error. 703
704
Fig. 3. Seasonal variation of the δ18O of evapotranspiration (δET), evaporation (δE), and transpiration (δT, equal to 705
xylem water, δx) at early afternoon (13:00-15:00). Four irrigation event is also indicated for reference. 706
707
Fig. 4. Relative contribution of transpiration (T) to evapotranspiration (ET) using isotopic labeling and 708
lysimeter/eddy covariance measurement. Leaf area index (LAI) and four irrigation events are also shown for 709
reference. The error bar (one standard error) is also shown. 710
711
Fig. 5. A schematic representation of average isotopic signals (δ18O) of various ecosystem water pools and fluxes 712
during the growing season. Numbers in parentheses indicate total fluxes in mm. 713
714

Figure 1 715
716
717

Figure 2 718
719
720
721

Figure 3 722
723
724
725

Figure 4 726
727
728

Figure 5 729
730
731
732
733