everest group - bps top 50 2018 · the everest group bps top 50™ is a global list of the 50...
TRANSCRIPT

Everest Group BPS Top 50 | 2018
May 2018
2
Based on market feedback and to reflect the momentum in service providers’ businesses, this year’s ranking is based on both revenues and year-on-year growth (whereas the previous years’ rankings were based solely on revenues).
HOW IS THE EVEREST GROUP BPS TOP 50 ™ DIFFERENT IN 2018?
The global third-party BPS industry is valued at more than US$175 billion. Over the years, this industry has evolved significantly, both in breadth and depth of services. What started as a cost optimization concept focusing on “non-core” and “back-office” business processes, today permeates the entire business process value chain addressing a wide variety of business objectives. Naturally, the industry has attracted many service providers from a broad range of backgrounds and heritages. Today, Everest Group estimates there are more than 200 service providers with more than US$50 million in revenues offering BPS services around the globe. Some are pure-play BPS providers, while others offer business services as part of a broader portfolio (IT services, consulting, technology products, etc.). Some are focused on a particular domain or geography, while others are broad-based. Some are listed, while others are privately held.
This list helps enterprises to identify the scaled-up providers and their functional coverage. It also helps BPS service providers to compare themselves against others in the industry.
WHY THE EVEREST GROUP BPS TOP 50 ™?
The Everest Group BPS Top 50™ is a global list of the 50 largest third-party providers, based on their Business Process Services (BPS) revenues1 and year-on-year growth. BPS is also referred to as Business Process Outsourcing (BPO). Inaugurated in 2015, Everest Group publishes this list every year.
WHAT IS THE EVEREST GROUP BPS TOP 50™?
1 BPS revenues exclude public sector services

3
There are two distinct steps involved in determining the Top 50:
Qualification – Only the 50 largest service providers, based on their BPS revenue, qualify for the BPS Top 50 assessment
Rank determination – Service providers are ranked on the basis of overall BPS revenue and year-on-year growth. Growth has two sub-parameters: absolute growth (measured as change in BPS revenue in US$ million) and percentage growth (measured as percentage change in BPS revenue)
We use multiple sources of information to conduct our analysis and determine the list rankings:
Reported BPS revenues and growth figures by listed companies Bottom-up revenue and growth build leveraging Everest Group’s proprietary BPS databases tracked
and maintained at the functional levels Information shared/validated by service providers
HOW IS THE EVEREST GROUP BPS TOP 50™ DETERMINED?
REVENUE(75%) (100%)
COMPOSITE SCORE+(12.5%) (12.5%)
Actualgrowth*
Percentagegrowth**
GROWTH
+ =
*Year-on-year revenue change in U.S. dollars**Year-on-year percentage of revenue change
4
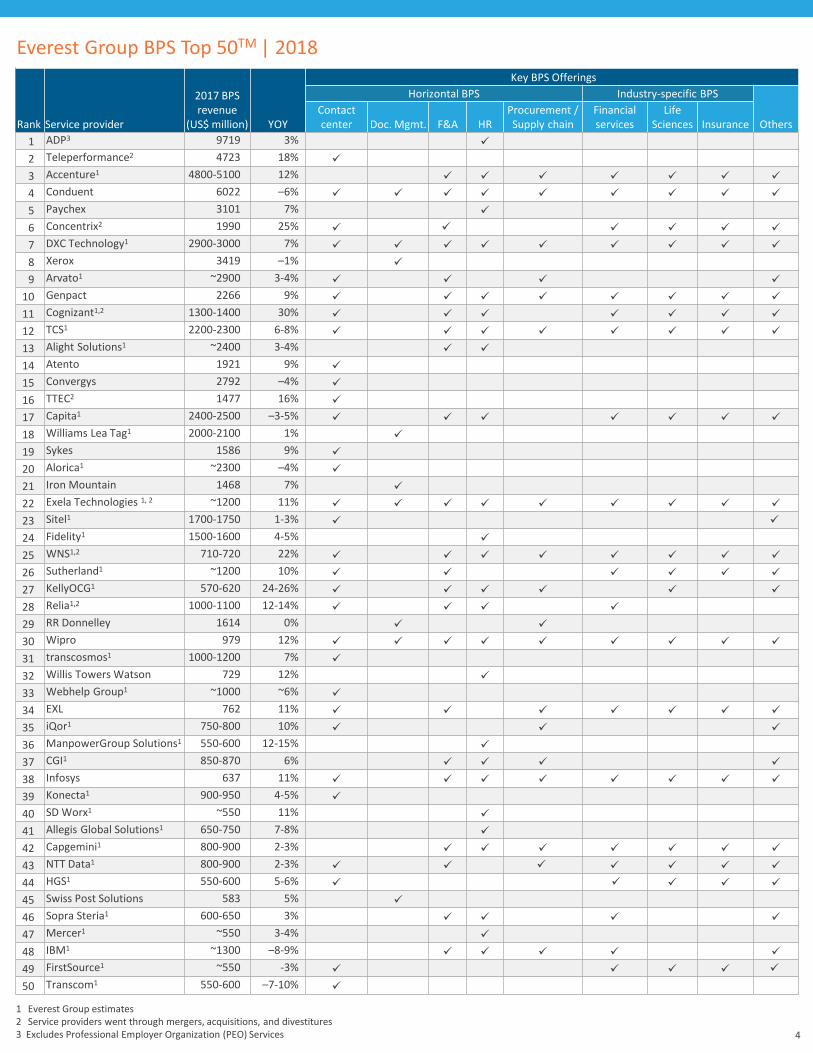
Everest Group BPS Top 50TM | 2018
Rank Service provider
2017 BPS revenue
(US$ million) YOY
Key BPS OfferingsHorizontal BPS Industry-specific BPS
OthersContact center Doc. Mgmt. F&A HR
Procurement / Supply chain
Financial services
Life Sciences Insurance
1 ADP3 9719 3%
2 Teleperformance2 4723 18%
3 Accenture1 4800-5100 12%
4 Conduent 6022 –6%
5 Paychex 3101 7%
6 Concentrix2 1990 25%
7 DXC Technology1 2900-3000 7%
8 Xerox 3419 –1%
9 Arvato1 ~2900 3-4%
10 Genpact 2266 9%
11 Cognizant1,2 1300-1400 30%
12 TCS1 2200-2300 6-8%
13 Alight Solutions1 ~2400 3-4%
14 Atento 1921 9%
15 Convergys 2792 –4%
16 TTEC2 1477 16%
17 Capita1 2400-2500 –3-5%
18 Williams Lea Tag1 2000-2100 1%
19 Sykes 1586 9%
20 Alorica1 ~2300 –4%
21 Iron Mountain 1468 7%
22 Exela Technologies 1, 2 ~1200 11%
23 Sitel1 1700-1750 1-3%
24 Fidelity1 1500-1600 4-5%
25 WNS1,2 710-720 22%
26 Sutherland1 ~1200 10%
27 KellyOCG1 570-620 24-26%
28 Relia1,2 1000-1100 12-14%
29 RR Donnelley 1614 0%
30 Wipro 979 12%
31 transcosmos1 1000-1200 7%
32 Willis Towers Watson 729 12%
33 Webhelp Group1 ~1000 ~6%
34 EXL 762 11%
35 iQor1 750-800 10%
36 ManpowerGroup Solutions1 550-600 12-15%
37 CGI1 850-870 6%
38 Infosys 637 11%
39 Konecta1 900-950 4-5%
40 SD Worx1 ~550 11%
41 Allegis Global Solutions1 650-750 7-8%
42 Capgemini1 800-900 2-3%
43 NTT Data1 800-900 2-3%
44 HGS1 550-600 5-6%
45 Swiss Post Solutions 583 5%
46 Sopra Steria1 600-650 3%
47 Mercer1 ~550 3-4%
48 IBM1 ~1300 –8-9%
49 FirstSource1 ~550 -3%
50 Transcom1 550-600 –7-10%
1 Everest Group estimates2 Service providers went through mergers, acquisitions, and divestitures3 Excludes Professional Employer Organization (PEO) Services
5
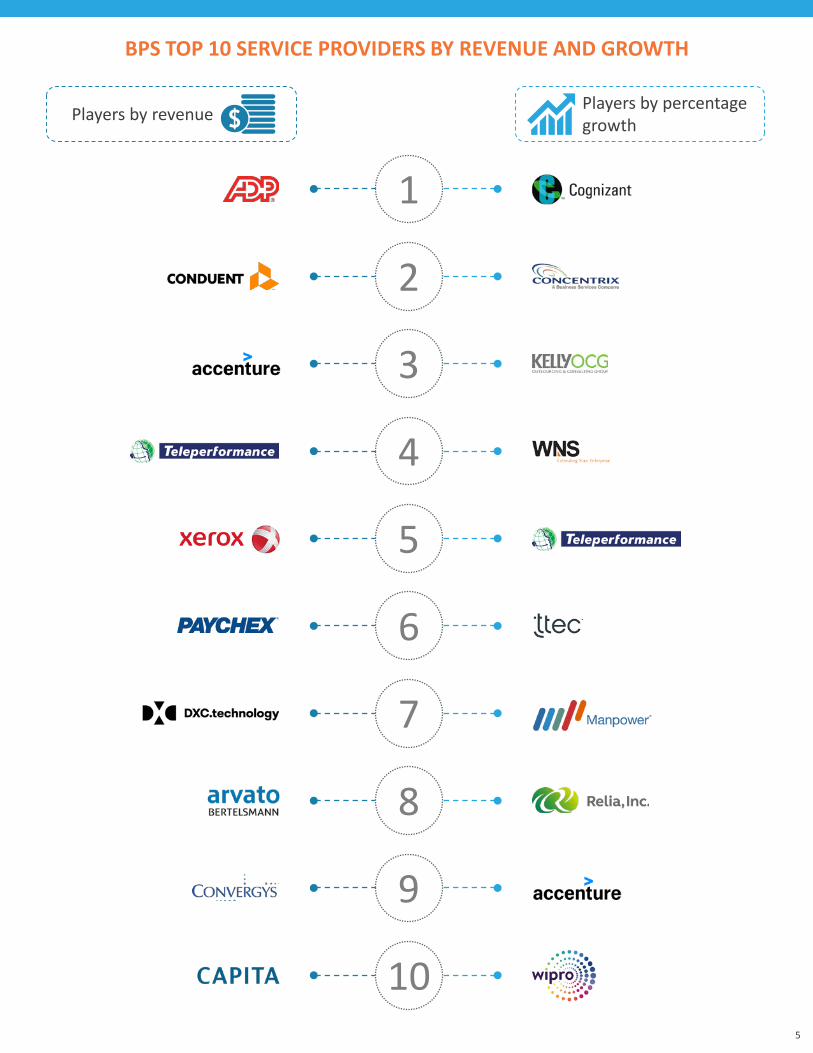
BPS TOP 10 SERVICE PROVIDERS BY REVENUE AND GROWTH
Healthcare & Life Sciences
Players by percentage growthPlayers by revenue
1
2
3
4
5
6
7
8
10
9
6
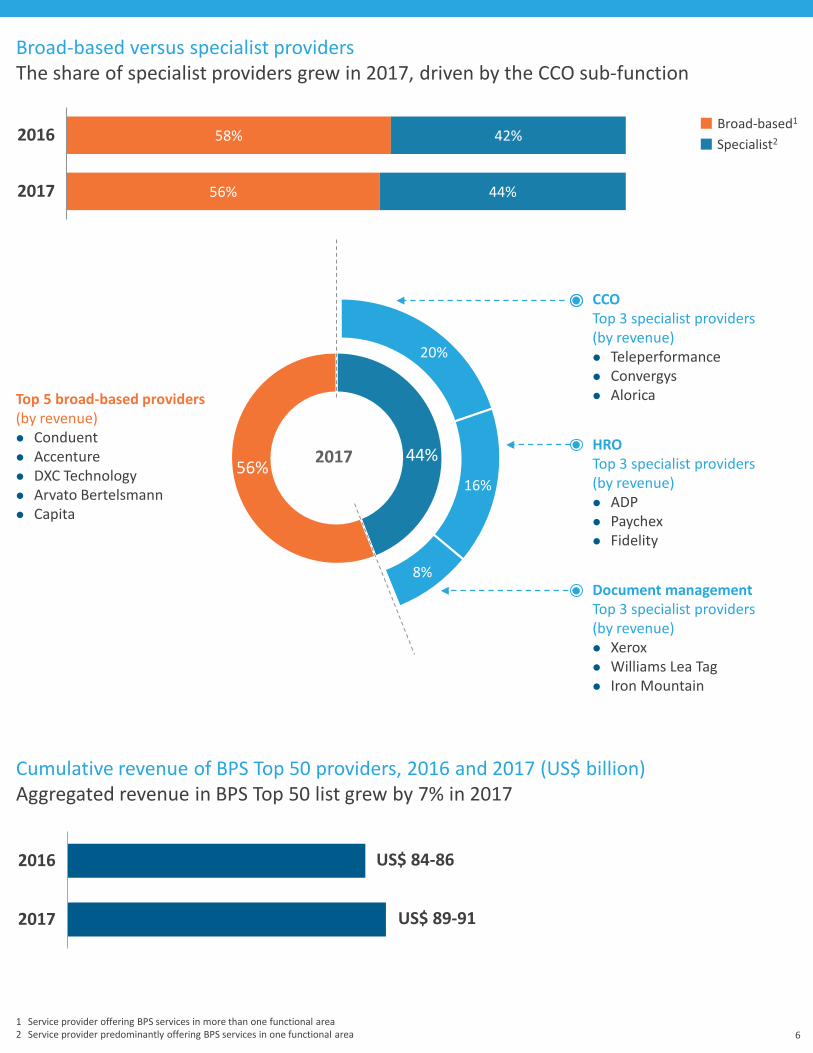
Broad-based versus specialist providersThe share of specialist providers grew in 2017, driven by the CCO sub-function
Broad-based1
Specialist2
2017
Top 5 broad-based providers (by revenue) Conduent Accenture DXC Technology Arvato Bertelsmann Capita
58%
56%
42%
44%
2016
2017
Cumulative revenue of BPS Top 50 providers, 2016 and 2017 (US$ billion)Aggregated revenue in BPS Top 50 list grew by 7% in 2017
2017
2016
US$ 89-91
US$ 84-86
Document management Top 3 specialist providers (by revenue) Xerox Williams Lea Tag Iron Mountain
HRO Top 3 specialist providers (by revenue) ADP Paychex Fidelity
CCOTop 3 specialist providers (by revenue) Teleperformance Convergys Alorica
1 Service provider offering BPS services in more than one functional area2 Service provider predominantly offering BPS services in one functional area
20%
16%
8%
44%56%
7
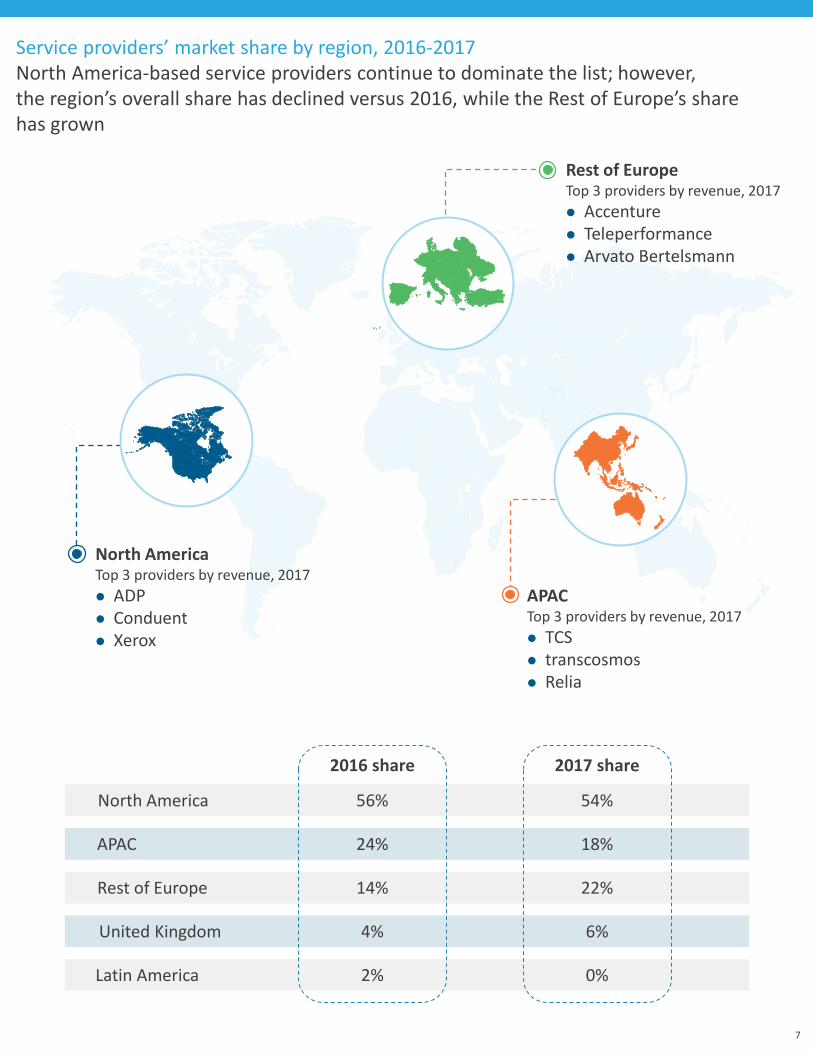
North AmericaTop 3 providers by revenue, 2017 ADP Conduent Xerox
APACTop 3 providers by revenue, 2017 TCS transcosmos Relia
Rest of EuropeTop 3 providers by revenue, 2017 Accenture Teleperformance Arvato Bertelsmann
Service providers’ market share by region, 2016-2017North America-based service providers continue to dominate the list; however, the region’s overall share has declined versus 2016, while the Rest of Europe’s share has grown
North America
APAC
Rest of Europe
United Kingdom
Latin America
56%
24%
14%
4%
2%
2016 share
54%
18%
22%
6%
0%
2017 share

Dallas (Headquarters)[email protected]+1-214-451-3000
New [email protected]+1-646-805-4000
[email protected]+1-416-388-6765
[email protected]+44-207-129-1318
[email protected]+91-124-284-1000
[email protected]+91 806-781-9999
For more information about Everest Group, please contact:
+1-214-451-3110
About Everest Group
Everest Group is a consulting and research firm focused on strategic IT, business services, and sourcing. We are trusted advisors to senior executives of leading enterprises, providers, and investors. Our firm helps clients improve operational and financial performance through a hands-on process that supports them in making well-informed decisions that deliver high-impact results and achieve sustained value. Our insight and guidance empower clients to improve organizational efficiency, effectiveness, agility, and responsiveness. What sets Everest Group apart is the integration of deep sourcing knowledge, problem-solving skills and original research. Details and in-depth content are available at www.everestgrp.com.