everything you heard about urbanisation is wrong you heard about... · china 1,500 •for the other...
TRANSCRIPT

Everything you heard about urbanisation is wrong

Regional & Urban Policy
Everything you heard about urbanisation is wrong
By Lewis Dijkstra, [email protected]
Head of the Economic Analysis Sector
DG for Regional and Urban Policy,

The well known narrative…
• The world is 50% urban.
• Middle income countries are less urbanised.
• Low income countries are least urbanised.
• Urbanisation will grow rapidly in low-income countries between 2010 and 2050.
… is purely based on national definitions

But national definitions are fine
• “I know it when I see it”, but maybe we see different things?
• The difference between national definitions must be quite small. How can we verify this without a benchmark?
• A city is a relative concept and differs between cultures and countries. A global definition is not appropriate.

What density reproduces the nationally defined urban population share?

Urban areas … lost in translation?
Big urban areas
• High Density
• Big population
• Low shares of agricultural jobs
• Specialised services (higher education, hospital, government)
Small urban areas
• Medium density
• Medium population
• Medium share of agricultural jobs
• Some services (primary school, doctor)
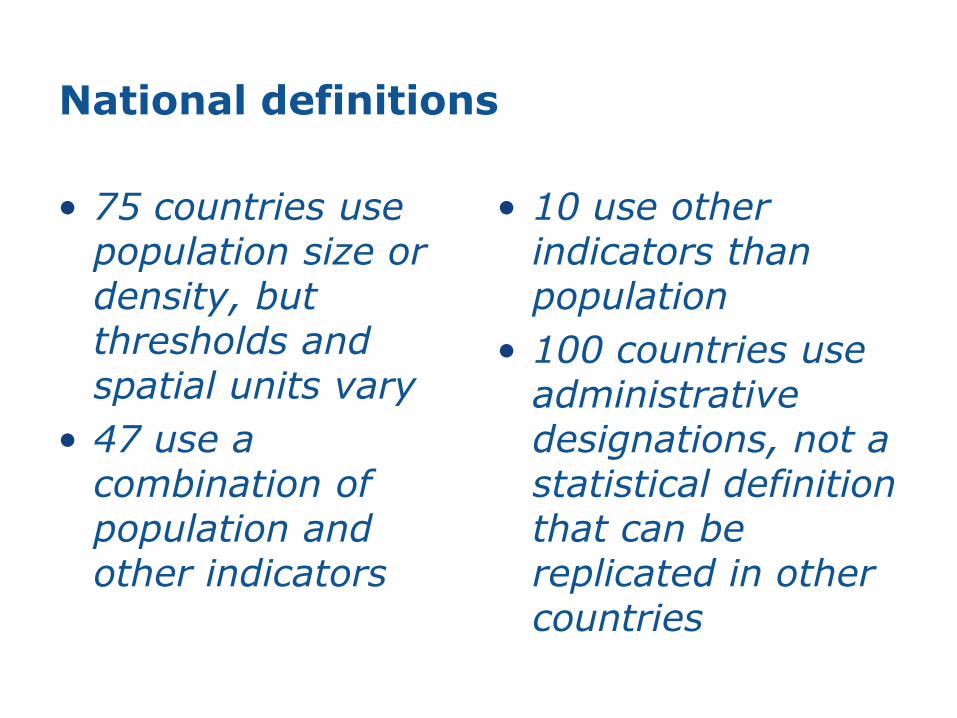
National definitions
• 75 countries use population size or density, but thresholds and spatial units vary
• 47 use a combination of population and other indicators
• 10 use other indicators than population
• 100 countries use administrative designations, not a statistical definition that can be replicated in other countries

Do national definitions rely on population size and or density?
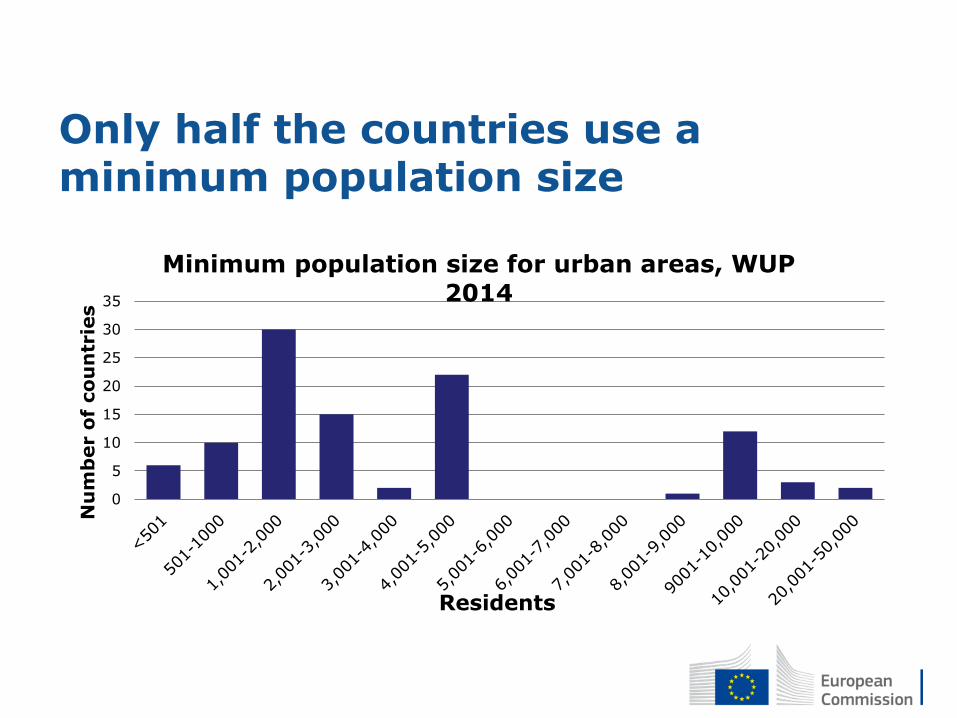
Only half the countries use a minimum population size
0
5
10
15
20
25
30
35
Nu
mb
er o
f co
un
trie
s
Residents
Minimum population size for urban areas, WUP 2014

14 countries use density
CountryMinimum
densityGermany 150Cambodia 200USA 390and195
Canada 400India 400Bhutan 1,000Philippines 1,000
China 1,500
• For the other countries we don’t know the density
• Density is highly dependent on the size of the unit, census block vslocal authority vsregion…

What indicators can be used globally
• Agricultural employment? Varies too much
• Infrastructure? No harmonised data
• Services? No harmonised data
• Poverty? Circular argument
Rural cannot be defined by problems, because then no problems = no rural
• Remoteness Separate dimension

Access to cities - Remoteness
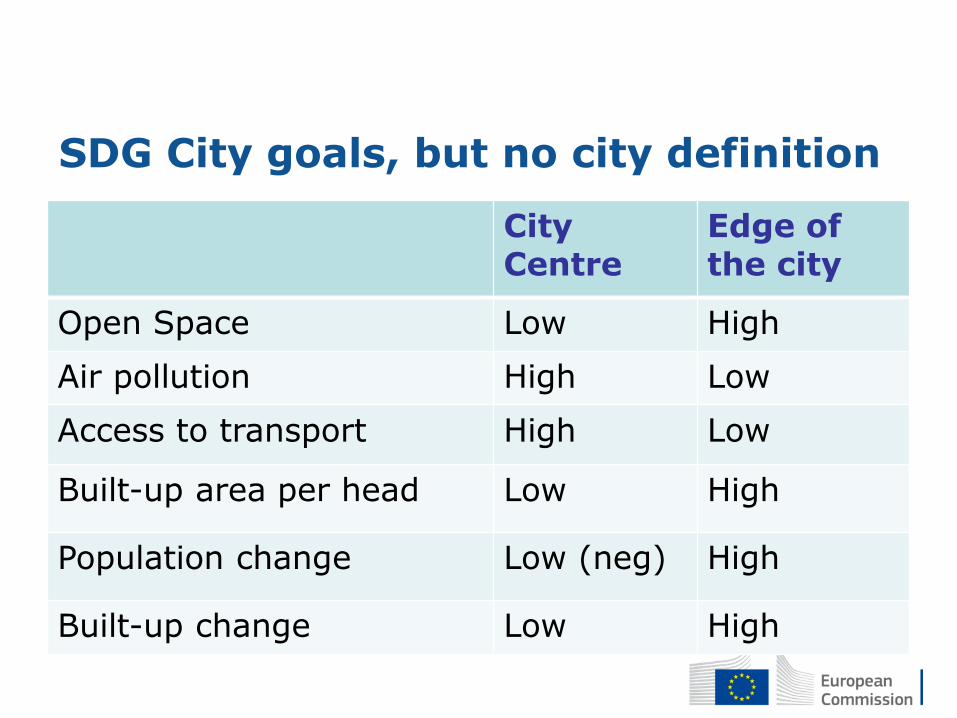
SDG City goals, but no city definition
City Centre
Edge of the city
Open Space Low High
Air pollution High Low
Access to transport High Low
Built-up area per head Low High
Population change Low (neg) High
Built-up change Low High

20
30
40
50
60
70
80
90
100
0 5 10 15 20 25 30
%ofpopulation
kmfromcitycentre
Accesstopublictransportbydistancetocentre
Praha
Berlin
London
Madrid
Paris

Who committed to develop a global definition?
• The European Union together with the OECD and the World Bank launched this commitment during Habitat III in Quito in 2016
• FAO has joined this commitment in 2017
• UN-Habitat follows this work closely
• Goal: present a definition to UN Statistical Commission in 2019
• UN SC side event in 2017 and in 2018

This is not a city

The population grid reduces modifiable areal unit problem
• Mongolian capital: Ulaanbaatar 1.4 million inhabitants, but a density of 272 inhab/km2
• Overcomes key obstacle: the variable size and shape of administrative and statistical units
• Allows to capture cities within a single large administrative unit AND a city spread out over multiple administrative units.
• Fixed boundaries and high spatial resolution
• Next census is going to more geo-coded

Exogenous city list reproduce distortions of national definitions
UNWUP Citydefinition2015Citiesover300,000 9 24Population 16million 32million
Nationalpopulationshareincitiesover300,000
17% 34%
Populationinsamecities 16million 24million
HoChiMinhCity 8million 12millionHanoi 3.6million 7.5million
HaiPhòng 1.1milion 1.3millionCanTho 1.2million 0.7million

An endogenous city list
• This method relies purely on the population grid to identify cities
• Other global work on cities relies on an exogenous city list
• Global Rural-Urban Mapping Project (GRUMP)
• Agglomeration index
• Shlomo Angel’s urban extent
• Any work that (in part) aims to replicate national shares will suffer from these distortions

Grid cells: same shape and size and boundaries do not change
Municipalities (LAU2)
118,504 in the EUPopulation Grid
4,404,011 in the EU
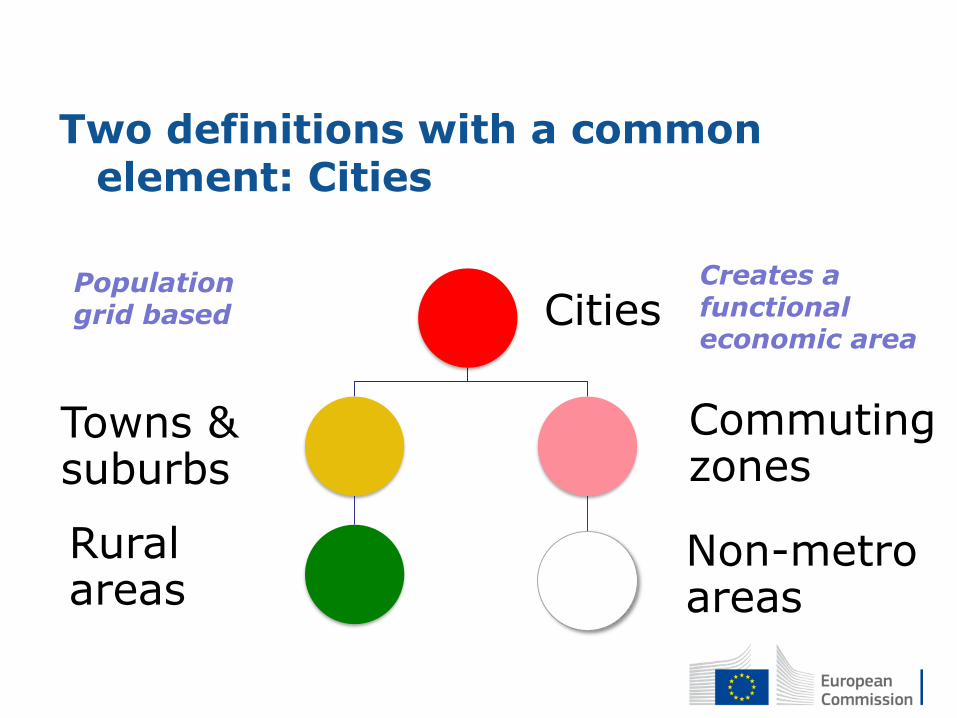
Two definitions with a common element: Cities
Cities
Towns & suburbs
Rural areas
Commuting zones
Non-metro areas
Population grid based
Creates a functional economic area

Three types of grid cells
Urban centres
Contiguous cells
above 1,500 residents per km2 and at least 50,000 people in the centre
Urban Clusters
Contiguous cells
above 300 residents per km2 and at least 5,000 people in the cluster
Rural grid cells
Cells below 300 residents per km2 + other cells outside urban clusters

Cork, Ireland: Urban centre, urban clusters and rural grid cells

Three types of municipalities
Cities > 50% pop. in urban centres
Towns and suburbs
> 50% pop. in urban clusters and not classified as city
Rural area > 50% pop. in rural grid cells
Urban areas = Cities + Towns and Suburbs

Cork, Ireland: Urban centre, urban clusters and rural grid cells

Cork, Ireland: City, towns & suburbs, and rural areas

Joint EU-OECD Definition of a Functional Urban Area
28

0
10
20
30
40
50
60
70
80
90
100
Asia
Latin A
merica
& C
arr
ibean
Afr
ica
Oceania
Russia
, U
kra
ine,
Bela
rus a
nd M
old
ova
Nort
h A
merica
Euro
pe
World
Sh
are o
f p
op
ula
tion
, in
%Population by degree of urbanisation per
major global region, 2015
Cities
Towns and suburbs
Rural areas
Urban areas WUP 2014Source: JRC 2018, GHSL SMOD v9s5, WUP 2014

More urban with the national definition or the degree of urbanisation?


Pilot projects to compare definitions
• Apply the definitions also to administrative units (census tracts, municipalities…)
• Appraise the result:
• Too urban or too rural?
• Too many or too few cities?
• Improve data (better population and/or remote sensing data)
• Find out if/how we can improve the definitions

Pilot projects by EC, OECD and WB
• Australia
• Brazil (completed)
• Colombia
• Egypt
• Haiti
• Indonesia
• India
• Jordan
• Malaysia
• Mozambique
• Pakistan
• South Africa (completed)
• Tunisia
• Turkey
• Uganda
• Ukraine
• USA

Australian cities
R² = 0.9957
0
500,000
1,000,000
1,500,000
2,000,000
2,500,000
3,000,000
3,500,000
4,000,000
4,500,000
0 500,000 1,000,000 1,500,000 2,000,000 2,500,000 3,000,000 3,500,000 4,000,000 4,500,000

Colombian cities
R² = 0.9985
0
1,000,000
2,000,000
3,000,000
4,000,000
5,000,000
6,000,000
7,000,000
8,000,000
9,000,000
10,000,000
0 1,0
00,0
00
2,0
00,0
00
3,0
00,0
00
4,0
00,0
00
5,0
00,0
00
6,0
00,0
00
7,0
00,0
00
8,0
00,0
00
9,0
00,0
00
10,0
00,0
00

Brazil
• We believe that this method offers a useful basis for statistical comparisons across national borders...
• … useful for generating Sustainable Development Goals’ indicators, producing data for these three types of cluster or for individual municipalities …

Survey by UN Statistical Division
1. Algeria
2. Argentina
3. Australia
4. Bolivia
5. China
6. Cuba
7. Ecuador
8. Ethiopia
9. Indonesia
10.Japan
11.Mexico
12.Mongolia
13.Namibia
14.New Zealand
15.Republic of Korea
16.Senegal
17.Thailand
18.USA
19.Venezuela
20.Zambia

Responses to the UN survey
• 9 out of 12 NSIs: it captured their main cities.
• 5 out of 8 NSIs the validity was good or satisfactory (1 poor and 2 unacceptable)
• 9 out of 10 NSIs could produce data by degree of urbanisation
• 9 out of 13 NSIs useful for international comparisons
• 11 out of 12 NSIs useful for measuring the SDGs
• 5 NSIs did not reply
• Some confusion about density thresholds and the distinction between cities and towns

Three key tools
• National fact sheets http://ghsl.jrc.ec.europa.eu/CFS.php
• Interactive online mapshttp://ghsl.jrc.ec.europa.eu/visualisation.php#
• City databasehttp://ghsl.jrc.ec.europa.eu/ccdb2016visual.php#

National factsheets
• Covers every country in the world
• Shows the share of population, built-up area and land by degree of urbanisation and its changes since 1975
• Lists the biggest cities
• Provides access to a list of all cities in a country with their change in population and built-up area over time
• Map of the country and the capital city
• Methodological info

Malaysia
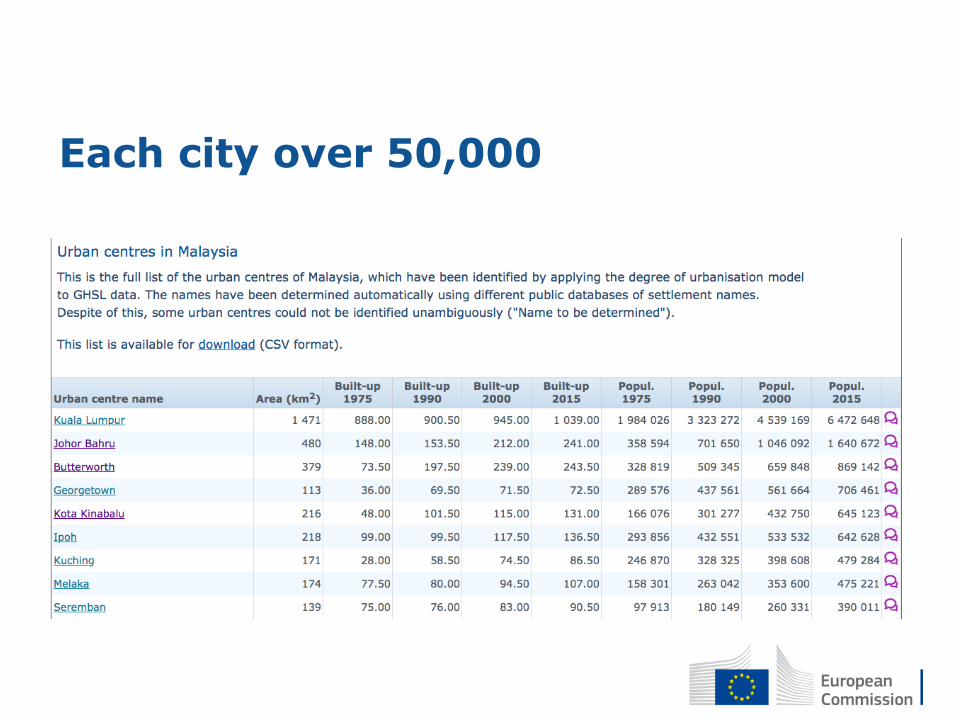
Each city over 50,000

1975Population
1 984 026
Built-up area
888 km2

1990Population
3 323 272
Built-up area
900 km2

2000Population
4 539 169
Built-up area
945 km2

2015Population
6 472 648
Built-up area
1 039 km2


Per city
• Evolution in population, built-up area and built-up per capita, 1975-2015
• Nightlights, 1990-2014
• Greenness index 1990-2014
• Particulate matter, 2000-2010
• Share of imperviousness, 2015
• Proximity to protected natural areas
• Population at or below sea-level, 1975-2015
• Population on steep slopes, 1975-2015

Next steps
• Distinguish towns from suburbs and villages from dispersed rural areas (done)
• Validate the updated cities (June 2018)
• Estimate commuting zones (summer 2018)
• Update factsheets, city database and interactive maps (October 2018)

Refined degree of urbanisation
Driving time buffers
• Commuting data is not widely available
• We will create a driving time buffer around each urban centre. Distance will depend on the population size of the city, GDP per head of the country and the road network
• Time series in selected countries

Next events
• May 2018 Urban Economics Association Conference (Dusseldorf)
• September 2018 International Association of Official Statistics, (Paris)
• October 2018 UN World Data Forum (Dubai)
• March 2019 UN Statistical Commission (New York)
• August 2019 ISI World Statistical Congress (Kuala Lumpur)

Conclusions
• A neutral global definition of urban is needed, national definitions are too different.
• Just like the $1 a day poverty rate, it should NOT replace national definitions but complement them
• The degree of urbanisation and the functional urban area definition are likely to be approved by the UNSC and already endorsed by EU and OECD
• The World Bank could make these definitions a standard component of all work on urbanisation and work with statistical offices

More information
• https://ec.europa.eu/eurostat/cros/content/global-city-and-settlement-definition_en
• http://ghsl.jrc.ec.europa.eu/degurba.php
• http://urban.jrc.ec.europa.eu/

1975

1990

2000

2015

0 100
200
300
400
500
600
700
800
900
1,000
1,100
1,200
1,300
1,400
1,500
1,600
1,700
1,800
1,900
2,000
2,100
2,200
2,300
2,400
2,500
2,600
2,700
2,800
2,900
3,000
3,100
3,200
3,300
3,400
3,500
3,600
3,700
3,800
3,900
4,000
4,100
4,200
4,300
4,400
4,500
4,600
4,700
4,800
4,900
5,000
500 99 95 93 90 89 87 85 83 81 79 77 76 74 73 71 70 68 67 66 65 64 63 62 61 60 59 58 57 56 55 55 54 53 52 52 51 50 50 49 49 48 47 47 46 46 45 45 44 44 43 43
1,000 98 94 91 89 87 85 83 81 80 78 77 76 74 73 71 70 68 67 66 65 64 63 62 61 60 59 58 57 56 55 55 54 53 52 52 51 50 50 49 49 48 47 47 46 46 45 45 44 44 43 43
2,000 96 91 88 86 84 82 80 78 77 75 74 72 71 70 69 68 67 66 65 64 64 63 62 61 60 59 58 57 56 55 55 54 53 52 52 51 50 50 49 49 48 47 47 46 46 45 45 44 44 43 43
3,000 95 90 87 84 82 80 78 76 75 73 72 70 69 68 67 66 65 64 63 62 61 60 59 59 58 57 57 56 56 55 55 54 53 52 52 51 50 50 49 49 48 47 47 46 46 45 45 44 44 43 43
4,000 94 88 85 83 80 78 76 75 73 72 70 69 68 66 65 64 63 62 61 60 60 59 58 57 56 56 55 54 54 53 52 52 51 51 50 50 49 49 49 48 48 47 47 46 46 45 45 44 44 43 43
5,000 93 87 84 81 79 77 75 73 72 70 69 68 66 65 64 63 62 61 60 59 58 58 57 56 55 55 54 53 52 52 51 51 50 50 49 49 48 48 47 47 46 46 45 45 45 44 44 44 43 43 43
6,000 92 86 83 80 78 76 74 72 70 69 68 66 65 64 63 62 61 60 59 58 57 57 56 55 54 54 53 52 52 51 51 50 49 49 48 48 47 47 46 46 45 45 44 44 44 43 43 42 42 42 41
7,000 92 85 82 79 77 75 73 71 69 68 67 65 64 63 62 61 60 59 58 57 56 56 55 54 53 53 52 52 51 50 50 49 49 48 48 47 46 46 45 45 45 44 44 43 43 42 42 42 41 41 40
8,000 91 84 81 78 76 74 72 70 68 67 66 64 63 62 61 60 59 58 57 56 56 55 54 53 53 52 51 51 50 50 49 48 48 47 47 46 46 45 45 45 44 44 43 43 42 42 41 41 41 40 40
9,000 91 84 80 77 75 73 71 69 68 66 65 64 62 61 60 59 58 57 57 56 55 54 53 53 52 51 51 50 50 49 48 48 47 47 46 46 45 45 44 44 44 43 43 42 42 41 41 41 40 40 39
10,000 90 83 79 77 74 72 70 68 67 65 64 63 62 61 60 59 58 57 56 55 54 54 53 52 51 51 50 50 49 48 48 47 47 46 46 45 45 44 44 43 43 43 42 42 41 41 41 40 40 39 39
20,000 86 78 74 71 69 66 65 63 61 60 59 57 56 55 54 53 53 52 51 50 49 49 48 47 47 46 46 45 45 44 44 43 43 42 42 41 41 40 40 40 39 39 38 38 38 37 37 37 36 36 36
30,000 84 75 71 68 65 63 61 59 58 56 55 54 53 52 51 50 49 49 48 47 46 46 45 45 44 43 43 42 42 41 41 41 40 40 39 39 38 38 38 37 37 37 36 36 35 35 35 35 34 34 34
40,000 82 73 69 66 63 61 59 57 55 54 53 52 51 50 49 48 47 46 46 45 44 44 43 43 42 41 41 40 40 40 39 39 38 38 37 37 37 36 36 36 35 35 34 34 34 34 33 33 33 32 32
50,000 81 71 67 64 61 59 57 55 53 52 51 50 49 48 47 46 45 45 44 43 43 42 41 41 40 40 39 39 38 38 38 37 37 36 36 36 35 35 34 34 34 33 33 33 32 32 32 32 31 31 31
60,000 80 70 65 62 59 57 55 53 52 50 49 48 47 46 45 45 44 43 42 42 41 40 40 39 39 38 38 37 37 37 36 36 35 35 35 34 34 34 33 33 33 32 32 32 31 31 31 30 30 30 30
70,000 79 68 64 61 58 56 54 52 50 49 48 47 46 45 44 43 42 42 41 40 40 39 39 38 38 37 37 36 36 35 35 35 34 34 34 33 33 32 32 32 31 31 31 31 30 30 30 29 29 29 29
80,000 78 67 63 59 57 54 52 51 49 48 47 45 45 44 43 42 41 40 40 39 39 38 38 37 37 36 36 35 35 34 34 34 33 33 32 32 32 31 31 31 31 30 30 30 29 29 29 29 28 28 28
90,000 77 66 62 58 55 53 51 49 48 47 45 44 43 42 42 41 40 39 39 38 37 37 36 36 35 35 35 34 34 33 33 33 32 32 32 31 31 31 30 30 30 29 29 29 28 28 28 28 27 27 27
100,000 76 65 61 57 54 52 50 48 47 45 44 43 42 41 41 40 39 38 38 37 36 36 35 35 34 34 34 33 33 32 32 32 31 31 31 30 30 30 29 29 29 28 28 28 28 27 27 27 27 26 26
250,000 69 57 52 48 45 43 41 39 37 36 35 34 33 32 31 31 30 30 29 29 28 28 27 27 26 26 26 25 25 25 24 24 24 24 23 23 23 23 22 22 22 22 22 21 21 21 21 20 20 20 20
500,000 65 51 46 42 39 36 34 33 31 30 29 28 27 26 26 25 25 24 24 23 23 22 22 22 22 21 21 21 20 20 20 20 20 19 19 19 19 18 18 18 18 18 18 17 17 17 17 17 17 16 16
1,000,000 60 46 40 36 33 30 28 27 25 24 24 23 22 21 21 20 20 19 19 19 18 18 18 18 17 17 17 17 16 16 16 16 16 15 15 15 15 15 15 14 14 14 14 14 14 14 14 13 13 13 13
5,000,000 50 33 27 23 20 17 16 14 13 13 12 12 11 11 10 10 10 10 10 9 9 9 9 9 9 8 8 8 8 8 8 8 8 7 7 7 7 7 7 7 7 7 7 7 7 7 7 7 7 7 6
Populationsizeofthecluster
Densitythresholdinresidentspersqkm

0%
10%
20%
30%
40%
50%
60%
70%
80%
90%
100%
<10
<50
<100
<200
<300
<500
<1,0
00
<1,5
00
<2,00
0
<3,0
00
<4,0
00
<5,0
00
<6,00
0
<7,0
00
<8,0
00
Tota
l
Shareofglobalpopulation,
Populationdensitythresholdsininhabitantspersqkm
Populationlivingbelowadensitythresholdbysizeofgridcells,2015
1,000,000
250,000
90,000
40,000
10,000
2,500
900
400
100
25
9
4
1
1/4