evidence for a natural allelic series at the maize - genetics
TRANSCRIPT

International Energy Agency
Promoting Energy Efficiency
Best Practice in Cities - A pilot study -
May 2008
Nigel Jollands
Energy Efficiency and Environment Division
IEA
Stephen Kenihan & Wayne Wescott
ICLEI

IEA/SLT/EC(2008)3
Acknowledgements
This project was made possible by funding provided by Southern California Edison
Ltd. In addition, Andred Saker from the New Zealand Ministry for the Environment
worked on this project during a three month secondment to the International Energy
Agency.
ICLEI – Local Governments for Sustainability were contracted to collate this report.
Wayne Wescott and Stephen Kenihan from ICLEI worked on this report.
Nigel Jollands of the IEA coordinated this project.

Contents Acknowledgements ........................................................................................................ 2 Glossary ......................................................................................................................... 4 Executive summary ........................................................................................................ 5
1 Background – the IEA and cities ............................................................................ 6 2 Energy efficiency best practice in cities ................................................................. 8
2.1 Aims of the project .......................................................................................... 9 2.2 Expected outcomes .......................................................................................... 9 2.3 Parties involved ............................................................................................... 9
3 The evaluation criteria .......................................................................................... 10 3.1 Implementation timeframe ............................................................................ 11
3.2 Energy savings .............................................................................................. 11 3.3 Greenhouse gas emission reductions ............................................................ 11 3.4 Return on investment .................................................................................... 11 3.5 Transferability of project ............................................................................... 12
4 Pilot project process.............................................................................................. 13
4.1 Programme selection ..................................................................................... 13 4.2 Survey design ................................................................................................ 13 4.3 Collation of results and analysis.................................................................... 13
5 Findings ................................................................................................................ 14
5.1 Best practice programmes summary ............................................................. 14 5.2 Findings - all programmes............................................................................. 14
6 Outcomes .............................................................................................................. 22
6.1 Implementation timeframe ............................................................................ 22
6.2 Energy savings .............................................................................................. 23 6.3 Greenhouse gas emission reductions ............................................................ 24
6.4 Return on investment .................................................................................... 24 6.5 Transferability ............................................................................................... 25
7 Future direction..................................................................................................... 26
7.1 Data management .......................................................................................... 26 7.2 Refinement of criteria.................................................................................... 26 7.3 Broaden scope ............................................................................................... 27
7.4 Feedback mechanism .................................................................................... 27 Appendix A – copy of survey cover letter and survey ................................................. 28

IEA/SLT/EC(2008)3
Glossary
The following definitions are used in this report:
Energy Efficiency means a change to a particular energy use that results in a
net benefit per unit of energy consumed.
Local Government refers to any authority that provides a range of fundamental
services to a local population based in an urban setting.
Programme refers to a particular energy efficiency policy or measure,
implemented by a local government
Case Study refers to a particular programme proposed for evaluation
Best Practice is determined by application of the criteria developed in this
report.

Executive summary There is a strong rationale for IEA engagement with cities and local governments on
the issue of energy efficiency. In May 2007, The IEA Governing Board called on the
IEA ―to promote … energy efficiency goals and action plans at all levels of
government‖. In addition, cities are large and growing energy users; City Authorities
(CAs) themselves use significant amounts of energy; CAs, are important
implementing agents for national energy efficiency policy, as well as being a vehicle
for implementing IEA energy efficiency policy recommendations. Through their
experience on the ground, CAs can provide important lessons in energy efficiency
policy implementation. The IEA energy-related expertise means it is well placed to
add significant value to promoting the best practice policies and measures that cities
are currently involved in.
Past attempts to document best practice energy efficiency in cities have been
piecemeal, lacked transparency and a clear set of criteria for identifying best practice.
This working paper presents the results of a pilot study aimed at testing a method of
collating, evaluating and reporting energy efficiency policy practice in cities. The
pilot study involved:
Developing a set of clearly defined criteria for evaluating energy efficiency
policies and measures;
Designing a survey and distributing it to city authorities;
Analysing results.
This pilot project is the first attempt to address the lack of rigorous and transparent
approach to defining best practice in city energy efficiency programmes. The project
has provided interesting insights into a range of exciting projects being implemented
in cities around the world. However, the potential exists for far greater benefit.
The study has found that it is possible to collate the detailed information needed to
identify best practice energy efficiency projects in cities. However, gathering the data
is not easy. The data is often not recorded in an easily accessible format. Nor is it easy
to get city officials to allocate time to the necessary data collation given the many
other competing demands on their time.
A key area that this project identifies as requiring urgent attention is the development
of a common data management format for energy efficiency projects by CAs. Further
work could also focus on refining the criteria used to define best practice, and
broadening the scope of projects beyond energy efficiency.

IEA/SLT/EC(2008)3
1 Background – the IEA and cities Over the last few years, there has been an increased interest in cities and their energy
use – driven in part by climate change concerns. Prominent examples include the:
International Council for Local Environmental Initiatives (ICLEI). ICLEI
boasts 628 member cities and runs a range of programmes including the Cities
for Climate ProtectionTM
(CCP) Campaign. The CCP assists cities to adopt
policies and implement quantifiable measures such as energy efficiency to
reduce local greenhouse gas emissions, improve air quality, and enhance
urban liveability and sustainability. More than 800 local governments
participate in the CCP;
Clinton Foundation’s Climate Initiative1 which was launched in August 2006
which aims to help cities ―fight against climate change in practical,
measurable, and significant ways‖;
C40 Large Cities Climate Leadership Group2 which is a group of the world's
largest cities committed to tackling climate change. The C40 group has
partnered with the Clinton Foundation;
ENERGY STAR Challenge which has a strategic focus on local governments.
The aim is to encourage local governments to promote the call-to-action to
improve the energy efficiency of America‘s commercial and industrial
buildings by 10% or more;
OECD‘s Urban Development programme which assesses trends and
challenges of urban regions, and promotes sustainable urban development;
Joint UN-HABITAT - UNEP Sustainable Cities Programme which promotes
environmental, social and economic sustainability of cities3;
Institute of Global Environmental Studies Urban Environmental Management
Project4 which focuses on Asian cities and aims to generate discussion on the
role of cities in achieving sustainable and cleaner utilisation of resources and
energy;
Sierra Club‘s Energy Efficiency Solutions for Cool Cities campaign5;
European Green Cities Network6 (EGCN) which aims to reach full market
effect for the solutions provided for efficient urban housing regarding energy,
resources, spatial planning, integration of renewables into buildings, etc.
1 www.clintonfoundation.org
2 www.c40cities.org - is comprised of the following cities: Addis Ababa, Bangkok, Beijing, Berlin,
Bogotá, Buenos Aires, Cairo, Caracas, Chicago, Delhi, Dhaka, Hanoi, Hong Kong, Houston, Istanbul,
Jakarta, Johannesburg, Karachi, Lagos, Lima, London, Los Angeles, Madrid, Manila, Melbourne,
Mexico City, Moscow, Mumbai, New York, Paris, Philadelphia, Rio de Janeiro, Rome, Sao Paulo,
Seoul, Shanghai, Sydney, Toronto, Tokyo, and Warsaw. 3 http://www.unhabitat.org/categories.asp?catid=369
4 http://www.iges.or.jp/en/ue/pdf/megacity03/HTML/3.html
5 http://www.sierraclub.org/globalwarming/coolcities/energy.asp
6 http://www.europeangreencities.com/about/about.asp

Evidence of such wide ranging activity raises an obvious question: why is there so
much attention on cities, City Authorities (CA) and their energy use, and why should
the IEA consider working with CAs?
The role of local governments is gaining increasing importance in the IEA. In May
2007, The IEA Governing Board called on the IEA ―to promote … energy efficiency
goals and action plans at all levels of government‖. In addition to this mandate from
the IEA Governing Board, there are at least six reasons:
a) Energy consumption in cities is significant – and growing rapidly. Towns and
cities consume significant amounts of energy. According to the UN-Habitat7
half the global population today lives in urban areas. However, town and city
dwellers consume 80% of all commercial energy produced globally. And as a
result, cities offer a huge resource for energy efficiency improvement.
b) City Authorities are significant energy users in their own right. CAs are
significant energy users in their own right, albeit their areas of responsibility
may vary. CAs are responsible for a major part of national energy
consumption. For example, in the USA, "Government agencies spend more
than $10 billion a year on energy to provide public services and meet
constituent needs — while grappling with tightening budgets."8 A significant
proportion of this energy spend is by city authorities. For example, Sydney's
local government spent around A$53 million on energy in 2006 to provide
urban services for their population of around 4.3 million people.
c) City Authorities play an important role in energy efficiency leadership and
implementing national energy efficiency policies. For example, many CAs are
responsible for implementing the energy efficiency requirements of building
codes.
d) City Authorities influence city energy use indirectly. This influence is
principally through CAs' urban planning functions and its consequent impact
on urban form and transport infrastructure.
e) City Authorities are currently looking for guidance. As a result, several
national governments and local government associations have developed a
range of guidance material for CAs (see for example, Kern (2005), the
Austrian Energy Agency (2008) and ICLEI (2008)).
f) City Authorities can be important implementing agents for existing IEA energy
efficiency policy work. Several of the IEA energy efficiency policy
recommendations relate to areas that, in some countries at least, are the
responsibility of local governments. These can include energy efficiency
requirements for building codes, outreach to SMEs and vehicle fuel-efficiency
testing.
7 UN-Habitat. 2006. The case for better energy planning in growing cities. Habitat Debate 12:6.
8 http://www.energystar.gov/index.cfm?c=government.bus_government_local

IEA/SLT/EC(2008)3
As a result of the rationale for
IEA involvement in the cities and
energy issues, the Secretariat has
initiated a work programme in
this area with four themes (see
box 1). The first part of this work
programme focuses on Theme 1;
namely, identifying and
evaluating best practice energy
efficiency programmes in cities.
This project is a collaborative
effort between the International
Energy Agency (IEA) and ICLEI
– Local Governments for
Sustainability (ICLEI) and is
funded by Southern California
Edison.
2 Energy efficiency best practice in cities
City governments share a
common interest to improve the
quality of life of their citizens.
Policies implemented by city
governments affect the economic,
environmental and social conditions within the city so it is imperative that those
policies are effective and suited to the particular city. There is clearly scope for city
governments to share their experiences of the effectiveness of particular policies and
so avoid the mistakes of others.
Determining what constitutes a best practice approach depends on the criteria used to
evaluate the programme. For some, cost effectiveness is the key factor. For others, the
level of CO2 savings might be important. It is important that the criteria used to define
best practice take into account the broad implications of policy.
There have recently been a number of other projects that share the specific objective
of identifying ‗best practice‘ energy efficiency programmes in cities. These other
projects include: the Best Practice Analysis (Clinton Climate Initiative, 2007), the
Good Practice on Local Energy Action (European Commission Directorate-General
for Energy and Transport, ManagEnergy Initiative) and the Best Practice Catalogue
(City Instruments Programme).
These projects have provided cities with valuable energy efficiency or greenhouse gas
mitigation information, but the lack of clear and consistent criteria means it is difficult
for cities to compare similar projects in order to assess the most effective approach.
The use of a consistent assessment framework is essential to assist cities to:
Box 1: IEA energy efficiency policy and local
governments – four themes
1. Best Practice: Documenting local government best
practice in energy efficiency policies and measures
Aim: To identify locally operational best-practice energy
efficiency policies and measures for local government.
2. Enhancing local government-national government
partnerships for energy efficiency
Aim: To enhance local government-national government
partnerships to achieve improved energy efficiency.
3. Benchmarking local government energy efficiency
Aim: To improve the understanding of energy end use in
local government by:
Identifying and addressing methodological issues
associated with local government energy efficiency
benchmarking;
Collecting, analysing and reporting relevant energy
end-use data.
4. Modelling city energy use
Aim: to identify the scope for city actions to promote
and achieve improvements in energy efficiency (demand
and supply side) and renewable energy. Specifically,
the modelling exercise will aim to:
establish cities as an important focus for energy
policy
estimate the size of global city energy spend
estimate of the energy saving/renewable energy
potential within cities
identify the impact of locally implementable energy
efficiency/renewable energy policies and measures.

identify potential projects of relevance to their city;
understand the possible financial and environmental impacts of projects;
select projects likely to deliver the greatest benefit at the least cost.
2.1 Aims of the project The overall aim of this project is to pilot an approach to evaluating energy efficiency
projects currently being implemented by cities, in order to identify those that are
suitable for other cities to adopt. The project utilises the expertise of IEA in energy
efficiency assessment and ICLEI‘s role of advocating sustainable development
policies to its local government membership.
More specifically, the project will:
develop a useful set of criteria for evaluating energy efficiency case studies.
The criteria will attempt to enable the assessment of benefits across multiple
areas of interest to city governments;
pilot the application of these criteria to a selection of energy efficiency
projects being implemented in cities.
This project is useful for cities and national governments. For cities, a rigorous
evaluation of energy efficiency projects from other jurisdictions can help them in the
process of filtering potential projects. National governments could also find the best
practice approach useful. National governments are often approached to assist with
funding of local energy efficiency projects. National governments could draw on the
approach used in this report to help them identify best practice projects for potential
funding assistance.
2.2 Expected outcomes There were two key outcomes expected of this pilot project:
1. Increased uptake of energy efficiency projects by cities. Demonstrating the
benefits of action, using a rigorous assessment approach, provides cities with
the detailed technical and financial data needed to prepare a business case.
2. A possible on-going project that continues to collect data on best practice
examples. Although the focus of this phase of the project is on energy
efficiency, a similar approach could be developed in later phases for the
assessment of renewable energy and other measures that have a greenhouse
gas mitigation benefit. Any on-going work in this area is outside the IEA core
budget and will require extra resources.
2.3 Parties involved The current project is a collaboration of IEA and ICLEI, utilising information from a
range of cities across eight countries in addition to that compiled by Energie-Cités and
the European Commission. Of the countries included in this project, only India and
Latvia are not members of the IEA.
ICLEI is an international association of local governments and national and regional
local government organizations that have made a commitment to sustainable
development. Of the cities included in this project, only Graz is not a member.

IEA/SLT/EC(2008)3
The following cities have contributed information, ether directly or indirectly, for the
project:
Adelaide, Australia
Austin, United States
Berkeley, United States
Berlin, Germany
Christchurch, New Zealand
Dunedin, New Zealand
Graz, Austria
Gwalior, India
Riga, Latvia
Stockholm, Sweden
Sydney, Australia
Information from the Energie-Cités Best Practice database and the European
Commission ManagEnergy Initiative‘s Good Practice on Local Energy Action was
used where sufficient data was not able to be obtained from the cities themselves
within the timeframe of the project.
3 The evaluation criteria The project adopts a quantitative evaluation approach to compare programmes using
defined metrics. While this requires more detailed technical and financial data than a
qualitative assessment, it is an important step in the move toward a more rigorous
approach that can be used to support effective policy development by cities.
The chosen criteria represent the most relevant aspects of a programme – time,
effectiveness and viability. The chosen criteria are well-known indicators that have
clearly defined metrics, leading to a programme evaluation process that is relatively
straightforward.
To determine whether a programme represents best practice or not, each criterion has
been assigned an arbitrary benchmark. Programmes that meet the return on
investment and two other benchmarks will be deemed best practice. Programmes that
do not achieve a minimum of three benchmarks will not be deemed best practice and
will be automatically excluded from the IEA-ICLEI project.
Although the benchmarks were arbitrarily chosen for the purpose of this pilot project,
they can be refined as more data is collected. More appropriate benchmarks will be
developed over time through on-going analysis of programme data.
The criteria used to assess projects were:
Implementation timeframe;
Energy savings;
Greenhouse gas emission reductions;
Return on investment;
Transferability.

3.1 Implementation timeframe This is defined as the time taken for the policy or the measure to first deliver energy
efficiency improvements. The timeframe includes the entire time taken to develop the
policy proposal, gain approval and implement the project. This criterion is measured
in months, with a benchmark of 12 months.
3.2 Energy savings The total energy saved as a proportion of the total energy that would have been
consumed without the programme. The total energy refers to all energy saved or
consumed during the lifetime of the programme9. This criterion is measured as a
percentage, with a benchmark of 20%.
In order to generate a baseline of energy use, had the programme not been
implemented, it was assumed that the trend in energy consumption prior to the
commencement of the programme would have continued in the absence of the
programme.
3.3 Greenhouse gas emission reductions The total CO2e saved as a proportion of the total CO2e that would have been emitted
without the programme. The total CO2e refers to all the CO2e saved or consumed
during the lifetime of the programme. This criterion is measured as a percentage, with
a benchmark of 20%.
In order to generate a baseline of greenhouse gas emissions, had the programme not
been implemented, it was assumed that the level of emissions in the year prior to the
commencement of the programme would have continued in the absence of the
programme. Greenhouse gas emissions were calculated using national emission
factors for either Scope 1 (natural gas) or Scope 2 (electricity, grid average).
3.4 Return on investment A measure of the cost-effectiveness of the programme, using the return on investment
(ROI) over 10 years. The initial investment required and the subsequent savings are
discounted to values in the year the programme commenced and the return over 10
years compared to a benchmark of 0%, which indicates the excess return over long
term interest rates.
The following discount rates are used:
Initial investment - the national long term interest (government bond) rate,
applicable in the country in which the programme is being implemented and in
the year the programme commenced. These values were sourced from the
OECD Economic Outlook No. 82 database, with the exception of Latvia
which was sourced from NationMaster. The use of this measure enables the
investment return to be compared to the alternative ‗risk-free‘ investment.
Financial savings – the average national inflation rate for the ten year period
over which the programme is analysed. These values were also sourced from
the OECD Economic Outlook 82 database, with the exception of Latvia which
was sourced from NationMaster. The use of this measure takes into account
the reduced value of energy savings in future years.
9 In this pilot study, we assumed energy use remained constant into the future. Any future study would
need to normalise for climate expectations etc.

IEA/SLT/EC(2008)3
3.5 Transferability of project City governments need to know if policy measures implemented elsewhere are
potentially suitable for their city. Examples of policies implemented in other cities
will be most relevant if the cities have similar priorities, as determined by their energy
use or greenhouse gas emission profiles. ICLEI assists many hundreds of city
governments around the world to develop greenhouse gas emission profiles, which
are used to set the strategic direction of their efforts to reduce emissions.
Although not an assessment criterion in this pilot project, an important consideration
for a city seeking to adopt a programme that has been demonstrated to be effective
elsewhere is the regulatory framework and technical capacity required to support it.
Local governments around the world have many similarities but it cannot be assumed
that all cities possess the same regulatory capacity. The ease with which a measure
can be transferred to other jurisdictions can depend on the similarity of the regulatory
frameworks across jurisdictions.
Cities were asked to provide an assessment of the transferability of the programme
they had implemented, using the following scale:
1 – The programme cannot be physically transferred due to the need for specific
environmental conditions;
2 – The programme can be transferred but at significant cost;
3 – The programme can be physically implemented with minimal cost.
A qualitative assessment of transferability was made by ICLEI using programme
information, where data was not available from the cities themselves.

4 Pilot project process The pilot project consisted of three steps:
Programme selection;
Survey design;
Collation of results and analysis.
4.1 Programme selection Many potential programmes were canvassed and classified as either ‗energy
efficiency‘, ‗renewable energy‘ or ‗alternative transportation‘. Due to the time
constraints of this phase of the project, only the energy efficiency programmes were
considered for further evaluation. Renewable energy and alternative transportation
programmes may be assessed in a future phase, using a similar approach.
Forty six programmes were initially considered for inclusion, but this was refined to
26 due to the similarity of many of the programs. In order to ensure a balance of
countries represented, a number of potential programmes in the United States were
not pursued in this phase. Ultimately, 17 cities were asked to provide information on
19 different energy efficiency programs.
Programmes were not selected on the basis of previously reported benefits, but as a
representative sample to be used to assess the potential for the more rigorous
quantitative analysis approach used in this project.
4.2 Survey design The data required to support an analysis of programmes using the criteria above was
identified. This consisted of energy source affected by the program, energy unit cost,
cost, energy savings, year of implementation, greenhouse emissions and emission
reductions.
Following the identification of data needed, a survey was developed. Cities that were
invited to participate were asked to provide data in a format that would facilitate
transfer to an analysis tool developed for the study.
Cities were also asked to provide a brief description of the programme and an
assessment of the ease with which the programme could be implemented in other
cities. This assessment of transferability was subjective, but provides an indication of
whether specific regulatory changes may be required to implement the program.
The survey was emailed to key contacts in each city, together with a covering letter of
invitation, with a response requested within three weeks. Follow-up was required in
order to get sufficient information for most cities and, in a number of cases, other
sources of information were used to supplement that provided by the cities. See
Appendix A for the Survey document developed for the pilot project.
4.3 Collation of results and analysis Programme information was compiled for 11 case studies, which was considered to
be an acceptable outcome given the constraints of the pilot project timeframe and the
nature of the information being requested.
The data reported by cities, either in a survey response or indirectly via other sources
of information, was entered into the analysis tool designed for the pilot project.
The Analysis Tool developed for the pilot project is available on request.

IEA/SLT/EC(2008)3
5 Findings A brief comparison of the case studies is presented in the Summary Table below,
followed by a further table for each of the case studies containing more detail.
5.1 Best practice programmes summary The following programmes met the benchmarks set for inclusion as Best Practice
programme examples. Note that, due to a lack of available information, the
implementation time criterion was not used to exclude programmes from this table.
5.2 Findings - all programmes The following tables present information on all programmes assessed for this pilot
project. The reason for a programme not meeting the criteria for best practice is noted
below each table.
City Project Implementation
time
Energy
saving10
GHG
reduction11
ROI
Berlin EPC for
Schools
Not available 20% 20% 117%
Christchurch Swimming
Complex
Heating
Not available 100% 100% 100%
Dunedin Pool Heat
Recovery
20 months 39% 31% 54%
Gwalior Street
lighting
efficiency
Not available 25% 25% 65%
Riga Efficient
Lighting
Initiative
15 months 48% 48% 11%
Stockholm LED Traffic
signals
18 months 90% 90% 134%
Sydney Library
Retrofit
12 months 46% 46% 89%
10
Energy saving compared to the total energy that would have been consumed without the programme,
over the ten years of the analysis.
11 Emission reduction compared to the total greenhouse emissions that would have been emitted in the
absence of the programme, over the ten years of the analysis.

5.2.1 Adelaide Detail
Country Australia
City Adelaide, South Australia
Responsible agency City of Adelaide
Project description Adelaide is progressively installing LED traffic signals at 107
intersections. Approximately 14 intersections are being
changed each year through to 2009.
Year commenced 2002
Investment ($US) $1,115,000 over 10 years
Impacts Energy saving (%12
) 59%
Greenhouse emission saving (tonnes) 1,078
Greenhouse emission reduction (%13
) 57%
Financial savings ($US p.a.) $115,300
Return on Investment (10 years) -29%
Transferability 3/3. Readily adopted by other jurisdictions, but a trial
recommended to ensure illumination level is acceptable to
road safety authorities. No specific regulation required.
This project failed to meet the Return on Investment criterion because it was
implemented over a period of 8 years. This reduced the benefit of the programme,
when measured over the ten years following the first year of implementation.
5.2.2 Austin Detail
Country United States
City Austin, Texas
Responsible agency Austin Energy
Project description The City resolved that cost effective demand side management
was to be the first priority for meeting new load growth.
Rebates and incentives are available to businesses to improve
the efficiency of equipment that contributes to peaks in power
demand.
Year commenced 1982, but detailed information available from 2003.
Investment ($US) $181,200,000 over 10 years
Impacts Energy saving (%) 1%
Greenhouse emission saving (tonnes) 77,200
12
Percent energy savings is calculated as described in Section 3.2
13 Percent CO2 savings is calculated as described in Section 3.2
IEA/SLT/EC(2008)3
Greenhouse emission reduction (%) 1%
Financial savings ($US p.a.) $6,602,000
Return on Investment (10 years) -66%
Transferability 2/3. The programme may be adopted in other cities, but needs
citizen support where the utility is publicly owned. Will be
most effective in regions with hot and humid summers, where
the peak is caused by air conditioning. Requires investment
priority to be diverted from energy supply infrastructure, so is
probably most suited to publicly owned, vertically integrated
utilities.
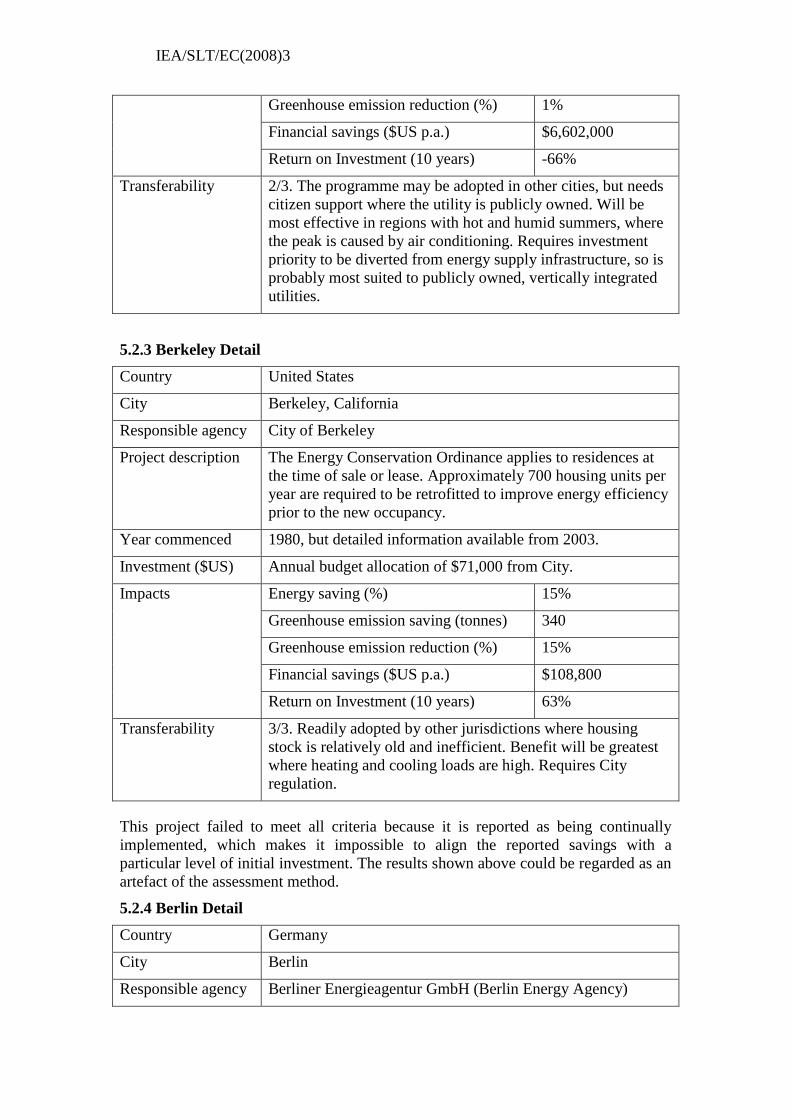
5.2.3 Berkeley Detail
Country United States
City Berkeley, California
Responsible agency City of Berkeley
Project description The Energy Conservation Ordinance applies to residences at
the time of sale or lease. Approximately 700 housing units per
year are required to be retrofitted to improve energy efficiency
prior to the new occupancy.
Year commenced 1980, but detailed information available from 2003.
Investment ($US) Annual budget allocation of $71,000 from City.
Impacts Energy saving (%) 15%
Greenhouse emission saving (tonnes) 340
Greenhouse emission reduction (%) 15%
Financial savings ($US p.a.) $108,800
Return on Investment (10 years) 63%
Transferability 3/3. Readily adopted by other jurisdictions where housing
stock is relatively old and inefficient. Benefit will be greatest
where heating and cooling loads are high. Requires City
regulation.
This project failed to meet all criteria because it is reported as being continually
implemented, which makes it impossible to align the reported savings with a
particular level of initial investment. The results shown above could be regarded as an
artefact of the assessment method.
5.2.4 Berlin Detail
Country Germany
City Berlin
Responsible agency Berliner Energieagentur GmbH (Berlin Energy Agency)

Project description Pools of school buildings are offered by tender for Energy
Performance Contracts. This ensures that some buildings with
less attractive energy saving opportunities are not ignored.
Year commenced 2001
Investment ($US) $1,500,000 over 10 years
Impacts Energy saving (%) 20%
Greenhouse emission saving (tonnes) 907
Greenhouse emission reduction (%) 20%
Financial savings ($US p.a.) $342,000
Return on Investment (10 years) 117%
Transferability 3/3. Potentially adopted by other jurisdictions where public
buildings (not limited to schools) are relatively inefficient.
Benefit will be greatest where heating and cooling loads are
high. Also requires a good energy monitoring system and a
competitive EPC industry.
5.2.5 Christchurch Detail
Country New Zealand
City Christchurch
Responsible agency Christchurch City Council
Project description A swimming pool complex that was previously heated using
LPG now uses landfill gas or heating and cogeneration. The
gas is captured and piped from a nearby landfill, from where
the gas previously escaped to the atmosphere. The methane
capture component of the project was credited with 200,000
Emission Reduction Units that were subsequently offered for
sale on the international market.
Year commenced 2007
Investment ($US) $2,900,000
Impacts Energy saving (%) 100%
Greenhouse emission saving (tonnes) 63,358
Greenhouse emission reduction (%) 100%
Financial savings ($US p.a.) $630,000
Return on Investment (10 years) 100%
Transferability 2/3. Some opportunity for replication, but requires the landfill
and a suitable facility to be reasonably close. This project
requires the landfill gas to be transported 3.7km.
Note that the landfill gas used as a replacement energy source in this programme is
regarded as waste product. The energy savings refer to the reduction in fossil fuel

IEA/SLT/EC(2008)3
energy used. The greenhouse emission reduction also refers to the reduction in
emissions associated with the LPG used previously.
5.2.6 Dunedin Detail
Country New Zealand
City Dunedin
Responsible agency City of Dunedin
Project description The installation of a heat pump at a public swimming pool was
matched to the waste heat stream in order to extract and return
energy to the pools, lowering net energy costs by 18%. The
reduction in heating gas costs was partially offset by an
increase in electricity use.
Year commenced 2007
Investment ($US) $711,000
Impacts Energy saving (%) 39%
Greenhouse emission saving (tonnes) 598
Greenhouse emission reduction (%) 31%
Financial savings ($US p.a.) $118,400
Return on Investment (10 years) 54%
Transferability 3/3. Particularly suited to cold climates, where the heating load
is high. Also requires the pool to be enclosed in order for the
heat to be reclaimed.
5.2.7 Graz Detail
Country Austria
City Graz
Responsible agency Graz Energy Agency
Project description The pilot project phase, Green Light Graz 1, was implemented
in main streets and involved replacing 720 lamps that were
quite old. The measures consist of lamp reconstruction, lamp
change, installation of control systems and the change of
associated equipment to modern technology. A further 15,000
lamps will be changed in the four years from 2007 to 2010, but
this analysis is of the pilot project only.
Year commenced 2005
Investment ($US) $1,310,000 over 10 years
Impacts Energy saving (%) 56%
Greenhouse emission saving (tonnes) 85

Greenhouse emission reduction (%) 56%
Financial savings ($US p.a.) $48,800
Return on Investment (10 years) -60%
Transferability 3/3. Suitable for any city with older street lighting
infrastructure. Graz used the Thermoprofit model, whereby the
investments were pre-financed and were refinanced from the
energy cost savings. After 15 years, when the works have been
paid for, the city benefits from the full energy savings.
This project failed to meet the Return on Investment criterion because it is reported as
being continually implemented, using an EPC financing model which makes it
impossible to align the reported savings with a particular level of initial investment.
The results shown above could be regarded as an artefact of the assessment method.
5.2.8 Gwalior Detail
Country India
City Gwalior
Responsible agency Gwalior City
Project description Street lighting accounted for 20% to 30% of total energy
consumed by the city government and cost $400,000 per year.
The City has implemented an efficiency programme is able to
be accredited under the Clean Development Mechanism
(CDM) and is hopeful that a similar approach can be used in
13 other cities in Madhya Pradesh.
Year commenced 2005
Investment ($US) $500,000
Impacts Energy saving (%) 25%
Greenhouse emission saving (tonnes) 1,195
Greenhouse emission reduction (%) 25%
Financial savings ($US p.a.) $97,400
Return on Investment (10 years) 65%
Transferability 3/3. Readily transferred to other cities for financial,
greenhouse and CDM benefits, when done in an eligible
country.
5.2.9 Riga Detail
Country Latvia
City Riga
Responsible agency Latvian Academy of Sport Education

IEA/SLT/EC(2008)3
Project description An Energy Services Company (ESCO) was used to renovate
the indoor lighting at the Academy. Improvements in the
quality of lighting were made in both the sports hall and
viewing balcony. This improved player safety, spectator
comfort and reduced energy usage.
Year commenced 2003
Investment ($US) $45,400
Impacts Energy saving (%) 48%
Greenhouse emission saving (tonnes) 30
Greenhouse emission reduction (%) 48%
Financial savings ($US p.a.) $6,850
Return on Investment (10 years) 11%
Transferability 3/3. An ESCO model is suitable for many applications where
the City itself does not have the financial resources to fund a
project. The ESCO needs access to capital, typically from a
commercial financial institution. No regulations were required.
5.2.10 Stockholm Detail
Country Sweden
City Stockholm
Responsible agency City of Stockholm
Project description LED traffic signals were installed to replace 27,000
incandescent lamps at 530 traffic control points. Before
installation proceeded, the LED technology was tested under
the conditions of extreme cold, humidity and salty air in the
city.
Year commenced 1996
Investment ($US) $3,000,000
Impacts Energy saving (%) 90%
Greenhouse emission saving (tonnes) 1,537
Greenhouse emission reduction (%) 90%
Financial savings ($US p.a.) $713,900
Return on Investment (10 years) 134%
Transferability 3/3. Readily adopted by other jurisdictions, but a trial
recommended to ensure illumination level is acceptable under
local conditions. No specific regulation required.

5.2.11 Sydney Detail
Country Australia
City Sydney
Responsible agency City of Sydney
Project description A major library in the city was retrofitted to replace inefficient
low voltage down-lights and the air-conditioning control
system. Relatively minor works were required, at minimal
cost, but the return has been significant.
Year commenced 2007
Investment ($US) $22,100
Impacts Energy saving (%) 46%
Greenhouse emission saving (tonnes) 82
Greenhouse emission reduction (%) 46%
Financial savings ($US p.a.) $4,580
Return on Investment (10 years) 89%
Transferability 3/3. Readily transferable to cities around the world, most of
which operate several libraries. Extent of benefit will depend
on the inefficiency of current equipment.

IEA/SLT/EC(2008)3
6 Outcomes A range of methods could potentially be used to analyse the result of this project. The
challenge of combining the criteria used into one assessment of ‗best practice‘ could
be resolved by multiplying each criterion by a weight. However, given the subjective
nature of the weighting process, it was decided that this was not appropriate. An
alternative approach is to use graphical representation of a programme‘s performance
against the criteria. An approach to summarising the results of the projects against 3
of the quantified criteria is given below:
Figure 1: Summary of projects against three criteria
The programmes are compared here under each of the assessment criteria.
6.1 Implementation timeframe All of the five programmes for which this information was available required a
planning and implementation period of at least 12 months.
-100%
-50%
0%
50%
100%
150%
Ad
elaide -LED
Traffic signals
Au
stin -Po
wer Saver P
rogram
Berkeley -R
esiden
tial Energy
Co
nservatio
n O
rdin
ance
Berlin
-Freidrich
shain
EPC
for
Scho
ols
Ch
ristchu
rch -Sw
imm
ing
Co
mp
lex Heatin
g & C
o-…
Du
ned
in -M
oan
a Poo
l Heat
Reco
very
Graz -G
reen
Light G
raz
Gw
alior -C
DM
Pro
ject in
Streetlightin
g
Riga -Efficien
t Lightin
g In
itiative
Stockh
olm
-LED Traffic
signals
Sydn
ey -Library R
etrofit
Energy saving

Figure 2: Implementation timeframe
This period was used for:
an assessment options to address the inefficiency that had been identified
through the compilation of a greenhouse gas inventory;
an assessment of the potential benefits of those options;
gaining the support of city decision-makers;
arranging a suitable means of financing the project;
a tender process;
infrastructure works.
The two indoor energy equipment retrofit projects, in Riga and Sydney, required the
least time to implement, due to the relatively minor infrastructure changes needed.
The LED traffic signal projects took the longest due to the need to ensure that the
technology provided an acceptable level of safety for road users.
6.2 Energy savings The percentage saving in energy achieved by the programmes varied greatly, from
just 1% to 100%, but most were in the range of 20% to 50% of business as usual
energy use.
The Austin Energy programme was reported against a baseline of the entire city
energy consumption, rather than just the energy consumed by those businesses in
receipt of subsidies to install more efficient equipment. The 1% saving reported for
this programme is probably understated.
02468
10121416182022
Ad
elaide -LED
Traffic signals
Au
stin -P
ow
er Saver Pro
gram
Berkeley -R
esiden
tial Energy
Co
nservatio
n O
rdin
ance
Berlin
-Freidrich
shain
EPC
for
Scho
ols
Ch
ristchu
rch -Sw
imm
ing
Co
mp
lex Heatin
g & C
o-…
Du
ned
in -M
oan
a Po
ol H
eat R
ecovery
Graz -G
reen Ligh
t Graz
Gw
alior -C
DM
Pro
ject in
Streetlightin
g
Riga -Efficien
t Lightin
g Initiative
Stockh
olm
-LED Traffic sign
als
Sydn
ey -Library R
etrofit
Mo
nth
s
Benchmark

IEA/SLT/EC(2008)3
The programme at the Christchurch city swimming complex involved replacing LPG
heating with a cogeneration system using landfill gas. It has been assessed as
providing a 100% reduction in energy use and greenhouse gas emissions, due to the
landfill gas being regarded as a zero carbon fuel source. The additional greenhouse
benefit from the landfill gas no longer escaping to the atmosphere has not been taken
into account in this analysis, on the basis that a range of other management options,
such as flaring, are available. The actual benefit of this programme is that the landfill
gas is being used as a replacement energy source.
The finding that most programmes provided energy savings of between 20% and 50%
demonstrates the large number of opportunities that exist to significantly reduce
energy consumption in cities.
6.3 Greenhouse gas emission reductions All programmes analysed, except Christchurch and Dunedin, involved an
improvement in the efficiency of electricity use. Because a grid average electricity
emission factor was used in this analysis, the greenhouse savings are very similar to
the energy savings.
Figure 3: Greenhouse gas emission reductions
6.4 Return on investment The financial analysis used in this pilot project is intended to highlight the excess
return from the project compared to the return that could have been obtained by
investing the money in long term bonds at the rate available in the year the
programme commenced. The benchmark of 0%, indicating that the programme
provided a net benefit, was exceeded by all except those in Adelaide, Austin and
Graz. As noted earlier, the assessment method used here may have disadvantaged
those projects requiring on-going investment.
1
10
100
1000
10000
100000
Ad
elaide -LED
Traffic signals
Au
stin -P
ow
er Saver Pro
gram
Berkeley -R
esiden
tial Energy
Co
nservatio
n O
rdin
ance
Berlin
-Freidrich
shain
EPC
for
Scho
ols
Ch
ristchu
rch -Sw
imm
ing
Co
mp
lex Heatin
g & C
o-…
Du
ned
in -M
oan
a Po
ol H
eat R
ecovery
Graz -G
reen Ligh
t Graz
Gw
alior -C
DM
Pro
ject in
Streetlightin
g
Riga -Efficien
t Lightin
g Initiative
Stockh
olm
-LED Traffic sign
als
Sydn
ey -Library R
etrofit
Ton
nes
of
CO
2

The range of positive returns shown by the programmes assessed here was between
11% in Riga and 134% in Stockholm. In general, a higher rate of return is
demonstrated in cases where the investment is made at the start of the project and the
energy savings are high.
The value of rapid programme implementation is demonstrated particularly well by
comparing the benefits of the LED traffic light programmes in Adelaide and
Stockholm. The ROI of the two similar programmes has been far greater in
Stockholm due to the Swedish programme being implemented rapidly, whereas the
Adelaide programme involves a progressive roll out of the technology to suit budget
limitations.
The returns are also highest where the inflation rate is low, so that the dollar value of
future energy savings is not diminished to any significant extent.
6.5 Transferability Of the cities that responded to this question in the survey, all except Austin regarded
their programme as being readily transferable. The rating of 2 given by Austin reflects
the cost of the programme and that it is most suitable for a utility in an area with hot
and humid summers.
Information sources used for this pilot project, in cases where the city itself did not
respond to the request for information, indicated that most programme were readily
transferable. The exception to this was the Christchurch programme, which was
designed to take advantage of the proximity of a landfill and a suitable heat load in
that city.

IEA/SLT/EC(2008)3
7 Future direction This pilot project is the first attempt to address the lack of rigorous and transparent
approach to defining best practice in city energy efficiency programmes. The project
has provided interesting insights into a range of exciting projects being implemented
in cities around the world. However, the potential exists for far greater benefit. Key
areas have been identified through this project that require further work:
Project data management;
Refinement of criteria;
Broaden scope;
A feedback mechanism.
7.1 Data management While some cities were well placed to provide the requested information, others were
clearly challenged by the detail requested. Although the data access issues
encountered were undoubtedly a function of the short timeframe of the project, the
response received by more than one city was that the level of detail was simply not
available.
The data management issues raised by this pilot project could be resolved by a
consistent method for the storage of programme data at the local government level,
together with the capacity to access the data when required.
The project also highlighted the need for programme assessment methods to be
comparable. While many cities have successfully reported qualitative information on
programmes to other agencies, they were less able to provide data to satisfy the strict
quantitative assessment criteria tested in this pilot project.
7.2 Refinement of criteria There are many potential benefits of programmes that are of interest to cities, in
addition to the environmental and economic elements assessed in this project. It is
within the mandate of most city governments to protect and enhance the amenity of
the area they govern to improve the quality of life of residents. There may be potential
to include certain social indicators in a future assessment.
It has been noted in this report that the criteria of return on investment may have
disadvantaged programmes implemented over a period of years. Further work is
required in order to determine which measure of financial benefit is most appropriate
for the full range of projects being implemented by cities.
While the general framework of assessment used here is applicable, further work is
required to define the appropriate criteria for programme assessment.
The development of benchmarks to assess best practice is facilitated by data from
many similar programmes. Once the assessment framework is further defined,
information from many more case studies is required to enable the development of
benchmarks that are based on programme experience rather than being arbitrarily set
as was the case for this pilot project.

7.3 Broaden scope This pilot project has focussed on energy efficiency and attempted to gather accurate
financial, energy and emissions data. However, there are two areas where this project
could benefit from a broader scope. First, the project could usefully extend its scope
beyond energy efficiency to include the many programmes being implemented by
cities involving the use of renewable energy and alternative transportation. Second,
the project could also usefully expand its scope to investigate some of the ‗softer‘
aspects of the programmes surveyed. That is, it would also be useful for the project to
help shed light on the motivations, perceived barriers and other factors involved in
pursuing energy efficiency or renewable energy investments.
7.4 Feedback mechanism Information on best practice programmes needs to be disseminated to other cities. It
needs to be both readily accessible and relevant to their city, in order that it can be
used in strategic planning processes.
The effective sharing of information would be assisted by a centralised, global
database that enables relevant case studies to be identified. The most relevant
information is that from analogous cities, so a key aspect of any feedback mechanism
is the assessment of transferability.
To achieve this, there may be scope to more closely align the assessment method
developed in this project with the IEA Demand Side Management work programme.
Of particular relevance is the DSM Programme Task XVIII: DSM and Climate
Change (2007), which includes a component of improving data management and the
development of a database to enable users to identify a range of options to improve
energy efficiency and reduce the emission of greenhouse gases. In addition, it may be
useful to include these and further local-government policies in the IEA energy
efficiency policies and measures database
(http://www.iea.org/textbase/pm/index_effi.asp).

IEA/SLT/EC(2008)3
References
Austrian Energy Agency. 2008. Klima:aktiv. http://www.klimaaktiv.at/, Vienna.
ICLEI. 2008. ICLEI‘s Five Milestones for Climate Protection. http://www.iclei-
usa.org/action-center/getting-started/iclei2019s-five-milestones-for-climate-
protection.
Kern, K., S. Niederhafner, S. Rechlin, and J. Wagner. 2005. Kommunaler
Klimaschutz in Deutschland — Handlungsoptionen, Entwicklung und
Perspektiven. Social Science Research Centre Berlin, Berlin.

Appendix A – copy of survey cover letter and survey
Dear <mail merge>
Re: Promoting Energy Efficiency Best Practice in Cities
We are writing to request your assistance on a major local government energy efficiency
project.
The ‘Promoting Energy Efficiency Best Practice in Cities‘ project is a collaborative exercise
between the International Energy Agency (IEA) and ICLEI – Local Governments for
Sustainability. The IEA provides international energy policy advice focusing on energy
security, economic development and environmental protection. ICLEI is an international non-
profit association of more than 700 local governments and their national organisations that
have made a commitment to sustainable development. For more information on the roles of
both the IEA and ICLEI please visit: www.iea.org or www.iclei.org respectively.
The purpose of the ‗Promoting Energy Efficiency Best Practice in Cities‘ project is to collect,
evaluate and publish a meaningful compilation of case studies of best practice. The case
studies represent prominent examples of energy efficiency policy and measures undertaken
by local government from around the world. The objective in undertaking such a project is to
encourage local governments to further improve the energy efficiency of their operations - by
considering adopting some of the innovative ideas contained in the compilation for their own
jurisdiction. Once completed, the results of the ‗Promoting Energy Efficiency Best Practice in
Cities‘ project will be made available free of charge to all local governments.
Your <mail merge> has been identified as a prominent example of an energy efficiency
policy or an energy efficiency measure, and as such, we would like to include it in the
‗Promoting Energy Efficiency Best Practice in Cities‘ project. However, in order for this to
happen, we require more information on your programme. It would be much appreciated if
you could please complete the attached survey and return it by 31 January 2008.
If you have any questions regarding the survey or the ‗Promoting Energy Efficiency Best
Practice in Cities‘ project - please do not hesitate to get in contact with:
Thank you for your time.
Kind Regards
Nigel Jollands, PhD Wayne Wescott
Principal Administrator Chief Executive Officer
Energy Efficiency Division ICLEI – Local Governments for
Sustainability
International Energy Agency Oceania Secretariat

IEA/SLT/EC(2008)3
Part 1: Programme Description
1. Name of programme (please amend as necessary)
2.
Please provide a contact person for the survey (so that we can contact you if required; this information will NOT be published)
Name:
Position:
Telephone:
Email:
3. Date of survey completion (dd/mm/yyyy)
4. What agency/organisation is responsible for the programme?
Organisation Name:
Website:
5.
Please write a description of the programme by answering the following questions. An example of a description is provided at the conclusion of the survey.
What does the programme aim to achieve and how will the programme achieve this aim?
Who are the stakeholders of the programme?
Where is the programme located? (i.e. country, city, suburbia etc.)
In what year did the programme first deliver benefits?
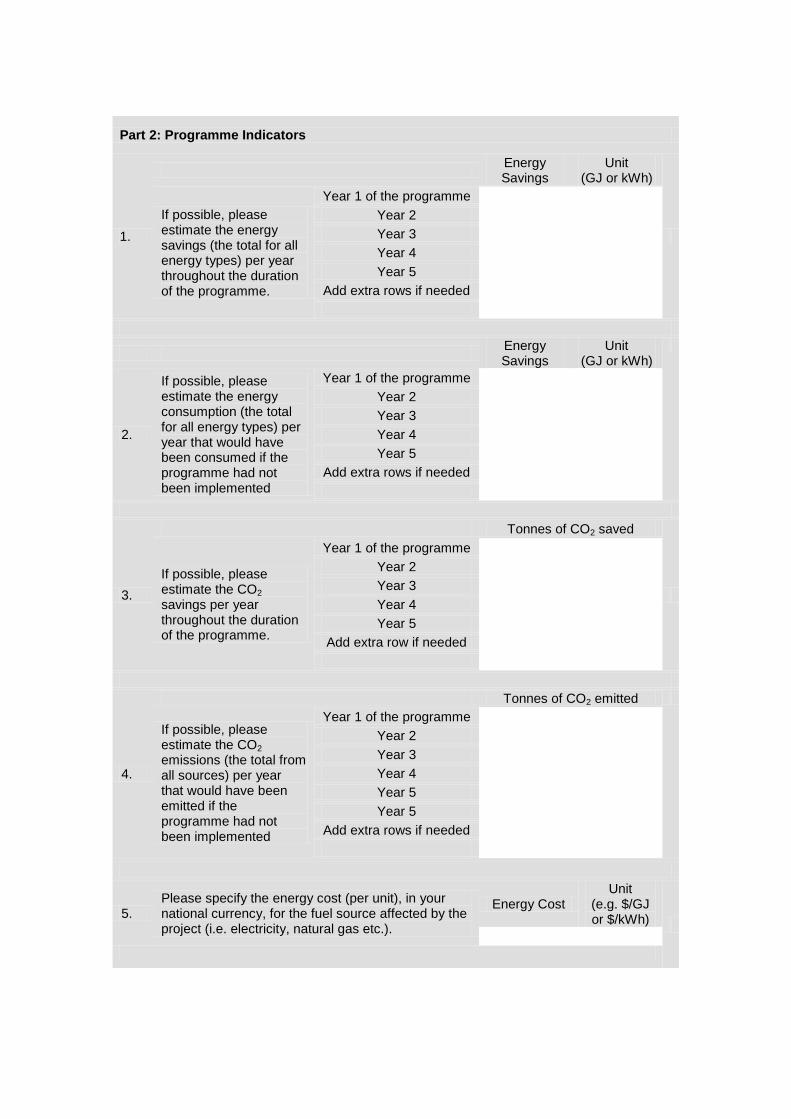
Part 2: Programme Indicators
1.
Energy Savings
Unit (GJ or kWh)
If possible, please estimate the energy savings (the total for all energy types) per year throughout the duration of the programme.
Year 1 of the programme
Year 2
Year 3
Year 4
Year 5
Add extra rows if needed
Energy Savings
Unit (GJ or kWh)
2.
If possible, please estimate the energy consumption (the total for all energy types) per year that would have been consumed if the programme had not been implemented
Year 1 of the programme
Year 2
Year 3
Year 4
Year 5
Add extra rows if needed
3.
Tonnes of CO2 saved
If possible, please estimate the CO2 savings per year throughout the duration of the programme.
Year 1 of the programme
Year 2
Year 3
Year 4
Year 5
Add extra row if needed
4.
Tonnes of CO2 emitted
If possible, please estimate the CO2 emissions (the total from all sources) per year that would have been emitted if the programme had not been implemented
Year 1 of the programme
Year 2
Year 3
Year 4
Year 5
Year 5
Add extra rows if needed
5. Please specify the energy cost (per unit), in your national currency, for the fuel source affected by the project (i.e. electricity, natural gas etc.).
Energy Cost Unit
(e.g. $/GJ or $/kWh)

IEA/SLT/EC(2008)3
Part 3: Financial Consideration
Amount Currency
1.
What are the costs, in your national currency to the programme throughout its duration? Please include, where applicable, the development cost, operation cost and any decommissioning cost.
Year 1 of the programme
Year 2
Year 3
Year 4
Year 5
Add extra row if needed
Part 4: Transferability
1.
Given the scale below, how transferable is your programme to other domestic or international jurisdictions? 1. The programme cannot be
physically transferred due to the need for specific environmental conditions
2. The programme can be transferred but at significant cost (see below)
3. The programme can be physically implemented with minimal cost.
The cost could be a result of the need to: implement a local or national legal framework, undertake campaigns to change people’s attitudes or behaviour in order for the programme to be accepted, attract and retain skilled labour to implement and/or operate the programme or extensively modify existing infrastructure in order to accommodate the programme – despite the fact that it can be physically transferred.
Please indicate in the top space the number between 1 and 3 that best corresponds to your programme, and in the bottom space provide an explanation for your answer.

Part 5: Comments
Please write in the space below if the programme has any other significant features that would help distinguish it from other programmes. For instance, the programme could have a high degree of innovation or could have considerable environmental, economic or social co-benefits or side effects.
Please attach any documents (such as reports etc.) that you think would be of use to the ‘Promoting Energy Efficiency Best Practice in Cities’ project. Likewise, if there is a website that has additional information on your programme, please enter the address below.
http://