evidence for phase transition in nerve fibers, cells and ... fileevidence for phase transition in...
TRANSCRIPT

Ferroelectrics, 1999, Vol. 220, pp. 305-316 Reprints available directly from the publisher Photocopying permitted by license only
© 1999 OPA (Overseas Publishers Association) N.V. Published by license under
the Gordon and Breach Science Publishers imprint.
Printed in Malaysia.
EVIDENCE FOR PHASE TRANSITION IN NERVE FIBERS, CELLS AND SYNAPSES
I. TASAKI*
*e-mail: [email protected]
National Institute of Mental Health, Bethesda, MD 20892, USA
(Received 14 August 1997; In final form I July 1998)
By examining rapid changes in the volume and temperature during excitation of a large number of excitable cells and tissues, we have shown that the excitation process is invariably accompanied by swelling and heat production in the superficial protoplasmic layer. Bycomparing the behavior of a model system (synthetic anionic gels containing both Ca- and Na-ions) with that of nerve fibers under comparable environmental conditions, we have demonstrated that the onset of an action potential is a reflection of a discontinuous volume transition in the superficial layer of nerve cells and fibers. Evidence for the existence of a first-order phase transition (involving volume and temperature changes) in nerve cells, fibers and synapses is presented.
Keywords: Nerve excitation; phase transition
INTRODUCTION.
It is well-known that water makes up over 80 percent of the weight of the brain and other excitable tissues. [I, 2] When these tissues are excited, there is a rapid swelling (sudden rise in the gel water content), accompanied by a rise in the temperature of the tissues (see below). It is asserted in this article that these abrupt changes in the tissue volume and temperature are manifestations of a first-order phase transition associated with divalent-monovalent cation-exchange [3], 4] in the plasmalemma-ectoplasm complex [5] ofthe cells and fibers. The speculation that the process of nerve excitation may be associated
with a profound structural change in the nerve fibers and cells is not new. Already in 1906, Jacques Loeb, [6J who introduced the concept of "ion
305

306 I. TASAKI
antagonism," wrote: "The normal irritability of animal tissues depends upon the presence ofNa, K, Ca and Mg ions in the right proportion .... Any sudden change in the relative proportions . . . alters the properties of the tissues and gives rise to an activity or an inhibition of the activity". Later on, Clowes [7] found that addition of CaCl2 to a concentrated emulsion ofNa-oleate brings about a drastic rise in the electric resistance of the emulsion and emphasized the importance of the fact that this rise takes place in an extremely narrow range of the Ca ion concentration. In his textbook of general physiology, Heilbrunn [8] wrote: "When a portion of a cell or tissue responds to stimulation, that region becomes electronegative and an action potential is created. Such an action potential might well be related to a release of calcium and other cations from the colloids in the cell cortex and an addition ofcalcium to the colloids of the cell interior". Similar views were held also by other investigators. [9] The occurrence of a transient change in the axon water content (arising
from Ca-ion influx during excitation) was predicted by R.J.P. Williams. [10] In his article entitled "The biochemistry of sodium, potassium, magnesium and calcium" (Tilden Lecture, 1970), he said: "As calcium has a high affinity for many proteins, it can be used as an initiator ofstructural change, provided that its concentration can be dynamically controlled (p. 337)". "There is the strong indication that activity owes itself to a cooperative interaction between metal ion and protein (p. 333)". The approach adopted in this article to describe the behavior of the nerve
membrane is phenomenological. "In a phenomenological description of a system, we try to describe the behavior solely in terms of the coarse-grained variables, without reference to the microscopic details of the system" (from p. 33 and p. 315 in "Lectures on Phase Transitions and the Renormalization Group" (N. Golenfeld, [11] 1992).
SWELLING AND HEAT PRODUCTION IN NERVE FIBERS, CELLS AND SYNAPSES
To observe swelling of nerve fibers and cells during excitation, it is required to use a device capable of detecting very small and rapid displacements or pressure changes taking place at the surfaces of live tissues that are inevitably soft and wet. We have constructed, for this purpose, sensitive measuring devices by incorporating either a Fotonic sensor (a dual light-guide device obtained from Mechanical Technology, Latham, New York) or

307 PHASE TRANSITION IN NERVE
a Gulton bender (a piezoceramic bar purchased from Gulton Industries, Metuchen, New Jersey). The details of constructing and calibrating these devices may be found elsewhere. [12] Four examples of the records obtained by using these devices are
presented in Figure 1. An upward deflection of the top traces in the Figure indicates generation of a force tending to displace the surface of the tissue outwards. The bottom traces represent the electric responses of the tissues recorded simultaneously by using electrodes placed in the vicinity of the site of mechanical recording. In the case of squid giant axons [13] and garfish olfactory nerves, [14] it was possible to record action potentials directly from the site of mechanical recording. In these cases, it was evident that the action potential starts at the onset of swelling of the nerve fibers and that the peak of the action potential coincides with the maximum of the swelling.
___
FROGFROG SYMPATHETIC
GANGLIONGARFISH DORSAL ROOT SQUID RETINA
OLFACTORY NERVE GANGLION
II /\ I
[——] 100 ms
[——]30 ms [——] 5 m s
FIGURE I Records showing swelling (top traces) of excitable tissues associated with the production of their electric responses (bottom traces). The vertical bars in the figure represent the magnitudes of the force, (from theleft) 4, 10, 1 and 5 mu g, respectively, detected by use of piezoelectric devices. (Refs. [ 14-I 6 and 19]).
By using the above-stated and other mechanical and optical devices, we have examined the signs of rapid structural changes during excitation of a large number of excitable cells and tissues.The materials examined include invertebrate and vertebrate nerve fibers, [13, 14] amphibian and mammalian ganglion cells, [15–17]invertebrate photoreceptor cells [18, 19] and amphibian skin glands. [20] All the excitable tissues that were amenable to our detection showed, without exception, rapid swelling during the electrical responses to electrical, photic and chemical stimuli. We now tum to our measurements of heat production associated with
excitation of nerve fibers, cells and other excitable tissues. The heat sensor which we have constructed by incorporating thin (6-9 mu m) pyroelectric film of polyvinylidene-fiuoride [21] is i well suited for detecting small and brief heat production in biological tissues. [22, 23]With our heat-sensor, we found the time required to detect a sudden rise in temperature was 0.5–1 ms. The best

308 I. TASAKI
time-resolution achieved by use of the classical thermopile device appears to be 50–100 ms.[241 Two examples of the records we have obtained are furnished in Figure 2.
The top traces in the Figure represent the rate of temperature rise (which is proportional to the heat produced in the tissues). The left-hand record was taken from a bundle of many small nerve fibers in the garfish olfatory nerve. [141
4x 10⁻³ deg/s /\
30 ms 3. s
FIGURE 2 Left: top trace shows the rate of temperature rise in the garfish olfactory nerve following the arrival of a nerve impulse at the site of heat detection; middle trace, the action potential recorded from the same site. (Ref. [14]) Right: top trace represents the rate of temperature rise in the bullfrog skin evoked by repetitive nerve stimulation (for Is at 10Hz); middle trace shows the time course of the pressure developed at the skin surface (roughly 150dyn/cm2 at its maximum). The bottom traces show the duration of the stimulus.
It is seen that the rising phase of the observed heat production (top trace) coincides with the upstroke of the. action potential (middle trace). The right-hand record in the Figure was taken from a frog nerve-skin preparation by stimulating the. nerve entering into the skin. [20J The middle trace shows the time course of the swelling of the skin glands. It is seen that the heat production occurs during the rising phase of the swelling (initiated by the release of adrenergic transmitter from the nerve endings). We have conducted temperature measurements on the following
materials: bundles of nonmyelinated and myelinated nerve fibers, [14, 25]
synapse-rich portions of the frog nerve-muscle and spinal cord prepara-tions, [26, 27] frog cutaneous exocrine glands, [28, 20] and electric organs of electric fish, [29 - 311etc. There is no doubt that the excitation process in these materials is invariably accompanied by heat production.
EXCITABILITY OF GIANT AXONS UNDER CONTINUOUS INTERNAL PERFUSION
In early 1960's, it was found possible to maintain excitability of the squid giant axons for hours under continuous internal and external perfusion with
309 PHASE TRANSITION IN NERVE
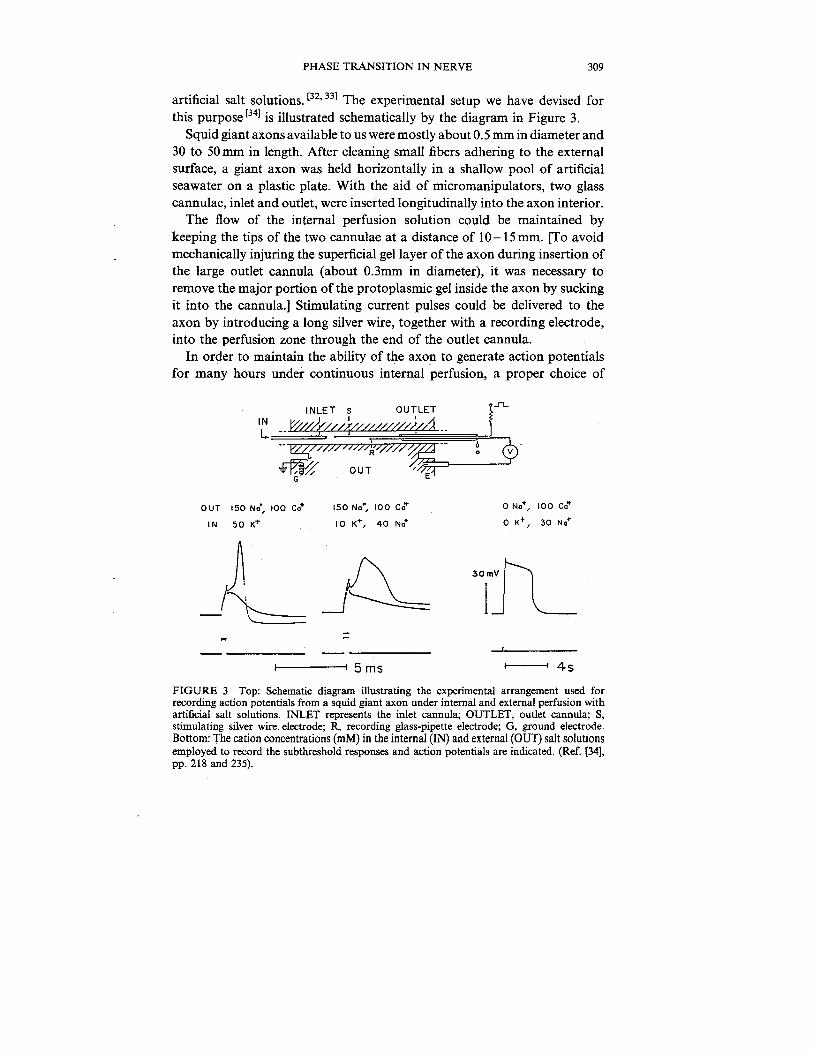
artificial salt solutions. [32, 331 The experimental setup we have devised for this purpose [341 is illustrated schematically by the diagram in Figure 3.
OUT 150 Na+, 100 Co+ 150 Na+, 100 Ca+ O Na+, 100 Ca+ O
IN 50 K+ 10 K+, 40 Na+ K+ 1 30 No+
= 5ms 4s
FIGURE 3 Top: Schematic diagram illustrating the experimental arrangement used for recording action potentials from a squid giant axon under internal and external perfusion with artificial salt solutions. INLET represents the inlet cannula; OUTLET, outlet cannula; S, stimulating silver wire. electrode; R, recording glass-pipette electrode; G, ground electrode. Bottom: The cation concentrations (mM) in the internal (IN) and external (OUT) salt solutions employed to record the subthreshold responses and action potentials are indicated. (Ref. [34], pp. 218 and 235).
Squid giant axons available to us were mostly about 0.5 mm in diameter and 30 to 50 mm in length. After cleaning small fibers adhering to the external surface, a giant axon was held horizontally in a shallow pool of artificial seawater on a plastic plate. With the aid of micromanipulators, two glass cannulae, inlet and outlet, were inserted longitudinally into the axon interior. The flow of the internal perfusion solution could be maintained by
keeping the tips of the two cannulae at a distance of 10 –15mm. [To avoid mechanically injuring the superficial gel layer of the axon during insertion of the large outlet cannula (about 0.3mm in diameter), it was necessary to remove the major portion of the protoplasmic gel inside the axon by sucking it into the cannula.] Stimulating current pulses could be delivered to the axon by introducing a long silver wire, together with a recording electrode, into the perfusion zone through the end of the outlet cannula. In order to maintain the ability of the axon to generate action potentials
for many hours under continuous internal perfusion, a proper choice of

310 I. TASAKI
perfusion solutions is important. It is necessary to keep the osmolarity of the internal salt solution close to that of seawater (by adding sucrose, glycerol or other non-electrolyte to the salt solution). The pH inside is held at about 7.3. The hydrostatic pressure inside is kept at a level slightly above that of the external medium, so that the normal shape of the superficial gel layer of the axon can be maintained. The anion species of the internal salt solution is chosen to be F-, HPO24-, or So2–4 [Anions with high lyotropic numbers, such as r, Br-, SCN- etc., cause dissolution of the superficial gel layer of the axon and slowly suppress the axon excitability.][34] The records furnished in Figure 3 are examples of the action potentials
obtained. The combinations of cations in the internal and external solutions employed are indicated in the Figure. It is seen that the action potential observed with a mixture of Ca2 + and Na + externally and with K + internally (see the record on the left-hand side) is very similar to that taken without internal perfusion: it has, after a sharp rise, a very brief falling phase followed by a large potential undershoot. When a sizable portion of K + inside is replaced with Na+, the falling phase of the action potential becomes slightly longer and shows little or no potential undershoot: this is very similar to the action potential of the vertebrate motor nerve fiber [34] (which are only 10 to 20 mu m in diameter).
It is very important to note that, even when the internal K + is completely replaced with Na+,the axon remains excitable for hours, as long as the Ca2 + concentration level outside is kept high. The action potentials observed under these conditions have a long duration and the record has an almost rect-angular appearance. This change in the action potential duration is reversible. When K + is reintroduced into the axon, brief action potentials reappear. The record shown on the right-hand side of the Figure was taken from an
axon internally perfused with a dilute salt solution containing only Na+ and immersed in a solution containing Ca2 + as the sole cation species. [35, 361This demonstrates the dispensability of Na + in the external medium for the maintenance of axon excitability. The nature of this action potential will be discussed later in this article. Action potentials observed by introducing other salts inside and outside the axon may be found elsewhere. [34]
DISCONTINUOUS VOLUME TRANSITION ASSOCIATED WITH Na+ -Ca2+ EXCHANGE IN SYNTHETIC ANIONIC GELS
A proper perspective of the experimental findings mentioned above may be gained when it is noted that synthetic anionic polymer gels can undergo

311 PHASE TRANSITION IN NERVE
discontinuous volume transitions associated with Na +-Ca2 + exchange in the gels. Following the experimental procedure described by Tanaka and his collaborators, [37, 38]we have examined swelling properties of small anionic gel beads immersed in aqueous salt solutions containing both Na + and Ca2 +.
Figure 4A shows equilibrium swelling of polyacrylic acid gel immersed in a medium prepared by mixing· NaCl and CaCl2 solutions at varying ratios. [3,4] It is seen that, at a mole ratio [Na +]/[Ca2 +] of roughly 30/1 in the external medium, a discontinuous change in the diameter of the beads takes place. At the transition threshold, roughly 80 percent of the negative charges in a compact bead is neutralized by Ca2 + and the remaining 20 percent by Na + and H+. When a gel in the Ca2 +-rich, compact state reaches this transition threshold, there is nearly 20-fold increase in the water content of the geL Evidently, this is a manifestation of a cooperative interaction of the cross-linked polymer strands in the gel with the cations and water coming from the surrounding aqueous solution. Similar results were obtained by using K + in place of Na +.
A 8 Gl ANT NERVE FI BER
CaCl2__j,GEL
30mM N
E I.O 40mM--NaCI CaCl2 1OOmM NoCl + 400mM
UJ
50mV
I---0.2 5
Ca2+ – CONC. (mM) [No+]SLOW RISE IN
[Ca2+]
FIGURE 4A Diagram illustrating a single polyacrylate gel bead immersed in a 40mM NaCl solution in a cuvette (top). The circles in the figure show the dependence of the diameter (log scale) of the gel bead (in equilibrium) on the concentration of calcium chloride added to the NaCl solution in the cuvette (bottom). (Ref. [3]). B: Diagram illustrating a squid giant axon under internal perfusion with a 30mM NaF solution and immersed in a solution containing lOOmM CaCl2 and NaCI, the concentration of which was raised slowly from 200 to 400mM. The heavy line in the figure (bottom) shows a portion of a long record (continuously taken) demonstrating an abrupt rise in the internal potential during the course of a continuous rise in the concentration ratio [Na +]/[Ca2 +] in the external medium. (Ref. [34], p. 243).
It is known that substitution of Ca2 + in various cation-exchangers with Na+ or K+ is associated with a decrease in enthalpy of 1.5-3.0kcal/ equiv. [39–41] Our measurement of temperature changes in polyacrylate gel suspension [3] yielded a slightly smaller value of enthalpy change associated

312 I. TASAKI
with Ca2 +-Na+ exchange. Substitution of Na + or K + for Ca2 + in the anionic gel is exothermic.
PHASE TRANSITION AND EXCITATION PROCESS
We now compare the behavior of the anionic polymer gels shown in Figure 4A with that of a squid giant axon under somewhat comparable environmental conditions. As illustrated by the diagram on the top of Figure 4B, we examine a squid giant axon internally perfused with a dilute Na-salt solution and immersed in a mixture of NaCl and CaCl2 solutions. Under these conditions, the superficial gel layer of the axon is sandwiched between a Ca2 + -rich solution and a Ca2 +-free solution (containing Na+). Therefore, when the external Ca2 +-concentration is high enough, the gel layer is expected to be in a compact, Ca2 +-rich, state. We now raise the concentration ratio [Na +]/[Ca2 +] in the external medium gradually. We then expect the layer to be thrown eventually into a swollen state. Continuous recording of the potential difference or of the electric impedance across the superficial gel layer of the axon is employed to uncover the expected change in the state of the gel layer. It is seen in the Figure that there is an abrupt rise in the potential level inside the axon during the course of a continuous rise in the ratio [Na +]/[Ca2+]. We now take this abrupt rise in the electric potential as a sign of a phase
transition of the layer. This potential jump is accompanied by a fall in the impedance of the layer, which undoubtedly is a reflection of the expected rise in the water content of the gel layer. [Note that the time required for transition from the compact state of a gel layer to the swollen state is expected to be inversely proportional to the square of the thickness of the layer involved.] There is good reason to believe that the abrupt potential jump observed in
Figure 4B represents the onset of an action potential. We recall that, in classical neurophysiology, a reduction in the external Ca2 + concentration was the most common method of stimulating nerve fibers. [9, , The plateau of a prolonged action potential can easily be made indefinitely long by lowering the external Ca2 + concentration and/or raising the external Na + concentration during its plateau phase. In a squid giant axon internally perfused with a dilute Na-salt solution
(see Fig. 3, right), a stimulating current pulse (which is outwardly directed through the axon surface) tends to drive Na+ into the superficial gel layer, whereby lowering the ratio [Ca2+]/[Na +]in the layer. When the stimulus is

313 PHASE TRANSITION IN NERVE
not strong enough or the current is inwardly directed through the layer, the disturbance produced in the layer by the stimulus gradually disappears after the end of the stimulus and the axon returns to its original "resting" state. In other words, the resting state of the axon is stable, indicating that the free energy of the system is at a minimum in this state. When the stimulus strength reaches the threshold, namely, when the value of [Ca2+]/[Na+] in the layer reaches the transition threshold, there is a transition of the layer to the other stable state, namely, to its "excited" state. At the transition threshold, the state of the axon is unstable. A relaxation process sets in immediately after this transition. It involves a
gradual rise of [Ca2 +] in the deeper portion of the layer resulting from the enhanced cation mobilities in the swollen state of the layer. It is known that the duration of a prolonged action potential is drastically curtailed when a very low concentration of Ca2 + is introduced into the axon interior. l42l Delivery of a brief inwardly-directed current pulse across the layer is known to bring about premature termination of the action potential. l43l There is little doubt, therefore, that the termination of a prolonged action potential is brought about by this rise of [Ca2 +] in the layer. The legitimacy of the statement above is supported further by the
experimental finding presented in Figure 5. Again, we deal with a squid giant axon internally perfused with a dilute Na-salt solution and immersed in a medium containing both NaCl and CaCl2. We now lower the temperature of the circulating external salt solution gradually. We see in this Figure that a familiar potential jump is induced simply by lowering the
50
a.. J 20 10 0
TEMPERATURE (°C)
FIGURE 5 Oscillograph record showing hysteresis in the internal potential of a squid giant axon associated with a cyclic change in the temperature. The axon under study was internally perfused with a 15mM NaF solution and immersed in a medium containing 100 mM NaCl, 100 mM CaCI2 and glycerol. A period of about 3 min was required to complete a cycle. (Ref. [44]).

314 I. TASAKI
temperature (without using electric current pulses). In accordance with LeChatelier-Braun's law, replacement of Ca2 + in the gel layer with Na +(which is exothermic) is favored by lowering the temperature. We note also that a hysteresis loop is generated by a cyclic change in the temperature. Finally, let us discuss the behavior of the normal (intact) nerve fiber. The
interior of the normal nerve fiber is a K +-rich gel. The external medium contains both Ca2 + and Na+. Hence, the excitation process in the normal fiber involves three cation species, Ca2 +, Na + and K + interacting with the polymer strands in the gel (which constitutes the axolemma-ectoplasm complex [5J) and with water. Under these conditions, a stimulating current pulse drives K + into the gel layer and evokes, if the stimulus is strong enough, a transition from the resting to the excited state of the nerve fiber. The relaxation process that takes place in a normal nerve fiber is utterly
different from that involving fluxes of only Ca2 + and Na+. A rise in the water content of the gel layer brings about a drastic increase in effi.ux of K +and, simultaneously, in influxes of Na+ and Ca2 + across the layer. The rapid potential fall observed in the action potential of an intact (i.e., internally unperfused) nerve fiber is considered to be associated with this intense cation interdiffusion. We have seen such a rapid potential fall in the case of a giant axon internally perfused with a solution containing K + (see Fig. 3, left). Eventually, the resulting rise in the Ca2+ concentration in the inner gel layer brings about a transition of the fiber from its excited state to the resting state. In vertebrate myelinated nerve fibers, the electric sign of this transition can be recognized as a more-or-less accelerated potential fall near the end of the action potential (see the middle record in Fig. 3). In the squid giant axon, however, this transition is obscured by the large potential undershoot associated with the intense Na +-K+ interdiffusion. When the nerve fiber returns to its resting state, a gradual recovery of the
cation distribution in the superficial gel layer is initiated. Our analysis of this recovery process in the myelinated fiber [341 have clearly demonstrated the legitimacy of the arguments developed above.
CONCLUDING REMARKS
We have emphasized in this article the important role played by Ca2 + and water molecules in the process of nerve excitation. In a normal nerve fiber, polymer strands in the gel layer constituting the axolemma-ectoplasm complex are in incessant thermal motion, interacting with water molecules, Ca2 +, Na + and K + that are also ceaselessly moving around. The water

315 PHASE TRANSITION IN NERVE
content in the superficial gel layer of the fiber is governed by the balance between two opposing forces, namely, between the attractive force exerted by Ca2 + upon the negatively charged sites of the strands (which tends to make the gel shrink) and the osmotic pressure exerted by the unbound cations in the gel (which tends to expand the gel). In the resting state of the nerve fiber, the attractive force is dominant and the gel loses its water (including a large portion of those in the hydration regions of the strands and Ca2 +). At the critical concentration ratio of [Na +]/[Ca2 +] in the medium, the balance is tipped in favor of the expanding force, resulting in a sudden increase in the number of the water molecules in the gel. The elastic force exerted by the strands places a limit upon the water content of the gel in the fiber in its excited state. There are two stable conformational states in the axolemma-ectoplasm
complex, compact and swollen. Each of these states is stable, indicating that it corresponds to a minimum of the free energy of the system. The free energy is considered to depend on [Na +], [K +], [Ca2 +] and temperature, as well as on the force applied to the surface of the complex. A sign of phase transition evoked by a change in the pressure applied to the surface has been observed in the cutaneous exocrine gland cells of the frog. [20] The picture of the excitation process mentioned above may be extended to
include the process of activating chemical synapses or photoreceptors by non-electrical stimuli. Let us suppose that the superficial gel layer of excitable tissues is maintained, by the metabolic activity of the living tissue, very close to its threshold for a transition from its compact (Ca2 +-rich) state to the swollen state. Under these circumstances, a discontinuous volume transition can be triggered by an infinitesimal disturbance of the gel, such as binding of acetylcholine, adrenaline and other molecules to the specific binding sites of the polymer strands in the layer. However, to investigate the process of such specific chemical binding, we have to deal directly with microscopic details of the excitable systems involved. Obviously, such investigation is outside the scope of our phenomenological, macroscopic theory of nerve excitation.
References
[1) Mitchell, H. H., Hamilton, T. S., Steggerck, F. R. and Bean, H. W. (1945). J. Bioi. Chem., 158, 625.
[2) Ling, G. N. (1965). Ann. N. Y. Acad. Sci., 125, 401. [3] Tasaki, I. and Byrne, P. M. (1992). Biopolymers, 32, 1019. [4] Tasaki, I. and Byrne, P. M. (1994). Biopolymers, 34, 209. [5) Metuzals, J., Terakawa, S. and Tasaki, I. (1980). Electron Microscopy, 2; Biology, 12.

316 I. TASAKI
[6] Loeb, J. (1906). The Dynamics ofLiving Matter (Columbia University Press, New York.), p.95.
[7] Clowes, G. H. A. (1916). J. Phys. Chern., 20, 407. [8] Heilbrunn, L. V. (1952). An Outline of General Physiology (Saunders Co., Philadelphia,),
p. 538. [9] Brink, F. (1954). Pharmacal. Rev., 6, 243. [10] Williams, R. J.P. (1970). Quart, Rev., 24, 331. [11] Goldenfeld, N. (1992). Lectures on Phase Transition and the Renormalization Group,
(Addison-Weisley, Reading, Massachusetts). p. 33 and p. 315. [12] Tasaki, I., lwasa, K. and Gibbons, R. C. (1980). Jpn. J. Physiol., 30, 897. [13] lwasa, K. and Tasaki, L (1980). Biochem. Biophys. Res. Commun., 95, 1328. [14] Tasaki, 1., Kusano, K. and Byrne, P. M. (1989). Biophys. J., 55, 1033. [15] Tasaki, I. and Byrne, P. M. (1983). Brain Res., 272, 360. [16] Tasaki, I., Nakaye, T. and Byrne, P. M. (1985). Brain Res., 131, 456. [17] Kusano, K. and Tasaki, I. (1990). J. Neurosci. Res., 25, 249. [18] Tasaki, I. and Nakaye, T. (1984). Science, 223, 411. [19] Tasaki, I. and Nakaye, T. (1986). Biomed. Res., 7, Suppl. 27. [20] Tasaki, I. (1998). Jpn. J. Physiol., 48(4). [21] Kawai, H. (1969). Jpn. J. Appl. Phys., 8, 975. [22] Tasaki, I. and lwasa, K. (1981). Biochem. Biophys. Res. Commun., 101, 172. [23] Tasaki, I., Byrne, P. M. and Masumura, M. (1987). Jpn. J. Physiol., 37, 609. [24] Howarth, J. V., Keynes, R. D. and Ritchie, J. M. (1968). J. Physiol., 194, 745. [25] Tasaki, I. and Byrne, P. M. (1992). Jpn. J. Physiol., 42, 805. [26] Tasaki, I. and Byrne, P. M. (1990). Jpn. J. Physiol., 40, 181. [27] Tasaki, I. and Byrne, P. M. (1987). Brain Res., 407, 386. [28] Tasaki, I. and Byrne, P.M. (1991). Jpn. J. Physiol., 41, 576. [29] Tasaki, I. and Byrne, P. M. (1993). Biochem. Biophys. Res. Commun., 197, 910. [30] Tasaki, I. and Byrne, P. M. (1994). Biochem. Biophys. Res. Commun., 200, 705. [31] Tasaki, I. (1995). Biochem. Biophys. Res. Commun., 215, 654. [32] Baker, P.M., Hodgkin, A. L. and Shaw, T. I. (1961). Nature (London), 190, 885. [33] Oikawa, T., Spyropoulos, C. S., Tasaki, I. and Teorell, T. (1961). Acta Physiol. Scand., 52,
195. [34] Tasaki, I. Physiology and Electrochemistry of Nerve Fibers (Academic Press, New York.
1982). pp. 181, 186, 218, 235, 238, 274. [35] Watanabe, A., Tasaki, I. and Lerman, L. (1967). Proc. Nat/. Acad. Sci. U.S.A., 58, 2246. [36] Meaves, H. and Vogel, W. (1973). J. Physiol., 235, 225. [37] Tanaka, T. (1981). Sci. Amer., 244, 110. [38] Sugitani, M., Kobayashi, T. and Tanaka, T. (1987). Polymer Preprints (in Japanese), 36,
2876. [39] Coleman, N. T. (1952). Soil. Sci., 74, 115. [40] Flett, D. S. and Mears, P. (1966). Trans. Faraday Soc., 62, 1469. [41] Sherry, H. A. (1968). J. Phys. Chern., 72, 4086. [42] Terakawa, S., Nagano, M. and Watanabe, A. (1978). Jpn. J. Physiol., 28, 785. [43] Tasaki, I. and Hagiwara, S. (1957). J. Gem. Physiol., 40, 859. [44] Inoue, I., Kobatake, Y. and Tasaki, I. (1973). Biochim. Biophys. Acta., 307, 471.