evidence from u.s. airlines e b - northwestern university
TRANSCRIPT
LIQUIDATION VALUES AND THE CREDIBILITYOF FINANCIAL CONTRACT RENEGOTIATION:
EVIDENCE FROM U.S. AIRLINES∗
EFRAIM BENMELECH AND NITTAI K. BERGMAN
How do liquidation values affect financial contract renegotiation? While the“incomplete-contracting” theory of financial contracting predicts that liquidationvalues determine the allocation of bargaining power between creditors and debtors,there is little empirical evidence on financial contract renegotiations and the roleasset values play in such bargaining. This paper attempts to fill this gap. Wedevelop an incomplete-contracting model of financial contract renegotiation andestimate it using data on the airline industry in the United States. We find thatairlines successfully renegotiate their lease obligations downward when their fi-nancial position is sufficiently poor and when the liquidation value of their fleet islow. Our results show that strategic renegotiation is common in the airline indus-try. Moreover, the results emphasize the importance of the incomplete contractingperspective to real-world financial contract renegotiation.
I. INTRODUCTION
The control rights that financial contracts provide over firms’underlying assets play a fundamental role in the incomplete-contracting literature. In particular, debt contracts providecreditors the right to possess assets when firms default onpromised payments (see, e.g., Aghion and Bolton [1992]; Shleiferand Vishny [1992]; Hart and Moore [1994, 1998]; and Bolton andScharfstein [1996]). This threat of asset liquidation motivatesdebtors to avoid default. Thus, in the incomplete-contractingliterature, asset liquidation values play a key role in the ex postdetermination of debt payments. When liquidation values arelow, debtors’ bargaining position improves vis-a-vis creditors, andall else equal, debt payments should decrease.
∗We thank Douglas Baird, Lucian Bebchuk, Andrea Eisfeldt, Mark Garmaise,Robert Gertner, Simon Gervais, Oliver Hart, Gustavo Manso, Stewart Myers,Antoinette Schoar, Andrei Shleifer, Jeremy Stein, George Triantis, Bilge Yilmaz,and seminar participants at the 2007 American Law and Economics Associationmeeting, 2008 AFA meeting in New Orleans, Columbia University, Dartmouth,Harvard Law School, Harvard Economics Department, Harvard-MIT organiza-tional economics seminar, Interdisciplinary Center of Herzliya, MIT Sloan, NBERCorporate Finance meeting, NYU-Stern, Stanford GSB, Texas Finance Festival,the Federal Reserve Bank of Philadelphia, and the University of Virginia, EdwardGlaeser (the editor), and two anonymous referees for constructive and helpfulcomments. We also thank Robert Grundy and Phil Shewring from AirclaimsInc. Alex Bayers provided excellent research assistance. All errors are our own.effi [email protected], [email protected].
C© 2008 by the President and Fellows of Harvard College and the Massachusetts Institute ofTechnology.The Quarterly Journal of Economics, November 2008
1635

1636 QUARTERLY JOURNAL OF ECONOMICS
But how do liquidation values affect financial contract rene-gotiation in practice? Although previous research has analyzedsome of the implications of the incomplete contracts approach forfinancial contracting,1 there is little empirical evidence analyzingthe ability of firms to renegotiate their financial liabilities and therole asset values play in such renegotiations. This paper attemptsto fill this gap by documenting empirically the conditions underwhich airlines renegotiate aircraft leases in the United States.Our goal is to understand the factors that enable airlines to ex-tract concessions in renegotiation, and to estimate the magni-tude of the concessions that airlines obtain. We find that publiclytraded airlines often renegotiate their lease contracts. Further-more, we show that aircraft lease renegotiations take place whenliquidation values are low and airlines’ financial condition ispoor.
Aircraft leases are a natural environment for testingrenegotiation-based models. While the incomplete-contracts liter-ature focuses on debt contracts and assumes that creditors havethe right to seize an asset if the debtor defaults, the automatic stayprovision of the U.S. bankruptcy code protects debtors from fore-closures and repossessions. In contrast to creditors, in bankruptcylessors are not subject to the automatic stay provision. Thus,matching the stylized assumption in the literature, lessors havethe ability to relatively swiftly take possession of their assets if afirm defaults on its lease payments.2
We begin our analysis by developing a simple theoreticalmodel of contract renegotiation based on Hart and Moore (1994).To determine the credibility of firms’ threat to renegotiate pre-existing financial contracts, we model explicitly the renegotiationprocess between the firm and its liability holders as in Bergmanand Callen (1991). Our model has two testable implications. First,firms will be able to credibly renegotiate their financial commit-ments only when their financial situation is sufficiently poor. Sec-ond, when a firm’s financial position is sufficiently poor, and henceits renegotiation threat is credible, a reduction in the liquidationvalue of assets increases the concessions that the firm obtainsin renegotiation. Therefore, the positive relation between liqui-dation values and post-renegotiation firm payments to creditors
1. See, for example, Stromberg (2000), Kaplan and Stromberg (2003),Benmelech, Garmaise, and Moskowitz (2005), Bergman and Nicolaievsky (2007),and Benmelech (2008).
2. See, for example, Pulvino (1998, 1999) and Eisfeldt and Rampini (2008).

LIQUIDATION VALUES AND CONTRACT RENEGOTIATION 1637
predicted in Hart and Moore (1994, 1998) should be concentratedduring times when firms are doing poorly.
As motivational evidence for our empirical analysis, we beginby providing a short case study that describes American Airlines’renegotiation of lease contracts subsequent to its acquisition ofTrans World Airlines (TWA) in January 2001. We show that Amer-ican substantially reduced lease payments on aircraft previouslyowned by TWA, and estimate the present value of the cost re-ductions due to lease renegotiation at 36%. Anecdotal evidencesuggests that American could successfully renegotiate the leasepayments because of TWA’s dire financial position and because ofAmerican’s credible threat to reject TWA’s leases and return theaircraft to lessors.
Our empirical analysis examines renegotiation of leasesamong U.S. airlines. We collect data on all publicly traded, pas-senger carriers and construct a data set that includes informationabout contracted lease payments, actual lease payments, and fleetcomposition by aircraft type. In addition, we construct four differ-ent measures of the ease of overall redeployability of an airline’sleased aircraft. Fleet redeployability serves as a proxy for thevalue of the outside option that lessors have when a lessee fails tomake a promised payment, and hence as a proxy for liquidationvalues.
We then examine how an airline’s financial condition com-bined with the redeployability of its fleet affects lease renegotia-tion. As the model predicts, lease payments are reduced duringperiods of poor financial performance. Our regression analysissuggests that during years in which cash flow from operations andcash balances fall short of interest expense, the average ratio ofan airline’s actual lease payment to its previous year’s contractedlease payment is reduced by approximately 10 percentage pointsafter controlling for changes in fleet size and its composition.
The results further show that, as predicted by our model,the ability to reduce payments during periods of poor financialperformance—when renegotiation credibility is high—is particu-larly large when liquidation values are low. This effect is siz-able. For example, during periods of poor financial performance,a one-standard-deviation decrease in the number-of-operators re-deployability measure decreases an airline’s lease payment by20% compared to its contracted lease payments. Our evidence isthus supportive of the ability of firms to strategically renegotiatetheir obligations when firm performance is poor, insofar as firm
1638 QUARTERLY JOURNAL OF ECONOMICS
payments are reduced when lessors’ outside options deteriorate.In contrast, when an airline is not in financial distress and henceits renegotiation credibility is relatively low, we find that fleet re-deployability is either unrelated or slightly negatively related tolease payments, depending on the specification.3
We proceed by studying airline bankruptcies. Consistent withour previous results, during bankruptcy, airlines are able to re-duce lease payments substantially. Furthermore, the ability ofbankrupt airlines to reduce their lease payments is greater whentheir fleets are less redeployable. For example, during periodsof bankruptcy, a one-standard-deviation decrease in the number-of-operators redeployability measure decreases an airline’s leasepayment by 22% compared to its contracted lease payment.
We supplement our analysis by studying lease renegotiationout of bankruptcy. We find that, even out of bankruptcy, airlines inpoor financial condition can reduce their lease payments and thatlower fleet redeployability enables these airlines to extract greaterconcessions from their lessors. Finally, we use the attacks of 9/11as an exogenous shock to airlines’ cash flows and fleet liquidationvalues and find that contractual lease obligations were reducedby approximately 13 percentage points.
The rest of the paper is organized as follows. Section II ana-lyzes a simple financial contract-renegotiation model. A case studythat analyzes the acquisition of TWA by American Airlines in 2001is presented in Section III. Section IV provides a description of ourdata sources and summary statistics. Section V describes the em-pirical analysis, and Section VI concludes.
II. THE MODEL
In this section, we develop a simple model of financial contractrenegotiation based on Hart and Moore (1994). Our main goals areto analyze the conditions under which a firm can credibly committo renegotiate its liabilities with outside claimholders, and to an-alyze the payoffs to parties conditional on renegotiation occuring.We generate two intuitive predictions which are then tested in thedata. To assess the credibility of renegotiation, we follow Bergmanand Callen (1991) in explicitly modeling the renegotiation process
3. Acharya, Bharath, and Srinivasan (2007) show that creditor recovery ratesdiminish during times of industry distress and particularly so among industrieswith high asset-specificity as measured by the book value of industry machineryand equipment divided by the book value of assets.

LIQUIDATION VALUES AND CONTRACT RENEGOTIATION 1639
FIGURE IProject Timeline and Assumptions
between the firm and its liability holders.4 The project timelineand assumptions are shown in Figure I.
II.A. Setup
Consider a firm (the “Lessee”) that has entered a contract tolease an asset for two periods from a Lessor. The contract stipu-lates that the Lessee will pay the Lessor l1 at the end of period 1,and l2 at the end of period 2. The Lessee will be using the assetto generate cash flow C1 in period 1, and C2 in period 2. Thesecash flows are not expropriable by the firm—an assumption thatapproximates the situation faced by large publicly traded firms inthe United States. At the end of period 1, the market value of theasset if liquidated is L, while at the end of period 2, this value is 0.We assume that L < C2, so that liquidation at t = 1 is inefficient.
The evolution of the game is as follows. At date 1.5 afterhaving obtained C1, the Lessee decides whether to abide by thecontract and pay the contracted payments, or instead to triggerrenegotiation with the Lessor.5 To understand the credibility ofthe threat to renegotiate, we explicitly model the renegotiation
4. Our model is also related to Baird and Picker (1991) and Bebchuckand Chang (1992), who study bargaining between claimholders in bankruptcy.Similarly, Eraslan (2008) develops and structurally estimates a multilateralChapter 11 bargaining game.
5. We assume that the Lessee cannot pay out a dividend until all lease obli-gations are fulfilled. Our main results are robust to this assumption.

1640 QUARTERLY JOURNAL OF ECONOMICS
process as a bargaining game in which the two parties engage ina series of alternating offers as in Rubinstein (1982). If duringthe bargaining process either party accepts an offer from its coun-terpart, bargaining ends and a new contract is signed with theagreed-upon repayment schedule. Bargaining, however, is costlyin that the value of the second-period cash flow declines by an in-finitesimal amount between each successive round of offers. Thiscost can be thought of as arising from a lack of optimal manage-ment, whether intentional or not, during the bargaining period.
If renegotiation is unsuccessful, in that the second-periodcash flow has dwindled to 0 while neither party has agreed to anoffer from its counterpart, a solution is imposed by a court. Accord-ing to this, (i) the Lessor repossesses the asset and can thereforesell it for L, and (ii) the court orders the Lessee to pay the Lessordamages D = min{C1, l1 + l2 − L}.6 This amount of damages guar-antees that the Lessor obtains as payoff either the full promisedpayments, or the Lessee’s entire date 1 cash balance as well asthe value L of the assets.
Note that although cash flows cannot be expropriated, un-der certain conditions the Lessee will still be able to successfullyrenegotiate lease contracts and pay less than the original stipu-lated obligation. This stems from the Lessee’s ability to crediblythreaten the Lessor to forego future cash flows by accepting theirloss during renegotiation, to the detriment of both parties.
II.B. Contract Renegotiation, Liquidation Values,and Cash Flows
In this section we solve for the subgame perfect equilibrium(SPE) of the game to analyze the conditions for contract renegoti-ation and the payoffs obtained therein. Because the game is oneof complete information, the SPE of the subgame beginning afterthe Lessee decides to trigger renegotiation involves both partiesimmediately agreeing on a new repayment schedule. We show ina lemma in Appendix I that this involves a payoff of 1/2(C2 − L)to the Lessee and C1 + 1/2(C2 + L) to the Lessor. The followingproposition, which is proved in Appendix I by simply comparingthe Lessee’s renegotiation payoffs to those from abiding by thecontract, identifies when the Lessee will choose to trigger renego-tiation.
6. In the event that the liquidation value, L, is greater than l1 + l2, damagesare assumed to be 0.

LIQUIDATION VALUES AND CONTRACT RENEGOTIATION 1641
PROPOSITION 1. The subgame perfect equilibrium of the game ischaracterized by the following two cases:(a) If C1 + C2 < l1 + l2, the Lessee always renegotiates the
contract.(b) If C1 + C2 ≥ l1 + l2 the Lessee renegotiates the contract
when
C1 + 12
(C2 + L) < l1 + l2,(1)
and otherwise abides by the original contract, raising capitalat t = 1 if necessary. In all cases, if renegotiation occurs, pay-offs to the parties are as in the lemma in Appendix I. If renego-tiation does not occur, the Lessee obtains (C1 + C2) − (l1 + l2)and the Lessor obtains (l1 + l2).
The intuition behind inequality (1) in Proposition 1 is thatthe Lessee can credibly renegotiate the initial contract when C1,C2, and L are sufficiently small compared to the contractuallyspecified payment l1 + l2. First, all else equal, when L or C1 aresmall, the Lessee’s effective bargaining position is high becausethe Lessor’s outside option—to sell the repossessed asset for Land seize the period 1 cash flow C1—is not very attractive. TheLessee can thus credibly commit to trigger renegotiation, know-ing that the Lessor will accept a more favorable payment sched-ule. Similarly, the Lessee can credibly commit to renegotiate thelease contract only if C2 is sufficiently low. This is because theLessee’s ability to obtain concessions in renegotiation stems fromhis willingness to accept the reduction of the firm’s future earn-ings prospects during renegotiation, and in so doing, harm thefirm’s ability to repay the Lessor. However, if C2 is too high, theLessee’s threat to accept future cash flow reduction is not credible,because in order to harm the firm’s ability to repay the Lessor, alarge fraction of the firm’s future earnings prospects would needto be lost. The Lessee would thus prefer instead to simply pay theprespecified lease payments.7
Figure II displays the Lessee’s renegotiation choice in (C1, C2)space. In area A, the firm is in financial distress (C1 + C2 < l1 + l2),and hence, as stated in Proposition 1, can easily credibly renegoti-ate lease payments to obtain a positive payoff. In area B the firm
7. Less formally, when C2 is high, the Lessee’s threat to accept asset repos-session and liquidation by the Lessor is not credible because the asset is needed togenerate the high C2 payoff in period 2. For a related intuition see Gromb (1995).
1642 QUARTERLY JOURNAL OF ECONOMICS
A
B
C
C1
C2
C1+ C2 = l1 + l2
C11 2+ C2 + L) = l1 + l2
l1 + l2
2(l1 + l2 ) - L
FIGURE IILessee’s Renegotiation Choice in (C1, C2) Space
is not in financial distress and condition (1) holds. Thus, becauseC1, C2, and L are small enough compared to the initially specifiedcontract payment, l1 + l2, the Lessee can credibly renegotiate anew, reduced payment schedule. Intuitively, although the firm isnot in financial distress, its financial position is poor enough toallow the Lessee to credibly renegotiate lease payments. Finally,in area C, prespecified lease payments are relatively small com-pared to both the liquidation value, L, and current and future firmcash flows. Thus, in this area the Lessee cannot credibly triggerrenegotiation and, instead, abides by the original signed contract.
The model generates two sets of predictions:
PREDICTION 1. All else equal, the credibility of contract renegotia-tion, and hence its likelihood, will decrease with the Lessee’scurrent and future cash flow.
PREDICTION 2. Firms’ ability to renegotiate down their lease pay-ments when liquidation values are low will be concentratedduring periods of relatively poor financial performance.
Both predictions are a direct result of Proposition 1. First,when C1 and C2 are relatively high, condition (1) will not holdand so the firm will not be able to credibly threaten to renegotiateits contracted lease payments. Thus, as Prediction 1 states, firmswill be able to renegotiate financial contracts only when their fi-nancial condition is sufficiently poor. Prediction 2 states that firms

LIQUIDATION VALUES AND CONTRACT RENEGOTIATION 1643
will be able to renegotiate and lower their lease payments whenthe liquidation value of their assets, L, decreases but that this ef-fect will be concentrated in times when firms’ financial position isrelatively poor. This is because only then can firms credibly rene-gotiate their payments, enabling changes in liquidation values toaffect changes in the parties’ payoffs.
III. THE ACQUISITION OF TWA BY AMERICAN AIRLINES:A CASE STUDY
In this section, we briefly describe the acquisition of TWA byAmerican Airlines (AA) in January 2001, and the lease renego-tiation process that subsequently ensued. We argue that AA hadthe ability to credibly threaten to reject many of TWA’s leases,and that the outcome of the lease renegotiation in this case isconsistent with the model presented in Section II.
III.A. TWA’s Financial Difficulties and AA’s Purchase Plan
On January 10, 2001, TWA filed a Chapter 11 bankruptcypetition as part of a deal with AA. Under the deal, AA acquired al-most all of TWA’s assets by paying $625 million in cash and assum-ing obligations of TWA that exceeded $5 billion. The acquisitionmarked the end of more than a decade of financial difficulties forTWA, which included two previous Chapter 11 reorganizations.
AA purchased substantially all of TWA assets subject to sec-tion 363 of the Bankruptcy Code, which authorizes the sale ofproperty of a debtor’s estate under certain conditions. Baird andRasmussen (2003) find that asset sales subject to section 363 ofthe Bankruptcy Code account for 56% of the large businesses thatcompleted their Chapter 11 proceedings in 2002.
AA acquired a total of 173 aircraft from TWA, in addition to anew hub in St. Louis, key gates, maintenance facilities, and a 26%stake in the Worldspan computer-reservations system. One of theprimary benefits of the TWA acquisition was the complementaritybetween the fleets of the two airlines.8
III.B. American Airlines’ Threat to Reject TWA Leases
Although AA assumed most of TWA’s obligations, it was notobligated by law to assume all lease contracts. According to section
8. There was a large overlap in aircraft type between AA and TWA. Out of itsfleet of 191 aircraft, TWA operated 103 MD-80s, 27 Boeing 757s, and 16 Boeing767s, whereas AA had a fleet of 726 aircraft, including 276 MD-80s, 102 Boeing757s, and 79 Boeing 767s.

1644 QUARTERLY JOURNAL OF ECONOMICS
365 of the bankruptcy code, AA had the ability to reject TWA’saircraft leases, resulting in the leased aircraft being returned tothe lessors and leaving the lessors with an action for damages.Furthermore, upon rejection, lessor’s claim for damages wouldbe against TWA cash flow. Consistent with Prediction 1 of themodel, because TWA had not generated positive earnings for morethan a decade, and by January 3, “TWA was down to its last $20million in cash” (Carey 2001), AA’s ability to threaten to reject theaircraft leases was deemed to be quite credible. Indeed, accordingto Buhler (2003, p. 7),
The aircraft market conditions, and the disparity between American’s creditand TWA’s allowed American to approach the aircraft lessors and lenderswith the choice of accepting American’s purchase offers/deeply discountedlease rates, or taking the aircraft back in their then-current condition. . . . Tomy knowledge, all of the lenders and lessors agreed, resulting in new leaserates, in some cases 50 percent or more under TWA’s.
Moreover, because TWA’s fleet was quite large, rejecting TWA’sleases could have flooded the aircraft market, thus forcing lessorsto sell their repossessed aircraft at “fire sale” prices. Table I dis-plays the top-ten operators of each of the main aircraft types inTWA’s fleet as of 1/10/2001: MD-80, DC-9, Boeing 757, and Boeing767. While all of these models are popular aircraft, AA was the topuser of MD-80s in the world (276 aircraft representing 23.45% ofthe total number of MD-80s in the world), and the second largestuser worldwide of both Boeing 757s (102 aircraft representing10.81% of the total number of Boeing 757s), and Boeing 767s (70aircraft representing 9.83% of the total number of Boeing 767s).Thus, AA was able to amplify the threat of fire sales by refus-ing to purchase the repossessed MD-80s, Boeing 757s, and Boeing767s from TWA’s lessors. The combination of limited demand fora large number of aircraft and TWA’s low cash flows increased thebargaining position of AA vis-a-vis TWA’s lessors during the leaserenegotiation process.
III.C. Estimates of the Value of Lease Renegotiation
Eventually most of the DC-9s were rejected and the leasesof the MD-80s, Boeing 757s, and Boeing 767s, were renegotiated.According to Buhler (2003, p. 7),
When the American acquisition of the TWA assets closed in April 2001, Amer-ican assumed most of TWA’s leases and purchased a number of its aircraft.In TWA’s case, the large number of aircraft created justifiable fears of a mas-sive glut on the market if American’s offers were refused. . . . The [TWA case]

LIQUIDATION VALUES AND CONTRACT RENEGOTIATION 1645
TABLE IMARKET FOR TWA’S AIRCRAFT AS OF 1/10/2001
Top-ten operators of MD-80s Top-ten operators of DC-9s
Number % of total Number % of totalRank Airline of aircraft aircraft Rank Airline of aircraft aircraft
1 American Airlines 276 23.45 1 Northwest Airlines 137 19.682 Delta Airlines 120 10.20 2 ABX Air 66 9.483 TWA Airlines 103 8.75 3 US Airways 46 6.614 Alitalia 89 7.56 4 AirTran Airways 35 5.035 SAS 68 5.78 5 TWA Airlines 30 4.316 Continental Airlines 66 5.61 6 US Navy 29 4.177 Aeromexico 41 3.48 7 Iberia 25 3.598 Iberia 37 3.14 8 Midwest Airlines 24 3.459 Spainair 35 2.97 9 US Air Force 23 3.30
10 Alaska Airlines 34 2.89 10 SAS 23 3.30
Top-ten market share 869 73.83 Top-ten market share 438 62.93Total aircraft 1,177 100.00 Total aircraft 696 100.00
Top-ten operators of B757s Top-ten operators of B767s
Number % of total Number % of totalRank Airline of aircraft aircraft Rank Airline of aircraft aircraft
1 Delta Airlines 118 12.50 1 Delta Airlines 113 14.052 American Airlines 102 10.81 2 American Airlines 70 9.833 United Airlines 98 10.38 3 United Airlines 54 6.724 UPS Airlines 75 7.94 4 ANA 53 6.595 British Airways 52 5.51 5 Qantas 36 4.486 Northwest Airlines 48 5.08 6 Air Canada 32 3.987 Continental Airlines 41 3.34 7 UPS Airlines 30 3.738 US Airways 34 3.60 8 Japan Airlines 22 2.749 TWA Airlines 27 2.86 9 British Airways 21 2.61
10 Iberia 23 2.44 10 Canadian Airlines Int. 20 2.49
Top-ten market share 618 65.47 Top-ten market share 460 52.71Total aircraft 944 100.00 Total aircraft 804 100.00
Notes. This table lists the ten largest operators for the main aircraft types operated by TWA as of1/10/2001: MD-80, DC-9, B757, and B767. The table reports the number of aircraft per type, and the ratiobetween the number of aircraft per type that an airline operates and the total number of aircraft per type.
demonstrates one simple rule: the bargaining positions of the parties and thevalue of the subject matter dictate the result.
We continue by estimating the value of the renegotiation to AA.We obtain data on current and expected lease payments from the10-Ks of AA and TWA. Because airlines are required to reporttheir future lease obligations as specified by preexisting leasecontracts, we can compare the expected lease expenses before theacquisition of TWA to the actual cost of the leases after the acqui-sition was completed. We begin by estimating the expected leaseobligations of TWA as of 12/31/2000.
Using TWA’s debt yields for different maturities as reported inTWA’s 10-K to discount TWA’s future lease commitments (between

1646 QUARTERLY JOURNAL OF ECONOMICS
9.7% and 14.7%), we calculate the present value of TWA’s futurelease commitments to be $3,433 million (see Panel A of Table II).Because AA assumed leases on 78% of TWA’s seat capacity, absentrenegotiation, we would expect the present value of AA’s leaseexpenses to increase by 0.78 × 3, 433 = $2, 677.6 million. This wasnot the case.
Panel B of Table II calculates the present value of the expectedlease payments of AA from 2001 and onward as of 12/31/2000, us-ing a discount rate of 6.6% (corresponding to the average yield onAA’s bonds during the year 2000). To estimate the increase in AA’spresent value of lease obligations during 2001, Panel C calculatesthe present value of AA’s actual 2001 lease payment combinedwith the expected lease obligations from 2002 and onward as of12/31/2000.9 In calculating this value, we adjust the difference be-tween AA’s expected lease payments as of 12/31/2000 and the sumof the actual payments during 2001 and the expected lease pay-ments as of 12/31/2001 for the number of AA’s aircraft that weredismissed during 2001.10 As can be seen from Panel C, while AAassumed TWA’s leases with an estimated present value of $2,677.6million, the present value of AA’s lease expense increased by only$1,705.5 million. The difference, $972.1 million, representing acost reduction of 36.3%, is the estimate of the amount saved byAA due to successful lease renegotiation.11
Our estimate is consistent with Buhler’s (2003) anecdotal ev-idence and suggests that, as our model predicts, AA was ableto accept a favorable payment schedule given its credible threatto reject the leases due to TWA’s low cash flow and the threatto flood the market with aircraft. The next sections provide a for-mal empirical analysis of these effects in the U.S. airline industry.
IV. DATA AND SUMMARY STATISTICS
This section describes the data sources used in our empiricalanalysis and outlines summary statistics for both airline charac-teristics and measures of fleet redeployability.
9. We use a discount rate of 7.7% that corresponds to the average yield of AA’sEnhanced Equipment Trust Certificates (EETCs) in 2001 prior to the 9/11 attacks.This rate reflects the increase in the risk of AA during 2001 that was not subjectto the 9/11 industry shock.
10. AA dismissed about 3% of its seat capacity during 2001.11. Note that the difference between the lease expenses of AA and TWA are
not driven by the superior credit quality of AA because risk-adjusted discountrates are used in the present value calculations.

LIQUIDATION VALUES AND CONTRACT RENEGOTIATION 1647
TABLE IIESTIMATES OF THE SAVINGS FROM LEASE NEGOTIATIONS IN AMERICAN AIRLINES’
ACQUISITION OF TWA
A. TWA’s actual and expected lease payments for 2001 and onward discountedas of 12/31/2000
20052001 2002 2003 2004 and after
Operating leases $553 $538 $528 $518 $3,263Present value of operating leases (at various rates b/w 9.7% and 14.7%) = $3,293Present value of capital leases = (at various rates b/w 9.7% and 14.7%) = $139.5Present value of total future lease payments (operating + capital) = $3,433
Fleet share taken by American (value weighted) = 0.78Lease’s value taken by American = 0.78*$3,433 = $2,677.6
B. American Airlines’ expected lease payments for 2001 and onwardas of 12/31/2000
20062001 2002 2003 2004 2005 and after
Operating leases $950 $898 $910 $893 $880 $11,268Present value of operating leases (at 6.6%) = $11,442Present value of capital leases (at 6.6%) = $1,364Present value of total future lease payments (operating + capital) = $12,806
C. American Airlines’ actual and expected lease payments for 2001 and onwardas of 12/31/2000
20072001 2002 2003 2004 2005 2006 and after
Operating leases $1,188 $1,314 $1,256 $1,180 $1,119 $1,054 $11,622Present value of operating leases (at 7.7%) = $12,481Present value of capital leases = (at 7.7%) = $1,647Present value of total future lease payments (operating + capital) = $14,128
During the year 2001, American Airlines dismissed 3% of its leased aircraft(value weighted)
Difference between expected lease payments = $14,127.8 − 0.97*$12,806.5= $1,705.5
Amount American saved on TWA leases (adjusted for risk) = $2,677.6 − $1,705.5= $972.1
Notes. This table summarizes the savings from lease renegotiation in the acquisition of TWA by AmericanAirlines. Panel A presents TWA’s actual and expected lease payments for 2001 and onward as of 12/31/2000.Panel B displays American Airlines’ expected lease payments for 2001 and onward as of 12/31/2000. Panel Cpresents American Airlines’ actual and expected lease payments for 2001 and onward as of 12/31/2000, andprovides an estimate of the risk-adjusted savings from lease renegotiation on American Airlines’s acquisitionof TWA. Present values of capital leases are taken from airlines’ financial reports.

1648 QUARTERLY JOURNAL OF ECONOMICS
IV.A. Airline Characteristics
To construct our sample, we collect data from a number ofsources. We start with all publicly traded firms with a four-digitSIC code equal to 4512 (Scheduled Air Transportation) during theperiod 1995–2005. We then search for all annual reports of each ofthese firms as recorded in the online SEC-Edgar database. Fromeach annual report, we collect the following information.
First, we construct an account of the composition of eachairline’s leased fleet. We record the number of aircraft that areleased by each airline by aircraft type. Second, from the incomestatement, we record the amount paid by each airline in the formof aircraft lease expenses.12 Third, from each annual report, wecollect information on future contracted lease payments owed byairlines. According to FAS regulation 13, a firm must report itspreexisting lease commitments for each of the five years follow-ing the filing of an annual report, as well as the sum of futurescheduled lease commitments from year six and on. We collect foreach airline-year the schedule of future contracted lease paymentsowed by each airline. Finally, we use Thomson’s SDC Platinum Re-structuring database to identify airlines that are in Chapter 7 orChapter 11 bankruptcy procedures. Our final sample consists of212 airline-year observations, representing 25 airlines during theperiod 1995 to 2005.
Table III displays descriptive statistics for a selected set ofvariables. As the table demonstrates, annual lease payments aresizable, with the mean annual lease payment equaling $250.4million and the maximum annual lease payment exceeding $1billion. Annual lease payments represent, on average, 14.9% ofan airline’s assets with a standard deviation of 18.5%. The meannumber of aircraft leased by airlines in our sample is 139, of which,on average, 7% were wide-bodied aircraft.13 The maximum num-ber of leased aircraft in our sample is 483 (Continental Airlines in2005). The mean number of total seats in an airline’s leased fleetis 20,472.1, while the average of airline profitability (operatingincome before depreciation divided by the book value of assets) is9.13%.
12. In a few cases, firms do not report aircraft lease payments separately fromother lease payments—such as those for ground facilities—and instead report thevalue of aggregate lease payments. Because we are interested in aircraft leasepayments, the relevant data for these firms are coded as missing.
13. A wide-bodied aircraft is an aircraft with passenger seats divided by twolengthwise aisles such as a Boeing 747 or an Airbus 300.

LIQUIDATION VALUES AND CONTRACT RENEGOTIATION 1649
TABLE IIIAIRLINE CHARACTERISTICS
25th 75th StandardMean percentile Median percentile deviation Min Max
Lease expenses ($m) 250.4 40.3 136.3 437.7 263.2 0.312 1,009.0Lease expenses/assets 0.149 0.040 0.088 0.156 0.185 0.008 1.260Actual/expected−1 1.051 0.851 1.057 1.194 0.293 0.458 2.809
lease paymentsln(lease expenses/ 0.091 −0.022 0.058 0.184 0.254 −0.907 1.309
lease expenses−1)Leased fleet (aircraft) 139 31 95 253 128 2 483Leased fleet (seats) 20,472.1 2,851.2 7,676.6 37,712.7 22,654.5 60 80,042.9Wide-body 0.070 0.00 0.000 0.078 0.166 0.000 1.000Profitability (%) 9.13 3.17 10.41 16.97 17.55 −100.10 52.42Cash flow if −13.10 −8.63 −1.53 0.96 31.41 −109.90 18.12
LowCash = 1 (%)
Notes. This table provides descriptive statistics of airline characteristics. Lease expenses are total aircraftlease expenses (in $million), Lease expenses/assets are total aircraft lease expenses divided by the book valueof the assets, Actual/Expected−1 lease payments is the ratio of an airline’s actual lease expenses to its previousyear’s minimum expected lease payments, ln(Lease Expenses/Lease Expenses−1) is the yearly change in leasepayments, Leased fleet (aircraft) is the number of aircraft leased by the airline. Leased fleet (seats) is the totalnumber of seats in the leased fleet. Wide-body is the fraction of wide-bodied aircraft leased by the airline.Profitability is operating income before depreciation divided by the book value of assets. Cash flow is incomebefore extraordinary items + depreciation and amortization divided by assets, LowCash is a dummy variablethat equals 1 for airlines in which cash flow from operations (income before extraordinary items + depreciationand amortization) plus cash balances are less than their interest expense, and 0 otherwise.
To measure the degree of lease contract concessions obtainedby airlines, we construct three variables related to lease payments.Our first, and main, measure is the ratio of actual lease pay-ments paid during year t to the minimum expected year t leasepayment as contracted in year t − 1 (Actual/Expected−1). As de-scribed above, the denominator of this ratio is taken from theairlines’ 10-K statements. Table III shows that the mean ratioof actual to minimum expected lease payment in the full sampleis 1.05. On average, lease payments are greater than the previ-ous year’s minimum expected lease payment, indicating increasedpayments due to fleet growth. Our second measure is simply therate of change of lease payments from year t − 1 to year t. Table IIIshows that this average rate is 9.1%. The final measure we useto measure possible renegotiation of lease payments is simply theannual lease payments divided by the book value of assets.
As a measure of financial difficulties we define a variableLowCash that equals 1 for airlines in which cash flow from op-erations (income before extraordinary items + depreciation andamortization) plus cash balances are less than their interest ex-pense, and 0 otherwise.14 There are 25 airline-year observations
14. Asquith, Gertner, and Scharfstein (1994) use a similar methodology toidentify firms in financial distress.

1650 QUARTERLY JOURNAL OF ECONOMICS
with LowCash = 1, representing 11.8% of our sample. Our resultsare qualitatively unchanged when proxying for financial difficul-ties using a dummy variable that equals 1 when cash flow fromoperations is negative.
IV.B. Redeployability Measures
Because of economies of scale in fleet operation, airlinestend to limit the number of aircraft types that they operate inorder to reduce costs associated with pilot training, maintenance,and spare parts. We take advantage of this fact in developingour measures of redeployability by assuming that the potentialsecondary market buyers of any given type of aircraft are likely tobe airlines already operating the same type of aircraft. Accordingto Pulvino (1998), the market for used commercial aircraft is“extremely thin,” with approximately twenty used commercialaircraft transactions per month worldwide. Likewise, Gavazza(2006) finds that between May 2002 and April 2003, 720 commer-cial aircraft were traded, representing 5.8% of the total stock ofcommercial aircraft. The thinness of the market for used aircraftreinforces the importance of the size of the set of potential buyersin determining aircraft redeployability.
Our approach to measuring redeployability is motivated bythe industry equilibrium model of Shleifer and Vishny (1992),and is similar to the empirical approach developed in Benmelech(2008) for 19th century American railroads, and to Gavazza (2006)for U.S. aircraft. Benmelech (2008) exploits the diversity of trackgauges in nineteenth century American railroads to identify po-tential buyers for railroad tracks and rolling stock. Gavazza (2006)uses the number of aircraft per type and the number of operatorsper type to proxy for asset liquidity.
We use the Ascend CASE database, which contains ownershipand operating information about all commercial aircraft world-wide, to construct our measures of airline fleet redeployability. Webegin by constructing three redeployability measures at the yearlylevel for each aircraft type, where aircraft type is defined using thebroad-type category in the Ascend CASE database. To do so, wecompute for every sample-year (1) the number of aircraft per type,(2) the number of operators per type, and (3) the number of opera-tors who operate at least five aircraft per type. In calculating thesethree redeployability measures, we disregard airlines that are inbankruptcy (as defined in the SDC bankruptcy database), becausetheir financial position most likely precludes them from serving as
LIQUIDATION VALUES AND CONTRACT RENEGOTIATION 1651
potential aircraft buyers. This process yields three redeployabilitymeasures for each aircraft type and each sample year.
To construct the redeployability measures for an entire fleetof an airline, we aggregate the aircraft-type redeployability mea-sures across all leased aircraft in each airline’s fleet. Specifically,we define the redeployability of an airline’s leased fleet to be theweighted average of the redeployability index corresponding toeach of the leased aircraft in the airline’s fleet. We calculate inthis manner three measures of fleet redeployability correspond-ing to each of the three measures of aircraft-type redeployability.The three measures are given by
Redeployabilityaircrafti,t =
A∑a
ωi,t,a(Redeployabilityaircraft
a,t
)
Redeployabilityoperatorsi,t =
A∑a
ωi,t,a(Redeployabilityoperators
a,t
)
Redeployabilityoperators>5i,t =
A∑a
ωi,t,a(Redeployabilityoperators>5
a,t
),
where i represents an airline fleet, t represents a sample year, adenotes an aircraft type, and ωi,t,a is defined as
ωi,t,a = numberi,t,a × seatsa
/ A∑a
numberi,t,a × seatsa.
Because we do not have data on aircraft market values, we usethe number of seats in an aircraft model as a proxy for its size(and value) in our weighted-average calculations. Furthermore,in calculating the first redeployability measure, because we wantto account for the residual demand for the aircraft in each fleet,we do not include each airline’s own aircraft. Likewise, in ournumber-of-operators–based proxies we do not count the airlinefor which we calculate the measure.
The TWA case suggests that the fleets of large airlines areless sellable. Using the Ascend CASE database we therefore con-struct a fourth measure of redeployability as the ratio betweenthe number of leased aircraft per type that an airline has andthe total number of aircraft per type. As before, to construct thefourth proxy at the airline-fleet level, we calculate the weightedaverage of the redeployability index corresponding to each of the
1652 QUARTERLY JOURNAL OF ECONOMICS
leased aircraft in the airline’s fleet:
Fleet sharei,t =A∑a
ωi,t,a
× (number of aircrafti,t,a/number of aircrafta,t),
where number of aircraftt,a is the number of worldwide aircraftof type a in year t.15 Panel A of Table IV presents descriptivestatistics for the redeployability proxies. As can be seen, the re-deployability measure based on aircraft number has an averagevalue of 1,217.2 with a median of 972.9. There are, on average,152.7 potential buyers for an airline’s leased aircraft but only 49.9when operators with more than five aircraft of the same type areconsidered (the median number is 41.8). Moreover, on average, anairline in our sample operates 7.57% of the world’s fleet of an air-craft type, with a median of 4.4%. Finally, as Panel B of Table IVshows, our redeployability measures are highly correlated.16
Table V lists examples of the leased aircraft and the corre-sponding redeployability measures of selected airlines in 2005.As Table V demonstrates, among the airlines in the table, AlaskaAirlines had the most redeployable fleet, while AirTran had theleast redeployable fleet in 2005. This is explained by the fact thatAlaska Airlines leased some of the most widely used aircraft (31B737-400, 5 B737-700, and 1 B737-800), while AirTran’s leasedfleet was dominated by 77 B717-200s, a low-redeployability air-craft with only 155 planes in active operation worldwide in 2005.
V. EMPIRICAL ANALYSIS
In this section we analyze empirically the ability of airlinesto renegotiate their contractual lease obligations. Our goal is tounderstand the factors that enable airlines to extract concessionsin renegotiation by holding up their lessors, and to estimate themagnitude of the concessions that airlines obtain.
V.A. Redeployability and Endogeneity
One concern in using our redeployability measures as prox-ies for the strength of airlines’ bargaining positions vis-a-vis their
15. Note that when the fleet-share redeployability measure is high, the fleetis less redeployable.
16. We include each of the redeployability measures separately in our regres-sion analysis to avoid a multicollinearity problem.
LIQUIDATION VALUES AND CONTRACT RENEGOTIATION 1653T
AB
LE
IVR
ED
EP
LO
YA
BIL
ITY
ME
AS
UR
ES
A.S
um
mar
yst
atis
tics
Mea
n25
thpe
rcen
tile
Med
ian
75th
perc
enti
leS
tan
dard
devi
atio
nM
inM
ax
Red
eplo
yabi
lity
1,21
7.2
642.
897
2.9
1672
.386
1.0
49.0
3,77
2.0
(nu
mbe
rof
airc
raft
)R
edep
loya
bili
ty15
2.7
67.3
123.
721
6.5
110.
311
.054
2.0
(nu
mbe
rof
oper
ator
s)R
edep
loya
bili
ty49
.921
.041
.869
.835
.53.
117
0.0
(nu
mbe
rof
oper
ator
sw
ith
mor
eth
an5
airc
raft
)R
edep
loya
bili
ty7.
572.
334.
407.
399.
710.
2058
.33
(flee
tsh
are)
(%)
B.C
orre
lati
onm
atri
xR
edep
loya
bili
tyR
edep
loya
bili
tyR
edep
loya
bili
ty(n
um
ber
ofop
erat
ors
wit
hR
edep
loya
bili
ty(n
um
ber
ofai
rcra
ft)
(nu
mbe
rof
oper
ator
s)m
ore
than
5ai
rcra
ft)
(flee
tsh
are)
Red
eplo
yabi
lity
1.00
0.97
00.
985
−0.4
73(n
um
ber
ofai
rcra
ft)
(0.0
0)(0
.00)
(0.0
0)R
edep
loya
bili
ty1.
000.
980
−0.4
44(n
um
ber
ofop
erat
ors)
(0.0
0)(0
.00)
Red
eplo
yabi
lity
1.00
−0.4
50(n
um
ber
ofop
erat
ors
wit
h(0
.00)
mor
eth
an5
airc
raft
)R
edep
loya
bili
ty1.
00(fl
eet
shar
e)
Not
es.P
anel
Apr
ovid
esde
scri
ptiv
est
atis
tics
for
the
fou
rre
depl
oyab
ilit
ym
easu
res
use
din
the
empi
rica
lan
alys
is.P
anel
Bdi
spla
ysco
rrel
atio
ns
acro
ssth
efo
ur
rede
ploy
abil
ity
mea
sure
s(p
-val
ues
inpa
ren
thes
es).
Red
eplo
yabi
lity
(nu
mbe
rof
airc
raft
)is
the
nu
mbe
rof
airc
raft
per
type
.Red
eplo
yabi
lity
(nu
mbe
rof
oper
ator
s)is
the
nu
mbe
rof
oper
ator
spe
rty
pe.
Red
eplo
yabi
lity
(nu
mbe
rof
oper
ator
sw
ith
mor
eth
an5
airc
raft
)is
the
nu
mbe
rof
oper
ator
sw
ho
oper
ate
atle
ast
5ai
rcra
ftpe
rty
pe;R
edep
loya
bili
ty(fl
eet
shar
e)is
the
rati
obe
twee
nth
en
um
ber
ofle
ased
airc
raft
per
type
that
anai
rlin
eh
asan
dth
eto
taln
um
ber
ofai
rcra
ftpe
rty
pe.

1654 QUARTERLY JOURNAL OF ECONOMICS
TA
BL
EV
RE
DE
PL
OY
AB
ILIT
YO
FL
EA
SE
DF
LE
ET
S—
SE
LE
CT
ED
AIR
LIN
ES
IN20
05
Red
eplo
yabi
lity
Red
eplo
yabi
lity
Red
eplo
yabi
lity
(nu
mbe
rof
oper
ator
sR
edep
loya
bili
tyL
ease
dai
rcra
ft(n
um
ber
ofai
rcra
ft)
(nu
mbe
rof
oper
ator
s)w
ith
>5
airc
raft
)(fl
eet
shar
e)(%
)fl
eet
Air
Tra
n84
8.1
118.
939
.344
.077
B71
7-20
0,15
B73
7-70
0A
lask
a3,
071.
642
9.6
133.
51.
0311
MD
-80,
31B
737-
400
573
7-70
0,1
B73
7-80
0A
mer
ican
694.
611
1.0
31.1
14.3
24A
-300
-600
R,2
03M
D-8
010
B73
7-80
0NG
,56
B-7
57-2
0014
B76
7-20
0ER
,13
B76
7-30
0ER
4F
okke
r-10
0D
elta
1,07
215
1.0
45.2
5.67
85C
RJ
Reg
ion
al,5
7M
D-8
824
B73
7-20
0,7
B73
7-30
044
757-
200,
2076
7-30
09
B76
7-30
0ER
JetB
lue
1,10
3.4
150.
859
.86.
7525
A32
0-23
0,6
EM
B-1
90U
nit
ed1,
230.
518
0.7
59.1
4.00
55A
320-
230,
22A
319
53B
737-
300,
3B
737-
500
10B
747-
400,
53B
757-
200
18B
767-
300,
16B
777-
200E
RU
.S.A
irw
ays
1,54
7.5
233.
474
.66.
415
A33
0-30
0,13
A32
168
A32
0-23
0,88
A31
918
EM
B17
0,23
CR
J200
7C
RJ
Reg
ion
al,7
5B
737-
300
40B
737-
400,
4475
7-20
010
B76
7-20
0,6
Das
h8-
100
9D
ash
8-20
0,12
Das
h8-
300
Not
es.T
his
tabl
epr
ovid
esva
lues
ofre
depl
oyab
ilit
ym
easu
refo
rse
lect
edai
rlin
esin
2005
asw
ella
sa
desc
ript
ion
ofth
eir
leas
edai
rcra
ftfl
eet.
Red
eplo
yabi
lity
(nu
mbe
rof
airc
raft
)is
the
nu
mbe
rof
airc
raft
per
type
,Red
eplo
yabi
lity
(nu
mbe
rof
oper
ator
s)is
the
nu
mbe
rof
oper
ator
spe
rty
pe,R
edep
loya
bili
ty(n
um
ber
ofop
erat
ors
wit
hm
ore
than
5ai
rcra
ft)
isth
en
um
ber
ofop
erat
ors
wh
oop
erat
eat
leas
t5
airc
raft
per
type
,Red
eplo
yabi
lity
(flee
tsh
are)
isth
era
tio
betw
een
the
nu
mbe
rof
leas
edai
rcra
ftpe
rty
peth
atan
airl
ine
has
and
the
tota
ln
um
ber
ofai
rcra
ftpe
rty
pe.

LIQUIDATION VALUES AND CONTRACT RENEGOTIATION 1655
lessors is that the redeployability of an airline’s aircraft is endoge-nous and driven by growth opportunities or profitability.
Although we control in our regressions for airline character-istics, and our identification strategy is based on within-airlinesestimates using airline fixed effects, the endogeneity of the rede-ployability measures is ultimately an empirical question. We testthe hypothesis that fleet redeployability is correlated with airlinecharacteristics and report the results in Appendix II. We regresseach of our four redeployability measures on airline characteris-tics: sales, profitability, fleet size as measured by the total numberof seats in an airline’s leased fleet, the fraction of wide-bodied air-craft leased by the airline, and a dummy variable that equals 1for airlines in bankruptcy and 0 otherwise. All regressions includeyear and airline fixed effects, and standard errors are clustered byairline. As can be seen, none of the explanatory variables are sta-tistically significant in explaining aircraft redeployability.17 We donot include the market-to-book ratio as an explanatory variablein the regressions in Table VI because several airlines do not havepublicly traded equity.18
The fact that our redeployability measures are not correlatedwith airline characteristics, such as size, profitability, bankruptcy,and market-to-book measures, alleviates concerns about the endo-geneity of our redeployability measures and their correlation withfuture growth opportunities and financial performance. Further-more, in our subsequent regression analysis we include airlinecharacteristics and airline fixed effects to control for airline het-erogeneity that potentially drives aircraft redeployability.
V.B. Financial Condition, Lease Renegotiation,and Aircraft Redeployability
Our model predicts that firms can credibly renegotiate sched-uled payments only when their financial condition is relativelypoor. We use years in which airlines’ cash flow from operationsplus cash balances are less than their interest expense as aproxy for periods in which their threat to renegotiate lease pay-ments is credible (LowCash = 1). While renegotiation itself is
17. To alleviate a multicollinearity concern, we also include each of the regres-sors individually for each of the redeployability measures and find similar results(not reported).
18. In unreported regressions we included market-to-book for the subsampleof airlines with data on equity prices and found no relation between market-to-book and the redeployability measures.
1656 QUARTERLY JOURNAL OF ECONOMICS
unobservable, we test the model’s prediction by estimating theoutcomes of contract renegotiation. To do so, we use the ratio ofan airline’s actual lease payments to its minimum expected leasepayments calculated as of the previous year (Actual/Expected−1)as our main dependent variable.
Because the ratio of an airline’s actual lease payments toits previous year’s minimum expected lease payments may in-crease (decrease) mechanically when airlines expand (reduce)their leased fleet size, we control in our regression analysis for theyearly change in the total number of seats in an airline’s leasedfleet.19 In addition, we control for the total seats in the leased fleet,the square of the total seats in the leased fleet, and the composi-tion of the fleet as captured by the fraction of wide-bodied aircraftin the fleet. We hypothesize that after controlling for fleet change,fleet composition, fleet size, and higher-order terms, changes in(Actual/Expected−1) should be driven by contract renegotiation.To confirm this hypothesis, we conduct keyword searches of thefinancial reports of the airlines in our sample and find twentycases in which airlines report that they have renegotiated aircraftleases. We find that the mean ratio of Actual/Expected−1 for air-lines that do not report lease renegotiation is 1.07, whereas thatof airlines that do report lease renegotiation in their financial re-ports is 0.91 (t-statistic for an equal means test = 2.38). Further-more, when we restrict our sample to airlines with LowCash =1, the mean of Actual/Expected−1 is 0.99 for airlines that do notreport lease renegotiation, compared to 0.76 for airlines that do re-port lease renegotiation in their financial reports (t-statistic for anequal means test = 1.79). Thus, confirming our Actual/Expected−1renegotiation measure, airlines that report lease renegotiationpay in lease expenses an amount smaller than their (previousyear’s) contracted lease payments. Hence, we conclude that af-ter controlling for a battery of fleet covariates that likely soakup changes in lease payments that may be unrelated to rene-gotiations, changes in our dependent variable capture contractrenegotiations.
We run different specifications of the following baselineregression that includes an interaction term between each of thefour measures of fleet redeployability and the LowCash dummy
19. As a robustness test we also scale Actual/Expected−1 by the yearly changein seat size and find similar results.

LIQUIDATION VALUES AND CONTRACT RENEGOTIATION 1657
variable:
(Actual/Expected−1)it = α × LowCashit + β × Redeployabilityit
+ γ × Redeployabilityit × LowCashit
+ Xitλ + ytψ + aiθ + εit,(2)
where (Actual/Expected−1)it is the ratio of an airline’s actuallease expenses to its previous year’s minimum expected leasepayments; LowCashit is a dummy variable indicating whetherthe sum of cash flow from operations and cash balances of airlinei is less than its interest expense in year t; Redeployabilityit is oneof our four measures of the redeployability of an airline’s fleet;Redeployabilityit × LowCashit is an interaction term betweenLowCash and each of the four redeployability measures; yt is avector of year fixed effects; ai is a vector of airline fixed effects;and Xit is a vector of control variables that include the natural log-arithm of the airline’s sales, the size of the airline’s leased fleet asmeasured by the total number of passenger seats in the airline’sleased aircraft, the square of size of the airline’s leased fleet, thepercentage change in the size of the airline’s leased fleet, and thepercent of wide-bodied aircraft in an airline’s fleet. The first fourcolumns in Table VI report the results of regression (2) for each ofour four measures of redeployability, while the next four columnsof Table VI report the results of the regressions that also includeairline fixed effects. All regressions include robust standarderrors that assume groupwise clustering at the airline level.
Consistent with Prediction 1, LowCash is associated with adrop in lease payments in three of the four redeployability mea-sures (the coefficient using the fleet-share redeployability mea-sure is negative but not statistically significant). The coefficientson the first four columns of Table VI indicate that during years ofpoor financial performance, the average ratio of an airline’s actuallease payment to its minimum expected payment is reduced by ap-proximately 10 percentage points.20 Including airline fixed effectsdoes not qualitatively change the results, although the statisticalsignificance is reduced.
We test Prediction 2 of the model by employing an interac-tion term between Redeployabilityit and the LowCash variable. As
20. This economic effect is calculated at the sample mean of each redeploya-bility measure.

1658 QUARTERLY JOURNAL OF ECONOMICS
TA
BL
EV
IA
CT
UA
LV
S.E
XP
EC
TE
DL
EA
SE
EX
PE
NS
ES,
FIN
AN
CIA
LD
IST
RE
SS,
AN
DR
ED
EP
LO
YA
BIL
ITY
Dep
ende
nt
Act
ual
/A
ctu
al/
Act
ual
/A
ctu
al/
Act
ual
/A
ctu
al/
Act
ual
/A
ctu
al/
Act
ual
/A
ctu
al/
Act
ual
/va
riab
leex
pect
edex
pect
edex
pect
edex
pect
edex
pect
edex
pect
edex
pect
edex
pect
edex
pect
edex
pect
edex
pect
ed
Sal
es−0
.015
−0.0
19−0
.018
−0.0
240.
043
0.04
30.
044
0.04
60.
043
0.04
40.
044
(−0.
59)
(−0.
71)
(−0.
68)
(−0.
81)
(2.0
8)(2
.05)
(2.0
1)(2
.12)
(2.0
9)(1
.94)
(1.9
2)S
eats
×10−5
−1.2
12−1
.207
−1.1
92−1
.323
0.50
30.
357
0.44
31.
572
0.45
60.
483
0.39
3(−
1.74
)(−
1.71
)(−
1.71
)(−
1.74
)(0
.35)
(0.2
2)(0
.31)
(0.8
9)(0
.30)
(0.3
1)(0
.25)
Sea
ts×1
0−5sq
uar
ed1.
121
1.13
41.
103
1.33
00.
118
0.26
70.
225
−0.6
540.
158
0.13
60.
227
(1.3
4)(1
.35)
(1.3
2)(1
.50)
(0.1
0)(0
.21)
(0.1
9)(−
0.50
)(0
.13)
(0.1
1)(0
.18)
Sea
tsch
ange
0.14
70.
158
0.15
50.
177
0.27
40.
278
0.27
10.
244
0.27
30.
264
0.26
4(0
.86)
(0.9
2)(0
.89)
(1.0
7)(1
.47)
(1.5
6)(1
.50)
(1.5
6)(1
.43)
(1.5
4)(1
.51)
Wid
e-bo
dysh
are
0.03
50.
045
0.04
80.
097
−0.2
59−0
.238
−0.2
09−0
.145
−0.3
07−0
.215
−0.2
17(0
.18)
(0.2
5)(0
.25)
(0.5
9)(−
0.56
)(−
0.50
)(−
0.44
)(−
0.31
)(−
0.77
)(−
0.51
)(−
0.50
)L
owC
ash
−0.2
55−0
.243
−0.2
48−0
.100
−0.4
19−0
.437
−0.4
34−0
.171
−0.2
96−0
.284
−0.3
19(−
2.56
)(−
1.66
)(−
2.13
)(−
0.86
)(−
2.12
)(−
1.62
)(−
2.05
)(−
0.93
)(−
1.70
)(−
1.43
)(−
1.80
)R
edep
loya
bili
ty−0
.000
05−0
.000
02−2
.52e
-08
(a)
(air
craf
t)(−
2.34
)(−
0.26
)(−
0.24
)×
Low
Cas
h0.
0001
30.
0002
72.
92e-
07(a
)(2
.69)
(2.2
1)(2
.02)
LIQUIDATION VALUES AND CONTRACT RENEGOTIATION 1659
TA
BL
EV
I(C
ON
TIN
UE
D)
Dep
ende
nt
Act
ual
/A
ctu
al/
Act
ual
/A
ctu
al/
Act
ual
/A
ctu
al/
Act
ual
/A
ctu
al/
Act
ual
/A
ctu
al/
Act
ual
/va
riab
leex
pect
edex
pect
edex
pect
edex
pect
edex
pect
edex
pect
edex
pect
edex
pect
edex
pect
edex
pect
edex
pect
ed
Red
eplo
yabi
lity
−0.0
003
−0.0
002
−5.0
9e-0
6(a
)(o
pera
tors
)(−
1.70
)(−
0.34
)(−
0.47
)×
Low
Cas
h0.
001
0.00
210.
0000
3(a
)(1
.55)
(1.8
8)(1
.70)
Red
eplo
yabi
lity
−0.0
011
−0.0
001
−7.5
5e-0
6(a
)(≥
5ai
rcra
ft)
(−2.
05)
(−0.
51)
(−0.
62)
×L
owC
ash
0.00
30.
0068
0.00
004
(a)
(2.0
3)(2
.18)
(2.1
6)R
edep
loya
bili
ty0.
113
−0.5
83(fl
eet
shar
e)(0
.63)
(−0.
58)
×L
owC
ash
0.64
82.
541
(0.3
1)(0
.85)
Fir
mfi
xed
effe
cts
No
No
No
No
Yes
Yes
Yes
Yes
Yes
Yes
Yes
Adj
ust
edR
20.
400.
390.
400.
380.
640.
630.
640.
620.
630.
630.
63O
bser
vati
ons
177
177
177
177
177
177
177
177
177
177
177
Not
es.T
he
depe
nde
nt
vari
able
inth
ere
gres
sion
sis
the
rati
oof
anai
rlin
e’s
actu
alle
ase
expe
nse
sto
its
prev
iou
sye
ar’s
min
imu
mex
pect
edle
ase
paym
ents
—A
ctu
al/E
xpec
ted −
1.
Sal
esis
the
loga
rith
mof
ann
ual
airl
ine
sale
s.S
eats
isth
eto
tal
nu
mbe
rof
seat
sin
the
leas
edfl
eet.
Sea
tssq
uar
edis
the
squ
are
ofth
eto
tal
nu
mbe
rof
seat
sin
the
leas
edfl
eet.
Sea
tsch
ange
isth
ean
nu
alch
ange
inS
eats
.W
ide-
body
shar
eis
the
frac
tion
ofw
ide-
bodi
edai
rcra
ftle
ased
byan
airl
ine.
Low
Cas
his
adu
mm
yva
riab
leth
ateq
ual
s1
for
airl
ines
inw
hic
hca
shfl
owfr
omop
erat
ion
s(i
nco
me
befo
reex
trao
rdin
ary
item
s+
depr
ecia
tion
and
amor
tiza
tion
)pl
us
cash
bala
nce
sar
ele
ssth
anth
eir
inte
rest
expe
nse
,an
d0
oth
erw
ise.
Red
eplo
yabi
lity
(air
craf
t)is
the
nu
mbe
rof
airc
raft
per
type
.Red
eplo
yabi
lity
(ope
rato
rs)
isth
en
um
ber
ofop
erat
ors
per
type
.Red
eplo
yabi
lity
(≥5
airc
raft
)is
the
nu
mbe
rof
oper
ator
sw
ho
oper
ate
atle
ast
5ai
rcra
ftpe
rty
pe.R
edep
loya
bili
ty(fl
eet
shar
e)is
the
rati
obe
twee
nth
en
um
ber
ofle
ased
airc
raft
per
type
that
anai
rlin
eh
asan
dth
eto
tal
nu
mbe
rof
airc
raft
per
type
.Red
eplo
yabi
lity
mea
sure
sin
the
tabl
e’s
last
thre
eco
lum
ns
are
calc
ula
ted
usi
ng
only
publ
icly
trad
edai
rlin
esan
dby
wei
ghti
ng
each
airl
ine
byit
sca
shfl
owfr
omop
erat
ion
spl
us
cash
bala
nce
s.R
egre
ssio
ns
also
incl
ude
inte
ract
ion
sbe
twee
nea
chof
the
Red
eplo
yabi
lity
mea
sure
san
dL
owC
ash
.All
regr
essi
ons
incl
ude
anin
terc
ept
(not
repo
rted
)an
dye
arfi
xed
effe
cts;
t-st
atis
tics
are
calc
ula
ted
usi
ng
stan
dard
erro
rsth
atar
ecl
ust
ered
byai
rlin
ean
dre
port
edin
pare
nth
eses
.
1660 QUARTERLY JOURNAL OF ECONOMICS
can be seen in Table VI, the coefficients on the noninteracted rede-ployability measures indicate either a negative relation betweenfleet redeployability and Actual/Expected−1 or a relation that isnot statistically different from 0. Thus, during years of relativelygood financial performance (LowCash = 0), we find that airlinesare not able to obtain concessions from their lessors and reducetheir lease payments when the redeployability of their assets islow.21
However, consistent with Prediction 2 of the model, the re-sults indicate that reduced fleet redeployability is associated withlower lease payments when an airline’s financial position is rela-tively poor. As the interaction term between redeployability andLowCash indicates, both with and without airline fixed effects,in years of poor financial performance the relation between re-deployability and Actual/Expected−1 is now positive using threeof our four measures of redeployability (number of aircraft, num-ber of operators, and number of large operators). Put differently,when the threat to renegotiate is more credible, reductions infleet redeployability measures are associated with reductions inactual lease payments. Using the airline fixed-effect specification,we find that when LowCash = 1, a one-standard-deviation de-crease in the redeployability measures decreases an airline’s leasepayment by approximately 20 percentage points as compared toits minimum expected lease payment.22 The interaction betweenthe fourth redeployability measure, fleet share, and the LowCashdummy variable implies a similar positive relation between re-deployability and Actual/Expected−1 but this is not statisticallysignificant.23 In unreported results we repeat our analysis usingas a dependent variable the ratio between actual year t lease pay-ments and the year t − 2 expected lease payments. We continue to
21. One possible explanation for the negative relation between redeployabil-ity and (Actual/Expected−1) found in the specifications without airline fixed effectsis that firms with highly redeployable fleets have lower lease expenses. Lessorsunderstand that upon default it will be easier to redeploy the aircraft, and there-fore charge lessees less up front. This argument is consistent with Benmelech andBergman (2008), who find that debt tranches that are secured by more redeploy-able aircrafts have lower credit spreads.
22. Economic magnitudes throughout the paper take into account the totaldifferential of both the level and the interaction term when appropriate. We alsotest for the statistical significance of the sum of the two coefficients and find thatin the specifications that include firm fixed effects they are statistically significant.
23. The firm fixed effects capture (non-time-varying) unobserved differencesin firms’ ability to renegotiate with lessors. These include management’s reputa-tion for “toughness” in renegotiation, managerial quality, or the strength of theemployee union in the firm.
LIQUIDATION VALUES AND CONTRACT RENEGOTIATION 1661
find a positive and significant coefficient on the interaction termbetween redeployability and the LowCash dummy variable.
In the last three columns of Table VI, we weight airlinesby their cash flow from operations plus cash balances when con-structing the redeployability measures. Following Shleifer andVishny (1992), this captures the notion that the financial conditionof potential buyers is of importance in determining demand forassets.24 Because accounting data are only available for publiclytraded firms, this procedure has the drawback that it does notallow inclusion of private airlines when calculating the aircraftredeployability measures. Still, as can be seen from the last threecolumns of Table VI, conditional on LowCash = 1 we continue tofind a positive relation between (weighted) fleet redeployabilityand Actual/Expected−1 for three of the four redeployability mea-sures.25 Indeed, conditional on poor financial performance, thecoefficients imply that a one-standard-deviation decrease in theredeployability measures reduces actual compared to expectedlease payments by between 11.8 and 17.5 percentage points.
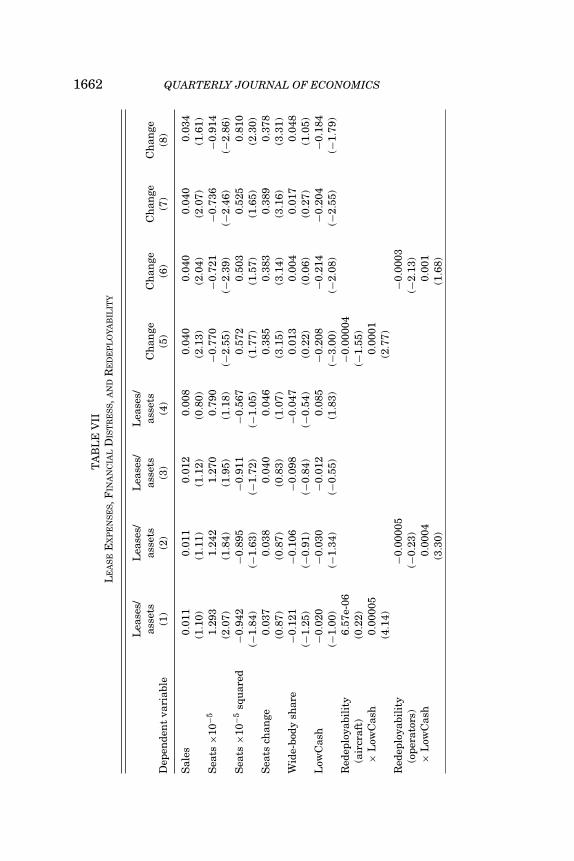
For robustness, we repeat our analysis using both lease pay-ments scaled by assets, or changes in lease payments as depen-dent variables, and report the results in Table VII. In the firstfour columns of Table VII we use lease expenses scaled by as-sets as our dependent variable. We find that after controlling forairline fixed effects, there is no statistically significant relationbetween the level of lease payments and the LowCash dummyvariable, or the redeployability measures. However, our main re-sult holds: the interaction between redeployability and LowCashis positive and statistically significant at the 1% level in three offour cases. Thus, consistent with Prediction 2, conditional on poorfinancial performance—as proxied by LowCash = 1—reductionsin fleet redeployability are associated with reductions in (scaled)lease payments. Indeed, a standard deviation reduction in fleetredeployability reduces the ratio of lease payments to assets bybetween 3.2 to 4.6 percentage points.
Likewise, in the last four columns of Table VII we use the one-year change in lease payments as our dependent variable. Becausein these regressions our dependent variable is a rate of change we
24. Our original unweighted redeployability measures also follow this no-tion in that when calculating the redeployability measures we ignore airlines inbankruptcy as a source of potential demand for aircraft.
25. As above, the coefficient on fleet share is not statistically significant and,for brevity, is not reported in Table VI.
1662 QUARTERLY JOURNAL OF ECONOMICST
AB
LE
VII
LE
AS
EE
XP
EN
SE
S,F
INA
NC
IAL
DIS
TR
ES
S,A
ND
RE
DE
PL
OY
AB
ILIT
Y
Lea
ses/
Lea
ses/
Lea
ses/
Lea
ses/
asse
tsas
sets
asse
tsas
sets
Ch
ange
Ch
ange
Ch
ange
Ch
ange
Dep
ende
nt
vari
able
(1)
(2)
(3)
(4)
(5)
(6)
(7)
(8)
Sal
es0.
011
0.01
10.
012
0.00
80.
040
0.04
00.
040
0.03
4(1
.10)
(1.1
1)(1
.12)
(0.8
0)(2
.13)
(2.0
4)(2
.07)
(1.6
1)S
eats
×10−
51.
293
1.24
21.
270
0.79
0−0
.770
−0.7
21−0
.736
−0.9
14(2
.07)
(1.8
4)(1
.95)
(1.1
8)(−
2.55
)(−
2.39
)(−
2.46
)(−
2.86
)S
eats
×10−
5sq
uar
ed−0
.942
−0.8
95−0
.911
−0.5
670.
572
0.50
30.
525
0.81
0(−
1.84
)(−
1.63
)(−
1.72
)(−
1.05
)(1
.77)
(1.5
7)(1
.65)
(2.3
0)S
eats
chan
ge0.
037
0.03
80.
040
0.04
60.
385
0.38
30.
389
0.37
8(0
.87)
(0.8
7)(0
.83)
(1.0
7)(3
.15)
(3.1
4)(3
.16)
(3.3
1)W
ide-
body
shar
e−0
.121
−0.1
06−0
.098
−0.0
470.
013
0.00
40.
017
0.04
8(−
1.25
)(−
0.91
)(−
0.84
)(−
0.54
)(0
.22)
(0.0
6)(0
.27)
(1.0
5)L
owC
ash
−0.0
20−0
.030
−0.0
120.
085
−0.2
08−0
.214
−0.2
04−0
.184
(−1.
00)
(−1.
34)
(−0.
55)
(1.8
3)(−
3.00
)(−
2.08
)(−
2.55
)(−
1.79
)R
edep
loya
bili
ty6.
57e-
06−0
.000
04(a
ircr
aft)
(0.2
2)(−
1.55
)×
Low
Cas
h0.
0000
50.
0001
(4.1
4)(2
.77)
Red
eplo
yabi
lity
−0.0
0005
−0.0
003
(ope
rato
rs)
(−0.
23)
(−2.
13)
×L
owC
ash
0.00
040.
001
(3.3
0)(1
.68)

LIQUIDATION VALUES AND CONTRACT RENEGOTIATION 1663
TA
BL
EV
II(C
ON
TIN
UE
D)
Lea
ses/
Lea
ses/
Lea
ses/
Lea
ses/
asse
tsas
sets
asse
tsas
sets
Ch
ange
Ch
ange
Ch
ange
Ch
ange
Dep
ende
nt
vari
able
(1)
(2)
(3)
(4)
(5)
(6)
(7)
(8)
Red
eplo
yabi
lity
−0.0
001
−0.0
009
(≥5
airc
raft
)(−
0.15
)(−
1.78
)×
Low
Cas
h0.
001
0.00
2(2
.77)
(2.2
8)R
edep
loya
bili
ty0.
289
0.31
3(fl
eet
shar
e)(3
.33)
(1.4
8)×
Low
Cas
h−0
.991
2.77
7(−
1.15
)(1
.19)
Fir
mfi
xed
effe
cts
Yes
Yes
Yes
Yes
No
No
No
No
Adj
ust
edR
20.
940.
940.
940.
940.
350.
360.
360.
36O
bser
vati
ons
184
184
184
184
184
184
184
184
Not
es.T
he
depe
nde
nt
vari
able
inth
ere
gres
sion
sis
eith
erth
era
tio
ofle
ase
paym
ents
toth
ebo
okva
lue
ofas
sets
(col
um
ns
(1)–
(4))
,or
the
year
lych
ange
inle
ase
paym
ents
—C
han
ge(c
olu
mn
s(5
)–(8
)).S
ales
isth
elo
gari
thm
ofan
nu
alai
rlin
esa
les.
Sea
tsis
the
tota
ln
um
ber
ofse
ats
inth
ele
ased
flee
t.S
eats
squ
ared
isth
esq
uar
eof
the
tota
ln
um
ber
ofse
ats
inth
ele
ased
flee
t.S
eats
chan
geis
the
ann
ual
chan
gein
Sea
ts.
Wid
e-bo
dysh
are
isth
efr
acti
onof
wid
e-bo
died
airc
raft
leas
edby
anai
rlin
e.L
owC
ash
isa
dum
my
vari
able
that
equ
als
1fo
rai
rlin
esin
wh
ich
cash
flow
from
oper
atio
ns
(in
com
ebe
fore
extr
aord
inar
yit
ems
+de
prec
iati
onan
dam
orti
zati
on)
plu
sca
shba
lan
ces
are
less
than
thei
rin
tere
stex
pen
se,a
nd
0ot
her
wis
e.R
edep
loya
bili
ty(a
ircr
aft)
isth
en
um
ber
ofai
rcra
ftpe
rty
pe.R
edep
loya
bili
ty(o
pera
tors
)is
the
nu
mbe
rof
oper
ator
spe
rty
pe.R
edep
loya
bili
ty(≥
5ai
rcra
ft)i
sth
en
um
ber
ofop
erat
ors
wh
oop
erat
eat
leas
t5
airc
raft
per
type
,Red
eplo
yabi
lity
(flee
tsh
are)
isth
era
tio
betw
een
the
nu
mbe
rof
leas
edai
rcra
ftpe
rty
peth
atan
airl
ine
has
and
the
tota
lnu
mbe
rof
airc
raft
per
type
.Reg
ress
ion
sal
soin
clu
dein
tera
ctio
ns
betw
een
each
ofth
eR
edep
loya
bili
tym
easu
res
and
Low
Cas
h.A
llre
gres
sion
sin
clu
dean
inte
rcep
t(n
otre
port
ed)a
nd
year
fixe
def
fect
s;t-
stat
isti
csar
eca
lcu
late
du
sin
gst
anda
rder
rors
that
are
clu
ster
edby
airl
ine
and
repo
rted
inpa
ren
thes
is.

1664 QUARTERLY JOURNAL OF ECONOMICS
do not include airline fixed effects. Consistent with Predictions 1and 2, we find a robust negative relation between the LowCashdummy variable and the yearly change in lease payments for threeof the four redeployability measures. During years when LowCashequals 1, the yearly change in lease payments is reduced by be-tween 10.8 and 11.4 percentage points as compared to years whenLowCash is zero. Importantly, consistent with Prediction 2, wefind that the interaction between redeployability and LowCash ispositive and statistically significant for three out of the four rede-ployability measures. Therefore, when airlines are doing poorly,reductions in fleet redeployability are associated with reductionsin lease payments. A one-standard-deviation reduction in the re-deployability measures reduces the change in lease payments bybetween 3.5 and 4 percentage points.
V.C. Lease Renegotiation in Bankruptcy
We continue our analysis by studying airline bankruptcies.We use years in which an airline is in bankruptcy as a proxy forperiods in which airlines can credibly renegotiate their lease pay-ments. While there is a limited number of airline bankruptcies inour sample,26 given the importance of airline bankruptcies, andbecause some of the airlines who file for Chapter 11 are among thelargest in the industry, we devote a subsection for lease renegoti-ation in bankruptcy. Furthermore, we hypothesize that because alessee’s threat to reject its leases and return aircraft to lessors ismore credible during bankruptcy, the effect of redeployability onthe ability to obtain concessions from lessors in lease renegotia-tion will be stronger than that found in the previous section.
Table VIII presents the results of running the following re-gression for each of the four redeployability measures:
(Actual/Expected−1)it = α × Bankruptcyit + β × Redeployabilityit
+ γ × Seatsit × Bankruptcyit
+ σ × Redeployabilityit × Bankruptcyit
+ Xitλ + ytψ + aiθ + εit,(3)
26. We include both bankruptcies of U.S. Airways (2002–2003 and 2004–2005), and the bankruptcies of ATA, Comair Delta Airlines, Mair, Northwest,and United Airlines. We were not able to obtain data for the second bankruptcyof TWA (1995), and for the bankruptcies of Hawaiian Airlines and Tower. We donot include the third bankruptcy of TWA because it was acquired by AmericanAirlines.

LIQUIDATION VALUES AND CONTRACT RENEGOTIATION 1665
TA
BL
EV
III
AC
TU
AL
VS.
EX
PE
CT
ED
LE
AS
EE
XP
EN
SE
S,B
AN
KR
UP
TC
Y,A
ND
RE
DE
PL
OY
AB
ILIT
Y
Act
ual
/A
ctu
al/
Act
ual
/A
ctu
al/
Act
ual
/A
ctu
al/
Act
ual
/A
ctu
al/
Dep
ende
nt
vari
able
expe
cted
expe
cted
expe
cted
expe
cted
expe
cted
expe
cted
expe
cted
expe
cted
Sal
es−0
.056
−0.0
52−0
.053
−0.1
020.
019
0.02
70.
023
−0.0
05(−
2.09
)(−
1.98
)(−
2.01
)(−
3.03
)(0
.61)
(0.8
7)(0
.75)
(−0.
16)
Sea
ts×1
0−5
−0.5
47−0
.640
−0.5
86−0
.002
0.06
6−0
.048
−0.1
180.
678
(−0.
78)
(−0.
93)
(−0.
84)
(−0.
00)
(0.0
4)(−
0.03
)(−
0.07
)(0
.35)
Sea
ts×1
0−5
squ
ared
0.53
90.
641
0.57
00.
092
0.46
50.
594
0.62
70.
106
(0.6
9)(0
.82)
(0.7
3)(0
.12)
(0.3
5)(0
.42)
(0.4
6)(0
.07)
Sea
tsch
ange
0.17
10.
174
0.17
50.
183
0.24
80.
256
0.25
60.
240
(1.4
0)(1
.39)
(1.4
0)(1
.52)
(1.3
8)(1
.47)
(1.4
7)(1
.49)
Wid
e-bo
dysh
are
0.08
80.
089
0.09
00.
110
−0.1
71−0
.152
−0.1
22−0
.065
(0.5
4)(0
.56)
(0.5
6)(0
.78)
(−0.
35)
(−0.
30)
(−0.
25)
(−0.
12)
Pro
fita
bili
ty0.
160
0.16
80.
162
0.25
60.
087
0.08
50.
088
0.07
8(1
.29)
(1.3
3)(1
.31)
(2.0
4)(0
.50)
(0.4
8)(0
.53)
(0.4
2)B
ankr
upt
cy−0
.252
−0.1
94−0
.212
1.11
3−0
.277
−0.2
57−0
.271
0.64
3(−
0.76
)(−
0.51
)(−
0.63
)(3
.46)
(−1.
49)
(−1.
33)
(−1.
46)
(3.3
9)S
eats
×10−
5−0
.002
−0.0
024
−0.0
025
−0.0
04−0
.001
−0.0
009
−0.0
01−0
.002
×ba
nkr
upt
cy(−
2.67
)(−
2.23
)(−
2.58
)(−
3.76
)(−
1.17
)(−
0.98
)(−
1.23
)(−
2.82
)R
edep
loya
bili
ty−0
.000
02−0
.000
06(a
ircr
aft)
(−1.
35)
(−0.
49)
×ba
nkr
upt
cy0.
0005
0.00
036
(2.3
5)(2
.02)
Red
eplo
yabi
lity
−0.0
002
−0.0
004
(ope
rato
rs)
(−0.
89)
(−0.
50)
×ba
nkr
upt
cy0.
003
0.00
24(1
.75)
(1.7
3)

1666 QUARTERLY JOURNAL OF ECONOMICS
TA
BL
EV
III
( CO
NT
INU
ED
)
Act
ual
/A
ctu
al/
Act
ual
/A
ctu
al/
Act
ual
/A
ctu
al/
Act
ual
/A
ctu
al/
Dep
ende
nt
vari
able
expe
cted
expe
cted
expe
cted
expe
cted
expe
cted
expe
cted
expe
cted
expe
cted
Red
eplo
yabi
lity
−0.0
006
−0.0
02(≥
5ai
rcra
ft)
(−1.
15)
(−0.
80)
×ba
nkr
upt
cy0.
010
0.00
9(2
.17)
(2.0
0)R
edep
loya
bili
ty0.
058
−0.2
67(fl
eet
shar
e)(0
.45)
(−0.
27)
×ba
nkr
upt
cy−5
.189
−3.0
70(−
4.75
)(−
2.60
)
Fir
mfi
xed
effe
cts
No
No
No
No
Yes
Yes
Yes
Yes
Adj
ust
edR
20.
440.
430.
440.
470.
620.
620.
620.
63O
bser
vati
ons
177
177
177
177
177
177
177
177
Not
es.T
he
depe
nde
nt
vari
able
inth
ere
gres
sion
sis
the
rati
oof
anai
rlin
e’s
actu
alle
ase
expe
nse
sto
its
prev
iou
sye
ar’s
min
imu
mex
pect
edle
ase
paym
ents
—A
ctu
al/E
xpec
ted −
1.
Sal
esis
the
loga
rith
mof
ann
ual
airl
ine
sale
s.S
eats
isth
eto
taln
um
ber
ofse
ats
inth
ele
ased
flee
t.S
eats
squ
ared
isth
esq
uar
eof
the
tota
lnu
mbe
rof
seat
sin
the
leas
edfl
eet.
Sea
tsch
ange
isth
ean
nu
alch
ange
inS
eats
.Wid
e-bo
dysh
are
isth
efr
acti
onof
wid
e-bo
died
airc
raft
leas
edby
anai
rlin
e.P
rofi
tabi
lity
isop
erat
ing
inco
me
befo
rede
prec
iati
ondi
vide
dby
the
book
valu
eof
asse
ts.B
ankr
upt
cyis
adu
mm
yva
riab
leta
kin
gon
the
valu
eof
1in
thos
eye
ars
inw
hic
han
airl
ine
isu
nde
rth
epr
otec
tion
ofC
hap
ter
11,a
nd
0ot
her
wis
e.R
edep
loya
bili
ty(a
ircr
aft)
isth
en
um
ber
ofai
rcra
ftpe
rty
pe.
Red
eplo
yabi
lity
(ope
rato
rs)
isth
en
um
ber
ofop
erat
ors
per
type
.R
edep
loya
bili
ty(≥
5ai
rcra
ft)
isth
en
um
ber
ofop
erat
ors
wh
oop
erat
eat
leas
t5
airc
raft
per
type
.R
edep
loya
bili
ty(fl
eet
shar
e)is
the
rati
obe
twee
nth
en
um
ber
ofle
ased
airc
raft
per
type
that
anai
rlin
eh
asan
dth
eto
tal
num
ber
ofai
rcra
ftpe
rty
pe.
Reg
ress
ion
sal
soin
clu
dein
tera
ctio
ns
betw
een
Fle
etan
dB
ankr
upt
cy,
and
betw
een
each
ofth
eR
edep
loya
bili
tym
easu
res
and
Ban
kru
ptcy
.A
llre
gres
sion
sin
clu
dean
inte
rcep
t(n
otre
port
ed)
and
year
fixe
def
fect
s;t-
stat
isti
csar
eca
lcu
late
du
sin
gst
anda
rder
rors
that
are
clu
ster
edby
airl
ine
and
repo
rted
inpa
ren
thes
is.

LIQUIDATION VALUES AND CONTRACT RENEGOTIATION 1667
where Bankruptcy is a dummy variable taking on the value of1 in those years in which an airline is under the protection ofChapter 11, and 0 otherwise. Seatsit is the total number of seatsin an airline’s leased fleet, Seatsit × Bankruptcyit is an interac-tion term between Bankruptcy and Seatsit, and the rest of thevariables are identical to those in regression (2). Consistent withour model, during bankruptcy, the relation between redeploya-bility and Actual/Expected−1 is positive using all four measuresof redeployability. Also, as hypothesized, consistent with a morecredible threat of lease rejection, the effect of reduced fleet rede-ployability is generally stronger in bankruptcy than in periodswhen LowCash = 1. In the specifications without airline fixedeffects, we find that in bankruptcy, a one-standard-deviation de-crease in the fleet redeployability measures decreases an airline’slease payments by between 30 and 49 percentage points belowits contractual lease payment. In the specifications that includeairline fixed effects, this effect is between 22.1 percentage points(number-of-operators redeployability measure) and 32.4 percent-age points (fleet-share redeployability measure). The fleet-sharemeasure captures an airline’s threat to reject leases on a mas-sive scale—a threat that is most credible in bankruptcy. Thus, asopposed to when using the LowCash variable, when proxying forpoor financial performance using the bankruptcy dummy variable,fleet share is statistically significant.
Finally, in Table VIII we also include the interaction betweenfleet size and the Bankruptcyit variable to capture the possibilitythat airlines with large fleets can extract concessions by threaten-ing their lessors with massive liquidation as in the case of TWA’sacquisition. We find support for this hypothesis in that the coeffi-cient on this interaction variable is negative in all eight specifica-tions, and is statistically significant in five of them.
V.D. Lease Renegotiation out of Bankruptcy
We now test whether our results are driven solely by the abil-ity of firms to renegotiate while in bankruptcy, by including onlythose airline-years in which airlines are outside of bankruptcy.The results are presented in the first four columns of Table IX.
Our results continue to hold when focusing only on airlinesout of bankruptcy: First, as in Table VI, the LowCash dummyvariable is negatively related to Actual/Expected−1 in three ofthe four redeployability measures. Second, and more important,among airlines with LowCash = 1, there is a positive relation
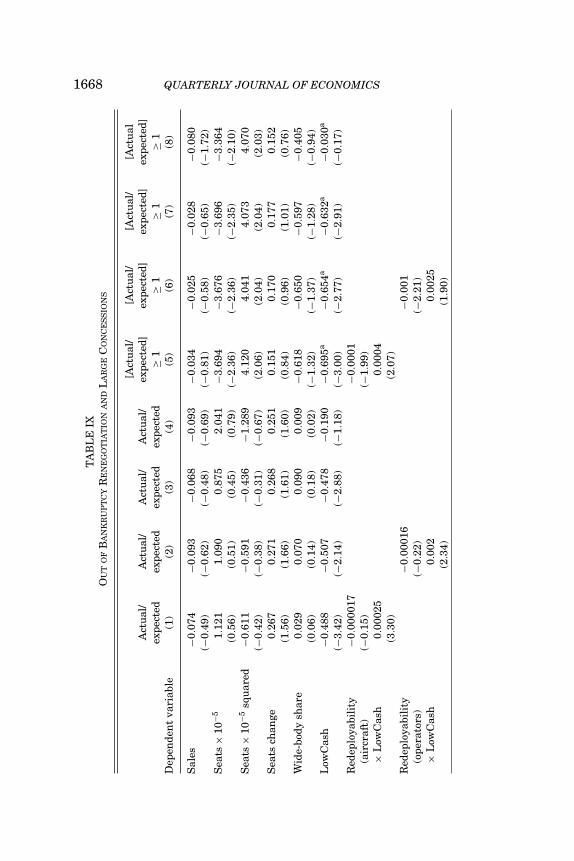
1668 QUARTERLY JOURNAL OF ECONOMICST
AB
LE
IXO
UT
OF
BA
NK
RU
PT
CY
RE
NE
GO
TIA
TIO
NA
ND
LA
RG
EC
ON
CE
SS
ION
S
[Act
ual
/[A
ctu
al/
[Act
ual
/[A
ctu
alA
ctu
al/
Act
ual
/A
ctu
al/
Act
ual
/ex
pect
ed]
expe
cted
]ex
pect
ed]
expe
cted
]ex
pect
edex
pect
edex
pect
edex
pect
ed≥
1≥
1≥
1≥
1D
epen
den
tva
riab
le(1
)(2
)(3
)(4
)(5
)(6
)(7
)(8
)
Sal
es−0
.074
−0.0
93−0
.068
−0.0
93−0
.034
−0.0
25−0
.028
−0.0
80(−
0.49
)(−
0.62
)(−
0.48
)(−
0.69
)(−
0.81
)(−
0.58
)(−
0.65
)(−
1.72
)S
eats
×10
−51.
121
1.09
00.
875
2.04
1−3
.694
−3.6
76−3
.696
−3.3
64(0
.56)
(0.5
1)(0
.45)
(0.7
9)(−
2.36
)(−
2.36
)(−
2.35
)(−
2.10
)S
eats
×10
−5sq
uar
ed−0
.611
−0.5
91−0
.436
−1.2
894.
120
4.04
14.
073
4.07
0(−
0.42
)(−
0.38
)(−
0.31
)(−
0.67
)(2
.06)
(2.0
4)(2
.04)
(2.0
3)S
eats
chan
ge0.
267
0.27
10.
268
0.25
10.
151
0.17
00.
177
0.15
2(1
.56)
(1.6
6)(1
.61)
(1.6
0)(0
.84)
(0.9
6)(1
.01)
(0.7
6)W
ide-
body
shar
e0.
029
0.07
00.
090
0.00
9−0
.618
−0.6
50−0
.597
−0.4
05(0
.06)
(0.1
4)(0
.18)
(0.0
2)(−
1.32
)(−
1.37
)(−
1.28
)(−
0.94
)L
owC
ash
−0.4
88−0
.507
−0.4
78−0
.190
−0.6
95a
−0.6
54a
−0.6
32a
−0.0
30a
(−3.
42)
(−2.
14)
(−2.
88)
(−1.
18)
(−3.
00)
(−2.
77)
(−2.
91)
(−0.
17)
Red
eplo
yabi
lity
−0.0
0001
7−0
.000
1(a
ircr
aft)
(−0.
15)
(−1.
99)
×L
owC
ash
0.00
025
0.00
04(3
.30)
(2.0
7)R
edep
loya
bili
ty−0
.000
16−0
.001
(ope
rato
rs)
(−0.
22)
(−2.
21)
×L
owC
ash
0.00
20.
0025
(2.3
4)(1
.90)
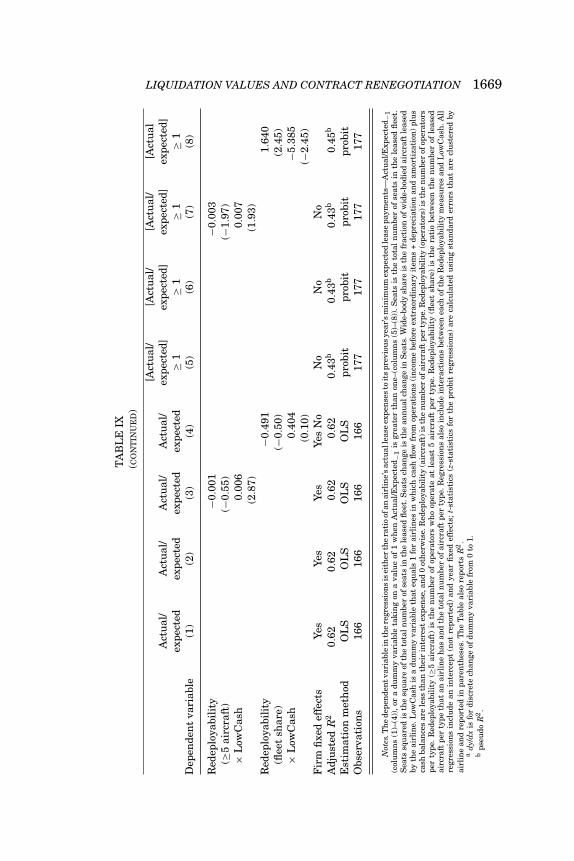
LIQUIDATION VALUES AND CONTRACT RENEGOTIATION 1669
TA
BL
EIX
(CO
NT
INU
ED
)
[Act
ual
/[A
ctu
al/
[Act
ual
/[A
ctu
alA
ctu
al/
Act
ual
/A
ctu
al/
Act
ual
/ex
pect
ed]
expe
cted
]ex
pect
ed]
expe
cted
]ex
pect
edex
pect
edex
pect
edex
pect
ed≥
1≥
1≥
1≥
1D
epen
den
tva
riab
le(1
)(2
)(3
)(4
)(5
)(6
)(7
)(8
)
Red
eplo
yabi
lity
−0.0
01−0
.003
(≥5
airc
raft
)(−
0.55
)(−
1.97
)×
Low
Cas
h0.
006
0.00
7(2
.87)
(1.9
3)R
edep
loya
bili
ty−0
.491
1.64
0(fl
eet
shar
e)(−
0.50
)(2
.45)
×L
owC
ash
0.40
4−5
.385
(0.1
0)(−
2.45
)F
irm
fixe
def
fect
sYe
sYe
sYe
sYe
sN
oN
oN
oN
oA
dju
sted
R2
0.62
0.62
0.62
0.62
0.43
b0.
43b
0.43
b0.
45b
Est
imat
ion
met
hod
OL
SO
LS
OL
SO
LS
prob
itpr
obit
prob
itpr
obit
Obs
erva
tion
s16
616
616
616
617
717
717
717
7
Not
es.T
he
depe
nde
ntv
aria
ble
inth
ere
gres
sion
sis
eith
erth
era
tio
ofan
airl
ine’
sac
tual
leas
eex
pen
ses
toit
spr
evio
us
year
’sm
inim
um
expe
cted
leas
epa
ymen
ts—
Act
ual
/Exp
ecte
d −1
(col
um
ns
(1)–
(4))
,or
adu
mm
yva
riab
leta
kin
gon
ava
lue
of1
wh
enA
ctu
al/E
xpec
ted −
1is
grea
ter
than
one–
(col
um
ns
(5)–
(8))
.Sea
tsis
the
tota
ln
um
ber
ofse
ats
inth
ele
ased
flee
t.S
eats
squ
ared
isth
esq
uar
eof
the
tota
lnu
mbe
rof
seat
sin
the
leas
edfl
eet.
Sea
tsch
ange
isth
ean
nu
alch
ange
inS
eats
.Wid
e-bo
dysh
are
isth
efr
acti
onof
wid
e-bo
died
airc
raft
leas
edby
the
airl
ine.
Low
Cas
his
adu
mm
yva
riab
leth
ateq
ual
s1
for
airl
ines
inw
hic
hca
shfl
owfr
omop
erat
ion
s(i
nco
me
befo
reex
trao
rdin
ary
item
s+
depr
ecia
tion
and
amor
tiza
tion
)pl
us
cash
bala
nce
sar
ele
ssth
anth
eir
inte
rest
expe
nse
,an
d0
oth
erw
ise.
Red
eplo
yabi
lity
(air
craf
t)is
the
nu
mbe
rof
airc
raft
per
type
.Red
eplo
yabi
lity
(ope
rato
rs)i
sth
en
um
ber
ofop
erat
ors
per
type
.R
edep
loya
bili
ty(≥
5ai
rcra
ft)
isth
en
um
ber
ofop
erat
ors
wh
oop
erat
eat
leas
t5
airc
raft
per
type
.R
edep
loya
bili
ty(fl
eet
shar
e)is
the
rati
obe
twee
nth
en
um
ber
ofle
ased
airc
raft
per
type
that
anai
rlin
eh
asan
dth
eto
taln
um
ber
ofai
rcra
ftpe
rty
pe.R
egre
ssio
ns
also
incl
ude
inte
ract
ion
sbe
twee
nea
chof
the
Red
eplo
yabi
lity
mea
sure
san
dL
owC
ash
.All
regr
essi
ons
incl
ude
anin
terc
ept
(not
repo
rted
)an
dye
arfi
xed
effe
cts;
t-st
atis
tics
(z-s
tati
stic
sfo
rth
epr
obit
regr
essi
ons)
are
calc
ula
ted
usi
ng
stan
dard
erro
rsth
atar
ecl
ust
ered
byai
rlin
ean
dre
port
edin
pare
nth
eses
.Th
eT
able
also
repo
rts
R2.
ady
/dx
isfo
rdi
scre
tech
ange
ofdu
mm
yva
riab
lefr
om0
to1.
bps
eudo
R2.

1670 QUARTERLY JOURNAL OF ECONOMICS
between redeployability and the amount of actual compared toexpected lease payments in three of the four redeployability mea-sures. Thus, we find that, even outside of bankruptcy, airlinescan renegotiate with their lessors and cut their lease rates whentheir fleets are less redeployable and their financial condition issufficiently poor.
V.E. Large Concessions
As an additional test of our model, we proxy for renegotia-tion using a dummy variable that takes on a value of 0 whenActual/Expected−1 is less than 1 and equals 1 otherwise. A 0 valueof the dummy variable represents cases in which airlines paid anamount smaller than their minimum contracted lease payment.27
We repeat the analysis in regression (2) using a probit model withthis dummy variable as a dependent variable.28
The last four columns of Table IX present the results. As canbe seen, our results are unchanged: Consistent with Prediction 1,in three of the four specifications airlines in poor financial con-dition are more likely to obtain concessions, as evidenced by ahigher probability of having a ratio of Actual/Expected−1 which isless than 1. Consistent with Prediction 2, conditional on LowCash= 1, reductions in all of the four redeployability measures are asso-ciated with a greater likelihood that an airline’s lease paymentsare smaller than its minimum contracted lease payments. Thecoefficients indicate that a standard-deviation reduction in theredeployability measures increases the likelihood of lease renego-tiation by between 14.2 and 36.4 percentage points, representingan increase of between 23.9% and 61.1% relative to the uncondi-tional mean event of large concessions.
V.F. 9/11 and Lease Renegotiations
Finally, we document the effect of the September 11, 2001,attacks on airline lease renegotiation. The 9/11 attacks shook theAmerican airline industry drastically and affected both cash flowsand liquidation values in the industry. Average profitability of air-lines in our sample was 13.31% in the period 1994–2000, and only4.77% in the period 2001–2005 (t-statistic for an equal means
27. In unreported results, we repeat this exercise with a 0.9 cutoff thresholdfor Actual/Expected−1 and obtain similar results.
28. We do not include airline fixed effects in the probit specification given theincidental parameters problem a fixed effects probit introduces (Wooldridge 2002).We find similar results using a linear probability model with airline fixed effects.

LIQUIDATION VALUES AND CONTRACT RENEGOTIATION 1671
test = 3.86). Similarly, liquidation values of aircraft declinedsharply after 9/11:
Prices for used jets are down as much as 40% since 2000, their lowest levelin at least 15 years. . . . The soft market for airplanes gives bankrupt airlinestremendous leverage when it comes to renegotiating their leases.29
We examine the implications of the 9/11 attacks for lease rene-gotiations. The attacks were an exogenous shock to the airlineindustry that affected both airline cash flows and liquidation val-ues. Because we cannot separate the effects of the exogenous 9/11shock on liquidation values and cash flows, we repeat the analy-sis in regression (2) using (Actual/Expected−1) as our dependentvariable and include a dummy variable that equals 1 for the years2001–2005 (Post-9/11), and 0 otherwise. As Table X demonstrates,the coefficients on the Post-9/11 dummy variable suggest thatcontractual lease obligations were reduced by approximately 13.0percentage points (t-statistics between −1.96 and −3.02). Fur-thermore, all our results hold after controlling for the Post-9/11dummy. Thus, the exogenous shock of the 9/11 attacks that af-fected both cash flows and liquidation values had a large impacton lease contract renegotiations.
VI. CONCLUSION
In this paper we analyze theoretically and empirically firms’ability to renegotiate financial obligations from an incomplete-contracting perspective. We provide a simple model showing thatfirms will be able to credibly renegotiate for better terms onlywhen their financial position is relatively poor, that firms’ abilityto reduce their prespecified commitments will increase when theliquidation values of their assets decrease, but, importantly, thatthis effect will be concentrated in those times when renegotia-tion is credible. We proceed by analyzing lease renegotiation in asample of publicly traded U.S. airlines. Our empirical results in-dicate that, consistent with the model, airlines in relatively poorfinancial position are able to renegotiate and reduce their leasepayments with lessors. Furthermore, using measures of fleet re-deployability as a proxy for the liquidation value lessors wouldobtain upon the default of an aircraft lease, we show that whenairlines are in poor financial condition, lower fleet redeployability
29. Kahn (2003).
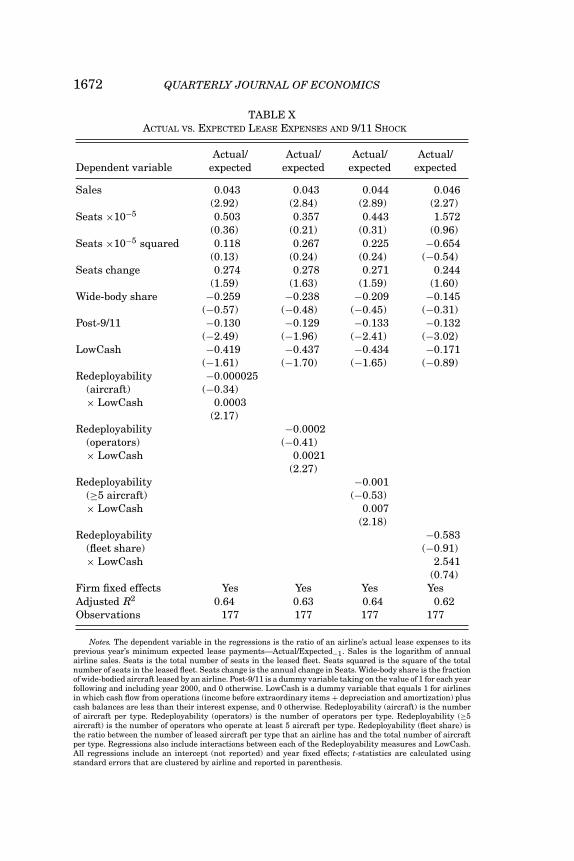
1672 QUARTERLY JOURNAL OF ECONOMICS
TABLE XACTUAL VS. EXPECTED LEASE EXPENSES AND 9/11 SHOCK
Actual/ Actual/ Actual/ Actual/Dependent variable expected expected expected expected
Sales 0.043 0.043 0.044 0.046(2.92) (2.84) (2.89) (2.27)
Seats ×10−5 0.503 0.357 0.443 1.572(0.36) (0.21) (0.31) (0.96)
Seats ×10−5 squared 0.118 0.267 0.225 −0.654(0.13) (0.24) (0.24) (−0.54)
Seats change 0.274 0.278 0.271 0.244(1.59) (1.63) (1.59) (1.60)
Wide-body share −0.259 −0.238 −0.209 −0.145(−0.57) (−0.48) (−0.45) (−0.31)
Post-9/11 −0.130 −0.129 −0.133 −0.132(−2.49) (−1.96) (−2.41) (−3.02)
LowCash −0.419 −0.437 −0.434 −0.171(−1.61) (−1.70) (−1.65) (−0.89)
Redeployability −0.000025(aircraft) (−0.34)× LowCash 0.0003
(2.17)Redeployability −0.0002
(operators) (−0.41)× LowCash 0.0021
(2.27)Redeployability −0.001
(≥5 aircraft) (−0.53)× LowCash 0.007
(2.18)Redeployability −0.583
(fleet share) (−0.91)× LowCash 2.541
(0.74)Firm fixed effects Yes Yes Yes YesAdjusted R2 0.64 0.63 0.64 0.62Observations 177 177 177 177
Notes. The dependent variable in the regressions is the ratio of an airline’s actual lease expenses to itsprevious year’s minimum expected lease payments—Actual/Expected−1. Sales is the logarithm of annualairline sales. Seats is the total number of seats in the leased fleet. Seats squared is the square of the totalnumber of seats in the leased fleet. Seats change is the annual change in Seats. Wide-body share is the fractionof wide-bodied aircraft leased by an airline. Post-9/11 is a dummy variable taking on the value of 1 for each yearfollowing and including year 2000, and 0 otherwise. LowCash is a dummy variable that equals 1 for airlinesin which cash flow from operations (income before extraordinary items + depreciation and amortization) pluscash balances are less than their interest expense, and 0 otherwise. Redeployability (aircraft) is the numberof aircraft per type. Redeployability (operators) is the number of operators per type. Redeployability (≥5aircraft) is the number of operators who operate at least 5 aircraft per type. Redeployability (fleet share) isthe ratio between the number of leased aircraft per type that an airline has and the total number of aircraftper type. Regressions also include interactions between each of the Redeployability measures and LowCash.All regressions include an intercept (not reported) and year fixed effects; t-statistics are calculated usingstandard errors that are clustered by airline and reported in parenthesis.

LIQUIDATION VALUES AND CONTRACT RENEGOTIATION 1673
increases their ability to reduce lease payments. Our evidence sup-ports the incomplete contracting literature in that the ability offirms to renegotiate their financial commitments depends heavilyon their bargaining position vis-a-vis liability holders. This bar-gaining position is determined, in turn, by both the credibility ofthreats made during renegotiation and by the outside option ofthe bargaining parties.
APPENDIX I
Proof. In this Appendix we solve for the SPE of the subgamebeginning after the Lessee has decided to trigger renegotiation.In doing so, we need only consider the case when C1 + L < l1 + l2.When this inequality does not hold, the Lessee clearly nevertriggers renegotiation because the Lessor can obtain full repay-ment through the court-imposed solution. We prove the followinglemma.
LEMMA. Assuming that C1 + L < l1 + l2, then in the SPE of thesubgame that begins after the Lessee triggers renegotiation,the Lessee immediately offers the Lessor a new schedule ofpayments (p1, p2) with p1 + p2 = C1 + 1/2(C2 + L) and p1 ≤C1. The Lessor accepts the offer, so that payoffs to the partiesare as follows: The Lessee obtains 1/2(C2 − L), and the Lessorobtains C1 + 1/2(C2 + L).
Proof. The lemma is a particular example of a standard resultin alternating-offers games (see, e.g., Rubenstein [1982]), whichshows that under certain conditions, the axiomatic Nash bargain-ing solution coincides with the subgame perfect equilibrium of thealternating-offer game. The proof is by backward induction. First,suppose that the value of the second-period cash flow has deterio-rated to a level below L. In this case, the only offer that the Lessorwill accept is one in which the Lessee liquidates the firm and paysout all proceeds, along with C1, to the Lessor, for a total paymentof C1 + L. This is because of the fact that the Lessor can guaran-tee C1 + L by refusing all offers and waiting for the court-imposedsolution, while the Lessee cannot offer more than this amountbecause of the deterioration of the second-period cash flow.30
By backward induction, to solve for the SPE, we can considera revised game in which the subgame following the point in which
30. Because C1 + L is assumed to be less than l1 + l2, the lessee obtains C1 + Lunder the court-imposed solution.

1674 QUARTERLY JOURNAL OF ECONOMICS
second-period cash flow equals L is replaced with a terminal nodehaving a payoff of C1 + L to the Lessor and a payoff of zero to theLessee. Consider, therefore, the game in which after a rejectionby either party, period 2 cash flow is reduced by (1/N) ∗ (C2 − L)(with N large) so that after N rejected offers, period 2 cash flowequals L and parties receive their terminal payoffs of C1 + L and0. Assume that, without loss of generality, the Lessor makes thefinal offer prior to second-period cash flow deteriorating to L andthat N is even. Finally, for convenience, we number the N roundsof alternating offers in reverse order with round N referring to theround in which the first offer is made, and round 1 referring tothe round in which the last offer is made, that is, prior to second-period cash flow deteriorating to L. Because the Lessee is notallowed to pay dividends until all lease obligations are fulfilled,we can analyze repayment schedules (p1, p2) based on their sum(p1 + p2). It should also be noted that because cash flows obtainedby the firm are not expropriable, at t = 2 the Lessee will never beable to renegotiate lease payments.
In the last round of the alternating offer process (round 1),second-period cash flow equals L + (1/N) ∗ (C2 − L). The Lessor’soptimal repayment-schedule offer has p1 + p2 = C1 + L + (1/N) ∗(C2 − L), which leaves 0 for the Lessee. It is optimal because theLessee is indifferent between accepting this offer and refusing it,because if he refuses, cash flow will deteriorate to L and he willobtain a terminal payoff of 0 anyway. Without loss of generality weassume that the Lessee accepts the offer. In round 2, in which it isthe Lessee’s turn to make an offer, second-period cash flow equalsL + (2/N) ∗ (C2 − L). To induce the lessor to accept a round 2 offer,the lessee must offer the lessor a payment schedule (p1, p2) withp1 + p2 ≥ C1 + L + (1/N) ∗ (C2 − L), as this is what the Lessor canguarantee by refusing the round 2 offer and proceeding to round1. The Lessee therefore offers p1 + p2 = C1 + L + (1/N) ∗ (C2 − L)leaving (1/N) ∗ (C2 − L) for himself, and the Lessor accepts. Thebackward induction solution continues to unravel in a similarmanner; in round i, the party making the offer—be it Lessor orLessee—offers to his counterpart the amount that the counter-part will obtain in round i − 1 and keeps the remaining surplus tohimself. Because in each round no rents are left on the table, everyperiod the offerer will increase his payoff by (1/N) ∗ (C2 − L),whereas the offeree will see no change in his payoff as comparedto the previous round. By induction, therefore, at every even-numbered round i, the SPE has the Lessee offering the Lessor a

LIQUIDATION VALUES AND CONTRACT RENEGOTIATION 1675
repayment schedule of p1 + p2 = C1 + L+ (i/2N) ∗ (C2−L), and theLessor accepting. Thus, at round N (the first round), the Lessoroffers the Lessee a payment schedule with a total payment of C1 +L + 1/2(C2 − L). Payoffs to the parties are as in Lemma 1.
Next, we prove Proposition 1 in Section II.
Proof. If the lessee is in financial distress in that (C1 + C2) <
(l1 + l2), he will obviously choose to renegotiate and obtain astrictly positive payoff rather than abide by the original contractand obtain a payoff of zero. In contrast, when the Lessee is notin financial distress, he will trigger renegotiation when his payofffrom doing so, 1/2(C2 − L), is greater than his payoff from abid-ing by the contract (C1 + C2) − (l1 − l2). This can be rearranged toyield equation (1) of Proposition 1. If renegotiation does not occurand C1 < l1, the only way to pay l1 at t = 1 is by raising additionalcapital against t = 2 cash flow. This is feasible, however, becausecase (b) of the proposition has C1 + C2 > l1 + l2.
APPENDIX II. REDEPLOYABILITY AND AIRLINE CHARACTERISTICS
RedeployabilityDependent Redeployability Redeployability (no. of operators Redeployabilityvariable (no. of aircraft) (no. of operators) ≥5 aircraft) (fleet share)
Sales 20.80 −2.21 0.233 0.013(0.59) (−0.51) (0.15) (1.33)
Seats × 10−5 −854.51 −199.88 −41.90 0.400(−0.85) (−1.27) (−0.93) (1.65)
Wide-body 383.85 72.04 26.64 0.012(0.48) (0.57) (0.66) (0.07)
Profitability −43.74 −0.067 −3.67 0.002(−0.11) (−0.00) (−0.25) (0.05)
Bankruptcy −101.70 −21.56 −3.29 0.011(−0.51) (−0.70) (−0.33) (0.48)
Firm fixed Yes Yes Yes Yeseffects
Adjusted R2 0.89 0.88 0.89 0.77Observations 213 213 213 213
Notes. This table regresses fleet redeployability measures on airline characteristics. Redeployability(aircraft) is the number of aircraft per type; Redeployability (operators) is the number of operators pertype, Redeployability (≥5 aircraft) is the number of operators who operate at least 5 aircraft per type. Salesis the logarithm of annual airline sales. Seats is the total number of seats in the aircraft leased by the airline.Wide-body is the fraction of wide-bodied aircraft leased by the airline. Profitability is operating income beforedepreciation divided by the book value of assets. Bankruptcy is a dummy variable taking on the value of 1 inthose years in which an airline is under the protection of Chapter 11, and 0 otherwise. All regressions includean intercept (not reported) as well as year fixed effects; t-statistics are calculated using standard errors thatare clustered by airline and reported in parenthesis.

1676 QUARTERLY JOURNAL OF ECONOMICS
HARVARD UNIVERSITY AND NBERMIT SLOAN SCHOOL OF MANAGEMENT
REFERENCES
Acharya, Viral, Sreedhar Bharath, and Anand Srinivasan, “Does Industry-wideDistress Affect Defaulted Firms?—Evidence from Creditor Recoveries,” Jour-nal of Financial Economics, 85 (2007), 787–821.
Aghion, Philippe, and Patrick Bolton, “An Incomplete Contracts Approach to Fi-nancial Contracting,” Review of Economic Studies, 59 (1992), 473–494.
Asquith, Paul, Robert Gertner, and David Scharfstein, “Anatomy of Financial Dis-tress: An Examination of Junk-Bond Issuers,” Quarterly Journal of Economics,109 (1994), 625–658.
Baird, Douglas, G., and Randal C., Picker, “A Simple Noncooperative BargainingModel of Corporate Reorganizations,” Journal of Legal Studies, 20 (1991),311–349.
Baird, Douglas, G., and Robert K. Rasmussen, “Reply Chapter 11 at Twilight,”Stanford Law Review, 56 (2003), 673–699.
Bebchuck, Lucian A., and Howard F. Chang, “Bargaining and the Division ofValue in Corporate Reorganizations,” Journal of Law, Economics, and Orga-nizations, 8 (1992), 253–279.
Benmelech, Efraim, “Asset Salability and Debt Maturity: Evidence from 19th Cen-tury American Railroads,” Review of Financial Studies, forthcoming, 2008.
Benmelech, Efraim, and Nittai K. Bergman “Collateral Pricing,” Journal of Finan-cial Economics, forthcoming, 2008.
Benmelech, Efraim, Mark J. Garmaise, and Tobias J. Moskowitz, “Do LiquidationValues Affect Financial Contracts? Evidence from Commercial Loan Contractsand Zoning Regulation,” Quarterly Journal of Economics, 120 (2005), 1121–1154.
Bergman, Nittai K., and Daniel Nicolaievsky, “Investor Protection and the CoasianView,” Journal of Financial Economics, 84 (2007), 738–771.
Bergman, Yaacov Z., and Jeffery L. Callen, “Opportunistic Underinvestment inDebt Renegotiation and Capital Structure,” Journal of Financial Economics,29 (1991), 137–171.
Bolton, Patrick, and David Scharfstein, “Optimal Debt Structure with MultipleCreditors,” Journal of Political Economy, 104 (1996), 1–26.
Buhler, Gregory W., “Airline Bankruptcies and Workouts: Lessons Learned,”Schnader Harrison Segal & Lewis LLP, April 2003.
Carey, Susan, “American Airlines’ TWA Financing Plan Is Approved, AlthoughRivals Cry Foul,” Wall Street Journal, January 29, 2001, A3.
Eisfeldt, Andrea, and Adriano Rampini, “Leasing, Ability to Repossess, and DebtCapacity,” Review of Financial Studies, forthcoming, 2008.
Eraslan, K. K. Hulya, “Corporate Bankruptcy Reorganizations: Estimates from aBargaining Model,” International Economic Review, 49 (2008), 659–681.
Gavazza, Alessandro, “Asset Liquidity, Boundaries of the Firm and Financial Con-tracts: Evidence from Aircraft Leases,” Working Paper, Yale University, 2006.
Gromb, Denis, “Renegotiation in Debt Contracts,” Working Paper, Universite Librede Bruxelles, 1995.
Hart, Oliver, Firms, Contracts, and Financial Structure (Oxford: Oxford UniversityPress, 1995).
Hart, Oliver, and John Moore, “A Theory of Debt Based on the Inalienability ofHuman Capital,” Quarterly Journal of Economics, 109 (1994), 841–879.
——, “Default and Renegotiation: A Dynamic Model of Debt,” Quarterly Journalof Economics, 113 (1998), 1–41.
Kahn, Jeremy, “The Great Airline Leasing Disaster,” Fortune, January 20, 2003.Kaplan, Steven N., and Per Stromberg, “Financial Contracting Theory Meets the
Real World: An Empirical Analysis of Venture Capital Contracts,” Review ofEconomic Studies, 70 (2003), 281–315.
Pulvino, Todd C., “Do Fire-Sales Exist? An Empirical Investigation of CommercialAircraft Transactions,” Journal of Finance, 53 (1998), 939–978.

LIQUIDATION VALUES AND CONTRACT RENEGOTIATION 1677
——, “Effects of Bankruptcy Court Protection on Asset Sales,” Journal of FinancialEconomics, 52 (1999), 151–86.
Rubinstein, Ariel, “Perfect Equilibrium in a Bargaining Model,” Econometrica, 50(1982), 97–110.
Shleifer, Andrei, and Robert W. Vishny, “Liquidation Values and Debt Capacity: AMarket Equilibrium Approach,” Journal of Finance, 47 (1992), 143–166.
Stromberg, Per, “Conflicts of Interests and Market Illiquidity in Bankruptcy Auc-tions: Theory and Tests,” Journal of Finance, 55 (2000), 2641–2692.
Wooldridge, Jeffrey M., Econometric Analysis of Cross Section and Panel Data(Cambridge, MA, and London: MIT Press, 2002).