evidence of extrapancreatic glucagon secretion in...
TRANSCRIPT

Asger Lund,1,2 Jonatan I. Bagger,1,2 Nicolai J. Wewer Albrechtsen,2,3
Mikkel Christensen,1,2 Magnus Grøndahl,1 Bolette Hartmann,2 Elisabeth R. Mathiesen,4
Carsten P. Hansen,5 Jan H. Storkholm,5 Gerrit van Hall,6 Jens F. Rehfeld,7
Daniel Hornburg,3 Felix Meissner,3 Matthias Mann,3,8 Steen Larsen,1 Jens J. Holst,2
Tina Vilsbøll,1 and Filip K. Knop1,2
Evidence of Extrapancreatic GlucagonSecretion in ManDiabetes 2016;65:585–597 | DOI: 10.2337/db15-1541
Glucagon is believed to be a pancreas-specific hor-mone, and hyperglucagonemia has been shown tocontribute significantly to the hyperglycemic state ofpatients with diabetes. This hyperglucagonemia hasbeen thought to arise from a-cell insensitivity to sup-pressive effects of glucose and insulin combined withreduced insulin secretion. We hypothesized that postab-sorptive hyperglucagonemia represents a gut-dependentphenomenon and subjected 10 totally pancreatectomizedpatients and 10 healthy control subjects to a 75-g oralglucose tolerance test and a corresponding isoglycemicintravenous glucose infusion. We applied novel analyti-cal methods of plasma glucagon (sandwich ELISA andmass spectrometry–based proteomics) and show that29–amino acid glucagon circulates in patients withouta pancreas and that glucose stimulation of the gastro-intestinal tract elicits significant hyperglucagonemia inthese patients. These findings emphasize the existenceof extrapancreatic glucagon (perhaps originating fromthe gut) in man and suggest that it may play a role indiabetes secondary to total pancreatectomy.
Patients with diabetes are characterized not only bycompromised insulin secretion and action but also byelevated plasma concentrations of the 29–amino acidpeptide hormone glucagon, which hitherto has been
considered a pancreas-derived hormone in humans(produced in and secreted from a-cells in the islet ofLangerhans) (1). In patients with diabetes, plasma con-centrations of glucagon are elevated in the fasting stateand fail to decrease appropriately or even increase in re-sponse to an oral glucose tolerance test (OGTT) and showexaggerated increases in response to ingestion of amixed meal (1,2). The elevated glucagon concentrationsincrease the hepatic glucose production and therebycontribute significantly to the fasting and postpran-dial hyperglycemia characterizing patients with diabe-tes. The etiology behind diabetic hyperglucagonemia isstill controversial. Whereas oral intake of glucose elicits ahyperglucagonemic response, intravenous glucose adminis-tration causes suppression of plasma glucagon levels (3,4).A “lighter version” of this phenomenon has also beenobserved in healthy individuals after ingestion of largeroral glucose loads (4). Together, these findings ledus to speculate that postprandial hyperglucagonemiacould be gut derived and independent of the endocrinepancreas.
The notion of extrapancreatic glucagon secretion inman has been debated for years, and several studieslooking at glucagon responses after total pancreatectomyin animals (5–10) and man (11–24) have been published.Overall, these investigations have reported very conflicting
1Center for Diabetes Research, Gentofte Hospital, University of Copenhagen,Hellerup, Denmark2The Novo Nordisk Foundation Center for Basic Metabolic Research and Depart-ment of Biomedical Sciences, Faculty of Health and Medical Sciences, Universityof Copenhagen, Copenhagen, Denmark3Department of Proteomics and Signal Transduction, Max Planck Institute ofBiochemistry, Martinsried, Germany4Center for Pregnant Women with Diabetes, Department of Endocrinology,Rigshospitalet, University of Copenhagen, Copenhagen, Denmark5Department of Gastrointestinal Surgery, Rigshospitalet, University of Copenha-gen, Copenhagen, Denmark6Clinical Metabolomics Core Facility, Rigshospitalet, University of Copenhagen,Copenhagen, Denmark
7Department of Clinical Biochemistry, Rigshospitalet, University of Copenhagen,Copenhagen, Denmark8The Novo Nordisk Foundation Center for Protein Research, Proteomics Program,University of Copenhagen, Copenhagen, Denmark
Corresponding author: Filip K. Knop, [email protected].
Received 6 November 2015 and accepted 6 December 2015.
Clinical trial reg. no. NCT02006459, clinicaltrials.gov.
This article contains Supplementary Data online at http://diabetes.diabetesjournals.org/lookup/suppl/doi:10.2337/db15-1541/-/DC1.
© 2016 by the American Diabetes Association. Readers may use this article aslong as the work is properly cited, the use is educational and not for profit, andthe work is not altered.
Diabetes Volume 65, March 2016 585
METABOLISM

results. One of the main challenges is that many of theglucagon assays suffer from shortcomings, and until re-cently, analytical methods have not been sufficientlysensitive or specific to justify decisive statements aboutthe absence or presence of extrapancreatic fully pro-cessed 29–amino acid glucagon (24). Recently, however,sandwich ELISAs using a combination of C- and N-terminalantiglucagon antibodies, and thus in theory eliminatingcross-reactivity with elongated or truncated forms ofglucagon, have become available (25). Furthermore, tech-nical advances have made it possible to detect low-abundantpeptides, such as glucagon, in human plasma by massspectrometry–based proteomics (26,27). Applying thesenovel techniques, we aimed to investigate whether post-absorptive hyperglucagonemia occurs independently offunctioning pancreatic islets and plasma glucose andinsulin concentrations by measuring plasma concentrationsof 29–amino acid glucagon in totally pancreatectomizedpatients and healthy control subjects after 75-g OGTTand isoglycemic intravenous glucose infusion (IIGI).
RESEARCH DESIGN AND METHODS
Study DesignThis study examined glucagon responses in totally pancre-atectomized patients and healthy control subjects duringOGTT and IIGI. The study was conducted at the Center forDiabetes Research (Gentofte Hospital), approved by theEthics Committee of the Capital Region of Denmark (reg.no. H-1-2012-123), and conducted in accordance with theprinciples of the Declaration of Helsinki (Seventh Revision,2013).
Study ParticipantsTen totally pancreatectomized patients (age [mean6 SD]:59.8 6 9.9 years; BMI: 21.5 6 4.3 kg/m2; HbA1c: 67.3 611.0 mmol/mol; time since operation: 4.6 6 4.5 years)and 10 age-, sex-, and BMI-matched healthy control sub-jects (age: 58.4 6 5.0 years; BMI: 22.9 6 2.4 kg/m2;HbA1c: 34.6 6 6.2 mmol/mol) without any family historyof diabetes were studied. Clinical characteristics of thetotally pancreatectomized subjects are displayed in Table 1,and a schematic illustration of the anatomy before and aftersurgery (28) is depicted in Fig. 1.
Experimental ProceduresAfter an initial screening visit, participants were ex-amined on two study days separated by at least 72 h.Subjects were studied after an overnight (10 h) fast, andpatients were instructed to take their normal daily insulindoses the day before but not to take any insulin on themorning of the experimental day. On the 1st day, a 75-gOGTT was performed. Participants were placed in arecumbent position and cannulas were inserted in cubitalveins, one for infusion of stable isotopes and one in thecontralateral vein for collection of arterialized bloodwith the hand wrapped in a heating pad (;50°C). Attime2120 min, an infusion of stable isotopes (CambridgeIsotope Laboratories, Tewksbury, MA) with [6,6-D2]glucose
(priming dose of 17.6 mmol 3 kg21 3 ϒ/5, where ϒstands for fasting plasma glucose in mmol/L, and contin-uous infusion of 0.6 mmol 3 kg21 3 min21) and[1,1,2,3,3-D5]glycerol (priming dose of 2.0 mmol 3 kg21
and continuous infusion of 0.1 mmol 3 kg21 3 min21)was initiated. Over the first 10 min (time 0–10 min), theparticipants ingested 75 g glucose (71.5 g + 3.5 g [U-13C6]glucose) dissolved in 250 mL water. Blood samples weredrawn 120, 45, 30, 15, and 0 min before and 5, 10, 15, 20,25, 30, 40, 50, 60, 70, 80, 90, 120, 150, and 180 min afterinitiation of glucose ingestion. At the very end of theexperiment, patients took half their normal basal insulindose and prandial insulin according to blood glucoselevels. At the 2nd experimental day, an IIGI (20% weightfor volume) was performed, aiming at duplicating theplasma glucose profile attained in the same individualduring the OGTT. Other procedures were as on the firststudy day, except for more frequent plasma glucose sam-pling (every 5 min) in order to adjust the glucose infusionrate to obtain isoglycemia. Plasma glucose concentrationswere measured bedside using the glucose oxidase method(YSI 2300 STAT PLUS analyzer; YSI, Yellow Springs,OH). Plasma glucagon concentrations were assayed witha sandwich ELISA using N- and C-terminal–specificglucagon antibodies (Mercodia AB, Uppsala, Sweden)(25). Gel chromatography of plasma was performed aspreviously described (29). High-performance liquid chro-matography (HPLC) and mass spectrometry–based pro-teomics were performed for the analysis of glucagon.C-peptide concentrations were measured using a two-sided electrochemiluminescence immunoassay (SiemensHealthcare, Ballerup, Denmark). Plasma enrichmentof [6,6-D2]glucose, [U-
13C6]glucose, and [1,1,2,3,3-D5]glycerol was determined using liquid chromatography–tandem mass spectrometry (LC-MS/MS) as previouslydescribed (30). Amidated gastrin and cholecystokinin(CCK), total glucose-dependent insulinotropic polypep-tide (GIP), total glucagon-like peptide 1 (GLP-1), andGIP(1-30) were measured with radioimmunoassays (RIAs).Oxyntomodulin was measured using a sandwich ELISA.Further details about analytical procedures are availablein the Supplementary Data.
Calculations and Statistical AnalysisArea under the curves (AUCs) were calculated using thetrapezoidal rule. Gastrointestinal-mediated glucose disposal(GIGD) was calculated from the amount of glucose ingestedduring the OGTT related to the amount administered duringthe IIGI using the following formula: GIGD (%) = 100% 3(glucoseOGTT 2 glucoseIIGI)/glucoseOGTT (31). Glucose rate ofappearance (Ra) and rate of disappearance (Rd) were calcu-lated from changes in glucose enrichment using the one-compartment, fixed-volume, non–steady-state model ofSteele and modified for use with stable isotopes and avarying pool fraction ranging from 70 to 200 mL 3 kg21,taking into account the high blood glucose levels of totallypancreatectomized patients (32). Results are reported as
586 Extrapancreatic Glucagon Diabetes Volume 65, March 2016

mean 6 SEM unless otherwise stated. Group differencesin baseline characteristics and AUCs were evaluatedusing two-sample Student t test (two-tailed). Linearmixed effect modeling was applied for analysis of re-peated measures with data transformed according todistribution pattern. A homogeneous or heterogeneous
autoregressive residual covariance structure for the re-peated measurements was chosen according to theAkaike information criteria. Statistics were performedin GraphPad Prism version 6.0 (GraphPad Software,La Jolla, CA) and the statistical software package SASversion 9.3 (SAS Institute, Cary, NC). A two-sided
Table 1—Clinical characteristics of the totally pancreatectomized patients
PatientSex(M/F)
Years sinceoperation BMI (kg/m2)
Insulintreatment (IU) Reason for surgery Other treatment
1 M 1.4 20.3 Insulin detemir Pancreatitis Creon* 65,000 33; plus 25,000to in-between meal–snacks16 + 5Buprenorphine 0.2 mg 32Insulin aspartCholecalciferol 20 mg 317 + 4 + 4
2 M 4 29.3 Insulin detemir Neuroendocrine tumor Creon 45,000 + 50,000 + 50,000; plus 35,000to in-between meal–snacks26 + 14Lansoprazole 30 mg 31Insulin aspartCholecalciferol 20 mg 318 + 6 + 8
Acetaminophen 500 mg 36Glucosamine 400 mg 31
3 F 4.5 18.0 Insulin glargine Adenocarcinoma Creon 35,000 33; plus 35,000to in-between meal–snacks13 + 0Levothyroxine 100 mg 32Insulin aspartLansoprazole 30 mg 313 + 3 + 5
4 F 1 17.5 Insulin detemir Adenocarcinoma Creon 25,000 33; plus 10,000to in-between meal–snacks9 + 6Pantoprazole 40 mg 32Insulin aspartMetoprolol 50 mg 314 + 2 + 3Calcium 500 mg 31
Cholecalciferol 10 mg 31
5 M 4.3 25.0 Insulin degludec Adenocarcinoma Creon 25,000 33; plus 10,000to in-between meal–snacks0 + 10
Insulin aspart10 + 10 + 5
6 F 4.3 23.6 Insulin detemir Adenocarcinoma Creon 35,000 33; plus 10,000to in-between meal–snacks12 + 24Pantoprazole 40 mg 31Insulin aspart
Bendroflumethiazide (1.25 mg) +kaliumchlorid (573 mg)
7 + 7 + 7
7 M 4 25.4 Insulin detemir Adenocarcinoma Creon 50,000 33; plus 35,000to in-between meal–snacks8 + 10Lansoprazole 30 mg 32Insulin aspart
12 + 6 + 10
8 F 3.7 17.7 Insulin detemir Mucinous cystadenoma Creon 40,000 33; plus 20,000to in-between meal–snacks20 + 6Hydroxocobalamin 1 mg 31
every 2 monthsInsulin aspart3 + 2 + 2
9 M 17.0 16.4 Insulin glargine Adenocarcinoma Creon 75,000 33; plus 50,000–75,000to in-between meal–snacks0 + 15Acetaminophen 500 mg 36Insulin aspart
Morphine 30 mg 326 + 8 + 6Isosorbidmononitrate 60 mg 31
10 F 2.0 21.9 Insulin detemir Adenocarcinoma Creon 80,000 33; plus 35,000to in-between meal–snacks12 + 6Pantoprazole 40 mg 32Insulin aspartLoperamide 2 mg 324 + 4 + 4
IU, international unit. *Creon (pancreas enzyme replacement therapy): 40,000: 25,000 EP-e amylase, 40,000 EP-e lipase, and1,600 EP-e protease; Creon 25,000: 18,000 EP-e amylase, 25,000 EP-e lipase, and 1,000 EP-e protease; Creon 10,000: 8,000EP-e amylase, 10,000 EP-e lipase, and 600 EP-e protease.
diabetes.diabetesjournals.org Lund and Associates 587

P value ,0.05 was used to indicate statistically significantdifferences. Further details about calculations and statisticalanalysis are available in the Supplementary Data.
RESULTS
Plasma GlucoseAfter the 75-g OGTT, a mean peak concentration of27.9 6 1.4 mmol/L was reached at time point 150 min inthe totally pancreatectomized patients compared with amean peak concentration of 9.1 6 0.5 mmol/L at timepoint 60 min in the healthy control subjects (Fig. 2A).The individually adjustable intravenous glucose infusionsresulted in glucose excursions over time similar to thoseduring the corresponding OGTT (isoglycemia) in boththe pancreatectomy group and the control group (Fig.2A and Table 2). The total amount of glucose infusedduring the IIGI, copying the plasma glucose excursionsfrom the 75-g OGTT, amounted to 28.5 6 1.8 g in thecontrol group and 83.3 6 3.1 g in the pancreatectomygroup (142 6 9 and 416 6 19 mL of 20% weight forvolume glucose solution, respectively; P , 0.001), corre-sponding to a GIGD of 62.0 6 2.4% in the control groupand 211.0 6 5.0% in the pancreatectomy group (P ,0.001), both different from 0% (P , 0.001 and P = 0.05,respectively).
C-Peptide and Pancreatic PolypeptideC-peptide and pancreatic polypeptide (PP) concentrationsin the totally pancreatectomized patients were belowdetection limit of the assays (,16 and ,0.5 pmol/L, re-spectively) at all time points on both days (Fig. 2C and Dand Table 2), except for one patient (operated because ofa neuroendocrine tumor in the pancreas) showing verylow levels of C-peptide (lower than what is needed todefine C-peptide negativity) in the last hour of both studydays (41 pmol/L at time point 180 min during the OGTTand 37 pmol/L at time point 150 min during the IIGI).Other end points, including glucagon, were not differentin this patient compared with the mean group values, and
thus this patient was kept in for the following analyses.As expected, the control group responded with signifi-cantly larger C-peptide and PP responses during theOGTT compared with the IIGI.
GlucagonIn the totally pancreatectomized patients, basal con-centrations of glucagon were above the detection limit(1 pmol/L) of the applied sandwich ELISA (P , 0.001),with levels tending to be lower compared with the healthycontrol subjects although without reaching statistical sig-nificance (Fig. 3A and Table 2). After OGTT, the totallypancreatectomized patients responded with significantsecretion of glucagon, resulting in mean peak levels of18.8 6 3.0 pmol/L (at time point 30 min), whereas im-mediate suppression of glucagon concentrations was seenafter initiation of the intravenous glucose infusion (Fig.3A and B). The healthy control subjects responded withsignificant suppression of glucagon concentrations onboth the OGTT day and the IIGI day, but glucagon sup-pression after oral glucose was delayed compared withduring intravenous glucose infusion, in line with previousobservations (4,33). To verify that the observed glucagonresponses in the pancreatectomy group were in fact dueto the presence of 29–amino acid glucagon, we performedaffinity chromatography (Fig. 3C) and HPLC fractionationof pooled plasma samples from the OGTT day, from base-line, and from time point 30 min where glucagon concen-trations peaked (Fig. 3D), followed by LC-MS/MS analysis(Fig. 3E). Peptide intensities for the glucagon sequenceincreased significantly (P , 0.001) from baseline totime point 30 min during the OGTT. LC-MS/MS analysistherefore confirmed that fully processed 29–amino acidglucagon was present at baseline and that concentrationsincreased considerably during OGTT in the totally pancre-atectomized patients.
Glucose and Glycerol KineticsBaseline levels of glucose Ra and Rd were higher in thetotally pancreatectomized patients compared with the
Figure 1—Illustration of the changed anatomy after total pancreatectomy operation. Left: The anatomy before operation, with the lightblue–colored organs indicating the organs being removed during surgery. Right: The anatomy after surgery.
588 Extrapancreatic Glucagon Diabetes Volume 65, March 2016

healthy control subjects (P , 0.001, for both measures)(Fig. 4A and B). In the pancreatectomy group, Rd ofglucose was higher during IIGI compared with OGTT(P = 0.005), driven partly by a higher glucose excretionin the urine during the IIGI (15.6 6 2.9 vs. 12.3 62.3 g; P = 0.01). Ra of glucose over time was also higherduring IIGI compared with OGTT in the pancreatec-tomy group (P = 0.02). Baseline levels of endogenous Ra
of glucose were higher in the totally pancreatectomizedpatients compared with the healthy control subjects(P , 0.001) and not different between study days ineach group (Fig. 4C). Suppression of endogenous Ra
was enhanced during IIGI compared with OGTT inboth groups, reflecting a mean difference between the2 days in endogenous glucose production (EGP) over3 h of 16.5 6 2.3 g in the pancreatectomy group and6.0 g 6 1.0 g in the control group (P = 0.001). Basalconcentrations of plasma glycerol were higher in the totallypancreatectomized patients compared with the healthycontrol subjects (146 6 22 vs. 80 6 13 mmol/L; P =0.022), but within each group, no difference in responses
over time between study days was observed (Fig. 4D).Plasma glycerol concentrations in the control groupwere significantly reduced (to ;50% of baseline levels)after both OGTT and IIGI, whereas no significant changesover time were seen in the pancreatectomy group. Meanlevels of Ra and Rd, respectively, for glycerol (Fig. 4E andF) were higher in the pancreatectomy group comparedwith the control group, likely explained by the insulin-deficient state of the patients.
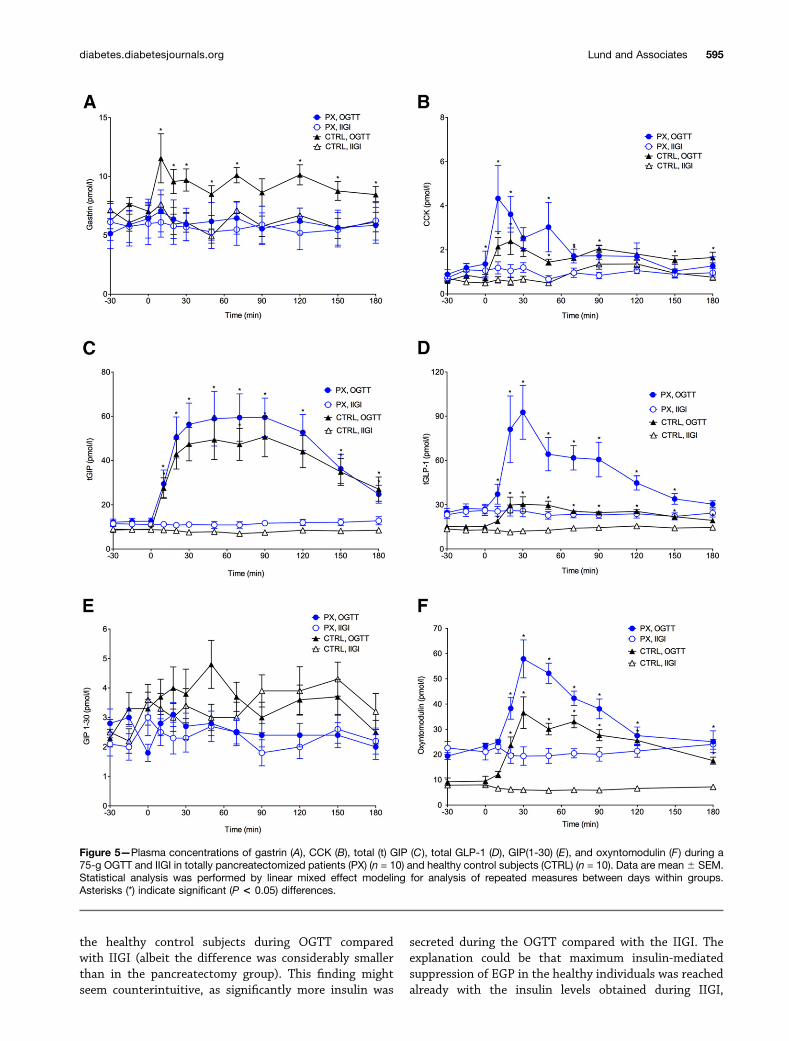
Gastrin and CCKThe control group responded with significant secretion ofgastrin after OGTT, whereas no change from baseline wasobserved during IIGI (Fig. 5A and Table 2). In the pancre-atectomy group, no differences in gastrin concentrationswere observed over time, during either OGTT or IIGI (P =NS). However, total AUC (but not baseline-subtracted AUC)was greater during OGTT compared with IIGI. Gastrin re-sponses over time during OGTT were greater in the controlgroup compared with the pancreatectomy group (P = 0.01).Significantly higher responses of CCK were observed in
Figure 2—Plasma glucose concentrations (A), glucose infusions during IIGI depicted as bar graphs (B), and serum/plasma responses ofC-peptide (C) and PP (D) during 75-g OGTT and IIGI, respectively, in totally pancreatectomized patients (PX) (n = 10) and healthy controlsubjects (CTRL) (n = 10). Data are mean6 SEM. Statistical analysis was performed by linear mixed effect modeling for analysis of repeatedmeasures between days within groups. Asterisks (*) indicate significant (P < 0.05) differences.
diabetes.diabetesjournals.org Lund and Associates 589

Table 2—Glucose and hormonal responses
Healthy control subjects Pancreatectomized patients P
GlucoseMean baseline (mmol/L) 5.1 6 0.1 11.5 6 1.1 ,0.001AUC (mmol/L 3 3 h)75-g OGTT 1,276 6 39 4,122 6 254 ,0.001IIGI 1,273 6 36 4,154 6 248 ,0.001P 0.79 0.10
bsAUC (mmol/L 3 3 h)75-g OGTT 358 6 43 2,022 6 111 ,0.001IIGI 373 6 42 2,120 6 133 ,0.001P 0.46 0.33
C-peptideMean baseline (pmol/L) 384.9 6 38.2 #16.0 6 0.0 ,0.001AUC (nmol/L 3 3 h)75-g OGTT 341.2 6 44.8 3.1 6 0.1 ,0.001IIGI 167.1 6 19.3 2.9 6 0.1 ,0.001P ,0.001 0.17
bsAUC (nmol/L 3 3 h)75-g OGTT 266.4 6 38.8 0.2 6 0.1 ,0.001IIGI 103.3 6 14.1 0.01 6 0.01 ,0.001P ,0.001 0.17
PPMean baseline (pmol/L) 16.6 6 2.6 #0.5 6 0.0 ,0.001AUC (pmol/L 3 3 h)75-g OGTT 4,331 6 672 90.1 6 0.1 ,0.001IIGI 1,927 6 332 96.0 6 4.6 ,0.001P ,0.001 0.22
bsAUC (pmol/L 3 3 h)75-g OGTT 350 6 99 20.9 6 0.8 0.006IIGI 254 6 95 3.2 6 2.5 0.56P 0.019 0.18
GlucagonMean baseline (pmol/L) 8.3 6 1.5 5.4 6 0.2 0.087AUC (pmol/L 3 3 h)75-g OGTT 1,019 6 228 2,418 6 231 ,0.001IIGI 867 6 196 465 6 56 0.075P 0.23 ,0.001
bsAUC (pmol/L 3 3 h)75-g OGTT 2367 6 86 1,383 6 170 ,0.001IIGI 2784 6 139 2449 6 72 ,0.001P 0.022 ,0.001
GastrinMean baseline (pmol/L) 6.8 6 0.6 5.9 6 1.5 0.58AUC (pmol/L 3 3 h)75-g OGTT 1,674 6 138 1,088 6 251 0.059IIGI 1,107 6 114 1,011 6 253 0.74P ,0.001 0.015
bsAUC (pmol/L 3 3 h)75-g OGTT 417 6 114 40 6 30 0.009IIGI 291 6 56 262 6 53 0.71P 0.011 0.15
CCKMean baseline (pmol/L) 0.7 6 0.1 1.1 6 0.2 0.095AUC (pmol/L 3 3 h)75-g OGTT 317 6 30 363 6 73 0.58IIGI 169 6 18 172 6 27 0.95P ,0.001 ,0.001
bsAUC (pmol/L 3 3 h)75-g OGTT 189 6 41 156 6 62 0.67IIGI 64 6 17 21.2 6 29 0.073P 0.08 0.03
Continued on p. 591
590 Extrapancreatic Glucagon Diabetes Volume 65, March 2016

both groups during OGTT compared with IIGI (Fig. 5B andTable 2). However, no significant differences in CCKresponses over time were observed between the pancre-atectomy group and the control group during OGTT(P = 0.13).
Incretin HormonesBasal concentrations of GIP were similar on the two studydays in each group but tended to be higher in the totallypancreatectomized patients compared with the healthycontrol subjects (Fig. 5C and Table 2). During OGTT,significant GIP responses were observed in both groups,with no significant differences between the two groups.Basal concentrations of GLP-1 (from enteroendocrineL cells) were significantly higher in the pancreatectomy
group compared with the control group (Fig. 5D andTable 2). GLP-1 responses during OGTT were largerin the pancreatectomy group compared with the con-trol group (P , 0.001), with a threefold higher peakvalue at time point 30 min (92 6 18 vs. 30 6 5 pmol/L;P = 0.008).
GIP(1-30)Basal concentrations of GIP(1-30), argued to be a productof prohormone convertase 2 (PC2) processing of pro-GIPin pancreatic a-cells and therefore not secreted fromthe enteroendocrine K cells from where the major iso-form GIP(1-42) is secreted (34), were similar betweenstudy days in each group and not different betweengroups (Table 2). Responses over time were similar
Table 2—Continued
Healthy control subjects Pancreatectomized patients P
GIPMean baseline (pmol/L) 8.8 6 1.0 11.8 6 1.1 0.053AUC (pmol/L 3 3 h)75-g OGTT 7,432 6 1,108 8,598 6 1,374 0.52IIGI 1,439 6 164 2,086 6 246 0.044P ,0.001 ,0.001
bsAUC (pmol/L 3 3 h)75-g OGTT 5,848 6 1,006 6,366 6 1,331 0.76IIGI 2157 6 117 58 6 105 0.19P ,0.001 0.001
GLP-1Mean baseline (pmol/L) 14.2 6 0.6 25.7 6 2.8 0.0025AUC (pmol/L 3 3 h)75-g OGTT 4,454 6 226 9,557 6 1,170 0.0017IIGI 2,500 6 113 4,278 6 424 0.0022P ,0.001 ,0.001
bsAUC (pmol/L 3 3 h)75-g OGTT 1,712 6 305 4,799 6 898 0.0076IIGI 142 6 135 2209 6 218 0.19P ,0.001 ,0.001
GIP(1-30)Mean baseline (pmol/L) 3.1 6 0.4 2.4 6 0.3 0.19AUC (pmol/L 3 3 h)75-g OGTT 650 6 84 416 6 50 0.061IIGI 639 6 62 414 6 66 0.023P 0.84 0.24
bsAUC (pmol/L 3 3 h)75-g OGTT 32 6 12 211 6 16 0.06IIGI 133 6 84 29 6 10 0.13P 0.25 0.98
OxyntomodulinMean baseline (pmol/L) 8.7 6 1.1 21.6 6 1.8 ,0.001AUC (pmol/L 3 3 h)75-g OGTT 4,590 6 300 6,442 6 505 0.007IIGI 1,154 6 61 3,816 6 391 ,0.001P ,0.001 0.002
bsAUC (pmol/L 3 3 h)75-g OGTT 2,907 6 328 2,590 6 469 0.59IIGI 2277 6 152 2117 6 274 0.62P ,0.001 ,0.001
Responses of glucose, C-peptide, PP, glucagon, gastrin, CCK, GIP, GLP-1, GIP(1-30), and oxyntomodulin during a 75-g OGTT and IIGIin totally pancreatectomized patients (n = 10) and healthy control subjects (n = 10). Data are mean 6 SEM. Statistical analysis wasperformed by two-sample Student t test (two-tailed), paired or unpaired. bsAUC, baseline-subtracted AUC.
diabetes.diabetesjournals.org Lund and Associates 591

Figure 3—Plasma responses of glucagon (A) and glucagon expressed as baseline-subtracted AUC (bsAUC) (B) during 75-g OGTT and IIGIin totally pancreatectomized patients (PX) (n = 10) and healthy control subjects (CTRL) (n = 10). Gel chromatography of pooled plasma (C )from time point 30 min during the 75-g OGTT in the pancreatectomy group (n = 10) analyzed using a C-terminal–specific glucagon assay(blue) and quality calibrators (black). A single peak (blue hatched area) with similar coefficient of distribution (KD) to that of the glucagoncalibrator control was identified. HPLC profile of pooled plasma (D) from fasting and from time point 30 min during the 75-g OGTT from the
592 Extrapancreatic Glucagon Diabetes Volume 65, March 2016

between days in both the pancreatectomy group andthe control group (P = 0.59 and P = 0.49, respectively),and likewise no differences in responses over timewere observed between groups during OGTT (P =0.09) (Fig. 5E).
OxyntomodulinBasal concentrations of the enteroendocrine L-cell prod-uct oxyntomodulin were significantly higher in the pan-createctomy group compared with the control group(Fig. 5F and Table 2). AUC during OGTT was significantlyhigher in the pancreatectomy group compared with thecontrol group; this was driven by the higher basal concen-trations, as baseline-subtracted AUCs were not different(Table 2). No significant changes from baseline occurredduring IIGI in either group.
DISCUSSION
This study demonstrates that 29–amino acid glucagon iscirculating in man after total pancreatectomy and thatglucagon secretion in these patients is stimulated byorally administered glucose and suppressed when glucoseis administered intravenously. Furthermore, our datasuggest that the hyperglucagonemic response to OGTTin totally pancreatectomized patients is involved in thepathogenesis of postabsorptive hyperglycemia, as EGPwas markedly higher during OGTT compared with duringintravenously administered glucose where glucagon valueswere suppressed.
Extrapancreatic glucagon secretion was proposed asearly as 1948 by Sutherland and De Duve (5), who showedthat in rabbits and dogs a “glycogenolytic substance” couldbe extracted not only from the pancreas but also from theupper two-thirds of the gastric mucosa. After the intro-duction of the first glucagon RIA in 1961, reports of mea-surable “immunoreactive glucagon” in insulin-deprivedtotally pancreatectomized animals and humans appeared(35). Since then, several investigations have been con-ducted in totally pancreatectomized animals and humans(8,12,14,15,17–20,22–24), reporting considerable speciesvariation and providing conflicting conclusions regardingthe presence or absence of extrapancreatic glucagon. Oneobvious reason for these conflicting results is that circu-lating glucagon concentrations are relatively low (picomolarrange), demanding a high degree of assay sensitivity notmet by the early assays and remaining a drawback formany glucagon assays (36). Furthermore, unclear specific-ity of the glucagon immunoassays relying on C-terminal
or side-viewing antibodies toward the various circulatingglucagon-like peptides remains a challenge for many ofthe currently applied glucagon assays (37).
In the current study, we used a recently developedsandwich ELISA targeting the N- and C-terminal regionsof glucagon simultaneously whereby these specificityproblems should be eliminated (25). In order to verifythe accuracy of this assay, we analyzed plasma from to-tally pancreatectomized patients for glucagon by using amass spectrometry–based platform. These results confirmthat the glucagon responses observed are indeed genuine29–amino acid glucagon. The absence of PP and C-peptideresponses in the totally pancreatectomized patients con-firms the completeness of pancreatectomy and thus elim-inates the possibility that the observed glucagon responsesmight originate from remnant pancreatic tissue. Al-though the exact origin cannot be determined in thisstudy, the fact that oral glucose stimulation resulted insignificant hyperglucagonemic responses, whereas in-travenous glucose infusion suppressed circulating gluca-gon levels, directs the attention to the gastrointestinaltract. Glucagon is a product of the preproglucagon gene(GCG), which is expressed by both pancreatic a-cells andspecific enteroendocrine cells (L cells) of the intestinalmucosa and neurons within the nucleus of the solitarytract (38,39). GCG encodes the precursor hormone pro-glucagon, which after posttranslational processing yieldsdifferent and multiple biologically active proglucagon-derived peptides depending on the presence and relativeactivity of the processing enzymes PC1/3 and PC2 (40).These processing enzymes have generally been consideredto be tissue specific, with PC2 being expressed in thepancreatic a-cells, where it processes proglucagon intoglucagon, glicentin-related PP, and a major proglucagonfragment, and PC1/3 being expressed in the enteroendo-crine L cells, where it processes proglucagon into glicen-tin, oxyntomodulin, and the two glucagon-like peptides,GLP-1 and GLP-2. Interestingly, recent studies haverevealed that activity of PC1/3 may also be present inpancreatic a-cells under certain circumstances (41,42)and that PC2 may also be present in enteroendocrine cellsin the human gastrointestinal tract (43,44), including cellscostaining for PC2 and the proglucagon product GLP-1(F.K. Knop et al., unpublished data). It is therefore pos-sible that the proglucagon-containing enteroendocrineL cells may be the origin of the extrapancreatic glucagonsecretion observed here. Enteroendocrine L cells arefound dispersed in the epithelium of the small and large
pancreatectomy group (n = 10), analyzed using a side-viewing glucagon assay (blue). The fractions containing glucagon-like peptides (bluehatched area) were subsequently pooled and subjected to tandem mass spectrometry–based proteomics (E). Peptide intensities (log2transformed) are color coded from low (green) to high (red) concentration with a false discovery rate of <1%. The 29–amino acid sequencecorresponding to that of glucagon is depicted in bold font. Data are mean6 SEM. Statistical analysis was performed by linear mixed effectmodeling for analysis of repeated measures between days within groups, and two-sample Student t test (two-tailed), paired or unpaired,was used for analysis of bsAUC. Asterisks (*) indicate significant (P < 0.05) differences. CPM, counts per minute.
diabetes.diabetesjournals.org Lund and Associates 593

intestines, with densities increasing from the duodenumto the large intestine (43). After total pancreatectomy,the gastrointestinal anatomy is dramatically changed,including the removal of the pyloric sphincter and theduodenum. Thus, after ingestion of a meal, nutrientsare rerouted and delivered directly from the stomachto the jejunum, where L cells are more abundant, possiblyexplaining the significantly increased GLP-1 and oxynto-modulin concentrations observed in the totally pancrea-tectomized patients after OGTT. These responses arereminiscent of the levels seen in subjects after Roux-en-Ygastric bypass surgery (43,45) (a bariatric surgical proce-dure in which the small intestine is rearranged so that thenutrients are rerouted from a small gastric pouch to themore distal jejunum) (45). Interestingly, we found thatfasting levels of GLP-1 and oxyntomodulin were signifi-cantly higher in the totally pancreatectomized patientscompared with the healthy control subjects, a differencenot typically observed after Roux-en-Y gastric bypass (45).This finding raises the interesting possibility of an in-creased recruitment of GCG-expressing cells in the pan-createctomized patients as a response to the removal ofthe pancreatic a-cells. In line with this, pancreatic a-cellhyperplasia is observed in total disruption of glucagonreceptor signaling in mice (46,47) and during partialdisruption of glucagon receptor signaling in humans(48). Furthermore, studies in mice with complete disrup-tion of glucagon receptor signaling specifically in the liverhave pointed to the existence of a circulating factor, whichstimulates a-cell proliferation when glucagon signaling is
abolished (49,50). Perhaps this factor is also formed inresponse to the surgical removal of the pancreas, and thusin the absence of pancreatic a-cells, the enteroendocrineL cells, expressing the GCG gene, might be upregulatedinstead. Accordingly, we hypothesize that when the L cellsof the totally pancreatectomized patients are exposed to alarge and rapid stimulation, as by the ingested glucose inthis experiment, they respond not only with increasedsecretion of PC1/3 cleavage products (i.e., GLP-1 andoxyntomodulin) but also with secretion of PC2 cleavageproducts, resulting in significant glucagon responses. Thefact that we did not observe increased GIP(1-30) levelsin the pancreatectomized group suggests that a generalupregulation of PC2 is not present [as an upregulation ofPC2 in the enteroendocrine K cells should yield increasedlevels of GIP(1-30)], but this does not rule out the possi-bility of a selective upregulation and/or activity of PC2 inthe enteroendocrine L cells.
We found an increased EGP during OGTT comparedwith during IIGI in the totally pancreatectomized pa-tients, which might be a consequence of the postprandialhyperglucagonemia. The pancreatectomized patients hada higher Rd of glucose during the IIGI day compared withthe OGTT day despite isoglycemic conditions and no dif-ference in insulin treatment on the two experimentaldays. But this difference in Rd was driven primarily by adifference in glucosuria between the 2 days, most likelyexplained by the larger volume of liquid infused duringIIGI compared with the volume ingested during OGTT.Interestingly, a higher rate of EGP was also observed in
Figure 4—Glucose Ra (A), glucose Rd (B), endogenous Ra of glucose (C), concentrations of plasma glycerol (D), glycerol Ra (E ), and glycerolRd (F ) during a 75-g OGTT and IIGI in totally pancreatectomized patients (PX) (n = 10) and healthy control subjects (CTRL) (n = 10). Data aremean 6 SEM. Statistical analysis was performed by linear mixed effect modeling for analysis of repeated measures between days withingroups. Asterisks (*) indicate significant (P < 0.05) differences.
594 Extrapancreatic Glucagon Diabetes Volume 65, March 2016
the healthy control subjects during OGTT comparedwith IIGI (albeit the difference was considerably smallerthan in the pancreatectomy group). This finding mightseem counterintuitive, as significantly more insulin was
secreted during the OGTT compared with the IIGI. Theexplanation could be that maximum insulin-mediatedsuppression of EGP in the healthy individuals was reachedalready with the insulin levels obtained during IIGI,
Figure 5—Plasma concentrations of gastrin (A), CCK (B), total (t) GIP (C), total GLP-1 (D), GIP(1-30) (E), and oxyntomodulin (F) during a75-g OGTT and IIGI in totally pancreatectomized patients (PX) (n = 10) and healthy control subjects (CTRL) (n = 10). Data are mean 6 SEM.Statistical analysis was performed by linear mixed effect modeling for analysis of repeated measures between days within groups.Asterisks (*) indicate significant (P < 0.05) differences.
diabetes.diabetesjournals.org Lund and Associates 595

combined with stimulatory effects from the delayed sup-pression of glucagon observed during OGTT in these sub-jects. The higher Ra and Rd of glycerol, and, thus, thehigher lipolysis rate in the pancreatectomy group com-pared with the control group, are likely explained bythe insulin-deficient state of the patients.
In conclusion, the ascertainment of extrapancreatic glu-cagon and the postprandial hyperglucagonemia observedin totally pancreatectomized patients might have clinicaland scientific implications. First, the present physicochem-ical proof that 29–amino acid glucagon is secreted fromextrapancreatic tissue in humans changes the concept ofglucagon being a pancreas-specific hormone and thusopens the way for a new explanation of postprandialhyperglucagonemia, as this might be a gut-dependent phe-nomenon. Second, the need for a larger amount of glucoseduring IIGI compared with the amount ingested duringOGTT and the larger EGP during OGTT compared withIIGI in the pancreatectomy group reveals, in a setting ofisoglycemia and without insulin in the equation, that thehyperglucagonemic response contributes to the postpran-dial hyperglycemia of the patients. And last, our findingssuggest that gut-derived glucagon may play a hitherto un-recognized role in diabetes secondary to pancreatectomy,and possibly, although speculative, also in the pathophys-iology of other conditions with paradoxical postprandialhyperglucagonemia, including type 2 diabetes.
Acknowledgments. The authors thank the participants for spending timeon this project, and the authors are grateful for laboratory assistance from SisseM. Schmidt, Sofie P. Olesen, Lene Albæk, and Alice Lieth of the Universityof Copenhagen. The authors also thank Julie L. Forman of the University ofCopenhagen for providing statistical support and expertise.Funding. This study was supported by the European Foundation for the Studyof Diabetes–Merck Sharpe & Dohme (EFSD-MSD); The Novo Nordisk FoundationCenter for Basic Metabolic Research, University of Copenhagen; the EuropeanMolecular Biology Organization (EMBO); the European Foundation for the Studyof Diabetes; the A.P. Møller Foundation for the Advancement of MedicalScience; the Aase and Ejnar Danielsens Foundation; the Johan Boserup andLise Boserup’s Foundation; and the Faculty of Health and Medical Sciences,University of Copenhagen.Duality of Interest. No potential conflicts of interest relevant to this articlewere reported.Author Contributions. A.L. conceptualized and planned the study aswell as wrote applications for funding, conducted the clinical experiments,researched data, performed statistical analyses, and wrote the manuscript. J.I.B.,M.C., and M.G. planned the study and helped with experiments. N.J.W.A.conducted ELISA and gel chromatography and performed mass spectrometry–based proteomic analysis of glucagon. B.H. conducted RIA analyses of GIP(1-30)and PP. E.R.M. recruited patients. C.P.H. and J.H.S. performed total pancreatec-tomies and recruited patients. G.v.H. processed and analyzed glucose and glyc-erol tracer data. J.F.R. processed and analyzed CCK and gastrin data. D.H., F.M.,and M.M. performed mass spectrometry–based proteomic analysis of glucagon. S.L.and T.V. planned the study. J.J.H. provided ELISA analysis of glucagon and RIAanalyses of glucagon, GLP-1, GIP, oxyntomodulin, GIP(1-30), and PP. F.K.K. concep-tualized the study, wrote applications for funding, planned the study, and wrote themanuscript. All authors contributed to discussion and critically reviewed the manu-script. F.K.K. is the guarantor of this work and, as such, had full access to all the data
in the study and takes responsibility for the integrity of the data and the accuracy ofthe data analysis.Prior Presentation. The main findings of this study were presented at the75th Scientific Sessions of the American Diabetes Association, Boston, MA, 5–9June 2015, and at the 51st Annual Meeting of the European Association for theStudy of Diabetes, Stockholm, Sweden, 14–18 September 2015.
References1. Unger RH, Orci L. Glucagon and the A cell: physiology and pathophysiology
(first two parts). N Engl J Med 1981;304:1518–15242. Gromada J, Franklin I, Wollheim CB. Alpha-cells of the endocrinepancreas: 35 years of research but the enigma remains. Endocr Rev 2007;28:84–1163. Knop FK, Vilsbøll T, Madsbad S, Holst JJ, Krarup T. Inappropriate sup-
pression of glucagon during OGTT but not during isoglycaemic i.v. glucose in-fusion contributes to the reduced incretin effect in type 2 diabetes mellitus.Diabetologia 2007;50:797–8054. Meier JJ, Deacon CF, Schmidt WE, Holst JJ, Nauck MA. Suppression ofglucagon secretion is lower after oral glucose administration than during in-
travenous glucose administration in human subjects. Diabetologia 2007;50:806–8135. Sutherland EW, De Duve C. Origin and distribution of the hyperglycemic-glycogenolytic factor of the pancreas. J Biol Chem 1948;175:663–6746. Vranic M, Pek S, Kawamori R. Increased “glucagon immunoreactivity” in
plasma of totally depancreatized dogs. Diabetes 1974;23:905–9127. Muller WA, Girardier L, Seydoux J, Berger M, Renold AE, Vranic M.Extrapancreatic glucagon and glucagonlike immunoreactivity in depancreatizeddogs. A quantitative assessment of secretion rates and anatomical delineation ofsources. J Clin Invest 1978;62:124–1328. Gotoh M, Monden M, Okamura J, Mori T, Shima K. Insulin and glucagonsecretion after pancreatectomies. Correlation of secretion and hormonal contentsof remaining pancreas. Diabetes 1989;38:861–8679. Matsuyama T, Foà PP. Plasma glucose, insulin, pancreatic, and entero-
glucagon levels in normal and depancreatized dogs. Proc Soc Exp Biol Med1974;147:97–10210. Doi K, Prentki M, Yip C, Muller WA, Jeanrenaud B, Vranic M. Identical bi-ological effects of pancreatic glucagon and a purified moiety of canine gastricimmunoreactive glucagon. J Clin Invest 1979;63:525–53111. Unger RH, Ketterer H, Eisentraut AM. Distribution of immunoassayableglucagon in gastrointestinal tissues. Metabolism 1966;15:865–86712. Boden G, Master RW, Rezvani I, Palmer JP, Lobe TE, Owen OE. Glucagondeficiency and hyperaminoacidemia after total pancreatectomy. J Clin Invest1980;65:706–71613. Barnes AJ, Bloom SR. Pancreatectomised man: a model for diabeteswithout glucagon. Lancet 1976;1:219–22114. Dammann HG, Besterman HS, Bloom SR, Schreiber HW. Gut-hormoneprofile in totally pancreatectomised patients. Gut 1981;22:103–10715. Holst JJ, Pedersen JH, Baldissera F, Stadil F. Circulating glucagon after totalpancreatectomy in man. Diabetologia 1983;25:396–39916. Villanueva ML, Hedo JA, Marco J. Plasma glucagon immunoreactivity in atotally pancreatectomized patient. Diabetologia 1976;12:613–61617. Kåresen R, Tronier B, Aune S. Immunoreactive glucagon and insulinC-peptide in man after resection of the pancreas and total pancreatectomy. AmJ Surg 1980;140:272–27618. Sudo T, Suzuki T, Tobe T. Changes in plasma glucagon after total pan-createctomy in man. Gastroenterol Jpn 1980;15:464–46819. Yasui K. Effects of total pancreatectomy on the secretion of gut glucagon inhumans. Jpn J Surg 1983;13:122–12920. Polonsky KS, Herold KC, Gilden JL, et al. Glucose counterregulation inpatients after pancreatectomy. Comparison with other clinical forms of diabetes.Diabetes 1984;33:1112–1119
596 Extrapancreatic Glucagon Diabetes Volume 65, March 2016

21. Bajorunas DR, Fortner JG, Jaspan J, Sherwin RS. Total pancreatectomyincreases the metabolic response to glucagon in humans. J Clin EndocrinolMetab 1986;63:439–44622. Bajorunas DR, Fortner JG, Jaspan JB. Glucagon immunoreactivity andchromatographic profiles in pancreatectomized humans. Paradoxical response tooral glucose. Diabetes 1986;35:886–89323. Ohtsuka K, Nimura Y, Yasui K. Paradoxical elevations of plasma glucagonlevels in patients after pancreatectomy or gastrectomy. Jpn J Surg 1986;16:1–724. Tanjoh K, Tomita R, Fukuzawa M, Hayashi N. Peculiar glucagon pro-cessing in the intestine is the genesis of the paradoxical rise of serum pancreaticglucagon in patients after total pancreatectomy. Hepatogastroenterology 2003;50:535–54025. Albrechtsen NJW, Hartmann B, Veedfald S, et al. Hyperglucagonaemiaanalysed by glucagon sandwich ELISA: nonspecific interference or truly elevatedlevels? Diabetologia 2014;57:1919–192626. Meissner F, Scheltema RA, Mollenkopf H-J, Mann M. Direct proteomicquantification of the secretome of activated immune cells. Science 2013;340:475–47827. Scheltema RA, Hauschild J-P, Lange O, et al. The Q Exactive HF, a Benchtopmass spectrometer with a pre-filter, high-performance quadrupole and an ultra-high-field Orbitrap analyzer. Mol Cell Proteomics 2014;13:3698–370828. Storkholm JH, Hansen CP. Mesenterico-portal vein resection in patientswith pancreatico-duodenal cancer is safe and may increase survival. Dan Med J2014;61:A475729. Holst JJ. Molecular heterogeneity of glucagon in normal subjects and inpatients with glucagon-producing tumours. Diabetologia 1983;24:359–36530. Bornø A, Foged L, van Hall G. Glucose and glycerol concentrations and theirtracer enrichment measurements using liquid chromatography tandem massspectrometry. J Mass Spectrom 2014;49:980–98831. Hare KJ, Vilsbøll T, Holst JJ, Knop FK. Inappropriate glucagon responseafter oral compared with isoglycemic intravenous glucose administration inpatients with type 1 diabetes. Am J Physiol Endocrinol Metab 2010;298:E832–E83732. Radziuk J, Norwich KH, Vranic M. Experimental validation of measurementsof glucose turnover in nonsteady state. Am J Physiol 1978;234:E84–E9333. Bagger JI, Knop FK, Lund A, Holst JJ, Vilsbøll T. Glucagon responses toincreasing oral loads of glucose and corresponding isoglycaemic intravenousglucose infusions in patients with type 2 diabetes and healthy individuals. Dia-betologia 2014;57:1720–172534. Fujita Y, Wideman RD, Asadi A, et al. Glucose-dependent insulinotropicpolypeptide is expressed in pancreatic islet alpha-cells and promotes insulinsecretion. Gastroenterology 2010;138:1966–197535. Holst JJ. Extrapancreatic glucagons. Digestion 1978;17:168–190
36. Dunning BE, Gerich JE. The role of alpha-cell dysregulation in fasting andpostprandial hyperglycemia in type 2 diabetes and therapeutic implications.Endocr Rev 2007;28:253–28337. Bak MJ, Albrechtsen NW, Pedersen J, et al. Specificity and sensitivity ofcommercially available assays for glucagon and oxyntomodulin measurement inhumans. Eur J Endocrinol 2014;170:529–53838. Sandoval DA, D’Alessio DA. Physiology of proglucagon peptides: role ofglucagon and GLP-1 in health and disease. Physiol Rev 2015;95:513–54839. Vrang N, Grove K. The brainstem preproglucagon system in a non-humanprimate (Macaca mulatta). Brain Res 2011;1397:28–3740. Campbell JE, Drucker DJ. Islet a cells and glucagon–critical regulators ofenergy homeostasis. Nat Rev Endocrinol 2015;11:329–33841. Kilimnik G, Kim A, Steiner DF, Friedman TC, Hara M. Intraislet production ofGLP-1 by activation of prohormone convertase 1/3 in pancreatic a-cells in mousemodels of ß-cell regeneration. Islets 2010;2:149–15542. Marchetti P, Lupi R, Bugliani M, et al. A local glucagon-like peptide 1 (GLP-1)system in human pancreatic islets. Diabetologia 2012;55:3262–327243. Claridge LE, Valiyapurayil NV, Nguyen NQ, Rayner CK, Wu T, Burgess JE,et al. Regional variation in expression of enzymes that synthesize incretin hor-mones and glucagon in lean and morbidly obese humans. Diabetes 2015;64(Suppl. 1):A528–52944. Rhee NA, Wahlgren CD, Pedersen J, et al. Effect of Roux-en-Y gastric bypasson the distribution and hormone expression of small-intestinal enteroendocrinecells in obese patients with type 2 diabetes. Diabetologia 2015;58:2254–225845. Jørgensen NB, Dirksen C, Bojsen-Møller KN, et al. Exaggerated glucagon-like peptide 1 response is important for improved b-cell function and glucosetolerance after Roux-en-Y gastric bypass in patients with type 2 diabetes.Diabetes 2013;62:3044–305246. Gelling RW, Du XQ, Dichmann DS, et al. Lower blood glucose, hyper-glucagonemia, and pancreatic alpha cell hyperplasia in glucagon receptorknockout mice. Proc Natl Acad Sci USA 2003;100:1438–144347. Vuguin PM, Kedees MH, Cui L, et al. Ablation of the glucagon receptor geneincreases fetal lethality and produces alterations in islet development and mat-uration. Endocrinology 2006;147:3995–400648. Zhou C, Dhall D, Nissen NN, Chen C-R, Yu R. Homozygous P86S mutation ofthe human glucagon receptor is associated with hyperglucagonemia, alpha cellhyperplasia, and islet cell tumor. Pancreas 2009;38:941–94649. Solloway MJ, Madjidi A, Gu C, et al. Glucagon couples hepatic amino acidcatabolism to mTOR-dependent regulation of a-cell mass. Cell Reports 2015;12:495–51050. Longuet C, Robledo AM, Dean ED, et al. Liver-specific disruption of themurine glucagon receptor produces a-cell hyperplasia: evidence for a circulatinga-cell growth factor. Diabetes 2013;62:1196–1205
diabetes.diabetesjournals.org Lund and Associates 597