adrenaline stimulates glucagon secretion by tpc2-dependent ... · ringgaard3,4, caroline e....
TRANSCRIPT

1
Adrenaline stimulates glucagon secretion by Tpc2-dependent Ca2+
mobilization from acidic stores in pancreatic α-cells
Alexander Hamilton1, Quan Zhang1, Albert Salehi2, Mara Willems1, Jakob G. Knudsen1, Anna K.
Ringgaard3,4, Caroline E. Chapman1, Alejandro Gonzalez-Alvarez1, Nicoletta C. Surdo5, Manuela
Zaccolo5, Davide Basco6, Paul R.V. Johnson1,7, Reshma Ramracheya1, Guy A. Rutter8, Antony Galione9,
Patrik Rorsman1,2,7* and Andrei I. Tarasov1,7*
1Oxford Centre for Diabetes, Endocrinology and Metabolism, University of Oxford. Churchill
Hospital, Headington, OX3 7LE, Oxford, UK
2Institute of Neuroscience of Physiology, Department of Physiology, Metabolic Research Unit,
University of Göteborg, Göteborg, Sweden
3Novo Nordisk A/S, Diabetes Research, Department of Stem Cell Biology, Novo Nordisk Park, 2760,
Måløv, Denmark
4University of Copenhagen, Department of Biomedical Sciences, Blegdamsvej 3B, 2200, Copenhagen,
Denmark
5Department of Physiology, Anatomy and Genetics, University of Oxford, Oxford, UK
6Center for Integrative Genomics, Université de Lausanne, Lausanne, Switzerland
7Oxford National Institute for Health Research, Biomedical Research Centre, Oxford, UK
8Section of Cell Biology and Functional Genomics, Department of Medicine, Imperial College London,
London, UK
Page 1 of 39 Diabetes
Diabetes Publish Ahead of Print, published online March 21, 2018

2
9Department of Pharmacology, University of Oxford, Oxford, UK
*Corresponding author: University of Oxford, OCDEM, Churchill Hospital, OX3 7LE Oxford UK
Tel +441865 857071 Email: [email protected]
* Corresponding author: University of Oxford, OCDEM, Churchill Hospital, OX3 7LE Oxford UK
Tel +441865 857348 Email: [email protected]
List of abbreviations: NAADP, nicotinic acid adenine dinucleotide phosphate; PKA, protein kinase A;
EPAC2, exchange protein directly activated by cAMP, isoform 2; cAMP, cyclic adenosine
monophosphate; TPC, two-pore channel; pAUC, partial area under the curve; IP3, inositol
trisphosphate; CICR, Ca2+-induced Ca2+ release; BSA, bovine serum albumin; sER, sarco/endoplasmic
reticulum; AKAR-3, A-kinase activity reporter version 3;
Word count: 3,990 Limit: 4,000
Running title: Adrenaline controls Ca2+ release in α-cells
Page 2 of 39Diabetes
3
Abstract
Adrenaline is a powerful stimulus of glucagon secretion. It acts by activation of β-adrenergic
receptors but the downstream mechanisms have only been partially elucidated. Here we have
examined the effects of adrenaline in mouse and human α-cells by a combination of
electrophysiology, imaging of Ca2+ and PKA activity and hormone release measurements. We found
that stimulation of glucagon secretion correlated with a PKA- and EPAC2-dependent (inhibited by PKI
and ESI-05, respectively) elevation of [Ca2+]i in α-cells, which occurred without stimulation of
electrical activity, persisted in the absence of extracellular Ca2+ but was sensitive to ryanodine,
bafilomycin and thapsigargin. Adrenaline also increased [Ca2+]i in α-cells in human islets. Genetic or
pharmacological inhibition of Tpc2 channel (that mediates Ca2+ release from acidic intracellular
stores) abolished the stimulatory effect of adrenaline on glucagon secretion and reduced the
elevation of [Ca2+]i.. Furthermore, in Tpc2-deficient islets, ryanodine exerted no additive inhibitory
effect. These data suggest that β-adrenergic stimulation of glucagon secretion is controlled by a
hierarchy of [Ca2+]i signaling in the α-cell that is initiated by cAMP-induced Tpc2-dependent Ca2+
release from the acidic stores and further amplified by Ca2+-induced Ca2+ release from the
sarco/endoplasmic reticulum.
Key words
Pancreatic α-cells, adrenaline, glucagon, two-pore channels
Page 3 of 39 Diabetes

4
Introduction
The ability of the ‘fight-or-flight’ hormone adrenaline to increase plasma glucose levels by
stimulating liver gluconeogenesis is in part mediated by glucagon, the body’s principal hyperglycemic
hormone (1). Glucagon is secreted by the α-cells of the pancreas (2). Reduced autonomic stimulation
of glucagon secretion may result in hypoglycemia, a serious and potentially fatal complication of
diabetes (3). It has been estimated that up to 10% of insulin-treated patients die of hypoglycemia
(4). Understanding the mechanism by which adrenaline stimulates glucagon secretion and how it
becomes perturbed in diabetic patients is therefore essential.
The mechanism by which adrenaline stimulates glucagon secretion has only partially been
elucidated. It is clear, however, that it involves activation of β-adrenergic receptors (5-7), leading to
elevated intracellular cAMP ([cAMP]i), and culminates in elevation of the cytoplasmic free Ca2+
concentration ([Ca2+]i) with resultant Ca2+-dependent stimulation of glucagon secretion (6;8;9).
However, our understanding of the spatiotemporal inter-relationship between different intracellular
Ca2+ stores involved in the α-cell adrenaline signaling remains patchy.
Here we have explored how adrenaline triggers glucagon release by a combination of hormone
secretion measurements, electrophysiology and imaging of cytoplasmic Ca2+, cAMP and PKA activity
in α-cells within intact mouse pancreatic islets. We have extended the measurements to human
islets and also tested how the responsiveness to adrenaline is affected when islets are cultured
under hyperglycemic conditions to establish if and how this regulation becomes impaired in
diabetes. Our data indicate that Ca2+ release from acidic (lysosomal) stores plays a critical and
unexpected role in adrenaline-induced glucagon secretion.
Page 4 of 39Diabetes

5
Research Design and Methods
Chemicals
The following substances were used (source given in parentheses): the L-type Ca2+ channel blocker
isradipine and the P/Q Ca2+ channel blocker ω-agatoxin (Alomone Labs; Jerusalem, Israel); the α1-
antagonist prazosin (Abcam, Cambridge, UK); the membrane-permeable PKA inhibitor myr-PKI, the
IP3 receptor inhibitor Xestospongin C, the NAADP antagonist Ned-19, the V-ATPase inhibitor
bafilomycin, the sER ATPase inhibitor thapsigargin and noradrenaline (Tocris Bioscience, Bristol, UK);
the EPAC2 inhibitor ESI-05 (BioLog, Bremen, Germany); the insulin receptor antagonist (S961, Novo-
Nordisk, Denmark). All other compounds were obtained from Sigma-Aldrich (Dorset, UK).
Solutions
The extracellular solution (EC1) used for imaging and current-clamp electrophysiology (Figure 2c)
experiments contained (mM) 140 NaCl, 4.6 KCl, 2.6 CaCl2, 1.2 MgCl2, 1 NaH2PO4, 5 NaHCO3, 10 HEPES
(pH 7.4, with NaOH). The pipette solution (IC1) consisted of (mM) 76 K2SO4, 10 NaCl, 10 KCl, 1 MgCl2,
5 HEPES (pH 7.35 with KOH). The extracellular solution (EC2) for recordings of the depolarization-
induced exocytosis (Figure 3c,d) contained (mM) 118 NaCl, 5.6 KCl, 2.6 CaCl2, 1.2 MgCl2, 5 HEPES, 20
TEA-Cl and 6 glucose (pH 7.4 with NaOH). In the latter experiments, the pipette-filling medium (IC2)
consisted of (mM) 76 Cs2SO4, 10 NaCl, 10 KCl, 1 MgCl2, 5 HEPES (pH 7.35 with CsOH).
Animals, islet isolation and culture
NMRI mice (Charles River) were used throughout the study except for the experiments involving the
genetic manipulation of TPC1 and 2 (Figure 5). Tpcn1-/- and Tpcn2-/- mice were developed on
C57Bl6/N background as described (10). Cd38-/- mice were developed on C57Bl6/J background (11).
Age- and sex-matched C57BL6/N and C57Bl6/J wild-type animals were used as controls. Mice were
kept in a conventional vivarium with a 12-hour-dark/12-hour-light cycle with free access to food and
water and were killed by cervical dislocation. All experiments were conducted in accordance with
Page 5 of 39 Diabetes
6
the United Kingdom Animals (Scientific Procedures) Act (1986) and the University of Oxford ethical
guidelines.
Pancreatic islets were isolated from mice by injecting collagenase solution into the bile duct, with
subsequent digestion of the connective and exocrine pancreatic tissue.
Human pancreatic islets were isolated in the Oxford Diabetes Research & Wellness Foundation
Human Islet Isolation Facility according to published protocols (12;13).
Unless otherwise stated, experiments were performed on acutely isolated islets. For experiments
aiming to emulate chronic hyperglycemia, islets were cultured for 48h in RPMI medium containing
30mM or the standard 11mM glucose, supplemented with 10% FBS, 100IU/mL penicillin and
100μg/mL streptomycin (all reagents from Life Technologies, Paisley, UK). Recombinant sensors
were delivered via adenoviral (GCamp6, AKAR3) or BacMam (cADDis) vectors at 105 infectious units
per islet, followed by 24-36h culturing at 11 mM glucose (as above) to express the sensors.
Imaging of [Ca2+]i, cAMP and PKA activity in islet cells
Time-lapse imaging of [Ca2+]i in intact freshly isolated mouse islets was performed on an inverted
Zeiss AxioVert 200 microscope equipped with Zeiss 510-META laser confocal scanning system. Prior
to Ca2+ imaging, mouse islets were loaded with 6μM Fluo-4 at room temperature or 10 μM Fluo4FF
(Molecular Probes) at +37°C for 90 min. Both dyes were excited at 488nm and emission was
collected at 530nm, using 512x512 frame scanning mode with the pixel dwell time of 6μs (image
frequency: 0.25Hz). Time-lapse imaging of [Ca2+]i in groups of mouse islets was done on a
Axiozoom.V16 microscope (0.1Hz) using Gcamp6f (14).
PKA activity was reported in pancreatic islet cells using recombinant FRET probe AKAR3 (15). AKAR3
CFP fluorescence was excited at 458nm using an Axiozoom.V16 microscope, which has been shown
previously to excite CFP selectively (16); the emitted light was collected at 485nm (CFP) and 515nm
(YFP) (image frequency: 0.0Hz). Time-lapse imaging of [cAMP]i was performed using recombinant
Page 6 of 39Diabetes

7
Green Downward cADDis sensor (Montana Molecular, Bozeman, Montana, U.S.A.). The cADDis
fluorescence was excited at 485nm and the emission recorded at 515nm using an Axiozoom.V16
microscope. PKA and cAMP were imaged at a frequency of 16 mHz.
All imaging at 34°C was performed using an open chamber. The bath solution containing various
stimuli was perifused continuously at a rate of 200 μl/min. In experiments involving PKI, ESI-05,
ryanodine, xestospongin C, Ned-19 thapsigargin and the Ca2+ channel blockers ω-agatoxin and
isradipine, cells were preincubated in the solution of the respective agent for 90min. For the
bafilomycin experiments, the pre-incubation time was 20 min. By pre-incubating the islets in the
agonist/antagonist solutions we aimed to reach the saturation of the effect by the start of the
recording. α-Cells were identified as those exhibiting a response to 1mM glutamate (Figure 1c-e) (17)
and/or adrenaline (known to inhibit secretion of both insulin and somatostatin) (18).
Images were acquired using ZenBlack or ZenBlue software (Carl Zeiss).
Hormone release measurements
Batches of 10–20 size-matched freshly isolated mouse islets were pre-incubated in 1ml of Krebs-
Ringer buffer containing 1 mM glucose and 0.2% BSA for 30min at 37°C, followed by a 1-h test
incubation in 1ml of the same medium supplemented as indicated. Glucagon was determined by RIA
RIA (Eurodiagnostica, Malmo, Sweden) (19). The experiments on the Tpcn1, Tpcn2 or Cd38 knockout
mice (Figure 5) and control mice were assayed using the MSD glucagon assay (Rockville, MD, USA).
Electrophysiology
The electrophysiological measurements were performed on α-cells within freshly isolated intact
islets (from NMRI or C57Bl/6 mice), using an EPC-10 patch-clamp amplifier (HEKA Electronics,
Lambrecht/Pfalz, Germany) and Pulse software. All electrophysiological experiments were
performed at 34°C. α-Cells were identified as those active at low (3 mM) glucose and were
differentiated from δ-cells (some of which fire action potentials, albeit at low frequency at this
glucose concentration) by the distinct appearance of action potentials (Figure S2a). For the
Page 7 of 39 Diabetes
8
membrane potential recordings (Figure 2c), the perforated patch configuration was used as
described previously (20) using solutions IC1 and EC1. Exocytosis was measured as increases in
membrane capacitance in α-cells in intact islets as described previously using the standard whole-
cell configuration and IC2 and EC2.
Data analysis
Image sequences were analyzed (registration, background subtraction, ROI intensity vs time analysis,
F/F0 calculation) using open-source FIJI software (http://fiji.sc/Fiji). The numerical data was analyzed
using IgorPro package (Wavemetrics). To calculate partial areas under the curve (pAUC), the
recording was split into 30s intervals, and area under the curve was computed for each individual
interval (Figure S1c), using the trapezoidal integration. Numbers of measurements/cells are specified
in Figure legends; the experiments on human islets were performed on islets isolated from 3 donors.
Statistical analysis was performed using R (21). Data is presented as the mean values ± S.E.M. Mann-
Whitney U-test or Wilcoxon’s paired test were used to compute the significance of difference
between independent and dependent samples, respectively. Multiple comparisons within one
experiment were performed using Kruskall-Wallis test with Nemenyi post-hoc analysis (independent
samples) or Friedman test with Nemenyi post-hoc analysis (dependent samples).
Results
We tested the effect of adrenaline on glucagon secretion at a glucose concentration that roughly
approximates hypoglycemia in vivo (3mM) (22) and minimizes the activity of β- and δ-cells (see (23)
and (Figure S1b)). Adrenaline stimulated glucagon secretion from isolated mouse pancreatic islets by
3.8±0.8-fold (Figure 1a), in line with previously reported results (5).
Glucagon secretion is a Ca2+-dependent process and is stimulated by an elevation of [Ca2+]i (5). We
quantified the adrenaline effect on [Ca2+]i in α-cells within intact islets using time-lapse laser
scanning confocal microscopy. At 3mM glucose, <20% of the cells in pancreatic islets isolated from
Page 8 of 39Diabetes

9
NMRI mice were active and generated [Ca2+]i oscillations (Figure 1b). Of the spontaneously active
cells, over 70% responded to glutamate (Movie1) and were thus identified as α-cells (17;24). In α-
cells thus identified, adrenaline induced a rapid and reversible increase in [Ca2+]i (Figure 1c-e).
Similar effects of adrenaline were observed at 1mM glucose (Figure S1a,e).
The majority of the islet cells (>80%) were inactive at 3mM glucose but were stimulated when
glucose was elevated to 20mM, as expected for β- or δ-cells cells (Figure 1e). At 3mM glucose,
adrenaline did not affect [Ca2+]i in any of these cells (Figure S1b) and at 20mM actually reduced
[Ca2+]i (not shown). Assessed as pAUC (see Research Design and Methods; Figure S1c),
responsiveness to adrenaline strongly correlated with spontaneous [Ca2+]i oscillations at 3mM
glucose (Pearson’s r=0.78) and responsiveness to glutamate (r=0.81) (Figure S1d). Similar responses
to adrenaline and glutamate were observed in human islets (Figure 1d,f) and islets of C57Bl/6N mice
(Figure 1f). These data make it unlikely that paracrine effects influence the [Ca2+]I responses to
adrenaline in α-cells. Indeed, neither addition of exogenous insulin, nor inhibition of insulin receptor
with S961 were able to significantly modify the adrenaline signaling in α-cells (Figure S5b).
Glucagon-secreting α-cells are equipped with several types of voltage-gated Ca2+ channels (25). The
effect of adrenaline on glucagon secretion was abolished by inhibition of L-type (with isradipine) but
not P/Q-type (with ω-agatoxin) Ca2+ channels (Figure 2a). The changes in adrenaline-induced [Ca2+]i
dynamics produced by isradipine and ω-agatoxin (Figure 2b) correlated with the effects of these
blockers on glucagon secretion (Figure 2a). When isradipine was applied just before adrenaline, the
response to adrenaline was attenuated but not abolished (Figure 2b). The effect of adrenaline on
[Ca2+]i was mimicked by noradrenaline (released by intraislet adrenergic nerve endings (26)) and by
the β-adrenergic agonist isoprenaline but abolished by β-antagonist propranolol. By contrast, the α1-
adrenergic inhibitor prazosin, reported to inhibit the adrenaline-induced [Ca2+]i increases in single α-
cells (6), had no detectable effect (Figure 2b). Thus, the effect of adrenaline on α-cell [Ca2+]i
dynamics principally reflects activation of β-receptors.
Page 9 of 39 Diabetes

10
We tested whether the adrenaline-induced increase in [Ca2+]i can be attributed to stimulation of α-
cell action potential firing by whole-cell perforated-patch measurements (20). In agreement with the
[Ca2+]i measurements, α-cells were electrically active and fired action potentials at a frequency of
~1Hz when exposed to 3mM glucose. Adrenaline depolarized α-cells by 3mV, produced a 10mV
reduction of spike height (Figure 2c, Figure S2f), increased the duration of the action potential from
4 to 8ms but did not (except for a moderate stimulation during the initial 4s) increase spike
frequency (Figure S2f,g). These small effects of adrenaline on α-cell electrical activity, possibly
reflecting transient activation of a depolarizing store-operated membrane conductance following
depletion of the sER Ca2+ stores (27), cannot account for the pronounced and sustained (several
minutes) increases in [Ca2+]i (Figure 1e,f). Indeed, neither hyperpolarizing the plasma membrane
with KATP channel opener diazoxide, nor chelating the extracellular Ca2+ with EGTA prior to the
addition of adrenaline diminished its capacity to increase [Ca2+]i in α-cells (Figure 2b, Figure S2c-e).
β-Adrenergic signaling results in the Gs-mediated activation of adenylyl cyclase and hence increases
the cytosolic concentration of cAMP ([cAMP]i (28) (Figure S3 ), which in turn activates the
downstream targets PKA and exchange protein directly activated by cAMP (EPAC2). We determined
the significance of PKA and EPAC in the regulation of [Ca2+]i and glucagon secretion using the
inhibitors myr-PKI (for PKA) and ESI-05 (for EPAC2). Both myr-PKI and ESI-05 inhibited adrenaline-
induced glucagon secretion (Figure 3a) and significantly reduced the adrenaline-induced increase in
[Ca2+]i (Figure 3b), with ESI-05 exerting a much stronger effect than myr-PKI on glucagon secretion.
The finding that EPAC2 and/or PKA, despite having similar effects on [Ca2+]i, differentially affect
adrenaline-induced glucagon secretion (p<0.05), suggests that cAMP-dependent activation of EPAC2
may be more tightly linked to exocytosis.
The effects of adrenaline itself on glucagon secretion have previously been examined previously (5).
Here we explored the roles of PKA and EPAC2 on the cAMP-dependent stimulation of the late-stage
depolarization-evoked exocytosis (monitored as increases in membrane capacitance). Figure 3c
Page 10 of 39Diabetes
11
shows the increase in Cm evoked by a 20ms depolarization from -70 to 0mV, in the absence or
presence of cAMP in the patch pipette and following inhibition of PKA or EPAC2; this pulse duration
is comparable to that of the α-cell action potential (see Figure 2c). Under control conditions,
exocytotic responses were small (<5fF). When cAMP was included in the pipette, exocytosis was
stimulated by ~10-fold (Figure 3c). The stimulatory effect of cAMP on depolarization-evoked
exocytosis was resistant to PKI but reduced by ESI-05 (Figure 3c,d). Longer depolarizations evoked
larger exocytotic responses but the effects of cAMP and the inhibitors were the same (Figure S4 ).
We explored the effect of adrenaline on [cAMP]i and its relationship to [Ca2+]i further by imaging the
activity of cAMP’s downstream target PKA using the FRET sensor AKAR3 (15). In most islet cells, the
application of adrenaline reduced [cAMP]i (Figure S3 ), probably reflecting the effect of α2-adrenergic
receptors in β- (29) and δ-cells (30). However, in a subset of islet cells (~10%, corresponding to α-
cells), adrenaline increased [cAMP]i (Figure S3 c). These changes in [cAMP]i correlated with increased
α-cell- and reduced β/δ-cell-activity of PKA (Figure 3e). We compared the adrenaline-induced
increases in PKA activity in α-cells to that produced by increasing concentrations of the adenylyl
cyclase activator forskolin (Figure 3f-g). Forskolin dose-dependently increased PKA activity and
[Ca2+]i; half-maximal effects were observed at 0.19±0.05μM and 5.3±1.5μM, respectively. The
increase in PKA activity induced by 5μM adrenaline was equivalent to the effect of 4.2±1.1μM
forskolin (Figure 3h), in agreement with the observation that stimulation of glucagon secretion is
only seen at micromolar concentrations of adrenaline (5). The observation that the adrenaline-
induced increase in [Ca2+]i requires high [cAMP]i (=high forskolin) is consistent with the involvement
of EPAC2 (Kd for cAMP≈10-5 M (31)) and the previous report that the stimulatory effect of adrenaline
on glucagon secretion is dramatically reduced in EPAC2 knock-out islets (5).
The findings that adrenaline produces a marked increase in [Ca2+]i despite having only a marginal
effect on α-cell electrical activity and that it retains the capacity to stimulate glucagon secretion in
the absence of extracellular Ca2+ and in the presence of a high concentration of the KATP channel
Page 11 of 39 Diabetes

12
activator diazoxide (to suppress electrical activity (20)) suggest that it, via activation of β-receptors
and cAMP-dependent stimulation of PKA and EPAC2, acts by mobilizing Ca2+ from intracellular
stores. We tested for the capacity of adrenaline to induce glucagon secretion and increase [Ca2+]i in
the presence of inhibitors of InsP3 receptor (xestospongin C (32)), sarco/endoplasmic reticulum (sER)
Ca2+ ATPase (thapsigargin or CPA) and Ca2+-induced Ca2+-release (CICR; ryanodine). Ryanodine,
xestospongin C and thapsigargin all inhibited the stimulatory effect of adrenaline on glucagon
secretion (Figure 4a) but - unexpectedly - did not appear to affect the adrenaline-induced increase in
[Ca2+]i (Figure S5a). We reasoned that there might be multiple Ca2+ release mechanisms operating in
parallel in the α-cell, and that Ca2+ release via any one of them might suffice to saturate the high-
affinity Ca2+ dye Fluo-4 (which has a Kd for Ca2+ of 300nM). Indeed, when the response to adrenaline
was instead assayed using the low-affinity indicator Fluo-4FF (Kd=9.7μM), ryanodine as well as CPA
produced marked and statistically significant diminution of the [Ca2+]i-increasing effect (Figure 4b,c).
Prompted by the observations indicating the presence of a ryanodine-independent component in
adrenaline-induced Ca2+ mobilization, we explored the possible involvement of acidic (lysosomal)
Ca2+ stores (10) in this phenomenon. Bafilomycin, an inhibitor of the vacuolar type-H+ ATPase,
abolished the adrenaline effect on [Ca2+]i in α-cells (Figure 4d).
Ca2+ release from lysosomal stores is mediated by activation of Ca2+- and Na+-permeable (33;34) two-
pore channels (TPCs) (10). We analyzed the role of these channels in the adrenaline-induced [Ca2+]i
increase and glucagon secretion by generation of Tpcn1 or Tpcn2 knockout mice. The mRNA of both
Tpcn1 and Tpcn2 is expressed in mouse and human α-cells (35-37). Whilst adrenaline increased
[Ca2+]i in α-cells in islets isolated from Tpcn1-/- mice (Figure 5a,d), it had very little effect in islets from
Tpcn2-/- mice (Figure 5b,d). The effects of ablating TPC1 and TPC2 on [Ca2+]i correlated with those on
glucagon secretion: adrenaline retained a stimulatory effect on glucagon secretion in Tpcn1-/- but not
Tpcn2-/- islets (Figure 5c). The effect of adrenaline was seemingly smaller in Tpcn1-/- than in wild-type
islets (but this difference did not attain statistical significance). Ryanodine had no inhibitory effect on
Page 12 of 39Diabetes

13
glucagon secretion in Tpcn2-/- islets (Figure 5c). Likewise, pharmacological inhibition of NAADP (the
intracellular messenger mobilizing lysosomal Ca2+ via TPC2 channels) (38;39), which inhibited
glucagon secretion in wilt-type islets, had no effect in Tpcn2-/- islets. Genetic ablation ADP-Ribosyl
Cyclase 1 (CD38), the enzyme producing NAADP, significantly reduced the increase in [Ca2+]i
produced by adrenaline (Figure 4d and Figure 5b) and abolished adrenaline-induced glucagon
secretion (Figure 5c).
Finally, we tested the effects of culturing islets at 30mM glucose for 72h (as an experimental
paradigm of poorly controlled diabetes) on adrenaline’s capacity to elevate [Ca2+]I and stimulate
glucagon secretion. ‘Hyperglycemia’ abolished the stimulatory action of adrenaline on both [Ca2+]i
and glucagon secretion (Figure 6a-b,e). By contrast, islets cultured at 11mM glucose (close to the fed
plasma glucose levels in mice) responded robustly to adrenaline with both a [Ca2+]i increase and
stimulation of glucagon secretion. ‘Hyperglycemia’ did not affect the responsiveness to glutamate
(Figure 6b) or effects of adrenaline on [cAMP]i and PKA activity (Figure 6c,d).
Discussion
Adrenaline-induced glucagon secretion involves both PKA- and EPAC2-dependent mechanisms (5).
Here we have explored the downstream mechanisms with a focus on intracellular Ca2+ dynamics.
Our data are suggestive of a hierarchy of intracellular Ca2+ signaling events and highlight a decisive
role of lysosomal stores and NAADP-activated Ca2+ release via TPC2 channels.
Pharmacological inhibition of EPAC2 nearly abolished the stimulatory effect of adrenaline on both
glucagon secretion and [Ca2+]i. By contrast, inhibition of PKA, whilst lowering [Ca2+]i as strongly as
inhibition of EPAC2, had only a moderate effect on glucagon secretion. This suggests that a full
response to adrenaline requires the activation of both PKA-dependent and -independent
mechanisms and that EPAC2 may act downstream of PKA (Figure 3c,d).
Page 13 of 39 Diabetes

14
Given the weak effect of adrenaline on α-cell electrical activity, the high sensitivity of both
adrenaline-induced glucagon secretion and [Ca2+]i increase after inhibition of L-type Ca2+ channels
may seem paradoxical. However, this effect may be secondary to depletion of intracellular Ca2+
stores when Ca2+ entry is blocked. Indeed, adrenaline retained most of its effect on [Ca2+]i when
isradipine was added just before adrenaline (Figure 2b).
The mechanism by which adrenaline increases [Ca2+]i in α-cells has variably been attributed to
increased Ca2+ channel activity (8) or activation of α1-adrenoreceptors (6). Our study unveils a
previously unrecognized role of acidic Ca2+ stores in regulation of glucagon secretion. Ca2+ liberated
by adrenaline-induced PKA and EPAC2 signaling from the acidic stores then triggers further Ca2+
increase by activating ryanodine-sensitive CICR (40). This hierarchy of intracellular [Ca2+]i signaling is
supported by the fact that ryanodine exerts no additive inhibitory effect on glucagon secretion in
Tpc2 knockout islets.
Our data suggest a link between PKA/EPAC2 signaling and the Tpc2 channel activity and the NAADP
antagonist Ned19 had no additive inhibitory effect on the adrenaline-induced [Ca2+]i increase when
PKA and EPAC2 activity was pharmacologically suppressed (Figure 4d). The production of NAADP is
influenced by high concentrations of cAMP, as expected for an effect mediated by low-affinity cAMP
sensor EPAC2 and PKA-dependent phosphorylation of S66 in Tpc2 increases the channel’s open
probability (41). The involvement of NAADP production is also illustrated by the ability of the genetic
knockdown of the NAADP-generating enzyme CD38 to prevent the effects of adrenaline on both
[Ca2+]i and glucagon secretion. NAADP-dependent adrenaline-induced Ca2+ release via Tpc2 channels
was recently implicated in the transduction of β-adrenergic signals in cardiomyocytes (42) but not
pancreatic β-cells (43;44). The observation that Tpcn2-/- mice have normal fasting blood glucose (43)
it not in conflict with the idea that adrenaline stimulates glucagon secretion by a TPC2-dependent
mechanism as adrenaline itself will stimulate hepatic glucose production even in the absence of
Page 14 of 39Diabetes
15
glucagon and low glucose also stimulates glucagon secretion by a direct (intrinsic) mechanism
independent of systemic signals (20;45).
The innervation of mouse and human islets is rather different (46). The finding that adrenaline’s
effects on [Ca2+]i are essentially the same in mouse and human α-cells may seem at odds with the
observation that adrenaline is without effect on glucagon secretion in human islets (23). It is likely
that adrenaline produces a transient stimulation of glucagon secretion that escapes detection during
a 1h incubation in human islets. We can exclude though that this discrepancy stems from different
glucose concentrations used for secretion measurements (1 mM) and [Ca2+]i imaging (3 mM). In a
series of initial experiments, adrenaline also increased [Ca2+]i in human islets exposed to 1mM
glucose (Figure S1a).
Circulating levels of adrenaline are below 1nM, and they remain below 100nM even during exercise
(47). Interestingly, these low concentrations of adrenaline inhibit glucagon secretion whilst the
stimulatory effect becomes detectable at concentrations >1μM and depends on activation of EPAC2
(5). Such high levels of agonist are unlikely to occur anywhere except close to nerve terminals (48).
Thus, our data suggest that the sympathetic signal mediated by locally released noradrenaline
(Figure 2b) plays a key role in linking the physiological “flight-or-fight” response to the α-cell
glucagon release. The schematic in Figure 7 presents a model for adrenaline signaling in pancreatic
α-cells. Hypoglycemia elevates systemic adrenaline (released from the adrenal glands) and/or
triggers a local release of noradrenaline from sympathetic nerve-endings within or adjacent to
pancreatic islets. The catecholamine then binds to a β-adrenoreceptor on the α-cell, resulting in
increased cytosolic cAMP levels, which activate PKA (which interacts with Tpc2 channel residing the
membrane of the acidic vesicles) and EPAC2 (which facilitates the liberation of NAADP by CD38). The
two signals converge into a release of Ca2+ from the acidic stores into the cytosol, which in turn
triggers further liberation of Ca2+ from ER. Altogether, this leads to a four-fold stimulation of the
glucagon release and, via stimulation of hepatic gluconeogenesis, rapid restoration of blood glucose
Page 15 of 39 Diabetes

16
levels. This process depends on background electrical activity of the α-cell and plasmalemmal Ca2+
entry (explaining the effect of isradipine) to refill intracellular Ca2+ stores.
The mechanism underlying the attenuation of the sympathoadrenal response in diabetes remains
debated. Diabetes is associated with the loss of sympathetic islet innervation and this may, via
reduced glucagon secretion, account for the increased risk of hypoglycemia (49). It is therefore of
interest that our in vitro model of chronic hyperglycemia lowers the α-cell’s intrinsic responsiveness
to adrenaline (Figure 6) and thus can itself result in the sympathetic islet neuropathy. The exact
mechanism remains to be identified but is likely to be downstream of cAMP and activation of PKA,
which were both unaffected. Novel therapeutic strategies that bypass the innervation may help to
restore normal counter-regulation in diabetic patients.
Author Contributions
AH, AIT, QZ, AGA performed the experiments and analyzed the data. AG, MZ, NCS, DB provided
reagents. GAR, PR, AIT, AG and MZ contributed to data interpretation. PR, AIT, AG and GAR wrote
the manuscript.
Conflict of interest
Authors declare no conflicts of interest.
Acknowledgements
We thank Dr Jin Zhang (Department of Pharmacology and Molecular Sciences, The Johns Hopkins
University School of Medicine, Baltimore, USA) for the gift of AKAR3. Supported by the MRC Program
Grant (G0901521). AH is a recipient of a Diabetes UK PhD Studentship. AG, GAR and PR hold
Wellcome Trust Senior Investigator Awards (102828, 098424 and 095531). During the initial stages
of the project, AIT held an Oxford Biomedical Research Council postdoctoral fellowship. QZ is a
Diabetes UK RD Lawrence Fellow. AIT and PR are the guarantors of the study.
Page 16 of 39Diabetes

17
Figure legends
Figure 1 The stimulatory effect of adrenaline on glucagon secretion is mediated by
selective elevation of [Ca2+]i in pancreatic α-cells
(a) Glucagon secreted from isolated NMRI mouse islets in response to 3mM glucose with/without
5μM adrenaline. #p<0.05 vs the effect of 3 mM glucose alone. (b) Variance of the Fluo4 intensity
when the islet was perifused with 3mM glucose ± 5μM adrenaline or 20mM glucose (as indicated).
The brighter cells are those in which [Ca2+]i oscillates. The arrow indicates a cell that started spiking
after adrenaline had been applied. (c-d) Typical single α-cell responses to application of 1mM
glutamate and 5μM adrenaline recorded in mouse (c; n=29) and human (d; n=55) islets, at 3mM
glucose. (e) Representative [Ca2+]i timecourse in the populations of α- (n=21) and non-α-cells
(mostly, β-cells, n=75), differentiated by the response to glutamate. The difference in magnitude of
the glutamate and the adrenaline effects was not a consistent finding. (f) [Ca2+]i changes in α-cells
quantified as pAUC at 3mM glucose ± glutamate or adrenaline in mouse (NMRI, C57Bl/6N) and
human islets. p<0.05 vs the respective effect observed in NMRI mice (*) or the effect of the basal (3
mM glucose) in the same recording (#).
Figure 2 Adrenaline’s effect in pancreatic α-cells depends on Ca2+ influx through L-type
Ca2+ channels and is mediated by β-adrenergic signaling
(a) Glucagon secreted from isolated NMRI mouse islets in response to 3 mM glucose with(out) 5μM
adrenaline ± isradipine or ω-agatoxin (as indicated). p<0.05 vs the effect of adrenaline + 3mM
glucose (*) or vs the basal (3mM glucose + respective antagonist) group. (b) [Ca2+]i upon adrenergic
(isoprenaline (n=27), or noradrenaline (n=19)) stimulation alone (n=29) or with (as indicated)
isradipine (n=17, preincubated, n=29, acute), ω-agatoxin (n=13), propranolol (n=11), prazosin (n=49),
diazoxide (n=20), EGTA (n=84). p<0.05 vs. the effect of adrenaline alone (*) or vs the basal (3 mM
Page 17 of 39 Diabetes
18
glucose+respective (ant)agonist) of the same recording. (c) Effect of adrenaline on α-cell action
potential firing (representative of 11 experiments). Examples of action potentials recorded in the
absence and presence of adrenaline (taken from the recording above as indicated) are shown.
Figure 3 Adrenaline mediates its effects via elevation of [cAMP]i
(a) Glucagon secretion from isolated NMRI mouse islets in response to 3mM glucose. Adrenaline,
myr-PKI or ESI-05 was added as indicated. p<0.05 vs the basal (3 mM glucose + respective
antagonist) (#), vs the effect of 3 mM glucose + adrenaline (*) or vs the effect of 3mM glucose +
adrenaline in the presence of ESI-05 (¶). (b) [Ca2+]i upon application of (as indicated) adrenaline ±
myr-PKI (n=32) or ESI-05 (n=12). p<0.05 vs the basal of the same recording (#) or vs the effect of 3
mM glucose + adrenaline (*). (c) Representative recording of the depolarization-induced increases in
plasma membrane electrical capacitance. (d) Exocytosis in α-cells. The pipette solution contained (as
indicated) either no cAMP (n=7) or 0.1mM cAMP (n=11) and PKA (1μM PKI, n=32) or EPAC2 (25μM
ESI-05, n=11). p<0.05 vs the effect of addition of cAMP into the pipette solution (*) and vs the
control (cAMP-free) condition (#). (e) The effect of adrenaline on PKA activity in α- (n=22) and β-cells
(n=85) within pancreatic islet cells isolated from Glu-RFP mice imaged using AKAR-3 sensor on
LSM510 confocal microscope (see also Figure S3 ). The PKA activity is expressed as a change of the
FRET ratio of the AKAR-3 sensor. (f) Comparison of the effects of 5μM adrenaline and 1nM-10μM
forskolin on PKA activity of pancreatic islet cells (n=870). The excerpt (below, n=62) represents the
data from cells activated by adrenaline (α-cells, see Figure 3e). Note the higher sensitivity of α-cells
to forskolin: EC50=187±50nM (n=24) and 383±7 nM (n=807) for α- and β-cells, respectively. (g)
Representative concentration-PKA activation dependence of [Ca2+]i on forskolin in α-cells measured
using Fluo4. (h) Forskolin concentration-activation curves for PKA (solid line, n=98) and [Ca2+]i
(dashed line, n=20). The effect of 5μM adrenaline on PKA measured on the same cells is mapped on
to the curves as a shaded area (4.1±0.8μM forskolin).
Page 18 of 39Diabetes

19
Figure 4 Adrenaline-induced glucagon secretion involves intracellular Ca2+ release
(a) Glucagon secreted from isolated NMRI mouse islets at 3mM with or without adrenaline and
ryanodine, xestospongin C or thapsigargin as indicated. p<0.05 vs the basal (#) or vs the effect of
glucose + adrenaline (*). (b) Representative recording of the effect of ryanodine on adrenaline-
induced [Ca2+]i increases visualized using Fluo4FF. The control (dashed) is superimposed with the
experimental trace. (c) [Ca2+]i upon adrenaline stimulation alone (n=23) or in the presence of
ryanodine (n=22), xestospongin C (n=30) or CPA (n=14), as measured using Fluo4FF. (d) [Ca2+]i upon
adrenaline stimulation alone or in the presence of Ned-19 (n=28), bafilomycin (n=36), myr-PKI and
ESI-05 (n=31) or myr-PKI + ESI-05 + Ned-19 (n=21). p<0.05 vs the basal (3 mM glucose + antagonist)
of the same recording (#) or vs the effect of 3 mM glucose + adrenaline (*). Non-significant (p>0.1) vs
the effect of 3mM glucose + adrenaline in the presence of PKI and ESI-05 (§).
Figure 5 CD38 and TPC2 but not TPC1 mediate the adrenaline response in α-cells
(a) Effect of adrenaline on [Ca2+]i in α-cells within islets isolated from TPC1-/- or TPC2-/- mice as
indicated. (b) [Ca2+]i upon adrenaline stimulation in wild-type, TPC1-/- (n=84), TPC2-/- (n=27) or CD38-/-
(n=153) mouse α-cells. p<0.05 vs basal (3 mM glucose) of the same recording (#) or vs the effect of
3mM glucose + adrenaline in wild-type animals (§). (c) Glucagon secretion from isolated mouse islets
in response to low glucose (3mM) or adrenaline in the absence/presence of Ned-19 or ryanodine,
measured in wild-type C57Bl/6n and TPC1-/-, TPC2-/- and CD38-/- mice. p<0.05 vs the basal (3 mM
glucose) (#), vs the effect of 3 mM glucose + adrenaline within the same genotype (*) or vs the effect
of 3mM glucose + adrenaline in wild-type animals (§).
Page 19 of 39 Diabetes

20
Figure 6 The adrenaline effect is attenuated by chronic hyperglycemia
(a) Typical [Ca2+]i responses to 5μM adrenaline recorded in mouse islet α-cells precultured at 11 mM
(n=102) or 30 mM (n=146) glucose for 48 hours. (b) Quantification of the data presented in (a).
p<0.05) vs the basal (3 mM glucose) of the same recording (#) or vs the effect of 3 mM glucose +
adrenaline in islets pre-cultured in 11 mM glucose (¶). (c) cAMP responses to adrenaline in
pancreatic islet α-cells pre-cultured at 11 (n=164) or 30mM (n=212) glucose. (d) PKA responses to
adrenaline in pancreatic islet α-cells pre-cultured at 11 (n=1277) or 30 mM (n=1323) glucose. (e)
Glucagon secretion from pancreatic islets pre-cultured at 11 (n=10) or 30 mM (n=10) glucose.
p<0.05) vs the basal (3 mM glucose) condition (#) or vs the respective effect in islets precultured in
11 mM glucose (¶).
Figure 7 Model of adrenaline-induced glucagon secretion. See main text for details. AC, adenylyl cyclase; Cav1.x, L-type voltage-gated Ca2+ channel; Gs, G-protein, s α-subunit. See main
text for description.
Page 20 of 39Diabetes

21
References
1. Cryer PE: Hypoglycaemia: the limiting factor in the glycaemic management of Type I and Type II
diabetes. Diabetologia 2002;45:937-948
2. Gromada J, Franklin I, Wollheim CB: Alpha-cells of the endocrine pancreas: 35 years of research
but the enigma remains. Endocr Rev 2007;28:84-116
3. Taborsky GJ, Jr., Mundinger TO: Minireview: The role of the autonomic nervous system in
mediating the glucagon response to hypoglycemia. Endocrinology 2012;153:1055-1062
4. Skrivarhaug T, Bangstad HJ, Stene LC, Sandvik L, Hanssen KF, Joner G: Long-term mortality in a
nationwide cohort of childhood-onset type 1 diabetic patients in Norway. Diabetologia 2006;49:298-
305
5. De Marinis YZ, Salehi A, Ward CE, Zhang Q, Abdulkader F, Bengtsson M, Braha O, Braun M,
Ramracheya R, Amisten S, Habib AM, Moritoh Y, Zhang E, Reimann F, Rosengren AH, Shibasaki T,
Gribble F, Renstrom E, Seino S, Eliasson L, Rorsman P: GLP-1 inhibits and adrenaline stimulates
glucagon release by differential modulation of N- and L-type Ca2+ channel-dependent exocytosis.
Cell metabolism 2010;11:543-553
6. Vieira E, Liu Y-J, Gylfe E: Involvement of alpha1 and beta-adrenoceptors in adrenaline stimulation
of the glucagon-secreting mouse alpha-cell. Naunyn Schmiedebergs Arch Pharmacol 2004;369:179-
183
7. Johansson H, Gylfe E, Hellman B: Cyclic AMP raises cytoplasmic calcium in pancreatic alpha 2-cells
by mobilizing calcium incorporated in response to glucose. Cell calcium 1989;10:205-211
8. Gromada J, Bokvist K, Ding WG, Barg S, Buschard K, Renstrom E, Rorsman P: Adrenaline stimulates
glucagon secretion in pancreatic A-cells by increasing the Ca2+ current and the number of granules
close to the L-type Ca2+ channels. The Journal of general physiology 1997;110:217-228
9. Pipeleers DG, Schuit FC, Van Schravendijk CF, Van de Winkel M: Interplay of nutrients and
hormones in the regulation of glucagon release. Endocrinology 1985;117:817-823
10. Calcraft PJ, Ruas M, Pan Z, Cheng X, Arredouani A, Hao X, Tang J, Rietdorf K, Teboul L, Chuang KT,
Lin P, Xiao R, Wang C, Zhu Y, Lin Y, Wyatt CN, Parrington J, Ma J, Evans AM, Galione A, Zhu MX:
NAADP mobilizes calcium from acidic organelles through two-pore channels. Nature 2009;459:596-
600
11. Lin WK, Bolton EL, Cortopassi WA, Wang Y, O'Brien F, Maciejewska M, Jacobson MP, Garnham C,
Ruas M, Parrington J, Lei M, Sitsapesan R, Galione A, Terrar DA: Synthesis of the Ca2+-mobilizing
messengers NAADP and cADPR by intracellular CD38 enzyme in the mouse heart: Role in beta-
adrenoceptor signaling. The Journal of biological chemistry 2017;292:13243-13257
12. Lake SP, Bassett PD, Larkins A, Revell J, Walczak K, Chamberlain J, Rumford GM, London NJ,
Veitch PS, Bell PR, et al.: Large-scale purification of human islets utilizing discontinuous albumin
gradient on IBM 2991 cell separator. Diabetes 1989;38 Suppl 1:143-145
13. Ricordi C, Lacy PE, Finke EH, Olack BJ, Scharp DW: Automated method for isolation of human
pancreatic islets. Diabetes 1988;37:413-420
14. Chen TW, Wardill TJ, Sun Y, Pulver SR, Renninger SL, Baohan A, Schreiter ER, Kerr RA, Orger MB,
Jayaraman V, Looger LL, Svoboda K, Kim DS: Ultrasensitive fluorescent proteins for imaging neuronal
activity. Nature 2013;499:295-300
15. Allen MD, Zhang J: Subcellular dynamics of protein kinase A activity visualized by FRET-based
reporters. Biochem Biophys Res Commun 2006;348:716-721
16. Liu X, Gong H, Li X, Zhou W: Monitoring calcium concentration in neurons with cameleon. J Biosci
Bioeng 2008;105:106-109
17. Cabrera O, Jacques-Silva MC, Speier S, Yang SN, Kohler M, Fachado A, Vieira E, Zierath JR, Kibbey
R, Berman DM, Kenyon NS, Ricordi C, Caicedo A, Berggren PO: Glutamate is a positive autocrine
signal for glucagon release. Cell metabolism 2008;7:545-554
Page 21 of 39 Diabetes

22
18. Samols E, Weir GC: Adrenergic modulation of pancreatic A, B, and D cells alpha-Adrenergic
suppression and beta-adrenergic stimulation of somatostatin secretion, alpha-adrenergic stimulation
of glucagon secretion in the perfused dog pancreas. J Clin Invest 1979;63:230-238
19. Panagiotidis G, Salehi AA, Westermark P, Lundquist I: Homologous islet amyloid polypeptide:
effects on plasma levels of glucagon, insulin and glucose in the mouse. Diabetes Res Clin Pract
1992;18:167-171
20. Zhang Q, Ramracheya R, Lahmann C, Tarasov A, Bengtsson M, Braha O, Braun M, Brereton M,
Collins S, Galvanovskis J, Gonzalez A, Groschner LN, Rorsman NJ, Salehi A, Travers ME, Walker JN,
Gloyn AL, Gribble F, Johnson PR, Reimann F, Ashcroft FM, Rorsman P: Role of KATP channels in
glucose-regulated glucagon secretion and impaired counterregulation in type 2 diabetes. Cell
metabolism 2013;18:871-882
21. R: A Language and Environment for Statistical Computing [article online], 2016. Available from
https://www.R-project.org/.
22. Cryer PE: Hypoglycemia, functional brain failure, and brain death. J Clin Invest 2007;117:868-870
23. Walker JN, Ramracheya R, Zhang Q, Johnson PR, Braun M, Rorsman P: Regulation of glucagon
secretion by glucose: paracrine, intrinsic or both? Diabetes, obesity & metabolism 2011;13 Suppl
1:95-105
24. Otter S, Lammert E: Exciting Times for Pancreatic Islets: Glutamate Signaling in Endocrine Cells.
Trends in endocrinology and metabolism: TEM 2016;27:177-188
25. Rorsman P, Ramracheya R, Rorsman NJ, Zhang Q: ATP-regulated potassium channels and
voltage-gated calcium channels in pancreatic alpha and beta cells: similar functions but reciprocal
effects on secretion. Diabetologia 2014;57:1749-1761
26. Esterhuizen AC, Spriggs TL, Lever JD: Nature of islet-cell innervation in the cat pancreas. Diabetes
1968;17:33-36
27. Liu YJ, Vieira E, Gylfe E: A store-operated mechanism determines the activity of the electrically
excitable glucagon-secreting pancreatic alpha-cell. Cell calcium 2004;35:357-365
28. Wallukat G: The beta-adrenergic receptors. Herz 2002;27:683-690
29. Ismail NA, El-Denshary ES, Idahl LA, Lindstrom P, Sehlin J, Taljedal IB: Effects of alpha-
adrenoceptor agonists and antagonists on insulin secretion, calcium uptake, and rubidium efflux in
mouse pancreatic islets. Acta Physiol Scand 1983;118:167-174
30. Hauge-Evans AC, King AJ, Fairhall K, Persaud SJ, Jones PM: A role for islet somatostatin in
mediating sympathetic regulation of glucagon secretion. Islets 2010;2:341-344
31. Ozaki N, Shibasaki T, Kashima Y, Miki T, Takahashi K, Ueno H, Sunaga Y, Yano H, Matsuura Y,
Iwanaga T, Takai Y, Seino S: cAMP-GEFII is a direct target of cAMP in regulated exocytosis. Nat Cell
Biol 2000;2:805-811
32. Gafni J, Munsch JA, Lam TH, Catlin MC, Costa LG, Molinski TF, Pessah IN: Xestospongins: potent
membrane permeable blockers of the inositol 1,4,5-trisphosphate receptor. Neuron 1997;19:723-
733
33. Ruas M, Davis LC, Chen CC, Morgan AJ, Chuang KT, Walseth TF, Grimm C, Garnham C, Powell T,
Platt N, Platt FM, Biel M, Wahl-Schott C, Parrington J, Galione A: Expression of Ca(2)(+)-permeable
two-pore channels rescues NAADP signalling in TPC-deficient cells. The EMBO journal 2015;34:1743-
1758
34. Wang X, Zhang X, Dong XP, Samie M, Li X, Cheng X, Goschka A, Shen D, Zhou Y, Harlow J, Zhu MX,
Clapham DE, Ren D, Xu H: TPC proteins are phosphoinositide- activated sodium-selective ion
channels in endosomes and lysosomes. Cell 2012;151:372-383
35. DiGruccio MR, Mawla AM, Donaldson CJ, Noguchi GM, Vaughan J, Cowing-Zitron C, van der
Meulen T, Huising MO: Comprehensive alpha, beta and delta cell transcriptomes reveal that ghrelin
selectively activates delta cells and promotes somatostatin release from pancreatic islets. Mol
Metab 2016;5:449-458
Page 22 of 39Diabetes

23
36. Adriaenssens AE, Svendsen B, Lam BY, Yeo GS, Holst JJ, Reimann F, Gribble FM: Transcriptomic
profiling of pancreatic alpha, beta and delta cell populations identifies delta cells as a principal target
for ghrelin in mouse islets. Diabetologia 2016;59:2156-2165
37. Blodgett DM, Nowosielska A, Afik S, Pechhold S, Cura AJ, Kennedy NJ, Kim S, Kucukural A, Davis
RJ, Kent SC, Greiner DL, Garber MG, Harlan DM, diIorio P: Novel Observations From Next-Generation
RNA Sequencing of Highly Purified Human Adult and Fetal Islet Cell Subsets. Diabetes 2015;64:3172-
3181
38. Naylor E, Arredouani A, Vasudevan SR, Lewis AM, Parkesh R, Mizote A, Rosen D, Thomas JM,
Izumi M, Ganesan A, Galione A, Churchill GC: Identification of a chemical probe for NAADP by virtual
screening. Nat Chem Biol 2009;5:220-226
39. Galione A: A primer of NAADP-mediated Ca(2+) signalling: From sea urchin eggs to mammalian
cells. Cell calcium 2015;58:27-47
40. Cancela JM, Churchill GC, Galione A: Coordination of agonist-induced Ca2+-signalling patterns by
NAADP in pancreatic acinar cells. Nature 1999;398:74-76
41. Lee CS-K, Tong BC-K, Cheng CW-H, Hung HC-H, Cheung K-H: Characterization of Two-Pore
Channel 2 by Nuclear Membrane Electrophysiology. Sci Rep 2016;6:20282
42. Capel RA, Bolton EL, Lin WK, Aston D, Wang Y, Liu W, Wang X, Burton RA, Bloor-Young D, Shade
KT, Ruas M, Parrington J, Churchill GC, Lei M, Galione A, Terrar DA: Two-pore Channels (TPC2s) and
Nicotinic Acid Adenine Dinucleotide Phosphate (NAADP) at Lysosomal-Sarcoplasmic Reticular
Junctions Contribute to Acute and Chronic beta-Adrenoceptor Signaling in the Heart. The Journal of
biological chemistry 2015;290:30087-30098
43. Arredouani A, Ruas M, Collins SC, Parkesh R, Clough F, Pillinger T, Coltart G, Rietdorf K, Royle A,
Johnson P, Braun M, Zhang Q, Sones W, Shimomura K, Morgan AJ, Lewis AM, Chuang KT, Tunn R,
Gadea J, Teboul L, Heister PM, Tynan PW, Bellomo EA, Rutter GA, Rorsman P, Churchill GC,
Parrington J, Galione A: Nicotinic Acid Adenine Dinucleotide Phosphate (NAADP) and Endolysosomal
Two-pore Channels Modulate Membrane Excitability and Stimulus-Secretion Coupling in Mouse
Pancreatic beta Cells. The Journal of biological chemistry 2015;290:21376-21392
44. Cane MC, Parrington J, Rorsman P, Galione A, Rutter GA: The two pore channel TPC2 is
dispensable in pancreatic beta-cells for normal Ca(2)(+) dynamics and insulin secretion. Cell calcium
2016;59:32-40
45. Vieira E, Salehi A, Gylfe E: Glucose inhibits glucagon secretion by a direct effect on mouse
pancreatic alpha cells. Diabetologia 2007;50:370-379
46. Rodriguez-Diaz R, Abdulreda MH, Formoso AL, Gans I, Ricordi C, Berggren PO, Caicedo A:
Innervation patterns of autonomic axons in the human endocrine pancreas. Cell metabolism
2011;14:45-54
47. Stich V, de Glisezinski I, Crampes F, Suljkovicova H, Galitzky J, Riviere D, Hejnova J, Lafontan M,
Berlan M: Activation of antilipolytic alpha(2)-adrenergic receptors by epinephrine during exercise in
human adipose tissue. Am J Physiol 1999;277:R1076-1083
48. Ludwig J, Gerlich M, Halbrügge T, Graefe KH: The synaptic noradrenaline concentration in
humans as estimated from simultaneous measurements of plasma noradrenaline and
dihydroxyphenylglycol (DOPEG). J Neural Transm Suppl 1990;32:441-445
49. Mundinger TO, Taborsky GJ, Jr.: Early sympathetic islet neuropathy in autoimmune diabetes:
lessons learned and opportunities for investigation. Diabetologia 2016;59:2058-2067
Page 23 of 39 Diabetes

Figure 1 The stimulatory effect of adrenaline on glucagon secretion is mediated by selective elevation of [Ca2+]i in pancreatic α-cells
(a) Glucagon secreted from isolated NMRI mouse islets in response to 3mM glucose with/without 5µM
adrenaline. #p<0.05 vs the effect of 3 mM glucose alone. (b) Variance of the Fluo4 intensity when the islet was perifused with 3mM glucose ± 5µM adrenaline or 20mM glucose (as indicated). The brighter cells are those in which [Ca2+]i oscillates. The arrow indicates a cell that started spiking after adrenaline had been applied. (c-d) Typical single α-cell responses to application of 1mM glutamate and 5µM adrenaline recorded in mouse (c; n=29) and human (d; n=55) islets, at 3mM glucose. (e) Representative [Ca2+]i timecourse in
the populations of α- (n=21) and non-α-cells (mostly, β-cells, n=75), differentiated by the response to glutamate. The difference in magnitude of the glutamate and the adrenaline effects was not a consistent finding. (f) [Ca2+]i changes in α-cells quantified as pAUC at 3mM glucose ± glutamate or adrenaline in
mouse (NMRI, C57Bl/6N) and human islets. p<0.05 vs the respective effect observed in NMRI mice (*) or the effect of the basal (3 mM glucose) in the same recording (#).
Page 24 of 39Diabetes
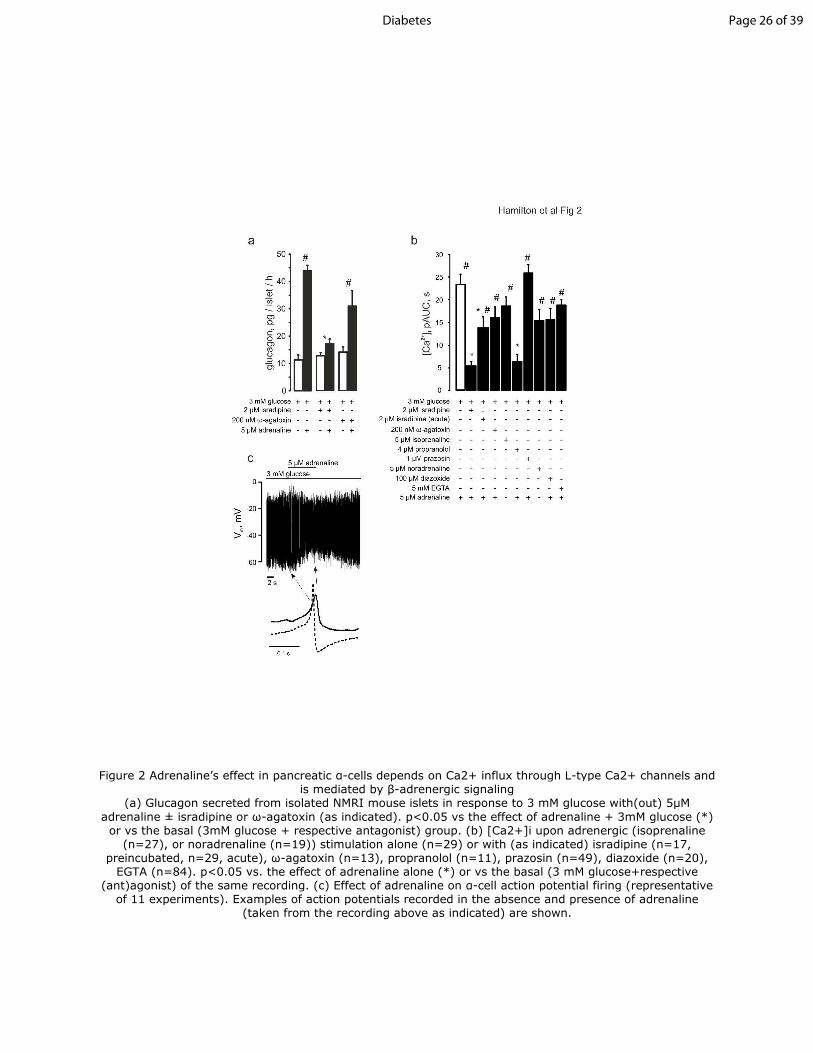
Figure 2 Adrenaline’s effect in pancreatic α-cells depends on Ca2+ influx through L-type Ca2+ channels and is mediated by β-adrenergic signaling
(a) Glucagon secreted from isolated NMRI mouse islets in response to 3 mM glucose with(out) 5µM
adrenaline ± isradipine or ω-agatoxin (as indicated). p<0.05 vs the effect of adrenaline + 3mM glucose (*) or vs the basal (3mM glucose + respective antagonist) group. (b) [Ca2+]i upon adrenergic (isoprenaline
(n=27), or noradrenaline (n=19)) stimulation alone (n=29) or with (as indicated) isradipine (n=17, preincubated, n=29, acute), ω-agatoxin (n=13), propranolol (n=11), prazosin (n=49), diazoxide (n=20),
EGTA (n=84). p<0.05 vs. the effect of adrenaline alone (*) or vs the basal (3 mM glucose+respective (ant)agonist) of the same recording. (c) Effect of adrenaline on α-cell action potential firing (representative
of 11 experiments). Examples of action potentials recorded in the absence and presence of adrenaline (taken from the recording above as indicated) are shown.
Page 26 of 39Diabetes

Figure 3 Adrenaline mediates its effects via elevation of [cAMP]i (a) Glucagon secretion from isolated NMRI mouse islets in response to 3mM glucose. Adrenaline, myr-PKI or
ESI-05 was added as indicated. p<0.05 vs the basal (3 mM glucose + respective antagonist) (#), vs the
effect of 3 mM glucose + adrenaline (*) or vs the effect of 3mM glucose + adrenaline in the presence of ESI-05 (¶). (b) [Ca2+]i upon application of (as indicated) adrenaline ± myr-PKI (n=32) or ESI-05
(n=12). p<0.05 vs the basal of the same recording (#) or vs the effect of 3 mM glucose + adrenaline (*). (c) Representative recording of the depolarization-induced increases in plasma membrane electrical
capacitance. (d) Exocytosis in α-cells. The pipette solution contained (as indicated) either no cAMP (n=7) or 0.1mM cAMP (n=11) and PKA (1µM PKI, n=32) or EPAC2 (25µM ESI-05, n=11). p<0.05 vs the effect of
addition of cAMP into the pipette solution (*) and vs the control (cAMP-free) condition (#). (e) The effect of adrenaline on PKA activity in α- (n=22) and β-cells (n=85) within pancreatic islet cells isolated from Glu-RFP mice imaged using AKAR-3 sensor on LSM510 confocal microscope (see also Figure S3). The PKA activity is
expressed as a change of the FRET ratio of the AKAR-3 sensor. (f) Comparison of the effects of 5µM adrenaline and 1nM 10µM forskolin on PKA activity of pancreatic islet cells (n=870). The excerpt (below,
n=62) represents the data from cells activated by adrenaline (α-cells, see Figure 3e). Note the higher sensitivity of α-cells to forskolin: EC50=187±50nM (n=24) and 383±7 nM (n=807) for α- and β-cells,
respectively. (g) Representative concentration-PKA activation dependence of [Ca2+]i on forskolin in α-cells measured using Fluo4. (h) Forskolin concentration-activation curves for PKA (solid line, n=98) and [Ca2+]i (dashed line, n=20). The effect of 5µM adrenaline on PKA measured on the same cells is mapped on to the
curves as a shaded area (4.1±0.8µM forskolin).
Page 27 of 39 Diabetes

Figure 4 Adrenaline- �induced glucagon secretion involves intracellular Ca2+ release (a) Glucagon secreted from isolated NMRI mouse islets at 3mM with or without adrenaline and ryanodine, xestospongin C or thapsigargin as indicated. p<0.05 vs the basal (#) or vs the effect of glucose + adrenaline (*). (b)
Representative recording of the effect of ryanodine on adrenaline-induced [Ca2+]i increases visualized using Fluo4FF. The control (dashed) is superimposed with the experimental trace. (c) [Ca2+]i upon adrenaline
stimulation alone (n=23) or in the presence of ryanodine (n=22), xestospongin C (n=30) or CPA (n=14), as measured using Fluo4FF. (d) [Ca2+]i upon adrenaline stimulation alone or in the presence of Ned-19
(n=28), bafilomycin (n=36), myr-PKI and ESI-05 (n=31) or myr-PKI + ESI-05 + Ned-19 (n=21). p<0.05
vs the basal (3 mM glucose + antagonist) of the same recording (#) or vs the effect of 3 mM glucose +
�adrenaline (*).
Page 28 of 39Diabetes

Figure 5 CD38 and TPC2 but not TPC1 mediate the adrenaline response in α-cells (a) Effect of adrenaline on [Ca2+]i in α-cells within islets isolated from TPC1-/- or TPC2-/- mice as indicated. (b) [Ca2+]i upon adrenaline stimulation in wild-type, TPC1-/- (n=84), TPC2-/- (n=27) or CD38-/- (n=153)
mouse α-cells. p<0.05 vs basal (3 mM glucose) of the same recording (#) or vs the effect of 3 mM glucose + adrenaline (*). (c) Glucagon secretion from isolated mouse islets in response to low glucose (3mM) or
adrenaline in the absence/presence of Ned-19 or ryanodine, measured in wild-type C57Bl/6n and TPC1-/-, TPC2-/- and CD38-/- mice. p<0.05 vs the basal (3 mM glucose) (#), vs the effect of 3 mM glucose +
adrenaline within the same genotype (*) or vs the effect of 3mM glucose + adrenaline in wild-type animals (§).
Page 29 of 39 Diabetes
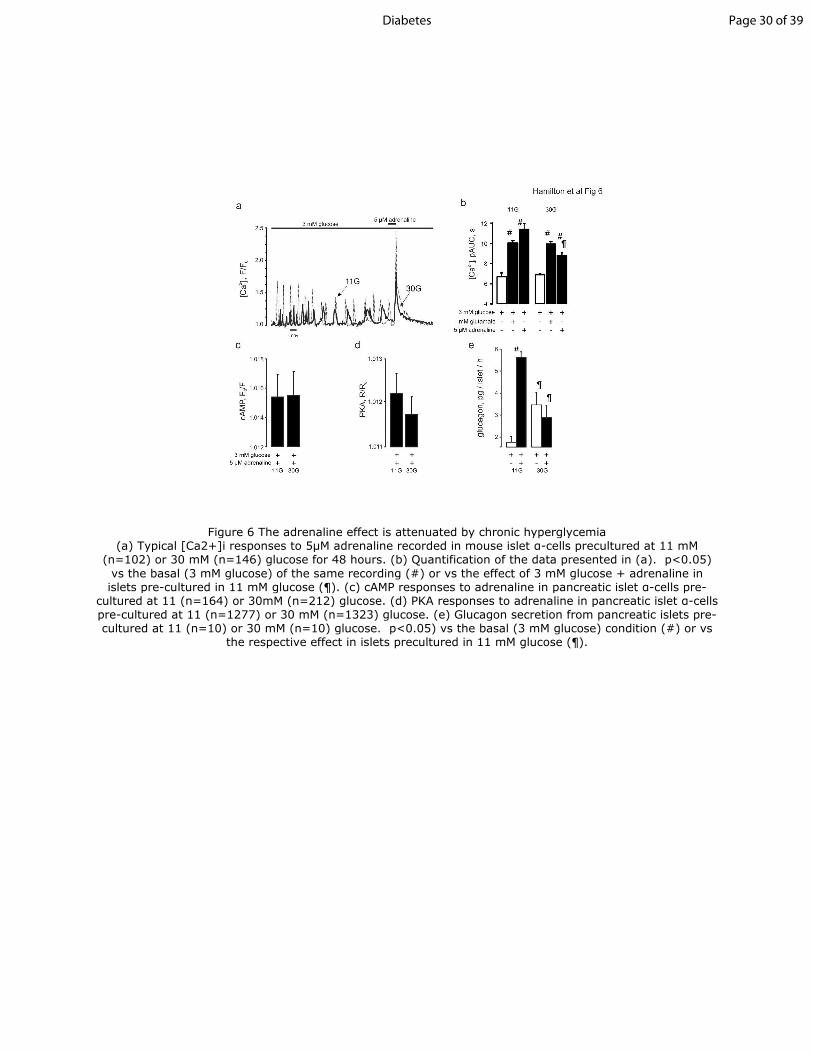
Figure 6 The adrenaline effect is attenuated by chronic hyperglycemia (a) Typical [Ca2+]i responses to 5µM adrenaline recorded in mouse islet α-cells precultured at 11 mM
(n=102) or 30 mM (n=146) glucose for 48 hours. (b) Quantification of the data presented in (a). p<0.05)
vs the basal (3 mM glucose) of the same recording (#) or vs the effect of 3 mM glucose + adrenaline in islets pre-cultured in 11 mM glucose (¶). (c) cAMP responses to adrenaline in pancreatic islet α-cells pre-
cultured at 11 (n=164) or 30mM (n=212) glucose. (d) PKA responses to adrenaline in pancreatic islet α-cells pre-cultured at 11 (n=1277) or 30 mM (n=1323) glucose. (e) Glucagon secretion from pancreatic islets pre-cultured at 11 (n=10) or 30 mM (n=10) glucose. p<0.05) vs the basal (3 mM glucose) condition (#) or vs
the respective effect in islets precultured in 11 mM glucose (¶).
Page 30 of 39Diabetes

Figure 7 Model of adrenaline-induced glucagon secretion. See main text for details. AC, adenylyl cyclase; Cav1.x, L-type voltage-gated Ca2+ channel; Gs, G-protein, s α-subunit. See main text
for description.
Page 31 of 39 Diabetes

Online Supplemental material
Supplementary figure legends
Figure S1 Partial area under the curve
(a) Representative [Ca2+]i timecourse in α-cells (above) the populations of islet cells (below) showing
the effect of the addition of adrenaline at 1 or 3 mM glucose. (b-c) Representative [Ca2+]i timecourse
in the populations of: (b) glutamate/adrenaline responsive cells (α-cells) and δ-cells, as
differentiated by glutamate response and expression of RFP, respectively, and (c) β-cells and δ-cells,
in sst-RFP mice expressing GCamp3 ubiquitously. (d) Representative recording of [Ca2+]i dynamics
processed and quantified as partial area under the curve (pAUC). The recording (above, red) is split
into equal time intervals (as indicated by the dashed lines) and area under the curve is computed for
each interval (blue). Note that pAUC is sensitive to changes in both Ca2+ frequency and amplitude
changes (below). (e) Representative [Ca2+]i timecourse in human α-cells showing the effect of the
addition of adrenaline at 1mM glucose. (f) 3-D plot of [Ca2+]i (pAUC) values recorded for each
individual mouse α-cell in response to 3mM glucose alone or with glutamate or adrenaline, as
indicated. The ideal correlation would assume that the individual cell values are positioned along the
main diagonal of the “3 mM glucose”-“glutamate”-“adrenaline” cube.
Page 32 of 39Diabetes

Page 33 of 39 Diabetes

Figure S2 Stimulatory effect of adrenaline can be dissociated from α-cell electrical
activity
(a) Action potentials recorded from α- and δ -cells. Note that action potentials in δ-cells are much
shorter than those in α-cells and that they are of much larger amplitude. Note that action potentials
in δ-cells are fired at lower frequency than those in α-cells and that they are of much larger
amplitude. The data was obtained from mouse islets, in which RFP was expressed under tissue-
specific promoters to mark α-cells or δ-cells, respectively. (b-d) Representative trace of the effect of
the acute inhibition of L-type Ca2+ channels with isradipine (b), chelation of the extracellular Ca2+
with EGTA (c) or opening of K+ channels with diazoxide on the adrenaline response in the α-cell. (e)
Quantification of the effect in (c, d), n=84, n=72, respectively. p<0.05) differences vs the effect of 3
mM glucose alone (¶) or basal (3 mM glucose+(ant)agonist) of the same recording (#). (f-g) Effect of
isoprenaline on α-cell action potential frequency (f, above) and most negative interspike membrane
potential (f, below; solid circles) and peak of the spike (f, below: open circles) (n=11). (g) Spike
duration (n=3 recordings) in the absence and presence of adrenaline. p<0.05 differences vs effect of
3 mM glucose alone in the same recording (#).
Page 34 of 39Diabetes

Page 35 of 39 Diabetes

Figure S3 Adrenaline induces PKA increase specifically in pancreatic α-cells
(a) Confocal images of Glu-RFP mouse islets expressing AKAR3 sensor; arrows indicate α-cells
expressing AKAR3. (b) Changes in PKA activity (quantified as a fold increase of the AKAR3 FRET ratio)
in α- and β-cells in response to forskolin and adrenaline as indicated. The bottom heat map
represents the data from all the cells within the islet: each line represents the timecourse of an
individual cell, color-coded according to the calibration bar to the right. (c) Effect of adrenaline on
[cAMP]i in human pancreatic islets measured using the downward cADDis sensor and presented as a
heat map. Populations of α-cells (cAMP increases in response to 5μM adrenaline) and β-cells (cAMP
decreases in response to 5μM adrenaline) are clearly visible.
Page 36 of 39Diabetes

Page 37 of 39 Diabetes

Figure S4 Effect of pulse duration on capacitance increase
(a) Representative traces of capacitance increases in the presence/absence (n=11) of cAMP in the
patch pipette, with or without (n=7) myr-PKI (n=32) and ESI-05 (n=11), in response to the 10ms,
20ms, 200ms and 300ms depolarizations. (b) [Ca2+]i transients evoked by the depolarization steps in
(a), imaged simultaneously with cell capacitance measurements. See Error! Reference source not
found.c for responses to a shorter depolarization.
Page 38 of 39Diabetes

Figure S5 Role of the Ca2+ release from ER and acute insulin
(a) [Ca2+]i quantified as pAUC upon adrenaline stimulation alone or in the presence of ryanodine
(n=56), xestospongin C (n=24), thapsigargin (n=23) as indicated. (b) [Ca2+]i quantified as pAUC
recorded in α-cells at 3mM glucose with or without 100nM insulin (n=20) or 10 μM S961 (n=20).
p<0.05 differences vs the basal (3 mM glucose + antagonist) of the same recording (#).
Page 39 of 39 Diabetes

Movie1 Pharmacology of Ca2+ dynamics in pancreatic α-cells
Timecourse of [Ca2+]i imaged in mouse islet of Langerhans using Fluo-4 dye on the confocal
microscope using 40x objective (see Research Design and Methods). The intensity of the dye is
coded using a color loo-up table, as indicated. Several cells (e.g. the one indicated by the arrow)
display clear [Ca2+]i oscillations under basal (3 mM glucose) conditions. Subsequent additions of
glutamate and adrenaline dramatically enhance Ca2+ dynamics in these cells.
https://www.dropbox.com/s/gdqn8pdulwazfyc/Hamilton_et_al_movie_01.gif?dl=0
Movie2 Adrenaline effect interacts with chronic hyperglycemia
Timecourse of [Ca2+]i imaged in groups of islets precultured at 11 or 30 mM glucose, as indicated,
using recombinant sensor GCamp6f and imaged on a zoom microscope (see Research Design and
Methods)
https://www.dropbox.com/s/dblgi24bmurmc7c/Hamilton_et_al_movie_02.gif?dl=0
Page 40 of 39Diabetes