overview of recent physics results from masteprints.whiterose.ac.uk/118857/1/1611.06047.pdf · m...
TRANSCRIPT
This is a repository copy of Overview of recent physics results from MAST.
White Rose Research Online URL for this paper:http://eprints.whiterose.ac.uk/118857/
Version: Accepted Version
Article:
Kirk, Andrew, Dickinson, David orcid.org/0000-0002-0868-211X, Dudson, Benjamin Daniel orcid.org/0000-0002-0094-4867 et al. (10 more authors) (2017) Overview of recent physicsresults from MAST. Nuclear Fusion. 102007. pp. 1-17. ISSN 1741-4326
https://doi.org/10.1088/1741-4326/aa65e0
[email protected]://eprints.whiterose.ac.uk/
Reuse
["licenses_typename_unspecified" not defined]
Takedown
If you consider content in White Rose Research Online to be in breach of UK law, please notify us by emailing [email protected] including the URL of the record and the reason for the withdrawal request.

1
17/11/16
Overview of recent physics results from MAST
A Kirk1, J Adamek
2, RJ Akers
1, S Allan
1, L Appel
1, F Arese Lucini
3, M Barnes
4, T Barrett
1,
N Ben Ayed1, W Boeglin
5, J Bradley
6, P K Browning
3, J Brunner
7, P Cahyna
2, S Cardnell
3,
M Carr1, F Casson
1, M Cecconello
8, C Challis
1, IT Chapman
1, S Chapman
13, J Chorley
7,
S Conroy8, N Conway
1, WA Cooper
9, M Cox
1, N Crocker
10, B Crowley
1, G Cunningham
1,
A Danilov11
, D Darrow12
, R Dendy13
, D Dickinson14
, W Dorland15
, B Dudson14
, D Dunai16
,
L Easy14
, S Elmore1, M Evans
3, T Farley
6, N Fedorczak
17, A Field
1, G Fishpool
1,
I Fitzgerald1, M Fox
4, S Freethy
1, L Garzotti
1, YC Ghim
18, K Gi
19, K Gibson
14,
M Gorelenkova12
, W Gracias20
, C Gurl1, W Guttenfelder
12, C Ham
1, J Harrison
1,
D Harting1, E Havlickova
1, N Hawkes
1, T Hender
1, S Henderson
1, E Highcock
4,
J Hillesheim1, B Hnat
13, J Horacek
2, J Howard
21, D Howell
1, B Huang
1, K Imada
14,
M Inomoto19
, R Imazawa22
, O Jones7, K Kadowaki
19, S Kaye
12, D Keeling
1, I Klimek
8,
M Kocan23
, L Kogan1, M Komm
2, W Lai
13, J Leddy
14, H Leggate
24, J Hollocombe
1,
B Lipschultz14
, S Lisgo23
, YQ Liu1, B Lloyd
1, B Lomanowski
7, V Lukin
25, I Lupelli
1,
G Maddison1, J Madsen
26, J Mailloux
1, R Martin
1, G McArdle
1, K McClements
1,
B McMillan13
, A Meakins1, H Meyer
1, C Michael
21, F Militello
1, J Milnes
1, AW Morris
1,
G Motojima27
, D Muir1, G Naylor
1, A Nielsen
28, M O’Brien1
, T O’Gorman1,
M O’Mullane29, J Olsen
26, J Omotani
1, Y Ono
30, S Pamela
1, L Pangione
1, F Parra
4,
A Patel1, W Peebles
10, R Perez
5, S Pinches
23, L Piron
1, M Price
1, M Reinke
14, P Ricci
9,
F Riva9, C Roach
1, M Romanelli
1, D Ryan
1, S Saarelma
1, A Saveliev
31, R Scannell
1,
A Schekochihin4, S Sharapov
1, R Sharples
7, V Shevchenko
1, K Shinohara
22, S Silburn
7,
J Simpson1, A Stanier
3, J Storrs
1, H Summers
29, Y Takase
30, P Tamain
17, H Tanabe
19,
H Tanaka32
, K Tani33
, D Taylor1, D Thomas
14, N Thomas-Davies
1, A Thornton
1,
M Turnyanskiy1, M Valovic
1, R Vann
14, F Van Wyk
4, N Walkden
14, T Watanabe
19,
H Wilson14
, M Wischmeier34
, T Yamada35
, J Young36
, S Zoletnik16
and the MAST Team
and the EUROfusion MST1 Team37
1 CCFE, Culham Science Centre, Abingdon, Oxon, OX14 3DB, UK 2 Institute of Plasma Physics AS CR vvi, Prague, Czech Republic 3 Jodrell Bank Centre for Astrophysics, University of Manchester, Manchester M13 9PL, UK 4 Rudolf Peierls Centre for Theoretical Physics, University of Oxford, Oxford, UK 5 Department of Physics, Florida International University, Miami, FL 33199 Florida, USA 6 Department of Electrical Engineering and Electronics, University of Liverpool, Liverpool, UK 7 Department of physics, University of Durham, Durham, DH1 3LE, UK 8 VR, Uppsala University, SE-75120 Uppsala, Sweden 9 CRPP, EPFL, 1015 Lausanne, Switzerland 10 University of California, Los Angeles, Los Angeles, California 90095, USA 11 Russian Research Centre, Kurchatov Institute, Institute of Nuclear Fusion, Moscow, Russia 12 Princeton Plasma Physics Laboratory, PO Box 451, Princeton, New Jersey 08543, USA 13 Centre for Fusion, Space and Astrophysics, Department of Physics, Warwick University, UK 14 York Plasma Institute, Department of physics, University of York, Heslington, York, UK 15 University of Maryland, College Park, MD, USA 16 KFKI-RMKI, Pf. 49, H-1525 Budapest, Hungary
2
17 CEA, IRFM, F-13108 Saint Paul-lez-Durance, France 18 National Fusion Research Institute, Daejeon 169-148, Korea 19 Graduate School of Frontier Sciences, University of Tokyo, Tokyo, 113-0032, Japan 20 Departamento de Física, Universidad Carlos III de Madrid, 28911 Leganes, Spain 21 Plasma Research Laboratory, Australian National University, Canberra, ACT 0200, Australia 22 Japan Atomic Energy Agency, Ibaraki, 311-0193, Japan 23 ITER Organization, CS 90046, 13067 St Paul-Lez-Durance Cedex, France 24 Dublin City University, Glasnevin, Dublin, Ireland 25 National Science Foundation, Arlington, VA 22230, USA 26 Department of Physics, Technical University of Denmark, 2800 Kgs. Lyngby, Denmark 27 NIFS, Oroshi-cho, Toki City, Gifu, Japan 28 Risø, National Laboratory for Sustainable Energy, PO Box 49, Roskilde, Denmark 29 Department of Physics SUPA, University of Strathclyde, Glasgow, G4 ONG, UK 30 University of Tokyo, Kashiwa 277-8561, Japan 31 Ioffe Institute, Politekhnicheskaya 26, 194021 St. Petersburg, Russia 32 Graduate School of Energy Science, Kyoto University, Kyoto 606-8502, Japan 33 Tokyo Institute of Technology, Ookayama Campus, 2-12-1 Ookayama, Meguro-ku, Tokyo 152-8550, Japan 34 Max-Planck Institut fur Plasmaphysik, Boltzmannstrasse 2, D-85748 Garching, Germany 35 Faculty of Arts and Science, Kyusyu University, Fukuoka, 819-0395, Japan 36 University of Manchester, Manchester, UK 37 See appendix of H. Meyer et.al. (OV/P-12) Proc. 26th IAEA Fusion Energy Conf. 2016, Kyoto, Japan
Abstract
New results from MAST are presented that focus on validating models in order to extrapolate to future devices. Measurements during start-up experiments have shown how the bulk ion temperature rise scales with the square of the reconnecting field. During the current ramp up models are not able to correctly predict the current diffusion. Experiments have been performed looking at edge and core turbulence. At the edge detailed studies have revealed how filament characteristic are responsible for determining the near and far SOL density profiles. In the core the intrinsic rotation and electron scale turbulence have been measured. The role that the fast ion gradient has on redistributing fast ions through fishbone modes has led to a redesign of the neutral beam injector on MAST Upgrade. In H-mode the turbulence at the pedestal top has been shown to be consistent with being due to electron temperature gradient modes. A reconnection process appears to occur during ELMs and the number of filaments released determines the power profile at the divertor. Resonant magnetic perturbations can mitigate ELMs provided the edge peeling response is maximised and the core kink response minimised. The mitigation of intrinsic error fields with toroidal mode number n>1 has been shown to be important for plasma performance.

3
1. Introduction
The Mega Ampere Spherical Tokamak (MAST) is a low aspect ratio device (R/a =
0.85m/0.65m ~ 1.3) with a cross-section similar to other medium sized devices. MAST’s
high-resolution diagnostic capability is complemented by sophisticated numerical
modelling to facilitate deeper understanding. Although MAST has not operated since 2013
there has been substantial analysis and modelling performed on data obtained previously.
The main aim of the analysis has been to validate models in order to allow extrapolation to
future devices, in particular, MAST Upgrade [1], which is currently in the final stages of
construction and will begin operation in 2017. Particular attention will be given to the areas
of scenario development, fast particle physics and plasma exhaust, for which MAST
Upgrade has unique capabilities. The layout of the paper follows the natural shot cycle. In
section 2 start-up studies are described, while in section 3 we discuss how the current ramp
can be used to test models of current diffusion. Section 4 is concerned with L-mode physics
and in particular the Scrape Off Layer (SOL), core and fast ion physics. In section 5 we
consider H-mode, specifically the nature of the pedestal, how the toroidal mode number of
Edge Localised Modes (ELMs) affect the area over which the power is deposited on the
divertor and how ELMs can be controlled using Resonant Magnetic Perturbations (RMPs).
Section 6 looks at understanding and correcting intrinsic error fields which limit both the
performance and duration of shots, while section 7 presents a summary and a look ahead to
MAST Upgrade.
2. Start-up
MAST often used a so called “Merging-Compression” plasma start-up scheme in which the
flux generated by ramping the current through an in-vessel low field side poloidal field coil
(P3) is used to initiate the plasma. Breakdown occurs in the form of plasma rings around
the P3 coils at the top and bottom of the vessel. The two current-carrying plasma rings
approach each other due to mutual attraction, forming a current sheet and subsequently
merge through magnetic reconnection into a single plasma torus, with substantial plasma
heating. Detailed 2D profile measurements of electron and ion temperature and electron
4
density have been made during merging reconnection start-up. The electron temperature
forms a highly localized hot spot at the X-point, whilst the ion temperature increases
downstream of this point [2]. When the toroidal field is more than three times the
reconnecting field, the closed flux surfaces formed by the reconnected field sustain the
temperature profile for longer than the electron/ion energy relaxation time ~4-10ms; with
both profiles forming a triple peak structure centred on the X point. An increase in the
toroidal field results in a more peaked electron temperature profile at the X-point (i.e.
localised electron heating), and also produces higher ion temperatures at this point, but the
ion temperature profile in the downstream region is unaffected [2]. The bulk ion
temperature rise resulting from the reconnection process scales with the square of the
reconnection field [3]. The ions are mostly heated in this downstream region by viscous
dissipation and shock-like compressional damping of the outflow jet. A model based on
magnetic helicity-conserving relaxation to a minimum energy state has been applied to the
magnetic reconnection processes in both MAST and the solar corona [4]. In the case of
MAST the average temperature rise predicted by this model is in good agreement with
experimental measurements if it is assumed that most of the dissipated magnetic energy is
converted to thermal energy. In addition, two-fluid (Hall Magneto Hydrodynamic)
simulations of the merging process in MAST are able to match fairly well the measured
temporal evolution of the density and temperature profiles.
3. Current ramp and current diffusion
Tokamaks typically use the current ramp-up to tailor the q-profile for the main heating
phase of advanced tokamak scenarios. The capability to predict the q-profile evolution
throughout the current ramp-up phase in response to the IP ramp-rate, externally applied
heating, plasma density and plasma shaping is crucial for the design of new plasma
scenarios. The q-profile evolution has been measured throughout the current ramp-up and
flat-top phase of a plasma with no additional heating [5]. The current profile was
determined by EFIT [6] equilibrium calculations constrained using high quality Motional
Stark Effect (MSE) [7] measurements of the plasma, combined with high resolution
Thompson scattering (TS) [8] and Z effective [9] measurements. The experimental data is

5
used as inputs to the TRANSP [10] code, which models the current diffusion assuming
neoclassical resistivity [11][12]. In both ramp-up and ramp-down experiments the current
diffusion is not well modelled by TRANSP.
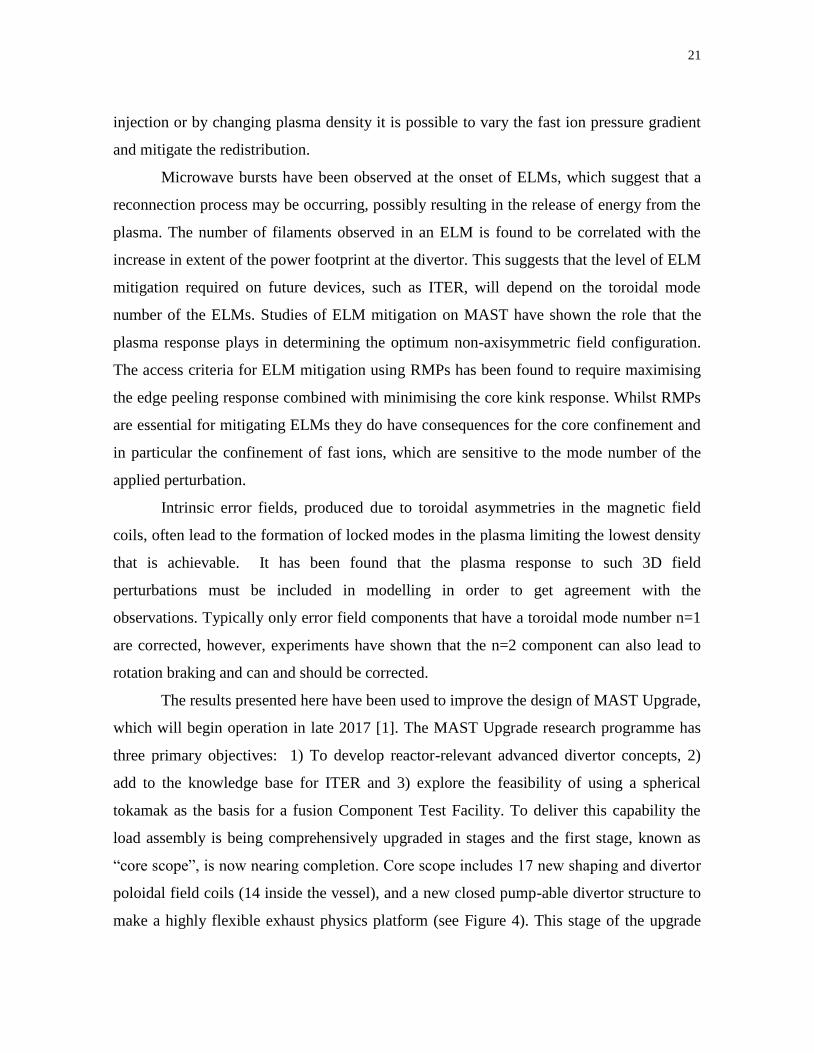
This inconsistency between simulation and experiment can be seen in Figure 1a-c.
Figure 1b and c show the resulting value of the safety factor (q) produced from an MSE
constrained EFIT obtained at specific times in the discharge compared to the results
obtained from the TRANSP simulation at, respectively, the magnetic axis (q0) and the half
radius (q0.5). Despite a good match to measurements at run initialisation, after 50ms the
simulated MSE data lies well outside the region bounded by the experimental error bars.
The discrepancy between measurements and simulation is particularly pronounced at the
half radius during the current ramp and early flat-top. The discrepancy becomes significant
at the axis in the latter stages of the IP flat-top where the modelled current diffusion is faster
than that observed experimentally. There is no observable Magneto Hydrodynamic (MHD)
activity in these plasmas in the period shown.
Experiments repeated in the flat top phase (see Figure 1d-f) show that after ~ 200ms
of the flat top period the TRANSP simulations, which include neoclassical resistivity and a
sawtooth model, are able to well describe the current evolution. In summary it would
appear that our fundamental understanding of current diffusion appears to be correct but at
present the models do not accurately reproduce the current ramp up phase.
In the present work the q profile has been used to conveniently illustrate the
discrepancy between experiment and modelling. The advantage of the MSE diagnostic is
that it gives a time-dependent measurement across the plasma profile and by specifying an
equivalent synthetic diagnostic in the modelling; a direct comparison with the
measurements is possible without any additional processing or interpretation. Other
quantities, such as the loop voltage profile can, and have been calculated for theses shots. In
the case of loop voltage, whilst the profile may be calculated, only the surface value is
comparable to an experimental quantity.
All such information is being studied and shows the discrepancy between the
modelling and experiment in a consistent manner and depending on how the model is
constrained the discrepancy can be shown in different quantities. For example, if the

6
modelling is constrained such that the current profile evolves according to the poloidal field
diffusion equation and a specified resistivity model, the discrepancy can be shown as a
difference between measured and calculated MSE angles and a difference between
measured and calculated loop voltage. If the current profile is constrained by MSE
measurements and loop voltage also constrained by experimental measurements, the
discrepancy is shown as a difference between calculated and inferred resistivity profile. It is
therefore still unclear which part of the calculation leads to the discrepancy.
4. L-mode
4.1 SOL transport
Understanding filamentary transport across the scrape off layer is a key issue for the design
and operation of future devices as it is crucial in determining the power loadings to the
divertor and first wall of the machine. The recent MAST exhaust programme has focussed
on investigating the basic mechanisms responsible for setting plasma profiles in the SOL
and their interplay with intermittent fluctuations (filaments), and on the physics of
advanced divertors. A detailed characterisation of the MAST Scrape Off Layer has been
performed including results from new diagnostics giving plasma potential and ion
temperature measurements, which have then been compared to extensive modelling using
the BOUT++ [13] and SOLPS [14] codes.
In L- and H-mode, it is commonly observed that the midplane density decay length
increases with distance from the separatrix and with line averaged density. On MAST this
density broadening occurs in the absence of detachment and independently from ionisation
sources in the SOL [15]. In addition at similar densities, discharges with a higher plasma
current do not show broadening, possibly due to the reduction in the connection length;
implying that parallel as well as cross field transport regulate the SOL decay lengths [15].
Precise measurements of the density and electron temperature were also made available by
a new binning technique of the Thomson scattering data. Mean profiles showed near-SOL
decay lengths decrease with plasma current and increase with fuelling levels. A good
correlation was found between decay lengths and the D emission, suggesting a role for the
neutral particles in setting the profiles.

7
At the midplane, new measurements techniques, including a Ball-pen (BPP) [16]
and a Retarding Field Energy Analyser (RFEA) [17] have been used to make profile
measurements by attaching them to a reciprocating probe drive. The BPP technique was
used to make profile measurements of plasma potential, electron temperature and radial
electric field in L-mode plasmas [16]. The measured plasma potential profile is shown to
significantly differ from the floating potential both in polarity and profile shape. By
combining the BPP potential and the floating potential, the electron temperature was
calculated and found to be in good agreement with the values obtained from the TS
diagnostic when secondary electron emission is accounted for in the floating potential [16].
The calculated radial electric field (ER) is of the order of 1kV/m and increases with plasma
current. The simultaneous measurement of ER and the fluctuation characteristics from ion
saturation current measurements (ISAT) allows the birth location of the filaments to be
investigated. Figure 2 shows a plot of the skewness of the ISAT signal versus the gradient of
the electric field obtained during the reciprocation of the BPP into an L-mode plasma. The
location where the skewness is smallest is often considered to be the region where the
filaments are born and this is found to correspond to the location were the E-field gradient
is largest.
Since plasma filaments play the dominant role in anomalous transport, they could
also be important in determining the SOL profiles. At the target, L-mode filaments form
spiral patterns that produce bands of increased heat flux, which were measured using
infrared thermography [18]. These results showed that filaments can account for the full
divertor target heat flux in the far SOL. In the near SOL the filaments overlap and hence it
is more difficult to establish their contribution from the target data. To try to determine the
role of filaments in the near SOL a study has been performed of the characteristics of the
filaments as a function of plasma current observed in L-mode plasmas, using visible
imaging at the mid-plane [19]. This analysis showed that the radial velocity (Vr), and to a
lesser extent the radial size of the filaments, decreases as the plasma current is increased at
constant density and input power. The decrease in Vr is in the same proportion to the
decrease in mid-plane density fall off length (ne) namely; a 56% reduction in Vr is
consistent with a ~60% reduction in ne over the IP range studied (400-900 kA). Figure 3

8
demonstrates the observed correlation between ne and Vr, which is compatible with the
idea that the filaments are responsible for determining the particle profiles at the divertor.
Detailed measurements of the motion, shape and amplitude of individual filaments
identified in these high speed movies were compared to large scale 3D two-fluid
simulations conducted in the STORM module of BOUT++ [20]. The simulations are able
to reproduce the motion of the observed filaments within the accuracy of the experimental
measurements. The numerical results showed that filaments characterised by similar size
and light emission intensity can have quite different dynamics if the pressure perturbation is
distributed differently between density and temperature components. In particular it has
been found that a filament with a larger temperature perturbation moves slower in the radial
direction than a filament dominated by a density perturbation [21]. This suggests a possible
mechanism for the observed IP dependence discussed above whereby at higher IP the
filaments have a higher Te and hence smaller Vr.
Linking the transient events to the midplane profiles, a theoretical framework was
developed to interpret the experimental features of the density profiles on the basis of
simple properties of the filaments, such as their radial motion and their draining towards the
divertor [22]. This describes L-mode and inter-ELM filaments as a Poisson process in
which each event is modelled as a wave function with (initial) amplitude and width
statistically distributed according to experimental observations and dynamically evolving
according to reduced fluid equations. The main strength of this statistical framework is its
flexibility and its ability to test different models of filament dynamics. For example, it can
be used to investigate the non-exponential nature of SOL profiles. It is found that a number
of mechanisms may be able to explain the flattening of the density and electron temperature
in the far SOL [23] and it is likely that several mechanisms are involved at the same time.
In order to guide experimental planning for MAST Upgrade the SOLPS code has
been benchmarked against MAST discharges. The parameters extracted from this
benchmarking have then been used to simulate both conventional and Super-X
configurations in MAST-U [24]. In comparison to MAST, MAST-U will operate with a
closed pumped divertor system (see Figure 4). MAST-U is designed to investigate a range
of divertor topologies that have different strike point position, connection length and flux

9
expansion. The simulations show that the Super-X configuration will detach at lower
density (×1/3) or higher power (×4) with respect to the conventional divertor. The new
divertor is predicted to significantly reduce the target power load through magnetic
geometry and baffling as the tight closure of the divertor region leads to a strong increase in
neutral density with associated power losses [24].
In order to simulate inter-ELM H-mode plasmas, the SOLPS radial transport
diffusivities were tuned to give an upstream radial e-folding length for density of そne=6.3
mm and for electron temperature of そTe=16.8 mm, in line with values observed for MAST
in H-mode [25]. This tuning was done on the same MAST grid as used in reference [24].
The resulting simulated energy flux density at the target was fitted with an Eich function
[26] to give a radial e-folding length of そq=8.0 mm (mapped to the outer mid-plane), in line
with MAST infra-red measurements [27]. The same radial transport diffusivities were then
used on conventional and Super-X MAST-U grids and density scans were performed in the
core scope scenario (5 MW heating power, turbo-pumps only). It was assumed that up to
30% of the heating power would be lost via imperfect absorption, while a further 20% was
assumed to be spent rebuilding the pedestal between ELMs. Thus the power into the
simulation grids was 2.5 MW. Figure 5 shows the total deuterium ion flux to the outer
target as a function of the outer mid-plane separatrix electron density, in conventional and
Super-X geometries. In these simulations, in H-mode without impurity seeding, access to
detachment (corresponding to full rollover of the target ion flux) at realistic upstream
densities was only possible in the super-X configuration.
4.2 Core physics
Tokamak plasmas can rotate even when there is no external input of momentum, and this
so-called “intrinsic rotation” can spontaneously change direction with relatively small
changes in plasma conditions [28][29][30]. Understanding the mechanisms that drive this
rotation is important for predictions of future reactors where neutral beams will typically
produce little rotation. A Doppler backscattering (DBS) system has been used to make
measurements of the intrinsic rotation in L-mode plasmas, including the first observation of
intrinsic rotation reversals in a spherical tokamak [31]. Experimental results were compared
to a 1D model, which captures the collisionality dependence of the radial transport of

10
toroidal angular momentum due to finite drift orbit effects on turbulent fluctuations [32].
The model is able to accurately reproduce the change in sign of core toroidal rotation, using
experimental density and temperature profiles from shots with rotation reversals as inputs
but no other free parameters. However, there are some examples at low density and low
plasma current that clearly disagree, which indicates there may be additional physics at play
The DBS system has also been used to investigate core turbulence. Ion scale
turbulence (kԋi <1.0) is strongly suppressed in spherical tokamaks, so in order to
understand the dominant transport mechanisms it is important to diagnose higher
wavenumbers. The high-k (7 < kԋi < 11) wavenumber spectrum of density fluctuations
has been measured for the first time using the DBS system [33]. The DBS implementation
used two-dimensional (2D) steering; this enabled high-k measurements with DBS, at kԋ>
20 cm−1 (kԋi > 10) for launch frequencies < 75 GHz. A power law decrease in fluctuation
signal was measured |n(kԋ)|2kԋ-with= 4.7±0.2 for 7 < kԋi < 11, which is similar to
the value of expected from turbulent cascade processes (=13/3).
While ion scale turbulence is strongly suppressed by flow shear, weak ion scale
turbulence has been observed in a range of shots using beam emission spectroscopy around
N~0.7 [34]. Linear GS2 flux tube simulations showed that all the modes are linearly
stable. However, non-linear simulations show beyond a certain threshold and given a large
enough initial perturbation, subcritical turbulence can be sustained. These simulations
suggest that the ion scale turbulence in MAST in the presence of flow shear is subcritical.
In normal turbulence regimes the heat flux is proportional to the amplitude squared of the
fluctuations, however, in the subcritical regime, near the threshold, the turbulent heat flux
increases because coherent structures become more numerous (but not more intense) [35].
Helium [36], carbon and nitrogen [37] impurity transport coefficients have been
determined from gas puff experiments carried out during repeat L-mode discharges. A
weak screening of carbon and nitrogen is found in the plasma core, whereas the helium
density profile is peaked. Both carbon and nitrogen experience a diffusivity of the order of
10 m2s-1 and a strong inward convective velocity of ~40 ms-1 near the plasma edge, and a
region of outward convective velocity at mid-radius. Neoclassical and quasi-linear

11
gyrokinetic simulations have been performed with NEO [38] and GKW [39] respectively.
Neoclassical transport alone is sufficient to explain the observed impurity transport of each
species within <0.4, but cannot explain the magnitudes of the transport coefficients or
trend in Z in the region 0.4 << 0.8. Whilst the equilibrium flow shear is sufficient to
stabilise Ion Temperature Gradient modes (ITGs) in this region, Trapped Electron Modes
(TEMs) are not stabilised, suggesting they may be the source of the anomalous transport
[37].
4.3 NBI heating and fast ion physics
Understanding the behaviour of fast particles and their interaction with MHD
instabilities is crucial for the operation and control of burning plasmas in future devices. In
Spherical Tokamaks due the low toroidal field the neutral beam particles can be super-
Alfvenic, which makes it possible to study fast ion-driven instabilities that resemble those
likely to be driven unstable by -particles in ITER in plasmas characterized by a large fast
particle pressure. Previous studies on MAST have indicated that the measured neutron rate
is often lower than TRANSP predictions and this deficit is due to Fast Ion (FI)
redistribution [40]. A series of experiments has been carried out to assess the effects that
resonant and non-resonant MHD instabilities have on fast ions using a comprehensive set
of fast ion diagnostics: a tangential and vertical Fast Ion D spectrometer (FIDA) system, a 235U fission chamber, a neutron collimated flux monitor and a charged fusion product
detector array. The aim was to integrate the observations from all diagnostics with a suite of
codes to provide a consistent description of the fast ion behaviour. Good agreement is
found for sawtooth induced fast ion losses between the experimental measurements and
TRANSP simulations including the implementation of the Kadomstsev model [41]. Whilst
ad hoc anomalous diffusion and loss models in TRANSP reproduce the global and local
neutron emission during periods of fishbone excitation [42] they do not reproduce the
spectrally and spatially resolved measurements from the FIDA system, showing that these
models do not fully capture the effects of these modes on the fast-ion distribution [43].
Fishbones are known to be driven by gradients in the fast ion distribution, and
therefore it is possible to control the instability by optimising the fast ion pressure profile to

12
suppress these modes and prevent the redistribution or loss of the fast ions themselves.
Experiments on MAST have demonstrated the efficacy of this approach by vertically
displacing the plasma to achieve off-axis NBI fast ion injection [40] or by changing plasma
density or NBI power to vary the magnitude of the fast ion pressure [44]. A series of shots
were performed using two on axis neutral beam sources at fixed input power with
increasing plasma density [44]. As the density increased the fishbone activity was observed
to decrease and the measured neutron rate divided by the neutron rate calculated by
TRANSP tended to unity (see Figure 6a). The TRANSP calculations show that as the
density increases the maximum gradient in fast ion distribution decreases (see Figure 6b).
Since operating at high density is not always desirable an alternative way of reducing the
fast ion gradient is to change the NBI geometry. On MAST this was achieved by shifting
the plasma vertically such that both NBI source were now off axis. This reduced the fast
ion gradient (Figure 6b), which effectively eliminated the fishbone activity and gave
improved agreement with the TRANSP calculations (Figure 6a).
These results have led to design options for MAST Upgrade to allow access to a
wide range of plasma parameters without significant fast ion redistribution. In the operation
of MAST-U in 2017, the NBI system will consist of two injectors, one located with the
same injection geometry as those previously installed on MAST (referred to hereafter as the
“on-axis” position), the other located with a horizontal line-of-sight 650mm above the
midplane (referred to hereafter as the “off-axis” position). This combination will provide
efficient core heating, via the on-axis injector, and significant off-axis heating and NBI
Current Drive (NBCD) via the off-axis injector. The off-axis NBCD is intended to allow a
certain degree of control of the q-profile with the intention of creating plasma scenarios
with current profiles tailored to avoid deleterious MHD modes and allow a detailed
investigation into the relationship between beam deposition profiles, MHD mode activity
and fast ion transport. The triangle in Figure 6b shows the fast ion gradient predicted from
the TRANSP simulations, which suggests that this beam configurations should have a
significant mitigating effect in terms of the fishbone mode drive and is therefore expected
to allow effective plasma heating and current drive over a wider range of plasma conditions
in MAST Upgrade.

13
5. H-mode
5.1 Pedestal
There is a strong correlation between pedestal and core performance and hence
understanding which turbulent processes determine the parameters of the pedestal is crucial
for extrapolation to future devices. The DBS system has been used to measure
intermediate-k (kԋI ~ 3 to 4) density fluctuations at the top of the pedestal during the inter-
ELM period of H-mode discharges. A novel diagnostic technique combining DBS with
cross-polarization scattering (CP-DBS) enabled magnetic field fluctuations to also be
locally measured at similar wave numbers [45]. Both measurements, which are shown in
Figure 7 as a function of time during the ELM cycle, were made in a series of high-く
(N~4.0–4.5) plasmas with large type-I ELMs with a ~ 9 ms period. The density
fluctuations go down in the first 0.5–1.0 ms after the ELM and then remain approximately
constant between 1 and 2 ms, which corresponds to the period in which the density pedestal
is rapidly increasing. The period between 2 and 3 ms sees a sharp rise in the fluctuations
and this corresponds to the period when the rapid pedestal evolution is arrested. Since these
fluctuations are at a higher wavenumber than kinetic ballooning modes (KBMs) (the largest
KBM growth rates were at k ~ 0.2 cm-1) it suggests that the other modes are determining
the pedestal evolution at this stage of the ELM cycle. In the remainder of the ELM cycle
the density fluctuations reach a saturated level. In contrast to the different stages observed
in the density fluctuations, the magnetic field fluctuations slowly increase after ~ 2ms, with
perhaps saturation at the end of the ELM cycle.
Linear GS2 calculations show that both microtearing modes (MTM) and electron
temperature gradient (ETG) modes are unstable at the pedestal top at similar wave numbers
to the measurements (although with more overlap with ETG wave numbers). Similar to
what has been found previously [46] KBMs are unstable lower in the pedestal (at larger
wavelengths). Taking into account the diagnostic differences when operating the DBS
system in the two modes, the inferred ratio of fluctuation levels from experiment was
(B/B)/(n/n)=1/20=0.05 [45]. Table 1 shows a comparison of the experimental

14
measurements with the GS2 simulations. Both the experimental wave number range and the
fluctuation ratio are more similar to the linear characteristics of the ETG than the MTM.
These results imply that intermediate-k fluctuations due to the ETG play a role in inter-
ELM pedestal evolution on MAST.
The pedestal pressure measured has been shown to increase as the global plasma
pressure increases [47]. It was observed that the electron pressure pedestal height increased
by around 100% for around a 40% increase in plasma pressure. Stability analysis shows
that the enhanced Shafranov shift at higher core pressure stabilizes the ballooning modes
driven by the pedestal pressure gradient, consequently allowing the pedestal to reach higher
pressures. In order to replicate the experimentally observed electron pedestal height, and
the scaling of the temperature and density pedestal height and width, an edge ion dilution
had to be included in the numerical pedestal stability analysis.
The Synthetic Aperture Microwave Imaging (SAMI) diagnostic, originally designed
to passively study electron Bernstein emission [48] has been used to conduct proof-of-
principle 2D DBS experiments of the edge plasma. SAMI has been used to actively probe
the plasma edge using a wide (±40° vertical and horizontal) and tuneable (10–34.5 GHz)
beam. Conventional DBS systems have to be aligned at a specific orientation so that their
probing beams are perpendicular to the magnetic field at the scattering location. In the
SAMI system a phased array of antenna allow the Doppler backscattering to be focused in
any direction. The system has been benchmarked against the conventional DBS system and
used to produce 2D Doppler measurements. The optimum backscattering occurs when the
probing beam is perpendicular to the magnetic field line, so by measuring the location of
the maximum blue and red shifted components of the signal, the pitch angle can be deduced
as a function of probing frequency and hence location in the plasma [49]. The preliminary
results show that, provided the scattered signal is strong enough, the pitch angle derived
from this technique is in good agreement with the EFIT equilibrium [6].
5.2 ELM physics
The so called Type I ELM [50] is thought to result from the peeling-ballooning MHD
instability [51]. While the particle and energy losses from the plasma due to a type I ELM

15
have been measured on a range of devices, including detailed measurements of the changes
to the plasma profiles over the ELM crash, there is no detailed quantitative understanding
of how these losses occur. The SAMI system in passive mode has also revealed that ELMs
are accompanied by intense bursts of microwave emission in the electron cyclotron (EC)
frequency range. These bursts provide strong evidence for the transient presence in the
edge plasma of highly supra-thermal electrons and imply acceleration of electrons parallel
to the magnetic field [52]. Particle-in-cell simulations show that magnetic field-aligned
energetic electron distributions, of the kind likely to result from parallel electric fields
generated by ELMs, excite electrostatic waves in the electron cyclotron range. If converted
to electromagnetic modes, these waves could account for the SAMI emission. Whilst soft
X-ray and Thomson scattering data suggest that the fraction of accelerated electrons is
small, these electrons may play a significant role in ELM dynamics and provide evidence
that a reconnection process is occurring.
The ELM wetted area is a key factor in the peak power load during an ELM, as it
sets the region over which the ELM energy is deposited. The deposited heat flux at the
target is seen to have striations in the profiles that are generated by the arrival of filaments
ejected from the confined plasma. The effect of the filaments arriving at the target on the
ELM wetted area has been measured using infrared (IR) thermography at the divertor and
compared with the toroidal mode number obtained from high speed visible imaging of the
main plasma [53]. Type I ELMs are found to have toroidal mode numbers of between 5 and
15. An increasing number of filaments at the target produce an increase in the wetted area.
Figure 8a shows that the ratio of the ELM wetted area to the inter-ELM wetted area
increases with the ELM toroidal mode number. Modelling of the ELMs has been used to
understand the variation observed and the effect of an increased mode number; the
modelling replicates the trends seen in the experimental data and supports the observation
of increased toroidal mode number generating larger target ELM wetted areas.
In the ITER baseline Q =10 (where Q is the fusion power gain factor = Pfusion/Pin)
scenario, which has a plasma current of 15 MA, the expected natural ELM frequency is
~1Hz with each ELM having and ELM energy loss WELM ~ 20 MJ [54]. In order to

16
ensure an adequate lifetime of the divertor targets on ITER the maximum ELM energy flux
that can be repetitively deposited is 0.5 MJm−2
[55]. In order to achieve this some level of
ELM mitigation will be required. One of the parameters that enters into the calculation of
the level of mitigation required is the changes in the power deposition profile. Figure 8b
shows a prediction for the required mitigated ELM frequency expressed as a fraction of the
natural ELM frequency as a function of the increase in wetted area during the ELM
compared to inter-ELM for the IP=15 MA discharges on ITER [55]. As can be seen the
level of mitigation required decreases with the increase in wetted area. Hence these new
results showing that the wetted area depends on the mode number of the ELM suggest that
if the ELMs in ITER have a lower mode number [56], because they are closer to the peeling
boundary, then a higher level of ELM control may be required.
Simulations of the ELM crash performed using the non-linear MHD code JOREK
[57] have shown how the non-linear coupling of different mode numbers could be a
necessary ingredient for ELM dynamics. This mode coupling has been found to be essential
in order to reproduce the experimentally observed structures [58]. Hence it may be possible
that a lower mode number of the ELM instability can still produce a larger observed
number of filaments and hence wetted area.
Ion temperature measurements have been made for the filaments arriving at the
divertor during ELMs using a retarding field energy analyser (RFEA) in a fast sweep mode
[59]. As well as showing that the ion temperature in the filaments is much larger than the
electron temperature, they have revealed that in a certain category of ELMs the filaments
arrive at the target over an extended time (>1 ms), compared to the normal duration of 200-
300 s. Similar to what has been seen previously on other devices (NSTX [60], JET [61],
AUG [62]) these ELMs appear to be composed of primary and secondary filaments.
Normally on MAST there is a large distance between the plasma and any structure. These
secondary filaments only occur when the plasma shape is such that there is a large plasma
interaction with an in vessel poloidal field coil (P3). This suggests that there may be a
mechanism by which the primary filaments interact with in vessel components (or the first
wall in other devices) that releases impurities or neutrals which then change the edge
stability and lead to further filaments being released.

17
5.3 ELM control
All current estimations of the energy released by type I ELMs indicate that, in order to
ensure an adequate lifetime of the divertor targets on ITER, a mechanism is required to
decrease the amount of energy released by an ELM, or to eliminate ELMs altogether. One
such amelioration mechanism relies on perturbing the magnetic field in the edge plasma
region, either leading to more frequent, smaller ELMs (ELM mitigation) or ELM
suppression (see [63] and references therein). On MAST it has been shown previously that
although the ELM frequency (fELM) increases with the applied resonance field (brres) above
a certain threshold, this threshold depends on the toroidal mode number of the applied
perturbation [64]. Calculations performed using the MARS-F code [65], which is a linear
single fluid resistive MHD code that combines the plasma response with the vacuum
perturbations, including screening effects due to toroidal rotation, show that the plasma
response leads to plasma displacements normal to the flux surfaces [66][67]. The poloidal
location of the maximum in the displacement can vary. The X-point displacement is largest
when the edge peeling-tearing response dominants whereas the displacement at the
midplane is largest when the core kink component dominates. Previous studies on MAST
showed that ELM mitigation only occurs when the X-point displacement is larger than the
mid-plane displacement [66] and similar results have also been obtained on ASDEX
Upgrade [68]. A detailed scan performed in the last campaign on MAST has illustrated
further the importance of minimising core-kink response. MAST had 6 coils in the upper
row and 12 coils in the lower row. By adjusting the current in the lower ELM coils in an
n=3 configuration it was possible to adjust the phase difference () between the field
patterns in the upper and lower row of coils. Figure 9a shows a plot of fELM versus for a
series of repeat discharges in which was changed shot to shot. fELM increases as is
decreased from 0 to -90϶. For discharges with the discharge is terminated by a locked
mode soon after the RMP coil current reaches its maximum value. Figure 9b shows the
resonant field component (brres) in the vacuum approximation and taking into account the
plasma response as a function of As observed on other devices [68] there is an offset in
the location of the peak for the vacuum and plasma response. Based on this observation

18
it could be concluded that the results were in better agreement with the vacuum than the
plasma response. However, looking in more detail, Figure 9c reveals that there is only a
small window in for which the X-point displacement is larger than the mid-plane
displacement. It is only in this window that ELM mitigation is observed without producing
a locked mode. Figure 9d shows that the peeling response is effectively flat for -120<<-
30϶. Although the peeling response increases for >0 the kink response is also rising
rapidly and dominates and this is presumably the cause of the locked modes observed in
this region. Hence in order to achieve the best ELM mitigation it is necessary to maximise
the peeling response and minimise the kink response.
The effect that the RMPs have on the confinement of energetic (neutral beam) ions
has been investigated using measurements of neutrons, fusion protons and FIDA light
emission [69]. In the worst case of a low plasma current (400 kA) discharge with RMPs
applied with a toroidal mode number n = 3 the total neutron emission dropped by
approximately a factor of two. Simulations of RMP-induced fast ion transport in MAST,
using the F3D-OFMC code, have been able to reproduce these results [70]. For higher n
RMPs and/or higher plasma current the losses were considerably lower.
6. Intrinsic error fields
The misalignment of field coils in tokamaks can lead to toroidal asymmetries in the
magnetic field, which are known as intrinsic error fields. These error fields often lead to
the formation of locked modes in the plasma, which limit the lowest density that is
achievable. Measurements on MAST suggest that the dominant source of the intrinsic error
field was due to the P4 and P5 poloidal field coils. Since these coils will be re-used in
MAST-U a series of measurements were made to characterise the field structure they
generate and a set of experiments performed to understand how best to minimise their
effect. A direct measurement of the toroidal asymmetry of the fields from these coils has
been made, which has then been parametrized in terms of distortions to the coils.
Empirically, the error fields are corrected using error field correction coils, where the
optimum correction is found by determining the current required to ensure that the

19
discharge is furthest from the onset of a locked mode. Assuming that the dominant n = 1
error field is produced by the P4 and P5 coils, the empirically derived corrections have been
compared with the known distortion of these coils [71]. In the vacuum approximation there
is a factor of 3 difference between the predicted and empirically determined correction.
These studies have been extended to a comparison with full MHD plasma response
calculations [72]. Various optimization criteria have been compared to the experimental
results and the two which are most compatible with the data are one that aims to minimise
the net toroidal resonant electromagnetic torque on the plasma column and the other
corresponds to the full cancellation of the 2/1 resonant field harmonic at the q = 2 surface,
including the plasma response. When the plasma response is included better agreement is
obtained, but there are still some cases where the agreement is not good. The results
suggest that other effects may be important. These include on the experimental side
additional unmeasured sources of the error field or on the theory side the effect of other
higher n toroidal harmonics or the non-linear coupling of the error field to the plasma.
Even if the n = 1 component can be corrected there is still a large residual n = 2
component from the P4 and P5 coils, which could be the source of the rotation braking in
shot 29912 shown in Figure 10. This n=2 components can in principle be corrected using
the RMP coils in an n=2 configuration. The optimum n=2 correction that minimised the
jxB torque on the plasma was calculated using MARS-F and applied to a plasma that
already had an optimised n=1 correction applied. Figure 10 shows that such a correction
can reduce the plasma braking and improve the quality of the H-mode (determined by the
regularity of the ELMs).
Rather than correcting the error fields the best policy is to reduce the error field to
the lowest possible value during the build stage. For MAST-U the toroidal variation in the
field from the coils has been measured and then the optimum installation angle and location
of the coils has then been calculated so as to minimise the n=1 components of their intrinsic
error fields.
20
7. Summary and future plans
New results from MAST are presented that focus on validating models in order to
extrapolate to future devices. Detailed measurements during start-up experiments,
combined with modelling, have shown how the bulk ion temperature increases as a result of
the reconnection process and scales with the square of the reconnecting field. An analysis
of the changes in the q profile as a function of time show that while our fundamental
understanding of current diffusion appears to be correct, at present the models do not
accurately reproduce the current ramp up phase. A detailed characterisation of the MAST
SOL has been performed including results from new diagnostics giving plasma potential
and ion temperature measurements. Detailed studies have revealed how filament
characteristic are responsible for determining the near and far SOL density profiles. These
measurements have been compared to extensive modelling, including 3D effects on
filaments dynamics with the BOUT++ code, and benchmarking the SOLPS code.
A DBS system has been used to make measurements of both core and edge
turbulence. Measurements of the intrinsic rotation in L-mode plasmas show good
agreement with a model that captures the collisionality dependence of the radial transport
of toroidal angular momentum due to finite drift orbit effects on turbulent fluctuations. Ion
scale turbulence is strongly suppressed in MAST and the DBS system has been used to
measure core turbulence at higher wavenumbers. The observed turbulence is consistent
with being created by a turbulent cascade process. The density fluctuation measurements
from the DBS have been combined with measurements of the magnetics fluctuations
obtained with cross-polarisation DBS. When compared with GS2 simulations the
experimental observations of the relative amplitudes and wavelengths of the density and
magnetic field fluctuations at the top of the pedestal are more similar to the linear
characteristics of electron temperature gradient modes than micro tearing modes.
Comprehensive measurements from a suite of diagnostics on MAST have shown
the effect that core MHD modes and RMPs have on the confinement and redistribution of
fast ions arising from neutral beam injection. Subsequent experiments on MAST
demonstrated that by vertically displacing the plasma to achieve off-axis NBI fast ion
21
injection or by changing plasma density it is possible to vary the fast ion pressure gradient
and mitigate the redistribution.
Microwave bursts have been observed at the onset of ELMs, which suggest that a
reconnection process may be occurring, possibly resulting in the release of energy from the
plasma. The number of filaments observed in an ELM is found to be correlated with the
increase in extent of the power footprint at the divertor. This suggests that the level of ELM
mitigation required on future devices, such as ITER, will depend on the toroidal mode
number of the ELMs. Studies of ELM mitigation on MAST have shown the role that the
plasma response plays in determining the optimum non-axisymmetric field configuration.
The access criteria for ELM mitigation using RMPs has been found to require maximising
the edge peeling response combined with minimising the core kink response. Whilst RMPs
are essential for mitigating ELMs they do have consequences for the core confinement and
in particular the confinement of fast ions, which are sensitive to the mode number of the
applied perturbation.
Intrinsic error fields, produced due to toroidal asymmetries in the magnetic field
coils, often lead to the formation of locked modes in the plasma limiting the lowest density
that is achievable. It has been found that the plasma response to such 3D field
perturbations must be included in modelling in order to get agreement with the
observations. Typically only error field components that have a toroidal mode number n=1
are corrected, however, experiments have shown that the n=2 component can also lead to
rotation braking and can and should be corrected.
The results presented here have been used to improve the design of MAST Upgrade,
which will begin operation in late 2017 [1]. The MAST Upgrade research programme has
three primary objectives: 1) To develop reactor-relevant advanced divertor concepts, 2)
add to the knowledge base for ITER and 3) explore the feasibility of using a spherical
tokamak as the basis for a fusion Component Test Facility. To deliver this capability the
load assembly is being comprehensively upgraded in stages and the first stage, known as
“core scope”, is now nearing completion. Core scope includes 17 new shaping and divertor
poloidal field coils (14 inside the vessel), and a new closed pump-able divertor structure to
make a highly flexible exhaust physics platform (see Figure 4). This stage of the upgrade

22
will also provide a 50% increase in the toroidal field (from 0.585 to 0.92 T at R = 0.7m)
and a near doubling of the inductive flux from the central solenoid (0.9 to 1.7Vs (1.6 Wb)),
which should allow access to a plasma current of 2MA. One of the present neutral beams
will be moved off-axis for improved current profile control and fast ion physics studies. It
will be equipped with ELM control coils, many new diagnostics and an extensive gas
fuelling system.
Acknowledgement
We acknowledge the contributions of the EUROFusion MST1 team. This work has been carried out within the framework of the EUROfusion Consortium and has received funding from the Euratom research and training programme 2014-2018 under grant agreement No 633053 and from the RCUK Energy Programme [grant number EP/I501045]. To obtain further information on the data and models underlying this paper please contact [email protected]. The views and opinions expressed herein do not necessarily reflect those of the European Commission.

23
References
[1] Morris AW 2012 IEEE Transactions on Plasma Science 40 682 [2] Tanabe H et al., 2015 Phys. Rev. Lett. 115 215004 [3] Tanabe H et al., EX/P4-32 this conference [4] Browning P et al., 2016 Plasma Phys. Control. Fusion 58 014041
[5] Keeling D et al., Proc 35th EPS Conf. 2008; Turnyanskiy M et al., 2009 Nucl. Fusion 49 065002
[6] Lao LL et al., 1985 Nucl. Fusion 25 1611
[7] Conway NJ et al., 2010 Rev. Sci. Instrum. 81 10D738
[8] Scannell R et al., 2010 Rev. Sci. Instrum. 81 10D520
[9] Patel A et al., 2004 Rev. Sci. Instrum. 75 4944
[10] Goldston RJ et al., 1981 J. Comput. Phys. 43 61
[11] Hinton FL and Hazeltine RD, 1976 Rev. Mod. Physics 48 239
[12] Sauter O et al., 1999 Phys. Plasmas 6 2834; Sauter O et al., 2002 Phys. Plasmas 9 5140
[13] Dudson DB, Umansky M, Xu X, Snyder P and Wilson H, 2009 Comput. Phys. Commun. 180 1467
[14] Schneider R et al 2006 Contrib. Plasma Phys. 46 3
[15] Militello F et al., 2016 Nucl. Fusion 56 016006
[16] Walkden NR et al., 2015 Rev. Sci. Instrum. 86 023510
[17] Allan S et al., 2016 ‘Ion Temperature Measurements of L-mode Filaments in MAST by Retarding Field Energy Analyser’ submitted to Plasma Phys. Control. Fusion
[18] Thornton AJ et al., 2015 Plasma Phys. Control. Fusion 57 115010
[19] Kirk A et al., 2016 Plasma Phys. Control. Fusion 58 085008
[20] Militello F et al., 2016 Plasma Phys. Control. Fusion 58 105002

24
[21] Walkden NR et al., 2016 ‘Dynamics of 3D isolated thermal filaments’ Submitted to Plasma Phys. Control. Fusion
[22] Militello F and Omotani JT, 2016 Nucl. Fusion 56 104004
[23] Militello F and Omotani JT, 2016 ‘On the relation between non-exponential Scrape Off Layer profiles and the dynamics of filaments’ Submitted to Plasma Phys. Control. Fusion
[24] Havlickova E et al, 2015 Plasma Phys. Control. Fusion 57 115001
[25] Kirk A et al, 2004 Plasma Phys. Control. Fusion 46 1591
[26] Eich T et al, 2011 Phys. Rev. Lett. 107 215001
[27] Thornton A et al, 2014 Plasma Phys. Control. Fusion 56 055008
[28] Bortolon A et al 2006 Phys. Rev. Lett. 97 235003
[29] Rice JE 2011 Phys. Rev. Lett. 107 265001
[30] Angioni C et al 2011 Phys. Rev. Lett. 107 215003
[31] Hillesheim JC et al. 2015 Nucl. Fusion 55 032003
[32] Barnes M et al., 2014 Phys. Rev. Lett. 111 055005
[33] Hillesheim JC et al., 2015 Nucl. Fusion 55 073024
[34] Field AR et al., 2014 Plasma Phys. Control. Fusion 56 025012
[35] Van Wyk F et al., 2016 ‘Transition to subcritical turbulence in a tokamak plasma’ to be published in Journal of Plasma Physics
[36] Henderson S et al. 2014 Nucl. Fusion 54 093013
[37] Henderson S et al. 2015 Plasma Phys. Control. Fusion 57 095001
[38] Belli EA and Candy J, 2008 Plasma Phys. Control. Fusion 50 095010.
[39] Peeters AG et al., 2009 Comput. Phys. Commun. 180 2650
[40] Turnyanskiy M. et al 2013 Nucl Fusion 53 053016
[41] Cecconello M et al. 2015 Plasma Phys. Control. Fusion 57 014006

25
[42] Klimek I et al., 2015 Nucl. Fusion 55 23003
[43] Jones OM et al. 2015 Plasma Phys. Control. Fusion 57 125009
[44] Keeling DL et al 2015 Nucl. Fusion 55 013021
[45] Hillesheim JC et al., 2015 Plasma Phys. Controlled Fusion 58 014020
[46] Dickinson D et al., 2012 Phys. Rev. Lett. 108 135002
[47] Chapman IT et al 2015 Nucl. Fusion 55 0130041
[48] Freethy SJ et al., 2013 Plasma Phys. Controlled Fusion 55 124010
[49] Thomas D et al 2016 Nucl. Fusion 56 026013
[50] Zohm H 1996 Plasma Phys. Control. Fusion 38 105
[51] Connor JW 1998 Plasma Phys. Control. Fusion 40 531
[52] Freethy SJ et al. 2015 Phys. Rev. Lett. 114 125004
[53] Thornton AJ et al 2016 ‘The role of ELM filaments in setting the ELM wetted area in MAST and the implications for future devices’ Submitted to Plasma Phys. Controlled Fusion [54] Loarte A et al 2003 Plasma Phys. Control. Fusion 45 1549
[55] Loarte A et al 2014 Nucl. Fusion 54 033007
[56] Snyder PB et al. 2011 Nucl. Fusion 51 103016
[57] Huysmans G et al., 2007 Nucl. Fusion 47 659
[58] Pamela S et al “Multi-machine modelling of ELMs and pedestal confinement:From validation to prediction” TH/8-2, paper presented at 26th IAEA Int. Conf. on Fusion Energy Kyoto, Japan 2016
[59] Elmore S et al 2016 Plasma Phys. Control. Fusion 55 065002
[60] Maqueda R et al 2009 J. Nucl. Mater. 390–1 843–6
[61] Silva C et al 2009 Plasma Phys. Control. Fusion 51 105001
[62] Kirk A et al 2011 Plasma Phys. Control. Fusion 53 035003

26
[63] Kirk A et al 2013 Plasma Phys. Control. Fusion 55 124003
[64] Kirk A et al 2013 Plasma Phys. Control. Fusion 55 115006
[65] Liu YQ et al 2010 Phys. Plasmas 17 122502
[66] Liu YQ et al 2011 Nucl. Fusion 51 083002
[67] Haskey S.R. et al 2014 Plasma Phys. Control. Fusion 56 035005
[68] Kirk A et al 2015 Nucl. Fusion 55 043011
[69] McClements KG et al 2015 Plasma Phys. Control. Fusion 57 075003
[70] Tani K et al. 2016 ``Application of a non-steady-state orbit-following Monte- Carlo code to neutron modeling in the MAST spherical tokamak’’, Plasma Phys. Control. Fusion, in press.
[71] Kirk A et al 2014 2015 Plasma Phys. Control. Fusion 56 104003
[72] Liu YQ et al 2014 2015 Plasma Phys. Control. Fusion 56 104002

27
Tables
Table 1 Comparison of wavenumber k and the ratio of magnetic to density fluctuations ሺ෩ȀሻȀሺȀ) measured at the top of the pedestal and from GS2 simulations for MicroTearing Modes (MTM) and Electron Temperature Gradient (ETG) modes.
k (cm-1) ሺܤ෨ȀܤሻȀሺ ݊Ȁ݊)
Experiment 6-9 0.05
MTM 0.5-4.0 0.4
ETG 4.0-30.0 0.02
28
Figures
Figure 1 q profile evolutions during IP ramp-up: a) IP waveform, b) and c) q0 and q0.5 traces from MSE constrained EFIT and TRANSP simulations. q profile evolutions during IP flat-top: d) IP waveform, b) and c) q0 and q0.5 traces from MSE constrained EFIT and TRANSP simulations.

29
Figure 2 The skewness of the ion saturation current versus the gradient in the radial electric field from ball pen probe measurements during a reciprocation into the edge of an L-mode plasma.
Figure 3 The mid-plane density fall off length (ne) as a function of the mean radial velocity of the filaments (Vr) determined from a range of shots at different plasma current.

30
Figure 4 Cross-section of MAST-U showing the location of the shaping coils and divertor tiles. Superimposed are magnetic field lines in a Super-X configuration.
Figure 5 SOLPS Simulation results of the total ion flux to the target versus separatrix density at the midplane for an inter ELM period of a H-mode plasma in MAST-U with the divertor in a conventional (solid) and Super-X configuration (dashed).

31
Figure 6 a) Neutron emission rate measured by the Fission chamber (FC) divided by TRANSP calculated neutron emission rate and b) maximum fast ion gradient (∂f /∂ねp,N) (in arbitrary units) versus line-averaged density for shots with two beams on axis (circles) and vertically shifted (Square). The triangle in b) shows a calculation for a MAST-U shot with one on and one off-axis beam
Figure 7 DBS measurements of the density fluctuations ሺሻ and CP-DBS measurements of the
magnetic fluctuations ሺ෩ሻ plotted against time after the last ELM for the 55.0 GHz channel (k ~6-
9 cm-1).

32
Figure 8 a) Ratio of ELM to inter-ELM wetted area at the lower outer divertor as a function of the ELM quasi-mode number derived from visible data (red circles). The points with error bars show the modelled ratio. b) Predicted required mitigated ELM frequency as a fraction of the natural ELM frequency for ITER as a function of the increase in wetted area during the ELM compared to inter-ELM.

33
Figure 9 a) ELM frequency (fELM) b) normalized resonant component of the applied field (brres) in
the vacuum (squares) and including the plasma response (circles) c) the X-point (circles) and mid-plane (squares) displacement and d) the maximum plasma displacement normal to the flux surfaces for the kink (m=1-4) (squares) and peeling (m=6-17) (circles) versus the toroidal phase (l) between the upper and lower row of coils for the RMPs in an n = 3 configuration.

34
Figure 10 Time traces of a) the current in the ELM coils (IELM) b) line average density, c) toroidal rotation frequency at r=1.2 m and the divertor D light for a shot d) without and e) with n=2 correction.