ewdocs-#788454-v2-resource capacity estimates for...
TRANSCRIPT

Prepared by: Sinclair Knight Merz Limited For: Environment Waikato PO Box 4010 HAMILTON EAST ISSN: 1172-4005 May 2002 Document: 788454
Environment Waikato Technical Report 2002/22
Resource Capacity Estimates for High Temperature Geothermal Systems in the Waikato Region May 2002

Environment Waikato
Resource Capacity Estimates for High Temperature Geothermal Systems in the Waikato Region May 2002

Environment Waikato
Resource Capacity Estimates for High Temperature
Geothermal Systems in the Waikato Region
May 2002
Sinclair Knight Merz Limited PO Box 9806 25 Teed Street Newmarket, Auckland New Zealand Telephone: +64 9 913 8900 Fax: +64 9 913 8901
COPYRIGHT: The concepts and information contained in
this document are the property of Sinclair Knight Merz Ltd.
Use or copying of this document in whole or in part without
the written permission of Sinclair Knight Merz constitutes an
infringement of copyright.

AP00512.0:EWDOCS-#788454-V2-RESOURCE_CAPACITY_ESTIMATES_FOR_HIGH-TEMPERATURE_GEOTHERMAL_SYSTEMS_IN_THE_WAIKATO_REGION.DOC PAGE i
Summary Estimates of resource capacity, expressed as equivalent electrical generating capacity using current technology, have been made for geothermal systems in the Waikato region, using a stored heat approach and resource lifetimes of 30, 100, 200 and 300 years. Total generating capacity for the Waikato geothermal fields is estimated to be 3100 MWe, for a 30 year resource life and using median resource parameters. Summing the 10th and 90th percentile estimates for the individual fields (which gives a greater than 90% confidence) realistic minimum and maximum values of 2200 and 4400 MWe are obtained. Increasing the resource life to 300 years, and using natural heat flow as a the lower limit on extraction rate, total generating capacity falls to about 420 MWe (median value). Generating capacity based on natural heat flow is greater than 40 MWe in four geothermal fields: Wairakei, Waimangu, Waiotapu-Waikite and Rotokawa. Estimates based on natural heat flow can be considered potentially physically sustainable, minimum capacities, although this does not mean that extraction at that level would have zero environmental effects. Resource capacities based on stored heat do not necessarily provide a good indication of long term productivity. In addition to stored heat, productivity is dependent on factors that may only be quantifiable when the resource is produced, such as susceptibility to groundwater incursion, or the ability of the system to provide enhanced recharge of hot fluid from the system upflow. The capacity estimates presented in this review are based on currently available information for the individual fields and Sinclair Knight Merz’s knowledge of analogous systems in New Zealand and overseas. It can be expected that the capacity estimates will be refined as more information becomes available.

AP00512.0:EWDOCS-#788454-V2-RESOURCE_CAPACITY_ESTIMATES_FOR_HIGH-TEMPERATURE_GEOTHERMAL_SYSTEMS_IN_THE_WAIKATO_REGION.DOC PAGE ii
Contents
1. Introduction.....................................................................................4 2. Methodology ...................................................................................7
2.1 Estimated Resource Parameters ......................................................8 2.2 Definitions and Criteria......................................................................9
2.2.1 Areal Extent .....................................................................................9 2.2.2 Thickness.........................................................................................9 2.2.3 Volume...........................................................................................10 2.2.4 Void Space ....................................................................................10 2.2.5 Temperature ..................................................................................10
2.3 Stored Heat Resource Capacity Estimate.......................................10 2.3.1 Basic Deterministic Method ...........................................................10
2.4 Worked Example.............................................................................12 2.5 Probabilistic Method........................................................................14 2.6 Capacity Based on Heat Flow.........................................................17
3. Issues of Sustainability................................................................18 4. Resource Parameters for Individual Fields ................................20
4.1 Atiamuri ...........................................................................................21 4.2 Horohoro .........................................................................................22 4.3 Horomatangi....................................................................................23 4.4 Mangakino.......................................................................................24 4.5 Mokai...............................................................................................25 4.6 Motuoapa ........................................................................................26 4.7 Ngatamariki .....................................................................................27 4.8 Ngauruhoe ......................................................................................28 4.9 Ohaaki.............................................................................................29 4.10 Ongaroto .........................................................................................30 4.11 Orakei Korako .................................................................................31 4.12 Reporoa ..........................................................................................32 4.13 Rotokawa ........................................................................................33 4.14 Ruapehu..........................................................................................34 4.15 Tauhara...........................................................................................35 4.16 Te Kopia..........................................................................................36 4.17 Tokaanu-Waihi-Hipaua ...................................................................37 4.18 Tongariro (Ketetahi) .......................................................................38 4.19 Waimangu.......................................................................................39 4.20 Waiotapu-Waikite ............................................................................40 4.21 Wairakei ..........................................................................................41
5. Resource Capacity Estimates .....................................................42 6. References ....................................................................................45

AP00512.0:EWDOCS-#788454-V2-RESOURCE_CAPACITY_ESTIMATES_FOR_HIGH-TEMPERATURE_GEOTHERMAL_SYSTEMS_IN_THE_WAIKATO_REGION.DOC PAGE iii
Document History and Status Issue Rev. Issued To Qty Date Reviewed Approved Proposal 0 Katherine Luketina 3 May 2002 JVL JVL
Printed: 21 October, 2009 Last Saved: 20 October, 2009 File Name: I:\Apwr\AP00512\Final Report.Doc Project Manager: Brian Lovelock Name of Organisation: Environment Waikato Name of Project: Name of Document: Document Version: 0 Project Number: AP00512.0

AP00512.0:EWDOCS-#788454-V2-RESOURCE_CAPACITY_ESTIMATES_FOR_HIGH-TEMPERATURE_GEOTHERMAL_SYSTEMS_IN_THE_WAIKATO_REGION.DOC PAGE 4
1. Introduction In 2001 Sinclair Knight Merz presented a paper at the annual NZGA meeting, giving estimates of electricity generating capacity of geothermal systems in New Zealand. This study used stored-heat calculations and took a probablistic approach to selection of the main input parameters. Table 1-1 shows the resource capacity estimates from this paper. In October 2001, Environment Waikato made an approach to Sinclair Knight Merz for assistance in carrying out resource capacity estimates for geothermal fields in the Waikato region. They expressed an interest in seeing the NZGA study refined to include a more rigorous justification for the resource parameters used and the inclusion of lower grade (<180°C) resources and direct use potential. Because of budget constraints at this time, the scope of work has been limited to only the higher temperature (>180°C) resources and the following tasks.
Update the 2001 NZGA review of high-temperature field to include Horomatangi, Motuoapa. Omit fields outside the Waikato region. Include comments on Ruapehu and Ngauruhoe.
Expand tabulated results to include total mass of geothermal fluid in place (>180°C), total energy in place (PJ) and pre-exploitation natural heat flow.
Calculate capacities over generating periods of 30, 100, 200 and 300 years. Provide a brief statement on sustainability and its influence on resource capacity
estimates. Provide discussion justifying resource parameter values, including reference list. Provide full methodology, including a full worked example for one field (using
mean values) List resource constraints to development (e.g: groundwater incursion, acidity,
scaling, gas etc), for each field.

AP00512.0:EWDOCS-#788454-V2-RESOURCE_CAPACITY_ESTIMATES_FOR_HIGH-TEMPERATURE_GEOTHERMAL_SYSTEMS_IN_THE_WAIKATO_REGION.DOC PAGE 5
Figure 1-1 High-temperature geothermal fields in the Waikato region, shown in red. (from Environment Waikato website: www.ew.govt.nz/ourenvironment/geothermal)

AP00512.0:EWDOCS-#788454-V2-RESOURCE_CAPACITY_ESTIMATES_FOR_HIGH-TEMPERATURE_GEOTHERMAL_SYSTEMS_IN_THE_WAIKATO_REGION.DOC PAGE 6
Table 1-1 Resource capacity estimates for geothermal systems in the Taupo Volcanic Zone (Lawless and Lovelock, 2001)
Resource Area Depth to Resource Thickness Void Space Mean Temperature4 Generating Capacity5
Field km2 Reservoir (m) m % °C MWemin mode max min mode max min mode max min mode max 10TH median 90TH
Atiamuri 3 4 5 800 1500 1700 2200 8 10 12 190 220 230 10 18 26
Horohoro 1 1.5 5 500 1800 2000 2500 8 10 12 190 200 230 4 9 18
Kawerau 25 35 40 400 1500 2100 2500 6 8 10 260 270 280 350 450 570
Ketetahi 10 12 20 800 1500 1700 2200 4 8 12 230 245 260 70 105 160
Mangakino 8 9.5 17 800 1500 1700 2200 8 10 12 220 230 250 65 85 120
Mokai 5 6 18 700 1250 1800 2300 8 10 12 260 280 295 100 155 250
Ngatamariki 10 14 16 400 1800 2100 2500 6 10 12 250 260 270 140 190 240
Ngawha 10 18 25 400 1800 2100 2500 3 4 6 220 240 260 50 75 120
Ohaaki 5 11 12 400 1800 2100 2500 6 8 10 260 275 280 100 135 175
Orakei-Korako 8 9.5 12 400 1800 2100 2500 8 10 12 250 260 270 125 150 180
Reporoa 8 10 15 700 1000 1500 2000 8 10 12 220 230 240 50 65 90
Rotokawa 16 18 20 500 1700 2000 2500 6 10 12 260 280 295 250 330 420
Rotoma 4 5 6 500 1700 2000 2500 6 8 10 220 240 245 28 35 46
Rotorua1 2 4 8 500 1500 1800 2000 8 10 15 220 240 250 25 35 55
Tauhara 7 15 24 500 1700 2000 2500 10 12 15 250 260 270 190 280 390
Te Kopia 6 10 12 500 1700 2000 2500 8 10 12 230 240 250 70 95 120
Tikitere-Taheke2 15 35 40 500 1000 1800 2200 8 10 12 220 240 260 160 240 350
Tokaanu 15 20 30 800 1500 1700 2200 4 8 12 250 260 270 150 220 310
Waimangu 9 12 30 400 1800 2100 2500 8 10 15 250 260 270 180 280 420
Waiotapu3 25 35 50 500 1200 2000 2500 8 10 12 260 275 280 440 590 800
Wairakei 15 25 30 350 2000 2150 2650 10 15 20 250 255 265 450 600 850
Means and Totals: 9.6 250 3000 4100 5700

AP00512.0:EWDOCS-#788454-V2-RESOURCE_CAPACITY_ESTIMATES_FOR_HIGH-TEMPERATURE_GEOTHERMAL_SYSTEMS_IN_THE_WAIKATO_REGION.DOC PAGE 7
2. Methodology Resource assessment is a process that includes evaluation of directly measured data (e.g.: well temperatures) and applying indirect interpretative methods (e.g.: geophysics, geothermometers etc). Equally important is the process of applying comparative techniques based on similarities with analogous systems. Because geothermal systems are natural phenomena, no two systems are identical. However, many geothermal systems share similar characteristics, including the distribution and nature of surface thermal activity, geological setting and reservoir chemistry. Recognising patterns in behaviour that are repeated from one system to the next, is a powerful tool in resource assessment, but relies on having experience with many fields. Confidence in the results of a resource assessment depends on the quantity and quality of the data. Prior to drilling, resource assessment relies entirely on surface exploration techniques. Where surface thermal activity is widespread and intense it may be possible to construct a detailed picture of the resource at depth. The absence of strong surface activity may not necessarily imply a low-grade resource if the system is well capped or under high terrain. However the lack of data imposes uncertainty and therefore a greater risk of failure. A geothermal development takes geothermal fluid from the ground, abstracts heat from it, and disposes of the cooled fluid back into the ground. The resource is the thermal energy contained in a body of rock that has been heated over geological time by hot geothermal water rising from depth. The energy stored in the rock and water can be quantified approximately using estimates of the temperature and the volume of the resource. Thermal energy is transported to the surface through wells as steam and water, the proportions of which are governed by the enthalpy of the fluid in the feed-zones of the well. In some cases steam fills the void spaces (so called “steam-dominated” systems) and in other cases the reservoir fluid is hot water (“liquid-dominated”). All geothermal fields developed so far in New Zealand are liquid-dominated resources although localised steam zones occur at shallow depths (e.g.: Wairakei). Any liquid water that is produced for a development should be disposed of by reinjection wells at a location where it will not interfere, in an adverse manner, with production wells. Important requirements of a geothermal resource for development are:
Large resource size (area and thickness) A high temperature for good electricity conversion efficiency Good permeability and therefore a large quantity of fluid for a long field life High fluid enthalpy for maximum energy per unit mass and low reinjection load Near-neutral pH fluids for low corrosion rates Low scaling potential Well capped reservoir, to limit groundwater ingress Down slope reinjection sites for gravity disposal Easy terrain for access Low risk of natural hazards (e.g.: volcanic or hydrothermal eruptions, flooding,
seismic) Proximity to transmission lines

AP00512.0:EWDOCS-#788454-V2-RESOURCE_CAPACITY_ESTIMATES_FOR_HIGH-TEMPERATURE_GEOTHERMAL_SYSTEMS_IN_THE_WAIKATO_REGION.DOC PAGE 8
Minimal perceived protection status Minimal environmental impact
These requirements are seldom all met and the resource assessment process usually involves a trade-off of these requirements. The amount of information available on the above requirements may vary greatly from field to field. Obviously, if wells have already been drilled, there will be an order of magnitude more information than for a field for which only surface exploration has been carried out. Therefore, the amount of information available for a resource is, in itself, an important parameter in ranking studies - the less information the greater the development risk. 2.1 Estimated Resource Parameters For this review, certain key resource parameters are defined based on the above requirements and other development factors. These are estimated for the individual fields in Section 4. The next step is to estimate the resource capacity. For this purpose a stored heat method has been used. While it has its limitations and is inferior to assessment based on numerical reservoir simulation in a field with a development history, it has the advantage that it provides a consistent basis for comparison between fields with widely varying amounts of data. It is commonly used in overseas geothermal projects at the stage of determining a suitable size for first stage power plant for planning purposes and/or commitment to delineation drilling. A stored heat method has limitations. It tells us nothing about the practicalities of development, particularly whether there may be site-specific constraints such as :
Scaling, acidity or high gas Cool water incursion Undesirable environmental effects such as subsidence and hydrothermal
eruptions Poor permeability. However, limited permeability does not necessarily mean the
heat stored in a particular sector of the field is not available. It may be too poorly permeable to permit the economic drilling of wells, but could still contribute heat and fluid to other more permeable sectors.
The greatest value in doing a stored heat assessment is that it gives an understandable, rational basis for comparing the size of different geothermal resources, taking into account both volume and temperature. Pragmatically, the utility of stored heat assessments can be demonstrated by applying them to known fields and determining that they produce what has been demonstrated to be a sustainable output. Provided it is used for this purpose and the limitations are understood a stored heat assessment can be very helpful. It should not however be regarded, at best, as any better than ± 50 % in terms of actual generation capacity. In the following section the key parameters used in resource capacity calculations are defined. For this review a probabilistic approach is taken where minimum, most likely (mode) and maximum values are estimated as input to the calculations. This approach is described in section 2.5.

AP00512.0:EWDOCS-#788454-V2-RESOURCE_CAPACITY_ESTIMATES_FOR_HIGH-TEMPERATURE_GEOTHERMAL_SYSTEMS_IN_THE_WAIKATO_REGION.DOC PAGE 9
2.2 Definitions and Criteria 2.2.1 Areal Extent The areal extent is defined as the area of the resource that has at least 500 m thickness, temperatures over 240°C at drillable depths and useable fluid. Although it is possible to exploit geothermal fluid at less than 240°C using binary cycle plant, this will probably require pumping rather than self-discharging wells, except in the unusual situation of low temperature steam zones, such as occur at Wairakei. Pumped well / binary technology, while perfectly feasible, is unlikely to be economic in New Zealand, given the low power price, drilling costs, and the impact of the low value of the NZ$ on the cost of capital plant. Where there are no wells, the resource area may be estimated on the basis of geophysics and the distribution of thermal activity. Extensive use of the compilation by Stagpoole and Bibby (1998) has been made in this regard. For consistency, the maximum estimate of resource area is taken in this review to be the area of the low resistivity anomaly or the area inside the resistivity “boundary”. The resistivity boundary is generally taken to be the area of the field where the steepest resistivity gradient occurs and which is interpreted to represent the edge of the saline reservoir and associated hydrothermal alteration (e.g: Bibby et al. 1994). This may be obscured if the system is waning and relict alteration exists (e.g: Horohoro). The resource area may not always include surface features (e.g.: Mokai). The estimate of most likely resource area (mode) is less than the area of the low resistivity anomaly, by a degree depending on information available (e.g.: at Ohaaki, well data indicates that most of the area inside the resistivity boundary is high-temperature resource). Where possible published estimates of the area of low-resistivity are used. In other cases, areas have been measured off the resistivity map of Stagpoole and Bibby (1998, nominal spacing of AB/2 =1000m). 2.2.2 Thickness “Thickness” refers to the mean thickness of the reservoir. The upper surface is taken to correspond to the depth where the minimum temperature is 240°C, and the bottom in this case to a vertical drilling depth of 2,500 m (plus 500 m storage for the “maximum” estimate). The exception is where an outflow exists and temperatures at deeper levels are low. Some overseas fields, where power prices are higher, have been drilled to significantly deeper than 2,500 m, so this approach down-rates the New Zealand fields in comparison. At the same time, some New Zealand fields, most notably Wairakei and to a lesser extent Ohaaki, take a large proportion of their current production from very shallow levels. Hence the stored heat estimates made for this review may look large in comparison to the current installed capacity. The shallowest possible depth at which a temperature of 240°C can occur, assuming boiling-point for depth conditions, is about 380 m.

AP00512.0:EWDOCS-#788454-V2-RESOURCE_CAPACITY_ESTIMATES_FOR_HIGH-TEMPERATURE_GEOTHERMAL_SYSTEMS_IN_THE_WAIKATO_REGION.DOC PAGE 10
2.2.3 Volume Reservoir volume is the area multiplied by the thickness as defined above. 2.2.4 Void Space Void Space is defined here as the volume percentage of the reservoir that is connected void space, and therefore can contain producible fluid. It includes open porosity and fractures but not sealed pores. In assessing reservoir capacity at an early stage, this is a more useful concept than permeability, since the latter varies over too wide a range and does not give a good estimate of fluid storage, and better than porosity (as determined by rock density measurements) because it does not include sealed pores. The void space is required for calculating the total fluid mass of the resource and in turn the total stored heat capacity. It is also used for estimating the fraction of the heat which can be recovered. For typical TVZ lithologies Void Space values of 8, 10, 12 (min, mode, max) are used. These are based loosely on porosities measured by Grindley and Browne (1968), using values at the lower end of the range measured. In part, this is because the measured data tends to be biased towards shallower levels, where porosities can generally be expected to be higher. Void Space values are increased where there is clear evidence for high permeabilities (e.g: Wairakei) or downgraded if the reservoir includes sedimentary basement rocks (e.g: Ohaaki). Void space and total fluid volume are not major determinants of total stored heat since the host rock contains the majority of the heat. 2.2.5 Temperature The mean temperature of the resource is obtained from direct downhole measurements on wells or by use of indirect methods, e.g.: chemical geothermometry on surface features. Liquid (solute) geothermometers will sometimes give temperature estimates well below actual temperatures at depth. It must be noted that the mean resource temperature refers to the entire resource area and may be lower than the mean feed-zone temperature of production wells that are drilled. At the same time, if wells are producing shallow, the estimate of the mean resource temperature through the reservoir thickness for 2500 m may be higher than measured well temperatures. A base temperature of 180°C is used for the stored heat calculations. While it would be uneconomic to use 180°C fluid directly for power generation, it is reasonable to assume that fluid down to this temperature can provide recharge to higher temperature sectors or to shallow vapour zones. 2.3 Stored Heat Resource Capacity Estimate 2.3.1 Basic Deterministic Method The principle of the stored heat method is to estimate the heat stored within the defined reservoir volume, both in the rock and fluid and above some base temperature which must be stated. In shallow reservoirs it has often been taken to be 180°C (as in this case), but in liquid reservoirs with a deep water level, or high temperatures implying a high separation pressure on silica saturation grounds, consideration should be given to selecting a higher base temperature.

AP00512.0:EWDOCS-#788454-V2-RESOURCE_CAPACITY_ESTIMATES_FOR_HIGH-TEMPERATURE_GEOTHERMAL_SYSTEMS_IN_THE_WAIKATO_REGION.DOC PAGE 11
The stored heat includes both the heat stored in the rock and the heat stored in the reservoir fluid. The reservoir volume is usually taken as the areal extent multiplied by the drilled depth plus some additional storage volume, assumed to exist below the drilled depth, commonly another 500 m. The equation used to calculate the stored heat is as follows: Q = A .h. {[Cr.ρr (1-φ).(Ti – Tf)] + [ρsi.φ .(1-Sw).(hsi - hwf)] + [ρwi .φ .Sw .(hwi - hwf)]} - (1) heat in rock heat in steam heat in water where: Q = stored heat A = areal extent of the reservoir h = average reservoir thickness Cr = specific heat of the rock at reservoir conditions Ti = initial average reservoir temperature Tf = base temperature Si = liquid saturation (volume percent of water present as liquid) ρsi, ρwi = steam and water density at reservoir temperature hsi, hwi = steam and water enthalpies at reservoir temperature hwf = water enthalpy at base temperature In order to convert stored heat (Q) to electricity generating capacity (MWe), it is necessary to apply some additional factors. These include: A recovery factor (Rf) to determine the amount of stored heat that can be extracted. In some cases this has been set as a fixed factor, but in fact this will depend primarily on reservoir void space (if rock is impermeable, heat cannot be extracted by fluid) and so the recovery factor is calculated here to be 2.5 times the void space, with an upper limit of 50%, i.e: Recovery Factor (Rf) = 2.5 x φ . A conversion efficiency (ηc) for converting the recovered heat to electricity. This is usually taken to be 0.1 (i.e. 10%) but consideration should be given to varying the figure for very high or low temperature resources, those with a high gas content or if the plant is more or less efficient than a standard plant (e.g. if binary bottoming plant is used). For this review the following empirical, temperature-dependent equation is used: Conversion Efficiency (ηc) = (0.0484 Ti – 0.5096) / 1000 The economic life of the project (L). This is used to divide the energy content from the previous step by time to give an average output in MWe (MJ/s). It is common to use 20 to 30 years, but for some overseas projects with quick pay-back periods, a shorter period is used. For this review, where there is interest in the long-term sustainability of the resources, periods of 30, 100, 200 and 300 years are used. A plant factor (F), which combines both plant availability and plant capacity. This allows for planned maintenance activities and/or unforeseen problems that cause a shutdown and whether the plant will be base load or load following. In most geothermal plants, this factor is generally between 90% and 95%. New Zealand plants

AP00512.0:EWDOCS-#788454-V2-RESOURCE_CAPACITY_ESTIMATES_FOR_HIGH-TEMPERATURE_GEOTHERMAL_SYSTEMS_IN_THE_WAIKATO_REGION.DOC PAGE 12
have had high plant factors, exceeding 95% in some cases. For this review a plant factor of 90% is used. Using the above factors, the final estimate of power potential (MWe) is calculated as follows:
EQ R
F Lf c=
⋅ ⋅
⋅⎡
⎣⎢
⎤
⎦⎥
η - (2)
A worked example is presented below for Ngatamariki. Sensitivity studies of stored heat assessments have shown that the results are most sensitive to the recovery factor and conversion efficiency and least sensitive to void space (except where that is used to define the recovery factor) and rock density. There are various means by which a stored heat assessment can be refined, for example:
Divide the reservoir into more, smaller blocks and assess each separately for temperature, density, void space, etc.
Integrate the well temperature profiles rather than take an average temperature, and extrapolate to depth using some stated assumption for the temperature gradient such as boiling-point-for-depth, rather than isothermal.
Assess steam zones separately by considering water, steam and rock as separate phases.
Subdivide the temperature profiles into, say, 10°C steps and use the actual properties of water and steam (e.g.: density) at each interval.
Given the large and rather arbitrary factors that are applied to recovery factors and lifetime of the project, and the considerable uncertainties in the reservoir volume, void space and temperature, it is questionable whether such refinements actually give a more realistic result. 2.4 Worked Example Following is a step-by-step stored heat calculation using the mean resource parameters for the Ngatamariki filed (Section 4.7) and the equations presented above Input Parameters Resource Parameters: Resource Area (A) = 10 km2 Resource Thickness (h) = 2100 m Resource Temperature (Ti) = 260°C Void Space (φ) = 0.08 (8%) Liquid Saturation (Sw) = 1.0 (i.e: no steam present) Fixed Parameters: Base Temperature (Tf) = 180°C Rock Density (ρr) = 2700 kg/m3 Rock Heat Capacity (CR) = 0.9 kJ/kg°C

AP00512.0:EWDOCS-#788454-V2-RESOURCE_CAPACITY_ESTIMATES_FOR_HIGH-TEMPERATURE_GEOTHERMAL_SYSTEMS_IN_THE_WAIKATO_REGION.DOC PAGE 13
Units: 1 Watt (W) = 1 J/s 1 MW = 1000 kJ/s 1 PetaJoule (PJ) = 1 x 10¹⁵ J Heat Capacity of Rock (volumetric, relative to base temperature) Volumetric Heat Capacity = [ Cr. ρr (1-φ) (Ti – Tf)] = 0.9 kJ/kg°C x 2700 kg/m3 x (1 - 0.08) x (260 – 180)°C = 178,848 kJ/m3 Heat Capacity of Steam Steam Heat Capacity = [ρsi .φ .(1 - Sw) .(hsi - hwf)] = 0 since steam is assumed to be absent (i.e: liquid saturation, Swi = 1) Heat Capacity of Water (volumetric, relative to base temperature) Water Density (ρwi) = 783 kg/m3 (from steam tables using Ti) hwi = 1134 kJ/kg (from steam tables using Ti) hwf = 763 kJ/kg (from steam tables using Tf) Volumetric Heat Capacity = [ρwi .φ .Sw .(hwi - hwf)] = 783 kg/m3 x 0.08 x 1 x (1134 – 763) kJ/ kg = 23,239 kJ/m3 Total Heat Capacity (Rock + Water) Volume of Rock = Heat in Rock + Heat in Steam + Heat in Water = 174,960 kJ/m3 + 0 + 29,049 kJ/m3 = 202,087 kJ/m3 = 202 MJ/m3 Heat in Place Q = A x h x Total Heat Capacity
Heat in Place = 10 x 106 m2 x 2100 m x 202 MJ/m3
= 4.24 x 10¹² MJ = 4240 PJ Generating Capacity (MWe) Recovery Factor (Rf) = 2.5 x φ (empirical equation) = 0.20 Conversion Efficiency (ηc) = (0.0484 Ti – 0.5096) / 100 (empirical equation) = 0.121

AP00512.0:EWDOCS-#788454-V2-RESOURCE_CAPACITY_ESTIMATES_FOR_HIGH-TEMPERATURE_GEOTHERMAL_SYSTEMS_IN_THE_WAIKATO_REGION.DOC PAGE 14
Plant Capacity Factor (F) = 0.9 (arbitrary) Plant Life (L) = 30 years = 30 x 365 x 24 x 3600 seconds
⎥⎦
⎤⎢⎣
⎡
⋅
⋅⋅=
LFRQ
E cf η
Therefore: E = 4.24 x 1012 MJ x 0.2 x 0.12 / (0.9 x 30 x 365 x 24 x 3600) s = 120 MWe (MJ/s) 2.5 Probabilistic Method The stored heat method described above uses a “deterministic” approach to the estimation of reserves, which means that each variable is assigned a fixed value. In practice, it is probably more meaningful to allow the variables to vary over a defined range, with the probability of any particular value being determined from an appropriately defined distribution. This is the basis of the “Monte Carlo Simulation” technique. Using this technique, a random number is first generated and then used with a defined probability distribution, which may vary for each resource parameter, to determine the values of the variables. The stored heat is then calculated using the generated values. This process is repeated until a well defined probability distribution for the power output (MWe) can be generated. In practice, it is normally necessary to repeat the calculations more than 1,000 times.
250 500 750 1,000 1,250 1,500Thickness [m]
Prob
abili
ty
PDF for Reservoir Thickness
0.0 0.1 0.2 0.3 0.4Porosity
Prob
abili
ty
PDF for Reservoir Porosity Triangular Distribution
minimum value = 500mmost likely value = 1,000mmaximum value = 1,250m
Log-normal Distribution
mean = 0.2 std. dev. = 0.05
Figure 2-1 Examples of Triangular and Log-Normal Distributions
There are a large number of possible probability distributions that can be used to describe each of the variables. The most popular distributions for this purpose, however, are the triangular and log-normal distribution (Figure 2-1) as they can be “skewed” to various degrees. In the triangular distribution, minimum, most likely (modal) and maximum values are used to define the distribution. For example, the reservoir temperature may be described in this way to be consistent with a similar

AP00512.0:EWDOCS-#788454-V2-RESOURCE_CAPACITY_ESTIMATES_FOR_HIGH-TEMPERATURE_GEOTHERMAL_SYSTEMS_IN_THE_WAIKATO_REGION.DOC PAGE 15
distribution of reservoir area. For the log-normal distribution, the mean and standard deviation need to be defined. The calculations for this review are done using a Monte Carlo simulation with a range of values, rather than a single value, for the four key parameters:
Resource area Resource thickness Mean temperature Void space
The estimated ranges for these parameters are given in Table 1 and a defined triangular distribution is used for each. Other parameters which are fixed include: Rock density: 2700 kg/m2 Rock specific heat: 0.9 kJ/kgK Base temperature: 180 °C Resource life: 30, 100, 200 years etc Plant factor 0.9 In this case we have used a single-layer reservoir and not differentiated steam zones. It would be possible to do so, but would make little difference to the stored heat estimates at the level of accuracy concerned since the volumetric energy content of a steam zone (including steam, rock and immobile liquid) is not vastly different to that of a liquid water zone. Also, steam zones in New Zealand fields usually represent only a small proportion of the reservoir volume, and the bulk of the stored heat is in the rock, not the fluid. The results from a Monte Carlo Simulation are generally presented as a histogram of the number of occurrences of a particular value (Probability Density Function - PDF) and as a plot of the Cumulative Distribution Function (CDF). As an example, the results for Ngatamariki are shown in Table 2-1, Figure 2-2 and Figure 2-3. The simulation shows that the most probable resource capacity is about 120 MWe. The distribution is close to symmetrical indicating that any skew in the input parameters is cancelled out. The lower and upper 10th percentiles are about 90 and 160 MWe. These represent capacities which have a 10% probability of being correct.

AP00512.0:EWDOCS-#788454-V2-RESOURCE_CAPACITY_ESTIMATES_FOR_HIGH-TEMPERATURE_GEOTHERMAL_SYSTEMS_IN_THE_WAIKATO_REGION.DOC PAGE 16
Table 2-1 Resource Capacity Probability Simulation Summary, for Ngatamariki
Simulation SummaryMeasure
ObservationsMeanStandard DeviationPosterior STDVarianceMinimum5th PercentileMedian95th PercentileMaximum
Value2000
125.2171926.30506
0.5882691.9561563.2250284.47106
123.37629171.35008235.2352
Estimated Electrical Power (MW)
Occ
uren
ces
(Tot
al =
5,0
00)
60 70 80 90 100 110 120 130 140 150 160 170 180 190 200 210 220 230 2400
100
200
300
400
Figure 2-2 Frequency distribution for resource capacity calculation
Estimated Electrical Power (MW)
Prob
abili
ty
50 100 150 200 2500.00
0.20
0.40
0.60
0.80
1.00
Figure 2-3 Cumulative probability distribution for resource capacity calculation

AP00512.0:EWDOCS-#788454-V2-RESOURCE_CAPACITY_ESTIMATES_FOR_HIGH-TEMPERATURE_GEOTHERMAL_SYSTEMS_IN_THE_WAIKATO_REGION.DOC PAGE 17
2.6 Capacity Based on Heat Flow Surface heat flow estimates have been made for most geothermal systems in the TVZ, expressed as the heat flow above ambient temperature (usually about 12°C). These values are included with the stored heat based estimates (Table 5-1) since they represent a minimum estimate of physically sustainable capacity. This is based on the premise that if the resource is produced only at the rate heat is removed naturally, then the system can sustain production indefinitely (see Section 3 below). The formula for converting surface heat flow (MWth) to generating capacity (MWe) is similar to that used for converting stored heat (Equat 2, section 2.3.1), i.e: MWe = ηc Heat Flow (MWth) / F The calculation assumes that surface heat flow is entirely derived from high-grade exploitable resource. A recovery factor is not required since the surface heat flow is already “recovered” from the system. A plant life is not required because time is already included in the heat flow value (e.g: MJ/s). For consistency, the calculations use the same conversion factor (ηc) and plant factors (F = 0.9) as used in the stored heat calculations.

AP00512.0:EWDOCS-#788454-V2-RESOURCE_CAPACITY_ESTIMATES_FOR_HIGH-TEMPERATURE_GEOTHERMAL_SYSTEMS_IN_THE_WAIKATO_REGION.DOC PAGE 18
3. Issues of Sustainability Sustainable use of a geothermal resource refers broadly to the long-term utilisation of the resource without degrading it. However, there is no strict definition and little consensus on the issue. A good discussion of sustainability and the differing opinions prevailing in the industry is given by Luketina (2001). The Resource Management Act refers to “sustainable management” as the development, use and protection of natural and physical resources in a way, or at a rate, that sustains their potential for the “reasonably foreseeable needs of future generations”, while avoiding, remedying or mitigating any adverse effects of activities on the environment. Some may argue that a geothermal development is only sustainable when surface features, as well as the resource at depth, are preserved. This is probably not possible for a reasonable-sized geothermal plant, particularly where natural surface flow is small and in a delicate hydraulic balance with reservoir fluids (e.g: Ngawha). Environment Waikato have taken a pragmatic approach and allowed for changes to natural activity in “Development” systems, as long as the overall suite of thermal activity in the Waikato Region is not significantly degraded. The natural life-span of a geothermal systems in the TVZ is in the order of tens to hundreds of thousands of years. On a human scale, therefore, the surface activity and natural heat flow can be considered permanent. Therefore, it may be argued that if the resource is produced only at the rate heat is removed naturally, then the system could, in theory, sustain generation indefinitely, although possibly with some change to surface activity. For some fields in the TVZ, capacity based on natural heat flow is significant; four fields have capacities over 50 MWe (Rotokawa, Waimangu, Waitapu-Waikite and Wairakei). In practice, such a development may not remove fluid and heat evenly from the system and localised degradation of the resource may still occur. To optimise capacity from a such a scheme it would be necessary to ensure production is well dispersed and deep, and all reinjection is targeted for full recharge. While the natural heat flow represents a conservative lower limit to the size of a development, additional capacity may be expected from induced recharge. Allis (1981) has assessed the heat flow changes in the Wairakei geothermal system and has estimated a three-fold increase in flow from the 260°C upflow, over the period 1955-1965 (from 600 to 1800 kg/s). Given the exceptionally long-life of geothermal systems it could be expected that such an induced increase could be sustained for a very long time. However, to induce an increase in the flow of the hot source water requires a pressure decline in the reservoir, which may also induce the ingress of shallow cool water (cf. Ohaaki). Achieving a sustainable development not only requires sizing the plant to the resource but minimising impacts such as groundwater incursion, which may degrade the resource. Groundwater incursion has been particularly serious at Ohaaki where the power station output has declined to about ¼ of full capacity. The problems at Ohaaki are not because of inadequate stored heat - the power plant at Ohaaki (110 MWe) is within the range of estimated resource capacity for a 30 year life (145 MWe). Rather, the problem is that most production is from relatively shallow depths (500-1000 m) and the system is poorly capped. Pressure decline in the shallow reservoir has resulted

AP00512.0:EWDOCS-#788454-V2-RESOURCE_CAPACITY_ESTIMATES_FOR_HIGH-TEMPERATURE_GEOTHERMAL_SYSTEMS_IN_THE_WAIKATO_REGION.DOC PAGE 19
in significant groundwater incursion, enthalpy decline and calcite scaling (due to admixture of bicarbonate-rich shallow waters). It could be argued that such external impacts are less likely with a smaller plant and longer plant life since production could be planned to give more even extraction of fluid over the whole resource (e.g: by concentrating on deep production). Such an approach would, however, be far less attractive economically. In summary, there are additional resource-related factors beyond simple stored heat which have a bearing on long-term sustainability of a geothermal resource. These include external impacts (e.g: groundwater incursion), the potential for enhanced hot recharge (e.g.: Wairakei) and the possibility of unwanted effects on the surface environment.

AP00512.0:EWDOCS-#788454-V2-RESOURCE_CAPACITY_ESTIMATES_FOR_HIGH-TEMPERATURE_GEOTHERMAL_SYSTEMS_IN_THE_WAIKATO_REGION.DOC PAGE 20
4. Resource Parameters for Individual Fields Following are summary tables of resource parameters for high-temperature geothermal fields in the Waikato region. For each of the key parameters, three values are given; a minimum, most likely (bold) and maximum estimate of the parameter. Literature references are given where these have guided the selection of values. In many cases however, the actual values and range are based on what we consider to be most reasonable, given the current information available for the field, and from our experience with analogous systems in New Zealand and overseas. Entries for Possible Resource Constraints are physical processes or conditions that may directly degrade the capacity of the resource or make it technically more difficult to utilise (e.g.: groundwater incursion, scaling, acidity). Development constraints such as environmental impact or protection status, while critical to any commercial development, are not considered here as they do not directly impact on the resource capacity. A simplified version of the resistivity map of Stagpoole and Bibby (1998), referenced throughout this review, is shown in Figure 4-1.
Figure 4-1. Resistivity Map of Taupo Volcanic Zone (Environment Waikato website: www.ew.govt.nz/ourenvironment/geothermal)

AP00512.0:EWDOCS-#788454-V2-RESOURCE_CAPACITY_ESTIMATES_FOR_HIGH-TEMPERATURE_GEOTHERMAL_SYSTEMS_IN_THE_WAIKATO_REGION.DOC PAGE 21
4.1 Atiamuri
Natural Features Dilute chloride springs with temperature up to 73°C (Cave et al. 1992), sinter deposits, hydrothermal eruption craters.
Information Available
Fluid chemistry, resistivity surveys, measurements from one shallow well: (AT1; 605 m deep).
Mean Resource Temperature (°C)
180, 210, 240°C. No temperature information from below 600 m. Maximum measured temperature = 165°C in well AT1 (Cave et al. 1992). Geothermometers indicate 180-200°C source (Hedenquist and Giggenbach, 1987). Allis (1987) suggests resource has similarities to Horohoro and may not be high-grade.
Resource Area (km2)
0, 0, 5 km2. 30 Ωm contour encloses ~7 km2. 20 Ωm contour encloses 3 km2. Area downgraded on basis of inversion in well AT1 (Cave et al. 1992). Zero values reflect chance that high-grade (>240°C) resource may not exist.
Thickness (m) 1500, 1700, 2200 m. Thickness downgraded on basis of isothermal profile at bottom of AT1.
Void Space 8, 10, 12%. Typical TVZ lithology.
Heat Flow ~0.5 MWth (Allis, 1987).
Possible Resource Constraints Moderate temperatures, small resource size.

AP00512.0:EWDOCS-#788454-V2-RESOURCE_CAPACITY_ESTIMATES_FOR_HIGH-TEMPERATURE_GEOTHERMAL_SYSTEMS_IN_THE_WAIKATO_REGION.DOC PAGE 22
4.2 Horohoro
Natural Features Dilute chloride spring (51°C) and seepages up to 90°C (Allis, 1987), fossil sinter deposits.
Information Available
Spring chemistry, geology and geophysics. Measurements from one drillhole in Matahana basin (HH1, 600 m)
Mean Resource Temperature (°C)
180, 200, 240°C. Geothermometry gives source temperatures of 150-200°C (Hedenquist and Giggenbach, 1987). Maximum temperature in HHI: ~80°C. Relict alteration and fossil sinter suggest system has waned.
Resource Area (km2)
0, 0, 5 km2. A small resistivity anomaly (~5 km2) is associated with the thermal area (Allis, 1987) but higher resistivities at depth suggest shallow fault-fed system. The large Matahana Basin anomaly to the west is considered to be unrelated. Because of relict alteration, resistivity provides poor indication of current resource size and location (Allis, 1987). Zero values reflect chance that high grade (>240°C) resource does not exist.
Thickness (m) 1800, 2000, 2500 m. Typical TVZ values used (Section 2.2.2).
Void Space 8, 10, 12%. Typical TVZ lithology.
Heat Flow ~ 0.32 ± 0.08 MWth (Allis, 1987)
Possible Resource Constraints Moderate temperatures, small resource size.
AP00512.0:EWDOCS-#788454-V2-RESOURCE_CAPACITY_ESTIMATES_FOR_HIGH-TEMPERATURE_GEOTHERMAL_SYSTEMS_IN_THE_WAIKATO_REGION.DOC PAGE 23
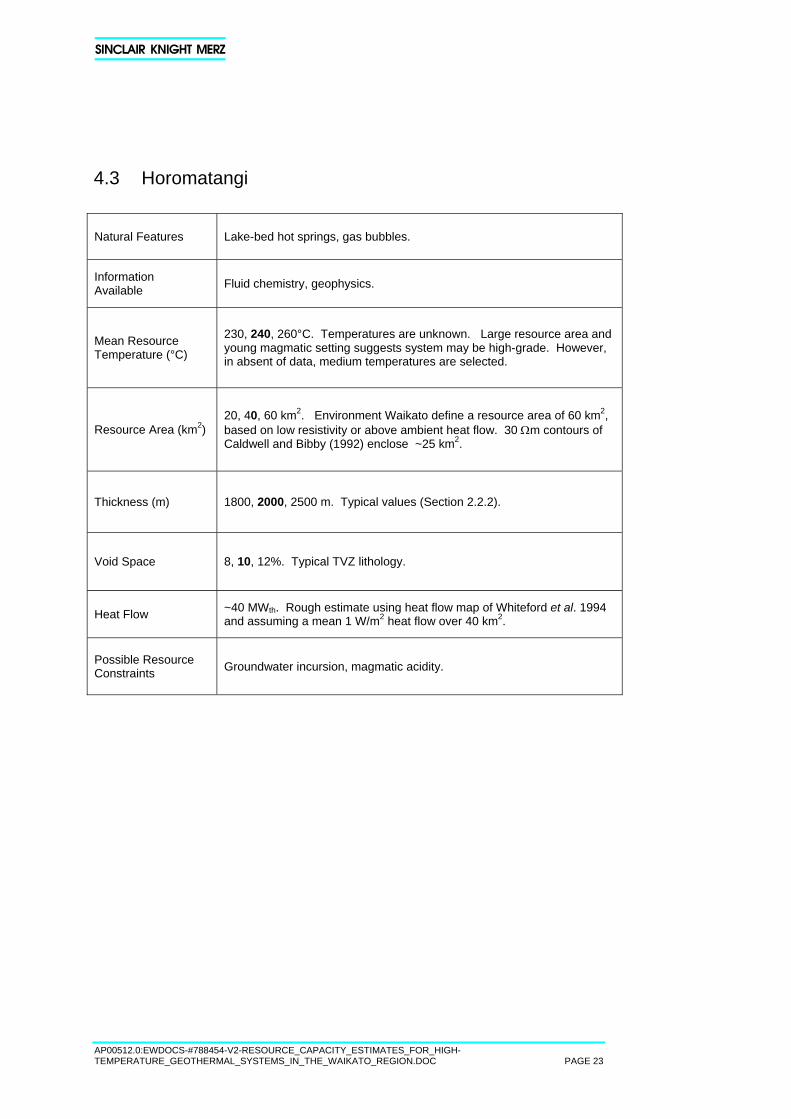
4.3 Horomatangi
Natural Features Lake-bed hot springs, gas bubbles.
Information Available Fluid chemistry, geophysics.
Mean Resource Temperature (°C)
230, 240, 260°C. Temperatures are unknown. Large resource area and young magmatic setting suggests system may be high-grade. However, in absent of data, medium temperatures are selected.
Resource Area (km2) 20, 40, 60 km2. Environment Waikato define a resource area of 60 km2, based on low resistivity or above ambient heat flow. 30 Ωm contours of Caldwell and Bibby (1992) enclose ~25 km2.
Thickness (m) 1800, 2000, 2500 m. Typical values (Section 2.2.2).
Void Space 8, 10, 12%. Typical TVZ lithology.
Heat Flow ~40 MWth. Rough estimate using heat flow map of Whiteford et al. 1994 and assuming a mean 1 W/m2 heat flow over 40 km2.
Possible Resource Constraints Groundwater incursion, magmatic acidity.

AP00512.0:EWDOCS-#788454-V2-RESOURCE_CAPACITY_ESTIMATES_FOR_HIGH-TEMPERATURE_GEOTHERMAL_SYSTEMS_IN_THE_WAIKATO_REGION.DOC PAGE 24
4.4 Mangakino
Natural Features At least one boiling spring, now submerged by Lake Maraetai.
Information Available
Fluid chemistry, geology and geophysics. One well (600m) but temperatures not public.
Mean Resource Temperature (°C)
200, 230, 250°C. Little temperature information available. Boiling springs suggest resource temperatures in excess of 200°C.
Resource Area (km2)
0, 8, 10 km2. 30 Ωm contours enclose area of ~10 km2 (using AB/2 = 1000 map of Stagpoole and Bibby, 1998). Zero value reflect chance that high-grade resource (>240°C) may not exist.
Thickness (m) 1500, 1700, 2200 m. Limited shallow drilling has found condensed steam at 600 m, so reservoir assumed to be deeper.
Void Space 8, 10, 12%. Typical TVZ lithology.
Heat Flow Not known
Possible Resource Constraints Moderate temperatures, small resource size

AP00512.0:EWDOCS-#788454-V2-RESOURCE_CAPACITY_ESTIMATES_FOR_HIGH-TEMPERATURE_GEOTHERMAL_SYSTEMS_IN_THE_WAIKATO_REGION.DOC PAGE 25
4.5 Mokai
Natural Features Dilute chloride springs, fumaroles and mud pools.
Information Available
Fluid chemistry, geology and geophysics. Measurements from 9 deep wells, production history.
Mean Resource Temperature (°C)
260, 280, 290°C. Maximum temperature of 325°C. Much of the resource proven with drilling.
Resource Area (km2) 5, 6, 16 km2. 20 Ωm contours enclose area of ~6 km2 . Bibby et al. (1984) give a low resistivity area of 12-16 km2. Part of the low resistivity area is in outflow (<240°C).
Thickness (m) 1300, 1800, 2300 m. Values downgraded because parts of system are in outflow.
Void Space 8, 10, 12%. Typical TVZ lithology. Average void ratio less than Wairakei because of proven ignimbrites and artesian capping.
Heat Flow 100 MWth (Mongillo and Clelland, 1984)
Possible Resource Constraints None recognised

AP00512.0:EWDOCS-#788454-V2-RESOURCE_CAPACITY_ESTIMATES_FOR_HIGH-TEMPERATURE_GEOTHERMAL_SYSTEMS_IN_THE_WAIKATO_REGION.DOC PAGE 26
4.6 Motuoapa A distinct resistivity anomaly exists at Motuoapa with the 30 Ωm contour covering 3 km2. Thermal activity includes one warm spring. There is insufficient information to indicate whether a high-temperature resource exists.

AP00512.0:EWDOCS-#788454-V2-RESOURCE_CAPACITY_ESTIMATES_FOR_HIGH-TEMPERATURE_GEOTHERMAL_SYSTEMS_IN_THE_WAIKATO_REGION.DOC PAGE 27
4.7 Ngatamariki
Natural Features Hot springs, bubbling pools, sinter and calcite deposits, hydrothermal eruption craters.
Information Available
Fluid chemistry, geology and geophysics. Measurements from 3 deep wells (NM1-3).
Mean Resource Temperature (°C)
250, 260, 270°C. Wells delineate an area of 2 km2 with temperatures >250°C. Maximum measured temperature = 282°C in well NM2 at 1000m. Higher temperatures may exist.
Resource Area (km2) 8, 10, 14 km2. 30 Ωm contours on map of Bennie and Stagpoole enclose area of 10 km2. Data from Risk (1988) indicate a larger area of up to 14 km2 and this is taken as the maximum.
Thickness (m) 1800, 2100, 2500 m. Typical TVZ values used (see Section 2.2.2).
Void Space
5, 8, 10%. Based on 800-900 m of high porosity ignimbrites and tuffs (est. 15% porosity), but less permeable diorite formations (est. 5%). Marginal areas of the resource may be less permeable. Stratigraphy is given in Brotheridge (1995)
Heat Flow 30-40 MWth , mainly as hot water (Bromley, 2000).
Possible Resource Constraints Groundwater incursion, scaling.

AP00512.0:EWDOCS-#788454-V2-RESOURCE_CAPACITY_ESTIMATES_FOR_HIGH-TEMPERATURE_GEOTHERMAL_SYSTEMS_IN_THE_WAIKATO_REGION.DOC PAGE 28
4.8 Ngauruhoe Ngauruhoe is the youngest and most active cone in the Tongariro volcanic massif. It last erupted in 1975. There is no available information on the existence of a hydrothermal system at Ngauruhoe. Any system is likely to be juvenile and acidic.

AP00512.0:EWDOCS-#788454-V2-RESOURCE_CAPACITY_ESTIMATES_FOR_HIGH-TEMPERATURE_GEOTHERMAL_SYSTEMS_IN_THE_WAIKATO_REGION.DOC PAGE 29
4.9 Ohaaki
Features (natural state)
Boiling, alkaline chloride-bicarbonate springs, silica sinter, steaming ground, mud pools,.
Information Available
Fluid chemistry, geology and geophysics. Measurements from 40 medium-to-deep wells.
Mean Resource Temperature (°C)
260, 270, 280°C. Maximum measured temperature 304°C (Hedenquist, 1983). Boiling-point for depth conditions over much of resource. Data in Glover and Hedenquist (1989) show 240°C contours extending close to resistivity boundary.
Resource Area (km2) 6, 10, 12 km2. 11 km2 inside 20 Ωm contour. Bibby et al. (1994) give low resistivity area of ~12 km2. Most of the area inside resistivity boundary has been proven by drilling.
Thickness (m) 1800, 2100, 2500 m. Typical values used (see Section 2.2.2).
Void Space 6, 8, 10%. Typical TVZ lithology, downgraded on basis of shallower depth to greywacke.
Heat Flow ~100 MWth (Glover and Hedenquist, 1989)
Observed Constraints
Groundwater incursion and temperature decline, calcite scaling, severe subsidence (Clotworthy et al., 1995)

AP00512.0:EWDOCS-#788454-V2-RESOURCE_CAPACITY_ESTIMATES_FOR_HIGH-TEMPERATURE_GEOTHERMAL_SYSTEMS_IN_THE_WAIKATO_REGION.DOC PAGE 30
4.10 Ongaroto The Ongaroto field is represented by a small resistivity anomaly on the map of Stagpoole and Bibby (1998). The 30 Ωm contour encloses an area of 3 km2. Within this anomaly thermal seepages occur on the south bank of the Waikato River and others have apparently been drowned by the Whakamaru hydro lake. These features could also be a dilute outflow from the Mokai geothermal field. No thermal features have been reported north of the Waikato River (Cave et al. 1992). There is insufficient information to support the existence of a distinct high-temperature hydrothermal system at Ongaroto.

AP00512.0:EWDOCS-#788454-V2-RESOURCE_CAPACITY_ESTIMATES_FOR_HIGH-TEMPERATURE_GEOTHERMAL_SYSTEMS_IN_THE_WAIKATO_REGION.DOC PAGE 31
4.11 Orakei Korako
Features Boiling springs (alkaline chloride-sulphate-bicarbonate), silica sinter, fumaroles. Many features have been submerged by Lake Ohakuri.
Information Available
Fluid chemistry, geology, geophysics and measurements from 4 deep wells (OK1, 2, 4, 6).
Mean Resource Temperature (°C)
240, 250, 260°C. Maximum measured temperature 265°C at 1140 m in OK2. Southern wells (OK1, OK4) have temperature < 250°C and inversions (Bignall, 1992), indicating outflow conditions. Solute geothermometry indicates 220-230°C (Lyon and Sheppard, 1981).
Resource Area (km2) 8, 10, 12 km2. 30 Ωm contour (map of Stagpoole and Bibby, 1992) is required to enclose well OK2 in north and thermal areas to south. This gives an area of 13 km3.
Thickness (m) 1500, 1800, 2200 m. Values downgraded because southern parts of resource area appears to be in outflow.
Void Space 8, 10, 12%. Typical TVZ lithology
Heat Flow 34 MWth (Mongillo and Clelland, 1984)
Possible Resource Constraints Groundwater incursion, calcite scaling (similar system to Ohaaki).

AP00512.0:EWDOCS-#788454-V2-RESOURCE_CAPACITY_ESTIMATES_FOR_HIGH-TEMPERATURE_GEOTHERMAL_SYSTEMS_IN_THE_WAIKATO_REGION.DOC PAGE 32
4.12 Reporoa
Features Heated ground, mud pools, small springs discharging alkali chloride bicarbonate water.
Information Available Well data (RP1), fluid chemistry, geology and geophysics.
Mean Resource Temperature (°C)
220, 230, 240°C. Maximum measured temperature: 225°C in well RP1 (Bignall, 1990), but with inversion.
Resource Area (km2) 0, 9, 12 km2. 12 km2 inside 10 Ωm contour. Area downgraded on basis that system may be waning and low-resistivity zone represents older larger system (Bibby et al., 1994).
Thickness (m) 1000, 1500, 2000 m. Mean thickness downgraded on basis that part of system lies in outflow.
Void Space 8, 10, 12%. Typical TVZ lithology assumed.
Heat Flow ~ 20 MWth (Bibby et al. 1994)
Possible Resource Constraints Moderate temperature.
AP00512.0:EWDOCS-#788454-V2-RESOURCE_CAPACITY_ESTIMATES_FOR_HIGH-TEMPERATURE_GEOTHERMAL_SYSTEMS_IN_THE_WAIKATO_REGION.DOC PAGE 33
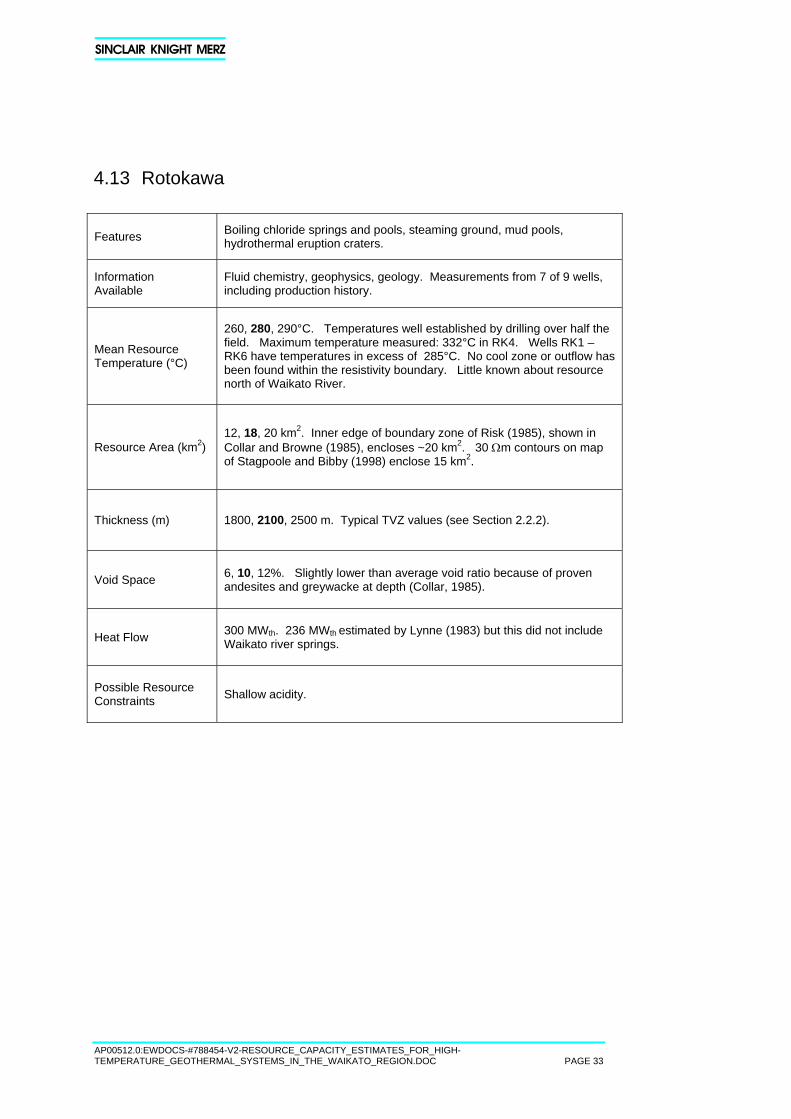
4.13 Rotokawa
Features Boiling chloride springs and pools, steaming ground, mud pools, hydrothermal eruption craters.
Information Available
Fluid chemistry, geophysics, geology. Measurements from 7 of 9 wells, including production history.
Mean Resource Temperature (°C)
260, 280, 290°C. Temperatures well established by drilling over half the field. Maximum temperature measured: 332°C in RK4. Wells RK1 – RK6 have temperatures in excess of 285°C. No cool zone or outflow has been found within the resistivity boundary. Little known about resource north of Waikato River.
Resource Area (km2) 12, 18, 20 km2. Inner edge of boundary zone of Risk (1985), shown in Collar and Browne (1985), encloses ~20 km2. 30 Ωm contours on map of Stagpoole and Bibby (1998) enclose 15 km2.
Thickness (m) 1800, 2100, 2500 m. Typical TVZ values (see Section 2.2.2).
Void Space 6, 10, 12%. Slightly lower than average void ratio because of proven andesites and greywacke at depth (Collar, 1985).
Heat Flow 300 MWth. 236 MWth estimated by Lynne (1983) but this did not include Waikato river springs.
Possible Resource Constraints Shallow acidity.

AP00512.0:EWDOCS-#788454-V2-RESOURCE_CAPACITY_ESTIMATES_FOR_HIGH-TEMPERATURE_GEOTHERMAL_SYSTEMS_IN_THE_WAIKATO_REGION.DOC PAGE 34
4.14 Ruapehu Ruapehu is an active andesitic stratovolcano which marks the southern end of the Taupo Volcanic Zone. It erupted most recently in 1999. Crater Lake, located at the summit (2530 m) is a highly saline, acidic lake with chemistry and temperature dependent on the degree of magmatic activity beneath the volcano. The lake water is displaced by eruptive material during eruptions. During periods of quiescence the lake temperature is somewhat above ambient. The chemistry of Crater Lake has been studied in detailed by Giggenbach (1974), primarily for the purposes of identifying chemical indicators of magmatic processes. The saline, acidic composition is produced through the input of magmatic gases (mainly HCl and SO2). There is no available information indicating that Ruapehu hosts a mature hydrothermal system. If a hydrothermal system exists, it is likely to be acidic.

AP00512.0:EWDOCS-#788454-V2-RESOURCE_CAPACITY_ESTIMATES_FOR_HIGH-TEMPERATURE_GEOTHERMAL_SYSTEMS_IN_THE_WAIKATO_REGION.DOC PAGE 35
4.15 Tauhara
Features Chloride springs, steaming ground, fumaroles, mud pools and hydrothermal eruption craters.
Information Available
Fluid chemistry, geology and geophysics. Measurements from four deep wells (TH1 - TH4). Indirect “production history” due to effects of Wairakei.
Mean Resource Temperature (°C)
240, 260, 270°C. All 4 wells have temperatures over 250°C with maximum of 279°C in well TH3. Resource conditions to south are unknown.
Resource Area (km2) 7, 15, 35 km2. Resistivity boundary of Risk et al. (1994) encloses an area of 35-50 km2, with Waikato River as arbitrary boundary with Wairakei.
Thickness (m) 1700, 2000, 2500 m. Near to typical TVZ values.
Void Space 10, 12, 15%. Above-average values based on well stratigraphy and similarity to Wairakei.
Heat Flow 200 MWth. 200-220 MWth from Curtis (1988), as referenced by Luketina (2001). 110 MWth. from Fisher (1965). High uncertainty because of significant lake-shore heat flow.
Possible Resource Constraints Pressure decline due to Wairakei production.

AP00512.0:EWDOCS-#788454-V2-RESOURCE_CAPACITY_ESTIMATES_FOR_HIGH-TEMPERATURE_GEOTHERMAL_SYSTEMS_IN_THE_WAIKATO_REGION.DOC PAGE 36
4.16 Te Kopia
Features Acid-sulphate pools, springs, steaming ground, fumaroles, mud pools and hydrothermal eruption craters, relict sinter deposits.
Information Available
Fluid chemistry, geology and geophysics. Measurements from two deep wells: TK1 (945m) and TK2 (1250m).
Mean Resource Temperature (°C)
230, 240, 250°C. Maximum measured temps: 241°C in well TK2 (Mongillo and Clelland, 1984) and 227°C in TK2 (Soengkono, 1999). However, both wells lie close to the resistivity boundary, so higher temperatures are likely. No information on resource temperatures to the south.
Resource Area (km2) 6, 10, 12 km2. Inner edge of resistivity boundary of Soengkono (1999) encloses an area of ~12 km2. Thermal features cover 3 x 1.2 km2.
Thickness (m) 1700, 2000, 2500 m. Typical TVZ values (see Section 2.2.2)
Void Space 8, 10, 12% Typical TVZ values.
Heat Flow Not known, but probably large given extensive surface activity. Assume a value of 100 MWth.
Resource Constraints Moderate temperature.

AP00512.0:EWDOCS-#788454-V2-RESOURCE_CAPACITY_ESTIMATES_FOR_HIGH-TEMPERATURE_GEOTHERMAL_SYSTEMS_IN_THE_WAIKATO_REGION.DOC PAGE 37
4.17 Tokaanu-Waihi-Hipaua
Features Boiling chloride springs, steaming ground, fumaroles.
Information Available
Chemistry of surface features, geology and geophysics. Some shallow wells.
Mean Resource Temperature (°C)
250, 260, 270°C. Shallow wells with temperatures up to 169°C (Cave et al., 1992). Robinson and Sheppard (1986) infer 250°C source water on basis of chemistry. Gas geothermometry gives temperatures up to 280°C. Analogous, high-relief andesitic systems commonly have temperatures over 300°C, but large areas of the resource may be much cooler.
Resource Area (km2)
10, 20, 30 km2. 20 Ωm contours from MT surveys of Risk et al. (1998) defines area of ~20 km2, including high elevation thermal areas but not chloride springs. 50 Ωm contours enclose area of 40 km2 but includes areas clearly outside resource.
Thickness (m) 1500, 1700, 2200 m. Based on top of reservoir being at 800m.
Void Space
4, 8, 12% No well data. Typical TVZ values (Section 2.2.4) are downgraded on basis of marine sedimentary basement, inferred on basis of regional geology, gravity (Bromley, 1999) and high CH4 content (Robinson and Sheppard, 1986).
Heat Flow 70 MWth ± 15 MWth (Severne, 1999). No basis for inferring significant subsurface flow.
Possible Resource Constraints none recognised

AP00512.0:EWDOCS-#788454-V2-RESOURCE_CAPACITY_ESTIMATES_FOR_HIGH-TEMPERATURE_GEOTHERMAL_SYSTEMS_IN_THE_WAIKATO_REGION.DOC PAGE 38
4.18 Tongariro (Ketetahi)
Natural Features At Ketetahi: fumaroles (138°C max), steaming ground, springs, mud-pools, thermally altered ground. Historical eruptions from Upper Te Mari Crater and Red craters (Cole et al., 1987).
Information Available Fluid chemistry, geology and geophysics. No wells
Mean Resource Temperature (°C)
230, 240, 260°C. Based on evidence for steam-dominated resource (Hochstein and Bromley, 1979) and tendency for temperatures in such systems to lie close to 240°C. Cave et al. 1992 suggest 280-300°C based on isotope geothermometry but this may be at greater than drillable depth.
Resource Area (km2) 10, 12, 20 km2. Low resistivity area is 15-20 km2 (Cave et al. 1992)
Thickness (m) 1500, 1700, 2200 m. Reduced from typical TVZ values because of high elevation and greater depth to top of reservoir.
Void Space 4, 8, 12%. Lower than average values because of andesitic reservoir and possible Tertiary sedimentary basement.
Heat Flow ~200 MWth. Based on: 65 MWth surface heat flow (Cave et al. 1992) and inferred subsurface brine heat flow of 140 MWth (using 300→240°C flash). Walsh et al. (1998) give a surface heat flow of 58 MWth.
Possible Resource Constraints Acid magmatic fluids, volcanic eruption.

AP00512.0:EWDOCS-#788454-V2-RESOURCE_CAPACITY_ESTIMATES_FOR_HIGH-TEMPERATURE_GEOTHERMAL_SYSTEMS_IN_THE_WAIKATO_REGION.DOC PAGE 39
4.19 Waimangu
Features Hydrothermal eruption craters; boiling chloride springs, thermal lakes, fumaroles. All date from after Tarawera eruption (1886).
Information Available Geology, chemistry, geophysics. No wells.
Mean Resource Temperature (°C)
250, 260, 270°C. Temperatures of 260-280°C indicated from chemical geothermometry (Simmons et al., 1994).
Resource Area (km2) 9, 12, 30 km2. 10 Ωm contour covers 14 km2. Boundaries to south (Waiotapu) and north not well defined. Higher areal estimate includes remnant system under Lake Rotomahana.
Thickness (m) 1800, 2100, 2500 m. Typical TVZ values (see Section 2.2.2)
Void Space 8, 10, 15%. No particular reason to suppose geology is different from general TVZ but possibly higher than average void ratio because of young nature of system and lack of alteration.
Heat Flow 400 ± 100 MWth including Rotomahana lake floor (Bibby et al., 1994). 150-190 MWth based on chloride flux from two lakes (Simmons et al., 1994).
Possible Resource Constraints
Groundwater incursion (young, poorly-capped system?), magmatic acidity.

AP00512.0:EWDOCS-#788454-V2-RESOURCE_CAPACITY_ESTIMATES_FOR_HIGH-TEMPERATURE_GEOTHERMAL_SYSTEMS_IN_THE_WAIKATO_REGION.DOC PAGE 40
4.20 Waiotapu-Waikite
Features Boiling chloride springs, steaming ground, mud pools, fumaroles, hydrothermal eruption craters.
Information Available Data from seven exploratory wells, fluid chemistry, geology, geophysics.
Mean Resource Temperature (°C)
260, 275, 280°C. Maximum temperature of 295°C measured in well WT7 at 1000 m (Hunt et al., 1994).
Resource Area (km2)
15, 20, 30 km2. Includes Waikite. Hot ground covers 17 km2 (Hedenquist, 1982). Using 20 Ωm contours west and east and arbitrary boundaries between Reporoa (south) and Waimangu (north), an area of ~30 Ωm is defined.
Thickness (m) 1200, 1800, 2500 m. Typical TVZ values (see Section 2.2.2) down-graded because of areas of resource that lie in outflows..
Void Space 8, 10, 12%. Typical TVZ lithology.
Heat Flow 620 MWth. 550 MWth from Waiotapu (Giggenbach et al. 1994) and 70 MWth from Waikite (Cave et al. 1992).
Possible Resource Constraints Groundwater incursion, calcite scaling.

AP00512.0:EWDOCS-#788454-V2-RESOURCE_CAPACITY_ESTIMATES_FOR_HIGH-TEMPERATURE_GEOTHERMAL_SYSTEMS_IN_THE_WAIKATO_REGION.DOC PAGE 41
4.21 Wairakei
Features (natural state)
Boiling chloride springs, steaming ground, mud pools, fumaroles, sinter, hydrothermal alteration.
Information Available
Geology, chemistry, geophysics and measurements from over 100 wells (but very few deep).
Mean Resource Temperature (°C)
250, 255, 265°C. Maximum measured: 271°C. Production wells produce from temperatures of 210-260°C at 500-1000m. Little information available on deep temperatures. No majors areas of outflow within resistivity boundary.
Resource Area (km2)
15, 20, 30 km2. Resistivity boundary zone of Risk et al. (1984) encloses an area of 20-30 km2 with a mean figure of 25 km2 cited in a number of references (e.g.: Bibby et al. 1994). Wells within this boundary have temperatures > 150°C at 700 m (ECNZ, 1990). Boundary with Tauhara set at Waikato River.
Thickness (m) 2000, 2150, 2650 m
Void Space 10, 15, 20%. High void ratios confirmed at shallow levels.
Heat Flow (natural state) ~ 400 MWth , (Electricity Corporation of New Zealand, 1990)
Resource Constraints Groundwater incursion

AP00512.0:EWDOCS-#788454-V2-RESOURCE_CAPACITY_ESTIMATES_FOR_HIGH-TEMPERATURE_GEOTHERMAL_SYSTEMS_IN_THE_WAIKATO_REGION.DOC PAGE 42
5. Resource Capacity Estimates Resource parameters estimated in Section 4 have been used to calculate the electricity generating capacity of the geothermal fields. Capacities based on a 30 year plant life, as used in most commercial resource assessments, are presented in Table 5-1. Capacities based on longer plant lives of 100, 200 and 300 years are shown in Table 5-2. These capacities are of relevance to Environment Waikato because of their core policy of sustainable resource management. They are effectively the 30 year model values reduced in direct proportion to the time period. Included in the table are the capacities based on natural heat flow, which can be considered a physically “sustainable” capacity over an indefinite period. The last column is a composite list of either 300 year values or natural heat flow values, whichever is highest. The heat flow values are higher for five fields. Total generating capacity for the Waikato geothermal fields is estimated to be 3100 MWe, based on a 30 year plant life and using median resource parameters. Summing the 10th and 90th percentile estimates for the individual fields (which gives a greater than 90% confidence) realistic minimum and maximum values of 2200 to 4400 MWe are obtained. Increasing the resource life to 300 years, total generating capacity falls to about 310 MWe, using median capacity values. However, if the capacities based on natural heat flow are taken as minimums the total capacity at 300 years increases to about 420 MWe. The capacity estimates in Table 5-1 are have been revised from what was presented in the 2001 NZGA paper (Lawless and Lovelock, 2001), with the total capacity reduced by about 20% (not including Horomatangi which was omitted from the 2001 review). Most of the changes come about as a result of constraining the maximum estimate of resource area to the size of resistivity anomaly. Also, a number of zero areas have been included for the small fields (Atiamuri, Horohoro) on the basis that these systems may not be high-grade (i.e: nowhere greater than 240°C). The Wairakei field, which has been operating for 45 years, provides a useful “reality check” on the methodology. The median figure of 510 MWe is large compared to the actual installed capacity (now 219 MWe, with Poihipi included). The reasons for this are:
The Wairakei field has been in operation at virtually full output for 45 years, not the 30 years which was used for the estimate here. If the 510 MW was distributed over 45 years, the capacity would drop to 340 MW.
The field has not actually been totally depleted by the operation. The stored heat estimate assumes full degradation of the resource within 30 years, whereas Wairakei clearly is operating at well below that level.
Almost all of the production at Wairakei has come from less than 1000 m depth, whereas the figure used here for most probable depth to the bottom of the reservoir is 2,500 m. To some extent this difference is offset in reality by heat transfer through boiling and flow from a deeper level, but most of the heat is contained in the rock, not the fluid. It does serve to demonstrate that there is a large untapped resource at greater depth at Wairakei, which (on technical grounds only) would be exploitable with current technology, ignoring possible environmental and economic constraints.

AP00512.0:EWDOCS-#788454-V2-RESOURCE_CAPACITY_ESTIMATES_FOR_HIGH-TEMPERATURE_GEOTHERMAL_SYSTEMS_IN_THE_WAIKATO_REGION.DOC PAGE 43
Table 5-1 Resource Parameters and Calculated Generating Capacities for a 30 Year Plant Life
Surface Resource Area Resource Thickness Void Space Mean Temperature Total Fluid Stored Generating Capacity*Field Heat Flow km2 m % °C Mass† Heat† MWe for 30 year Life
MWth min mode max min mode max min mode max min mode max Gkg PJ 10TH median 90TH
1 Atiamuri 0.5 0 0 5 1500 1700 2200 8 10 12 180 220 240 210 200 1 6 182 Horohoro 0.3 0 0 5 1800 2000 2500 8 10 12 180 200 240 250 170 1 5 153 Horomatangi 40 20 40 60 1800 2000 2500 8 10 12 230 240 260 6770 11500 260 380 5304 Mangakino ? 0 8 10 1500 1700 2200 8 10 12 200 230 250 910 1500 20 47 705 Mokai 100 5 6 16 1300 1800 2300 8 10 12 260 280 290 1160 3800 95 140 2206 Ngatamariki 40 8 10 14 1800 2100 2500 5 8 10 250 260 270 1350 4560 90 120 1607 Ohaaki 100 6 10 12 1800 2100 2500 6 8 10 260 270 280 1220 4530 100 130 1708 Orakei-Korako 34 8 10 12 1500 1800 2200 8 10 12 240 250 260 1450 3250 90 110 1359 Reporoa 20 0 9 12 1000 1500 2000 8 10 12 220 230 240 870 1360 20 42 6510 Rotokawa 300 12 18 20 1800 2100 2500 6 10 12 260 280 290 2500 8730 230 300 40011 Tauhara 200 7 15 35 1700 2000 2500 10 12 15 240 260 270 3620 7480 200 320 50012 Te Kopia 100 6 10 12 1700 2000 2500 8 10 12 230 240 250 1550 2940 75 96 12013 Tokaanu-Waihi-Hipaua 70 10 20 30 1500 1700 2200 4 8 12 250 260 270 2180 7280 130 200 30014 Tongariro 200 10 12 20 1500 1700 2200 4 8 12 230 240 260 1580 3930 70 100 15015 Waimangu 400 9 12 30 1800 2100 2500 8 10 15 250 260 270 2990 7130 180 280 42016 Waiotapu-Waikite 620 15 20 30 1200 1800 2500 8 10 12 260 275 280 2980 9160 250 340 45017 Wairakei 400 15 20 30 2000 2150 2650 10 15 20 250 255 265 5790 9060 380 510 670
Means and Totals: 12.9 1897 9.9 250 37,400 86,600 2200 3100 4400
† based on median resource values * Three values are 10, 50 and 90th percentiles
Gkg = 109 kilograms. PJ = 1015 Joules

AP00512.0:EWDOCS-#788454-V2-RESOURCE_CAPACITY_ESTIMATES_FOR_HIGH-TEMPERATURE_GEOTHERMAL_SYSTEMS_IN_THE_WAIKATO_REGION.DOC PAGE 44
Table 5-2 Calculated generating capacities (median values) for plant life of 30, 100, 200 and 300 years. Where these capacities fall below
those estimated from heat flow (shown in italics), the latter can be considered more reliable.
Field Based on Heat FlowNatural Heat Flow 30 Y 100 Y 200 Y 300 Y and 300 Y*
1 Atiamuri 0.06 6 2 0.8 0.6 0.62 Horohoro 0.03 5 1 0.7 0.5 0.53 Horomatangi 5 380 114 57 38 384 Mangakino - 47 14 7 5 -5 Mokai 14 140 42 21 14 146 Ngatamariki 5 120 36 18 12 127 Ohaaki 14 130 39 20 13 148 Orakei-Korako 4 110 33 17 11 119 Reporoa 2 42 13 6 4 4
10 Rotokawa 43 300 90 45 30 4311 Tauhara 27 320 96 48 32 3212 Te Kopia 12 96 29 14 10 1213 Tokaanu-Waihi-Hipaua 9 200 60 30 20 2014 Tongariro 25 100 30 15 10 2515 Waimangu 54 280 84 42 28 5416 Waiotapu-Waikite 88 340 102 51 34 8817 Wairakei 53 510 153 77 51 53
Totals: 360 3130 940 470 310 420
* MW e = MW th * ηc / F (see text) * lists heat flow value or 300 Y stored heat value, whichever is greater
Based on Stored Heat and Plant Life (Years):
Electricity Generating Capacity (MWe)

AP00512.0:EWDOCS-#788454-V2-RESOURCE_CAPACITY_ESTIMATES_FOR_HIGH-TEMPERATURE_GEOTHERMAL_SYSTEMS_IN_THE_WAIKATO_REGION.DOC PAGE 45
6. References Allis R.G. (1981) Changes in heat flow associated with exploitation of the Wairakei geothermal field, New Zealand. N.Z. J. Geol. Geophys. 24, 1-19. Allis R.G. (compiler) (1987) Geophysical and geochemical investigations of the Horohoro geothermal prospect. Geophysics Division, D.S.I.R. Report No: 213. Allis R.G. (compiler) Bibby H.M., Bennie S.L., Stagpoole V.M. and Caldwell T.G. (1994) Resistivity structure of the Waimangu, Waiotapu, Waikite and Reporoa geothermal areas, New Zealand. Geothermics Special Issue. 23, No. 5/6. Bignall G. (1990) Hydrology and hydrothermal alteration, Reporoa well (1), Reporoa, New Zealand. Proc. 12th New Zealand Geothermal Workshop. p257-264. Bignall G. (1992) Fluid inclusion evidence of thermal change in the Orakeikorako Geothermal Field, New Zealand. Proc. 14th New Zealand Geothermal Workshop. p259-266. Bromley C.J. (2000) Statement of evidence in the matter of hearings in relation to the Waikato proposed regional plan. Brotheridge J.M.A. (1995) Surface manifestations – past and present – of the Ngatamariki geothermal field, Taupo Volcanic Zone, New Zealand. MSc Thesis, University of Auckland. Caldwell T.G. and Bibby H.M. (1992) Geothermal implications of resistivity mapping in Lake Taupo. Proc. 14th New Zealand Geothermal Workshop. p207-212. Cave M.P., Lumb J.T. and Clelland L. (1993) Geothermal Resources of New Zealand. Resource Information Report 8, Energy and Resource Division, Ministry of Commerce, New Zealand. Clotworthy A.W., Lovelock B.G. and Carey B. (1995) Operational history of the Ohaaki geothermal field, New Zealand. Proc. World Geothermal Congress 1995, 1797-1802. Cole J.W., Hochstein M.P., Skinner D.N.B. and Briggs R.M. (1987) Tectonic setting of North Island Cenozoic Volcanism. In: International Volcanological Congress 1987, Central North Island Volcanism. Tour Guide. N.Z.G.S. Record 21. Collar R.J. (1985) Hydrothermal eruptions in the Rotokawa geothermal field, Taupo Volcanic Zone, New Zealand. Geothermal Institute Report GIR 014. Collar R.J. and Browne P.R.L. (1985) Hydrothermal eruptions at the Rotokawa geothermal field, Taupo Volcanic Zone, New Zealand. Proc. 7th New Zealand Geothermal Workshop. 171-175. Contact Energy Ltd (1996) Tauhara Geothermal Development. Resource Consent Application. Assessment of Environmental Effects. Sept. 1996.

AP00512.0:EWDOCS-#788454-V2-RESOURCE_CAPACITY_ESTIMATES_FOR_HIGH-TEMPERATURE_GEOTHERMAL_SYSTEMS_IN_THE_WAIKATO_REGION.DOC PAGE 46
Curtis R.J. (1988) Low temperature heat utilisation. – Tauhara Geothermal Field, Taupo. Waikato Catchment Board Technical Report No. 88/2, April 1988. 13 p. Fisher R.G. (1965) Shallow heat flow survey of Taupo Borough and adjacent country. N.Z. J. Geol. Geophys. 7, 725-771. Fisher R.G. and Dickenson D. (1960) The natural heat flow from the Rotokawa area. Unpublished D.S.I.R. report, TSG.10. Giggenbach W.F. (1974) The chemistry of Crater Lake, Mt Ruapehu (New Zealand) during the and after the 1971 active period. N.Z. J. Sci. 17, 33-45. Giggenbach W.F., Sheppard D.S., Robinson B.W., Stewart M.K. and Lyon G.L. (1994) Geochemical structure and position of the Waiotapu geothermal field, New Zealand. Geothermics Special Issue. 23, No. 5/6. Glover R.G. and Ellis A.J. (1967) Chemistry of Hole 1, Reporoa. CD 118/12 RGB, AJE/17. Unpublished D.S.I.R. Chemistry Division report. Glover R.G. and Hedenquist J.W. (1989) History of chemical exploration at Ohaaki-Broadlands. Proc. 11th New Zealand Geothermal Workshop. p73-80. Grindley G.W. and Browne P.R.L. (1968) Geology of the Broadlands Geothermal Field. In: Report on Geothermal Survey at Broadlands 1968. D.S.I.R. Report. Healy J. and Hochstein M.P. (1973) Horizontal flow in hydrothermal systems. Jnl. Hydrology (NZ), 12, Number 2, p71-82. Hedenquist J.W. (1982) Fluid flow through the Waiotapu geothermal system, New Zealand: implications for its potential. Proc. 4th New Zealand Geothermal Workshop. Hedenquist J.W. (1983) Characteristics of Broadlands-Ohaaki water chemistry and changes subsequent to initial production. Proc. 5th New Zealand Geothermal Workshop. p151-156. Hedenquist J.W. and Giggenbach W.F. (1987) Geochemistry In: Allis R.G. (compiler) (1987) Geophysical and geochemical investigations of the Horohoro geothermal prospect. Geophysics Division, D.S.I.R. Report No: 213. Hochstein M. and Bromley C.J. (1979) Resistivity structure of the Tongariro geothermal system. Proc. 1st New Zealand Geothermal Workshop. 1979. Lawless J.V. and Lovelock B.G. (2001) New Zealand’s Geothermal Resource. Paper presented to the 2001 NZGA annual meeting. Luketina K (2001) Reserves of Geothremal Energy in the Waikato. Unpublished File Note No: 47 04 05. September 19, 2001 Lynne G.W. (1983) Multispectral infra-red mapping of the Rotokawa geothermal field, Auckland University Geothermal Institute Report 83:11.

AP00512.0:EWDOCS-#788454-V2-RESOURCE_CAPACITY_ESTIMATES_FOR_HIGH-TEMPERATURE_GEOTHERMAL_SYSTEMS_IN_THE_WAIKATO_REGION.DOC PAGE 47
Mahon W.A.J. (1966) A chemical survey of the Opaheke hot springs. CD 118/12 - WAJM/32. unpublished D.S.I.R. Chemistry Division report. Mongillo M.A. and Clelland (1984) Concise Listing of Information on the Thermal Areas of New Zealand. D.S.I.R. Geothermal Report No. 9. Risk G.F. (1985) Resistivity and magnetic investigations. In: Mongillo M.A. (compiler), Rotokawa geothermal field: a preliminary report of the scientific investigations. Unpublished D.S.I.R. report. Risk G.F., Caldwell T.G., Bennie S.L., Severne C.M. and Bibby H.M. (1998) Recent resistivity measurements at okaanu-Waihi geothermal field. Proc. 20th New Zealand Geothermal Workshop. p 291-296. Risk G.F., Bennie S.L. and Graham D.J. (1994) Resistivity resurvey of the southern Tauhara geothermal field. Proc. 16th New Zealand Geothermal Workshop. Risk G.F., Caldwell T.G. and Bibby H.M. (1994) Deep resistivity surveys in the Waiotapu-Waikite-Reporoa region, New Zealand. Geothermics Special Issue. Vol. 23, No. 5/6. Robinson B.W. and Sheppard D.S. (1986) A chemical and isotopic study of the Tokaanu-Waihi geothermal area, New Zealand. Journal of Volcanology and Geothermal Research. 27 135-151. Severne C.M. (1999) Recent geophysical and geochemical studies from the Tokaanu-Waihi hydrothermal system (Taupo Volcanic Zone, New Zealand). Proc. 24th Workshop on Geothermal Reservoir Engineering. Stanford University, Stanford, California. Severne C.M. (1999b) The Tokaanu-Waihi Geothermal System. PhD thesis. University of Auckland. Simmons S.F., Stewart M.K., Robinson B.W. and Glover R.B. (1994) The chemical and isotopic compositions of thermal water at Waimangu, New Zealand. Geothermics Vol. 23, No. 5/6. 539-553. Soengkono S. (1999) Te Kopia geothermal system (New Zealand) – the relationship between its structure and extent. Geothermics 28, 767-784. Stagpoole V.M. and Bibby H.M. (1998) Electrical resistivity map of the Taupo Volcanic Zone, New Zealand; nominal array spacing 1000m, 1:250 000, version 1.0. Institute of Geological and Nuclear Sciences geophysical map 12. Institute of Geological and Nuclear Sciences Limited, Lower Hutt, New Zealand Walsh, F.D., Hochstein, M.P., and Bromley, C.J., 1998: The Tongariro geothermal system (NZ): Review of geophysical data in Proceedings of the 20th Geothermal Workshop. Geothermal Institute, University of Auckland. 317 - 324 Whiteford P.C., Caldwell T.G. and Bibby H.M. (1994) Examination of heat flow and resistivity values at the boundaries of the geothermal system beneath Lake Taupo,

AP00512.0:EWDOCS-#788454-V2-RESOURCE_CAPACITY_ESTIMATES_FOR_HIGH-TEMPERATURE_GEOTHERMAL_SYSTEMS_IN_THE_WAIKATO_REGION.DOC PAGE 48
North Island. New Zealand. Proc. 16th New Zealand Geothermal Workshop. p157-162.