examining racial disparities in criminal case...
TRANSCRIPT

Examining Racial Disparities in Criminal Case Outcomes among Indigent Defendants in San Francisco
SUMMARY REPORT
Emily Owens, PhD (Univ. of California, Irvine School of Social Ecology)
Erin M. Kerrison, PhD (Univ. of California, Berkeley School of Social Welfare)
Bernardo Santos Da Silveira, PhD (Wash. Univ. in St. Louis Olin Business School)
May 2017

Contents
Introduction ................................................................................................................................... 1
Study Overview .............................................................................................................................. 1
Summary of Key Findings .............................................................................................................. 2
Overall Case Outcomes by Race .................................................................................................... 3
Factors Contributing to Racial Disparities in Criminal Case Outcomes ....................................... 4
Criminal History, Poverty, and Police Activity by Neighborhood ............................................. 5
Pre- and Post-filing Case Decisions. ......................................................................................... 6
Case Adjudication: How Charges Evolve and Are Bargained ................................................... 9
Case Adjudication: Convictions and Sentences ....................................................................... 16
Length of Time to Case Resolution. ........................................................................................ 20
Sentencing/Length of Incarceration ........................................................................................ 22
Public Defender Resource Constraints .................................................................................... 24
Conclusions and Questions for Policy Makers ............................................................................ 25

1
Introduction People of color are overrepresented in California correctional facilities. According to a recent report from the Public Policy Institute of California, approximately 4.4% of the Black male population of California is incarcerated in a California prison.1 Black men in California are incarcerated at 100 times the rate of Asian men, ten times the rate of White men, and five times the rate of Latino men. It is important for criminal justice practitioners, policymakers, and scholars to understand these disparities and their causes. Potential explanations include variations in socioeconomic status, access to employment and education opportunities, patterns in policing, and differences in charging and sentencing decisions made by prosecutors and judges. Most studies of racial disparities in the justice system have focused on final case outcomes, such as conviction, incarceration, and sentence length. While important, these data points do not provide sufficient insight into the many points in the criminal justice process where cases against Black, White, and Latinx defendants could diverge. To fill this knowledge gap, the Quattrone Center for the Fair Administration of Justice (“Quattrone Center”), in collaboration with the San Francisco Public Defender (“Public Defender”), reviewed the charging and case adjudication process for Public Defender clients in San Francisco, so that differences in the processing of and final outcomes for Black, White, and Latinx defendants could be seen, and to explain the source of any differences that exist.
Study Overview We reviewed 10,753 complete case records, consisting of cases between 2011 and 2014, from the San Francisco Public Defender’s Office. These data were stored in the Public Defender’s GIDEON case management system, which draws from data maintained by the San Francisco County Superior Court’s larger case management system database. Unlike previous studies that rely solely on arrest and conviction data, these records cover the entire pretrial process, providing a richer portrait of the experiences of defendants in the criminal justice system. These data can help policymakers and stakeholders understand whether racial disparities exist in the outcomes of San Francisco criminal cases, including cases resolved by plea bargains, and how bargaining affects disparities in other areas of the criminal justice system, such as corrections.2 Where disparities were seen, we sought to understand them and to evaluate what changes could be made to ensure that similarly situated individuals receive equal and race-neutral treatment in the criminal justice system. Such information could assist the Public Defender, the San Francisco District Attorney, the San Francisco Police Department, and other criminal justice stakeholders to ensure equitable treatment of all San Franciscans.
1 Grattet, R. and Hayes, J., “Just the Facts: California’s Changing Prison Population,” April 2015, accessed May 1, 2017 at http://www.ppic.org/main/publication_show.asp?i=702. 2 Just under 59% of these cases resulted in a conviction, and the clear majority of all convictions - 91% - involved at least one guilty plea.

2
Summary of Key Findings Our analysis revealed that Black, White and Latinx indigent defendants in San Francisco have substantially different experiences during the criminal adjudication process. However, disparities by race/ethnicity could largely be explained by factors determined prior to the initiation of plea negotiations. In particular:
1. The raw data reveal Black/White and Latinx/White disparities across several metrics related to case processing and outcomes. a. Black defendants are held in pretrial custody longer than Whites. Black defendants are held in pretrial
custody for an average of 30 days, 62% longer than Whites.
b. Cases involving Black defendants take longer to resolve. It takes an average of 90 days to process a case for a Black defendant, but only 77.5 days to process a case for White defendants, a delay of 14%.
c. Defendants of color are convicted of more serious crimes than White defendants. Black defendants are convicted of 60% more felony charges than White defendants, and 10% fewer misdemeanors. Latinx defendants are convicted of a similar number of felonies to Whites, but 10% more misdemeanors.
d. Defendants of color receive longer sentences than White defendants. Custodial sentences received by Black defendants are, on average, 28% longer than those received by White defendants. While Latinx defendants receive comparable custodial sentences to White defendants, they receive probation sentences that are 55% longer than those received by White defendants.
2. Even though these disparities are occurring within the plea bargaining system, plea bargaining itself appears to neither contribute to the disparate outcomes, nor to reduce the disparities. Bargaining decisions by public defenders and prosecutors did not appear to increase the disparities that were inherited from the arrest process. There was no disparity seen in either the number of charges added by the DA’s Office to the booking charges, or the proportion of charges to which individuals plead guilty (across charge type and severity). At the same time, the more severe initial bookings tended to follow Black defendants through the process, resulting in a higher rate of felony convictions and longer sentences on average.
3. The majority of these disparities seem to be generated by two factors that pre-date the case adjudication process: a. People of color receive more serious charges at the initial booking stage, reflecting decisions made by
officers of the San Francisco Police Department; and

3
b. People of color have pre-existing racial differences reflected in their criminal record, based on previous encounters with the criminal justice system in San Francisco County. This criminal history has a “ripple effect” that impacts plea negotiations for subsequent charges, as police, prosecutors, and defense attorneys make plea bargain decisions based in part of the individual’s prior criminal history.
Overall Case Outcomes by Race Black, White and Latinx indigent defendants in San Francisco experience the criminal adjudication process differently, as shown in Table 1 below.
Table 1. Average Case Outcomes by Race
Notes: * indicates statistically significant difference from White, p < .05
White Black Latinx
Booking % diff. % diff. Number of Booked Charges 2.57 2.75* 7% 2.58 0%
Felonies 1.46 1.81* 24% 1.30* -11% Misdemeanors 0.96 0.80* -17% 1.12* 17%
Prosecutor Activity Number of Added Charges 0.95 0.91 -4% 1.01 6%
Felonies 0.34 0.43* 26% 0.32 -6% Misdemeanors 0.57 0.46* -19% 0.63 11%
Case Adjudication Guilty of any charge 56.7% 60.0%* 6% 59.2% 4% Number of Convicted Charges 0.695 0.739* 6% 0.721 4%
Felonies 0.186 0.299* 61% 0.178 -4% Misdemeanors 0.514 0.451* -12% 0.557* 8%
Sentence Length (in days, if convicted)
89.3 189.7* 112% 104.5 17%
Method of Resolution Plead guilty of any charge 53.5% 54.7% 2% 54.2% 1% Number of Plead Charges 0.647 0.665 3% 0.637 -2%
Case Processing Days from First to Last Court Event 77.5 90.3* 17% 80.9 4% Days in Pretrial Custody 18.8 30.4* 62% 20.5 9% Sample Size 3,831 4,749 2,173

4
Table 1 reports average outcomes for defendants of different races. These are simple comparisons that do not account for contributing factors other than race that may explain the observed overall disparities (e.g., criminal history). In general, White defendants fared better than minorities, although for some important outcomes the differences between Blacks, Latinx, and Whites were not statistically significant.
Factors Contributing to Racial Disparities in Criminal Case Outcomes We have taken two approaches to highlighting racial disparities in San Francisco’s criminal justice system. The first is to show “raw” or unadjusted overall differences in case outcomes across defendants of different races, as in Table 1 above. Such comparisons are useful, but can be oversimplified and misleading, as they may not show legally or socially relevant factors that differ across cases involving defendants of different races. Failing to account for such differences could lead to an inaccurate view of the role of race in the criminal justice system. Criminal history is an excellent example. In most jurisdictions, the sentencing scheme is structured to increase the penalty for criminal conduct if the defendant has prior criminal convictions. In such a system, observations that one racial group tends to receive longer sentences could be the result of biased treatment, but they could also simply reflect that the group receiving the longer sentences has more prior convictions, leading to the assignment of longer sentences. To properly measure racial disparity, then, one would ideally take two pools of otherwise similar defendants that differ only in race, and compare outcomes across such groups. Such an ideal comparison is not possible here, because no two cases are exactly the same. However, we can statistically adjust for a range of legally relevant contextual factors that might vary across defendants drawn from different racial backgrounds, in an effort to isolate race from other factors. Disparities that remain after accounting for other legally relevant race-neutral factors deserve further investigation. Accordingly, we performed a statistical analysis of the data that accounts for factors other than race that might explain disparities, and analyzed which characteristics are most important for explaining the existence of racial disparities.3
3 To examine this, we conducted a decomposition analysis, which calculated the portion of the unadjusted disparity that is explained by the various contextual factors considered in the analysis. For example, if the results indicated that the unadjusted Black/White disparity in added felonies was 20% - meaning Black defendants on average had 20% more felonies added to their case by prosecutors than White defendants - and 50% of this disparity can be explained by criminal history, then for Black and White defendants with identical criminal histories (rather than the more extensive criminal histories among Black defendants that is actually the case in these data), we would expect Black defendants to have only 10% more added felonies than White defendants.
These contextual factors are more likely to be identified in the decomposition analysis as substantial contributors to disparity if they vary appreciably across minority and White defendants and if, other things being equal, they tend to be more predictive of the outcome in question. It is also possible with such an analysis for a portion of the raw disparity to remain unexplained, meaning that contextual factors outside of those considered in the analysis may be driving the observed disparity.

5
Criminal History, Poverty, and Police Activity by Neighborhood.Table 2 illustrates the variance across White, Black, and Latinx defendants of several important factors that could contribute to or help explain the racial disparities set forth in Table 1 above. In addition to criminal history, whose importance is explained above, we examined the role of geography, in terms of socioeconomic levels in different neighborhoods that might lead to different types or levels of criminal behavior, as well as disparities that occur due to decisions made by police officers in so-called “high crime” versus “low crime” neighborhoods. To understand this, we examined court records that identified the exact location of each arrest, as well as the defendant’s home address. Several differences are worth noting:
1. The likelihood that an individual defendant has had previous contact with the criminal justice system is greater for Black than for White defendants, and greater in turn for White than for Latinx defendants. Blacks averaged almost twice the number of prior arrests and twice the number of prior convictions than whites.
2. Poverty rates in the defendant’s neighborhood of residency were higher for Blacks (15%) than for Latinx (11.5%) or whites (9%).
3. Police activity in the neighborhood of residence (which combines both crime rates and police presence) and arrest rates were higher for Blacks than for Whites and higher for Whites than for Latinx.
Table 2. Group Differences in Contextual Factors
Notes: * indicates statistically significant difference from White, p < .05. Incident and arrest rates are measured per 1000 residents.
White Black Latinx Defendant Characteristics % diff. % diff.
Transient 29.5% 18.8%* -36% 14.0%* -53% Female 15.9% 19.0%* 19% 16.4%* 3% Age at Arrest 36.27 36.86* 2% 33.51* -8% # Previous Arrests 7.85 13.08* 67% 4.88* -38% # Previous Convictions 1.59 2.97* 87% 1.13* -29%
Neighborhood of Residence % Adults w/ Limited English 3.5% 3.9%* 11% 5.4%* 54% % Adults w/ Some College 69.1% 60.2%* -13% 61.9%* -10% % Families in Poverty 8.9% 15.3%* 72% 11.5%* 29% Police Incident Rate 7,391 9,738 32% 5,749 -22% Warranted Arrest Rate 383 506 32% 299 -22% Gang-Related Incident Rate 179 234 31% 145 -19%

6
Neighborhood of Arrest Same as Home 13.4% 12.9%* -4% 14.6%* 9% % Black 7.0% 12.3%* 76% 8.1%* 16% % Hispanic 15.9% 18.2%* 14% 22.5%* 42% % of Housing Units Not Owner-Occupied
74.6% 75.3%* 1% 70.9%* -5%
Police Incident Rate (per 1,000 pop.)
82,176 111,466* 36% 58,503* -29%
Sample Size 3,831 4,749 2,173
Pre- and Post-filing Case Decisions.We also examined pre- and post-filing phases of the case adjudication process to understand their impact on the overall disparities shown in Table 1 above. We examined many interactions during the case adjudication process where similarly situated defendants could receive different treatment from the criminal justice system. Specifically, we analyzed the decisions of booking officers, prosecutors, public defenders, judges, and probation officers during pre- and post-filing phases “Pre-filing outcomes” are decisions made by booking officers and prosecutors, often before a client is assigned to the Public Defender’s Office. These initial decisions on what to charge establish the foundation of the criminal proceedings going forward and influence the defendant’s bargaining position during the adjudication phase. Pre-filing outcomes include:
• The total number of charges for which one is booked into a San Francisco jail;
• The number of felony and/or misdemeanor charges for which one is initially booked;
• The total severity4 of the charges for which one is booked, including:
o “Top” charge (i.e., most serious offense, as defined by the District Attorney’s severity scale);
o Total number of charges;
o Total severity of all charges; and
• The number, type, and severity of charges that are added to the initial booking by the District Attorney’s Office.
“Post-filing outcomes” include determinations of guilt or innocence for whatever number of charges has been brought. They reflect the ability of defendants, and/or the willingness of prosecutors, to modify the initial charges
4 This severity score is based on the California Attorney General’s ranking of criminal charges, which can be found here: https://oag.ca.gov/law/code-tables

7
based on individual defendant characteristics or circumstances. Figures 3 and 4 below display Black/White and Latinx/White disparities across four pre-filing outcome case measures: total booked charges, booked felonies, booked misdemeanors, and case severity. The “case severity” measure combines all booked charges into a single summary measure that considers both the number and seriousness of booked charges. For example, being booked for robbery is more serious than being booked for loitering, and being booked for three similarly serious counts is worse than being booked for one. The blue bars in the chart show the raw, or unadjusted disparity, while the orange bars show the measured disparity after statistically controlling for the contextual factors noted above using regression analysis. In other words, the orange bars show the expected difference in pre-filing outcomes for a Black or Latinx arrestee as compared to an individual who is similar in age, gender, residential and arrest neighborhood characteristics, and prior criminal history – but is White. Figure 3 shows that Blacks in our dataset are booked for 7% more crimes than Whites on a raw or unadjusted basis, while they are booked for 8% more crimes than Whites with similar age, gender, criminal history, and other characteristics.
Figure 3: Black/White Disparities in Pre-filing Outcomes
Note: * denotes a statistically significant Black/White difference
The blue bars show the raw, or unadjusted disparities between Blacks and Whites: Black defendants were booked on average for more charges overall than White defendants, including more felonies. They were booked for fewer misdemeanors than White defendants (suggesting greater severity in charging on average, even controlling for contextual factors). Black arrestees faced initial cases that were about 50% more severe than White arrestees in terms of number and severity of charges.5
5 Total severity on the California Attorney General’s scale, the severity scale used in this analysis, roughly correlates to the length of a typical sentence. Thus, a 50% increase in total severity score can be thought of as roughly equivalent to a 50% increase in length of a typical sentence.
7%*
24%*
-17%*
48%*
8%*
22%*
-11%*
46%*
-30% -10% 10% 30% 50% 70%
Totalbookedcharges
Totalbookedfelonies
Totalbookedmisdemeanors
Severityofbookedoffenses
Rawdisparity Disparityaftercontrollingforcontextualfactors
8
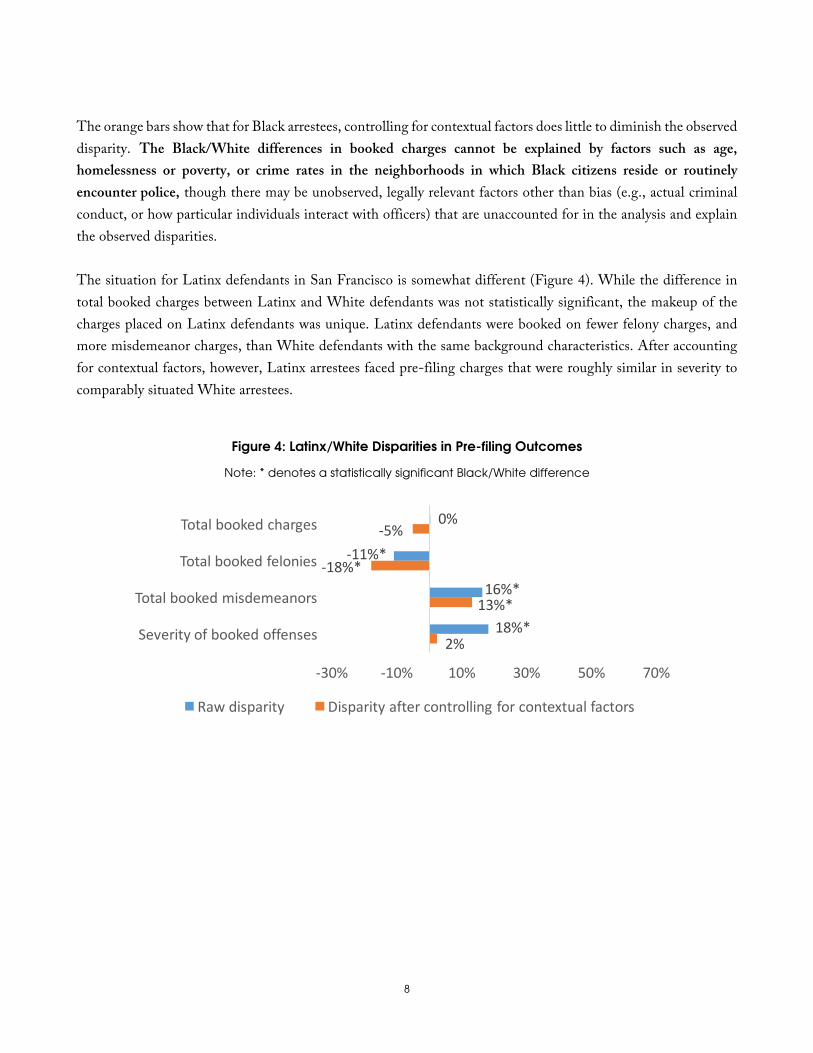
The orange bars show that for Black arrestees, controlling for contextual factors does little to diminish the observed disparity. The Black/White differences in booked charges cannot be explained by factors such as age, homelessness or poverty, or crime rates in the neighborhoods in which Black citizens reside or routinely encounter police, though there may be unobserved, legally relevant factors other than bias (e.g., actual criminal conduct, or how particular individuals interact with officers) that are unaccounted for in the analysis and explain the observed disparities. The situation for Latinx defendants in San Francisco is somewhat different (Figure 4). While the difference in total booked charges between Latinx and White defendants was not statistically significant, the makeup of the charges placed on Latinx defendants was unique. Latinx defendants were booked on fewer felony charges, and more misdemeanor charges, than White defendants with the same background characteristics. After accounting for contextual factors, however, Latinx arrestees faced pre-filing charges that were roughly similar in severity to comparably situated White arrestees.
Figure 4: Latinx/White Disparities in Pre-filing Outcomes
Note: * denotes a statistically significant Black/White difference
0%
-11%*
16%*
18%*
-5%
-18%*
13%*
2%
-30% -10% 10% 30% 50% 70%
Totalbookedcharges
Totalbookedfelonies
Totalbookedmisdemeanors
Severityofbookedoffenses
Rawdisparity Disparityaftercontrollingforcontextualfactors

9
Case Adjudication: How Charges Evolve and Are Bargained
The detail available in the Public Defender’s case files enabled us to examine how prosecutors and defense attorneys actually bargain to reach final case outcomes. First, we looked at plea bargaining in a traditional sense – whether defendants pled guilty to any charges, and the number of charges to which they pled guilty (or nolo contendere). The rate at which Black, Latinx, and White defendants pled guilty to any charge was similar, and we observed no statistically significant differences in the number of charges discharged or dismissed among Black and Latinx defendants. Figures 5 and 6 depict disparities between Blacks and Whites, and between Latinx and Whites, respectively, in the application of prosecutors’ charging discretion. Put differently, they depict the decision of prosecutors to modify the original charges booked by the police, based on the prosecutor’s review of the case record and what charges are possible based on the facts alleged. We looked at the probability that a felony would be downgraded to a misdemeanor, the probability that a misdemeanor would be refiled as a felony, and the number of times the District Attorney’s office refiled a charge in court documents for any reason. Felony charges filed against White defendants were more likely to be downgraded (31%) than felony charges filed against Black (23%) and Latinx (29%) defendants. However, these differences across groups were not statistically significant after adjusting for contextual factors. Most of the Black/White disparity can be explained by combining the variation in the criminal history of Black defendants (explaining 26% of the disparity) and the charges for which they were booked (explaining 48%). The disparity in outcomes for Latinx and White defendants also appears to be driven largely by booking charges (explaining 70% of the disparity). Latinx defendants were much less likely to have their misdemeanors upgraded to felony convictions, doing so at only 2.3 percent of the rate that misdemeanors for White defendants were upgraded to felonies for White defendants. On the other hand, since felony convictions for Latinx defendants are more likely to raise immigration or citizenship-related concerns than those confronted by White and Black defendants in San Francisco, it is a potentially important source of inequality in the justice system. Very little of this difference can be explained using the study’s control variables; even the variation in booked charges can explain only 21% of the Latinx-White gap. Again, the blue bars depict the raw or unadjusted disparities shown above in Table 1, while the orange bars depict disparities that persist after adjusting for contextual factors. For these comparisons, in addition to accounting for the demographic and neighborhood characteristics mentioned previously, the adjusted comparisons also account for racial differences that occurred at the booking stage. Thus, the figures compare added charges for two defendants with similar demographics, criminal histories, etc. and booking charges who differ only in race.

10
Figure 5: Black/White Disparities in Prosecutor Charging
Note: * denotes a statistically significant Black/White difference.
-4%
26%*
-20%*
21%*
-25%*
22%
-8%
-7%
-8%
-13%
-6%
-21%
-30% -20% -10% 0% 10% 20% 30%
Addedcharges
Addedfelonies
Addedmisdemeanors
Addedseverity
Feloniestomisdemeanors
Misdemeanorstofelonies
Rawdisparity Disparityaftercontrollingforcontextualfactors
While the raw or unadjusted data shows a disparity in the number and severity of felonies charged against Blacks versus whites, when we adjust for the various contextual factors, we see no statistically significant differences in the number or severity of charges added by prosecutors for either Black or Latinx as compared to Whites. This suggests that the discretion of the booking (police) officer is more impactful than that of the district attorney in terms of the disparities in the number and seriousness of charges filed. In fact, we found no evidence that district attorneys file more or fewer charges against Black or Latinx defendants than they file against Whites. While it does appear that charges added by the DA against Black defendants were more likely to be felonies and less likely to be misdemeanors; these differences disappeared after accounting for contextual factors (including booking charges), suggesting that race was not a contributing factor to the decision. Similarly, DAs may have added more misdemeanors and more severe charges to Latinx defendants after booking, but these differences are not statistically significant. For both groups, once the differences in criminal background (including type of charges booked for) were accounted for, the overall disparity was explained.

11
Figure 6: Latinx/White Disparities in Prosecutor Charging
Note: * denotes a statistically significant Latinx/White difference
6%
-8%
11%
21%
-7%
-38%*
1%
-4%
5%
2%
0%
-34%*
-50% -40% -30% -20% -10% 0% 10% 20% 30%
Addedcharges
Addedfelonies
Addedmisdemeanors
Addedseverity
FeloniestoMisdemeanors
MisdemeanorstoFelonies
Rawdisparity Disparityaftercontrollingforcontextualfactors
The additional felonies that are added by the District Attorney’s Office to the cases of Black defendants can be explained by differences in police booking decisions. There appear to be certain booked charges made by the police that are more likely to cause an Assistant District Attorney to add further charges. One hypothetical example of this could be that an aggravated assault in which a gun was displayed might be more likely to have an illegal gun possession charge added by the DA.

12
Figure 7. What Affects the Black/White Disparity in Charges Added by Prosecutor?
Recall that in Table 1, we showed that prosecutors add 26% more felonies to cases with Black defendants than to cases with White defendants, and they add 23% fewer misdemeanors to cases with Black defendants. Figures 7 and 8 report which of various contextual factors best explain these charge disparities, with blue bars showing added felonies and orange bars showing misdemeanors. A value above 0% shows that the contextual factor reduces the minority/White disparity, while a negative value shows an increased disparity.
0%
4%
0%
-3%
18%
10%
1%
130%
1%
2%
3%
1%
1%
-1%
14%
26%
77%
2%
-20% 0% 20% 40% 60% 80% 100%120%140%
IndividualDemographics
Day,Month,andWeekofArrest
PoliceActivityatHome
PoliceActivitywhereArrested
CharacteristcsofHome
ChacteristicsofArrestLocation
CriminalRecord
Bookedcharges
Attorneyload
AddedMisdemeanors AddedFelonies

13
Figure 8. What Affects the Latinx/White Disparity in Charges Added by Prosecutor?
3%
9%
0%
-2%
-1%
16%
-6%
72%
0%
14%
-11%
4%
-5%
-14%
-32%
40%
56%
-4%
-40% -20% 0% 20% 40% 60% 80%
IndividualDemographics
Day,Month,andWeekofArrest
PoliceActivityatHome
PoliceActivitywhereArrested
CharacteristcsofHome
ChacteristicsofArrestLocation
CriminalRecord
Bookedcharges
Attorneyload
Addedmisdemeanors Addedfelonies
In this decomposition analysis, booking decisions accounted for 130% of the observed raw Black/White disparity in added felonies, more than enough to explain the entire discrepancy.6 Both criminal history and booking charges play a role in explaining raw differences in added charge severity, with criminal history accounting for 26% of the Black/White disparity and 40% of the Latinx/White disparity, and booking charges accounting for 18% of the Black/White disparity and 39% of the Latinx/White disparity. However, for both groups, a substantial fraction of the disparity in added charge severity remains unexplained.
6 In other words, if Blacks were booked for the same crimes as Whites, and all other factors were equal, the Blacks would have fewer additional felonies added by the prosecutor than Whites by a factor of 30%.
14
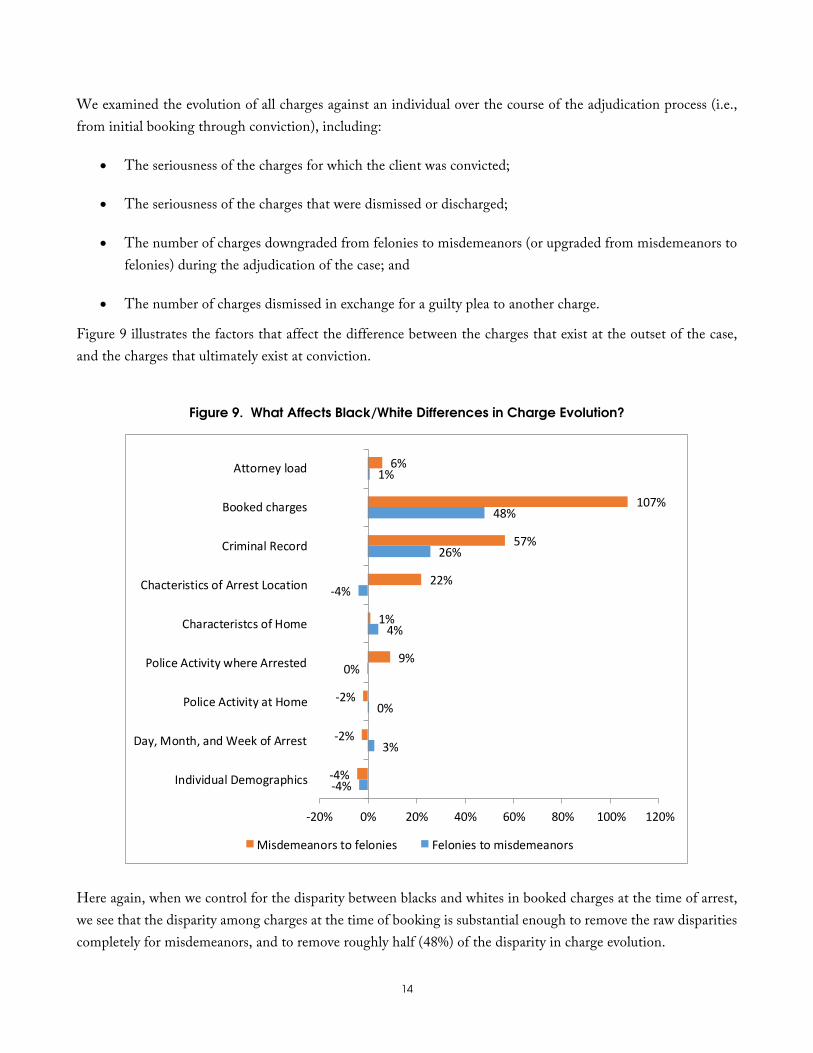
We examined the evolution of all charges against an individual over the course of the adjudication process (i.e., from initial booking through conviction), including:
• The seriousness of the charges for which the client was convicted;
• The seriousness of the charges that were dismissed or discharged;
• The number of charges downgraded from felonies to misdemeanors (or upgraded from misdemeanors to felonies) during the adjudication of the case; and
• The number of charges dismissed in exchange for a guilty plea to another charge.
Figure 9 illustrates the factors that affect the difference between the charges that exist at the outset of the case, and the charges that ultimately exist at conviction.
Figure 9. What Affects Black/White Differences in Charge Evolution?
-4%
-2%
-2%
9%
1%
22%
57%
107%
6%
-4%
3%
0%
0%
4%
-4%
26%
48%
1%
-20% 0% 20% 40% 60% 80% 100% 120%
IndividualDemographics
Day,Month,andWeekofArrest
PoliceActivityatHome
PoliceActivitywhereArrested
CharacteristcsofHome
ChacteristicsofArrestLocation
CriminalRecord
Bookedcharges
Attorneyload
Misdemeanorstofelonies Feloniestomisdemeanors
Here again, when we control for the disparity between blacks and whites in booked charges at the time of arrest, we see that the disparity among charges at the time of booking is substantial enough to remove the raw disparities completely for misdemeanors, and to remove roughly half (48%) of the disparity in charge evolution.

15
In contrast to the situation with Blacks, however, it appears that the evolution of charges in cases involving Latinx defendants may act in the defendants’ favor. For Latinx defendants, the contributing factors are similar but differently weighted, as seen in Figure 10. Booking charges continue to be the largest factor explaining the disparities between Latinx and White defendants in the evolution of charges. Controlling for booking charges accounts for 70% of the disparity between Latinx and whites in terms of their booked misdemeanor charges, and 22% of the disparity in the evolution of felony charges during the adjudication period. Surprisingly, though, we see that the defendants’ criminal history adds to the disparity in misdemeanors by 24%. Remember that a negative result in this chart means that the Latinx defendants, whose charges are more likely to be misdemeanors, are increasingly evolving from felony charges to misdemeanor charges as their cases evolve. Thus, it appears that police and prosecutors are more likely to agree to a misdemeanor charge for Latinx than whites.
Figure 10. What Affects Latinx/White Differences in Charge Evolution?
-6%
-5%
3%
-7%
5%
-10%
13%
22%
-2%
15%
16%
1%
12%
15%
-17%
-24%
70%
13%
-40% -20% 0% 20% 40% 60% 80%
IndividualDemographics
Day,Month,andWeekofArrest
PoliceActivityatHome
PoliceActivitywhereArrested
CharacteristcsofHome
ChacteristicsofArrestLocation
CriminalRecord
Bookedcharges
Attorneyload
MisdemeanorstoFelonies FeloniestoMisdemeanors

16
Case Adjudication: Convictions and Sentences Because criminal cases in San Francisco are primarily resolved by plea bargain rather than bench or jury trials, the study also examined the number of charges to which defendants pled guilty (or nolo contendere). Previous studies have simply compared cases where there is, or is not, a plea bargain;7 this focus ignores the substantial variation in how many and which types of plea deals are made.8 Our research tracked each individual client of the San Francisco Public Defender from initial booking through case disposition, and accounted for each defendant’s local criminal history, enabling the researchers to consider several pieces of information available to prosecutors, defenders, and judges when they make their decisions. As a result, we can more precisely identify disparities that might arise from the menu of charges for which someone is booked, and their full criminal history in San Francisco County.
Figure 11. Black/White Disparities in Case Adjudication
Note: * denotes a statistically significant Black/White difference.
7 See, e.g., e.g. Bushway, S. D., Redlich, A. D. and Norris, R. J. (2014), An Explicit Test of Plea Bargaining in the “Shadow of the Trial”. Criminology, 52: 723–754 8 For example, the Bureau of Justice Statistic’s State Court Processing Statistics only includes information on the most serious charge filed.
6%*
6%*
60%*
-12%*
49%*
28%*
40%*
-5%-29%*
3%
2%
12%
-1%
7%
-1%
-5%
13%
8%
-30% -10% 10% 30% 50% 70%
Convictionrate
Numberofconvictedcharges
Convictedfelonycharges
Convictedmisdemeanorcharges
Convictedchargeseverity
Sentence(days),alldefendants
Sentence(days)convictedonly
Probation(days),alldefendants
Probation(days),convictedonly
Rawdisparity Disparityaftercontrollingforcontextualfactors

17
Figure 12: Latinx/White Disparities in Case Adjudication
Note: * denotes a statistically significant Latinx/White difference.
Tables 13 and 14 evaluate racial disparities in convictions. In general, Black defendants are convicted of more charges than White defendants. For Black defendants, prior contact with the criminal justice system has a ripple effect that is seen in the severity of punishment for future contact. More specifically, differences in the number of times that Black defendants were previously arrested, convicted, and incarcerated explain almost all of the difference in conviction rates among Black and White defendants. The fact that booking charges have such a substantial impact (see Figure 14 below) suggests that Latinx defendants are being booked for charges for which a conviction tends to be more certain (e.g., littering, which requires a simple observation, vs. assault with intent to injury, which requires a proof of the defendant’s state of mind). Differences in education, employment, and facility with the English language also explain a small amount of the disparity in conviction rates for Black and Latinx defendants, compared to White defendants. When the study looked at how many different charges people are convicted of, booking charges appeared to drive convictions for Latinx defendants, as distinguished from Black defendants, where the driver appears to be previous convictions.
4%
4%
-4%
8%*
27%*
-15%*
-27%*
55%*
68%*
0%
0%
2%
1%
9%
-4%
-12%
7%
23%*
-30% -10% 10% 30% 50% 70%
Convictionrate
Numberofconvictedcharges
Convictedfelonycharges
Convictedmisdemeanorcharges
Convictedchargeseverity
Sentence(days),alldefendants
Sentence(days)convictedonly
Probation(days),alldefendants
Probation(days),convictedonly
Rawdisparity Disparityaftercontrollingforcontextualfactors

18
The unadjusted comparisons reveal that Black defendants were convicted of more felonies and fewer misdemeanors than White defendants, and were convicted of more serious charges overall than White defendants. Latinx defendants were convicted of more misdemeanors, and more serious charges overall, than White defendants. All of these disparities can be explained by differences in demographics, criminal history, booking decisions, and public defender caseloads.
Figure 13. What Affects Black/White Differences in Convictions?
-6%
2%
0%
-1%
8%
-1%
33%
46%
-1%
12%
3%
0%
-3%
7%
3%
1%
72%
-7%
-20%-10% 0% 10% 20% 30% 40% 50% 60% 70% 80%
IndividualDemographics
Day,Month,andWeekofArrest
PoliceActivityatHome
PoliceActivitywhereArrested
CharacteristcsofHome
ChacteristicsofArrestLocation
CriminalRecord
Bookedcharges
Attorneyload
ConvictedMisdemeanors ConvictedFelonies

19
Figure 14. What Affects Latinx/White Differences in Convictions?
-24%
-14%
-1%
-4%
-13%
-9%
-14%
154%
5%
-1%
-59%
5%
-17%
-73%
34%
133%
121%
5%
-100% -50% 0% 50% 100% 150% 200%
IndividualDemographics
Day,Month,andWeekofArrest
PoliceActivityatHome
PoliceActivitywhereArrested
CharacteristcsofHome
ChacteristicsofArrestLocation
CriminalRecord
Bookedcharges
Attorneyload
ConvictedMisdemeanors ConvictedFelonies
Decisions made at booking explain almost half (46%) of the Black-White disparity in the number of felony convictions that Black defendants faced. Criminal history also plays an important role, explaining a third of the disparity. Thus, roughly 20% of the increased number of felony convictions against Blacks remains unexplained or is explained by other factors. Differences in booking charges are also the primary explanation for why Black defendants were convicted of fewer misdemeanors, and why Latinx defendants were convicted of more misdemeanors. To put these differences in perspective, note that, on average, White defendants in our data set were convicted of 0.19 felony charges on average, while Black defendants were convicted of 0.30 felony charges, a roughly 60% increase. Based on these estimates, if White defendants were booked for the same offenses as similarly situated Black defendants, shared their criminal history, and otherwise were identical on average to Black defendants in contextual factors other than

20
race, White defendants would on average be convicted of 0.28, rather than 0.19, felonies, reducing the disparity with Blacks to 7%. Latinx defendants were convicted of 0.56 misdemeanors, which is 0.01 more misdemeanors than would be expected among White defendants with the same criminal records, booking charges, and other contextual factors as the Latinx defendants (other than ethnicity). Thus, while the unadjusted differences across racial groups are large, once pre-adjudication contextual factors are adjusted for, the racial gaps become smaller and in most cases no longer statistically significant.Length of Time to Case Resolution.How cases are processed, and in particular whether defendants are released on bail, has a direct influence on outcomes. Longer cases can benefit defendants, as evidence and witness cooperation deteriorate over time, making it harder for the state to prove their case. If clients are in custody, however, there is a direct cost to this extra time, particularly for indigent defendants charged with low-level crimes. In addition to the physical and emotional toll of incarceration, many defendants operate with little or no economic safety net, and even brief periods of incarceration can have widespread collateral consequences including loss of employment, loss of housing, loss of custody and/or child support, and loss of other public benefits. In some instances, even the time burden of appearing at court to handle their cases may disrupt work or other obligations for indigent individuals not in custody, causing them to plead guilty to charges simply to have them resolved and in the past. We evaluated the time taken to process defendants of different races in the San Francisco County criminal justice system, including:
• Days passed between arrest and adjudication;
• Days a client was in custody;
• Number of times charges were refiled; and
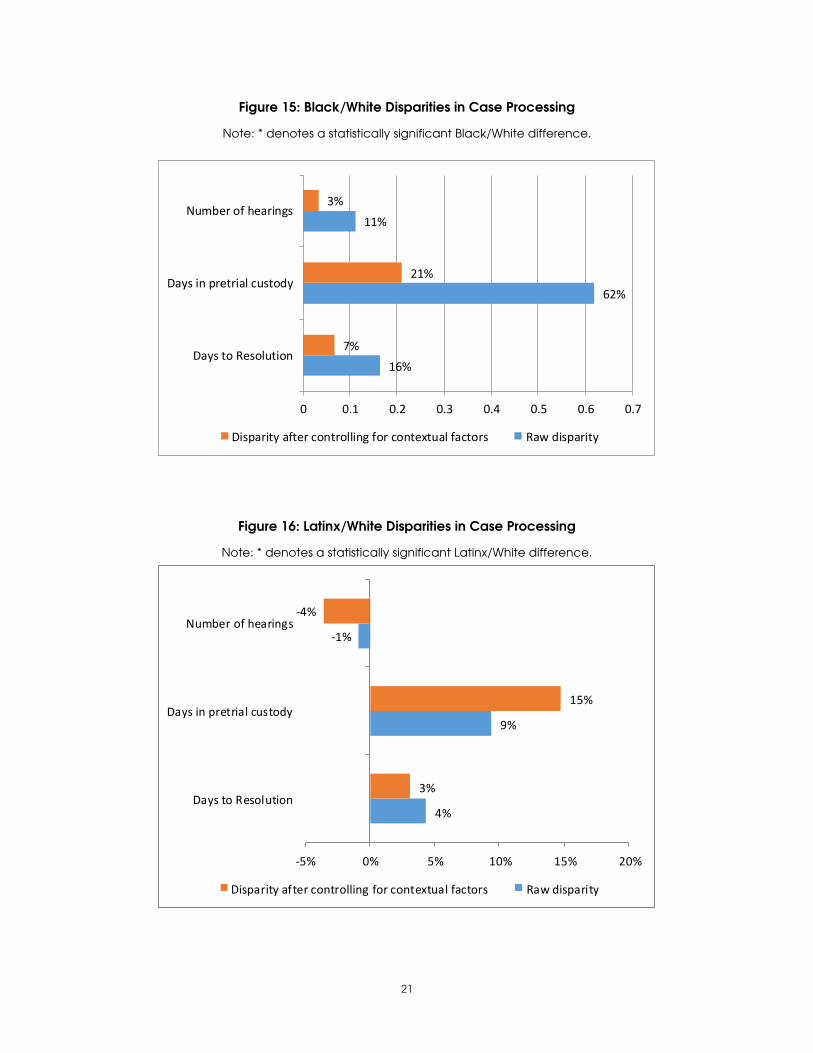
• Court events9 that took place. White, Black and Latinx defendants respectively spent 19, 30, and 21 calendar days detained over the course of their case. That means Black defendants were in custody for 11.6 additional days relative to White defendants, which is statistically and substantively significant (Table 1). This disparity falls by 7 days to 4 days after adjusting for contextual factors, but those remaining four days are still statistically meaningful (Figure 15). Black/White disparities in days in custody may be explained in large part by criminal record (accounting for 25% of the disparity) and booking charges (accounting for 42% of the disparity). These data suggest that the main driver of the increased length of time to resolution of cases involving Black defendants is their (on average) more extensive criminal history.
9 A “court event” as used in this paper means a hearing or other procedure that caused the defendant or the defendant’s counsel to appear in court.
21
Figure 15: Black/White Disparities in Case Processing
Note: * denotes a statistically significant Black/White difference.
16%
62%
11%
7%
21%
3%
0 0.1 0.2 0.3 0.4 0.5 0.6 0.7
DaystoResolution
Daysinpretrialcustody
Numberofhearings
Disparityaftercontrollingforcontextualfactors Rawdisparity
Figure 16: Latinx/White Disparities in Case Processing
Note: * denotes a statistically significant Latinx/White difference.
4%
9%
-1%
3%
15%
-4%
-5% 0% 5% 10% 15% 20%
DaystoResolution
Daysinpretrialcustody
Numberofhearings
Disparityaftercontrollingforcontextualfactors Rawdisparity

22
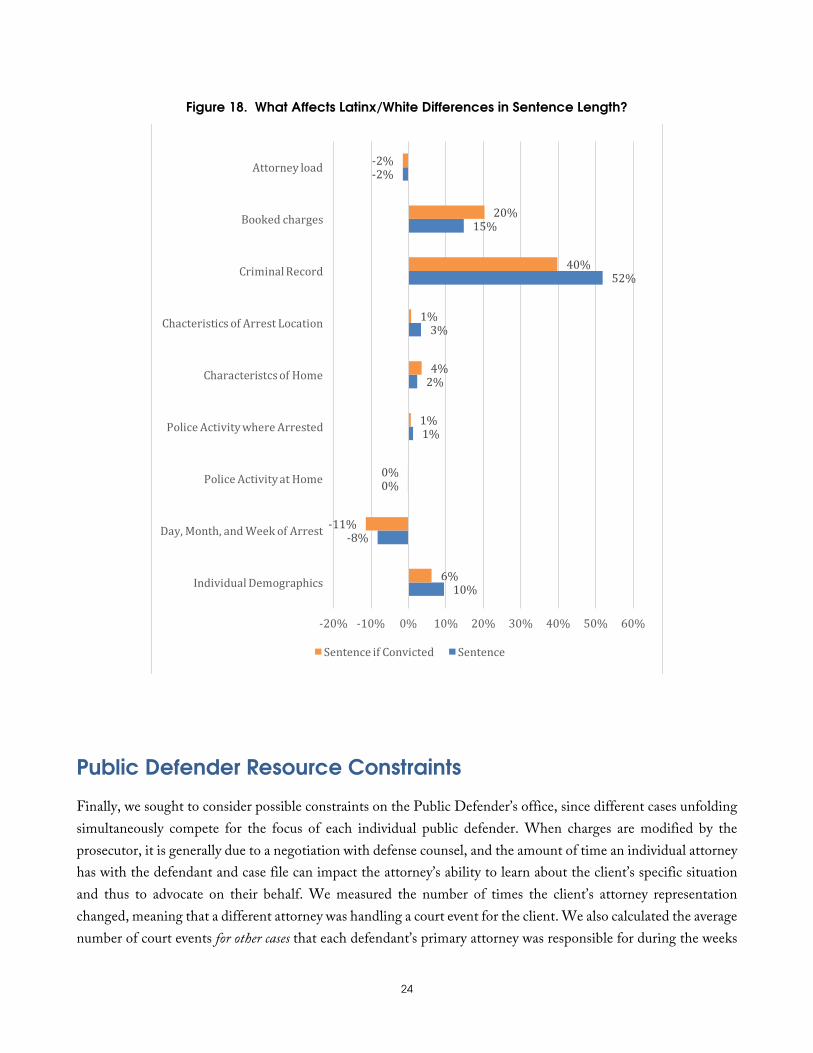
An additional measurement that reflects the complexity of the case is the number of court events associated with that case. Black defendants had a statistically significant 1.7 additional court events relative to White defendants (Table 1). As was the case for pretrial custody days, this disparity appears to be driven by criminal history (explaining 24% of the disparity) and charges filed at booking (explaining 45% of the disparity). For Latinx defendants, there were no statistically significant differences in days to resolution or custody days relative to White defendants. Latinx defendants did have roughly 10% fewer hearings than White defendants, a statistically significant difference. The measured gap in hearings remains virtually unchanged after accounting for the contextual factors in the model, so this disparity remains largely unexplained. One speculated possibility is that the need to accommodate the language needs of some Latinx defendants led to different patterns of scheduling of hearings. Sentencing/Length of Incarceration.For those who were convicted, sentence length (in days) was measured. Without adjusting for contextual factors (but limiting the influence of outlier sentences), Across all defendants (i.e., those convicted of crimes and those who ultimately were not), Blacks received sentences that were on average 27.9% longer than Whites, and Latinx defendants received sentences that were 15% shorter than White defendants. Among the subset of Black defendants that were convicted of crimes, sentences for Black defendants were 40% longer than those of White defendants, while sentences for Latinx defendants were 27% shorter than for White defendants. Again, however, as shown in Figure 15 below, these unadjusted disparities almost completely disappear when we account for contextual factors. The main source of the disparities in length of incarceration is criminal history and, in particular, previous incarcerations, which account for 70-90% of the raw Black/White disparity and 40-50% of the Latinx/White disparity. Booking decisions remain an important secondary explanation for the observed Black-White and Latinx-White disparities. While Latinx defendants receive shorter terms of incarceration than White defendants, they receive longer sentences of probation. When comparing Latinx defendants who were convicted to their White counterparts, Latinx defendants received probation sentences that were 23.9% longer, for reasons that could not be identified.

23
Figure 17. What Affects Black/White Differences in Sentence Length?
-17%
2%
0%
0%
2%
7%
86%
24%
2%
-16%
4%
0%
0%
1%
8%
78%
39%
1%
-40.% -20.% 0.% 20.% 40.% 60.% 80.% 100.%
IndividualDemographics
Day,Month,andWeekofArrest
PoliceActivityatHome
PoliceActivitywhereArrested
CharacteristcsofHome
ChacteristicsofArrestLocation
CriminalRecord
Bookedcharges
Attorneyload
SentenceifConvicted Sentence
24
Figure 18. What Affects Latinx/White Differences in Sentence Length?
Public Defender Resource Constraints Finally, we sought to consider possible constraints on the Public Defender’s office, since different cases unfolding simultaneously compete for the focus of each individual public defender. When charges are modified by the prosecutor, it is generally due to a negotiation with defense counsel, and the amount of time an individual attorney has with the defendant and case file can impact the attorney’s ability to learn about the client’s specific situation and thus to advocate on their behalf. We measured the number of times the client’s attorney representation changed, meaning that a different attorney was handling a court event for the client. We also calculated the average number of court events for other cases that each defendant’s primary attorney was responsible for during the weeks
10%
-8%
0%
1%
2%
3%
52%
15%
-2%
6%
-11%
0%
1%
4%
1%
40%
20%
-2%
-20% -10% 0% 10% 20% 30% 40% 50% 60%
IndividualDemographics
Day,Month,andWeekofArrest
PoliceActivityatHome
PoliceActivitywhereArrested
CharacteristcsofHome
ChacteristicsofArrestLocation
CriminalRecord
Bookedcharges
Attorneyload
SentenceifConvicted Sentence

25
that court events for the defendant’s case took place. The average number of other court events for public defenders was 26, and was slightly lower (25) for black defendants than white defendants (27), a difference that is statistically significant. This is consistent with the fact that black defendants are more likely to be facing felony charges, and our understanding is that the public defender’s office makes efforts to assign fewer cases to attorneys handling felonies. Ultimately, caseload differences across public defenders were not a major explanation of racial disparities in case outcomes, accounting for only 5% (or less) of the unadjusted disparity for all of the prosecutor activity outcomes listed above in Table 1 and Figures 7-8. This suggests that increasing the number of public defenders representing this group of defendants is not likely to resolve the different outcomes seen among similarly situated Black, Latinx, and White defendants.
Conclusions and Questions for Policy Makers Disparities in the criminal justice system have an impact that extends beyond the four corners of a criminal charge or conviction. They create and perpetuate inequalities in poverty, family formation, education, and child development. Understanding why Black and Latinx defendants experience disproportionately worse criminal justice outcomes can help policy makers and practitioners mitigate the disparities: by focusing on specific contributing factors associated with race-based negative outcomes, we reduce the likelihood that race is a cause of disparate treatment in our system of justice. Our analysis of several years of cases from the San Francisco Public Defender’s Office suggests that “equal justice for all” may be elusive in San Francisco for people of color. We observed systematic differences in outcomes for Black, Latinx, and White defendants across almost all metrics evaluated. The main factor explaining these disparate outcomes appears to be racially disparate booking charges imposed by the police, which remain in the system through the downstream case adjudication process managed by prosecutors, defense attorneys, and judges. Moreover, the influence of these booking decisions is actually larger than what is shown by our figures, because today’s booking decisions become tomorrow’s criminal record, and a defendant’s criminal history was the second most important contributing factor in both the length of time a defendant would spend in custody during the adjudication process, and the length of sentence for those convicted of crimes. Booking decisions influence downstream decisions made by district attorneys, public defenders, and judges. District attorneys and public defenders are making what appear to be race-neutral decisions in response to the charges brought to them by the police – but police bring more severe charges against Blacks and Latinx relative to Whites, and that then persists throughout the case adjudication process.

26
If we desire a criminal justice system in which similarly situated defendants experience similar outcomes, it may not be sufficient for defense attorneys, prosecutors, and judges to be merely race-blind participants themselves. Given the important role they play as checks and balances on other parts of the system, it may be necessary for these parties to actively mitigate unwarranted racial disparities that occur in earlier stages of the process. Our analysis suggests that to date, the actions of prosecutors, public defenders, and judges do not actively increase disparities – but neither have they undone disparities attributable to upstream booking decisions. Booking decisions can be thought of as police responses to alleged criminal behavior committed by a defendant with specific characteristics. Our data do not permit the perfect separation of these criteria for independent analysis, and additional research is needed to ensure the utility of further reforms. It is possible that there are legally relevant factors outside of those accounted for in the present study – most importantly, the actual criminal behavior observed relative to the specific charges that are filed – that affect racial disparities in charging at the booking stage. Future studies that examine police behavior and attitudes – dashboard camera media, incident reports, officer statements, and witness testimony, for example – could shed light on this important issue. To the extent that the Office of the Public Defender and the District Attorney have a shared goal of reducing unwarranted racial disparities, careful scrutiny of booked charges is needed. Moreover, policies that can mitigate the adverse downstream consequences (from the perspective of the defendant) of a prior criminal record—such as use of actuarial risk assessment tools rather than prior record as a proxy for risk in bail setting, more flexible sentencing, or improved access to expungement services—may also serve to reduce disparities.

Conviction Review
Units: A National Perspective
4