examining the effect of aural preparation on second grade
TRANSCRIPT

Research & Issues in Music EducationVolume 14Number 1 v.14, 2018 Article 4
2018
Examining the Effect of Aural Preparation onSecond Grade Students’ Music Literacy RhythmSkillsCraig HurleyUniversity of Georgia
Dorothy MusselwhiteUniversity of Georgia
Brian C. WesolowskiUniversity of Georgia
Follow this and additional works at: https://ir.stthomas.edu/rime
Part of the Music Education Commons, and the Music Pedagogy Commons
This Featured Articles is brought to you for free and open access by UST Research Online. It has been accepted for inclusion in Research & Issues inMusic Education by an authorized editor of UST Research Online. For more information, please contact [email protected].
Recommended CitationHurley, Craig; Musselwhite, Dorothy; and Wesolowski, Brian C. (2018) "Examining the Effect of Aural Preparation on Second GradeStudents’ Music Literacy Rhythm Skills," Research & Issues in Music Education: Vol. 14 : No. 1 , Article 4.Available at: https://ir.stthomas.edu/rime/vol14/iss1/4

Abstract
Aural preparation is operationally defined as hearing, performing, decoding, and creating
rhythms or pitches aurally prior to the introduction of music notation. The purpose of this study
was to explore the effect of aural preparation on second grade students’ music literacy rhythm
skills (i.e. reading, performing, and dictation). The research questions that guided this study
included: (1) What are the psychometric qualities (i.e., validity and reliability) of the three
measures used in this study used to assess rhythmic potential and achievement? (2) How does
aural preparation affect students' ability to read and perform rhythms? (3) How does aural
preparation affect students' ability to decode and dictate rhythms? Six second grade elementary
school classes (N = 125 students) participated in this study. Three classes (n = 64) received aural
preparation interventions, and three classes (n = 61) received no aural preparation interventions.
Each participant was administered a pretest and posttest that assessed rhythm dictation and
rhythm performance skills. Results indicated a significant increase in performance skills but no
significant increase in dictation skills when students received aural preparation interventions.
Implications for use of aural preparation in the general music classroom as well as future
research are discussed.
Introduction
Music literacy is defined as “the ability: (1) to see symbols and to think or reproduce the
sound; and (2) to hear the sound and to think or write the symbol” (Campbell & Scott-Kassner,
1995, p. 96). Based upon this definition, a musically literate student should be able to (a) perform
music notation without the aid of an instrument, (b) hear or think of a musical phrase and write
out the musical notation for the phrase, and (c) be able to read, perform, decode, and compose
1
Hurley et al.: Examining the Effect of Aural Preparation on Second Grade Student
Published by UST Research Online, 2018

rhythms and pitches. As Choksy, Abramson, Gillespie, Woods and York (2001) noted, “musical
literacy should not be the property of a chosen few, but a general knowledge of all” (p. 82).
Teaching students music literacy skills has long been a part of the North American music
education curriculum (Mark, 2008). In early music education, Mason (1834) outlined an
important note reading sequence that laid the foundation for many future music methodologies
and curricula. This outline included: (a) singing by rote, (b) reading notation of previously
learned melodies, (c) reading new melodies, and (d) part-singing. In particular, these four stages
began with an aural (i.e., “sound”) experience and followed with a visual (i.e., “sight”)
experience. The goal of this sequential cycle was to foster musical literacy via note-reading
processes. Several methodologies used today implement Mason’s sequence of “sound before
sight,” including Kodály (Kodaly, Bonis, Halapy, and Macnicol, 1974) and Music Learning
Theory (Gordon, 2013), for example. However, these methodologies differ in terms of the
specific skills taught during the “sound” stage.
Music Literacy: Kodály and Gordon
The Kodály method is highly sequential, has a strong emphasis on music literacy, and is
based on high quality literature (Kodaly, et al., 1974). The Kodály methodology introduces new
rhythms and pitches through three distinct phases: prepare, present, and practice. In particular, a
new rhythm or pitch is prepared aurally, visually, and kinesthetically through imitation and
performance. In the Kodály method, students are asked to imitate and perform rhythms before
being introduced to traditional notation. However, they are not typically asked to decode or
create rhythms aurally prior to reading musical notation (Szőnyi, 1973).
2
Research & Issues in Music Education, Vol. 14 [2018], No. 1, Art. 4
https://ir.stthomas.edu/rime/vol14/iss1/4

Based heavily on the research of Edwin Gordon, Music Learning Theory (MLT) focuses
on audiation, a term used to indicate when music is heard and understood silently by the listener
when the actual sounds are not present (Gordon, 2013). In MLT, skills are divided into two main
categories: discrimination (i.e., rote learning) and inference (i.e., conceptual learning). During
the discrimination phase students experience a specified learning sequence. First, students hear
and echo sounds orally through nonsense syllables such as “bum” or “bah.” Second, students
make verbal associations with sounds by naming patterns with either solfège or rhythm syllables.
Third, students experience partial syntheses where the teacher may sing or play a pattern and
students recognize the pattern and name it. Fourth, students learn to associate the music symbols
that represent the sounds they have already learned. Since audiation has ideally occurred in the
first three steps, students do not “decode” patterns but rather “recognize” patterns (Gordon,
2007). Students are then encouraged to read and write known patterns as well as make inferences
on their own. MLT engages students in decoding or recognizing known patterns and naming
them prior to introducing music notation, but it does not engage students in creating new
patterns. Inference learning does not occur until students have been taught how to discriminate
various sounds and have made discriminations successfully.
Palmer (1976) compared a Gordon-based methodology, a Kodály-based methodology,
and a control group to explore which had the greatest effect on 4th graders’ rhythmic reading
abilities. Using Gordon’s (1965) Musical Aptitude Profile (MAP) to measure both written and
performance achievement in rhythm reading, Palmer found that both the Gordon and Kodály
groups had a larger increase in students’ MAP scores than the control group, suggesting that both
Gordon- and Kodály-based methodologies may have a positive effect on student’s rhythmic
performance and writing abilities.
3
Hurley et al.: Examining the Effect of Aural Preparation on Second Grade Student
Published by UST Research Online, 2018

Conversational Solfege and the Aural Experience
Influenced by both the Kodály and Gordon methodologies, Conversational Solfege (CS)
is a music literacy curriculum where students are asked to hear, perform, decode, and create
music in the aural experience stage of the music literacy sequence (Feierabend, 2001). CS is a
curriculum and not a methodology; therefore, CS provides specific directions and exemplars of
each stage of learning. During the CS curriculum, the learner echos patterns, decodes familiar
and unfamiliar patterns, and creates original patterns aurally through reading notation and
writing notation. A unique component of the CS curriculum is asking students to not only
experience and perform rhythm patterns, but to also decode and create rhythm patterns before
introducing the musical notation of those patterns (Feierabend, 2001).
CS is divided into 12 sequential steps that can be categorized into four broader
categories: readiness, Conversational Solfege, reading, and writing. Each time a new rhythm or
pitch set is introduced, the learner experiences all four categories and all twelve steps. Readiness
is when rhythm or pitches are experienced through hearing and student performance, but not
labeled with rhythmic syllables (ta, ti-di/du, du-de) or solfège (do, re mi, etc.). Conversational
Solfege asks students to attach rhythm syllables, or solfège, to specific sounds without visual aid.
In particular, games and activities are aurally based and facilitate ear training through hearing,
echoing, decoding, and creating original patterns using the newly introduced rhythm or pitch
through the use of rhythm syllables or solfège. Traditional notation is introduced during the
reading section, where students echo, decode, and perform patterns from the pitch or rhythm set
using flashcards. Writing occurs when students copy, decode, and create patterns by writing out
the appropriate notation. The CS curriculum recommends experiencing rhythm and pitches
through rote learning, performance, decoding, and creating aurally before music notation is
4
Research & Issues in Music Education, Vol. 14 [2018], No. 1, Art. 4
https://ir.stthomas.edu/rime/vol14/iss1/4

introduced. This is similar to Kodály and Gordon methodologies, however, the Kodály
philosophy does not include decoding and creating in the aural stage and Gordon’s philosophy
does not include creating patterns in the aural stage.
Several studies have investigated the effect of having students echo, perform, decode, and
create patterns aurally prior to reading music notation. Holmes (2009) compared how movable-
do instruction and fixed-do instruction improved the pitch sight-reading skills of seven- and
eight-year-olds. Holmes’ moveable-do instruction was based on CS and fixed-do instruction was
based on two Russian solfège textbooks: Solfeggio Podgotovitelny Class by Frolova (2006) and
Solfeggio dlya 1 classa detskoy muzykalnoy shkoly by Metallidi & Pertcovskaya (2003). Holmes
indicated that the pitch sight-reading scores of the movable-do group (based on CS) increased by
9.79 points, the fixed-do group increased by 8.48 points, and the control group increased by 1.53
points. Dictation skills were not tested in this study.
Several instructional techniques have been explored to help improve students’ rhythm
music literacy abilities, including beat awareness (Boyle, 1970), direct instruction (Lowe, 2012),
rhythmic syllable systems (Bebeau, 1982; Colley, 1987; Cha, 2015), visual and aural stimuli
(Shehan, 1987), beat subdivision (Gauthier & Dunn, 2004), color-coded notation (Rogers, 1991),
shape notes (Kyme, 1960), learning modalities (Persellin, 1992) and specific literacy curriculums
based on Kodály (Palmer, 1976; Hanson, 2003), Gordon (Palmer, 1976), Frolova, Metalidi and
Petcovskaya (Holmes, 2009), and Feierabend (Holmes, 2009). These studies suggest specified
teaching techniques as a method for improving students’ ability to read notation; however, the
effects of students hearing, performing, decoding, and creating patterns using specific rhythms
prior to introducing notation has not been directly explored. The purpose of this study is to
5
Hurley et al.: Examining the Effect of Aural Preparation on Second Grade Student
Published by UST Research Online, 2018

explore the effects of aural preparation on rhythmic music literacy skills of second grade
students. The research questions that guide this study include:
1. What are the psychometric qualities (i.e., validity and reliability) of the three
measures used to measure rhythmic potential and rhythmic achievement?
2. How does the aural preparation affect students' ability to read and perform rhythms?
3. How does aural preparation affect students' ability to decode and dictate rhythms?
Method
Participants
Six second-grade classes (N = 125; male, n = 68; female, n = 57; M = 8 years) from an
upper-middle class elementary school in the southeast United States participated in this study.
Each of the six classes ranged in size from 21 to 25 students. The study was conducted as part of
the students’ normally scheduled general music classes. Informed consent was obtained from the
participants and their parents/guardians. To maintain anonymity, student data were labeled
through a randomized numerical coding system.
Research Design
This study used a matching-only pretest-posttest control group research design. The
Intermediate Measures of Music Audiation (IMMA) (Gordon, 1986), performance task, and
dictation task were administered to all participants prior to treatment. The rhythm portion of the
IMMA was administered as a pretest only in order to match intact classes into balanced
treatment and control groups based upon rhythmic music potential. The IMMA was chosen
based on its convenience, ease of administration, and reputation for reliable and valid data. The
mean IMMA raw scores of previously formed classes were used to create two similarly matched
6
Research & Issues in Music Education, Vol. 14 [2018], No. 1, Art. 4
https://ir.stthomas.edu/rime/vol14/iss1/4

groups across class assignment. The control group (n = 61) demonstrated an average measure of
.99 logits (SD = .59 logits) (observed average = 28.30, SD = 4.28). The treatment group (n = 64)
demonstrated an average measure of .98 logits (SD = .57 logits (observed average = 28.20, SD =
4.32). Detailed psychometric results of the IMMA administration is found in the results section.
Both treatment and control groups participated in eight rhythmic literacy teaching
sessions lasting between 15 and 20 minutes. All sessions took place during regularly scheduled
music lessons and were taught by the principal investigator. Lesson plans for both groups were
reviewed by a CS certified trainer to ensure that they were aligned with the CS methodology.
The specific amount of session time was chosen to imitate a typical school setting where
instructional time is limited. Both groups used the same rhythmic patterns, activities, poems, and
songs from Unit 2 of CS (see Appendix A). The unit was specifically selected because it focused
on dotted quarter notes and three beamed eighth notes in 6/8 time. In particular, Unit 2 was
selected because of the participants’ lack of exposure to the 6/8 time signature.
Both groups followed the activities and guidelines prescribed in CS. They both used the
rhythm syllable du for a dotted quarter note and du-da-di for three beamed eighth notes. Both
groups used a kinesthetic motor as suggested in the CS curriculum. For 6/8 time, students tapped
one elbow three times and then the other three times reinforcing both the micro and macro beat.
The four sections of CS included: readiness, Conversational Solfege, reading, and writing. The
non-aural preparation (i.e., control) group participated in eight lessons, including one lesson in
readiness, zero lessons in Conversational Solfege, four lessons in reading, and three lessons in
writing. The control group did not experience any lessons in the Conversational Solfege category
because this is when students are expected to aurally decode and create patterns. The aural
preparation (i.e., treatment) group participated eight lesson plans, including one lesson in
7
Hurley et al.: Examining the Effect of Aural Preparation on Second Grade Student
Published by UST Research Online, 2018

readiness, four lessons in Conversational Solfege, two lessons in reading, and one lesson in
writing. Detailed lesson plans for each lesson are included in Appendix A.
Musical Tasks and Related Measurement Instruments
Two musical tasks (performance and dictation) were used to assess rhythmic skills. The
performance and dictation tasks used for this study were based on Colley’s (1987) performance
test and dictation test. Colley’s test was chosen because it was most relevant for the typical
activities that take place in the music classes. All students were evaluated using the performance
and dictation tasks as a pretest and a posttest in order to measure differences across group means
across time.
The measurement instruments for each task were created/adapted by the principal
investigator in order to specifically align to the performance and dictation tasks. The
performance test (see Appendix B) assessed the students’ ability to read and perform rhythms.
Ten examples, two measures long in a 6/8 time signature consisting of dotted quarter notes and
three beamed eighth notes were randomly selected from Unit 2, patterns set 2a and 2b from
Conversational Solfege (Feierabend, 2001). Participants were tested and audio was recorded
individually by the principal investigator using a Zoom H1n handy recorder. Five examples were
performed using rhythm syllables and five examples were performed on a woodblock with a
metronome set to a dotted quarter note equals sixty beats per minute. Recordings were labeled
with student numbers and stored in an online file storage system (i.e., Dropbox).
A 5-point rating scale was used based on Bebeau’s (1982) performance measurement
scale (See Appendix B). The 5-point scale was used to assess three criteria: rhythmic accuracy,
8
Research & Issues in Music Education, Vol. 14 [2018], No. 1, Art. 4
https://ir.stthomas.edu/rime/vol14/iss1/4

steady tempo, and proportional rhythms. The highest possible raw score on the performance task
was 50 points and the lowest possible raw score was ten points.
Due to the performance nature of the task, two content experts were solicited to act as
raters. Both raters were certified music educators currently teaching kindergarten through fifth
grade elementary general music. Raters were asked to participate based on their professional
experience and convenience of participating. The principal investigator and two raters met, prior
to the raters’ evaluations, and discussed the performance assessment rubric. Practice exemplars
were evaluated together to ensure the raters’ understanding of and agreement upon the
vocabulary included in the measurement instrument. Both raters separately evaluated all 125
audio recordings using the paper version of the form in Appendix B . Forms were returned to the
principal investigator and data was recorded into an Excel spreadsheet.
The dictation task assessed the student’s ability to aurally decode and write the notation
of a given rhythm pattern. The dictation assessment included 10 examples (see Appendix C).
Rhythm examples were played on a single note (F above middle C) on the piano at 60 beats per
minute. The dictation tasks were recorded to ensure uniformity. The rhythmic patterns consisted
of two measures of 6/8 time signature and only included dotted quarter notes and three beamed
eighth notes. Patterns were randomly selected from Unit 2, patterns set 2a and 2b from
Conversational Solfege (Feierabend, 2001). The participants were asked to write the notation that
matched the pattern played in the recording. All rhythm patterns were played three times with a 5
second pause in between each repetition. Participants were allowed to write the rhythms
throughout the recordings being played. Each beat was evaluated dichotomously (e.g., correct =
1, incorrect = 0). The highest possible raw score on the dictation task was 40 points and the
lowest possible raw score was zero points.
9
Hurley et al.: Examining the Effect of Aural Preparation on Second Grade Student
Published by UST Research Online, 2018

Psychometric Considerations
In order to investigate the psychometric qualities (i.e., validity and reliability) of the
IMMA, the performance measure, and the dictation measure, the Rasch measurement model
(Rasch, 1960/1980) was used. In the behavioral, social, and health sciences, Rasch measurement
theory is often a preferred method for determining the psychometric properties of a measure
(Engelhard, 2013). Specifically, the Rasch model is underscored by five requirements of
invariant measurement: (1) person-invariant calibration of test items: the calibration of the items
must be independent of the particular persons used for calibration; (2) non-crossing item
response functions: any person must have a better chance of success on an easy item than on a
more difficult item; (3) item-invariant measurement of persons: the measurement of persons
must be independent of the particular items that happen to be used for the measuring: item-
invariant measurement of persons; (4) non-crossing person response functions: a more able
person must always have a better chance of success on any item than a less able person; (5)
unidimensionality: items must be measuring a single underlying latent variable (Engelhard and
Perkins, 2011).
In the case that raters mediate the assessment process (as in the performance task
described above), the five requirements of invariant measurement can be extended to the raters
(Engelhard, 2013). Specifically, the five requirements for rater-mediated invariant measurement
include: (a) rater invariant measurement of persons: the measurement of students must be
independent of the particular raters that happen to be used for the measuring; (b) non-crossing
person response functions: a higher achieving student must always have a better chance of
obtaining higher ratings from raters than a lower achieving student; (c) person-invariant
calibration of raters: the calibration of the raters must be independent of the particular students
10
Research & Issues in Music Education, Vol. 14 [2018], No. 1, Art. 4
https://ir.stthomas.edu/rime/vol14/iss1/4

used for calibration; (d) non-crossing rater response functions: any student must have a better
chance of obtaining a higher rating from lenient raters than from more severe raters; and (e)
unidimensionality: students and raters must be simultaneously located on a single underlying
latent variable). When the data demonstrate adequate fit to the Rasch model, invariant
measurement is achieved, allowing for confidence in the measurement instruments themselves
(i.e., construct validity) as well as the inferences about the students made from the measurement
instruments (i.e., predictive validity). Analysis of the data was conducted using the computer
program FACETS (Linacre, 2014).
Results
Between the administration of the pretest and posttest, five students transferred schools
and did not complete the treatment or posttest. Their data are not included in any results.
Furthermore, six additional students’ data were not included in this paper at the request of their
parent/guardian.
Summary Statistics
In order to answer research question 1 (What are the psychometric qualities of the three
measures used in this study used to assess rhythmic potential and achievement?), summary
statistics and model-data fit for the calibrations of students, items, and raters for each measure
were evaluated. Summary statistics for the IMMA, performance task, and dictation task are
displayed in Table 1. The rhythm demonstrated overall significant differences for items (χ2 (39) =
308, p = 0.00, Rel = 0.87) and students (χ2 (113) = 259.9, p = 0.00, Rel = 0.57), indicating that
the measure was able to significantly separate items based upon difficulty level and the measure
was also able to separate students based upon overall achievement level. However, reliability of
separation (interpreted similarly to Cronbach’s Alpha) was considerably low for the IMMA
11
Hurley et al.: Examining the Effect of Aural Preparation on Second Grade Student
Published by UST Research Online, 2018

student measure. The performance task demonstrated overall significant differences for items (χ2
(9) = 1081.9, p = 0.00, Rel = 0.99) and students (χ2 (249) = 3526.6, p = 0.00, Rel = 0.94) with
high reliability. The performance task was a performance assessment; therefore, the raters were
included in the measurement model to investigate and control for their quality (i.e., severity)
based upon overall interpretations of leniency/severity and fit to the model. The two performance
task raters were not significantly different from one another in regard to overall severity (χ2 (1) =
0.20, p = 0.68, Rel = 0.00), suggesting that the raters used the items and scored the students in a
similar manner. The dictation measure demonstrated overall significant differences for items (χ2
(9) = 272.2, p = 0.00, Rel = 0.97) and students (χ2 (249) = 805.5, p = 0.00, Rel = 0.82) with
moderate to strong reliability.
Fit statistics are empirical quality indicators for the response patterns based on expected
predictability and invariant requirements of the Rasch measurement model. Fit values close to
the expected value of 1.00 indicate good data fit to the model. The acceptable range for
parameter-level fit statistics (e.g., overall students, overall items) is between 0.50 and 1.50 and
the acceptable range for element-level fit statistics (e.g., each student, each item) in the context
of a classroom setting is 0.40 and 1.60 (Wright & Linacre, 1994). Values above the
recommended range indicate too much randomness in the response patterns for productive
measurement. Values below the recommended range indicate not enough randomness in the
response patterns for productive measurement. Infit MSE for IMMA items (M = 0.99, SD = 0.10)
and IMMA students (M = 0.99, SD = 0.13) fell within parameter level fit statistics (0.50 – 1.50).
Infit MSE for performance items (M = 0.98, SD = 0.15), performance students (M = 0.99, SD =
0.47) and performance raters (M = 0.98, SD = 0.15) also fell within parameter level fit statistics
(0.50 – 1.50). Infit MSE for dictation items (M = 1.07, SD = 0.23) and dictation students (M =
12
Research & Issues in Music Education, Vol. 14 [2018], No. 1, Art. 4
https://ir.stthomas.edu/rime/vol14/iss1/4

1.04, SD = 0.53) fell within parameter level fit statistics (0.50 – 1.50) as well. Good construct
validity is associated with the adequate item fit. This suggests strong construct validity of items
and strong predictive validity of the students for the IMMA, performance task and dictation task.
The descriptive statistics for the pretest and posttest performance task and the pretest and posttest
dictation task can be found in Table 2.
Table 1
Summary Statistics IMMA, Performance Task, Dictation Task
IMMA Performance Task Dictation Task
Items Students Items Students Raters Items Students
Measure
(Logits)
Mean 0.00 0.98 0.00 0.68 0.00 0.00 2.36
SD 0.65 0.58 0.60 1.27 0.01 0.57 1.48
N 40 125 10 250 2 10 250
Infit MSE
Mean 0.99 0.99 0.98 0.99 0.98 1.07 1.04
SD 0.10 0.13 0.15 0.47 0.15 0.23 0.53
St. Infit
MSE
Mean 0.20 0.10 -0.30 -0.01 -0.70 0.40 0.10
SD 1.20 0.90 2.3 1.40 5.20 1.60 1.10
Outfit
MSE
Mean 0.97 0.97 1.01 1.01 1.01 0.96 0.96
SD 0.14 0.19 0.21 0.53 0.06 0.24 0.59
Std. Outfit
MSE
Mean 0.10 0.00 -0.10 -0.10 0.20 -0.10 0.00
SD 1.3 1.00 2.60 1.40 1.80 1.40 1.00
Separation
Statistics
Reliability
of
Separation
0.88 0.57 0.99 0.94 0.00 0.97 0.82
Chi-Square 308.0 259.0 1081.9 3526.6 0.20 272.7 805.5
Degrees of
Freedom
39* 113* 9* 249* 1 9* 249*
* p < .01
13
Hurley et al.: Examining the Effect of Aural Preparation on Second Grade Student
Published by UST Research Online, 2018

Table 2
Descriptive Data for the Performance Task and Dictation Task
Aural
Preparation
Treatment Group
(N = 64)
Non-aural
Preparation
Control Group
(N = 61)
Pretest Posttest Pretest Posttest
M (SD) M (SD) M (SD) M (SD)
Performance Task -0.13 (0.98) 1.72 (0.99) -0.04 (1.06) 1.19 (0.94)
Dictation Task 1.49 (1.00) 3.04 (1.39) 1.69 (1.39) 3.24 (1.23)
Item and Student Calibrations for the IMMA
The calibrations of the rhythm portion of the IMMA for items is provided in Appendix D.
The calibrations of the rhythm portion of the IMMA for students is provided in Appendix E.
IMMA item number 27 achieved the highest linear measure (1.32 logits) indicating it was the
most difficult question and IMMA item number 3 achieved the lowest linear measure (-1.28
logits) indicating it was the least difficult question. All rhythm IMMA items fell within an
acceptable range of model data fit (0.60 – 1.40). Student 79 achieved the highest linear measure
(2.35 logits) indicating the highest rhythmic potential prior to treatment and student 116 achieved
the lowest linear measure (-0.70) indicating the lowest rhythmic potential prior to treatment. All
students fell within an acceptable range of model data fit (0.60 – 1.40).
Item and Student Calibrations for the Performance Task
The calibrations of the items on the performance task is provided in Appendix F. The
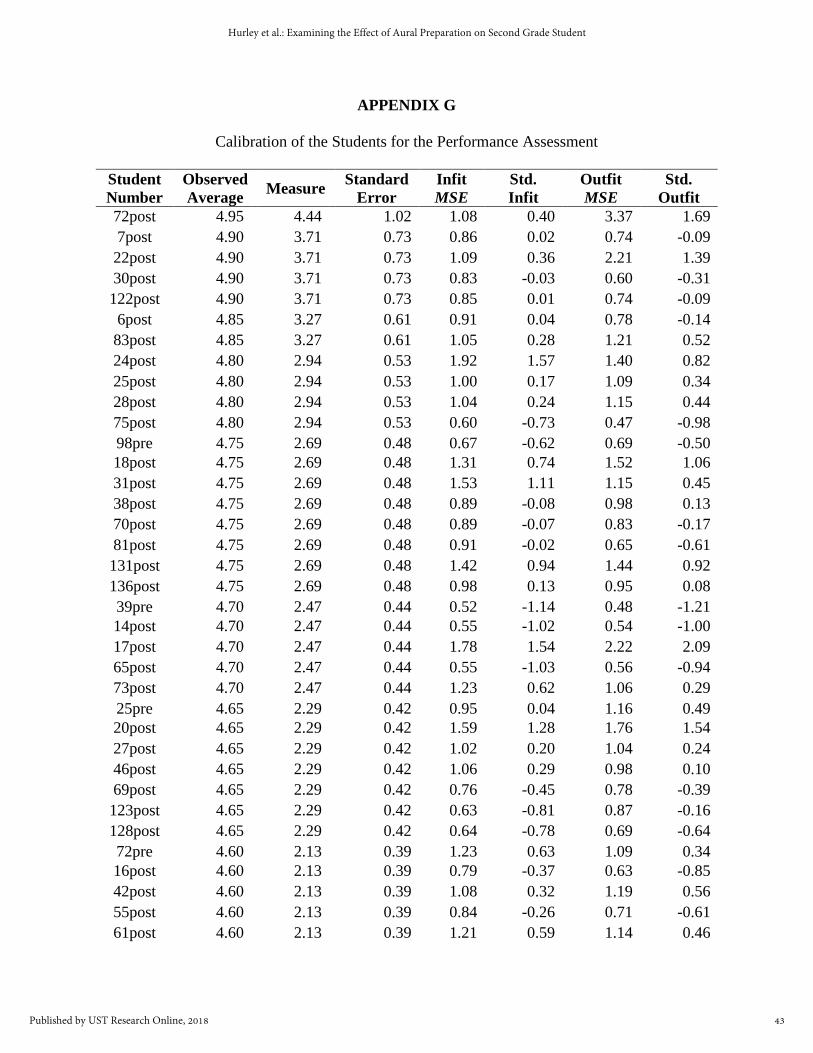
calibrations of the students on the performance task is provided in Appendix G. The calibrations
of the raters on the performance task is provided in Appendix H. Item 8 achieved the highest
linear measure (1.15 logits) indicating that it was the most difficult item and item 10 achieved
the lowest linear measure (-1.10 logits) indicating that was the least difficult item. All items fell
14
Research & Issues in Music Education, Vol. 14 [2018], No. 1, Art. 4
https://ir.stthomas.edu/rime/vol14/iss1/4

within an acceptable range of model data fit (0.60 – 1.40). The performance task posttest score
for student 72 was the highest linear measure (4.44 logits) while the performance task pretest
score for student 107 was the lowest linear measure (-2.78). The pretest scores for nine students
were above the recommended fit statistics range (0.60 – 1.40), while the pretest scores for 23
students were below the recommended fit statistics range. The posttest scores for 11 students
were above the recommended fit statistics range (0.60 – 1.40), while the posttest score scores for
27 students were below the recommended fit statistics range.
Item and Student Calibrations for the Dictation Task
The calibrations of the items on the dictation task is provided in Appendix I. The
calibrations of the students on the dictation task is provided in Appendix J. Item 1 achieved the
highest linear measure (0.92 logits) indicating that it was the most difficult item and item 4
achieved the lowest linear measure (-1.03 logits) indicating that it was the least difficult item.
Item 4 (1.42 logits) was slightly over the acceptable range of model data fit (0.60 – 1.40). The
pretest scores for 14 students and posttest scores for 69 students were the highest linear measures
(4.19 logits) while the pretest score for student 78 was the lowest linear measure (-0.38). The
pretest scores for students 25 were above the recommended fit statistics range (0.60 – 1.40)
while the pretest scores for students 26 were below the recommended fit statistics range. The
posttest scores for 12 students were above the recommended fit statistics range (0.60 – 1.40)
while the posttest score for 15 students were below the recommended fit statistics range.
15
Hurley et al.: Examining the Effect of Aural Preparation on Second Grade Student
Published by UST Research Online, 2018

Examining Changes in Pretest and Posttest Scores across Measures
In order to answer research question number two (How does the aural preparation affect
students' ability to read and perform rhythms?), a one-way ANCOVA was conducted to compare
the differences in the treatment and control groups’ achievement scores on the performance task
after controlling for pretest scores. A statistically significant difference in overall means was
found between the control and treatment groups (F (1,122) =11.04, p < 0.01). An examination of
estimated marginal means demonstrated that the treatment group (M = 1.72 logits) performed
significantly higher than the control group (M = 1.18 logits) on the performance task (See Table
3). Furthermore, the treatment group’s mean logit score increased by 1.59 logits from pretest to
posttest while the control group’s mean logit score increased by 1.15 logits from pretest to
posttest (See Table 2).
Table 3
Performance Assessment – Univariate Analysis of Covariance (ANCOVA)
Source Sum of
Squares
df Mean
Square
F p h2 Noncent.
Parameter
Observed
Powerb
Corrected
Model
22.99a 2 11.50 13.92 0.00 0.19 27.85 0.10
Intercept 269.72 1 269.72 326.63 0.00 0.73 326.63 1.00
pretest 14.87 1 14.87 18.00 0.00 0.13 18.00 0.99
Treatment 9.12 1 9.12 11.04 0.01 0.08 11.04 0.91
Error 100.74 122 0.83
Total 387.16 125
Corrected
Total
123.74 124
a. R Squared = 0.19 (adjusted R Squared = 0.17)
b. Computed using alpha = 0.05
In order to answer research question number three (How does aural preparation affect
students' ability to decode and dictate rhythms?), a one-way ANCOVA was conducted to
compare the differences in the treatment and control groups’ achievement scores on the dictation
16
Research & Issues in Music Education, Vol. 14 [2018], No. 1, Art. 4
https://ir.stthomas.edu/rime/vol14/iss1/4

task after controlling for pretest scores. Overall, there was not a significant difference in overall
means between the treatment and control groups (F (1,122) = 0.61, p = 0.44) (See Table 4). The
treatment and control groups mean logit score both increased by 1.55 logits from pretest to
posttest showing no significant difference between groups (See Table 2).
Table 4
Dictation Assessment – Univariate Analysis of Covariance (ANCOVA)
Source Sum of
Squares
df Mean
Square
F p h2 Noncent.
Parameter
Observed
Powerb
Corrected
Model
69.91a 2 34.95 29.57 0.00 0.33 59.14 1.00
Intercept 213.66 1 213.66 180.74 0.00 0.60 180.74 1.00
pretest 68.50 1 68.50 57.95 0.00 0.32 57.95 1.00
Treatment 0.72 1 0.72 0.61 0.44 0.01 0.61 0.12
Error 144.22 122 1.18
Total 1446.77 125
Corrected
Total
214.13 124
a. R Squared = 0.33 (adjusted R Squared = 0.32)
b. Computed using alpha = 0.05
Conclusion
The purpose of this study was to explore the effects of aural preparation on rhythmic
music literacy skills of second-grade students. The role of the first research question was to
investigate the psychometric qualities of the three measures used in this study. The rhythm
portion of the IMMA, the performance task, and the dictation task all demonstrated significant
separation and acceptable goodness of fit. As a result, the IMMA, performance task, and
dictation task were able to reliably separate marked differences in student achievement levels
and differences in item difficulties, suggesting that the measurements are sensitive enough to
provide confidence in the measures and related inferences. Overall, the psychometric
17
Hurley et al.: Examining the Effect of Aural Preparation on Second Grade Student
Published by UST Research Online, 2018

investigation suggests strong construct validity of items and strong predictive validity of the
students for all measurements used.
The role of the second research question was to investigate how aural preparation would
affect students' ability to read and perform rhythms. Results suggest that the treatment had a
significant effect on improving reading and performance skills as measured by the performance
task. The treatment group demonstrated a significantly higher overall mean score than the control
group on the performance task.
The role of the third research question was to investigate the effects of aural preparation
on students’ decoding and writing skills as measured by the dictation task. There was not a
statistically significant difference between treatment and control groups on the dictation task.
Discussion
Measurements
All three measurements demonstrated an acceptable goodness of fit, which supports
previous validity/reliability reports of the rhythm portion of the IMMA for second graders
(Gordon, 1986, p. 92). While the IMMA is recommended for students in grades one through six,
at 40 items long it requires an attention span that challenged many second graders, which is one
possible explanation for the low reliability results. Future research might utilize Gordon’s
Primary Measures of Music Audition (PMMA), which, with fewer items, is recommended for
grades kindergarten through three.
The performance task demonstrated high reliability for both items (Rel = 0.99) and
students (Rel = 0.94). Additionally, the dictation task showed high reliability for both items (Rel
= 0.97) and students (Rel = 0.82). Because the performance task was scored using a five-point
18
Research & Issues in Music Education, Vol. 14 [2018], No. 1, Art. 4
https://ir.stthomas.edu/rime/vol14/iss1/4

rubric as opposed to a dichotomously scored method (correct or incorrect) as in the dictation
task, data were more descriptive for the performance task than the dictation task. This is evident
in the range of scores for each assessment. The performance task logit scale ranged from -2.78 to
4.44 whereas the dictation task logit scale ranged from -0.38 to 4.19. This sensitivity may have
aided in indicating a significant difference between groups on the performance task. There was
also a ceiling effect on the dictation task. For example, 14 students earned a perfect score on the
dictation pretest and 69 of the 125 students (55%) earned a perfect score on the dictation posttest.
There may be differences in the dictation skill levels of those 69 students, but they were not
evident as there were not enough difficult items indicated in the assessment instrument to
separate their performances. In contrast, no students earned a perfect score on the performance
pretest. Rater one scored four students as earning a perfect score on the performance posttest
while rater two scored zero students as earning a perfect score on the posttest. These data suggest
that the performance test was more descriptive than the dictation measurement. It is
recommended that an improved assessment be used for dictation assessment in future studies.
During the performance task a metronome was set to 60 beats per minute. This aided the raters
greatly when assessing each recording. After review of the audio recordings, many students
seemed to struggle to not rush the dotted quarter note. In future research the metronome marking
could possibly be set at a higher rate of speed to aid all students’ achievement.
Performance
The aural preparation group mean (1.72 logits) was found to be significantly higher (p <
0.01) than the non-aural preparation group mean (1.18 logits) on the performance task. In
addition to demonstrating more gains on the performance task from pretest to posttest, the aural
19
Hurley et al.: Examining the Effect of Aural Preparation on Second Grade Student
Published by UST Research Online, 2018

preparation groups experienced the music literature at a deeper level. Aural preparation activities
were based on songs more often than the non-aural preparation groups, possibly providing the
group with a seemingly better understanding and comfort with the literature. Anecdotally, the
principal investigator observed that the aural preparation group learned and experienced more
literature because they were not focused on the symbols, but rather on the music and sounds.
Non-aural preparation groups spent more time with the notation symbols that were not
necessarily related to a particular song. Because the songs were more prevalent, the aural-
preparation groups may have had a better feel for the 6/8 time signature. This seemed to increase
their aural understanding of the rhythmic relationship between a dotted quarter note and three
beamed eighth notes. The principal investigator also observed that the aural-preparation group
seemed to be better at accenting the strong beats in the meter as opposed to giving the same
weight to all six eighth notes. This accenting was not part of the criteria on the assessment
instrument and therefore would not have been included in the scoring, but having a better
understanding of rhythmic relationships may have helped the aural-preparation students maintain
a steady beat more effectively. During the performance task a metronome was set at 60 beats-
per-minute, which is a rather slow tempo. Understanding the feeling of the time signature and
rhythmic relationships between the two rhythms may have helped aural preparation students
maintain control over the slow tempo resulting in higher evaluations on the performance task.
Dictation
The aural preparation group mean (3.01 logits) was found to be slightly lower than the
non-aural preparation group mean (3.22 logits), but not at a statistically significant level. As
mentioned earlier, the descriptive data of the dictation task did not seem to be as sensitive as the
20
Research & Issues in Music Education, Vol. 14 [2018], No. 1, Art. 4
https://ir.stthomas.edu/rime/vol14/iss1/4

performance task data. The dictation task seemed to have a ceiling effect as evidenced by 55% of
the students earning a perfect score on the dictation posttest. Because unit two of CS only has
two rhythms (dotted quarter note, three beamed eighth notes) the students can either pick one
rhythm or the other for each response. This gives students a 50% chance of getting each answer
correct. A more descriptive assessment may have provided better clarity and precision in scoring.
It should also be noted that all students in the study had already experienced all twelve steps of
unit one of CS. Unit one follows the same 12 steps as unit two but focuses on quarter notes and
paired eighth notes in 2/4 time rather than dotted quarter notes and three beamed eighth notes in
6/8 time. Having already learned the skills to decode quarter notes and paired eighth notes in CS
unit one might have had a carryover effect on students abilities to decode dotted quarter notes
and three beamed eighth notes in this study.
Research from this study suggests that aural skills can be confidently taught to second
grade students. Spending class time on aural preparation proved beneficial in improving student
achievement on the performance task. Results also indicated that exposure to written notation for
only 38% of the lessons (aural preparation group) versus exposure to written notation for 88% of
the lessons (non-aural preparation group) had a non-significant effect on students’ ability to
decode and write rhythmic patterns. This suggests aural skills and exposure to written music
notation should be balanced to better ensure high student achievement.
Limitations of this research include the use of only two contrasting rhythms (dotted
quarter note and three beamed eighth notes in 6/8 time signature). Further research is needed to
investigate if more complex rhythm patterns would change the results of this study. In this study
the treatment group spent five lessons on aural skills and three on reading and writing skills.
Future research could alter the lesson schedule to include more or less aural lessons and explore
21
Hurley et al.: Examining the Effect of Aural Preparation on Second Grade Student
Published by UST Research Online, 2018

whether that change effects the results. Students in this study had already experienced all four
sections of CS Unit 1 and parts of Unit 4. Further research is also needed to see if no experience
with CS would affect the results. Since students had already experienced aural preparation with
other rhythms (e.g., quarter note and paired eighth notes) and pitch (e.g., do, re, mi), these skills
may have carried over to the current study. This study was also limited to the assessment of
rhythm only and would need to be replicated with pitch patterns to investigate similarities or
differences in results.
The 2014 National Core Arts Standards for Music (National Association for Music
Education (NAfME) outline several rhythmic literacy performance standards. They include not
only reading and performing, but also creating, improvising, generating patterns (NAfME, n.d.).
The Standards emphasize a broad definition of music literacy, as evidenced through the artistic
process of creating, performing, responding, and connecting that align with the definition
provided by Campbell and Scott-Kasner (1995). Students are now expected to not only read and
perform patterns but improvise and write them as well. The field of music education now clearly
expects students to not only perform but to engage in other artistic processes such as create,
respond, and connect. This leads general music teachers to consider how to better engage
students in these artistic processes through the “sound” portion of our preparation sequence.
Results from this study suggest that aurally hearing, performing, decoding, and creating patterns
prior to introducing musical notation may increase second grade students’ abilities to perform,
create, respond, and connect via rhythm-based learning.
22
Research & Issues in Music Education, Vol. 14 [2018], No. 1, Art. 4
https://ir.stthomas.edu/rime/vol14/iss1/4

References
Bebeau, M. J. (1982). Effects of traditional and simplified methods of rhythm-reading
instruction. Journal of Research in Music Education, 30(2), 107 – 119.
Boyle, J. D. (1970). The effect of prescribed rhythmical movements on the ability to read music
at sight. Journal of Research in Music Education, 18(4), 307 – 318.
Campbell, P., & Scott-Kassner, C. (1995). Music in childhood: From preschool through the
elementary grades. New York: Schirmer Books: Macmillan.
Cha, J. W. (2015). The Takadimi system reconsidered: Its psychological foundations and some
proposals for improvement. Psychology of Music, 43(4), 563 – 577.
Choksy, L., Abramson, R., Gillespie, A., Woods, D., & York, F (2001). Teaching music in the
twenty-first century. Prentice Hall.
Colley, B. (1987). A comparison of syllabic methods for improving rhythm literacy.
Journal of Research in Music Education, 35(4), 221 – 235.
Engelhard, G. (2013). Invariant measurement: Using Rasch models in the social, behavioral,
and health sciences. New York: Routledge.
Engelhard, G., Jr., & Perkins, A. F. (2011). Person response functions and the definition of units
in the social sciences. Measurement: Interdisciplinary Research & Perspective, 9, 40 – 45.
Feierabend, J. (2001). Conversational solfege level 1: Teachers manual. Chicago: GIA
Publications.
Frolova, Yu. (2006). Solfeggio Podgotovitelny Class (7th ed.). Rostov-na-Donu: Fenix.
Gauthier, D., & Dunn, R. E. (2004). Comparing two approaches for teaching rhythm reading
skills to first-grade children: A pilot study. Research & Issues in Music Education, 2(1),
4.
23
Hurley et al.: Examining the Effect of Aural Preparation on Second Grade Student
Published by UST Research Online, 2018

Gordon, E. (1986). Manual for the primary measures of music audiation and the intermediate
/measures of music audiation: Music aptitude tests for kindergarten and first, second,
third, and fourth grade children. GIA Publications, Inc.
Gordon, E. (1965). Musical aptitude profile.
Gordon, E. (2007). Learning sequences in music: A contemporary music learning theory.
Chicago: GIA Publications.
Gordon, E. (2013). Music learning theory for newborn and young children. Chicago: GIA
Publications.
Hanson, M. (2003). Effects of sequenced Kodály literacy-based music instruction on the spatial
reasoning skills of kindergarten students. Research & Issues in Music Education, 1(1), 4.
Holmes, A. V. (2009). Effect of fixed-do and movable-do solfege instruction on the development
of sight-singing skills in 7- and 8-year-old children. University of Florida. Retrieved
from: http://etd.fcla.edu/UF/UFE0024398/holmes_a.pdf
Kodaly, Z., Bonis, F., Halapy, L., & Macnicol, F. (1974). The selected writings of Zoltan Kodaly.
London ; New York: Boosey & Hawkes.
Kyme, G. H. (1960). An experiment in teaching children to read music with shape notes. Journal
of Research in Music Education, 8(1), 3 – 8.
Linacre, J. M. (2014). Facets. Chicago, IL: MESA Press.
Lowe, G. (2012). Direct instruction and music literacy: one approach to augmenting
the diminishing?. Australian Journal of Music Education, (1), 3 – 13.
Mark, M., & MENC, the National Association for Music Education. (2008). A concise history of
American music education. Lanham, Maryland: Rowman & Littlefield Education.
24
Research & Issues in Music Education, Vol. 14 [2018], No. 1, Art. 4
https://ir.stthomas.edu/rime/vol14/iss1/4

Mason, L. (1834). Manual of the Boston Academy of Music: for instruction in the elements of
vocal music, on the system of Pestalozzi. Boston: Carter, Hendee, 1834.
Metalii, J., & Petcovskaya, A. (2003). Solfeggio dlya 1 classa detskoy muzykalnoy shkoly (2nd
ed.). Saint-Petersburg: Kompozitor-Saint-Petersburg.
National Association for Music Education (NAfME). (n.d.). Retrieved November
17, 2017, from http://www.nafme.org/my-classroom/standards/
Palmer, M. (1976). Relative effectiveness of two approaches to rhythm reading for
fourth-grade students. Journal of Research in Music Education, 24(3), 110 – 118.
Persellin, D. C. (1992). Responses to rhythm patterns when presented to children through
auditory, visual, and kinesthetic modalities. Journal of Research in Music Education,
40(4), 306 – 315.
Rasch, G. (1960/1980). Probabilistic models for some intelligence and attainment tests.
Copenhagen, Denmark: Danish Institute for Educational Research. (Expanded
edition, 1980 Chicago, IL: University of Chicago Press).
Rogers, G. L. (1991). Effect of color-coded notation on music achievement of elementary
instrumental students. Journal of Research in Music Education, 39(1), 64 – 73.
Shehan, P. K. (1987). Effects of rote versus note presentations on rhythm learning and
retention. Journal of Research in Music Education, 35(2), 117 – 126.
Szőnyi, E. (1973). Kodály's principles in practice: an approach to music education through the
Kodály method. Boosey & Hawkes.
Wright, B. D., & Linacre, J. M. (1994). Reasonable mean-square fit values. Rasch Measurement
Transactions, 8, 370.
25
Hurley et al.: Examining the Effect of Aural Preparation on Second Grade Student
Published by UST Research Online, 2018

About the Authors
Craig Hurley is an elementary music specialist for the Cobb County School District in Marietta,
Georgia. Craig Hurley is also the conductor of the Spivey Hall Young Artists, the preparatory
choir of the Spivey Hall Children’s Choir. Mr. Hurley is a music education doctoral candidate at
the University of Georgia. His research interests include music literacy and children’s choir
pedagogy.
Dorothy Musselwhite received her Ph.D. in Music Education from the University of Georgia.
She is currently the Assistant Director of Assessment at Kansas State University. Her research
interests include pre-service teachers, scale development, and educational assessment.
Brian Wesolowski is an Associate Professor of Music Education. His teaching focuses on
graduate music education, including quantitative research design, assessment and policy in
education and music, educational measurement, and statistical programming. His primary
research interest includes the study of rater behavior, scale development, policy of educational
assessment, and broad applications of assessment, measurement, and evaluation in large-scale
testing and classroom contexts.
26
Research & Issues in Music Education, Vol. 14 [2018], No. 1, Art. 4
https://ir.stthomas.edu/rime/vol14/iss1/4

Examining the Effect of Aural Preparation on Second Grade Students’ Music Literacy Rhythm
Skills
APPENDIX A
Lesson Plans for Control and Treatment Groups
All page numbers below refer to:
Feierabend, J. M. (2001). Conversational solfege level 1: Teachers manual. Chicago: GIA
Publications.
Non-Aural Preparation Group (Control Group)
Session 1 (1. Readiness-Rote)
1. Echo Me (p. 19) – teacher speaks patterns on neutral syllable, students echo
2. Learn this Rhyme (p. 19) - Oh My! Fish in the Sky! (p. 149)
3. Layering with Ostinatos (p. 20)
a. Ostinato – “What shall we do there’s a fish in the sky?” (teacher vs. student)
b. Add speech ostinato to poem, transfer ostinato to instruments and against
poem
Session 2 (1. Readiness-Rote, 6. Reading Rote)
1. Review Poem - Oh My! Fish in the Sky! (p. 149)
2. Teach Song – Oh Dear What Can the Matter Be (p. 139)
3. Read Patterns from Pattern Cards (p. 39)
a. Teacher reads patterns 2a on syllables, students echo
Session 3 (6. Reading Rote, 7. Reading-Decoding Familiar)
1. Read Patterns from Pattern Cards (p. 39)
a. Teacher reads patterns 2a on syllables, students echo
2. Read patterns (p. 40)
a. Students read patterns 2a on syllables
3. Read and Remember (p. 40)
a. Teacher displays flashcard from patterns 2a while students study card
b. Teachers hides card and students perform card on rhythm syllables
Session 4 (7. Reading-Decoding Familiar, 8. Reading-Decoding Unfamiliar)
1. Multiple Choice (p. 43)
a. Teacher displays two or more patterns selected from patterns 2a
b. Teacher performs patterns
c. Students indicate which pattern teacher performed
2. Read patterns (p. 40)
27
Hurley et al.: Examining the Effect of Aural Preparation on Second Grade Student
Published by UST Research Online, 2018

a. Students read patterns 2b on syllables
3. Take a Reading Walk (p. 41)
a. Students read their flashcard from patterns 2a and 2b at the same time
(multiple flashcards will be read at the same time)
b. Students travel to the next flashcard and repeat process
Session 5 (7. Reading-Decoding Familiar, 8. Reading-Decoding Unfamiliar)
1. Read patterns (p. 40)
a. Students read patterns 2b on syllables
2. I Think I Made an Error (p. 41)
a. Teacher reads patterns from 2a and 2b, but makes alteration
b. Students identify error and read pattern correctly
Session 6 (8. Reading-Decoding Unfamiliar, 9. Writing-Rote)
1. Lost My Partner (p. 43)
Students are given a flashcard
Students read their pattern and travel around the room looking for the other
person who also has their identical pattern
2. Copy These Patterns (p. 50)
Students copy rhythm patterns and then speak them
Session 7 (10. Writing-Decode Familiar, 11. Writing-Decode-Unfamiliar)
1. Unscramble (p. 285)
a. Teacher distributes rhythmcard packets
b. Students decode familiar rhyme - Oh My! Fish in the Sky! (p. 149)
c. Students decode unfamiliar rhyme - Stirring the Brew (p. 157)
Session 8 (11. Writing-Decode-Unfamiliar, 12 – Writing-Create)
1. Create Worksheet (p. 369)
a. Using the rhythm boxes students create 4 original patterns
b. Students perform patterns
28
Research & Issues in Music Education, Vol. 14 [2018], No. 1, Art. 4
https://ir.stthomas.edu/rime/vol14/iss1/4

Aural Preparation Group (Experimental Group)
Session 1 (1. Readiness-Rote)
1. Echo Me (p. 19) – teacher speaks patterns on neutral syllable, students echo
2. Learn this Rhyme (p. 19) - Oh My! Fish in the Sky! (p. 149)
3. Layering with Ostinatos (p. 20)
a. Ostinato – “What shall we do there’s a fish in the sky?”
b. Add speech ostinato to poem, transfer ostinato to instruments and against
poem
Session 2 (1. Readiness-Rote, 2. Conversational Solfege-Rote)
1. Review Poem - Oh My! Fish in the Sky! (p. 149)
2. Echo Me (p. 23) – teacher speaks patterns on rhythm syllables, students echo
3. Who Speaks What (p. 21)
a. Teacher speaks patterns with syllables from 2a, but only girls says eighth
notes and only boys say dotted quarter notes
b. Girls and boys switch jobs
4. Teach Song – Oh Dear What Can the Matter Be (p. 139)
Session 3 (2. Conversational Solfege-Rote, 3. Conversational Solfege-Decode Familiar)
1. Clap for Your Syllable (p. 22)
a. Teacher speaks pattern with syllables from 2a
b. Students speak the eighth notes, but clap the dotted quarter notes
2. I’m Thinking of Something that Begins With ______
a. Teacher speaks pattern from 2a
b. Teachers gives clues about pattern such as I’m thinking of something that
begins with du-da-di
c. Students decode pattern as a class
3. Phrase by Phrase (p. 26)
a. Teacher speaks Oh My! Fish in the Sky! (p. 149) one phrase at a time
b. Students echo no syllables
Session 4 (3. Conversational Solfege-Decode Familiar, 4. Conversational Solfege-Decode
Unfamiliar)
1. Jungle Messages (p. 25)
a. Teacher plays rhythm on drum from patterns 2a and 2b
b. Students echo on syllables
2. I’m Thinking of Something that Begins With ______
a. Teacher speaks pattern from 2a and 2b
b. Teacher gives clues about pattern such as I’m thinking of something that
begins with du-da-di
c. Students decode pattern
3. Create a Pattern that Includes… (p. 31)
29
Hurley et al.: Examining the Effect of Aural Preparation on Second Grade Student
Published by UST Research Online, 2018

a. Students create a rhythm pattern that with a restriction such as: “Create a
pattern that begins with du-da-di”
Session 5 (4. Conversational Solfege-Decode Unfamiliar, 5. Conversational Solfege-Create)
1. Jungle Messages (p. 25)
a. Teacher plays rhythm on drum from patterns 2a and 2b
b. Students echo on syllables
2. Question/Answer (p. 30)
a. Teacher performs rhythm pattern
b. Individuals create a different pattern and perform back to teacher
c. In pairs, one student asks the “question” while the other one gives a different
“answer”
Session 6 (6. Reading Rote, 7. Reading-Decoding Familiar)
1. Read Patterns from Pattern Cards (p. 39)
a. Teacher reads patterns 2a on syllables, students echo
2. Read patterns (p. 40)
a. Students read patterns 2a on syllables
3. Read and Remember (p. 40)
a. Teacher displays flashcard from patterns 2a while students study card
b. Teacher hides card and students perform card on rhythm syllables
Session 7 (7. Reading-Decoding Familiar, 8. Reading-Decoding Unfamiliar)
1. Multiple Choice (p. 43)
a. Teacher displays two or more patterns selected from patterns 2a
b. Teacher performs pattern
c. Students indicate which pattern teacher performed
2. Read patterns (p. 40)
a. Students read patterns 2b on syllables
3. Take a Reading Walk (p. 41)
a. Students read their flashcard from patterns 2a and 2b at the same time
(multiple flashcards will be read at the same time)
b. Students travel to the next flashcard and repeat process
Session 8 (10. Writing-Decode Familiar, 11. Writing-Decode Unfamiliar, 12-Writing-Create)
1. Popsicle Sticks (p. 50) Substitute rhythmcards (p. 285) for popsicle sticks
a. Students use cards to copy pattern displayed by teacher
b. Students speak card on syllables
2. Unscramble (p. 285)
a. Teacher distributes rhythmcard packets
Students decode familiar rhyme - Oh My! Fish in the Sky! (p. 149)
3. Create a Pattern that Includes… (p. 55)
a. Using rhythmcards, students create patterns with a specific beginning, ending
or pattern
30
Research & Issues in Music Education, Vol. 14 [2018], No. 1, Art. 4
https://ir.stthomas.edu/rime/vol14/iss1/4

APPENDIX B
Performance Assessment
31
Hurley et al.: Examining the Effect of Aural Preparation on Second Grade Student
Published by UST Research Online, 2018

32
Research & Issues in Music Education, Vol. 14 [2018], No. 1, Art. 4
https://ir.stthomas.edu/rime/vol14/iss1/4

Grading Sheet
Student Number: ____________________________
Total Score: ________________________________
1) 1 2 3 4 5
2) 1 2 3 4 5
3) 1 2 3 4 5
4) 1 2 3 4 5
5) 1 2 3 4 5
6) 1 2 3 4 5
7) 1 2 3 4 5
8) 1 2 3 4 5
9) 1 2 3 4 5
10) 1 2 3 4 5
Performance Assessment Scoring Rubric
5 – Steady tempo and accurate rhythms throughout
4 – Inaccurate tempo, accurate rhythms throughout
3 – Inaccurate tempo, or missed one rhythm unit
2 – Inaccurate tempo, or missed two rhythm units
1 – Missed more than two rhythm units
Rhythm unit – one beat of music, in 6/8 time that would be a dotted quarter note or three beamed
eighth notes
The first four rhythm performed were assessed. If extra rhythms were performed they made the
final rhythm unit incorrect.
The 3 eighth notes had to be even relative to one another to be counted correct.
The dotted quarter note had to be as long as 3 eighth notes to be counted correct.
33
Hurley et al.: Examining the Effect of Aural Preparation on Second Grade Student
Published by UST Research Online, 2018

APPENDIX C
Dictation Assessment
34
Research & Issues in Music Education, Vol. 14 [2018], No. 1, Art. 4
https://ir.stthomas.edu/rime/vol14/iss1/4

35
Hurley et al.: Examining the Effect of Aural Preparation on Second Grade Student
Published by UST Research Online, 2018

36
Research & Issues in Music Education, Vol. 14 [2018], No. 1, Art. 4
https://ir.stthomas.edu/rime/vol14/iss1/4

APPENDIX D
Calibration of the Items for the Rhythm Portion of the IMMA Assessment
Item
Number
Observed
Average Measure
Standard
Error
Infit
MSE
Std.
Infit
Outfit
MSE
Std.
Outfit
35 0.42 1.32 0.20 1.19 3.37 1.22 3.07
27 0.42 1.32 0.20 1.14 2.49 1.15 2.22
14 0.46 1.13 0.19 1.08 1.55 1.11 1.82
20 0.54 0.83 0.19 0.95 -0.95 0.96 -0.72
7 0.54 0.80 0.20 1.14 2.60 1.16 2.66
26 0.57 0.68 0.20 1.07 1.25 1.07 1.14
19 0.60 0.57 0.20 1.07 1.22 1.08 1.21
30 0.60 0.57 0.20 1.05 0.76 1.04 0.58
37 0.60 0.55 0.20 1.01 0.22 1.02 0.27
34 0.61 0.53 0.20 1.11 1.77 1.11 1.55
29 0.61 0.49 0.20 1.21 3.04 1.23 2.95
21 0.64 0.37 0.20 0.91 -1.33 0.88 -1.53
24 0.66 0.29 0.20 1.00 -0.03 0.98 -0.18
36 0.66 0.27 0.21 1.00 -0.02 0.99 -0.07
32 0.68 0.20 0.21 0.95 -0.55 0.94 -0.62
31 0.69 0.11 0.21 1.16 1.72 1.16 1.50
8 0.69 0.11 0.21 1.09 1.06 1.11 1.01
11 0.70 0.07 0.21 0.92 -0.85 0.92 -0.68
5 0.70 0.07 0.21 0.94 -0.59 0.90 -0.88
4 0.74 -0.11 0.22 0.99 -0.05 1.01 0.10
9 0.74 -0.11 0.22 1.05 0.50 0.99 -0.01
25 0.74 -0.11 0.22 0.98 -0.12 0.97 -0.20
6 0.74 -0.11 0.22 0.92 -0.70 0.90 -0.79
33 0.74 -0.11 0.22 0.93 -0.60 0.88 -0.93
15 0.75 -0.16 0.22 0.93 -0.60 0.92 -0.57
13 0.75 -0.21 0.22 1.03 0.26 0.99 -0.04
16 0.75 -0.21 0.22 0.83 -1.51 0.75 -1.90
39 0.76 -0.24 0.23 0.94 -0.52 0.95 -0.28
28 0.76 -0.26 0.23 1.05 0.48 1.05 0.38
23 0.78 -0.37 0.23 0.87 -1.04 0.76 -1.62
2 0.80 -0.48 0.24 0.93 -0.47 0.89 -0.65
1 0.81 -0.54 0.24 0.98 -0.11 1.02 0.15
38 0.81 -0.58 0.25 0.92 -0.53 0.97 -0.11
18 0.83 -0.73 0.26 1.00 0.03 0.93 -0.29
17 0.83 -0.73 0.26 0.89 -0.67 0.87 -0.63
40 0.84 -0.77 0.26 0.88 -0.70 0.74 -1.30
10 0.87 -1.02 0.28 0.89 -0.53 0.76 -0.99
22 0.87 -1.02 0.28 0.86 -0.67 0.67 -1.45
37
Hurley et al.: Examining the Effect of Aural Preparation on Second Grade Student
Published by UST Research Online, 2018

12 0.88 -1.10 0.29 0.90 -0.43 0.79 -0.79
3 0.89 -1.28 0.31 0.95 -0.16 0.77 -0.80
Mean 0.70 0.00 0.22 0.99 0.21 0.97 0.06
SD 0.12 0.65 0.03 0.10 1.21 0.14 1.26 Note. The items are presented in Measure order, from high to low.
38
Research & Issues in Music Education, Vol. 14 [2018], No. 1, Art. 4
https://ir.stthomas.edu/rime/vol14/iss1/4

APPENDIX E
Calibration of the Students for the Rhythm Portion of the IMMA Assessment
Student
Number
Observed
Average Measure
Standard
Error
Infit
MSE
Standard
Infit
Outfit
MSE
Standard
Outfit
79 0.90 2.35 0.54 0.87 -0.20 0.82 -0.21
30 0.85 1.86 0.45 0.96 -0.03 0.89 -0.16
34 0.85 1.86 0.45 1.00 0.10 0.93 -0.04
42 0.85 1.86 0.45 0.98 0.02 0.87 -0.23
51 0.85 1.86 0.45 0.87 -0.35 0.65 -0.90
97 0.85 1.86 0.45 0.85 -0.43 0.67 -0.84
98 0.85 1.86 0.45 0.83 -0.52 0.60 -1.09
2 0.85 1.86 0.45 1.05 0.25 1.10 0.38
14 0.85 1.86 0.45 0.78 -0.70 0.61 -1.03
33 0.82 1.67 0.43 0.83 -0.62 0.65 -1.05
37 0.82 1.67 0.43 1.00 0.08 0.92 -0.13
38 0.82 1.67 0.43 1.03 0.19 0.99 0.09
46 0.82 1.67 0.43 1.05 0.29 1.06 0.28
109 0.82 1.67 0.43 0.89 -0.36 0.77 -0.62
15 0.82 1.67 0.43 0.85 -0.53 0.67 -0.97
17 0.82 1.67 0.43 0.80 -0.72 0.65 -1.06
122 0.82 1.67 0.43 0.98 0.00 0.97 0.03
25 0.80 1.49 0.41 1.15 0.69 1.37 1.20
27 0.80 1.49 0.41 0.98 -0.01 0.86 -0.37
36 0.80 1.49 0.41 1.00 0.09 0.99 0.07
55 0.80 1.49 0.41 1.00 0.06 0.99 0.07
106 0.80 1.49 0.41 0.89 -0.42 0.79 -0.66
110 0.80 1.49 0.41 1.07 0.37 0.94 -0.09
6 0.80 1.49 0.41 0.75 -1.09 0.61 -1.41
8 0.80 1.49 0.41 0.89 -0.40 0.81 -0.55
73 0.80 1.49 0.41 1.06 0.33 1.16 0.62
75 0.80 1.49 0.41 0.92 -0.29 0.78 -0.67
117 0.80 1.49 0.41 1.04 0.27 1.15 0.58
29 0.77 1.33 0.39 0.88 -0.55 0.91 -0.23
39 0.77 1.33 0.39 0.98 -0.05 0.93 -0.18
63 0.77 1.33 0.39 0.89 -0.47 0.83 -0.58
103 0.77 1.33 0.39 1.04 0.26 1.00 0.08
112 0.77 1.33 0.39 0.97 -0.08 1.06 0.31
3 0.77 1.33 0.39 0.82 -0.84 0.69 -1.22
10 0.77 1.33 0.39 0.90 -0.42 0.86 -0.46
69 0.77 1.33 0.39 0.99 0.01 0.85 -0.49
70 0.77 1.33 0.39 0.96 -0.12 1.01 0.13
76 0.77 1.33 0.39 0.81 -0.94 0.78 -0.80
39
Hurley et al.: Examining the Effect of Aural Preparation on Second Grade Student
Published by UST Research Online, 2018

125 0.77 1.33 0.39 0.91 -0.40 0.78 -0.80
31 0.75 1.19 0.38 1.06 0.36 0.95 -0.13
95 0.75 1.19 0.38 0.96 -0.18 0.87 -0.50
96 0.75 1.19 0.38 1.02 0.14 1.05 0.27
108 0.75 1.19 0.38 0.84 -0.88 0.71 -1.28
19 0.75 1.19 0.38 0.87 -0.70 0.76 -1.01
22 0.75 1.19 0.38 0.95 -0.18 0.86 -0.52
81 0.75 1.19 0.38 0.92 -0.38 0.83 -0.64
83 0.75 1.19 0.38 0.93 -0.32 0.91 -0.31
91 0.75 1.19 0.38 0.98 -0.02 0.97 -0.04
28 0.73 1.05 0.37 1.02 0.16 0.96 -0.11
35 0.73 1.05 0.37 0.85 -0.86 0.77 -1.08
41 0.73 1.05 0.37 0.93 -0.37 0.98 0.00
20 0.73 1.05 0.37 1.01 0.09 1.02 0.15
85 0.73 1.05 0.37 0.81 -1.13 0.73 -1.28
86 0.73 1.05 0.37 0.88 -0.66 0.78 -1.04
89 0.73 1.05 0.37 1.03 0.23 0.92 -0.28
43 0.70 0.92 0.36 0.99 -0.01 1.00 0.07
45 0.70 0.92 0.36 1.12 0.80 1.21 1.05
60 0.70 0.92 0.36 0.76 -1.69 0.69 -1.72
62 0.70 0.92 0.36 1.09 0.66 1.10 0.56
92 0.70 0.92 0.36 1.08 0.55 1.17 0.91
101 0.70 0.92 0.36 1.01 0.10 0.95 -0.18
18 0.70 0.92 0.36 0.87 -0.87 0.81 -0.99
71 0.70 0.92 0.36 0.98 -0.10 0.89 -0.51
78 0.70 0.92 0.36 0.92 -0.47 0.90 -0.48
84 0.70 0.92 0.36 0.85 -0.98 0.78 -1.17
87 0.70 0.92 0.36 0.93 -0.41 1.00 0.07
123 0.70 0.92 0.36 1.06 0.41 1.01 0.13
40 0.68 0.79 0.35 1.02 0.21 0.99 -0.02
50 0.68 0.79 0.35 1.12 0.86 1.11 0.67
56 0.68 0.79 0.35 1.11 0.82 1.19 1.08
67 0.68 0.79 0.35 1.21 1.48 1.35 1.87
104 0.68 0.79 0.35 0.95 -0.33 0.89 -0.59
11 0.68 0.79 0.35 1.19 1.32 1.18 1.01
13 0.68 0.79 0.35 1.12 0.88 1.05 0.32
16 0.68 0.79 0.35 0.86 -1.04 0.83 -0.97
74 0.68 0.79 0.35 0.95 -0.34 0.91 -0.44
82 0.68 0.79 0.35 1.00 0.01 0.97 -0.12
118 0.68 0.79 0.35 1.05 0.40 1.14 0.85
121 0.68 0.79 0.35 0.93 -0.44 0.99 0.00
124 0.68 0.79 0.35 1.07 0.53 1.02 0.16
24 0.65 0.67 0.35 0.90 -0.81 0.86 -0.88
57 0.65 0.67 0.35 0.97 -0.23 0.91 -0.53
40
Research & Issues in Music Education, Vol. 14 [2018], No. 1, Art. 4
https://ir.stthomas.edu/rime/vol14/iss1/4

59 0.65 0.67 0.35 1.00 0.01 1.01 0.12
94 0.65 0.67 0.35 0.91 -0.71 0.93 -0.41
12 0.65 0.67 0.35 0.97 -0.17 0.91 -0.53
72 0.65 0.67 0.35 0.95 -0.38 0.91 -0.55
77 0.65 0.67 0.35 0.92 -0.61 0.89 -0.69
114 0.65 0.67 0.35 0.98 -0.14 0.92 -0.49
23 0.62 0.55 0.34 1.33 2.58 1.45 2.83
64 0.62 0.55 0.34 0.97 -0.26 0.97 -0.18
65 0.62 0.55 0.34 0.92 -0.67 0.91 -0.61
93 0.62 0.55 0.34 0.97 -0.21 0.93 -0.43
100 0.62 0.55 0.34 0.89 -0.92 0.88 -0.86
111 0.62 0.55 0.34 1.02 0.21 0.98 -0.08
7 0.62 0.55 0.34 0.98 -0.17 0.97 -0.16
47 0.60 0.44 0.34 1.04 0.37 1.05 0.44
54 0.60 0.44 0.34 1.34 2.85 1.43 2.94
99 0.60 0.44 0.34 1.16 1.41 1.21 1.53
90 0.60 0.44 0.34 1.03 0.32 0.99 -0.04
26 0.57 0.33 0.33 0.98 -0.21 1.00 0.00
9 0.57 0.33 0.33 0.94 -0.60 0.91 -0.74
58 0.55 0.22 0.33 1.28 2.71 1.32 2.65
66 0.55 0.22 0.33 1.18 1.77 1.21 1.82
120 0.55 0.22 0.33 1.25 2.47 1.29 2.45
44 0.52 0.11 0.33 1.28 2.79 1.33 2.83
107 0.52 0.11 0.33 1.01 0.13 1.04 0.45
5 0.52 0.11 0.33 1.24 2.41 1.26 2.28
49 0.50 0.00 0.33 1.11 1.15 1.14 1.26
1 0.50 0.00 0.33 1.24 2.48 1.28 2.49
115 0.47 -0.11 0.33 1.25 2.56 1.31 2.64
88 0.43 -0.33 0.33 1.13 1.30 1.12 0.96
52 0.40 -0.44 0.34 1.22 1.96 1.24 1.75
61 0.35 -0.67 0.35 1.19 1.45 1.25 1.53
116 0.34 -0.70 0.37 1.13 0.94 1.11 0.66
Mean 0.70 0.98 0.38 0.10 0.14 0.97 0.05
SD 0.11 0.58 0.04 0.13 0.93 0.19 1.01 Note. The items are presented in Measure order, from high to low.
41
Hurley et al.: Examining the Effect of Aural Preparation on Second Grade Student
Published by UST Research Online, 2018

APPENDIX F
Calibration of the Items for the Performance Assessment
Item
Number
Observed
Average Measure
Standard
Error
Infit
MSE
Std.
Infit
Outfit
MSE
Std.
Outfit
8 2.64 1.15 0.05 1.13 1.95 1.11 1.38
9 3.17 0.52 0.05 0.92 -1.22 1.02 0.25
1 3.42 0.22 0.05 1.12 1.78 1.13 1.74
4 3.49 0.13 0.05 0.98 -0.31 0.97 -0.37
7 3.52 0.09 0.05 0.79 -3.34 0.78 -3.24
6 3.63 -0.05 0.05 1.26 3.59 1.38 4.59
3 3.79 -0.27 0.05 0.84 -2.46 0.77 -3.16
5 3.83 -0.33 0.05 0.85 -2.25 0.78 -3.07
2 3.86 -0.36 0.05 0.87 -1.98 0.90 -1.29
10 4.29 -1.10 0.06 1.06 0.80 1.22 2.18
Mean 3.56 0.00 0.05 0.98 -0.34 1.01 -0.10
SD 0.44 0.60 0.00 0.16 2.29 0.21 2.63
Note. The items are presented in Measure order, from high to low.
42
Research & Issues in Music Education, Vol. 14 [2018], No. 1, Art. 4
https://ir.stthomas.edu/rime/vol14/iss1/4
APPENDIX G
Calibration of the Students for the Performance Assessment
Student
Number
Observed
Average Measure
Standard
Error
Infit
MSE
Std.
Infit
Outfit
MSE
Std.
Outfit
72post 4.95 4.44 1.02 1.08 0.40 3.37 1.69
7post 4.90 3.71 0.73 0.86 0.02 0.74 -0.09
22post 4.90 3.71 0.73 1.09 0.36 2.21 1.39
30post 4.90 3.71 0.73 0.83 -0.03 0.60 -0.31
122post 4.90 3.71 0.73 0.85 0.01 0.74 -0.09
6post 4.85 3.27 0.61 0.91 0.04 0.78 -0.14
83post 4.85 3.27 0.61 1.05 0.28 1.21 0.52
24post 4.80 2.94 0.53 1.92 1.57 1.40 0.82
25post 4.80 2.94 0.53 1.00 0.17 1.09 0.34
28post 4.80 2.94 0.53 1.04 0.24 1.15 0.44
75post 4.80 2.94 0.53 0.60 -0.73 0.47 -0.98
98pre 4.75 2.69 0.48 0.67 -0.62 0.69 -0.50
18post 4.75 2.69 0.48 1.31 0.74 1.52 1.06
31post 4.75 2.69 0.48 1.53 1.11 1.15 0.45
38post 4.75 2.69 0.48 0.89 -0.08 0.98 0.13
70post 4.75 2.69 0.48 0.89 -0.07 0.83 -0.17
81post 4.75 2.69 0.48 0.91 -0.02 0.65 -0.61
131post 4.75 2.69 0.48 1.42 0.94 1.44 0.92
136post 4.75 2.69 0.48 0.98 0.13 0.95 0.08
39pre 4.70 2.47 0.44 0.52 -1.14 0.48 -1.21
14post 4.70 2.47 0.44 0.55 -1.02 0.54 -1.00
17post 4.70 2.47 0.44 1.78 1.54 2.22 2.09
65post 4.70 2.47 0.44 0.55 -1.03 0.56 -0.94
73post 4.70 2.47 0.44 1.23 0.62 1.06 0.29
25pre 4.65 2.29 0.42 0.95 0.04 1.16 0.49
20post 4.65 2.29 0.42 1.59 1.28 1.76 1.54
27post 4.65 2.29 0.42 1.02 0.20 1.04 0.24
46post 4.65 2.29 0.42 1.06 0.29 0.98 0.10
69post 4.65 2.29 0.42 0.76 -0.45 0.78 -0.39
123post 4.65 2.29 0.42 0.63 -0.81 0.87 -0.16
128post 4.65 2.29 0.42 0.64 -0.78 0.69 -0.64
72pre 4.60 2.13 0.39 1.23 0.63 1.09 0.34
16post 4.60 2.13 0.39 0.79 -0.37 0.63 -0.85
42post 4.60 2.13 0.39 1.08 0.32 1.19 0.56
55post 4.60 2.13 0.39 0.84 -0.26 0.71 -0.61
61post 4.60 2.13 0.39 1.21 0.59 1.14 0.46
43
Hurley et al.: Examining the Effect of Aural Preparation on Second Grade Student
Published by UST Research Online, 2018

63post 4.60 2.13 0.39 1.18 0.53 1.34 0.85
87post 4.60 2.13 0.39 0.71 -0.60 0.68 -0.71
98post 4.60 2.13 0.39 1.11 0.39 1.11 0.38
115post 4.60 2.13 0.39 0.69 -0.68 0.59 -0.97
87pre 4.55 1.98 0.37 0.77 -0.44 0.80 -0.37
8post 4.55 1.98 0.37 0.88 -0.17 0.94 -0.01
78post 4.55 1.98 0.37 1.31 0.81 1.15 0.49
117post 4.55 1.98 0.37 0.64 -0.84 0.64 -0.85
22pre 4.50 1.85 0.35 0.48 -1.44 0.65 -0.85
58post 4.50 1.85 0.35 1.10 0.37 1.04 0.24
62post 4.50 1.85 0.35 1.09 0.35 1.17 0.54
76post 4.50 1.85 0.35 1.46 1.12 1.36 0.94
79post 4.50 1.85 0.35 0.87 -0.20 0.87 -0.19
114post 4.50 1.85 0.35 1.05 0.26 1.26 0.73
135post 4.50 1.85 0.35 0.71 -0.65 0.71 -0.66
85pre 4.45 1.73 0.34 0.79 -0.44 0.95 0.01
93pre 4.45 1.73 0.34 0.66 -0.83 0.72 -0.65
36post 4.45 1.73 0.34 1.17 0.54 1.20 0.61
125post 4.45 1.73 0.34 1.27 0.76 1.25 0.71
127post 4.45 1.73 0.34 0.67 -0.78 0.83 -0.32
89pre 4.40 1.62 0.33 0.42 -1.78 0.49 -1.51
37post 4.40 1.62 0.33 1.45 1.12 1.61 1.46
39post 4.40 1.62 0.33 1.02 0.18 1.07 0.30
74post 4.40 1.62 0.33 1.22 0.65 1.12 0.42
100post 4.40 1.62 0.33 2.09 2.22 1.32 0.87
132post 4.40 1.62 0.33 1.78 1.73 1.67 1.56
23pre 4.35 1.51 0.32 1.38 1.00 1.26 0.75
5post 4.35 1.51 0.32 1.45 1.15 1.01 0.15
29post 4.35 1.51 0.32 2.11 2.30 1.90 1.99
45post 4.35 1.51 0.32 0.56 -1.22 0.71 -0.71
85post 4.35 1.51 0.32 1.84 1.85 1.95 2.07
134post 4.35 1.51 0.32 0.49 -1.51 0.68 -0.82
2post 4.30 1.42 0.31 0.86 -0.26 0.92 -0.10
40post 4.30 1.42 0.31 0.40 -1.90 0.50 -1.49
103post 4.30 1.42 0.31 1.32 0.88 1.27 0.78
111post 4.30 1.42 0.31 0.80 -0.43 0.91 -0.12
121post 4.30 1.42 0.31 3.07 3.66 2.95 3.54
124post 4.30 1.42 0.31 0.51 -1.44 0.67 -0.86
74pre 4.25 1.33 0.30 0.53 -1.38 0.62 -1.06
33post 4.25 1.33 0.30 2.17 2.46 1.98 2.16
129post 4.25 1.33 0.30 0.71 -0.71 0.82 -0.37
75pre 4.20 1.24 0.29 1.36 0.98 1.29 0.84
44
Research & Issues in Music Education, Vol. 14 [2018], No. 1, Art. 4
https://ir.stthomas.edu/rime/vol14/iss1/4

3post 4.20 1.24 0.29 0.64 -0.99 0.69 -0.82
95post 4.20 1.24 0.29 0.53 -1.39 0.56 -1.27
107post 4.20 1.24 0.29 0.84 -0.34 0.81 -0.43
6pre 4.15 1.16 0.28 0.51 -1.50 0.59 -1.20
81pre 4.15 1.16 0.28 1.06 0.30 1.02 0.17
97pre 4.15 1.16 0.28 0.71 -0.75 0.78 -0.53
61pre 4.10 1.08 0.27 0.45 -1.83 0.47 -1.68
71pre 4.10 1.08 0.27 0.70 -0.81 0.74 -0.66
10post 4.10 1.08 0.27 0.79 -0.50 0.90 -0.16
12post 4.10 1.08 0.27 1.12 0.43 1.05 0.26
23post 4.10 1.08 0.27 0.61 -1.15 0.68 -0.87
43post 4.10 1.08 0.27 0.36 -2.26 0.41 -2.00
57post 4.10 1.08 0.27 1.76 1.84 1.62 1.55
71post 4.10 1.08 0.27 1.12 0.44 0.86 -0.27
84post 4.10 1.08 0.27 0.64 -1.01 0.74 -0.67
116post 4.10 1.08 0.27 1.22 0.70 1.12 0.43
3pre 4.05 1.01 0.27 0.99 0.08 1.03 0.20
41pre 4.05 1.01 0.27 2.40 2.97 2.49 3.06
9post 4.05 1.01 0.27 1.28 0.85 1.21 0.66
89post 4.05 1.01 0.27 1.42 1.15 1.49 1.30
57pre 4.00 0.94 0.26 1.43 1.19 1.37 1.05
95pre 4.00 0.94 0.26 1.19 0.64 1.13 0.48
19post 4.00 0.94 0.26 1.04 0.24 0.97 0.04
108post 4.00 0.94 0.26 0.49 -1.71 0.48 -1.67
109post 4.00 0.94 0.26 0.37 -2.27 0.37 -2.21
120post 4.00 0.94 0.26 1.59 1.56 1.33 0.96
20pre 3.95 0.87 0.26 0.52 -1.57 0.50 -1.64
63pre 3.95 0.87 0.26 0.48 -1.77 0.51 -1.57
78pre 3.95 0.87 0.26 0.77 -0.60 0.75 -0.66
35post 3.95 0.87 0.26 0.55 -1.45 0.57 -1.30
49post 3.95 0.87 0.26 0.82 -0.43 0.87 -0.28
130post 3.95 0.87 0.26 0.50 -1.68 0.52 -1.52
83pre 3.90 0.80 0.25 0.58 -1.34 0.63 -1.09
64post 3.90 0.80 0.25 1.05 0.25 0.93 -0.08
77post 3.90 0.80 0.25 0.38 -2.29 0.44 -1.90
93post 3.90 0.80 0.25 1.30 0.92 1.43 1.20
58pre 3.85 0.74 0.25 1.04 0.23 0.98 0.05
59pre 3.85 0.74 0.25 0.33 -2.65 0.34 -2.47
65pre 3.85 0.74 0.25 0.53 -1.57 0.52 -1.56
92pre 3.85 0.74 0.25 1.02 0.17 0.82 -0.45
41post 3.85 0.74 0.25 1.46 1.31 1.55 1.46
112post 3.85 0.74 0.25 0.37 -2.41 0.40 -2.17
45
Hurley et al.: Examining the Effect of Aural Preparation on Second Grade Student
Published by UST Research Online, 2018

126post 3.85 0.74 0.25 0.67 -0.98 0.66 -0.99
139post 3.85 0.74 0.25 1.48 1.35 1.68 1.75
50post 3.80 0.68 0.24 0.44 -2.03 0.41 -2.15
67post 3.80 0.68 0.24 0.47 -1.91 0.50 -1.70
91post 3.80 0.68 0.24 1.34 1.04 1.29 0.89
114pre 3.75 0.62 0.24 0.68 -1.01 0.72 -0.81
11post 3.75 0.62 0.24 1.22 0.74 1.13 0.47
54post 3.75 0.62 0.24 1.10 0.40 1.04 0.22
66post 3.75 0.62 0.24 1.16 0.56 1.06 0.30
43pre 3.70 0.56 0.24 0.72 -0.84 0.62 -1.19
64pre 3.70 0.56 0.24 0.78 -0.64 0.77 -0.63
60post 3.70 0.56 0.24 1.09 0.38 1.02 0.18
86post 3.70 0.56 0.24 0.54 -1.61 0.51 -1.68
88post 3.70 0.56 0.24 2.24 2.97 1.98 2.39
90post 3.70 0.56 0.24 0.60 -1.35 0.59 -1.34
110post 3.70 0.56 0.24 0.59 -1.39 0.53 -1.61
24pre 3.65 0.51 0.23 1.20 0.69 1.12 0.45
54pre 3.65 0.51 0.23 0.97 0.01 0.92 -0.15
104post 3.65 0.51 0.23 0.77 -0.66 0.71 -0.88
14pre 3.60 0.45 0.23 0.51 -1.79 0.54 -1.61
17pre 3.60 0.45 0.23 1.06 0.29 1.12 0.47
97post 3.60 0.45 0.23 0.85 -0.38 0.83 -0.45
99post 3.60 0.45 0.23 0.48 -1.94 0.64 -1.14
101post 3.60 0.45 0.23 0.81 -0.55 0.76 -0.68
100pre 3.55 0.40 0.23 0.38 -2.55 0.37 -2.49
116pre 3.55 0.40 0.23 1.10 0.41 1.08 0.34
130pre 3.55 0.40 0.23 0.66 -1.13 0.73 -0.84
11pre 3.50 0.35 0.23 1.00 0.12 0.90 -0.22
13post 3.50 0.35 0.23 0.52 -1.79 0.49 -1.91
38pre 3.45 0.30 0.22 0.94 -0.09 0.94 -0.09
15post 3.45 0.30 0.22 2.52 3.67 2.71 3.87
92post 3.45 0.30 0.22 0.48 -2.02 0.49 -1.94
18pre 3.40 0.25 0.22 1.03 0.20 0.99 0.07
55pre 3.40 0.25 0.22 0.34 -2.95 0.31 -3.05
66pre 3.40 0.25 0.22 0.64 -1.29 0.63 -1.29
34post 3.40 0.25 0.22 0.45 -2.26 0.45 -2.14
56post 3.40 0.25 0.22 0.66 -1.17 0.64 -1.24
59post 3.40 0.25 0.22 0.43 -2.37 0.43 -2.29
35pre 3.35 0.20 0.22 1.24 0.85 1.20 0.73
112pre 3.35 0.20 0.22 2.98 4.55 3.89 5.72
94post 3.35 0.20 0.22 0.55 -1.76 0.62 -1.36
47post 3.30 0.15 0.22 0.39 -2.68 0.39 -2.57
46
Research & Issues in Music Education, Vol. 14 [2018], No. 1, Art. 4
https://ir.stthomas.edu/rime/vol14/iss1/4

51post 3.30 0.15 0.22 0.84 -0.48 0.81 -0.56
28pre 3.25 0.10 0.22 1.65 1.99 2.24 3.21
47pre 3.25 0.10 0.22 0.34 -3.05 0.32 -3.05
117pre 3.25 0.10 0.22 1.50 1.60 1.48 1.49
128pre 3.25 0.10 0.22 1.03 0.21 1.09 0.38
15pre 3.16 0.07 0.22 1.67 2.02 1.68 2.01
27pre 3.20 0.06 0.21 1.97 2.78 1.91 2.54
108pre 3.20 0.06 0.21 1.87 2.55 1.86 2.44
37pre 3.15 0.01 0.21 1.11 0.48 1.19 0.71
60pre 3.15 0.01 0.21 0.74 -0.94 0.67 -1.21
1post 3.15 0.01 0.21 0.87 -0.41 0.84 -0.48
16pre 3.10 -0.03 0.21 1.19 0.75 1.20 0.75
30pre 3.10 -0.03 0.21 0.39 -2.80 0.40 -2.64
44post 3.10 -0.03 0.21 0.95 -0.08 0.88 -0.33
118post 3.10 -0.03 0.21 0.98 0.01 0.95 -0.07
29pre 3.05 -0.08 0.21 1.05 0.27 1.05 0.28
73pre 3.05 -0.08 0.21 1.28 1.04 1.22 0.83
127pre 3.05 -0.08 0.21 0.86 -0.45 0.76 -0.81
82post 3.05 -0.08 0.21 0.25 -3.97 0.25 -3.77
106post 3.05 -0.08 0.21 1.31 1.14 1.28 1.01
7pre 3.00 -0.12 0.21 2.85 4.73 3.08 4.91
134pre 3.00 -0.12 0.21 0.90 -0.28 0.86 -0.42
1pre 2.95 -0.17 0.21 1.17 0.70 1.06 0.30
40pre 2.95 -0.17 0.21 1.32 1.18 1.33 1.15
52post 2.95 -0.17 0.21 0.67 -1.32 0.67 -1.25
5pre 2.90 -0.21 0.21 1.26 0.99 1.17 0.66
49pre 2.90 -0.21 0.21 0.79 -0.77 0.78 -0.75
94pre 2.90 -0.21 0.21 1.50 1.72 1.48 1.60
8pre 2.85 -0.25 0.21 1.04 0.23 0.97 -0.01
110pre 2.85 -0.25 0.21 0.79 -0.76 0.75 -0.88
124pre 2.85 -0.25 0.21 0.46 -2.49 0.44 -2.49
46pre 2.80 -0.30 0.21 1.57 1.93 1.56 1.82
123pre 2.70 -0.38 0.21 0.55 -1.98 0.70 -1.11
2pre 2.65 -0.43 0.21 1.07 0.36 0.98 0.02
111pre 2.65 -0.43 0.21 0.99 0.03 1.06 0.32
76pre 2.60 -0.47 0.21 0.73 -1.08 0.68 -1.19
99pre 2.60 -0.47 0.21 1.02 0.16 0.95 -0.09
125pre 2.60 -0.47 0.21 2.26 3.70 2.37 3.63
96post 2.55 -0.51 0.21 0.89 -0.35 0.82 -0.60
12pre 2.50 -0.56 0.21 0.67 -1.34 0.64 -1.35
106pre 2.50 -0.56 0.21 0.63 -1.58 0.62 -1.44
121pre 2.50 -0.56 0.21 1.09 0.42 1.08 0.35
84pre 2.45 -0.60 0.21 1.27 1.04 1.20 0.76
132pre 2.45 -0.60 0.21 1.63 2.11 2.45 3.69
47
Hurley et al.: Examining the Effect of Aural Preparation on Second Grade Student
Published by UST Research Online, 2018

33pre 2.40 -0.65 0.21 1.04 0.23 0.99 0.05
26post 2.40 -0.65 0.21 0.29 -3.75 0.29 -3.38
67pre 2.35 -0.69 0.21 0.90 -0.31 0.78 -0.72
86pre 2.35 -0.69 0.21 0.63 -1.51 0.65 -1.26
109pre 2.35 -0.69 0.21 0.90 -0.28 1.48 1.49
118pre 2.35 -0.69 0.21 1.10 0.46 1.05 0.28
9pre 2.30 -0.74 0.22 1.42 1.47 1.36 1.17
50pre 2.30 -0.74 0.22 0.75 -0.91 1.37 1.18
96pre 2.30 -0.74 0.22 0.92 -0.23 0.85 -0.44
122pre 2.30 -0.74 0.22 1.55 1.84 1.54 1.63
42pre 2.25 -0.79 0.22 0.77 -0.82 0.99 0.08
51pre 2.25 -0.79 0.22 1.30 1.10 2.16 2.94
62pre 2.25 -0.79 0.22 0.71 -1.10 0.69 -1.03
91pre 2.25 -0.79 0.22 0.52 -2.06 0.52 -1.80
120pre 2.25 -0.79 0.22 0.51 -2.10 0.49 -1.93
131pre 2.25 -0.79 0.22 1.10 0.43 1.04 0.22
135pre 2.25 -0.79 0.22 0.90 -0.29 0.84 -0.44
45pre 2.20 -0.83 0.22 0.98 0.02 0.94 -0.09
77pre 2.20 -0.83 0.22 0.44 -2.51 0.44 -2.17
79pre 2.20 -0.83 0.22 0.91 -0.24 0.83 -0.45
31pre 2.10 -0.93 0.22 0.97 -0.03 0.88 -0.26
69pre 2.00 -1.04 0.23 0.76 -0.78 0.72 -0.78
70pre 2.00 -1.04 0.23 0.65 -1.23 0.64 -1.09
56pre 1.95 -1.09 0.24 0.51 -1.85 0.50 -1.60
90pre 1.95 -1.09 0.24 1.46 1.41 1.37 1.04
126pre 1.90 -1.15 0.24 0.68 -1.03 0.75 -0.63
26pre 1.85 -1.20 0.24 0.91 -0.19 1.18 0.58
88pre 1.80 -1.27 0.25 0.88 -0.27 0.88 -0.17
103pre 1.80 -1.27 0.25 0.51 -1.68 0.60 -1.03
139pre 1.80 -1.27 0.25 0.73 -0.79 0.95 0.00
10pre 1.75 -1.33 0.26 0.74 -0.72 0.68 -0.75
19pre 1.75 -1.33 0.26 1.12 0.45 1.10 0.38
34pre 1.75 -1.33 0.26 0.88 -0.24 0.89 -0.15
44pre 1.75 -1.33 0.26 0.72 -0.80 0.89 -0.14
82pre 1.75 -1.33 0.26 1.38 1.11 1.22 0.64
101pre 1.70 -1.40 0.26 0.64 -1.06 0.58 -1.03
115pre 1.70 -1.40 0.26 1.38 1.06 1.31 0.80
52pre 1.65 -1.47 0.27 1.60 1.49 1.27 0.70
129pre 1.65 -1.47 0.27 0.99 0.10 0.91 -0.06
136pre 1.60 -1.54 0.28 1.24 0.71 0.94 0.02
104pre 1.55 -1.62 0.29 1.04 0.24 1.16 0.47
13pre 1.35 -2.03 0.36 0.88 -0.09 1.06 0.30
36pre 1.25 -2.33 0.42 1.34 0.71 0.57 -0.51
107pre 1.15 -2.78 0.54 1.45 0.78 1.62 0.90
48
Research & Issues in Music Education, Vol. 14 [2018], No. 1, Art. 4
https://ir.stthomas.edu/rime/vol14/iss1/4

Mean 3.57 0.68 0.29 0.99 -0.13 1.01 -0.08
SD 0.95 1.27 0.11 0.47 1.38 0.53 1.36Note. The items are presented in Measure order, from high to low. Pre refers to pretest and post refers to posttest.
49
Hurley et al.: Examining the Effect of Aural Preparation on Second Grade Student
Published by UST Research Online, 2018

APPENDIX H
Calibration of the Raters for the Performance Assessment
Rater
Number
Observed
Average Measure
Standard
Error
Infit
MSE
Std.
Infit
Outfit
MSE
Std.
Outfit
2 3.56 0.01 0.02 0.88 -4.33 0.96 -1.06
1 3.57 -0.01 0.02 1.09 2.97 1.05 1.42
Mean 3.57 0.00 0.02 0.99 -0.68 1.01 0.18
SD 0.00 0.01 0.00 0.15 5.16 0.06 1.75 Note. The items are presented in Measure order, from high to low.
50
Research & Issues in Music Education, Vol. 14 [2018], No. 1, Art. 4
https://ir.stthomas.edu/rime/vol14/iss1/4

APPENDIX I
Calibration of the Items for the Dictation Assessment
Item
Number
Observed
Average Measure
Standard
Error
Infit
MSE
Std.
Infit
Outfit
MSE
Std.
Outfit
1 3.95 0.92 0.08 1.20 1.86 1.25 2.09
6 4.24 0.45 0.08 0.95 -0.48 0.93 -0.52
9 4.29 0.36 0.08 1.34 2.89 1.38 2.49
8 4.32 0.32 0.09 0.99 -0.02 0.96 -0.23
7 4.40 0.15 0.09 0.94 -0.48 0.98 -0.08
3 4.50 -0.05 0.09 0.96 -0.28 0.87 -0.74
2 4.54 -0.14 0.10 0.80 -1.69 0.91 -0.45
5 4.64 -0.39 0.11 0.80 -1.50 0.60 -2.21
10 4.71 -0.60 0.11 1.31 1.89 1.08 0.42
4 4.82 -1.03 0.14 1.42 2.03 0.63 -1.42
Mean 4.44 0.00 0.10 1.07 0.42 0.96 -0.07
SD 0.26 0.57 0.02 0.23 1.61 0.24 1.44Note. The items are presented in Measure order, from high to low.
51
Hurley et al.: Examining the Effect of Aural Preparation on Second Grade Student
Published by UST Research Online, 2018

APPENDIX J
Calibration of the Students for the Dictation Assessment
Student
Number
Observed
Average Measure
Standard
Error
Infit
MSE
Std.
Infit
Outfit
MSE
Std.
Outfit
6pre 5.00 4.19 1.77 1.00 0.00 1.00 0.00
17pre 5.00 4.19 1.77 1.00 0.00 1.00 0.00
20pre 5.00 4.19 1.77 1.00 0.00 1.00 0.00
22pre 5.00 4.19 1.77 1.00 0.00 1.00 0.00
25pre 5.00 4.19 1.77 1.00 0.00 1.00 0.00
28pre 5.00 4.19 1.77 1.00 0.00 1.00 0.00
29pre 5.00 4.19 1.77 1.00 0.00 1.00 0.00
30pre 5.00 4.19 1.77 1.00 0.00 1.00 0.00
33pre 5.00 4.19 1.77 1.00 0.00 1.00 0.00
37pre 5.00 4.19 1.77 1.00 0.00 1.00 0.00
39pre 5.00 4.19 1.77 1.00 0.00 1.00 0.00
46pre 5.00 4.19 1.77 1.00 0.00 1.00 0.00
70pre 5.00 4.19 1.77 1.00 0.00 1.00 0.00
95pre 5.00 4.19 1.77 1.00 0.00 1.00 0.00
2post 5.00 4.19 1.77 1.00 0.00 1.00 0.00
3post 5.00 4.19 1.77 1.00 0.00 1.00 0.00
6post 5.00 4.19 1.77 1.00 0.00 1.00 0.00
8post 5.00 4.19 1.77 1.00 0.00 1.00 0.00
14post 5.00 4.19 1.77 1.00 0.00 1.00 0.00
16post 5.00 4.19 1.77 1.00 0.00 1.00 0.00
17post 5.00 4.19 1.77 1.00 0.00 1.00 0.00
18post 5.00 4.19 1.77 1.00 0.00 1.00 0.00
20post 5.00 4.19 1.77 1.00 0.00 1.00 0.00
22post 5.00 4.19 1.77 1.00 0.00 1.00 0.00
23post 5.00 4.19 1.77 1.00 0.00 1.00 0.00
24post 5.00 4.19 1.77 1.00 0.00 1.00 0.00
25post 5.00 4.19 1.77 1.00 0.00 1.00 0.00
27post 5.00 4.19 1.77 1.00 0.00 1.00 0.00
28post 5.00 4.19 1.77 1.00 0.00 1.00 0.00
29post 5.00 4.19 1.77 1.00 0.00 1.00 0.00
30post 5.00 4.19 1.77 1.00 0.00 1.00 0.00
31post 5.00 4.19 1.77 1.00 0.00 1.00 0.00
33post 5.00 4.19 1.77 1.00 0.00 1.00 0.00
36post 5.00 4.19 1.77 1.00 0.00 1.00 0.00
37post 5.00 4.19 1.77 1.00 0.00 1.00 0.00
38post 5.00 4.19 1.77 1.00 0.00 1.00 0.00
39post 5.00 4.19 1.77 1.00 0.00 1.00 0.00
40post 5.00 4.19 1.77 1.00 0.00 1.00 0.00
52
Research & Issues in Music Education, Vol. 14 [2018], No. 1, Art. 4
https://ir.stthomas.edu/rime/vol14/iss1/4

41post 5.00 4.19 1.77 1.00 0.00 1.00 0.00
42post 5.00 4.19 1.77 1.00 0.00 1.00 0.00
44post 5.00 4.19 1.77 1.00 0.00 1.00 0.00
45post 5.00 4.19 1.77 1.00 0.00 1.00 0.00
46post 5.00 4.19 1.77 1.00 0.00 1.00 0.00
50post 5.00 4.19 1.77 1.00 0.00 1.00 0.00
51post 5.00 4.19 1.77 1.00 0.00 1.00 0.00
54post 5.00 4.19 1.77 1.00 0.00 1.00 0.00
57post 5.00 4.19 1.77 1.00 0.00 1.00 0.00
61post 5.00 4.19 1.77 1.00 0.00 1.00 0.00
62post 5.00 4.19 1.77 1.00 0.00 1.00 0.00
63post 5.00 4.19 1.77 1.00 0.00 1.00 0.00
65post 5.00 4.19 1.77 1.00 0.00 1.00 0.00
66post 5.00 4.19 1.77 1.00 0.00 1.00 0.00
70post 5.00 4.19 1.77 1.00 0.00 1.00 0.00
71post 5.00 4.19 1.77 1.00 0.00 1.00 0.00
73post 5.00 4.19 1.77 1.00 0.00 1.00 0.00
75post 5.00 4.19 1.77 1.00 0.00 1.00 0.00
76post 5.00 4.19 1.77 1.00 0.00 1.00 0.00
78post 5.00 4.19 1.77 1.00 0.00 1.00 0.00
79post 5.00 4.19 1.77 1.00 0.00 1.00 0.00
81post 5.00 4.19 1.77 1.00 0.00 1.00 0.00
83post 5.00 4.19 1.77 1.00 0.00 1.00 0.00
85post 5.00 4.19 1.77 1.00 0.00 1.00 0.00
87post 5.00 4.19 1.77 1.00 0.00 1.00 0.00
89post 5.00 4.19 1.77 1.00 0.00 1.00 0.00
93post 5.00 4.19 1.77 1.00 0.00 1.00 0.00
95post 5.00 4.19 1.77 1.00 0.00 1.00 0.00
97post 5.00 4.19 1.77 1.00 0.00 1.00 0.00
98post 5.00 4.19 1.77 1.00 0.00 1.00 0.00
104post 5.00 4.19 1.77 1.00 0.00 1.00 0.00
108post 5.00 4.19 1.77 1.00 0.00 1.00 0.00
109post 5.00 4.19 1.77 1.00 0.00 1.00 0.00
112post 5.00 4.19 1.77 1.00 0.00 1.00 0.00
117post 5.00 4.19 1.77 1.00 0.00 1.00 0.00
120post 5.00 4.19 1.77 1.00 0.00 1.00 0.00
121post 5.00 4.19 1.77 1.00 0.00 1.00 0.00
123post 5.00 4.19 1.77 1.00 0.00 1.00 0.00
124post 5.00 4.19 1.77 1.00 0.00 1.00 0.00
125post 5.00 4.19 1.77 1.00 0.00 1.00 0.00
127post 5.00 4.19 1.77 1.00 0.00 1.00 0.00
129post 5.00 4.19 1.77 1.00 0.00 1.00 0.00
130post 5.00 4.19 1.77 1.00 0.00 1.00 0.00
131post 5.00 4.19 1.77 1.00 0.00 1.00 0.00
53
Hurley et al.: Examining the Effect of Aural Preparation on Second Grade Student
Published by UST Research Online, 2018

132post 5.00 4.19 1.77 1.00 0.00 1.00 0.00
135post 5.00 4.19 1.77 1.00 0.00 1.00 0.00
139post 5.00 4.19 1.77 1.00 0.00 1.00 0.00
23pre 4.90 3.09 0.94 0.86 0.31 1.06 0.52
27pre 4.90 3.09 0.94 0.57 0.03 0.27 -0.26
40pre 4.90 3.09 0.94 0.87 0.32 1.17 0.59
42pre 4.90 3.09 0.94 0.57 0.03 0.27 -0.26
117pre 4.90 3.09 0.94 0.57 0.03 0.27 -0.26
127pre 4.90 3.09 0.94 0.57 0.03 0.27 -0.26
35post 4.90 3.09 0.94 0.78 0.23 0.61 0.16
47post 4.90 3.09 0.94 0.78 0.23 0.61 0.16
59post 4.90 3.09 0.94 0.57 0.03 0.27 -0.26
74post 4.90 3.09 0.94 0.82 0.28 0.81 0.34
101post 4.90 3.09 0.94 0.57 0.03 0.27 -0.26
136post 4.90 3.09 0.94 0.57 0.03 0.27 -0.26
3pre 4.80 2.50 0.65 1.09 0.41 0.51 -0.19
14pre 4.80 2.50 0.65 1.46 0.74 1.02 0.38
31pre 4.80 2.50 0.65 1.51 0.78 1.16 0.50
36pre 4.80 2.50 0.65 1.09 0.41 0.51 -0.19
63pre 4.80 2.50 0.65 0.42 -0.50 0.30 -0.56
85pre 4.80 2.50 0.65 1.60 0.86 1.56 0.80
15post 4.80 2.50 0.65 0.53 -0.31 0.56 -0.13
77post 4.80 2.50 0.65 0.50 -0.37 0.43 -0.32
82post 4.80 2.50 0.65 0.59 -0.21 1.08 0.43
107post 4.80 2.50 0.65 0.54 -0.29 0.62 -0.05
110post 4.80 2.50 0.65 0.50 -0.37 0.43 -0.32
111post 4.80 2.50 0.65 1.46 0.74 1.02 0.38
116post 4.80 2.50 0.65 1.53 0.80 1.24 0.56
122post 4.80 2.50 0.65 1.09 0.41 0.51 -0.19
61pre 4.70 2.15 0.53 1.19 0.49 1.08 0.38
79pre 4.70 2.15 0.53 0.80 -0.04 0.58 -0.26
120pre 4.70 2.15 0.53 0.72 -0.18 0.43 -0.51
121pre 4.70 2.15 0.53 1.50 0.83 2.97 1.76
7post 4.70 2.15 0.53 1.65 0.98 0.80 0.07
10post 4.70 2.15 0.53 1.65 0.98 0.80 0.07
34post 4.70 2.15 0.53 0.75 -0.13 0.75 -0.01
43post 4.70 2.15 0.53 1.13 0.42 0.86 0.14
58post 4.70 2.15 0.53 2.55 1.72 3.37 1.96
84post 4.70 2.15 0.53 1.10 0.37 0.82 0.09
94post 4.70 2.15 0.53 0.94 0.17 0.78 0.04
100post 4.70 2.15 0.53 1.12 0.40 0.87 0.15
128post 4.70 2.15 0.53 0.72 -0.18 0.43 -0.51
16pre 4.60 1.91 0.47 0.68 -0.36 0.59 -0.35
18pre 4.60 1.91 0.47 1.02 0.25 0.86 0.08
54
Research & Issues in Music Education, Vol. 14 [2018], No. 1, Art. 4
https://ir.stthomas.edu/rime/vol14/iss1/4

41pre 4.60 1.91 0.47 3.05 2.33 2.30 1.49
66pre 4.60 1.91 0.47 0.76 -0.20 0.74 -0.11
69pre 4.60 1.91 0.47 0.74 -0.24 0.64 -0.26
72pre 4.60 1.91 0.47 0.74 -0.24 0.62 -0.30
87pre 4.60 1.91 0.47 0.74 -0.24 0.64 -0.26
108pre 4.60 1.91 0.47 0.90 0.05 1.11 0.40
116pre 4.60 1.91 0.47 1.29 0.63 0.90 0.13
132pre 4.60 1.91 0.47 1.69 1.11 1.94 1.20
69post 4.60 1.91 0.47 0.74 -0.24 0.62 -0.30
86post 4.60 1.91 0.47 1.55 0.96 1.23 0.53
103post 4.60 1.91 0.47 1.02 0.25 0.86 0.08
114post 4.60 1.91 0.47 1.36 0.73 1.11 0.39
118post 4.60 1.91 0.47 0.92 0.09 0.68 -0.20
2pre 4.50 1.71 0.42 1.30 0.67 0.95 0.16
8pre 4.50 1.71 0.42 1.98 1.55 1.99 1.34
24pre 4.50 1.71 0.42 0.79 -0.22 0.65 -0.34
35pre 4.50 1.71 0.42 1.23 0.56 1.02 0.26
51pre 4.50 1.71 0.42 2.08 1.65 2.46 1.73
81pre 4.50 1.71 0.42 1.22 0.55 0.84 -0.02
83pre 4.50 1.71 0.42 0.90 0.01 0.61 -0.42
98pre 4.50 1.71 0.42 1.31 0.69 0.96 0.18
104pre 4.50 1.71 0.42 0.67 -0.47 0.52 -0.60
109pre 4.50 1.71 0.42 0.61 -0.62 0.74 -0.17
118pre 4.50 1.71 0.42 0.78 -0.23 0.62 -0.40
135pre 4.50 1.71 0.42 0.94 0.09 0.65 -0.35
92post 4.50 1.71 0.42 1.25 0.60 1.03 0.28
106post 4.50 1.71 0.42 2.45 2.04 1.85 1.21
19pre 4.40 1.55 0.39 0.59 -0.78 0.58 -0.57
38pre 4.40 1.55 0.39 0.35 -1.53 0.32 -1.28
78pre 4.40 1.55 0.39 0.97 0.12 0.72 -0.29
89pre 4.40 1.55 0.39 1.01 0.18 1.26 0.59
97pre 4.40 1.55 0.39 1.59 1.14 1.03 0.27
55post 4.40 1.55 0.39 1.98 1.66 1.56 0.97
134post 4.40 1.55 0.39 0.95 0.07 0.69 -0.33
7pre 4.30 1.40 0.37 0.97 0.10 0.89 -0.01
74pre 4.30 1.40 0.37 0.90 -0.06 1.25 0.59
122pre 4.30 1.40 0.37 1.46 1.01 1.22 0.55
123pre 4.30 1.40 0.37 0.70 -0.56 0.55 -0.73
11pre 4.20 1.27 0.35 0.55 -1.04 0.47 -1.07
13pre 4.20 1.27 0.35 1.13 0.43 0.89 -0.04
15pre 4.20 1.27 0.35 1.14 0.44 0.95 0.09
45pre 4.20 1.27 0.35 0.73 -0.53 0.61 -0.68
50pre 4.20 1.27 0.35 0.30 -2.06 0.30 -1.66
57pre 4.20 1.27 0.35 0.36 -1.78 0.35 -1.45
55
Hurley et al.: Examining the Effect of Aural Preparation on Second Grade Student
Published by UST Research Online, 2018

76pre 4.20 1.27 0.35 1.67 1.39 1.29 0.67
129pre 4.20 1.27 0.35 0.57 -0.99 0.52 -0.90
131pre 4.20 1.27 0.35 0.73 -0.53 0.61 -0.68
136pre 4.20 1.27 0.35 0.86 -0.18 0.73 -0.37
5post 4.20 1.27 0.35 0.63 -0.82 0.57 -0.77
11post 4.20 1.27 0.35 1.00 0.16 0.91 0.01
13post 4.20 1.27 0.35 0.54 -1.10 0.55 -0.82
60post 4.20 1.27 0.35 1.21 0.58 1.26 0.62
67post 4.20 1.27 0.35 0.68 -0.66 0.59 -0.73
72post 4.20 1.27 0.35 0.60 -0.89 0.71 -0.42
10pre 4.10 1.15 0.34 1.34 0.86 1.08 0.32
34pre 4.10 1.15 0.34 0.54 -1.18 0.50 -1.05
43pre 4.10 1.15 0.34 0.33 -2.01 0.31 -1.76
62pre 4.10 1.15 0.34 1.05 0.27 1.18 0.51
71pre 4.10 1.15 0.34 0.78 -0.41 0.72 -0.44
92pre 4.10 1.15 0.34 0.33 -2.04 0.31 -1.76
93pre 4.10 1.15 0.34 0.39 -1.77 0.38 -1.48
128pre 4.10 1.15 0.34 1.21 0.61 1.00 0.17
52post 4.10 1.15 0.34 1.24 0.67 1.31 0.73
56post 4.10 1.15 0.34 0.72 -0.59 0.78 -0.31
99post 4.10 1.15 0.34 1.54 1.23 1.44 0.94
103pre 4.00 1.04 0.33 0.73 -0.59 0.65 -0.68
110pre 4.00 1.04 0.33 0.52 -1.28 0.47 -1.24
130pre 4.00 1.04 0.33 0.36 -1.95 0.34 -1.76
1post 4.00 1.04 0.33 1.19 0.58 1.00 0.16
49post 4.00 1.04 0.33 1.37 0.94 1.49 1.06
5pre 3.90 0.94 0.32 0.66 -0.83 0.62 -0.84
9pre 3.90 0.94 0.32 0.47 -1.54 0.46 -1.38
47pre 3.90 0.94 0.32 1.30 0.83 1.27 0.70
55pre 3.90 0.94 0.32 1.18 0.56 1.12 0.41
65pre 3.90 0.94 0.32 1.37 0.97 1.33 0.81
75pre 3.90 0.94 0.32 2.03 2.13 2.21 2.16
94pre 3.90 0.94 0.32 0.61 -1.02 0.72 -0.54
26post 3.90 0.94 0.32 0.21 -2.90 0.21 -2.52
64post 3.90 0.94 0.32 0.38 -1.95 0.35 -1.79
91post 3.90 0.94 0.32 0.94 -0.01 0.86 -0.17
96post 3.90 0.94 0.32 0.31 -2.29 0.33 -1.92
73pre 3.80 0.84 0.31 1.34 0.92 1.55 1.24
86pre 3.80 0.84 0.31 0.49 -1.47 0.46 -1.45
111pre 3.80 0.84 0.31 1.60 1.43 1.59 1.30
112pre 3.80 0.84 0.31 2.11 2.29 2.59 2.74
114pre 3.80 0.84 0.31 0.58 -1.16 0.55 -1.10
19post 3.80 0.84 0.31 0.50 -1.44 0.49 -1.32
115post 3.80 0.84 0.31 2.27 2.53 1.97 1.91
56
Research & Issues in Music Education, Vol. 14 [2018], No. 1, Art. 4
https://ir.stthomas.edu/rime/vol14/iss1/4

126post 3.80 0.84 0.31 0.44 -1.69 0.45 -1.50
1pre 3.70 0.74 0.31 0.70 -0.75 0.66 -0.77
54pre 3.70 0.74 0.31 1.56 1.37 2.26 2.38
77pre 3.70 0.74 0.31 0.53 -1.37 0.60 -1.00
90pre 3.70 0.74 0.31 1.26 0.75 1.12 0.42
115pre 3.70 0.74 0.31 1.32 0.88 1.18 0.54
67pre 3.60 0.64 0.31 0.28 -2.61 0.28 -2.39
88post 3.60 0.64 0.31 0.45 -1.70 0.43 -1.69
90post 3.60 0.64 0.31 1.14 0.48 1.04 0.22
26pre 3.50 0.55 0.30 1.40 1.06 1.36 0.94
107pre 3.50 0.55 0.30 0.38 -2.02 0.39 -1.91
124pre 3.50 0.55 0.30 2.63 3.12 2.62 2.97
52pre 3.40 0.46 0.30 1.06 0.29 1.08 0.33
56pre 3.40 0.46 0.30 1.24 0.70 1.19 0.59
60pre 3.40 0.46 0.30 0.79 -0.48 0.74 -0.60
126pre 3.40 0.46 0.30 1.62 1.49 1.64 1.50
139pre 3.40 0.46 0.30 0.43 -1.79 0.57 -1.15
9post 3.40 0.46 0.30 1.50 1.27 1.66 1.53
64pre 3.20 0.28 0.30 0.88 -0.20 0.94 -0.03
91pre 3.20 0.28 0.30 1.99 2.13 2.09 2.26
100pre 3.20 0.28 0.30 0.92 -0.08 0.90 -0.12
82pre 3.10 0.19 0.30 0.56 -1.21 0.60 -1.04
96pre 3.10 0.19 0.30 1.16 0.51 1.15 0.50
99pre 3.10 0.19 0.30 1.06 0.27 1.03 0.21
125pre 3.10 0.19 0.30 2.59 3.01 2.97 3.44
134pre 3.10 0.19 0.30 1.68 1.58 1.68 1.57
49pre 2.90 0.01 0.30 1.61 1.42 1.65 1.49
88pre 2.90 0.01 0.30 1.48 1.18 1.44 1.08
106pre 2.90 0.01 0.30 0.70 -0.71 0.66 -0.82
12pre 2.80 -0.09 0.31 0.47 -1.53 0.45 -1.56
44pre 2.80 -0.09 0.31 1.47 1.16 1.50 1.20
12post 2.80 -0.09 0.31 1.70 1.57 1.78 1.69
59pre 2.70 -0.18 0.31 1.16 0.50 1.10 0.38
101pre 2.70 -0.18 0.31 1.52 1.24 1.73 1.58
58pre 2.50 -0.38 0.32 1.47 1.11 1.64 1.40
84pre 2.50 -0.38 0.32 1.27 0.74 1.30 0.77
Mean 4.44 2.36 0.89 1.02 0.07 0.97 0.03
SD 0.63 1.48 0.65 0.43 0.89 0.48 0.83 Note. The items are presented in Measure order, from high to low. Pre refers to pretest and post refers to posttest.
57
Hurley et al.: Examining the Effect of Aural Preparation on Second Grade Student
Published by UST Research Online, 2018