examining the protection efficacy of face shields against ......2020/07/06 · boundary wetting,...
TRANSCRIPT

Examining the protection efficacy of face
shields against cough aerosol droplets
using water sensitive papers
A. Ronen1, H. Rotter2, S. Elisha1, S. Sevilia1, B. Parizer1, N. Hafif2, A. Manor1
Israel Institute for Biological Research. 1- Environmental Physics Department, 2- Physical Chemistry Department
Abstract
Simple plastic face shields have many advantages compared to regular medical masks.
They are easily cleaned for reuse and comfortable to wear. In light of the spreading
COVID-19 pandemic, the potential of face shields as a substitution for medical masks, as
a recommendation to the general population, was tested. Testing the efficacy of the
protective equipment utilized a cough simulator that was carefully tuned to replicate human
cough in terms of droplet size distribution and outlet velocity. The tested protective
equipment was worn on a manikin head simulating human breathing. An Aerodynamic
Particle Sizer (APS) was used to analyze the concentration and size distribution of small
particles that reach the manikin head respiration pathways. Additionally, Water sensitive
papers were taped over and under the tested protective equipment, and were subsequently
photographed and analyzed. For droplets larger than 3μm by diameter, the efficiency of
shields to block cough droplets was found to be comparable to that of regular medical
masks, with enhanced protection on face parts the mask does not cover. Additionally, for
finer particles, of the order 0.3 to few microns, a shield was found to perform even better,
blocking about 10 times more fine particles than the medical mask. This implies that for
the general population that is not intendedly exposed to confirmed infected individuals,
All rights reserved. No reuse allowed without permission. was not certified by peer review) is the author/funder, who has granted medRxiv a license to display the preprint in perpetuity.
The copyright holder for this preprint (whichthis version posted July 7, 2020. .https://doi.org/10.1101/2020.07.06.20147090doi: medRxiv preprint
recommending the use of face shields as an alternative to medical masks should be
considered.
Introduction
Transmission of diseases by means of pathogen-laden aerosol transport, created by
expiratory events such as coughing, sneezing or talking, fundamentally contributes to the
spread of the disease and its potential of becoming an epidemic. The study of the processes
involved in such expiratory events and the efficiency of related personal protective
equipment (PPE) is therefore essential.
The global COVID-19 pandemic that has spread worldwide in just a few months has
challenged public health policy makers in many different aspects. The ultimate objective
for controlling the pandemic in the nation level is to lower the rate of infections such that,
in average, every infected person will subsequently infect not more than a single
susceptible to make the disease endemic. In this respect, altering the rate of spread even
modestly, can greatly contribute to the overall control over the spread of the disease. For
that reason, personal protective equipment that is considered insufficient in the
occupational context, focusing on the well-being of individual workers (i.e., healthcare
workers) operating in a highly contaminated environment, can make a considerable
difference when the problem at hand involves epidemic control in mass-population scales.
The advantages of face shields over regular medical masks are numerous. While medical
masks have limited availability and are disposable, face shields can be reused and are easily
cleaned. They are comfortable to wear, less retained dermal facial heat, and they have no
impact on breathing resistance, less claustrophobic and inexpensive [1]. They reduce the
All rights reserved. No reuse allowed without permission. was not certified by peer review) is the author/funder, who has granted medRxiv a license to display the preprint in perpetuity.
The copyright holder for this preprint (whichthis version posted July 7, 2020. .https://doi.org/10.1101/2020.07.06.20147090doi: medRxiv preprint

potential for autoinoculation by preventing the wearer from touching their face, and
potentially protect all the face and not only expiratory pathways [2].
Also, the importance of cooperation by a large fraction of the population leads to the fact
that, in the public health context, protective equipment which is less effective but more
comfortable or simple to wear, may be beneficial compared to more effective equipment
which is less comfortable or cumbersome. Considering the above, a face shield, although
protecting the users only partially, can reduce the rate of infections, and be adopted by
more users thanks to its relative comfortableness [3].
Motivated by these concepts, this work examines the potential of face shields as a sole
protective equipment used by the entire population. It is important to emphasize that for
health-care workers face shields are generally not used alone, but rather in conjunction with
other protective equipment and are therefore classified as adjunctive personal protective
equipment [1].
A former comprehensive work which studied the level of protection provided by face
shields [4-6] used a coughing simulator, a breathing simulator and an optical particle
counter to estimate the amount of spray inhaled by a susceptible in the vicinity of a cough
event. The inhaled, droplet-laden air was transferred into the particle analyzer, and the total
inhaled mass was reported as a function of time. The study concludes that wearing a face
shield substantially reduces the number of inhaled particles in the short term, but in the
longer term, very small particles bypass the shield and are inhaled.
Droplet formation during an expiratory event like coughing, sneezing, talking or even
breathing is a complicated process which involves complex flow through the different
All rights reserved. No reuse allowed without permission. was not certified by peer review) is the author/funder, who has granted medRxiv a license to display the preprint in perpetuity.
The copyright holder for this preprint (whichthis version posted July 7, 2020. .https://doi.org/10.1101/2020.07.06.20147090doi: medRxiv preprint
expiratory pathways. When a fast airflow passes over a wet boundary, stripes of liquid are
lifted from the boundary, and are consequently shredded and ripped into droplets. The final
droplet size distribution depends upon the fluid velocity, the pathways topology, the
boundary wetting, and physical attributes of the mucus. Spray created by different
expiratory events has been studied in different aspects. Yang et al. [7] measured the cough
droplets size distribution by asking volunteers to cough into airbags, and subsequently
sucked its content into a droplet size analyzer. Their measurements yield a droplet number
size distribution with a mode at 8.35 µm. More controlled experiments conducted by
Morawska et al. [8] took into account the droplet dynamics between exhalation and
measurement and attained a different size distribution. The size distributions observed for
different expiratory events were measured, and the authors suggest that every observed
distribution is a combination of four distinct distributions, each of them characterized by a
specific mode. Specifically, a cough event involves two main modes, at 0.8 µm and at 1.8
µm. Face shields are more efficient in blocking larger droplets, above a few microns.
Smaller droplets evaporate extremely fast and reach the vicinity of the susceptible as sub-
micron aerosol which follows the flow and easily bypasses the shield. The droplet size
distribution created by the cough simulator used here admits the latter of the two modes
specified.
The ejected air stream during a cough event creates a jet. The velocity immediately after
the mouth is the greatest, and it decreases further downstream. Specifying a jet velocity is
therefore a matter of definition. The common way of defining and measuring the velocity
related to coughing and sneezing events is to estimate arrival times for a given distance
All rights reserved. No reuse allowed without permission. was not certified by peer review) is the author/funder, who has granted medRxiv a license to display the preprint in perpetuity.
The copyright holder for this preprint (whichthis version posted July 7, 2020. .https://doi.org/10.1101/2020.07.06.20147090doi: medRxiv preprint

using some imagery technique. Tang et al. [9] used a shadowgraph imaging technique
combined with high speed photography and reported velocities around 4.5 m/s for coughs.
The current study utilizes a cough simulator and additionally to monitoring of inhaled fine
particles, provides further insight into the subject in a few aspects. First, infected droplets
can impinge on other parts of the face and subsequently be inhaled by the susceptible. To
address this, water papers (see below) were taped on the breathing simulator and the
protecting shield. The droplet patterns formed on the papers were subsequently
quantitatively analyzed. Second, different mutual configurations of the simulators were
tested. Finally, a shield was placed on the coughing simulator itself to assess the amount
of protection the surrounding is provided when an infected individual is wearing the shield.
This issue is very important in the current context since COVID-19 can be transmitted by
non-symptomatic infected individuals.
Methods
A controlled experiment was held inside an IIBR aerosol chamber, a facility which allows
the controlled formation of artificial aerosol under monitored conditions. An “Airbrush”
diffuser [Iwata Eclipse SBS] was used as a source of droplets spray, due to its characteristic
droplet size distribution that meets the requirements (see below). Controlling the diffuser
pressure and operation duration enabled to calibrate the amount of released liquid. Tuning
the jet direction and estimating the spray exit velocity were achieved by high-speed
photography using a Photron high-speed digital camera applied in a frame rate of 4500
Frames/sec. The jet velocity was estimated by measuring the average velocity over 40
cm. The instantaneous size distribution of airborne droplets was monitored by a laser
diffraction system, “Spraytec” [Malvern], located 30 cm from the source.
All rights reserved. No reuse allowed without permission. was not certified by peer review) is the author/funder, who has granted medRxiv a license to display the preprint in perpetuity.
The copyright holder for this preprint (whichthis version posted July 7, 2020. .https://doi.org/10.1101/2020.07.06.20147090doi: medRxiv preprint

The susceptible person was represented by a breathing simulator located downstream from
the diffuser. The breathing mechanism is required in order to simulate the increased
droplets penetration during inhalation as a result of lower pressure. A standard medium-
sized breathing manikin head [Dräger] was connected to a mechanical breathing machine
(self-production) which is a piston pump maintaining a sinusoidal respiratory rate, with a
maximal flow rate of 21 liters per minute (1.1 liter per a single breath).
At the first stage, the experimental setup was aimed at monitoring the concentration of the
inhaled very fine particles. The experimental setup included 2 APS 3321 [TSI] instruments,
sampling the air very close to the mouth of the breathing simulator through thin 40 cm long
tubes. The APS instruments yield continuous monitoring, with a time resolution of 1
second, of the particle number concentration and size distribution between 0.3 to 20 μm.
To ensure sufficient concentration of very fine particles, the cough simulator was used with
0.25 gr/L NaCl solution.
A subsequent phase was designed to study the distribution of larger cough droplets on
different face parts. Indication of droplets reaching different areas on the manikin head was
achieved by yellow water sensitive papers [Quantifoil] that change their color upon contact
with liquids. The papers were taped over the manikin face, above and below the tested face
shield, at six representative regions: forehead, nose, chin, left chic, right chic and neck.
Following former work [4] which determines that about 90% of the total spray mass
affecting the susceptible accumulates during the first few seconds, the papers were
collected right after each trial, and analyzed not more than one hour later.
Some figures that show the experimental setup are presented in Fig. 1.
All rights reserved. No reuse allowed without permission. was not certified by peer review) is the author/funder, who has granted medRxiv a license to display the preprint in perpetuity.
The copyright holder for this preprint (whichthis version posted July 7, 2020. .https://doi.org/10.1101/2020.07.06.20147090doi: medRxiv preprint

Fig. 1: Experiment Setup. Up left: diffuser was located behind the left manikin head, releasing
the jet toward the right. Down left: An Airbrush diffuser (indicated by an arrow) is located
facing the manikin head, while the “Spraytec” analyzer measures the droplet size distribution
along the jet. Up right: Water sensitive papers taped on top of and below a face shield. Down
right: Water sensitive papers marked by droplets stains of Airbrush spray (up) compared to
real human sneeze (down).
After the absorption of droplets onto the water sensitive papers, they were photographed
using a digital camera (Nikon D810) with macro lens (Nikon Macro D 105 mm). Image
analysis of each figure (by Image Pro Plus Version 10.0, [Media Cybernetics]) included
the number of droplets, area and appropriate diameter of each droplet. Finally, each droplet
aerodynamic size (Y) was calculated from the stain droplets on paper (X) by the known
paper spread factor as follows [10]:
All rights reserved. No reuse allowed without permission. was not certified by peer review) is the author/funder, who has granted medRxiv a license to display the preprint in perpetuity.
The copyright holder for this preprint (whichthis version posted July 7, 2020. .https://doi.org/10.1101/2020.07.06.20147090doi: medRxiv preprint

(1) 𝒀 = −𝟒. 𝟒𝟐 + 𝟎. 𝟓𝟖𝟑𝑿 − 𝟎. 𝟎𝟎𝟎𝟏𝟑𝟐𝑿𝟐
Relation Eq. (1) can be used to determine the smallest pre-impact diameter that could be
identified on the water sensitive papers. In our case this value was around 3 μm.
The protection efficiency of a face shield was assessed by testing its ability to block the
droplets from reaching the face below the shield. This is achieved by counting the droplets
below and above the shield for every specific run. Equation (2) defines the blocking
efficacy, evaluated separately for each run, as the ratio between the number of droplets
deposited on the shield, and the total number of droplets, on shield and face together.
(2) 𝑬 = 𝟏𝟎𝟎𝑵𝒂𝒃𝒐𝒗𝒆
𝑵𝒂𝒃𝒐𝒗𝒆+𝑵𝒃𝒆𝒍𝒐𝒘
It is worth elaborating here on the utilization of eq. (2) in the current work. The straight
forward way of evaluating the total mass of fluid impacting the face and shield is through
addressing the size distribution of the droplets staining the papers. A simpler, alternative
way was followed here. It is reasonable to assume that a smaller, flow-tracing droplet has
a greater chance of reaching the face compared to a bigger, inertial droplet flung at the
shield. Therefore, the blocking efficacy, Eq. (2), provides a lower bound for the fraction of
mass of contaminated fluid blocked by the shield. In other words, for the evaluation of
shield efficacy, it is sufficient to show high values of blocking efficacy.
Relaying on water-sensitive papers for the evaluation of the effectivity of face shields in
preventing infection, involves a few assumptions:
1. The distribution of pathogens among different droplet size populations is yet
unknown for the novel coronavirus. So is the minimal infective dose. Therefore,
All rights reserved. No reuse allowed without permission. was not certified by peer review) is the author/funder, who has granted medRxiv a license to display the preprint in perpetuity.
The copyright holder for this preprint (whichthis version posted July 7, 2020. .https://doi.org/10.1101/2020.07.06.20147090doi: medRxiv preprint

these factors are not taken into account in our analysis. In other words, we assume
that pathogens are uniformly distributed in the volume of liquid ejected during the
expiratory event, and that the protection efficacy is proportional to the mass fraction
of liquid blocked by the shield.
2. During its flight, droplets evaporate, and their diameter is reduced. This process is
affected by the temperature and relative humidity in the close proximity of the
droplet [11] (which can deviate from environmental background values due to the
local impact of the droplet cloud itself). Studying this effect demands careful
monitoring and control on the environmental parameters along the droplets path.
This was left out of the scope of the current work. The same applies for other
environmental conditions which affect the droplet spray dynamics such as ambient
wind speed and direction.
Results The scenario tested is designed to challenge the shield, but at the same time to be
feasible. The released mass in each of the cough simulating events was set to 100 μl,
which is the upper limit expected from a real cough. The proximity of the breathing
simulator was set to 60 cm, which is a typical distance of mutually interacting
individuals. In order to take into account height differences between the infected and the
susceptible individuals, some trials were conducted where, aside from the 60 cm
horizontal distance, a vertical distance of 30 cm is kept between the cough and the
breathing simulators. The pressure of the diffuser was tuned to guarantee a jet speed
typical for a cough event (about 5 m/s [9]) that was measured using fast photography.
All rights reserved. No reuse allowed without permission. was not certified by peer review) is the author/funder, who has granted medRxiv a license to display the preprint in perpetuity.
The copyright holder for this preprint (whichthis version posted July 7, 2020. .https://doi.org/10.1101/2020.07.06.20147090doi: medRxiv preprint

The diffuser was selected and tuned to meet representative distributions of droplet sizes.
Mass and number distributions as measured 30 cm from the diffuser are shown in Fig 2,
where different colors indicate different repetitions. Minor differences between repetitions
arise mostly as a result of the unsteady flow generated by the jet. It should be noted that
converting the measured volume distribution results to number distributions can be
followed by errors, thus the number distributions is used as an indication only. The spray
number distribution is characterized by diameters of 1.29, 1.76 and 6.51 μm for the 10th,
50th and 90th percentiles, respectively. Additionally, the volume distribution diameter is
characterized by the diameters 8.87, 22.25 and 280.64 μm for the 10th, 50th and 90th
percentiles, respectively.
It is worth noting, that observed distributions of cough-generated droplets include sizes of
up to a few hundreds of micrometers [12]. In contrast, our cough simulator is limited to
droplets smaller than 100 μm. However, such large droplets are very inertial and ballistic,
and their increased presence in real cough events would therefore enlarge the actual
blocking efficiency.
Fig. 2. Spraytec measurements number (left) and volume (right) size distribution of jet
droplets, measured 30 cm from source. The different line colors indicate different repetitions.
All rights reserved. No reuse allowed without permission. was not certified by peer review) is the author/funder, who has granted medRxiv a license to display the preprint in perpetuity.
The copyright holder for this preprint (whichthis version posted July 7, 2020. .https://doi.org/10.1101/2020.07.06.20147090doi: medRxiv preprint
APS measurements were conducted with a 60 cm horizontal distance between the breathing
and the coughing simulators (no vertical distance was introduced). Several tens of
repetitions were conducted, with a medical mask [Shengguan LTD.], a face shield (28 cm
width and 23 cm long) and a N95 mask (MOLDEX LTD.) were tested. Additionally, some
repetitions were conducted with no protection.
The typical time interval after a simulated cough event when a concentration higher than
the room’s background could be identified is around one minute. Maximal concentrations
were observed around 10 seconds after cough event onset.
Fig. 3 shows statistics of the measured number size distributions during multiple
repetitions, where for each repetition the time of maximal total number concentration was
selected. As indicated by different bar colors, measurements are grouped into tests with no
protection, with a medical mask or with a face shield. The bars show the average of
different repetitions and the error bars indicate the standard deviation. The leftmost bar is
exceptional as it is associated with a wider diameter range (0.3-0.523 μm) compared to the
other bars.
Up to a particle diameter of about 2.2 μm, the different distributions look qualitatively
similar in shape, with a slight decrease in amplitude moving from no protection to medical
mask, and a more significant decrease moving further to the face shield tests. For larger
particles, the medical mask and the face shield cases exhibit similar performance, with
substantially lower concentrations, up to about two orders of magnitude, compared to the
case of no protection.
All rights reserved. No reuse allowed without permission. was not certified by peer review) is the author/funder, who has granted medRxiv a license to display the preprint in perpetuity.
The copyright holder for this preprint (whichthis version posted July 7, 2020. .https://doi.org/10.1101/2020.07.06.20147090doi: medRxiv preprint

Fig. 3: APS measurement statistics of inhaled particles Number concentration. The
horizontal axis specifies the aerodynamic particle diameter. Repetitions are grouped into
three different cases as indicated by the different colors. For each repetition, a single
representative size distribution is taken at the moment of highest total number concentration.
The bars reflect the average of different repetitions, and the variability between different
repetitions is indicated by error bars.
Considering the total number concentration measured by the APS across all repetitions, the
median value of maximal concentration available to be inhaled (Fig. 4) is around 750,
450,100 and 40 particles per cubic centimeter for cases with no protection, a medical mask,
a N95 mask and a face shield, respectively. Also, despite the considerable scatter among
different repetitions, the clear advantage of face shields in comparison to medical masks is
evident. While the medical mask reduces the number of inhaled particles by roughly a
factor of two, the face shield provides better protection and blocks more than 90% of the
otherwise inhaled particles.
All rights reserved. No reuse allowed without permission. was not certified by peer review) is the author/funder, who has granted medRxiv a license to display the preprint in perpetuity.
The copyright holder for this preprint (whichthis version posted July 7, 2020. .https://doi.org/10.1101/2020.07.06.20147090doi: medRxiv preprint

Fig 4: Total maximal particles number, measured by an APS instrument, comparing un-
protected scenario, plastic shield, medical mask and an N95 mask. The horizontal red line
marks the median, the blue square indicates the second and third quarter, and the extreme
horizontal lines describe the first and ninth decile. Individual values are depicted by red
circles.
For the second phase, that included the use of water sensitive papers, four face shields with
plastic visors from different manufactures were examined. Their sizes were in the range of
23-35 cm width and 23-28 cm long. For reference, a medical mask was also tasted.
The total number of droplets deposited by the cough simulator on the shield and
simultaneously on the face, at different test configurations, can be seen in Fig. 5. Two
repetitions were conducted for each configuration. The bars indicate the average number
of droplets for the two repetitions, and the difference between each pair is indicated by the
error bars. High repeatability is reflected by small deviations from the average where in
cases of lower number of droplets are associated with larger variation between identical
measurements, due to bad droplets statistics.
All rights reserved. No reuse allowed without permission. was not certified by peer review) is the author/funder, who has granted medRxiv a license to display the preprint in perpetuity.
The copyright holder for this preprint (whichthis version posted July 7, 2020. .https://doi.org/10.1101/2020.07.06.20147090doi: medRxiv preprint

Fig 5: Overall number of droplets (logarithmic scale) over and under the face shield (FS),
for different kinds of shields (FS 1 to 4), a medical mask and different configurations ‘up’
and ‘down’ refer to cases in which a vertical distance was introduced, where in the former,
the breathing simulator was positioned 30 cm above the cough simulator and the opposite
for the latter. For all repetitions a horizontal distance of 60 cm was kept.
Fig. 6 presents the overall average blocking efficacy (as defined by Eq. 2) for each tested
scenario. The plastic shield did not cover the neck area completely and therefore, the neck
droplet counting is omitted from the calculation of blocking efficacy.
All rights reserved. No reuse allowed without permission. was not certified by peer review) is the author/funder, who has granted medRxiv a license to display the preprint in perpetuity.
The copyright holder for this preprint (whichthis version posted July 7, 2020. .https://doi.org/10.1101/2020.07.06.20147090doi: medRxiv preprint
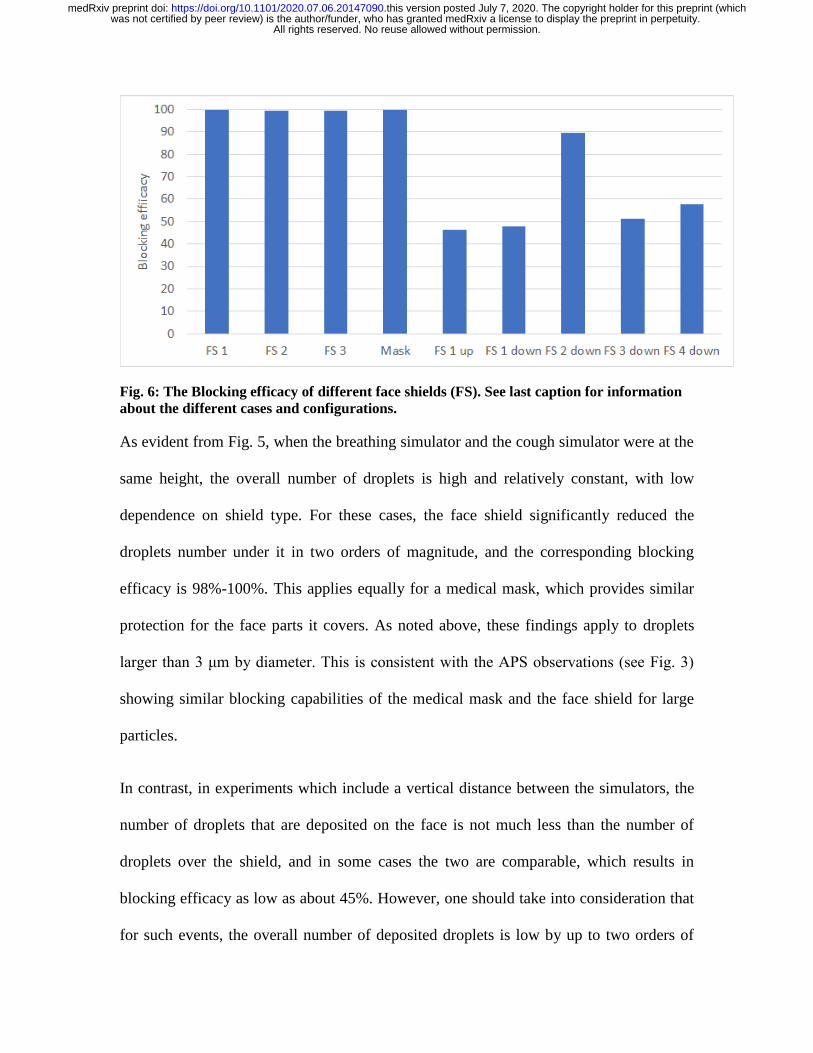
Fig. 6: The Blocking efficacy of different face shields (FS). See last caption for information
about the different cases and configurations.
As evident from Fig. 5, when the breathing simulator and the cough simulator were at the
same height, the overall number of droplets is high and relatively constant, with low
dependence on shield type. For these cases, the face shield significantly reduced the
droplets number under it in two orders of magnitude, and the corresponding blocking
efficacy is 98%-100%. This applies equally for a medical mask, which provides similar
protection for the face parts it covers. As noted above, these findings apply to droplets
larger than 3 μm by diameter. This is consistent with the APS observations (see Fig. 3)
showing similar blocking capabilities of the medical mask and the face shield for large
particles.
In contrast, in experiments which include a vertical distance between the simulators, the
number of droplets that are deposited on the face is not much less than the number of
droplets over the shield, and in some cases the two are comparable, which results in
blocking efficacy as low as about 45%. However, one should take into consideration that
for such events, the overall number of deposited droplets is low by up to two orders of
All rights reserved. No reuse allowed without permission. was not certified by peer review) is the author/funder, who has granted medRxiv a license to display the preprint in perpetuity.
The copyright holder for this preprint (whichthis version posted July 7, 2020. .https://doi.org/10.1101/2020.07.06.20147090doi: medRxiv preprint
magnitude. This applies, that the chances of infection following such events is relatively
low, and thus, these cases are practically less important in evaluating the overall efficacy
of shields.
It is interesting to compare the number of droplets deposited on the shield and below it, for
different face parts. Fig. 7 presents the ratio between the number of droplets that were
deposited over the shield\mask and the total number of droplets (i.e., over and under the
shield) for specific face parts. For each face part, only the droplets in its vicinity were taken
into account. Values close to unity reflect good protection for the specific area of the face,
whereas lower values indicate less effective blocking of droplets. For cases without vertical
separation, this ratio depends on the region of the face. For the center of the face, the
forehead, the nose and the chin, that ratio is close to 1. In contrast, at the cheeks and neck
it falls to a range of 0.4-0.5. This observation can motivate the designing of more advanced
shields that allow less penetration from the marginal gaps which exist at the bottom and at
the sides of the shield.
Introducing a vertical distance of 30 cm above and below, results in an increase in the
relative penetration of the droplets, regardless of the face part. The droplets penetrate
through the shield openings, and affect all parts of the face, not only those close to the
openings.
All rights reserved. No reuse allowed without permission. was not certified by peer review) is the author/funder, who has granted medRxiv a license to display the preprint in perpetuity.
The copyright holder for this preprint (whichthis version posted July 7, 2020. .https://doi.org/10.1101/2020.07.06.20147090doi: medRxiv preprint
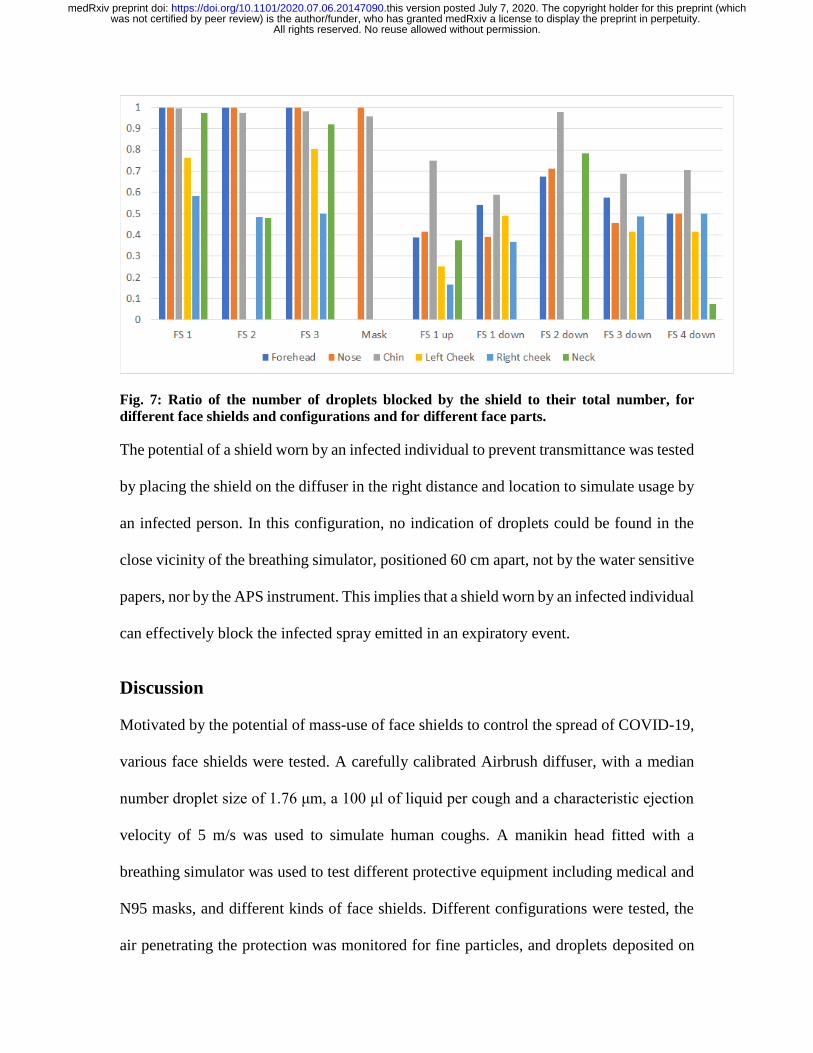
Fig. 7: Ratio of the number of droplets blocked by the shield to their total number, for
different face shields and configurations and for different face parts.
The potential of a shield worn by an infected individual to prevent transmittance was tested
by placing the shield on the diffuser in the right distance and location to simulate usage by
an infected person. In this configuration, no indication of droplets could be found in the
close vicinity of the breathing simulator, positioned 60 cm apart, not by the water sensitive
papers, nor by the APS instrument. This implies that a shield worn by an infected individual
can effectively block the infected spray emitted in an expiratory event.
Discussion
Motivated by the potential of mass-use of face shields to control the spread of COVID-19,
various face shields were tested. A carefully calibrated Airbrush diffuser, with a median
number droplet size of 1.76 μm, a 100 μl of liquid per cough and a characteristic ejection
velocity of 5 m/s was used to simulate human coughs. A manikin head fitted with a
breathing simulator was used to test different protective equipment including medical and
N95 masks, and different kinds of face shields. Different configurations were tested, the
air penetrating the protection was monitored for fine particles, and droplets deposited on
All rights reserved. No reuse allowed without permission. was not certified by peer review) is the author/funder, who has granted medRxiv a license to display the preprint in perpetuity.
The copyright holder for this preprint (whichthis version posted July 7, 2020. .https://doi.org/10.1101/2020.07.06.20147090doi: medRxiv preprint
water sensitive papers were counted. Each tested case was repeated to ensure statistical
significance.
An APS instrument monitored the air inhaled by the breathing simulator for the
concentration of fine particles. Cough events were repeated several tens of times where the
manikin head is fitted by turns with a medical mask, an N95 mask, a face shield and, for
the sake of reference, no protection at all. While the medical mask lowered the number of
inhaled particles by a factor of around 2, the face shield performed much better and blocked
10 times more particles than the mask. A spectral analysis of the aerodynamics particle
diameter reveals that this effect is related to the finer particles, smaller than 2 μm by
diameter.
The protection provided from larger particles was subsequently examined using water
sensitive papers. For that part of the measurements, different kinds of face shields were
tested, which all exhibited similar blocking efficacies. For configurations where the
breathing simulator is located directly in front of the cough simulator, high blocking
efficacy of close to 100% was attained, which is comparable to the blocking efficacy
measured for a regular medical mask, for the face parts it covers. In contrast, when a
vertical difference between the simulators also exists, the blocking efficacy drops markedly
and reaches typical values of 40%-60%. It is however important to note that for such
configurations, the total number of arriving droplets also drops by up to two orders of
magnitude, which lowers their relative practical significance.
The droplet counting for the different face parts yields that the shield performs the best in
protecting the central and upper parts of the face. The other marginal parts of the face are
All rights reserved. No reuse allowed without permission. was not certified by peer review) is the author/funder, who has granted medRxiv a license to display the preprint in perpetuity.
The copyright holder for this preprint (whichthis version posted July 7, 2020. .https://doi.org/10.1101/2020.07.06.20147090doi: medRxiv preprint

less protected. Extending shields toward covering a wider part of the face, especially the
neck and the cheeks, may improve their protection. This is consistent with the
recommendations of the Centers for Diseases Control and Prevention (CDC) [2].
Other scenarios we examined included locating the shield over the coughing simulator
itself. This is done to assess the protection provided to the surrounding when an infected
individual is wearing a shield. For this configuration, no particles could be identified in the
vicinity of the manikin head, by neither the APS nor the water sensitive papers. The
important conclusion is that wearing a face shield can protect the surrounding from
exposure to an infected person.
Conclusions
Overall, our results imply that blocking efficacy of face shields is similar, and for some
parts of the face, even higher, than the efficacy of medical masks. This is even more true
for fine particles, which are blocked much more efficiently by a shield compared to a
medical mask. Considering other advantages of shields over medical masks, public health
policy makers may consider, for the general population, the usage of face shields as an
alternative to medical masks.
References
[1] Roberge, R.J. Face shields for infection control: A review. J. Occup. Environ. Hyg., 13, 235–242, (2016).
[2] Centers for Disease Control and Prevention (CDC): “Workplace Safety & Health Topics. Eye Protection
for Infection Control.” Available at http://www.cdc.gov/niosh/topics/eye/eye-infectious.html (accessed July
15, (2015).
[3] Perencevich, E.N., Diekema, D.J., Edmond, M.B., Moving Personal Protective Equipment into the
Community: Face Shields and Containment of COVID-19, JAMA (2020).
All rights reserved. No reuse allowed without permission. was not certified by peer review) is the author/funder, who has granted medRxiv a license to display the preprint in perpetuity.
The copyright holder for this preprint (whichthis version posted July 7, 2020. .https://doi.org/10.1101/2020.07.06.20147090doi: medRxiv preprint
[4] Lindsley W. G., Noti J.D., Blachere F. M., Szalajda, J.V., Beezhold, D.H. “Efficacy of face shields against
cough aerosol droplets from a cough simulator”. J. Occup Environ Hyg. 11(8): 509-518, (2014).
[5] Lindsley W. G., Blachere F. M., Thewlis R. E., Vishnu A., Davis K. A., Cao G., Palmer J. E., Clark K.
E., Fisher M. A., Khakoo R., Beezhold D. H. “Measurements of airbourne influenza virus in aerosol particles
from human coughs”. PLOS ONE (2010).
[6] Lindsley, W. G., Reynolds J. S., “A cough aerosol simulator for the study of disease transmission by
human cough-generated aerosols”. Aerosol Science and Technology 47.8 (2013).
[7] Yang, S., Lee, G. W. M., “The size and concentration of droplets generated by coughing in human
subjects”. Journal of Aerosol Medicine, 20(4), (2007).
[8] Morawska L., Johnson G. R., Ristovski Z. D., Hargreaves M., Mengersen K., Corbett S., Chao C. Y. H.,
Li Y., Katoshevski D., “Size distribution and sites of origin of droplets expelled from the human respiratory
tract during expiratory activities”. Aerosol Science. 40 (2009).
[9] Tang J. W., Nicolle A. D., Klettner C. A., Pantelic J., Wang L., Bin Suhaimi A., Tan A.Y.L., Ong G. W.
X., Su R., Sekhar C., Cheong D. D. W., Tahm K. W., “Airflow dynamics of human jets: Sneezing and
breathing – potential sources of infectious aerosols”. PLOS one (2013).
[10] Hoffman WC., Hewitt AJ. “Comparison of three imaging systems for water sensitive paper”. Applied
engineering in Agriculture. 21: 961-964, (2005).
[11] Bouroubia L., “Turbulent gas clouds and respiratory pathogen emissions: potential implications for
reducing transmission of COVID-19”. JAMA (2020).
[12] Xiaojian Xie, Yuguo Li, Hequan Sun and Li Liu, Exhaled droplets due to talking and coughing, J. R.
Soc. Interface (2009).
All rights reserved. No reuse allowed without permission. was not certified by peer review) is the author/funder, who has granted medRxiv a license to display the preprint in perpetuity.
The copyright holder for this preprint (whichthis version posted July 7, 2020. .https://doi.org/10.1101/2020.07.06.20147090doi: medRxiv preprint