executive summary development strategy for clmv in …globalization and regionalization, and be a...
TRANSCRIPT

1
Executive Summary DEVELOPMENT STRATEGY FOR CLMV IN THE AGE OF ECONOMIC INTEGRATION
Chap Sotharith
1. INTENTIONS AND AIMS OF THE STUDY
Regional economic integration has been rapidly progressing in East Asia with
increasing numbers of Free Trade Agreements (FTAs) and Economic Partnership
Agreements (EPAs). The liberalization of international trade and investment
accompanying the integration process is expected to accelerate economic growth in the
whole region. At the same time, however, there is concern that integration may also
widen development gaps among individual member countries and among the regions in
each country. If these regional development gaps continue to widen, they could hamper
the progress of regional integration in East Asia. It is essential to study how extensively
the gap-expanding force works in the integrated economy.
This research aims to frame the development strategies for Cambodia, Lao
People’s Democratic Republic or Lao PDR, Myanmar, and Vietnam (CLMV) in the age
of globalization and help narrow the development gaps among countries in the region. It
highlights the assessment of economic performance, economic reform programmes,
challenges and policy recommendations for CLMV as a group, for individual countries,
and for external partners in order to bring about substantial development of CLMV
economies.

2
The recommendations derived from the study are expected to provide the basic
direction for the economic development of CLMV,. but the individual policy measures
should be determined by each government according to country-specific conditions. For
example, the individual paths for the upgrading of industries should be chosen based on
the resource endowment of, and other socioeconomic conditions in, each country.
Similarly, the most appropriate form of development cooperation between CLMV and
other East Asian countries should also depend on the current state of international
relations between CLMV and their East Asian neighbors. The authors, therefore, tried to
analyze development issues in the context of country-specific and relations-specific
conditions for individual problems.
2. METHODOLOGY
The authors used qualitative analyses as the primary methodology. They reviewed
economic performance, challenges, and prospects for CLMV and proposed policy
recommendations based on statistical data and information from secondary sources,
including published books, reports, and papers.
The report has 13 chapters in all. Chapters 1 and 2 provide a perspective on
practical and theoretical issues in East Asia’s integration while chapters 3 to 9 highlight
the regional partners that will assist CLMV in narrowing development gaps. Chapters
10 to 13 focus on country-by-country analyses.
3. FINDINGS AND CONCLUSIONS
CLMV, which are relatively new members of the Association of Southeast Asian

3
Nations (ASEAN), share a number of similarities, although they differ in the size of
their markets and economic priorities, among other things. While Vietnam, for example,
has achieved high levels of economic development, per capita income, and
industrialization, the other members of the group still have low per capita income and
limited human resources.
CLMV’s similarities include their primarily agro-based, transition economies, high
poverty incidence rate, insufficient infrastructure, and institutions that are still too weak
for a shift to a market economy. Although CLMV have enjoyed a certain degree of
macroeconomic stability in recent years and are considered one of the fastest-growing
economies in the region, unemployment and underemployment still persist. CLMV are
still facing huge challenges in fighting poverty, narrowing gaps in wealth among the
population, and addressing development gaps within the regions.
Although each country in CLMV faces different development constraints, CLMV
as a whole has a huge potential for future development, which will depend on individual
country efforts and support from development partners within and outside the region.
The ASEAN is strongly committed to regional integration with special emphasis
on narrowing the development gap among its members. Within this context, the
Initiative for ASEAN Integration (IAI) Work Plan for Narrowing the Development Gap
within the ASEAN was adopted to assist new member countries reduce development
gaps among themselves and expedite regional economic integration, promote equitable
economic development, and help alleviate poverty in CLMV.
The aim of narrowing the development gap is consistent with the ASEAN’s
commitment to build an economic community. A fully integrated ASEAN will sustain
its relevance, boost its competitiveness in the face of the increasing challenges of

4
globalization and regionalization, and be a catalyst for strengthening East Asia
integration. Moreover, an economically strong ASEAN will benefit both the member
countries and their trading partners. The integration of the ASEAN, therefore, remains a
critical factor which will be of significant benefit to East Asia as a whole.
The specific findings in each country paper are discussed below:
3.1 Cambodia
Since Cambodia achieved peace and national reconciliation through the 1991 Paris
Accord and the 1993 general elections, it has enjoyed a broad degree of macroeconomic
stability and development. Though it started from a very low base, Cambodia is now
considered as one of the fastest-growing economies in the region, enjoying double-digit
growth rates and macroeconomic stability for the past five years. However, it still
grapples with development challenges such as a high poverty rate, large income gap,
low production base, and inadequate human resources.
The main sectors that contribute to Cambodia’s economic growth are the garments
industry, tourism, construction, and agriculture. Cambodia exports mainly finished
products, which are usually of poor quality. This makes it difficult for Cambodia to
compete with its neighbours in terms of exports.
The country is implementing its third five-year plan called the National Strategic
Development Plan (NSDP) for 2006 to 2010, the main goal of which is to set into
motion the government’s Triangular Strategy focusing on growth, employment, equity,
and efficiency. Human resource development and promotion of trade and investment are
very crucial for future development.

5
3.2 Lao PDR
Lao PDR is aiming to remove itself from the list of least developed countries
(LDC) by 2020 and eradicate mass poverty by 2010. However, to achieve those goals, it
must first deal with a number of constraints such as a low production base, lack of
highly skilled human resources, poor infrastructure, and an unfavorable geographical
position as a landlocked country.
The government hopes that infrastructure development, tourism development, and
promotion of natural resources-based industries will change the country from being a
landlocked one to a “land-linked”one. It is also hoped that this will provide Lao PDR
full access to the seaports of neighbouring countries and other regional networks of
roads and railways. These priority sectors are expected to significantly enhance the
process of economic development and poverty reduction.
3.3 Myanmar
Myanmar’s huge and untapped potential for future economic development lies in its
large local market, abundant natural resources, and young labor force. Although the
country is dealing with a number of challenging domestic and international problems, it
is committed to regional economic integration.
Myanmar’s four economic objectives (Basic Economic Guidelines towards
Democratic State) are the following: 1) to develop agriculture as the base of the
economy along with the other sectors; 2) to allow the a market-oriented system to
evolve properly; 3) to spur economic development with the technical assistance and
investment of local and foreign partners; and 4) to maintain the initiative to shape the
national economy in the hands of the state and the people of Myanmar.

6
Myanmar’s economic development will also be boosted by accelerating economic
reforms, especially financial reforms, and realigning exchange rates; promoting small
and medium enterprises (SMEs) and special economic zones (SEZs); and taking
advantage of Myanmar’s geographical location between China, India, and the ASEAN.
3.4 Vietnam
Vietnam began its economic reform process in 1986 with a view to proactively
engaging in international economic integration. Due to its early headstart, it is now in a
relatively good place in its reform process. It has, in fact, achieved important
socioeconomic gains and laid a more concrete foundation for future economic
development. However, it still faces many reform challenges, which makes realizing its
development goals a formidable task.
Vietnam’s basic development objectives are: 1) to sustain high economic growth;
2) to escape the status of a poor country by 2010 although it is highly likely that this
objective will be realized by 2008; 3) to accelerate the industrialization and
modernization process in order to become “a modern, industrialized country” by 2020;
and 4) to transform into reality the slogan “prosperous people; a forceful country; and
an equitable, democratic, and civilized society.”
The main policy recommendations are 1) to promote Vietnam’s comparative
advantages and moving up along the value chain by: (i) diversifying/differentiating
export products and strengthening nonprice competitiveness; (ii) attracting efficient
foreign direct investments (FDIs); and (iii) improving labor and management skills; 2)
to accelerate the reform of state-owned enterprises (SOEs) with emphasis on large
corporations and their equitization and listing in the stock market; 3) to lay down better

7
prerequisites for the development of the financial market, especially the corporate bond
market and to build up an effective financial supervision system and appropriate capital
account liberalization; and 4) to deepen tax reforms, especially those associated with the
taxation administration and assets tax in order to broaden the tax base.
3.5 Thailand
As CLMV’s neighbor, Thailand plays a very important role in strengthening economic
cooperation. Thailand has a policy of “prospering its neighbors,” which it launched in
the early 1990s.
To determine the importance of trade with Thailand on the economic development
of CLMV, the ratio of trade to Gross Domestic Product (GDP) for Thailand and CLMV
were calculated. The higher the ratio between trade to GDP, the greater the importance
of trade between CLMV and Thailand is to the economies of CLMV. On the whole, the
volume of international trade has been increasing for both Thailand and its neighboring
countries, especially within the last decade.
The role of international trade in improving per capita income has been significant
especially in Cambodia and Vietnam. Thailand has taken the lead and should continue
helping CLMV in capacity building, especially to improve productivity and encourage
participation from the private sector. Likewise, it should help CLMV synchronize
domestic rural development plans with international cooperative development programs
and build economic networks in the region to achieve the goal of narrowing
development gaps. Logistic networking can be a starting point to further networking so
that the region can be developed into a single hub.

8
3.6 ASEAN
There is no doubt that the integration gap, which is also a development gap, is an
important concern because the level of ASEAN integration achieved at the end of the
day will decide whether the regional grouping will be able to face increasingly stiff
globalizing economic headwinds. There is, however, the possibility that the
development gap within the three-tiered grouping may widen further because benefits
arising out of globalization may become even more unevenly distributed among the
different members of the grouping. In view of this, the integration gap should not be
considered as critical as the previously mentioned three development gaps, viz.
infrastructure gap, income gap, and institutional gap. After all, the volume of trade
between ASEAN-6 and CLMV remains trivial, and integration does not seem to be
actually that important a concern for ASEAN, as suggested by its actions when it
devised new rules to accommodate members’ requests for delays in the inclusion of
certain products in the coverage of the ASEAN Free Trade Agreement (AFTA). And
since the integration gap should not be considered as critical as the infrastructure gap,
income gap, and institutional gap, the IAI Work Plan should thus divert resources away
from projects that presently come under the area of “Regional Economic Integration.”
3.7 China, Japan, and Korea
China, Japan and Korea are the most important partners to help bring CLMV to the next
level of development. The increasing volume of trade and investment from these
countries will help strengthen CLMV’s economy through technology transfer, skill
enhancement, job creation, capital mobilization, and infrastructure improvement.
Official Development Assistance (ODA) from these countries is still vital for

9
CLMV to build the foundation for economic development and to implement reform
programs. To promote cooperation between CLMV and China, Japan, and Korea,
CLMV should provide competent workers, produce quality products, and implement an
open door policy to attract FDIs from these countries. In turn, China, Japan, and Korea
should continue to develop economic and social infrastructure needed in CLMV and
provide assistance to reduce trade imbalance.
To implement regionwide development efficiently and effectively, it is essential to
conduct studies related to the benefits wrought by regionwide development such as
training and capacity building and mechanisms supporting cross-border economic
transactions.
4. POLICY RECOMMENDATIONS
The policy recommendations are divided into three groups: 1) common policy agendas
for CLMV; (2) country-specific policy agendas for CLMV; and 3) policy agendas for
development partners. Only the top three policy recommendations are highlighted in
this summary.
4.1 The Development and Utilization of Special Economic Zones in CLMV
The CLMV economies have not been deeply integrated into the East Asian production
and distribution networks in spite of their various location advantages and notably
abundant, reasonably well-educated, and low-waged labor force. CLMV’s
underdeveloped infrastructure, logistics in particular, and poor investment climate
hinder them from participating in such networks in East Asia. The cost of service links
and doing business in CLMV are not yet at the point where players can realize total cost

10
reduction.
Special economic zones (SEZs), including export processing zones (EPZs), could
be a good policy tool to reduce business and transaction costs embedded in CLMV
economies. SEZs can provide well-developed infrastructure with intensive capital
investments in the demarcated production sites. SEZs can also provide efficient
administrative procedures, including one-stop services for export and import, business
services such as offshore banking and logistics, and government support for human
resources development and technology transfer. SEZs will be able to provide these
services efficiently if they are insulated from the rest of the country where investment
climate is generally poor.
SEZs can be located along border areas where it will be easier for them to connect
to the regional and global economy through the borders they share with their
neighboring countries. Thailand, in particular, has logistic hubs such as deep-sea ports,
airports, and trunk roads. Firms, including multinational companies (MNCs), located in
the border areas of CLMV can enjoy location advantages such as wage differences
while realizing total cost reduction with lower service-link costs. CLMV should
therefore develop SEZs in locations closely linked to transportation hubs. To develop
SEZs, individual countries should provide a favorable legal framework, master plans,
infrastructure, land-clearance support, aftercare services, and a close link between
owners and potential investors, leading firms in particular.
4.2 Transport Network (Hub) Development
CLMV have an excellent geographical advantage—they face both the Pacific and
Indian Oceans and are adjacent to fast-growing Asian countries such as China, India,

11
and Thailand. To fully exploit this geographical advantage, they need to develop a good
logistic network that links major cities and ports in the abovementioned countries and
CLMV.
Some parts of the network, in fact, have been already constructed by the Greater
Mekong Sub-region (GMS) program on the initiative of the Asian Development Bank
(ADB). Those economic corridors need to be extended and connected with one other by
several branch links. In the process of doing this, the current schemes of
public-private-partnership (PPP) should be improved to promote the efficient
development and operation of the infrastructures. Moreover, to facilitate trade along
these highways, “the ASEAN Framework Agreement on the Facilitation of Goods in
Transit” should be continuously implemented.
It should be noted, however, that trade facilitation with construction of transport
infrastructure is not enough to attract industrial firms to CLMV and achieve strong
economic growth. On the contrary, the good connection could encourage relocation of
industries to the clusters in the surrounding countries. In order to utilize the constructed
infrastructures effectively for development of the CLMV economies, the governments
of CLMV need to launch some specific policy measures for attracting industrial firms to
the these sites.
One of the most feasible measures is to develop transport hubs in the region. It is
well known that a process of reciprocal reinforcement generally works between hub
formation and agglomeration development. A transport hub attracts firms, and this
encourages the development of transport services around the hub, which makes the hub
more attractive. In order to initiate these circular causations, it is important to encourage
firms that heavily use the transport infrastructures. Note that firms of transport users do

12
not necessarily exhibit economies of scale or the tendency to agglomerate. We can start
with fostering conventional industries, such as food, garments, resource-based
manufacturing, and tourism industries. When we have successfully attained the critical
amount of transport demand to create a hub, we may upgrade the industries to those
with greater economies of scale like chemicals, machinery, and electronics.
4.3 Human Resource Development with the Emphasis on Vocational Training and Public Administration
Central to the objective of capacity building in CLMV is the immediate and urgent need
for human resource development (HRD). Specifically, HRD must be implemented based
on cost-benefit analysis in which the benefit is optimized and the cost is minimized.
Investment in vocational training and public administration will supply much-needed
technical and vocational skilled workers. Trained and efficient public administrators
facilitate the implementation of domestic reforms and institution building.
Often, developing countries spend their scarce resources and prioritize spending
large amounts for “academic-oriented education.” However, there seems to be more
benefits to establishing institutions for vocational training, especially for practical
technical education, rather than “academic-oriented universities.”
Another critical element of HRD is the training of public administrators as they are
critically in short supply in all developing countries. Public administrators are the key to
the success of domestic reforms and institution building in CLMV. The severe shortage
of trained and capable civil servants and public administrators to implement policy
and institutional reform can create critical bottlenecks in the implementation process
despite the plethora of trade and investment liberalization measures,.
To achieve this objective, it is urgent and imperative to establish a functioning

13
civil-service institute exchange in East Asia where CLMV can send their public
administrators for training in selected East Asian countries. In this respect, the Civil
Service Institute (CSI) in Singapore has been notable in providing civil-service training
to ASEAN public administrators. In addition, Singapore and Malaysia have established
a close collaboration in civil-service training.

17
Chapter 1 GROWTH AND GAPS IN EAST ASIA: TRADE, INVESTMENT, AND ECONOMIC INTEGRATION Hank Lim ABSTRACT Economic integration in East Asia is picking up speed, due to foreign direct investments (FDI). This integration is increasingly based on production networking of agglomeration and fragmentation by optimizing the process of globalization.
However, there are visible evidences of constraints such as income gap, development gap, and institution gap. Globalization has relatively widened further the gap between the more-developed and the less-developed countries in the region. This has resulted in an uneven economic integration in East Asia.
There are a number of bilateral and subregional economic and technical assistance schemes for Cambodia, Lao People’s Democratic Republic or Lao PDR, Myanmar, and Viet Nam (CLMV), but the scope and substance of such schemes are inadequate. It is considered as necessary, therefore, to develop policy packages and incentives in order to utilize globalizing and regional production network. There is, in fact, a clear sign that economic agglomeration is starting to influence industrial location, whereby CLMV could benefit from such process. The geographical proximity of China, India, Thailand, and Viet Nam as growth centres are definitely an advantage, as long as CLMV can reduce setup cost and service link cost. In turn, reducing such costs will require a gradual but vast improvement in infrastructure, institutions, human resource development, and governance of CLMV.
Toward this objective, it is suggested that multilateral stakeholder fund is put in place through policy recommendations and further commitment to increase and coordinate intra-ASEAN Official Development Assistance (ODA) is established. These will have to support infrastructure development, human resource development, and domestic policy reform. In the end, reducing development gaps will go a long way in improving ASEAN economic competitiveness and in moving towards a common production base and single market as embodied in the ASEAN Economic Community.
18
1. INTRODUCTION Prior to the Asian financial crisis in 1997, rapid and dynamic economic growth in East Asia
was facilitated through market-driven forces. Various regional economic cooperation
initiatives and schemes were introduced, including and agreement on ASEAN Free Trade
Area (AFTA) in 1992, which came into full operation by end of 2003.
The impact of ASEAN-initiated regional cooperation was negligible, because ASEAN
economies were basically competing on the same product range and their main export
markets were non-ASEAN countries. However, a clear evidence has been recently
identified, which indicates that the impact of AFTA has encouraged production networking
on some intermediate and consumer goods in Thailand, Viet Nam, and other ASEAN
economies.
Some economists claimed that de facto economic integration has proceeded in East
Asia, even as there was no effective implementation of AFTA and other regional bilateral
trade and investment agreements. The nature and characteristics of de facto economic
integration are crucially important in policy discussion to understand how far integration
has been realized and what sort of integration has been achieved so far. Understanding such
fundamental issues would be helpful for policymakers in designing regional and bilateral
Free Trade Areas (FTAs) that will facilitate and accelerate further regional production
networks. The development of vertical production networks have certainly been supported
by trade liberalization efforts. On the other hand, the trade regime in East Asia is still far
from a single production base and a single market. Substantial barriers in service trade still
remain in East Asia. The development of vertical production networks and the remaining

19
Figure 1. Intraregional Trade (Exports and Imports) Ratio ( percent)
48.2East Asia
ASEAN1022.2
China-Japan-Korea
25.8
EU15
58.7
NAFTA
44.6
0.0
10.0
20.0
30.0
40.0
50.0
60.0
70.0
1980 1985 1990 1995 2000
(%)
2003
Source: IMF, Direction of Trade, 2004 CD-ROM.
trade barriers affect the nature of ongoing process of de jure economic integration in East
Asia.
Since the early 1990s, international production networks have been developed in the
ASEAN and surrounding East Asian countries. Production networking and regional
division of labour have been pursued, resulting in massive vertical intra-industry trade in
parts and components within the region.
International trade statistics clearly presents the recent advancement of de facto
economic integration in East Asia. In Figure 1, which shows the share of intraregional
trade (exports and imports) within several economic areas, the share of intra-East Asia trade
remarkably rose from 34.9 percent in 1980 to 52.4 percent in 2003 (East Asia comprises the
ASEAN 10, China, Japan, Hong Kong, and the Republic of Korea). Surprisingly, this

20
increase is higher than that of NAFTA (44.6 percent) though a bit lower than that of the EU
(58.7 percent). East Asia has no doubt achieved a high level of de facto economic
integration in terms of international trade transactions within the region. The integration
process has not been seriously interrupted even in the late 1990s when the Asian currency
crisis happened.
However, economic integration in East Asia does not seem to develop in an even
manner. The share of intraregional trade of the ASEAN 10 and China–Japan–Korea in
2003 remained at only 22.2 percent and 25.8 percent, respectively, as compared to that of
East Asia (52.4 percent). This suggests then that economic activity requires a large space
for expansion, that is, the whole East Asia, as the spatial economists would argue.
Moreover, China and the ASEAN 5 (Indonesia, Malaysia, the Philippines, Singapore, and
Thailand) increased their shares in East Asian trade, as shown in Figure 2. This suggests
that even countries with relatively low-income levels have played a significant role in the
expansion of the intraregional trade in East Asia.
It should be noted that the trade pattern inside East Asia has changed, from the
traditional pattern (in which final products, such as consumer goods, intermediate goods,
and capital goods, were being traded) to a pattern where parts and components were traded.
To put it differently, intermediate goods in the same industry have been actively traded
among the Asian countries, expanding intra-industry and intraregional trades. For instance,
import shares of parts and components within East Asia increased from 7.2 percent in 1980
to 32.2 percent in 2003, while those of processed goods decreased from 37.3 percent in
1980 to 28.0 percent in 2003. The shares of parts and components became the largest
among commodity groups (see Figure 3).

21
Figure 2. Trade Share of East Asia with Partner Country ( percent)
The United States
European Union
China
Korea
ASEAN Five
India
0.0
5.0
10.0
15.0
20.0
25.0
30.0
1980 1985 1990 1995 2000
%
Note: East Asia consists of ASEAN 10, China, Japan, Hong Kong, South Korea, and Taiwan. Source: IMF, Direction of Trade, 2004
Figure 3 Trade Pattern Inside East Asia ( percent)
0
10
20
30
40
50
1980 1982 1984 1986 1988 1990 1992 1994 1996 1998 2000 2002
Primary GoodsProcessed goodsParts and componentsCapital goodsConsumption goods
(%)
Processed goods
Capital goods
Parts and components
Consumption goods
Primary goods
Source: ComTrade

22
From this development we can generate an observation about an explosive increase in
East Asian trade in intermediate goods, particularly in machinery industries, based on
production process-wise international division of labour among countries with different
income levels and development stages. Trade patterns in today’s global competitive climate
where economies of scale strongly work are quite different from the traditional ones that
are based on static comparative advantage. The whole production processes involve
sequential production blocks located across countries. Different stages of production are
shared by different suppliers located in different countries. Instead of final products,
companies in different countries traded components and intermediate input.
This phenomenon is known as cross-border production sharing or fragmentation of
production. Production processes, located in different countries in East Asia, are finely
divided into many stages. It is theoretically confirmed that, in such vertical specialization,
a slight decline in trade costs induces large trade in intermediate goods, since goods may
move across national borders multiple times. For example, an intermediate good is exported
from country A to country B and is imported back to country A again after being processed
in country B. In this case, the good crosses a national border four times. This is what
actually happens in East Asia—when trade costs decline, such decline comes with
substantial increase in the competitiveness of the whole East Asia.
In the ASEAN and surrounding East Asian countries, international trade in parts and
components has been expanded, and the international division of labour in terms of
production processes has grown to an unprecedented degree. At the same time, economic
agglomeration or industrial clusters have grown in several notable places where dense
vertical supply chains are formulated. The fragmentation of production processes and the
formation of economic agglomeration, however, are rather new phenomena that started in

23
the late 1980s or the early 1990s. To understand the mechanism of agglomeration and
fragmentation, understanding the new economic geography and the fragmentation theory
would be useful.
The new economic geography explains the formation of economic agglomeration in
geographical space. The spatial structure of economic activities is considered to be the
outcome of a process involving two opposing types of forces, that is, agglomeration forces
and dispersion forces.
The theoretical formulation analyzes the balance of these two opposing forces, which
generate a variety of location patterns of economic activities. A key property of
agglomeration forces resides in the circular causality of economic activities. For example,
an automobile assembler would attract a number of upstream suppliers, and the resulting
productivity enhancement and market expansion may in turn attract another assembler.
Such circular causality would generate a sort of economies of scale in a geographical sense.
On the other hand, the growth of economic agglomeration would enhance dispersion
forces at the same time. Concentration of economic activities would increase land prices
and wage rates, bring tough price competition among firms, and cause traffic congestion,
and air pollution. Due to such negative effects, dispersion forces would be intensified.
One of the important factors that delicately affect the balance between agglomeration
forces and dispersion forces is the broadly defined transportation costs, which includes
freight cost, tariffs, nontariff barriers, and risk for exchange-rate variation. As transport
costs decrease, agglomeration may grow. With a further decrease in transport costs,
production activity may rather disperse. The new economic geography analyzes factors,
some of them are policy variables, that determine industry location among countries or
cities in different sizes.

24
The fragmentation theory focuses on the location of production processes. Production
processes are fragmented into multiple slices and located in different areas, say, in different
countries in East Asia. Suppose that an electronics company originally has a huge factory
in a developed country, and this factory takes care of the whole production processes, from
upstream to downstream. If the company can separate production processes and establish
them in appropriate places, the total production cost may be maximized.
There are three elements that make fragmentation possible. First, there must be
production cost savings in fragmented production blocks; the company must take advantage
of the differences in location between the original position and the new position. Second,
the cost of service links that connect remotely located production blocks (that is, costs of
transportation, telecommunications, and various types of coordination) must not be too high.
Third, the cost of network setups is small. When additional cost for setting a new plant is
relatively small, the production process can be easily fragmented.
The feasibility of fragmentation, therefore, heavily depends on the nature of
technologies in the industry and the economic environment. New economic geography and
the fragmentation theory provide insights into important factors that determine the location
of economic activities in the globalization era.
2. POLICY ENVIRONMENTS THAT ENABLE UTILIZTION OF GLOBALIZING FORCES
International production or distribution networks in the ASEAN and surrounding East
Asian countries are relatively the most advanced and sophisticated in the world. East Asia
has no doubt developed a favorable policy environment suitable for globalizing corporate
activities. However, such policy environment has been realized through accumulated

25
profit-motivation actions by the private sector, rather than being developed with well-
designed strategic moves. Analytical evaluation of policy environments that enable
countries to take advantage of globalizing forces for economic development is necessary
and important.
The new economic geography and the fragmentation theory provide rich implication
for policy environments in the globalizing era. The new economic geography suggests
policies affecting the agglomeration forces and the dispersion forces. The fragmentation
theory lists up policies affecting production cost savings, service link cost, and network
setup cost.
Combining the new economic geography, with careful consideration on policy needs
that are possibly have different development stages, it is possible to develop desirable
policy packages in order to utilize globalizing forces.
2.1 The Economic Development of Latecomers
The economic development of latecomers, in particular CLMV, is a very important
agendum not only for CLMV but also for the ASEAN and the whole East Asian countries.
The relationship between two objectives—to deepen integration and narrow development
gaps—takes the most extreme form in this context.
2.2.1 Macroeconomic Indicators
In Table 1, which shows wide gaps in terms of GDP per capita between the ASEAN
member-countries, Brunei and Singapore topped the list in 2006. On the other hand,
CLMV, with GDP per capita of less than US$1,000, took the bottom of the list. Note that

26
even among the older ASEAN-6 member-countries, there are wide gaps, with Indonesia
and the Philippines trailing behind.
Cambodia, Lao PDR, and Myanmar are primarily agro-based, while Viet Nam has
relatively large manufacturing and services sectors. Viet Nam’s share of services in GDP
was already on par with that of Indonesia’s and Brunei’s, while Singapore took the lead on
the list. This explains that for economic integration to proceed smoothly, the issue of
incompatible economic structures needs to be tackled.
Table 1: ASEAN Macroeconomic Indicatiors GDP at current
prices
(US$ ‘000 mil)
GDP per capita
at current
prices
(US$ ‘000 mil)
Share of
Agriculture in
GDP
Share of
Industry in
GDP
Share of
Services in
GDP
2001 2006 2001 2006 2000 2004 2000 2004 2000 2004
Brunei 4.2 11.6 12.1 30.2 1.6 2.1 59.5 58.4 38.9 39.5
Indonesia 164.8 364.3 0.8 1.6 15.6 15.0 45.9 44.5 38.5 40.5
Malaysia 88.0 156.9 3.7 5.9 8.4 7.9 44.2 42.4 47.4 49.7
Philippines 72.0 117.5 0.9 1.4 19.9 19.7 34.7 33.0 45.4 47.3
Singapore 85.9 132.3 21.0 29.5 0.1 0.1 33.8 32.6 66.1 67.3
Thailand 115.6 206.6 1.8 3.2 10.3 9.3 44.4 46.7 45.3 44.0
Cambodia 3.8 7.3 0.3 0.5 39.6 32.8 23.3 30.7 37.1 36.5
Laos 1.7 3.5 0.3 0.6 52.1 50.2 22.7 24.6 25.2 25.1
Myanmar 8.3 12.0 0.2 0.2 42.9 42.9 17.3 17.3 39.7 39.7
Vietnam 32.6 61.0 0.4 0.7 23.3 20.2 35.4 39.4 41.3 40.4
Source: ASEAN Statistical Yearbook (various issues) ASEAN Statistical Pocketbook 2006.

27
2.2.2 Human Development Index (HDI)
Average achievements in basic human development can be measured and compared using
the human development index (HDI). Based on three component sub-indices (life
expectancy, education, and GDP), the HDI value of a country, which ranges from 0 to 1,
shows the distance the country has to travel to reach the maximum possible value of 1.
Table 2 compares the development states of the ASEAN member countries. The latest
HDI rankings (“UNDP: Human Development Report 2006”) put Singapore, Brunei, and
Malaysia in the “high human development category,” while the rest fall under the “medium
human development” category.
Table 2: ASEAN Human Development Indicators Human
Development
Index (Rank)
Human
Development
Index (Value)
Life
Expectancy
Index
Education
Index
GDP Index
1999 2004 1999 2004 1999 2004 1999 2004 1999 2004
Singapore 26 25 0.876 0.916 0.87 0.90 0.87 0.91 0.89 0.94
Brunei 32 34 0.857 0.871 0.85 0.86 0.86 0.88 0.87 0.88
Malaysia 56 61 0.774 0.805 0.79 0.81 0.80 0.84 0.74 0.77
Thailand 66 74 0.757 0.748 0.75 0.75 0.84 0.86 0.69 0.73
Philippines 70 84 0.749 0.763 0.73 0.76 0.91 0.89 0.61 0.64
Indonesia 102 108 0.677 0.711 0.68 0.70 0.79 0.83 0.56 0.60
Vietnam 101 109 0.682 0.709 0.71 0.76 0.84 0.81 0.49 0.55
Cambodia 121 129 0.541 0.583 0.52 0.52 0.66 0.69 0.44 0.53
Myanmar 118 130 0.551 0.581 0.52 0.59 0.75 0.76 0.39 0.39
Laos 131 133 0.476 0.553 0.47 0.50 0.51 0.66 0.45 0.50
Source: UNDP. Human Development Report - 2001 & 2006.

28
As if this is not bad enough, those falling within the “medium human development”
category can be further subdivided into “upper,” “medium,” and “lower.” Note that Lao
PDR was in the “low human development” category in 1999 but is now within the
“medium human development” category in the latest rankings.
Table 3 shows the HDI trends of the ASEAN countries from 1985 to 2004. Though
there have been improvements in HDI readings for all ASEAN countries, it is not likely
that improvements expected to be achieved over the next 10 years or so by the less-
developed ASEAN countries will be enough to enable them to catch up with the more-
developed countries, because these countries will also be moving forward.
Table 3: Human Development Index Trends
HDI Values HDI
RANK
(2004)
Country 1985 1990 1995 2000 2004
25 Singapore 0.786 0.823 0.862 … 0.916
34 Brunei … … … … 0.871
61 Malaysia 0.696 0.723 0.761 0.791 0.805
74 Thailand 0.680 0.717 0.751 0.775 0.784
84 Philippines 0.695 0.722 0.738 0.759 0.763
108 Indonesia 0.585 0.626 0.665 0.682 0.711
109 Vietnam … 0.618 0.661 0.696 0.709
129 Cambodia … … 0.536 0.545 0.583
130 Myanmar … … … … 0.581
133 Laos 0.425 0.451 0.488 0.523 0.553
Source: UNDP. Human Development Report - 2006.

29
Since the early 1990s, there have been all sorts of international initiatives to assist the
Mekong-Delta countries. With the admission of CLMV into the ASEAN, there are now
ASEAN initiatives (e.g., the IAI Work Plan) targeted at these countries. Between 1995 and
2004, Viet Nam improved its HDI reading from 0.661 to 0.709, that is, an increase of 0.048
point, without the help of IAI Work Plan. Assuming that Cambodia, Myanmar, and Lao
PDR are able to improve their HDI readings by a very improbable 0.048 point between
2004 and 2015 with the help of the IAI Work Plan, while the HDI readings of the rest of the
ASEAN countries remain stagnant at the levels achieved in 2004, these three countries still
will not be able to catch up with the rest, not even with Viet Nam.
Various initiatives have been put in place to assist CLMV. It specifically looks at the
IAI Work Plan projects, analyzing how effective they have been.
3. CLMV-FOCUSED COOPERATION AND ASSISTANCE
International attention started to focus on CLMV in the early 1990s after the end of the
Cold War and the Cambodian civil war, and when the free market reforms were launched in
said countries, which started in the late 1980s. The 1990s saw the creation of various
international forums and cooperative efforts to promote development in the Mekong region.
The efforts include, among many others, the following:
3.1 ADB-sponsored GMS Economic Cooperation Programme
Since 1992, the countries of the Greater Mekong Sub-region (GMS)—Cambodia, Lao PDR,
Myanmar, Viet Nam, Thailand, and the Yunnan Province of the People's Republic of
China—have embarked on a programme of economic cooperation, with the support of

30
international organizations. The programme has so far managed to achieve results that are
more tangible and carried more impact on regional cooperation. The high-priority
subregional development projects include projects in transportation, energy,
telecommunications, environment, human resource development, tourism, trade, private
sector investment, and agriculture.
3.2. Working Group on Economic Cooperation in Indochina
The Working Group, which was organized under the umbrella of the ASEAN and Japanese
economic Ministers Meeting (AEM-MITI), held its first meeting in 1995. It targeted
countries that were not regular ASEAN members—Lao PDR, Cambodia, Myanmar, and
initially, Viet Nam. The Working Group aims “to promote the economic development of
Cambodia, Lao PDR, and Myanmar and also to promote economic growth of the Southeast
Asian region as a whole by strengthening the economic linkages between these countries
and other ASEAN countries.”
3.3 ASEAN Mekong Basin Development Cooperation (AMBDC)
Initiated by the ASEAN, ten Southeast Asian countries and China attended the first
Ministerial Meeting in 1996. The objectives of this cooperative effort were: (1) to enhance
economically sound and sustainable development of the Mekong Basin; (2) to encourage a
process of dialogue and common project identification that can result in firm economic
partnerships for mutual benefit; and (3) to strengthen interconnectivity and economic
linkages between the ASEAN members and the Mekong riparian countries.
The ASEAN’s efforts to help tackle the Mekong region's development issues and
challenges were shelved temporarily during the 1997-1998 Asian financial crisis when the

31
members of the group became too engrossed with their own domestic economic problems.
But as Asia started to recover from the financial crisis, the Mekong development moved
back onto the ASEAN’s agenda.
The ASEAN leaders agreed at the 2004 Vientiane Summit to pursue comprehensive
integration of the ASEAN into an ASEAN Community by 2020. At the ASEAN Economic
Ministers Meeting in Kuala Lumpur on August 24, 2006, the member-countries agreed to
accelerate the objective of the ASEAN Economic Community by 2015. The ASEAN
Economic Community is the realization of the end-goal of economic integration, as
outlined in the ASEAN Vision 2020: to create a stable, prosperous, and highly competitive
ASEAN economic region in which there is a free flow of capital, equitable economic
development, and reduced poverty and socio-economic disparities by 2020. Reducing
development gaps among the ASEAN members are firmly manifested and embedded in the
Hanoi Plan of Actions, the Bali Concord II, and the Vientiane Actions Programme
In the light of these developments, correcting the so-called "ASEAN divide" became a
high priority. There was a greater commitment toward assisting CLMV to ensure that no
one is left behind.10 Solidarity would be affected if the divide would not be eliminated. To
help hasten the economic development of CLMV and, hence, narrow the development gap
between these countries and the more-developed ASEAN-6, ASEAN leaders agreed in
November 2000 to launch the Initiative for ASEAN Integration (IAI).
In the meantime, the AMBDC resumed its activities. It held its second ministerial
meeting in 2000. At its third ministerial meeting in October 2001, it was agreed that Japan
and South Korea would be taken in as additional members. Projects related to infrastructure,
trade and investment, agriculture, forestry and minerals, industry, tourism, HRD, and

32
science and technology have been implemented or are ongoing, but there have been
financing problems.
At the Eighth Ministerial Meeting of the AMBDC in August 2006, the member-
countries agreed to provide recommendations to place the AMBDC Ministerial Meeting
under the ASEAN Economic Ministers Meeting process at the 12th ASEAN Summit in
December 2006. The rationale given for the recommendation was that it would be easier to
synchronize the economic integration activities, and, hence, would make maximum use of
resources available.
New economic geography suggests that latecomers may utilize the dispersion forces
due to congestion in economic agglomeration. The theory analyzes two forces in economic
agglomeration: the agglomeration forces and the dispersion forces. The agglomeration
forces may enlarge disparities among the integrated countries (e.g., CLMV versus other
countries) as well as among domestic regions in each country (e.g., inland versus coastal
regions in China). At the same time, the dispersion forces may move manufacturing
activities from forerunners to latecomers, and narrow development gaps. The balance of
these two forces would largely determine the overall effects of economic integration on
industrial location patterns among the East Asian countries. From the viewpoint of CLMV,
how to take advantage of the dispersion forces would become an issue.
There is, in fact, a sign of congestion in economic agglomeration in East Asia, and the
dispersion forces start working so as to influence industrial location. We observe
substantial increases in production costs in agglomeration due to difficulties in securing
labour and land, traffic jam problems, among others. Companies have to find labour from
distant places, and some of them eventually set up a new factory in middle-size cities or
rural areas. In particular, labour-intensive or land-intensive production processes tend to

33
shift. In the last several years, many cities have been growing with increasing number of
residents, factories, and warehouses. For instance, in Thailand, factories are located in
concentration in Lamphun, 50 kilometer south of Chiang Mai. In Malaysia, many parts
suppliers are in Johor, and Malacca, where a superhighway is connected from Singapore to
Kuala Lumpur.
The fragmentation theory, on the other hand, suggests that the differences in location
advantages, such as factor prices, motivate fragmentation of production processes.
Differences in wage levels between the ASEAN forerunner countries and CLMV are still
substantial, and thus CLMV may have strengths, particularly for labour-intensive or natural
resource-intensive production processes. The issue would be the network-setup cost and
the service link cost. Their geographical proximity to growth centers would be a strong
point, but drastic reduction in the setup cost and the service link cost would be required.
Efforts for deeper integration would also be essential to preparing necessary policy
environments.
To summarize, latecomers, particularly CLMV, have good opportunities for attracting
economic activities in the globalization era. By strategically improving policy
environments, they can attain two objectives at the same time: deepening integration and
narrowing development gaps.
It is vitally important to understand the extent of the influence of the global value
chain (GVC) and de jure regional trade agreements on regional production networking.
Global business corporations have extended their production, material and resource
sourcing, and markets beyond their domestic economies. Because of the pressure of
integration, competition and JIT production system, East Asia is now fully connected into a
global value chain system in which it produces the world production output. The

34
importance of production networking, clustering (agglomeration) and fragmentation must
be factored in de jure regional FTAs. There are some studies related to the importance of
this issue. What is needed is to focus the linkage and relevance of de jure regional trade and
investment arrangements with the accelerating process of production networking. A study
should be conducted to examine specific trade and investment areas and sectors that require
further government support and facilitations arising from trade and investment agreements.
Economic integration in terms of production networking or value chains has not
benefited much from formal regional trade agreements. The basic weaknesses of the
ASEAN Free Trade Area (AFTA), the ASEAN Economic Community (AEC), the ASEAN
Investment Area (AIA), and the ASEAN Framework Agreement on Services (AFAS)
consist of the too many exceptions on key sectors of ASEAN economies, as well as the
inadequate standardization and harmonization of rules and regulations (including the
existence of nontariff barriers). Transportation, infrastructure, and institutions to implement
those trade and investment agreements are either not present or inadequate.
Production network and regional economic integration in Southeast and Northeast
Asia, within the framework of global value chain and expanding production network in
East Asia, are picking up speed. They are motivated basically by market-driven forces of
competition, the rise of China and India, the political stability in the region relative to other
regions, and the availability of productive labor force and resources buttressed by
individual country’s macroeconomic regime and liberal trade and investment regimes that
promote economic development.
Despite many distortions and inefficiency in implementing the ASEAN regional
cooperation schemes, there are many cumulative positive effects on the rapidly emerging
production networking and agglomeration of industry in East Asia. The clustering of

35
automobile industry and parts in Thailand, the clustering of electronic industry in Malaysia,
and the knowledge-based industry cluster in Singapore are cases in point. Indirectly,
positive and business-friendly policies and institutional environments in Southeast Asian
countries have undoubtedly contributed to the emergence of industrial clustering and
agglomeration and production network particularly in parts, components, and intermediate
inputs in some sectors and in some selected Southeast Asian countries.
Further and enhanced efforts to accelerate and integrate existing agreements in goods,
services, and investment are vitally important for ASEAN economies to meet the
challenges and opportunities related to the rise of China and India and the accelerating
process of global value chain development trend.
In the case of CLMV, these countries require development assistance in addition to the
ASEAN regional economic integration. Without adequate development assistance, trade
and investment liberalization alone would not be sufficient for these countries, perhaps with
the exception of Viet Nam, to benefit from the emerging production networking and
industrial clustering in Southeast Asia. That’s because their infrastructures and institutions
are yet to be developed.
Economic integration through regional and bilateral FTAs can enhance regional
production networking if policy makers can minimize the distortions related to regional and
bilateral FTAs in East Asia. Since 2000, bilateral FTAs and subregion FTAs have
proliferated in East Asia. What is the nature of the proliferation FTAs in East Asia? Those
bilateral FTAs are based on reciprocal preferential tariff schemes. Both parties choose its
own sensitive lists. This implies that, for example, the ASEAN-China FTA (ACFTA) is
counted as 10 separate bilateral FTAs between China and the 10 ASEAN countries. The
36
degree of market access faced by an ASEAN exporter varies according to the ASEAN
destination markets. This means that there are 45 bilateral preferential trade relationships
within 10 ASEAN countries (10 x 9/2=45). In the same way, ASEAN-Japan FTA,
ASEAN-Korea FTA, and ASEAN-India FTA are 10 separate bilateral FTAs each.
ASEAN-CER (Australia and New Zealand) is 20 bilateral FTAs. A total of 105 ASEAN
FTAs are enforced and/or under negotiation. Any ASEAN exporter faces different
preferential treatments based on destinations. Baldwin (2006) has called the overlapping
FTA problem as East Asian “noodle bowl syndrome.” Potentially, 16 countries would
produce 120 bilateral FTAs (16 x 15/2) in the region.
Different FTA strategies by individual country may create severe overlapping FTA
problems with various kinds of FTA. Because of the different FTA strategies taken by each
country, there are much heterogeneity in exclusion lists, tariff rates, rules of origin, dispute
settlement mechanism, mutual recognition, competition policy, and other norms and
regulation among existing multilateral FTAs in Asia. The overlapping FTAs would
complicate tariff rates and Ro0 on the same products, according to destinations. It is
commonly agreed that the costs arising from the Ro0 are expected to increase substantially
when countries experience overlapping of multiple FTAs/RTAs.
Other than the lack of FTA management arising from different FTA strategy and
overlapping issues, there are some crucial impediments in the East Asia’s bilateralism. First,
except for a few countries, East Asia has failed in forming high level FTAs in terms of
trade liberalization. Reduction in agricultural trade barriers is important for narrowing
development gaps. Agricultural products, however, tend to be excluded from
preferentialtariff treatments.

37
Moreover, the bilateral FTAs in East Asia have addressed trade liberalization in goods,
while liberalization in service trade has not progressed much in East Asia’s FTA
bilateralism. In short, economic integration in East Asia still remains “shallow.” There are
limited benefits from such integration, since there are much border-related barriers other
than tariffs. A study estimates that trade costs of developed countries total 170 percent, of
which 21 percent come from transportation of goods, 44 percent from border-related trade
barrier, and 55 percent from retail and wholesale distribution costs. The study suggests that
tariff reduction can partly reduce border barriers. Considering that East Asia’s border trade
barriers other than tariff are greater than those in developed countries, this region can
considerably benefit from reduced border barriers.
Present trade patterns are very different from the past patterns as global competition
emphasizes economies of scale. Production process involves sequential stages of
production located across countries. Different stages of production are divided among
different suppliers that are located in different countries. Products traded between
companies in different countries are intermediate goods instead of final products, and final
products are sold outside the region in which international division of labour in production
process happens either intra-firm or inter-firm. This phenomenon is known by many names:
production fragmentation, slicing up the value chain, vertical specialization, and production
network.
The practice of dividing production process into many stages and locating it in
different countries has progressed significantly and is gaining speed in East Asia.
Theoretically, it has been confirmed that in such vertical specialization, a slight decline in
trade costs induces large trade in intermediate goods, since goods are traded across borders
many times.

38
The policy environment for trade facilitation in East Asia varies considerably by
country. For example, customs clearance time in one country is quite different from that of
another country. Customs procedures in many countries in East Asia are still complicated
and lack transparency. This means that the policy space to facilitate trade or reduce trade
costs remains wide. If trade facilitation measures, such as simplification and harmonization
of customs procedure, paperless trading, and mutual recognition, are improved, trade costs
will be reduced and production network will be expanded to a considerable extent.
The enhancement of logistic infrastructure system, including institutional system, is an
issue that should challenge policymakers in East Asia toward realizing deep integration,
since this will facilitate trade and location of production. The study on cross-border trade
facilitation for ASEAN countries by JETRO (2006) reveals that goods between Bangkok
and Hanoi, for example, were transported mainly by sea. This does not fit the “just-in-time”
production operation prevailing in other parts of East Asia. JETRO study suggests that if
logistic infrastructure system, such as road networks, transportation terminal facilities, and
legal institution, is developed and established, then trucking transportation would increase.
4. Conclusion
Intraregional trade and investment have been developed through production networking in
terms of regional division of labour and vertical specialization. Since the Asian Financial
crisis in 1997 and the rapid rise of China, production networking has considerably
developed in East Asia, Northeast Asia, and Southeast Asia. However, the pattern of
industrial development in East Asia is not even and there are many existing structural and
policy impediments to regional economic integration, resulting to growth gaps.

39
In the past, regional economic integration was largely driven by market forces and
supplemented by subregional and bilateral FTAs. Since 2000, the impetus of regional
integration by way of initiating and establishing subregional and bilateral FTAs has
increased considerably. However, due to different FTA strategies adopted by regional
countries and the proliferation of low-grade FTAs, subregional and bilateral FTAs have
resulted to duplication and overlapping rules of origin, dispute settlement mechanism, and
competition policy, as well as other distortions in trade and investment regimes. These
constraints tend to increase transaction costs and trade barriers despite continuing reduction
in average tariff rates in developing countries in East Asia. Increased transaction costs
would tend to reduce industrial dispersion effect in less-developed economies in the region
and, thus, the phenomenon of growth gaps in East Asia would tend to persist.
To minimize this trade and investment distortion and increase production networking,
economies in the region must aim for high-grade FTA and consolidate the existing plethora
of bilateral FTAs. Equally important is policy priority to harmonise customs procedures,
mutual recognition of standards, and improvement of infrastructure and other capacity-
building efficiency to facilitate cross-border trade. Such policy initiatives and measure
would invariably enhance the capacity and competitiveness of the regional economies to
leverage the ever-accelerating globalization through global value change (GVC) trend,
regional division of labour, and vertical specialization of production process, which is
operating more strongly in East Asia than in any other region.
As part of global value chains (GVC) production network, CLMV must be part of the
global value chains process for CLMV to prosper. In other words, individual CLMV
economy must identify its specific market and production niches and contribute to the
overall regional and global production network. Such development strategy applies

40
particularly to countries that have small domestic market and lack in marketable
commodities and resource endowment (Cambodia and Lao PDR may be cited as case in
point). Development strategy of Cambodia and particularly Lao PDR necessitates the
identification of their specific market and production niches, which can contribute to the
production network of the much larger and more-developed economies such as Thailand,
Viet Nam, and China.
More than the need for trade and investment liberalization, CLMV economies urgently
need to undertake long-term, consistent, effective domestic restructuring, as well
institutional and organizational reforms. Likewise, there is a need to institute transparency
and enforce legal framework and good governance through effective civil service
administration.
Without those internal reforms, FDI, under the impetus of globalization and regional
trade and investment agreements, tends to gravitate to more efficient and developed
economies and therefore aggravate the widening development gap in East Asia.
Any regional integration requires the provision of regional public goods by more
developed and stronger economies. A case in point is the role of Germany and France in
providing regional public goods in the early formative years of the European Economic
Community (EEC). These public goods can be in the form of technical assistance, grants-
in-aid, concessionary loans (ODAs), preferential market access without reciprocity, and
other privileges. The provision of these regional public goods is often referred to as
“enabling clause,” with the objective to establish human and institutional capacity for the
less-developed members. Over a period of time, a level playing field may emerge, which
would contribute to the realization of more prosperous, competitive, and equitable ASEAN
economies as envisioned in the ASEAN Vision 2020.

41
It should therefore be the collective responsibility of more-developed ASEAN
members to undertake a long-term initiative in providing adequate public goods to CLMV.
Such as strategic approach would go a long way in establishing a sense of shared prosperity
and in strengthening community value and regional identity as embedded in the ASEAN
Social and Cultural Community.
In this context, the ASEAN-6, on a bilateral basis, have contributed about USD$159.4
million to CLMV to implement various projects and a total of 55.5 percent of the total
funding required in the Integrated ASEAN Initiative (IAI). However, much more resources
need to be provided in the areas of infrastructure, human resource development,
information, communications technology, and customs capacity improvement. In addition,
the ASEAN Development Fund (ADF) is up and running with contributions from Australia
and India, and to a large extent from Japan through Japan-ASEAN Integration Fund (JAIF)
to provide funds for the implementation of Vientiane Actions Programme.
Towards this objective to reduce development gaps, there are existing regional and
bilateral mechanisms to implement development assistance to CLMV. Greater Mekong
Sub-regional (GMS) Initiative provides a comprehensive framework of development
programme. Through the ASEAN-Mekong Basin Development Cooperation, the
programme encompasses the ASEAN Highway Network; the ASEAN East-West corridor
across Viet Nam, Lao PDR, Cambodia, Thailand, and Myanmar; the Singapore-Kunming
Rail Link; and the ASEAN energy network. In this respect, Japan has committed to
providing more than $3-billion assistance to ASEAN for human resource development and
exchange programme for the development of the Mekong sub-region.
What is also urgently needed is a sense of priority and political commitment to
implement those agreed initiatives and programmes based on existing mechanism. With

42
greater and consistent assistance in providing regional public goods, the GMS assistance,
accompanied with timely and correct domestic reforms, CLMV would gradually integrate
with the rest of ASEAN as envisioned in the ASEAN Vision 2020.
Reducing development gap is an important and strategic measure that will establish
ASEAN as a credible and dynamic regional organization ready for economic integration
and the ASEAN Community by 2020. Economic integration goes parallel with economic
competitiveness. To meet the economic challenges that go with the rise of China and India,
ASEAN has to establish a single market and production base of 550 million people.
Without adequate and consistent development assistance to less-developed economies
of CLMV, trade and investment liberalization and domestic reform measures would not be
sufficient to engender a sustained overall development for CLMV. To enable these
countries to participate and contribute fully to regional integration, development agenda are
more important than liberalization in trade and investment at this stage of their
development.
The framework for reducing development gap is already in place. ASEAN needs
policy focus as well as coordination and political commitment among more developed
members and their external partners, particularly within the ASEAN-Plus-Three (APT)
framework, to provide regional public goods (external economies) for their less-developed
ASEAN members.
5. Policy Recommendations
1. Initiate and set up multilateral stakeholder fund and a commitment to increase and
coordinate intra-ASEAN Official Development Assistance (ODA);

43
2. Accelerate economic integration measures as embodied in the Bali Concord II to
increase ASEAN economic competitiveness as an important mechanism to reduce
development gap;
3. Undertake a study to identify policy measures to attract FDI into infrastructure
development in CLMV through a series of workshops organized to review the
recommendations of the study and formulate an implementation strategy;
4. Emphasize intra-ASEAN assistance for education and technical trainings for the
youth;
5. Initiate infrastructure joint development in CLMV to support economic integration;
6. Strengthen coordinating mechanism within the existing subregional arrangements in
the ASEAN;
7. Develop subregional and bilateral trade and investment agreements consistent with
wider regional agreement and will eventually converge to minimize trade and
investment distortions and duplications of rules; and,
8. Establish a scheme to reduce development gaps, which is consistent and in line with
the increasing competitiveness in ASEAN and moving towards a single market and
production base.
REFERENCES ASEAN Secretariat, AFTA Reader Volume V: The Sixth ASEAN Summit and the Acceleration of AFTA, http://www.aseansec.org/viewpdf.asp?file=/pdf/aftaVOL5.pdf ASEAN Secretariat, "ASEAN Investment Area: An Update" in the ASEAN Secretariat Website [downloaded on 1 November 2006], http://www.aseansec.org/6480.htm

44
Burton, David, Wanda Tseng, and Kenneth Kang, “Asia’s Winds of Change” in Finance and Development, (Washington: IMF), June 2006: 8-15. Chia, Siow Yue, "Singapore: Advanced Production Base and Smart Hub of the Electronics Industry" in Multinationals and East Asian Integration, edited by Wendy Dobson and Chia Siow Yue (Singapore: ISEAS), 1997: 31-62. Chong, Vince, “Pearl River Delta Set to be New Growth Story” in The Straits Times, 6 August 2005: p. 13. Crawford, Susan, "Thailand: Detroit of Asia: Thailand's automotive industry plans to leverage its competitive advantages to achieve a top10 world automotive manufacturing ranking by 2010" dated March 2005 in Business in Asia.com [downloaded on 1 November 2006], http://www.business-in-asia.com/automotive/auto_detroit.htm Elson, Anthony, “What Happened?” in Finance and Development, (Washington: IMF), June 2006: pp. 37-43. Gaulier, Guillaume, Francoise Lemonie and Denz Unal-Kesenci, "China's Integration in East Asia: Production Sharing, FDI and High-Tech Trade" in the Centre D'Etudes Prospectives Et D'Informations Interiationales (CEPII) Working Paper No. 2005-09 dated June 2005 [downloaded on 1 November 2006], www.haworthpress.com.innopac.lib.bcit.ca/store/SampleText/5463.pdf Kimura, Fukunari, “International Production and Distribution Networks in East Asia: 18 Facts, Mechanics and Policy Implications” in Asian Economic Policy Review [forthcoming] (UK: Blackwell), May 2006. Kuroiwa, Ikuo (2007) “Cross-Border Production Networks in Southeast Asia: Applications of International Input-Output Analysis. Presented at the ISEAS-IDE Joint Workshop, May 7, 2007. Lim, Hank and Matthew Walls, “ASEAN after AFTA: What’s Next?” in the Occasional Papers Southeast Asia Europe, 3/2004 (Singapore: Friedrich Ebert Stiftung): 91-103.

45
Lim, Hank, Regional Economic Cooperation and Production Networks in Southeast Asia. Presented at the ISEAS-IDE Joint Workshop, May, 2007 Mulapruk, Pishayasinee and Ian COxhead, "Competition and complementarity in Chinese and ASEAN Manufacturing Industries," http://www.aae.wisc.edu/coxhead/papers/gravity_wp-4.pdf , pp. 1-32. Oxley, Alan (Australian APEC Study Centre), "The Value of the ASEAN Free Trade Agreement to Australian business: a strategic assessment" in the APEC website [downloaded on 1 November 2006], http://www.apec.org.au/docs/iss5.htm Sally, Razeen and Rahul Sen, "Whither Trade Policies in Southeast Asia? The Wider Asian and the Global Context" in the ASEAN Economic Bulletin, 22, 1,April 2005 Santo, Renee, "BOI Promotes Opportunities for Investments in Auto Parts Production" in Business in Asia.com [downloaded on 1 November 2006], http://www.business-in-asia.com/automotive/auto_detroit.htm Soesastro, Hadi, "Accelerating ASEAN Economic Integration: Moving Beyond AFTA" dated March 2005 in the CSIS Working Paper Series [downloaded on 1 November 2006], http://www.csis.or.id/papers/wpe091 Singapore Institute of International Affairs (SIIA), "An Intregrated Roadmap for East Asian Free Trade Areas" [draft, unpublished] Singapore Institute of International Affairs (SIIA), "ASEAN Economic Community - Reality Check" in SIIA website [downloaded on 1 November 2006], http://www.siiaonline.org/news_highlights?func=viewSubmission&sid=883&wid=171 Singapore Institute of International Affairs (SIIA), "ASEAN Vision 2020" in the SIIA website [downloaded on 11 March 2006], http://www.siiaonline.org/scm/articles/ASEAN-india_vision_2020.pdf Trade and Industry Dept (TID) of the Hong Kong government, “Trade and Industry Department Fact Sheet on ASEAN Countries” in the TID website, [downloaded on 1 Sept

46
2005], http://www.tid.gov.hk/print/english/aboutus/publications/factsheet/ASEAN2004.html Vo Tri Thanh, "Can the CLV Effectively Engage in the ASEAN Integration?" Paper for presentation at the Seminar "Accelerating Development in the Mekong Region - The Role of Economic Integration" Siem Reap, 26-27 June 2006, pp. 1-28.

47
Chapter 2
ECONOMIC INTEGRATION AND DELOPMENT STRATEGIES: A THEORETICAL PERSPECTIVE
Koji Nishikimi
ABSTRACT Economic integration creates two different forces on industrial location: dispersion and agglomeration forces. The dispersion force relocates industries across integrated countries according to each country’s comparative advantage and achieves the static efficiency of resource allocation. In contrast, the agglomeration force serves as a dynamic source of industrialization but at the same time, it may produce the economic disparities among integrated countries and among domestic regions within each country. In order to work out effective development strategies under the influence of the two forces, it is important to manage dexterously the nonlinear effects, such as home market effect, lock-in effect and hub effect. With these effects, drastic progress in long-term economic development can be triggered by a single success of a short-term program for inviting firms, particularly in the initial stage of agglomeration. Individual policies therefore bear great importance in the industrialization process, but the government of each country is likely to face two kinds of difficulties in developing a successful strategy: (1) strategy-building requires extremely accurate information about the state of the country; and (2) difficulty in policy coordination to avoid excess public investment for development.
1. INTRODUCTION In East Asia, a large number of multinational enterprises have vigorously expanded their
production networks since the 1990s. Moreover, from the beginning of the twenty-first
century, increasing numbers of free trade agreements (FTAs) and economic partnership

48
agreements (EPAs) have been concluded, and the economic integration has been rapidly
progressing in this region on both de facto and de jure bases. The progress in integration
promoted the intraregional division of labor in East Asia and thereby enhanced the
production potentials of the region. As a result, the share of intraregional exports in total
exports by East Asia has rapidly increased from 39.9 percent in 1990 to 51.1 percent in
2005, and their GDP share in the world has grown from 18.9 percent to 25.9 percent
during the period 1990-2004. The progress in regional integration, however, has also
generated serious concern over expanding economic disparities among integrated
countries as well as among domestic regions in each country. For example, China
encounters large and growing difference in production and income between costal and
inland regions: the GDP share of the 11 costal provinces increased from 53.3 percent in
1990 to 61.3 percent in 2003, although these provinces occupy only 12.4 percent of
China’s land.
Economic integration is expected to create two different influences on industrial
location. First, the international difference in comparative advantage leads different
industries to different countries. As comparative advantage structures change over time,
industries would disperse over many countries, and such a tendency becomes clearer as
trade becomes more liberalized with economic integration (the dispersion force of
economic integration). However, when there are significant economies of scale in
production, firms tend to locate in countries/regions close to large markets so as to
exploit the scale merits. This likely forms industrial agglomerations in a limited number
of countries/regions, leaving other regions vacant (the agglomeration force of economic
integration). Hence, with this second force, trade liberalization and capital mobilization
tend to intensify the economic disparities noted above.

49
The relative size of the above two forces should largely determine the overall
effects of economic integration on industrial growth of East Asian countries. It is
regularly pointed out that the flying-geese pattern in Asia recently became more
ambiguous than before, and this fact suggests that the agglomeration force has been
getting dominant in East Asia. The current economic environment in this area might be
rather tough for those countries/regions with small markets. In this chapter, we will
study the desirable development strategies for the Cambodia, Laos, Myanmar and
Vietnam (CLMV) economies, which joined the ASEAN in the late 1990s and now are
vigorously try to catch up with other Asian countries. We attempt to find good ways to
harness the two forces of integration for CMLV’s growth and how to coordinate them
with each country’s strategy for development so as to make the Asian economic
integration really fruitful.
In the following section, we look at how dispersion and agglomeration forces work
in the process of economic integration. Then in Section 3, we examine the effects of
these forces on resource allocation and economic disparity among countries and among
domestic regions of each country. In Section 4, we investigate possible development
strategies that appear to work effectively under the two forces.
2. TWO FORCES OF ECONOMIC INTEGRATION
As briefly discussed above, economic integration likely produces two different forces
on industrial location, i.e., dispersion and agglomeration forces. It should be noted here
that the industrial location pattern and the trade pattern are the two sides of a single coin.
Both closely reflect the competitiveness of each country’s products in the world market.

50
There are two major sources of competitiveness, comparative advantage and home
market effect. The former source works in both cases with and without scale economies
in production, while the latter works only in a situation with significant scale
economies.
2.1 Dispersion force
First, let us examine the dispersion force on industrial location. This force arises from
the comparative advantage structure among trading partner-countries.
2.1.1 Comparative advantage and industrial location
Asian countries exhibit wide differences in endowment of production factors such as
land, capital, and labor with various skills and knowledge. For example, China is
endowed with rich land resource and productive labor force, while Japan accumulates
much engineering knowledge but has relatively small land and labor. The difference in
factor endowment should be an essential determinant of the comparative advantage of
each country. As factor endowment in a country changes with accumulation of physical
and human capital, for example, the industrial structure of that country (and perhaps, of
its trade partners) may evolve reflecting the comparative advantage.
Figure 1 shows a situation where labor becomes scarce relative to (physical and
human) capital in a country that produces electronic appliance and apparel, which are
characterized as capital-intensive and labor-intensive, respectively. Suppose that,
initially, both industries have faced a wage-rental ratio given by (w/r)0. Note that all
points on line AB show the factor inputs that require identical total cost, for example, a
dollar. Hence Q0 units of electronic appliance entail the same cost as q0 units of apparel
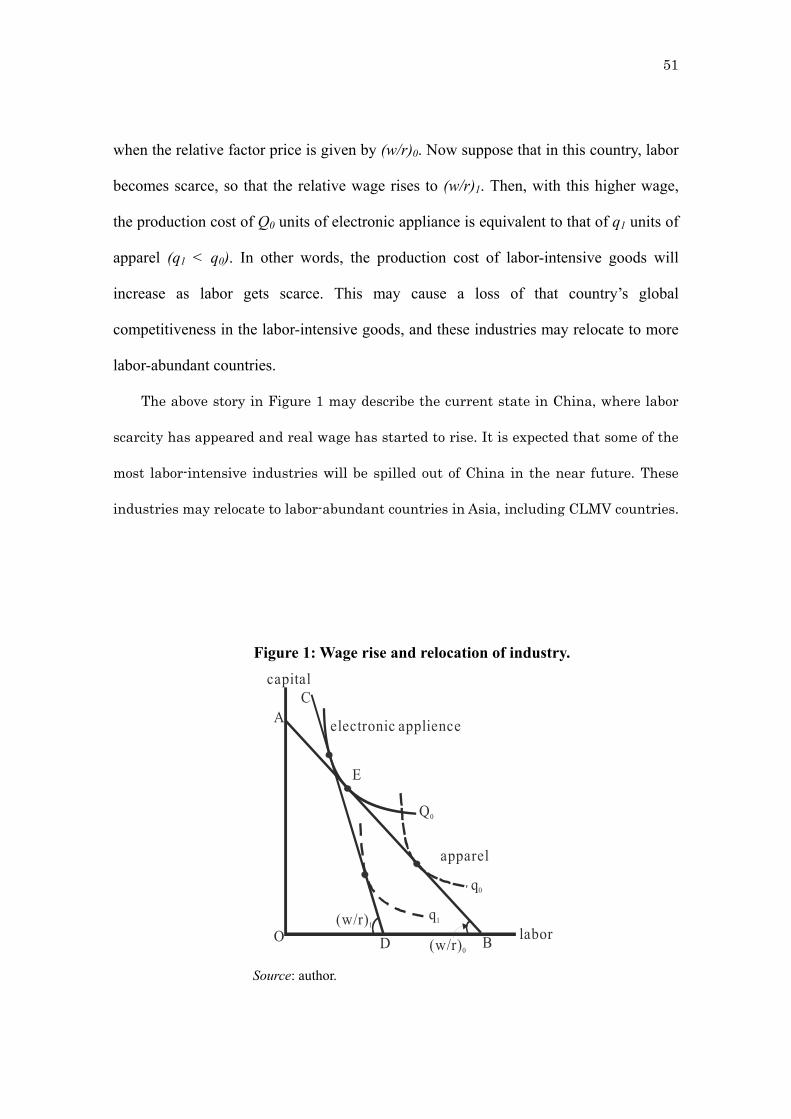
51
when the relative factor price is given by (w/r)0. Now suppose that in this country, labor
becomes scarce, so that the relative wage rises to (w/r)1. Then, with this higher wage,
the production cost of Q0 units of electronic appliance is equivalent to that of q1 units of
apparel (q1 < q0). In other words, the production cost of labor-intensive goods will
increase as labor gets scarce. This may cause a loss of that country’s global
competitiveness in the labor-intensive goods, and these industries may relocate to more
labor-abundant countries.
The above story in Figure 1 may describe the current state in China, where labor
scarcity has appeared and real wage has started to rise. It is expected that some of the
most labor-intensive industries will be spilled out of China in the near future. These
industries may relocate to labor-abundant countries in Asia, including CLMV countries.
Figure 1: Wage rise and relocation of industry. capital
laborO
electronic applience
apparel
(w/r)1
(w/r)0
A
B
C
D
Q0
q0
q1
E
Source: author.

52
2.1.2 Flying geese pattern of industrial development
Applying the above view to a general case that includes many industries and many
countries with variable factor endowments, we can imagine a dynamic process where
industries trickle down from one country to another, reflecting the over-time changes in
each country’s factor endowment. This idea is often called the flying geese model of
industrial development.
In the context of East Asia, Japan has played the role of the “lead goose” ---i.e., the
first to start operating the new industries in the area. As it gains advantages in
production of more advanced goods, Japan successively releases industries in which it
no longer holds a comparative advantage. Then, these industries relocate to nearby
less-developed countries (the Asian NIEs), which, in turn, encourages relocation of
some outdated industries in the “follower-geese” countries to the neighboring
less-developed countries (ASEAN, China, and CLMV). This flying geese model fits the
“catching-up” industrialization of Asian economies until the 1980s. More recently,
however, the flying geese pattern in East Asia has become vague and more complicated
with multiple lead geese, as asserted by Fujita and Hamaguchi (2007).1
2.1. 3 Fragmentation
The traditional arguments on comparative advantage and the flying-geese
industrialization have focused on production of final goods. In Asia, however, the
international division of labor has recently made substantial progress, particularly in the
1 In the 1990s, the Asian NIEs caught up with Japan in certain technological areas such as semiconductors and information and telecommunication equipment (i.e., notebook computers and mobile telephones). On the other hand, China emerged not only as a location for cheap labor but also as a huge consumer market. These might be caused by the agglomeration forces of de facto economic integration, which would be discussed in the following sections of this chapter.

53
production of intermediate goods. Many enterprises in the automobile and electronics
industries, for example, separate several processes of production and relocate them to
different countries, according to the market conditions prevalent in each country. This
phenomenon is often called fragmentation and has been intensively studied since the
late 1990s.2
In the case of firms that apply fragmentation, the industrial location pattern can be
basically described by the same theory of comparative advantage, as shown by Jones
and Kierzkowski (2001) and Deardorff (2001).3 For example, suppose that the
production of the electronic appliance given by point E in Figure 1 can be separated into
two subprocesses, production of components (Z1) and assembly (Z2), as depicted in
Figure 2. In the figure, we assume that the process of component production is more
Figure 2: Fragmentation. capital
laborO
electronic applience
(w/r)0
A
BD
E
Z2
Z1
assembly
component
Z1
Z2
~
~
Source: author.
2 For detailed analysis of fragmentation, see Arndt and Kierzkowski (2001) and Jones (2000). 3 Here we assume that the production process in a fragmenting firm is characterized by constant returns to scale. When it is subject to increasing returns to scale, the location pattern is affected by home market effects as well as comparative advantage, as discussed in detail in the next section.

54
capital-intensive than the assembly process. Recall that line AB in Figure 2 (and Figure
1) represents a-dollar-worth inputs of capital and labor when the relative wage is given
by (w/r)0. Hence 1~Z units of the components cost as much as 2
~Z units of the
assembly service. If labor becomes scarce, the relative wage will rise. This makes
assembly service more expensive and encourages the electronics firms to relocate their
assembly process to countries where labor is more abundant and cheap. Clearly, this
process of fragmentation is caused by the same mechanism of comparative advantage as
the location process of the final-good industries, which is drawn in Figure 1.
In addition to changes in factor prices, a decrease in international transportation
and communication costs among various location sites will encourage firms to apply
fragmentation and build up their global intra-firm production networks, which enables
more effective exploitation of the location advantages. In this sense, economic
integration promotes global dispersion of industries.
2.2 Agglomeration force
2.2.1 Home market effect and industrial agglomeration
The origin of the agglomeration force can be found in the scale economies of production,
which we temporarily set out of our view in the preceding section for the sake of
analytical simplicity. Suppose that manufacturing process of sector M (the electronics
sector, for example) is characterized by increasing returns to scale. We also assume that
international transportation entails significant cost, while domestic transportation costs
are negligible. Then, if M-firms produce the same homogeneous good, all domestic
production of M should be supplied by a single firm as a result of competition. In this
case, because of the scale economies, an M-firm operating in a country with large

55
markets can produce at lower cost, hence, tends to be more competitive in the world
market. Then, export brings more production and higher efficiency to these firms. This,
in turn, lowers the domestic price of M, which makes the consumers in that country
better off. In short, the size of the home market affects the real income (utility) of the
consumers in that market. This mechanism is often called home market effect.
The above story of natural monopoly with homogeneous M-products gives a
simple and clear picture of the home market effect, but the result may seem to rely
heavily on the assumption of pure monopoly in M-market, which is seldom observed in
the real economy. Then one may wonder if home market effects can be obtained even
when the market is not purely monopolistic. When manufactured goods are not
homogeneous but slightly differentiated from each other, there should be multiple (or
even many) producers at an equilibrium. Such situations are lucidly described by the
monopolistic competition model of Dixit and Stiglitz (1977). In their model, each firm
exhibits increasing returns to scale; hence, each variety of manufactured good, Mi, gets
cheaper as its home market becomes large. When the price of Mi declines, however,
consumers may spend their spare money to buy a new variety of M, rather than to
increase their purchase of the existing varieties. In fact, at the equilibrium of
monopolistic competition in Dixit and Stiglitz (1977), an increase in market size does
not affect the production quantity of each firm but increases the number of varieties of
manufactured goods. In this case, consumers enjoy higher utility with consuming a wide
variety of M-good. Accordingly, the size of the market affects the real income, and the
home market effects are therefore at work in the case with many M-firms, too.
Incorporating domestic transportation costs into the above model, we can obtain a
domestic version of the home market effect: A large market attracts producers of a wide

56
variety of differentiated goods and gives consumers higher utility by providing those
goods at cheaper prices. In addition, for the case of the domestic economy, it should be
natural to allow labor (= consumer) migration across regions. With labor migration, the
home market effect works more extensively by forming a circular effect between
demand and supply growth: Labor (= consumer) migrates to the place where a wide
variety of consumer goods are available, and this brings more income to spend at the
market there, which in turn attracts more firms to that place. As a result, there emerges a
large agglomeration of producers and consumers.4
2.2.2 Effects of transport hub
Other than the labor migration discussed above, there are several factors that form
circular effects and stimulate the agglomeration mechanism. Formation of transport
hubs is perhaps the most popular factor.
The basic mechanism of hub-formation originates from scale economies in
transportation, which have been realized by the development of large-sized and
high-speed carriers, such as large container ships, bullet trains, and jumbo jets. The
scale economies provide an incentive for collective transportation and hence stimulate
the development of transport network systems with trunk routes and the hub-spoke
structure of transportation.
Trunk routes often arise from the following circular causations. Suppose there are
regular services of transport on a given link. If this link is used, shippers can save
substantial costs from seeking a transporter for individual shipment. This attracts many
shippers to use this link, which in turn supports even more frequent transport services in
4 For detail of the agglomeration mechanism, see Fujita et al. (1999) and Baldwin et al. (2003).
57
the link. This positive feedback mechanism eventually leads to the endogenous
formation of a trunk link and transport hubs at the two ends of the link. When scale
economies in transportation rule the transport advantage of each location, a major
transport node (hub) can spontaneously emerge at any place that has a large transport
demand such as the sites of industrial agglomeration.
Once a hub-spoke structure arises in a transportation network, the hub attracts
many producers and consumers by its significant transport advantages. This will switch
on the reciprocal reinforcement process between transport hub and industrial
agglomeration.5
2.2.3 Specific labor market
Another stimulation factor of agglomeration emerges when a pooled market for workers
with special skills is formed. Such a market benefits both workers and firms as Marshall
pointed out in his 1920 book:
[A] localized industry gains a great advantage from the fact that it offers a constant market for
skill. Employers are apt to resort to any place where they are likely to find a good choice of
workers with the special skill which they require; while men seeking employment naturally go
to places where there are many employers who need such skill as theirs and where therefore it
is likely to find a good market. The owner of an isolated factory, even if he has good access to
plentiful supply of general labour, is often put to great shifts for want of some special skilled
labour; and a skilled workman, when thrown out of employment in it, has no easy refuge.
(Marshall 1920: 271-272)
5 This reciprocal reinforcement is often called hub effect. For detail of the hub effect, see Krugman (1993), Fujita and Mori (1996), and Mori and Nishikimi (2002)

58
In the modern context, the most prominent example of this factor should be
perhaps given by the case of IT clusters in Silicon Valley and Bangalore, where a large
mass of IT firms and high-tech engineers have established a pooled market and attracted
more firms and engineers.
2.2.4 Local Spillover Effects
Industrial agglomeration can be also caused by local spillover of information.
Up-to-date knowledge of production technologies and market trends often plays a key
role in many fields of business. Hence, individual producers always try to accumulate
and update their knowledge bases. Such knowledge and information tend to spill over
from one producer to another through face-to-face business contacts, close monitoring
of rival firms and other daily communications, all of which should be easy if producers
operate together in a same production site. As a result, firms in the same industry or
closely related sectors are likely to be agglomerated. When a large number of firms are
clustered in a small area, competition among them becomes severe, so that the firms
naturally get specialized in slightly different products. This leads to monopolistic
competition and creates a circular causation of further agglomeration via home market
effect, as discussed in Section 2.2.1.
It should be noted here that in reality, the above forces of agglomeration often
appear to operate together, so that we cannot simply identify the main factor of an
existent agglomeration. For example, suppose a significant number of IT manufacturers
operate side-by-side to exploit the information spillover effects. This may create a local
market of high-tech engineers equipped with special knowledge and skills for their
production and R&D activities. As production increases, transport network will be

59
developed to connect this site and major markets outside, and the site may become a
transport hub if the transportation grows sufficiently. Once a hub emerges, it attracts
large numbers of consumers as well as firms in various industries. All these factors
interact with one another and create a large industrial cluster.
3. RESOURCE ALLOCATION AND DISPARITY EFFECTS OF
INTEGRATION
3.1 Resource allocation effects
The dispersion and agglomeration forces bring different effects on resource allocation in
the integrated economy. In the case of industries without scale economies, a competitive
equilibrium with the dispersion force achieves a Parato optimal allocation. In contrast, if
scale economies are at work, the agglomeration force may well bring about an
inefficient allocation of resources. Below, we look at the allocation consequence of each
case.
3.1.1 Efficiency gains from trade liberalization
First, let us examine the allocation effects of trade liberalization in a case without scale
economies. Suppose two countries are being integrated. They produce two goods,
electronic appliance and apparel, which are respectively capital-intensive and
labor-intensive sectors, as in the case shown in Figure 1. Country 1 is assumed capital
abundant, while Country 2 is labor abundant. In Figure 3, curves BD and CE depict the
production possibility frontiers (PPF) of Countries 1 and 2, respectively. Sliding the
PPF of Country 2 along Country 1’s PPF, we can draw the envelope AG’H’F, which
represents the PPF for the integrated economy of Countries 1 and 2. Note that total

60
production OG’ can be decomposed into Country 1’s production OG and Country 2’s
production GG’. Moreover, the slopes of the three PPFs (marginal rates of
transformation) are all equal at the corresponding points, G and G’.6 It should be noted
that market competition leads producers to achieve a production point where the slope
of PPF is equalized to the relative price of the two products. Hence, free trade
equilibrium realizes an efficient production in the integrated countries, such that the
production point locates on the frontier PPT curve AH’F in Figure 3.7
Figure 3: PPF and Production Efficiency in the Integrated Countries.
A
B
C
O D E F
G
G’
H H’
elecrtonicapplience
apparel
A
B
C
O D E F
H H’
elecrtonicapplience
apparel
I
I’
(a) PPF for the integrated economy (b) efficiency of resource allocation
Source: author.
6 This can be verified by using the envelope theorem. 7 In addition to the production efficiency discussed in the text, efficiency in consumption is also realized at a competitive equilibrium under free trade. For details, see standard textbooks on microeconomics.

61
Now, suppose import taxes are levied, so that the relative price differs between
Countries 1 and 2. Production in the two countries will occur at the points where the
slopes of their PPFs are different, for example, at points H and I in the right panel of
Figure 3. In this case, total production in the two countries is given at I’, which locates
in the interior of the production possibility set, OAF. This resource allocation is not
efficient because the production of both goods can be increased if resources are
relocated so that Country 1 produces more electronics and Country 2 provides more
apparel.
Such production can be achieved by eliminating the import taxes. In fact, if all
tariffs are completely removed, then all producers in the two countries encounter the
same product prices. This leads production in the integrated economy to a point on the
envelope that achieves a Parato optimum allocation of resources. In other words, trade
liberalization accompanying the process of economic integration will improve the
efficiency of resource allocation in the integrated economy as a whole.
It should be noted that trade liberalization brings about an efficient resource
allocation even for cases where firms apply fragmentation. As was discussed in an
earlier section in this study, the location of producers of intermediate goods is affected
by the comparative advantage structure basically in the same way as that of final-good
producers. Hence, not surprisingly, trade liberalization brings about a gain in efficiency
in resource allocation. Moreover, a decrease in international transportation and
communication costs that accompany the process of economic integration will
encourage firms to relocate their production processes to countries where their
necessary inputs are available at cheaper prices. Accordingly, economic integration will
improve the efficiency in resource allocation for cases with or without fragmentation.

62
3.1.2 Allocation efficiency of agglomeration equilibrium
Next, we examine the allocation efficiency for cases where agglomeration forces are at
work. The entire efficiency depends on how many industrial clusters exist in the
equilibrium. Hence, the key question here is: Is there a reliable mechanism that
generates the optimal number of clustering sites? In the real world, we often observe
that new industrial clusters emerge in the process of economic growth. This suggests
that market mechanism adjusts, to some extent, the number of clusters according to the
size of the economy. However, it does not necessarily imply that the optimal number of
industrial clusters are created by market forces. In fact, home market effect, which
provides a main cause of the agglomeration force, tends to realize an excessively small
number of large agglomerations.
Figure 4 shows how the home market effect hinders multiplication of clustering
sites. Assume that, unlike in the previous examples, electronics manufacture is
characterized by scale economies and, hence, by home market effects. Assume further
that there is a single cluster of that industry at Site 1. If the production in Site 1 is
sufficiently small as shown by the part of O-QA in the left panel of Figure 4, the utility
of residents near the site rises as production increases, due to the home market effects.
We further assume that the home market effect diminishes as the production becomes
larger than QA, so that the utility at Site 1 hits the maximum at A and then decreases as
shown in the left panel of Figure 4.8
8 This occurs if there is a technological limit in product differentiation or if an expansion of employment and production in the electronics industry raises the prices of other products.

63
Figure 4: Allocation Efficiency with Home Market Effect.
U for residents
O
A
electronics site
production
Bu0
uA
QBQA
U for residents
O
electronics site 1
electronics site 2
production
Bu0
uA
QBQ (=Q /2)E C
CD
QC
E
QD
uC
FG
C’H
(a) Single cluster (b) Two clusters Source: author.
When demand for the electronic appliance increases, the agglomeration at Site 1
will continuously grow over the utility-maximizing size, QA. Of course, any electronics
firm can start producing alone at a site outside the cluster. However, such a firm will
face some difficulty in finding good workers because workers at the new site achieve
less utility, u0, than at the agglomerated site, due to home market effects. To keep
workers in a small town, the relocating firm has to pay more wage than the
agglomerated firms. As a result, home market effect tends to hinder the emergence of
new clusters and make the existing agglomerations too large. Without policy
intervention, the agglomeration at Site 1 will grow up to QB, where the utility level at
that site equals to that at a potential new site.
Now suppose that the electronics production in Site 1 is given by QC in the right
panel of Figure 4. In the figure, the production at the (potential) new site, Site 2, is
measured to the left from Point QC, and the utility for Site 2’s residents is represented by

64
Curve C’EG, which is drawn as a horizontal mirror of Curve HEB.9 Since QC is smaller
than QB, individual producers do not have sufficient motivation to start production in a
new site. However, even in this situation, the creation of Site 2 will make both sites’
residents better off. If the critical mass of production, QC-QB, is transferred from Site 1
to Site 2 (perhaps by some policy measures), Site 2 starts growing spontaneously
because it provides greater utility than Site 1. When the production in Site 2 exceeds
QC-QE, some workers and firms in Site 2 will go back to Site 1, where larger utility is
attainable than in Site 2. Therefore, Point E represents a stable equilibrium with two
agglomerated production sites.10 Note that at Point E, residents in both sites achieve
greater utility, as compared to the equilibrium with a single agglomeration. In other
words, the equilibrium represented by Point C does not achieve the optimum allocation
of resources while it is a stable equilibrium, too.
To sum, in cases where home market effect exhibits a reverse-U shape, market
competition tends to hinder creation of new agglomeration. Economic liberalization
accompanying the process of regional integration leads to excessive localization of
producers with such effects.
3.2 Disparity effects
As we discussed in Sections 2.2 and 3.1.2, market forces lead the industries with scale
economies to be localized in a small number of locations. Liberalization of international
trade and investment encourages localization of such industries and intensifies
economic disparities among integrated countries as well as among regions within each
country. 9 For simplicity, we assume that the two sites provide identical conditions for production. 10 In the right figure of Figure 4, there are three stable equilibria, Points C, E and G, and two unstable equilibria, Points D and F.

65
3.2.1 Transport costs and core-periphery structure
How integration widens regional disparity is well explained by the core-periphery
model whose essence has been discussed in Section 2.2. Using a two-region economy
model, Fujita et al. (1999) closely examine the stability of geographical configuration of
industries and show that transport costs between the two regions play a critical role in
creating a core-periphery structure in a regional economy. Figure 5 depicts their main
results. The two curves in the figure show the relations between Region 1’s labor share
and the ratio of utility for Region 1’s residents to that for Region 2’s residents, for cases
with high and low rates of transport cost, respectively. If transport is prohibitively
expensive, an increase of labor in Region 1 lowers the price of its products and wage
because supply growth does not meet the corresponding growth in export demand.
Accordingly, for the case where high transport rate exists, the relative utility of
Region 1 is given by the downward sloping curve in Figure 5. By contrast, if transport
cost is sufficiently low, a growth in the regional supply potential leads to an increase of
real wage (in utility term) in that region, due to home market effects. Hence, for this
Figure 5: Stability of Equilibrium in Two-region Model.
½ 1
1
O
u /u1 2
A
B
C
LL +L
1
1 2
____
high ratelow rate
Source: author.

66
case, the relative utility curve has a positive slope.
In both cases, the symmetric distribution of industries between two regions
(represented by Point A) gives an equilibrium configuration. But the above-noted
difference in slope of the curves produces a striking contrast in the stability of
equilibrium between the two cases. When transport cost is sufficiently high, a small
increase in Region 1’s labor force lowers u1/u2, which attracts labor back to Region 2,
and vice versa. The equilibrium point A is therefore stable. When transport cost is low,
in contrast, a small increase of labor in Region 1 raises u1/u2 and encourages more
migration. In this case, the symmetric equilibrium is not stable, and the regional
economy will be led to an extremely unequal state, Point B or C.
The above result of Fujita et al. (1999) is quite suggestive for the case of economic
integration, too. The process of economic integration is often accompanied with a
decrease in transport costs in a broad sense, including pecuniary/time costs for
transportation as well as tariff/nontariff trade barriers. If it produces a change in stability
of the dispersed equilibrium, as shown in Figure 5, then it will suddenly create a large
disparity among integrated regions.
3.2.2 Disparity among countries
Within East Asia, international mobility of products, materials and capital has been
increasingly enhanced, but labor mobility is still substantially limited across countries,
so far. Hence, so as to examine how regional integration affects economic disparity
among the integrated countries, the core-periphery model discussed above needs to be
modified for cases where labor mobility is restricted only within countries. To do this,
Nishikimi (2007) extends the core-periphery model with footloose capital developed by

67
Figure 6: Three-country Model of Economic Integration.
ROW
Country 1 Country 2
Economic Integration Source: Nishikimi (2007).
Baldwin et al. (2003). He assumes three countries, Countries 1, 2 and ROW, of which
Countries 1 and 2 are forming an economic integration as illustrated by Figure 6.
Each country is endowed with two kinds of production factors, labor and capital. It
is assumed that capital is internationally mobile without cost, while labor is immobile
across countries. These production factors are to be used in two sectors: differentiated
manufacture characterized by increasing returns to scale (IRS), and agriculture with
constant returns to scale (CRS). Products of these two sectors are traded among the
three countries, but they involve transport charges. Suppose that transport between the
integrated countries costs less than that between ROW and each of Country1 and 2.11
Now, the question is: What geographical distribution of the IRS manufacture will
emerge in equilibrium? Figure 7 shows the relationship between transport cost and each
county’s share in world production of manufactured goods. In both panels of Figure 7,
the vertical axis represents each country’s share in manufacturing, sn (n=1,2, ROW),
while the horizontal axis gives the “freeness of trade” within the integrated economy, f,
11 Nishikimi (2007) simply assumes that transport cost between ROW and Country 1 equals to that between ROW and Country 2.

68
which is defined as the proportion of transport cost in the delivered price of the
manufactured goods ( ). The value of f equals unity when transport cost is zero,
and it approaches zero as transport cost becomes infinitely large. These figures are
drawn by assuming that the freeness of the transport between ROW and each of
Countries 1 and 2, f’, is lower than that of trade within the integration ( ).
The left panel (a) of Figure 7 depicts the case where the three countries are
endowed with identical quantities of labor and capital. When transport cost within the
integrated economy is as low as transport cost in the trade with ROW (i.e., f=f’), the
three countries are situated in completely the same conditions, and thus in equilibrium.
They have the same share of manufacturing industry, . As the
freeness, f, increases in the process of economic integration, an increasing number of
manufacturing firms relocate from ROW to Countries 1 and 2 because the transport
facilitation within the integrated economy makes ROW relatively isolated and less
attractive to the global capital. Yet, the shares for Countries 1 and 2 are always equal as
they have identical conditions. In this case, therefore, integration does not intensify the
disparity between the integrated countries.
In contrast, if there is a large difference in factor endowment, integration may
intensify the disparity between the integrated countries. The right panel (b) of Figure 7
shows a case where Country 1 is much smaller in factor endowment than Countries 2,
while keeping all other assumptions the same as the symmetric case of panel (a). As
integration progresses (f increases), the smaller country in the integrated economy,
Country 1, loses its share of manufacture. This is because the home market effect works
between Countries 1 and 2. Eventually, when f =1, all firms are agglomerated in
Country 2. In cases where diversified countries with different endowment are forming

69
Figure 7: Transport Cost and Production Shares.
1
2/3
1/3
½
sn1+2
sn1
snROW
sn2
sn1
10
sn
f ’freeness of transport
1
2/3
sn1+2
snROW
sn2
sn1
10
sn
f ’freeness of transport
(a) Symmetric case (b) Highly asymmetric case Source: Nishikimi (2007).
integration, the economic disparity may expand as trade liberalization progresses in the
process of integration.
3.2.3 Disparity among domestic regions
Nishikimi (2007) also examines how integration of countries affects the disparity
among domestic regions within each country. To do this, the preceding model is revised
in as much as Country 1 is assumed to compose of two regions, U1 and R1, as shown in
Figure 8. It is assumed that all international ports in Country 1 locate in U1, while R1 is
situated in deep inland. Domestic transport of the manufactured goods also incurs costs,
and, as in the previous model, capital is freely mobile across countries and regions,
while labor is mobile only within each country.

70
Figure 8: Three-country, Two-region Model.
Region U1
Region R1
Country 1
Country 2
Economic Integration
ROW
T ’M T ’M
TM
T ”M
Source: Nishikimi (2007).
Nishikimi (2007) shows that a decrease in transport cost accompanying the process
of integration accelerates localization of the IRS manufacturing industry in urban area,
U1. This is because market integration provides larger opportunities to Region U1,
which possesses the advantage of better accessibility to the integrated market than
Region R1. As a result, economic integration tends to intensify the economic disparity
among domestic regions, U1 and R1.
4. DEVELOPMENT STRATEGIES UNDER ECONOMIC
INTEGRATION: POLICY IMPLICATIONS
Based on the discussions in the preceding sections about several effects of economic
integration, we now investigate possible development strategies for countries where
economic integration is ongoing.

71
If the dispersion forces alone are at work in the process of integration, it would be
rather easy to design a strategy. Every country can achieve an efficient resource
allocation by fully utilizing market mechanism. In this case, all we need are
liberalization and facilitation of trade for the market to work smoothly. However, the
dispersion force does not seem to dominate in recent East Asia -- the flying geese
pattern of industrialization is no longer clearly observed, and a growing number of
industrial agglomerations have been emerging in various areas of the region. The
agglomeration force appears to exert significant influences upon the industrial
development in this area.
Under the influence of the agglomeration force, a small difference in the initial
state may be amplified throughout the development path while a huge difference may be
seen in the consequence. In this sense, individual development policies can trigger a
long-term prosperity in economic development, but at the same time can entail a
considerable risk of policy failure, which may cause long-term problems in
development performance.
4.1 Transport costs and economic development
4.1.1 Transport development and lock-in effects
In Section 3.1.2, we have seen how the home market effect encourages growth of
existing agglomeration and hinders birth of new clusters. This often brings a result
where once a geographical structure of industrial agglomeration appears, it tends to be
preserved even if that structure is not efficient. This tendency is regularly referred as
lock-in effect of agglomeration.
More importantly, as transport cost and tariff/nontariff trade barriers are lowered,

72
competition among industrial agglomerations becomes severer, and this poses tough
conditions to infant clusters. In other words, the lock-in effect becomes more prominent
as economic integration progresses. Therefore, each country can hardly foster clusters
by merely promoting economic integration. Each integrated country needs to build up
its own strategy to attract industrial firms, in competition with all other surrounding
neighbors.
While the agglomeration force causes the lock-in effect, it can fuel the
development of a new cluster if the government successfully attracts a critical mass of
producers to a production site by implementing an appropriate policy, as illustrated in
Figure 4. In this sense, integrated countries should try to design their strategies so as to
utilize the agglomeration forces rather than to suppress them.
4.1.2 Development of transport hub
As discussed above, a decrease in transport cost alone is likely to discourage creation of
new agglomerations in less industrialized countries. However, this will not occur if the
decrease in transport cost is accompanied by formation of a transport hub. As discussed
earlier, a reciprocal reinforcement mechanism works between development of transport
hub and formation of industrial agglomeration, once the transport volume at the hub
exceeds a critical level. Hence, if the government of a country succeeds to develop a
transport hub up to a proper size, then the development of the hub and the cluster will
be accelerated spontaneously by that mechanism.
In Laos, for example, Vientiane has a good geographical advantage for its
proximity to large cities in the surrounding countries such as Bangkok, Chiangmai,
Hanoi, and Kunming. So as to exploit this advantage, the government needs to build a

73
transport network connecting all the above cities and, at the same time, to stimulate
industrial production in Vientiane. It should be noted that at this stage of development,
the industrial production does not necessarily bring about the home market effect. It has
only to create substantial demand for transport of the products and materials along the
newly developed network. For emerging economies with small domestic markets, in
particular, it seems feasible to start with fostering CRS industries such as foods,
garments, and wooden products, rather than IRS industries such as chemicals,
machinery, and electronics. They will be able to upgrade industries consecutively after
establishing a transport hub, which connects and integrates several nearby markets.
The above strategy of industry-upgrade together with hub development appears to
be applicable to other countries, too. For example, in Cambodia, a growing number of
garment producers have recently operated in Phnom Penh, attracted mainly by cheap
local labor. If the Cambodian government can successfully provide the appropriate
transport infrastructure, its priority industry will bring about significant demand for
transport to various cities, including Bangkok, Ho Chi Minh, and Sihanoukville for
export by sea. Then, this will allow Phnom Penh to be a transport hub and enjoy the
special location advantages in attracting IRS industries, which are generally
accompanied by the agglomeration force and the lock-in effect in industrial localization.
This development strategy with consecutive industry-upgrading seems steadier and
more feasible than the strategy to form an agglomeration of IRS industries at one stroke
by developing a special economic zone.
4.1.3 Control on transport costs
Another policy implication of the spatial economic arguments is the possibility of

74
industrialization by manipulating trade/transport costs. Fujita and Mori (1996) examine
the evolution pattern of industrial agglomeration, assuming the location space depicted
in Figure 9. The integrated economy consists of two countries, which are connected
only by one link (highway or sea route) between two transport hubs, A and B. In the
initial state, a single agglomeration exists at A, the hub in Country 1.
Figure 9: Location Space.
A
B
(transport hub)
(transport hub)
agglomerationCountry 1
Country 2 Source: Drawn by author based on Fujita and Mori (1996).
Figure 10 shows the typical evolution pattern of agglomeration formation in this
two-country economy.12 In the figure, the horizontal axis represents the cost required
for transport of the IRS product between the hubs,13 while the vertical axis represents
the total size of the integrated economy (total labor endowment). When the economy is
sufficiently small, only the initial agglomeration can continuously exist in this
integrated economy, no matter how much the transport costs. As the economy becomes
large, a new agglomeration emerges in either country. If the international transport cost
is sufficiently large, the new cluster appears in Country 1. In contrast, when the trade
12 Figure 10 is drawn for the case where labor is freely mobile across countries. In this case, the equilibrium level of consumers’ utility (real wage) is equalized between the two countries. If we allow for international difference in the real wage, we can obtain a similar result to Figure 10 for the cases with restrictive labor mobility, too. 13 We assume that transport of CRS products does not entail any cost.

75
cost is small, the new cluster appears in Country 2 although it requires a relatively large
market because of the strong lock-in effect created by the first cluster.
Now, suppose that the current state of the economy is given by Point E in Figure 10.
What policy can the government of Country 2 exert so as to establish a new industrial
cluster in Country 2? One possible choice is the laissez-faire policy: i.e., just wait for a
sufficient growth of the integrated market without enforcing any active policy, as
indicated by the arrow (1) in Figure 10. If regional integration expands the market
enough to overcome the lock-in effect of the existent cluster, Country 2 will obtain a
new cluster. If not, it may require a long time to foster the market.
Figure 10: Bifurcation Pattern and Alternative Transport Policies.
Economic size of the integrated economy (Countries 1+2)
O Transport costs between A and B
emergence of a new agglomeration in Country 2 emergence of
a new agglom-eration in Country 1
single agglomeration in Country 1
EG
(1)(2)
(3)
Source: Drawn by author based on Fujita and Mori (1996).
There is such an alternative policy measure as represented by the arrows (2) and
(3). That is, the government can foster a new cluster by increasing the international
trade cost by means of tariff and nontariff barriers [arrow (2)]. Then, once the new

76
cluster is established in Country 2, it creates the lock-in effect and can remain at the
same place even if the government replaces the policy and lowers the trade cost to the
previous level [arrow (3)]. In other words, the government of Country 2 can set up a
new cluster by a temporary restriction of international trade, utilizing the lock-in effect.
This policy measure sometimes works effectively, especially in cases where infant
industries need to be nurtured.
The above arguments suggest that a temporary policy intervention may affect the
entire path of economic growth. If the government can manipulate such policy measures
accurately according to circumstances, it may be able to achieve the optimal
development by carefully choosing the growth path. However, it should be noted here
that those policies involve formidable risks of failure. For example, in Figure 10,
suppose that the initial state of the integrated economy is represented by Point G,
instead of Point E. In this case, the above policy of increasing the trade cost will lead to
the emergence of a new cluster in Country 1 instead of Country 2. This leads economic
disparity between the two countries to intensify, which is just the opposite of what is
expected. As a matter of fact, it is quite difficult to identify correctly whether the
economy is at Point E or G. Identical policies in similar situations can lead to
completely different results. Halfhearted policymaking with superficial information may
lead to negative results. Moreover, we have to remember that under the dominance of
the agglomeration force, a temporary failure can affect the entire path to economic
development.

77
4.2 Competition in public investment
4.2.1 Excess investment for agglomeration-luring
As discussed in the preceding sections, long-run industrialization and economic
development may be triggered by the success of a short-run program for firm attraction,
particularly at the initial stage of agglomeration development. Therefore, the
governments of many countries are eager to construct special economic zones (SEZ)
and huge international ports/airports, spending large amount of public funds and
economic assistances from abroad. This leads to an international competition in luring
agglomeration, but unfortunately, not all of the investments can be rewarded because of
the limited market size in developing countries.
Figure 10 above shows that when the market is relatively small, only a single
cluster can be sustained in the entire area of the integrated countries. A similar situation
can also be demonstrated by Figure 11. This figure depicts the home market effect of the
clustering industry by revising Figure 4 for the case where market demand in the
integrated economy is so small, as given by QF in Figure 11. In this case, there are three
equilibria of which the dispersive equilibrium G is unstable, unlike the case of Figure 4.
Thus, if two countries compete in investment to attract agglomeration, either of them
has to abandon its development plan. As a result, a large amount of investment will be
wasted.14 That is, without any coordination among governments, severe competition
among neighboring countries will lead to excess investment for agglomeration-luring.
14 The government can avoid the passing of agglomeration by enforcing protectionist policies, but it will be accompanied by large costs of misallocated resources.

78
Figure 11: Prisoner’s Dilemma in Development Policy. U for residents
O
electronics site 1
electronics site 2
production
uG
uF
QF
F
u0
QG
GF’
Source: author.
4.2.2 Benefits and risks of policy coordination
The agglomeration-luring activities by adjacent countries have a game structure that is
of the prisoners’ dilemma type, and this is the main cause of the excess investments
devoted to industrial agglomeration.
At the initial stage, many neighboring countries have an equal opportunity to
obtain a new industrial cluster, and the cluster may be set up by a short-run policy, as
discussed previously. In such a situation, it is rather natural for governments of those
countries to eagerly invest in cluster-building. To avoid the redundant investment by
neighboring countries, those countries need to coordinate their policies in this aspect.
For example, the number and location of international airports should be determined in
cooperation with neighboring countries, so that the countries can efficiently share the
optimal number of airports. Otherwise, each country may try to construct an
international airport for its own use, and this is clearly an over-investment. Similar
problems can occur in the construction of SEZs for large-scale agglomerations, such as

79
that on automobiles, electronics, and heavy chemicals.15
Policy coordination, however, is not a panacea for the efficient resource allocation
in agglomeration-luring. It may produce a serious side effect: Coordination can easily
shift to collusion. If geographical distribution of clustering industries is determined by
negotiation in the intergovernment assembly, then those industries are likely to be
separated from market competition. This would make the industries spoiled and cause
serious inefficiency in resource allocation. Of course, inefficient producers cannot
survive the market competition, and the industrialization may fail in the long run. We
are thus placed in a dilemma over what development strategy can be applied and need to
look for a better way of allocating investment.
5. CONCLUDING REMARKS
In this chapter, we have examined two forces, dispersion and agglomeration forces,
which are brought about by economic integration. These two forces bring different
effects on resource allocation in integrated countries. In cases without scale economies,
the dispersion force determines industrial location according to each country’s
comparative advantage, and a competitive equilibrium achieves a Parato optimal
allocation. In contrast, if scale economies are at work, the agglomeration force serves as
a dynamic source of industrialization and rapid economic development. However, this
force tends to bring about inefficiency in static allocation of resources, and it may also
produce serious economic disparities among integrated countries as well as among
domestic regions within each country.
15 An effective coordination must be accompanied with some programs to compensate the devolving countries for forgoing benefits of the abandoned facilities, such as international airports and SEZs. It is not easy to design such a compensation program. In practice, this causes difficulty in coordination.

80
If the dispersion forces alone are at work in the process of integration, all we need
are liberalization and facilitation of trade, so as to make the market work smoothly.
However, the dispersion force does not seem to dominate in recent East Asia; the flying
geese pattern of industrialization is no longer clearly observed, and a growing number
of industrial agglomerations have been emerging in various areas of East Asia. The
agglomeration force appears to exert significant influences upon the industrial
development in this area.
In this situation, what kind of development strategy should be drafted for CLMV
countries, so as to catch up? Is it the one that weakens the agglomeration force? –The
answer here is No, such a strategy is neither effective nor realistic. Instead, we should
try to utilize the agglomeration force aggressively to attract productive industries. To do
this, it is important to manage dexterously various nonlinear effects, such as the home
market effect, lock-in effect and hub effect, which are all likely to accompany economic
integration.
Under the agglomeration force, a long-run industrialization and economic
development can be triggered by the success of a short-run program to invite firms at
the initial stage of the agglomeration development. However, there are two kinds of
difficulties in implementing a successful strategy: (1) difficulty of the government to
collect accurate information about the current state of the country, and (2) difficulty in
policy coordination among the integrated countries. We should overcome these
difficulties, taking into account the actual situation surrounding the country concerned.

81
REFERENCES Arndt, S.W. 2001. Offshore sourcing and production sharing. In Arndt and Kierzkowski
(2001). Arndt, S.W. and H. Kierzkowski, eds. 2001. Fragmentation: New Production Patterns
in the World Economy. Oxford: Oxford University Press. Baldwin, R., R. Forslid; P. Martin; G. Ottaviano; and F. Robert-Nicoud. 2003. Economic
Geography and Public Policy. Princeton: Princeton University Press. Deardorff, A. 2001. Fragmentation across cones. In Arndt and Kierzkowski (2001). Dixit, A.K. and , J.E. Stiglitz. 1977. Monopolistic competition and optimum product
variety. American Economic Review. Vol.67, No.3. Pp. 297-308. Ethier, W.J.; E. Helpman; and P. Neary, eds. 1993. Theory, Policy and Dynamics in
International Trade. Cambridge: Cambridge University Press. Fujita, M. and N. Hamaguchi. 2007. Regional integration in East Asia: From the
perspective of the new economic geography. In Fujita et al. eds. (2007). Fujita M., P. Krugman and A. Venables. 1999. The Spatial Economics: Cities, Regions,
and International Trade. Cambridge, MA: MIT Press. Fujita, M.; S. Kumagai; and K. Nishikimi, eds. 2007. Economic Integration in East
Asia: A Combined View from Spatial and Neoclassical Economics. London: Edward Elgar, forthcoming.
Fujita, M. and T. Mori. 1996. The role of ports in the making of major cities: self-agglomeration and hub-effect. Journal of Development Economics. Vol.49, No.1. Pp. 93-120.
Jones, R.W. 2000. Globalization and the Theory of Input Trade. Cambridge, MA: MIT Press.
Jones, R.W. and H. Kierzkowski. 2001. A Framework for fragmentation. In Arndt and Kierzkowski (2001).
Krugman, P. 1991. Geography and Trade. Cambridge, MA: MIT Press. Krugman, P. 1993. The hub effect or threeness in interregional trade. In Ethier et al. eds
(1993). Marshall, A. 1920. Principles of Economics. Eighth edition. London: MacMillan. Mori, T. and K. Nishikimi. 2002. Economies of transport density and industrial
agglomeration. Regional Science and Urban Economics. Vol.32, No.2. Pp. 167-200. Nishikimi, K. 2007. Specialization and agglomeration forces of economic integration.
Chapter 3 in Fujita, M. et al., eds (2007).

82
Chapter 3 CLMV DEVELOPMENT ASSISTANCE PROGRAMMES: BACKGROUND, APPROACHES, CONCERNS Quah Boon Huat ABSTRACT Cambodia, Laos, Myanmar, and Vietnam joined the Association of Southeast Asian Nations (ASEAN) just as economic integration was accelerating. Concerns about the development gap hindering integration led to the launching of the Initiative for ASEAN Integration (IAI) Work Plan. The results of a case study of a Work Plan project focusing on implementation aspects, however, raises concerns about whether Work Plan objectives are being realized because of effectiveness issues. This paper concludes by recommending some implementation measures, widening the scope of the Work Plan, incorporating the programme into other existing development assistance frameworks, as well as expanding it into a wider regional initiative for East Asian integration.
1. INTRODUCTION
Rising regionalism in the other parts of the world as well as increasing competition
from the regional giants China and India spurred ASEAN efforts at economic
integration in the early 1990s. These integration efforts accelerated especially after the
admission to ASEAN of the CLMV countries, namely Cambodia, Laos, Myanmar, and
Vietnam. For ASEAN economic integration to proceed smoothly and effectively,
however, there is a need to narrow the existing development gap between the older
ASEAN-6 and the newer members.
The six-year IAI Work Plan was formulated and launched in 2002 with 48 projects
to specifically target the development gap. The IAI Work Plan’s programmes, activities

83
and projects are directed at strengthening the CLMV countries’ capacity, capability and
resolve to meet the challenges ahead. Various issues and problems with the Work Plan
were documented in the Mid-Term Review report where several recommendations were
made.
This paper looks at some implementation, evaluation, and assessment aspects of a
specific Work Plan project and then infers from the evidence gathered whether the aims
of the IAI Work Plan are being met. It starts with a very short background introduction
to the formation of ASEAN in Section 2. Section 3 describes ASEAN economic
cooperation and integration, while the all-important issue of the development gap
between ASEAN-6 and the newer members is described in Section 4. Section 5 looks
at international initiatives to assist the CLMV countries, and Section 6 talks about what
the IAI Work Plan is all about. A case study focusing on the implementation and
evaluation aspects of a Work Plan project is discussed in Section 7. Section 8
concludes with recommendations.
2. FORMATION OF ASEAN
On August 8, 1967, five Southeast Asian countries comprising of Indonesia, Malaysia,
the Philippines, Singapore, and Thailand formed the Association of Southeast Asian
Nations. This was mainly a response to the then fluid regional political situation,
though one of the aims of the association was to function as a regional association for
economic, social, and cultural cooperation.
The founding of ASEAN was quite an achievement, considering the still tense
regional political dynamics. There was the still recent 1963 military standoff between

84
Indonesia and Malaysia over the formation of Malaysia. There was also the failed
merger attempt between Malaysia and Singapore, both countries going their separate
ways in 1965 because of distrust and ideological differences. Add to the list of regional
problems the Philippines’ claim on Sabah, then already a part of Malaysia.
The document upon which ASEAN was founded—the “Bangkok Declaration”—
was just a simple declaration of intent. It was signed as a display of solidarity against
communist expansionism and insurgencies, i.e., the “common problems among
countries of Southeast Asia,” as well as to also emphasize the grouping’s determination
“to ensure their stability and security from external interference in any form or
manifestation.”1
The comments by former Indonesian Foreign Minister Ali Alatas that “the truth is
that politics attended ASEAN at its birth” and that “it was the convergence in political
outlook among the five original Members, their shared convictions on national priority
objectives and on how best to secure these objectives in the evolving strategic
environment of East Asia, which impelled them to form ASEAN ” very nicely sums up
the situation prevailing then.2
ASEAN spent its early years “fostering an atmosphere of trust and goodwill in
which the Member Countries developed a habit of working together in informality and
candor.” 3 Building on the principles advocated in the founding document, the
Declaration on Zone of Peace, Freedom, and Neutrality (November 1971) declared that
the five founding nations “are determined to exert initially necessary efforts to secure
1 ASEAN Secretariat. “The Bangkok Declaration, 1967.” <http://www.aseansec.org/1212.htm> 2 ASEAN Secretariat. “Political Achievement.” <http://www.aseansec.org/11833.htm> 3 ibid.

85
the recognition of, and respect for, South East Asia as a Zone of Peace, Freedom and
Neutrality, free from any form or manner of interference by outside Powers.”4
In 1976, the ASEAN Secretariat was established to improve coordination among
ASEAN members. In the same year, the grouping’s first formal agreement, the Treaty
of Amity and Cooperation, which enshrined one of ASEAN’s fundamental principles—
that of non-interference—was signed.
Brunei joined ASEAN immediately upon achieving its independence from the
United Kingdom in 1984. Vietnam was admitted in 1995, even though it was still under
a communist system. Laos and Myanmar followed in 1997, and Cambodia in 1999.
ASEAN thus sought to stabilize the region politically in its early days. The
grouping may have started out as a geo-political organization, set up in response to the
fluid regional political situation at that time, but group dynamics veered towards
economic cooperation during the 1970s, and later towards economic integration,
especially from the 1990s onwards.
3. ECONOMIC COOPERATION AND INTEGRATION
At the Fourth ASEAN Ministerial Meeting in March 1971, suggestions of ASEAN
economic integration by the Philippines’ then-president Marcos was largely ignored.5
Five years later, at the First ASEAN Summit in Bali in February 1976, economic
cooperation, not economic integration, moved onto the ASEAN agenda. The
4 ASEAN Secretariat. “Zone of Peace, Freedom and Neutrality Declaration, November 1971.”
<http://www.aseansec.org/3629.htm> 5 Severino, R.C. (2006) Southeast Asia in Search of an ASEAN Community. Institute of Southeast
Asian Studies, Singapore, p.221.

86
Declaration of ASEAN Concord, which called for economic cooperative action by
member states “in their national and regional development programmes, utilizing as far
as possible the resources available in the ASEAN region to broaden the
complementarity of their respective economies,” was thus made in the hope that
regional cooperation in large-scale industries in critical sectors could spur economic
development via industrialization.6
The motivation for the ASEAN Preferential Trade Agreement of 1977 was again
merely that of regional economic cooperation. It was to ensure that there were ready
markets for the products of the ASEAN Industrial Projects as well as those of the
Industrial Complementation Schemes, and the hope was that preferential trading
arrangements “will act as a stimulus to the strengthening of national and ASEAN
economic resilience and the development of the national economics of the Member
States by expanding investment and production opportunities, trade, and foreign
exchange earnings.”7
It was globalization and growing economic regionalism elsewhere that forced
ASEAN to take another look at its economic agenda. The member countries had
realized that they needed “to coalesce to be competitive in today’s world—to enlarge
their markets, attract investments, cut costs, increase efficiency, improve productivity
and thus generate jobs and raise people’s incomes.”8 At the Fourth ASEAN Summit in
1992, member countries agreed to create the ASEAN Free Trade Area (AFTA), a step
6 ASEAN Secretariat. “Declaration of ASEAN Concord, February 1976.”
<http://www.aseansec.org/1216.htm> 7 ASEAN Secretariat. “Agreement On ASEAN Preferential Trading Arrangements Manila, 24 February
1977.” <http://www.aseansec.org/2348.htm> 8 ASEAN Secretariat. “Economic Integration.” <http://www.aseansec.org/13635.htm>

87
toward regional economic integration, in which tariff and non-tariff barriers to trade
among the members would be reduced and eventually abolished.
However, ASEAN regional free trade alone was (and is) seen as inadequate for the
regional grouping to be able to tap effectively into unprecedented opportunities as well
as cope with challenges being unleashed by globalization, especially with the rise of
China and India. In December 1997, ASEAN leaders resolved to build an economic
community to increase the region’s economic potential. This resolution was followed
through when the ASEAN leaders agreed during the Ninth ASEAN Summit in October
2003 in Bali to establish an ASEAN Economic Community by 2020, the end-goal of
regional economic integration.
4. THE DEVELOPMENT GAP
The CLMV countries started becoming members of ASEAN from the mid-1990s
onwards, just about when ASEAN economic integration was accelerating. Before the
admission of the CLMV countries into ASEAN, there had already existed economic
disparities within and between the six older members. Economic disparity, perceived to
be a hindrance to economic integration, grew larger within the enlarged grouping with
the admission of the CLMV countries, raising concerns about difficulties arising out of
a two-tiered ASEAN.
There are fears that the grouping may become irrelevant in the global economy if
effective economic integration cannot take place because of the regional economic
divide. The CLMV countries have also realized that they must progressively and
steadily integrate their economies with those of the older members if they do not want

88
to be left behind. Time is of the essence because the development divide may widen,
making worse an already bad situation when the benefits arising out of globalization
become even more unevenly distributed among the members of the grouping, and
therefore making it more difficult for ASEAN members to move and advance together.
As such, ASEAN has resolved to assist its less developed newer members to
achieve their economic potential, with a view to ensuring effective economic integration.
This will in turn better equip ASEAN to face the increasingly stiff economic headwinds
of global competition. In the process, the less developed members will also be able to
reap the benefits of ASEAN’s economic integration process more equally as compared
to the more developed members, and therefore ensure that prosperity is shared among
the grouping’s more than 550 million inhabitants.9
The UNDP Human Development Index (HDI) measures and compares each
country’s average achievements in basic human development, and can be used to get a
good feel of the development gap between ASEAN member countries. Based on three
component sub-indices, namely life expectancy, education, and GDP, the HDI value of
a country, which ranges from 0 to 1, shows the distance the country has to travel to
reach the maximum possible value of 1.
The latest HDI rankings (UNDP: Human Development Report 2007/2008) put
Singapore, Brunei, and Malaysia in the “high human development” category while the
rest falls under “medium human development.” ASEAN member countries falling
within the “medium human development” category can be further roughly subdivided
9 ASEAN Secretariat. Remarks by H.E. Ong Keng Yong, Secretary-General of ASEAN at the Opening
Ceremony of the Regional Workshop on “Bridging Development Gaps in ASEAN: Key Challenges
Towards the Realization of ASEAN Community,” Lao PDR, February 2007.
<http://www.aseansec.org/20599.htm>

89
into “upper,” and “lower.” Thus, based on the latest HDI rankings, ASEAN is actually
a three-tiered regional grouping, rather than two-tiered.
Between 1995 and 2005, Vietnam’s stellar economic performance saw it
surpassing Indonesia in the HDI rankings. It managed to improve its HDI reading from
0.661 to 0.733, an increase of 0.072 (see Table 1). If we assume that Cambodia,
Myanmar, and Laos, are able to improve their HDI readings by 0.072 between the years
2005-2015, i.e. similar to Vietnam’s achievement between the years 1995-2005, and
then also assume (unreasonably) that the HDI readings of the rest of the ASEAN
countries remain stagnant at the levels achieved in 2005, these three countries will still
not be able to catch up with the rest, not even with Vietnam.
Table 1: Human Development Index Trends.
HDI HDI Values
Rank (2005) Country 1985 1990 1995 2000 2005 25 Singapore 0.786 0.823 0.862 .. 0.922 30 Brunei .. .. .. .. 0.894 63 Malaysia 0.696 0.723 0.761 0.791 0.811 78 Thailand 0.680 0.717 0.751 0.775 0.781 90 Philippines 0.695 0.722 0.738 0.759 0.771
105 Vietnam .. 0.618 0.661 0.696 0.733 107 Indonesia 0.585 0.626 0.665 0.682 0.728 130 Laos 0.425 0.451 0.488 0.523 0.601 131 Cambodia .. .. 0.536 0.545 0.598 132 Myanmar .. .. .. .. 0.583
Source: UNDP, Human Development Report – 2007/2008.
The improvements expected to be achieved over the years up to 2015 by the less
developed ASEAN countries, namely Cambodia, Myanmar, and Laos, seemed not
enough to enable them to catch up with the more developed ones, notwithstanding the
existence of many international development assistance programmes since the early

90
1990s, including ASEAN initiatives, to assist Mekong-delta countries. Even worse,
given the possibility that benefits from globalization may become even more unevenly
distributed among the disparate members of the grouping, ASEAN faces the grim
prospect of a widening development gap in the three-tiered grouping.
The next section touches on three examples of development assistance initiatives
that were put in place prior to the Asian Financial Crisis of 1997-1998 to assist CLMV
countries.
5. CLMV-FOCUSED COOPERATION AND ASSISTANCE
With the end of the Cold War hostilities and the Cambodian civil war, as well as the
launching of free market reforms in the CLMV countries in the late 1980s, the Mekong
region countries started becoming the focus of international attention from the early
1990s onwards. There were, and still are, various international forums and cooperative
efforts, using a variety of approaches, promoting economic development in the region.
Pre-Asian Financial Crisis (1997-1998) international initiatives include, among
many others, the following:
1. The ADB-sponsored GMS Economic Cooperation Programme
Since 1992, the countries of the Greater Mekong Subregion (GMS), i.e., Cambodia,
Laos, Myanmar, Vietnam, Thailand, and the Yunnan Province of the People's
Republic of China, had, with the support of international organizations, embarked on
a programme of economic cooperation. The programme has so far managed to
achieve results that are more tangible and carried more impact on regional
cooperation. High priority subregional development projects include projects in

91
transport, energy, telecommunications, environment, human resource development,
tourism, trade, and agriculture. With the ADB taking an active role in facilitating
greater private sector involvement, the private sector has become a significant player
in the GMS programme.
2. Working Group on Economic Cooperation in Cambodia, Laos, and Myanmar
Formerly known as the Working Group on Economic Cooperation in Indochina and
Myanmar, it was established in September 1994 under the umbrella of the ASEAN
and Japanese economic ministers meeting (AEM-MITI). It targeted countries that
were not regular ASEAN members—Laos, Cambodia, and Myanmar (and initially,
Vietnam). The aims of the Working Group were “not only to promote the economic
development of Cambodia, Laos, and Myanmar but also to promote economic growth
of the Southeast Asian region as a whole by strengthening the economic linkages
between these countries and the ASEAN countries.”10
3. ASEAN Mekong Basin Development Cooperation (AMBDC)
Initiated by ASEAN, AMBDC’s first ministerial meeting in 1996 was attended by 10
Southeast Asian countries and China. The objectives were: (i) to enhance
economically sound and sustainable development of the Mekong Basin; (ii) to
encourage a process of dialogue and common project identification which can result
in firm economic partnerships for mutual benefit; and (iii) to strengthen the
10 ASEAN Secretariat. “Policy Recommendation of the AEM-MITI's Working Group on Economic
Cooperation in Cambodia, Laos, and Myanmar, Phnom Penh, August 1996.”
<http://www.aseansec.org/7954.htm>

92
interconnections and economic linkages between the ASEAN member countries and
the Mekong riparian countries.11
Efforts by ASEAN to help tackle development issues and challenges in the
Mekong region were shelved temporarily during the 1997-1998 Asian Financial Crisis
when the grouping’s members had to focus on their own economic problems. But as
Asia recovered from the Asian Financial Crisis, Mekong development moved back onto
ASEAN’s radar screen.
The admission of the CLMV countries into ASEAN against the backdrop of a
rapidly changing socioeconomic global landscape heightened the sense of urgency
within the grouping to take steps to ensure that the grouping can meet the challenges
ahead. In the light of these developments, correcting the so-called "ASEAN divide"
became a high priority. The development gap became an even more important issue
when ASEAN leaders agreed to build an ASEAN Economic Community by 2020. To
help the region counter fierce competition from rising economic giants China and India,
ASEAN leaders later agreed to speed up the target date by five years to 2015.
There was a greater commitment toward assisting the CLMV countries to ensure
that no one gets left behind, as solidarity would be affected if the divide were not filled.
To help hasten the economic development of the CLMV countries and narrow the
development gap between the newer members and the more developed ASEAN-6,
ASEAN leaders agreed in November 2000 to launch the Initiative for ASEAN
Integration (IAI).12
11 ASEAN Secretariat. “Basic Framework of ASEAN- Mekong Basin Development Cooperation, Kuala
Lumpur, June 1996.” <http://www.aseansec.org/2474.htm> 12 Besides the usual technical and development cooperation programmes, another major component of
ASEAN-6 assistance is the Special and Differential Treatment (SDT) notified in ASEAN agreements.

93
In the meantime, AMBDC resumed its activities when it held its second ministerial
meeting in 2000. At its third ministerial meeting in October 2001, it was agreed that
Japan and South Korea would be taken in as additional members. Projects related to
infrastructure, trade and investment, agriculture, forestry and minerals, industry, tourism,
HRD, and science and technology have been implemented or are ongoing but financing
problems hindered progress.
At the Eighth Ministerial Meeting of the AMBDC in August 2006, it was agreed to
recommend that the AMBDC Ministerial Meeting be placed under the ASEAN
Economic Ministers Meeting process at the 12th ASEAN Summit in December of the
same year. The rationale given for the recommendation was that it would be easier to
synchronize the economic integration activities, and hence make maximum use of
resources available.13
6. THE INITIATIVE FOR ASEAN INTEGRATION (IAI)
Integrating the transitional economies of the CLMV countries with those of the
older ASEAN members will be one of the regional grouping's greatest challenges. To
give direction to and to sharpen the focus of ASEAN's collective efforts to narrow the
development gap between it's older and newer members and ultimately enhance the
grouping’s competitiveness, ASEAN leaders agreed in November 2000 to launch the
SDT allows the CLMV countries a longer period of implementation of liberalization policies or easier
access to the markets of the ASEAN-6. 13 ASEAN Secretariat. “Joint Media Statement at The Eighth Ministerial Meeting of the ASEAN-Mekong
Basin Development Cooperation (AMBDC), Aug. 2006, Kuala Lumpur.”
<http://www.aseansec.org/18845.htm>

94
Initiative for ASEAN Integration (IAI) programme.14 A six-year IAI Work Plan (July
2002–June 2008) was formulated and launched in August 2002 at the IAI Development
Cooperation Forum in Jakarta.
The IAI Work Plan’s programmes, activities, and projects are directed at
strengthening the CLMV countries’ capacity, capability, and resolve to meet the
challenges ahead. It will also prepare them to face global competition. Growth in
productive capacities in the CLMV countries is being hindered by weak human resource
capabilities as well as weak or absent policies, institutional, and legal frameworks.
These factors also hinder the effective optimum use of foreign aid. ASEAN-6
contributes toward the IAI Work Plan by providing training, technical experts and
equipment, among others.
Eleven Dialogue Partner countries and international development agencies have
also supported the Work Plan projects by providing funding assistance. For example,
Japan, under the ASEAN-Japan Plan of Action, will strengthen support for the
realization of the IAI Work Plan and other regional and subregional endeavors to
narrow the development gaps in ASEAN.15
The objectives of the IAI Work Plan are to:
1. Facilitate the development of policy, institutional, and regulatory frameworks; and,
2. Strengthening the capacity of the CLMV countries to:
• Reduce poverty and increase standard of living; and
• Improve civil service for global competition.
14 Under the Vientiane Action Plan, the IAI was broadened to include development efforts to narrow
development gaps between sub-regions within ASEAN-6 itself. This paper focuses only on aspects of
the development efforts associated with CLMV countries. 15 ASEAN Secretariat. “The ASEAN-Japan Plan of Action.” <http://www.aseansec.org/15502.htm>
95
The four priority areas of the current IAI Work Plan are: i) infrastructure
development; ii) human resource development; iii) information and communication
technology; and, iv) the promotion of regional economic integration. Three new focus
areas were added after a Mid-Term Review of the IAI Work Plan, which was completed
in November 2005. The Mid-Term Review recommended the broadening of the scope
of the Work Plan to include tourism, poverty and quality of life, and projects of general
coverage.16
The Report on the Mid-Term Review of the IAI Work Plan also pointed out issues
of concern such as: i) weak inter-agency coordination, reporting mechanisms,
implementation and follow-through actions; ii) the need to strengthen the ownership of
the IAI projects by the CLMV countries; and iii) the level of coherence of the training
programmes and duration of training courses, and unsatisfactory level of English
proficiency among some instructors and trainees.
The following section focuses mainly on aspects associated with the
implementation of IAI Work Plan projects and raises questions about project
effectiveness.
7. CASE STUDY OF AN IAI WORK PLAN PROJECT
The table below lists a sample of completed IAI Work Plan projects:17
16 ASEAN Secretariat. “Report on the Mid Term Review of the Initiative for ASEAN Integration (IAI)
Work Plan.” <http://www.aseansec.org/18201.htm> 17 ASEAN Secretariat. “Status Update on Progress of IAI Work Plan as of 1 September 2006.”
< www.aseansec.org/iai_update.doc>

96
Table 2: Sample of Completed IAI Work Plan Projects.
No. Component Projects Donors 1 HRD-Public Sector
Capacity Building Project by Brunei – Executive Development Programme for CLMV Senior Government Officers (27 Feb – 23 April 2006, 16 participants)
Brunei Darussalam
2 Regional Economic Integration -Customs
Project by Malaysia – Senior Level Customs Officer Study Tour to Malaysia - Customized for CLMV Customs Administrators (19 Sep - 1 Oct 2005, 20 Participants)
Malaysia
3 Infrastructure-Transport
Project by Indonesia – TRN/02/009 – Railways Training for CLMV Countries. (Consists of 5 training courses, 16 participants for each component. Component 1 and 2: 3-24 May 2004, Component 3 and 4: 7-28 March 2005, Component 5 will be held on 4-22 April 2005)
Indonesia & Japan-ASEAN General Exchange Fund (JAGEF)
4 HRD-Labour & Employment
Project by Singapore – SCD/LAB/03/013/IAI –Training programme on Curriculum Development for Technical Vocational Education and Training (Cambodia: 6-22 July 2004, Laos: 23 June - 3 July 2003, Myanmar: 11-27 May 2004, Viet Nam: 8-24 June 2004)
Singapore
5 ICT Project by Thailand – ETF/EAS/04/004/IAI – Joint IAI Project on e-ASEAN: ASEAN e-Commerce Programme (17-21 Nov 2003)
Thailand
6 HRD-Labour & Employment
Project by Philippines – Capacity Building Training Programmes on Technical Vocational Education and Training for CLMV Countries (Activity 1 was held in Ho Chi Minh City, 2-20 Aug 2004 with 15 participants from CLMV: 4 from Cambodia, 4 from Laos, 4 from Myanmar, and 3 from Viet Nam. Activity 2 was held in Manila on 18-29 October 2004 for 16 participants).
Philippines & ASEAN Foundation (Japan-ASEAN Solidarity Fund)
Source: Status Update on Progress of IAI Work Plan as of 1 Sept. 2006.

97
7.1 Workshop for Training the Trainers on e-Commerce
This workshop, which comes under the ASEAN e-Commerce Programme, was
implemented in November 2003.18 The objectives of the workshop were to:
1. provide a broader understanding of e-Commerce and the emerging cyberspace
market, as well as develop and manage an e-Commerce curriculum in the context
of company, industry, and unlimited cyberspace;
2. develop managerial skills for running an effective e-Commerce and/or research-
based e-commerce curriculum; and,
3. provide an understanding of e-commerce strategic direction for building cyber-
based e-Commerce future applications and research for both academics and
practitioners in the future.
The instruction methods included lectures, case studies, and on-line assignments.
A student manual and a CD ROM developed in-house by the implementing agency (i.e.,
training agency) supplemented the college-level US textbook “Managing Information
Technology in the E-Business Enterprise” used in the course.19
The workshop had two sessions a day, each running for two hours and 45 minutes.
The first three days of the workshop covered 14 chapters of the textbook, while lectures
on the fourth day covered the following two topics: “Evaluate e-Commerce
Curriculum” and “Develop e-Commerce Research Guideline and Future Direction.”
18 Ministry of Commerce, Thailand. “Completion Report on IAI Work Plan Project: ASEAN e-Commerce
Programme – Workshop for Training the Trainers on e-Commerce.”
< http://thairegistration.com/thai/e-commerce/pdf/Completion%20Report.pdf> 19 O’Brien, J.A. 2002. Management information systems: managing information technology in the
e-business enterprise (5th Edition). McGraw-Hill: USA.

98
The morning of the last day of the workshop was spent on a field trip. The daily
schedule of the 5-day workshop can be found in the Appendix.20
7.2 Implementation, evaluation, and impact assessment
7.2.1 Definition of capacity building or development
According to the UNDP, “capacity is the ability of individuals, institutions, and
societies to perform functions, solve problems, and set and achieve objectives in a
sustainable manner”…and…“capacity development is thereby the process through
which individuals, organisations, and societies obtain, strengthen, and maintain the
capabilities to set and achieve their own development objectives over time.”21
Based on the above definitions and in the context of IAI Work Plan projects, capacity
building or development programmes should target both human and institutional
capacities, as well as build both analytical and decision-making skills for sustainability
purposes.
7.2.2 Concerns
A glance at the daily schedule of the one-week workshop is enough for one to conclude
that the workshop was ineffectively run. Participants’ comments like “need more time
to cover all material presented in the curriculum,” and, “time for this course is too
short,” confirmed this.
Other concerns include the following: 20 The daily schedule appearing in the Appendix has been edited slightly for typographical errors, and to
ensure brevity and conciseness. 21 UNDP. “Capacity Development.” <http://www.capacity.undp.org/>

99
1. Evaluations on course content, effectiveness of lecturers, site visits, and staff
ratings ranged from “good” to “great.” However, the evaluation exercises did not
provide indicators that could give an insight into whether workshop objectives were
met.22 The following evaluation aspects were left out: i) Learning, which measures
knowledge acquired, skills improved, or attitudes changed; ii) Behaviour, which
measures whether what is learnt is actually put into practice at work; and, iii)
Results, which looks at whether the training had any effect at the level of the
organization.23
2. The activities in this workshop basically remained at an awareness-raising level
only, even though building analytical and decision-making skills had been part of
the project’s objectives. This is an important issue because analytical and decision-
making capacities are necessary to ensure sustainability of organizational change.
Without these capacities, the hoped-for change is unlikely to take place.
3. The workshop was a one-day event and not part of any long-term programme.
Neither was there any follow-through action. To be effective, the programme should
include a series of workshops that reflect the priorities of each of the participants’
countries.
22 The results of these first level evaluation exercises may not be that valuable for the following reasons:
i) an exciting but irrelevant workshop could be rated higher than a less exciting but better constructed and
relevant one; ii) the responses might have reflected trainees’ interactions with the trainer, not value of the
workshop; and iii) the responses were probably superficial because there were no open questions. 23 According to the IAI Work Unit in the ASEAN Secretariat, in a reply to emailed inquiries, “post
evaluation forms and questionnaires are sometimes sent to the participants at their work address at a given
interval”. Malaysian project implementers interviewed for this paper say that they have not yet conducted
post evaluations of any sort. For details on the important levels of training evaluation, see Kirkpatrick,
Donald L. (1994) Evaluating Training Programs. The Four Levels. Berrett-Koehler Publishers, USA.

100
4. Building human capacities alone does not ensure that the process of
organizational change is sustainable. Institutional capacities also need to be
developed. Though the workshop implicitly had this as one of its objectives, there
lacks follow-up activity to ensure that the project will lead to institutional capacity
building.
5. Though ICT courses under the IAI Work Plan are being run by both Brunei and
Malaysia, there were participants coming from both these countries. This raises the
question of whether the right participants from the right countries were targeted.
6. The very intensive workshop lectures were based on a US college-level textbook
“Management Information Systems: Managing Information Technology in the E-
Business Enterprise” by James A. O’Brien. Judging from the intensive schedule of
the workshop, it is doubtful that the participants were able to follow and benefit
from the lectures.
Interviews with Malaysian project implementing agencies running IAI Work Plan
projects in Malaysia confirmed that:
1. No training needs analyses were conducted. As such, there was no way for them
to identify problems or other issues in the workplace. Training needs analysis is
necessary to specifically define the gap between current and desired individual and
organizational performances, and therefore determine whether training is an
appropriate response or not.

101
2. They have no idea whether or not the participants were chosen based on the
organizational needs of their institutions. One project implementing agent felt that
some senior officials were monopolizing the opportunities to train overseas. 24
3. Some participants had difficulties understanding the coursework conducted
using the English language.
4. Except for the first level on-site evaluation exercises conducted at the end of the
programmes, they were not mandated to measure the kind of knowledge acquired or
skills improved.25 Neither were they required to do second, third, or fourth level
evaluations nor informed of the results of such evaluations, if such evaluations were
indeed carried out, as to whether:26
• trainees actually apply what they have learned in their workplace.
• there are barriers preventing trainees from applying their learning in their
workplace.
• the training had resulted in changes in trainees’ work performances, and if
there had been changes, whether the changes had been substantial enough to
affect organizational performances. 24 According to the IAI Work Unit, “while further guidance is provided by the trainers and the ASEAN
Secretariat at the selection stage, final decisions as to the actual selection of participants are left to each of
the participating Member Country.” One Malaysian project implementer, however, commented that they
were not consulted on the level and characteristics of the ideal candidates for participation in the
workshops, seminars, etc. 25 According to the IAI Work Unit, “evaluation often only extends to course participants and second hand
information is not captured unless specifically shared by the respective line agency or Member Country.” 26 According to the IAI Work Unit, “…IAI Meetings, which occurs four times a year, provides an
effective platform to allow for continuous feedback between all stakeholders…” Malaysian project
implementers interviewed say that they were provided with feedback for reference in the design of future
courses. The question that should be raised here is why the implementing agencies were left out of the
training evaluations and assessments.
102
• the impacts on organizational performances emanating from the changes in
trainees’ work performances were sustainable.
The following section concludes and sets forth some recommendations.
8. CONCLUSION AND RECOMMENDATIONS
The CLMV countries started joining ASEAN at a time when economic integration was
accelerating within the grouping. To ensure effective and smooth economic integration
of the ASEAN-10, ASEAN launched the IAI Work Plan in 2002. The Work Plan aims
to help narrow the development gap between the older ASEAN-6 member countries and
the newer CLMV countries, as well as to strengthen the latter’s capacity, capability and
resolve to meet the challenges ahead.
The result of a case study on the implementation aspects of a specific Work Plan
project, however, raises questions about the effectiveness of that particular project, and
in turn raises concerns about whether the aims and objectives of all IAI Work Plan
projects are being realized. These are serious concerns if the capacity building efforts
of the IAI Work Plan, which is scheduled to end its six-year run in June 2008, have not
contributed effectively towards narrowing the development gap between the ASEAN-6
and the CLMV countries. Or worse, the development gap has widened further despite
the IAI Work Plan, a real possibility because benefits arising out of globalization may
be becoming even more unevenly distributed among the disparate members of the
grouping.
To help improve effectiveness and efficiency of development assistance, it should
be emphasized that projects and programmes targeting less developed members should

103
be drawn up separately to cater to each country’s specific needs because of the
differences in the pace of reforms and level of socioeconomic performance.
To facilitate this process, development assistance recipient countries should take
ownership of their development problems and determine the final outcome of capacity
building efforts because “capacity building … isn’t a process where an organization
external to the process can determine the final outcome.”27 To this end, a special unit
should be set up in each of the CLMV countries, if they not already have, to carry out
activities that should include:
1. conducting training needs analysis to identify problems or other issues in the
workplace, and based on the results, work together with the implementing agencies
in the ASEAN-6 to design relevant capacity building courses to target their specific
training needs;
2. ensuring that the right trainees are sent to the right courses, and are actually able
to apply what they have learned in their workplace; and
3. measuring changes in trainees’ work performances, evaluate whether the changes
have been substantial enough to affect organizational performances, as well as
assess whether the impacts have been sustained.
Needless to say, the special unit should make the results of all post-evaluation and
assessment activities available to the other stakeholders in the IAI Work Plan projects,
especially the project implementers.
ASEAN needs help in its efforts to narrow the development gap. There are clearly
problems with the effectiveness of the IAI Work Plan programmes, as can be inferred
27 Macadam, R., J. Drinan., N. Inall, N. and B. McKenzie. 2004. Growing the capital of rural Australia –
the task of capacity building. < http://www.rirdc.gov.au/reports/HCC/04-034.pdf>

104
from the case study in this paper. The “Report on the Mid-Term Review of the Initiative
for ASEAN Integration (IAI) Work Plan” cited many problems, among which are the
low quality of some of the programmes, and the lack of coordination between ASEAN
and other development frameworks in the Mekong Basin. For the IAI Work Plan to be
meaningful, it should be incorporated into, for example, the better regarded ADB-
sponsored GMS Economic Cooperation Programme, or for that matter, other
development assistance programmes targeting CLMV countries. After all, ASEAN-6
does not have deep enough pockets to meaningfully fund IAI initiatives.
Infrastructure development, for example, is one of the priority areas of the current
IAI Work Plan. However, the focus of IAI Work Plan projects is on soft infrastructure,
“such as conducting training to build up capacity, assisting in developing policy,
institutional, legal and regulatory frameworks, conducting feasibility studies,
etc.”28 The GMS Economic Cooperation Programme, on the other hand, has a heavy
emphasis on physical infrastructure development. Linking the IAI Work Plan’s soft
infrastructure capacity building efforts to the GMS Programme’s physical infrastructure
development projects will increase effectiveness because of the synergies created.
The “Report on the Mid-Term Review of the Initiative for ASEAN Integration
Work Plan” recommended broadening the scope of the Work Plan to include, among
others, tourism. The CLMV countries are culturally rich, and have a natural
environment brimming with potential. As such, culture and ecotourism projects should
especially receive more attention. However, again for reasons of meaningfulness and
effectiveness, tourism-related IAI Work Plan projects should be linked to similar
28 ASEAN Secretariat. “Bridging the Development Gap among Members of ASEAN.”
<http://www.aseansec.org/14683.htm>

105
projects under other development frameworks in the Mekong Basin. The ongoing
Mekong Tourism Development Project (which comes under the GMS Economic
Cooperation Programme), for example, has among its initiatives, a project to develop 16
pro-poor community-based tourism products. This is a superb opportunity to link IAI
Work Plan projects with this project, as eradicating poverty is also a Work Plan priority.
The scope of the IAI Work Plan should also be further widened to include projects
aimed at specifically providing an enabling environment to small, medium, and micro-
enterprises (SMEs). SMEs play such an important role in the process of providing
incomes and creating jobs. SME-related Work Plan soft infrastructure projects could,
for example, target the elimination of bureaucracy and assist in the creation of efficient
and reliable public administration systems, since bureaucratic hurdles are a special
burden for SMEs. Institutions should also be set up to ensure easier credit access and
training for SMEs, if they not already have.
Since the CLMV countries are still basically agriculture-based, non-agricultural
economic activities provide vital earnings supplements for rural households. Work Plan
projects could target especially non-agricultural SMEs that are closely tied to
agriculture through demand and supply linkages. Needless to say, SMEs involved in
cultural and eco-tourism activities should also be targeted.
Economic integration is a trend. Broader regional integration processes in East
Asia have already started, and the region is actively progressing on a path toward
greater regional cooperation. East Asian regional cooperation and integration will bring
with it the types of concerns that ASEAN is presently grappling with. During the first
East Asia Summit in December 2005, leaders from the 10 member states of ASEAN,
China, Japan, South Korea, India, Australia, and New Zealand vowed to focus on,

106
among other things, promoting cooperation in development, economic integration and
growth, eradicating poverty and narrowing the development gap in East Asia, through
technology transfer and infrastructure development, capacity building, good governance
and humanitarian assistance.29 These are the very issues ASEAN is currently focusing
on in its community building efforts.
Economic disparities will likely become even more pronounced and therefore more
of a concern in the context of East Asian regional integration. In anticipation of
deepening East Asian regional cooperation and integration, ASEAN should thus see to
it that the “Initiative for ASEAN Integration” is expanded into an “Initiative for East
Asian Integration.”
REFERENCES ASEAN Secretariat. 1977. Agreement on ASEAN preferential trading arrangements
[online] <http://www.aseansec.org/2348.htm> (Accessed June 20, 2007). ________. 1996. Basic framework of ASEAN-Mekong Basin Development
Cooperation (AMBDC), [online] <http://www.aseansec.org/2474.htm> (Accessed June 28, 2007).
________. 2007. Bridging development gaps in ASEAN: key challenges towards the
realization of ASEAN community. Remarks by H.E. Ong Keng Yong, Secretary-General of ASEAN at the Opening Ceremony at a Regional Workshop in Lao PDR. [online] <http://www.aseansec.org/20599.htm> (Accessed November 8, 2007).
29 ASEAN Secretariat. “Kuala Lumpur Declaration on the East Asia Summit, Kuala Lumpur, 14
December 2005.” <http://www.aseansec.org/18098.htm>

107
________. Bridging the development gap among members of ASEAN. [online] <http://www.aseansec.org/14683.htm> (accessed Sept. 13, 2007).
________. 1976. Declaration of ASEAN Concord.” [online]
<http://www.aseansec.org/1216.htm> (Accessed June 18, 2007). ________. Economic integration [online] <http://www.aseansec.org/13635.htm> (Accessed June 18, 2007). ________. 2006. Joint media statement at the Eighth Ministerial Meeting of the
ASEAN-Mekong Basin Development Cooperation held at Kuala Lumpur. [online] <http://www.aseansec.org/18845.htm> (Accessed June 20, 2007).
________. 2005. Kuala Lumpur declaration on the East Asia Summit at Kuala Lumpur.
[online] <http://www.aseansec.org/18098.htm> (Accessed December 26, 2007). __________. 1996. Policy recommendation of the AEM-MITI's Working Group on
Economic Cooperation in Cambodia, Laos and Myanmar, Phnom Penh. [online] <http://www.aseansec.org/7954.htm> (Accessed June 28, 2007)
__________. Political Achievement. [online] <http://www.aseansec.org/11833.htm>
(Accessed June 18, 2007). ________. Report on the mid-term review of the initiative for ASEAN integration (IAI)
Work Plan.” [online] <http://www.aseansec.org/18201.htm> (Accessed May 10, 2007)
________. 2006. Status update on progress of IAI Work Plan as of 1 Sept. 2006 [online]
<http://www.aseansec.org/iai_update.doc> (Accessed Sept. 13, 2007). __________. The ASEAN-Japan Plan of Action. [online]
<http://www.aseansec.org/15502.htm> (Accessed May 28, 2007). ________. 1967. The Bangkok declaration [online]
<http://www.aseansec.org/1212.htm> (accessed June 18, 2007).

108
________. 1971. Zone of peace, freedom and neutrality declaration. [online] < http://www.aseansec.org/3629.htm> (Accessed June 18, 2007).
Kirkpatrick, D.L. 1994. Evaluating training programs. The Four Levels. Berrett-Koehler
Publishers: USA. Macadam, R.; J. Drinan,; Inall, N. and B. 2004. Growing the capital of rural Australia –
the task of capacity building. [online] <http://www.rirdc.gov.au/reports/HCC/04-034.pdf> (Accessed October 11, 2007).
Ministry of Commerce. Completion report IAI Work Plan Project: ASEAN e-
Commerce Programme - Workshop for training the trainers on e-Commerce [online] <http://thairegistration.com/thai/e-commerce/pdf/Completion%20Report.pdf> (Accessed September 13, 2007).
O’Brien, J.A. 2002. Management information systems: managing information
technology in the e-business enterprise (5th Edition). McGraw-Hill: USA. Severino, R.C. 2006. Southeast Asia in search of an ASEAN community. Institute of
Southeast Asian Studies: Singapore. UNDP (2007) Human Development Report 2007/2008 [online]
<http://hdr.undp.org/en/reports/global/hdr2006/> (Accessed January 15, 2008). ________. Capacity Development.[online]
<http://www.capacity.undp.org/> (Accessed October 11, 2007).
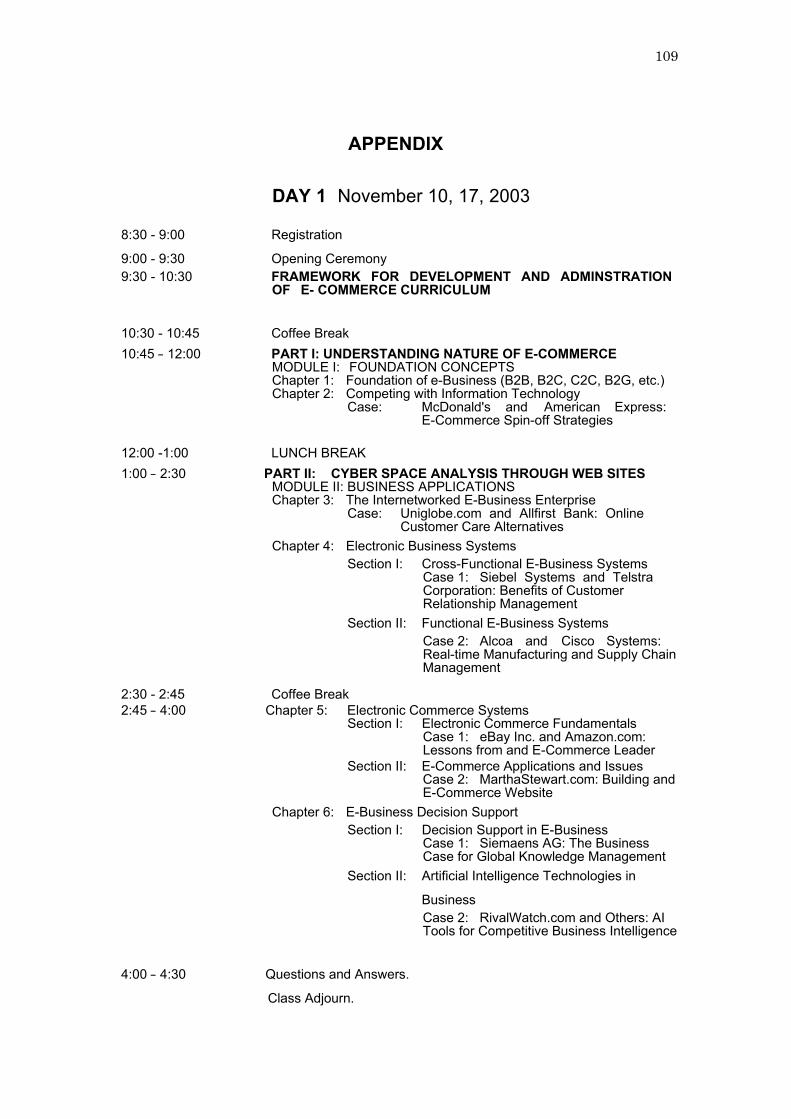
109
APPENDIX DAY 1 November 10, 17, 2003
8:30 - 9:00 Registration
9:00 - 9:30 Opening Ceremony 9:30 - 10:30 FRAMEWORK FOR DEVELOPMENT AND ADMINSTRATION
OF E- COMMERCE CURRICULUM
10:30 - 10:45 Coffee Break 10:45 – 12:00 PART I: UNDERSTANDING NATURE OF E-COMMERCE
MODULE I: FOUNDATION CONCEPTS Chapter 1: Foundation of e-Business (B2B, B2C, C2C, B2G, etc.) Chapter 2: Competing with Information Technology
Case: McDonald's and American Express: E-Commerce Spin-off Strategies
12:00 -1:00 LUNCH BREAK 1:00 – 2:30 PART II: CYBER SPACE ANALYSIS THROUGH WEB SITES
MODULE II: BUSINESS APPLICATIONS Chapter 3: The Internetworked E-Business Enterprise
Case: Uniglobe.com and Allfirst Bank: Online Customer Care Alternatives
Chapter 4: Electronic Business Systems Section I: Cross-Functional E-Business Systems
Case 1: Siebel Systems and Telstra Corporation: Benefits of Customer Relationship Management
Section II: Functional E-Business Systems Case 2: Alcoa and Cisco Systems: Real-time Manufacturing and Supply Chain Management
2:30 - 2:45 Coffee Break 2:45 – 4:00 Chapter 5: Electronic Commerce Systems
Section I: Electronic Commerce Fundamentals Case 1: eBay Inc. and Amazon.com: Lessons from and E-Commerce Leader
Section II: E-Commerce Applications and Issues Case 2: MarthaStewart.com: Building and E-Commerce Website
Chapter 6: E-Business Decision Support Section I: Decision Support in E-Business
Case 1: Siemaens AG: The Business Case for Global Knowledge Management
Section II: Artificial Intelligence Technologies in
Business Case 2: RivalWatch.com and Others: AI Tools for Competitive Business Intelligence
4:00 – 4:30 Questions and Answers.
Class Adjourn.

110
Completion Report on ASEAN e-Commerce Programme

111
DAY 2 November 11, 18, 2003
8:30 - 9:00 Registration 9:00-10:30 PART III: DEVELOP E-COMMERCE STRATEGIES
MODULE III: DEVELOPMENT PROCESS Chapter 7: Developing E-Business Strategies
Section I: E-Business Planning Fundamentals Six major e-Commerce sectors strategies: 1. Infrastructure 2. Applications 3. Portals 4. Content
5. Service
s 6.
Exchanges
10:30-10:45 Coffee Break
Case 1: Accel Partners: The Past, Present, and Future of E-Commerce
10:45-12:00 Section II: Implementing E-Business Strategies Seven key to e-tailing success factors: 1. Selection and value 2. Performance and service efficiency 3. Look and feel of the site 4. Advertising and incentives to purchase 5. Personal attention 6. Community relationships 7. Security and Reliability
Case 2: Cross Engineering, Pitney-Bowes, and
Emerson: Change Management Challenges of CRM Systems
12:00-1:00 LUNCH BREAK 1:00-2:30 PART IV: DEVELOP ACTION PLANS FOR E-COMMERCE
DEVELOPMENT, IMPLEMENTATION, OPERATION Chapter 8: Developing E-Business Solutions
Section I: Developing E-Business Systems and Web-Store
2:30-2:45 Coffee Break
Nine Essential e-commerce Processes: 1. Access control and security 2. Profiling and personalizing 3. Search management (yahoo.com, google.com,
etc) 4. Content management 5. Catalog management 6. Payment (web-payment, EFT, digital wallet) 7. Workflow management 8. Event notification and Advertising 9. Collaboration and trading (customer, suppliers,
stakeholders and employees)
2:45-4:00 Section II: Implementing E-Business Systems Case 3: The Sports Authority and Others: E-
Commerce Website Design Requirements: • Web site navigation • Shopping cart design • Checkout process • Trust and security • Web site speed
4:00 – 4:30 Questions and Answers. Class Adjourn.
Completion Report on ASEAN e-Commerce Programme
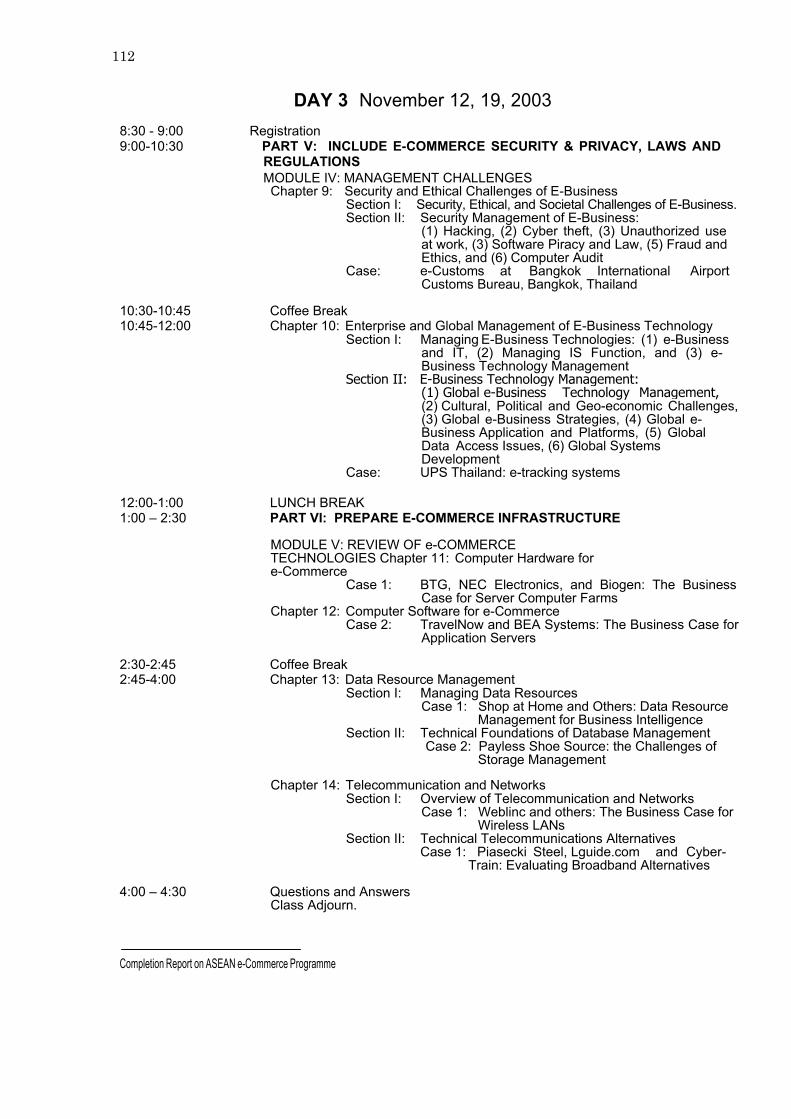
112
Section II: E-Business Technology Management: (1) Global e-Business Technology Management,
DAY 3 November 12, 19, 2003
8:30 - 9:00 Registration 9:00-10:30 PART V: INCLUDE E-COMMERCE SECURITY & PRIVACY, LAWS AND
REGULATIONS MODULE IV: MANAGEMENT CHALLENGES Chapter 9: Security and Ethical Challenges of E-Business
Section I: Security, Ethical, and Societal Challenges of E-Business. Section II: Security Management of E-Business:
(1) Hacking, (2) Cyber theft, (3) Unauthorized use at work, (3) Software Piracy and Law, (5) Fraud and Ethics, and (6) Computer Audit
Case: e-Customs at Bangkok International Airport Customs Bureau, Bangkok, Thailand
10:30-10:45 Coffee Break 10:45-12:00 Chapter 10: Enterprise and Global Management of E-Business Technology
Section I: Managing E-Business Technologies: (1) e-Business and IT, (2) Managing IS Function, and (3) e- Business Technology Management
(2) Cultural, Political and Geo-economic Challenges, (3) Global e-Business Strategies, (4) Global e-Business Application and Platforms, (5) Global Data Access Issues, (6) Global Systems Development
Case: UPS Thailand: e-tracking systems 12:00-1:00 LUNCH BREAK 1:00 – 2:30 PART VI: PREPARE E-COMMERCE INFRASTRUCTURE
MODULE V: REVIEW OF e-COMMERCE TECHNOLOGIES Chapter 11: Computer Hardware for e-Commerce
Case 1: BTG, NEC Electronics, and Biogen: The Business Case for Server Computer Farms
Chapter 12: Computer Software for e-Commerce Case 2: TravelNow and BEA Systems: The Business Case for
Application Servers
2:30-2:45 Coffee Break 2:45-4:00 Chapter 13: Data Resource Management
Section I: Managing Data Resources Case 1: Shop at Home and Others: Data Resource
Management for Business Intelligence Section II: Technical Foundations of Database Management
Case 2: Payless Shoe Source: the Challenges of Storage Management
Chapter 14: Telecommunication and Networks
Section I: Overview of Telecommunication and Networks Case 1: Weblinc and others: The Business Case for
Wireless LANs Section II: Technical Telecommunications Alternatives Case 1: Piasecki Steel, Lguide.com and Cyber- Train: Evaluating Broadband Alternatives
4:00 – 4:30 Questions and Answers
Class Adjourn.
Completion Report on ASEAN e-Commerce Programme

113
DAY 4 November 13, 20, 2003
8:30 - 9:00 Registration 9:00 – 10:30 PART VII: EVALUATE E-COMMERCE CURRICULUM
Section I: Framework for e-Commerce Teaching Evaluation (e- CTE
) 1. Objectives of e-CTE 2. e-CTE Techniques 3. e-CTE Analysis and Administration 4. e-CTE during Teaching and Learning Process 5. Standard e-CTE 6. Strategy to Improve e-CTE Technique
10:30-10:45 Coffee Break 10:45-12:00 Section II: Enhancing E-Commerce Curriculum that Fit with
Your Organization 12:00-1:00 LUNCH BREAK 1:00 – 2:30 PART VIII: DEVELOP E-COMMERCE RESEARCH GUIDELINE AND
FUTURE DIRECTION Section I: Guideline for development and administration of Research–based E-Commerce Curriculum:
1. Develop Research Questions 2. Conduct Relevant Literature Review 3. Develop Research Model or Framework 4. Select Research Methodology 5. Conduct Data Collection and Analysis 6. Conclusion and Major Findings
2:30 - 2:45 Coffee Break 2:45 – 4:00 Section II: Future Direction of E-Commerce and Research
1. Future Research Topics 2. Publication of Results 3. E-Business Research Club at NIDA
4:00 – 4:30 Questions and Answers
Class Adjourn.
Completion Report on ASEAN e-Commerce Programme

114
DAY 5 November 14, 21, 2003 8:30 - 9:00 Registration
9:00 - 10:00 PART IX: FIELD TRIP to: Phillip Securities (T) PCL (for session starting on 10 Nov. 2003) or Seagate (T) Co. Ltd. (for session starting on 17 Nov. 2003)
10:00 - 10:15 Arrival at company
10:15 - 10: 45 Company briefing
10:45 - 11:00 Coffee Break
11:00 - 12:00 Company tour
12:00 - 2:00 Lunch
2:30 - 3:30 Back to training centre
3:30 – 4:30 CERTIFICATE PRESENTATION CEREMONY/PARTY
4:30 CONGRATULATIONS! Class Adjourn.
Completion Report on ASEAN e-Commerce Programme

115
Chapter 4
GMS ECONOMIC COOPERATION AND ITS IMPACT ON CLMV DEVELOPMENT
Masami Ishida
ABSTRACT Development in the Cambodia, Laos, Myanmar, Vietnam (CLMV countries) is impossible to discuss without mentioning the projects of the Greater Mekong Subregion Economic Cooperation Program (GMS-ECP). The GMS-ECP is an economic cooperation program inaugurated in 1992 by six countries, namely, Cambodia, Laos, Myanmar, Vietnam, Thailand, and Yunnan Province of China through the initiative of Asian Development Bank (ADB). In this chapter, the three stages of GMS-ECP history is reviewed. Then, the concept of GMS economic corridors, which include the cross-border transportation agreement (CBTA), is explained. Finally, the paper reviews the policies implemented so far on using geographical locations for developing the economic corridors. Thus, favorable policies are identified and analyzed.
1. INTRODUCTION About fifteen years ago, the Greater Mekong Subregion Economic Cooperation
Program (GMS-ECP) was inaugurated (1992). Since then, the regional economic
cooperation of the six Member Countries of GMS region (e.g., Cambodia, China, Laos,
Myanmar, Thailand and Vietnam) have expanded and deepened. 1992 was considered a
symbolic year because the long wartime in Indochina was ended through the Paris
Peace Agreement in the following year. Peace building was an initial, yet, important
role expected from GMS-ECP. Its members formulated means to grow towards peace,
116
through dialogues for economic cooperation among themselves.
Today, the GMS-ECP contributes in the regional integration of the East Asia
through its free trade agreements. GMS-ECP designated the economic corridors within
in the GMS region to facilitate increased cross-border trade and inland transportation
among major cities in East Asia. Free trade movements, however, could widen regional
gaps because they promote further agglomeration of the major cities.
On the other hand, Asian Development Bank (ADB) claims that one of the main
purposes of the GMS-ECP is poverty reduction. The GMS-ECP is expected to play an
important role in narrowing existing gap and reducing poverty while expanding and
deepening the regional integration.
This chapter provides a review on the brief history of GMS-ECP and a description
of the problems and prospects in realizing the economic corridors (ECS) of the GMS
This discussion provides clarity on the possible means to reduce the regional gaps.
Section one explains the project sectors involve and the decisionmaking system. The
second section traces the three stages of the GMS-ECS. The third section describes the
transfiguration from the transport corridors to the economic corridors, referring
specifically to the additional economic activities and the development of soft
infrastructure of the economic corridors.
2. THE FRAMEWORK OF THE GMS-ECP
The Greater Mekong Subregion Economic Cooperation Program (GMS-ECP) started
with a Ministerial Meeting through ADB’s initiative. Its Member Countries are
Cambodia, Laos, Myanmar, Vietnam, Thailand and China. As for China, Yunnan

117
Province of China was initially considered as a member country of the program (ADB,
1993, p.1) but in 2005, Guangxi Zhuang Autonomous Region of China also became a
member of the GMS-ECP.
GMS-ECP started with six development sectors, namely: transportation,
telecommunication, energy, human resource, environment, and trade and investment. In
1994, tourism was added as a new development sector; trade and investment was
separated in 1998; and, agriculture was included in 2001. Thus, it is now composed of
nine sectors, namely: 1) Transportation; 2) Telecommunication; 3) Energy; 4) Human
Resource; 5) Environment; 6) Trade; 7) Investment; 8) Tourism; and, 9) Agriculture.
After drawing the blueprint of potential projects in the region and the GME-ECP
progressed into phases of implementation, Member Countries and ADB established the
following sectoral working groups:
(a) GMS Subregional Transportation Forum (STF)
(b) Subregional Telecommunication Forum (STCF)
(c) Electric Power Forum (EPF)
(d) GMS Working Group on Human Resource Development (WGHRD)
(e) Subregional Working Group on Environment (WGE)
(f) GMS Business Forum (GMS-BF)
(g) Subregional Investment Working Group (SIWG)
(h) GMS Tourism Working Group (TWG)
(i) Working Group on Agriculture (AGA)
In terms of the decisionmaking system, GMS-ECP started with two layers process
(left side of Figure 1) which were the senior official meeting (SOM) and Ministerial
Meeting. When the working groups were established, layers increased into three. In

118
Figure 1: Change in Decisionmaking System of GMS-ECP.
Source: author.
2002, a custom of opening the GMS Summit started, consequently, the number of layers
increased to four (right side of Figure 1). Aside from the technical and financial support,
ADB also acted as a catalyst or an “honest broker,” who encourages dialogues, provides
the fora, and extends assistance when needed. The process only emphasized the fact that
the Member Countries owns the GMS-ECP and not ADB, even if it had provided
valuable assistance and resources.
3. BRIEF HISTORY OF GMS-ECP
The history of the GMS-ECP can be presented and understood easily by dividing its
period into three stages; the first stage (1992-1996); the second stage (1994-2001); and,
Working
Group
Working
Group
Working
Group
Working
Group
Senior Official
Meeting (SOM)
Ministerial
Meeting
SUMMIT
Senior Official
Meeting (SOM)
Ministerial
Meeting
At the Beginning Current System …

119
the third stage (2001- to present).
3.1 First Stage (1992-1996)
The first stage (1992-1996) was the period that involved two components, namely, the
creation of GMS-ECS principles and the fact finding and project formation. The
creation of principle component generated several important principles, which were
declared at the First Ministerial Meeting in 1992. One of the most important principle is
the “two plus” principle, wherein, projects of the GMS-ECP need to be subjected into
any of these two conditions:
(a) each project involves, at least, two countries (purely subregional project), or,
(b) a national project that will benefit the whole region (national project with
subregional dimension).
Construction of a bridge at the border of two countries is an example of the former.
A national project on constructing and opening a new airport, however, is an example of
the latter. It is important to note that GMS-ECP project does not require the unanimous
agreement of six countries; it can start based on an agreement of any number of
participating countries. The “two plus” principle brought about more projects focused
on border areas, which were more likely regarded as periphery and a cross-border trade.
Moreover, the role played by ADB as an “honest broker”, utilizing, and improving
existing infrastructure are also examples of other principles.
The second component of this stage is the fact finding and project formation. It
involved the country visits of a study team, dialogues (exchange of views) on
subregional cooperation, and the identification of projects to strengthen subregional
economic cooperation. Thus, the Third Ministerial Meeting in 1994 finalized and

120
approved the list of projects that later became the blueprint of the GMS-ECP.
3.2 Second Stage (1994-2001)
The second stage (1994-2000) is the implementation stage of the listed projects. One of
the listed projects was the Yunnan Expressway between connecting Chunxiong and
Dali; it was constructed soon after it was listed up. However, most of listed projects start
with feasibility study and undergo engineering design prior its stage of implementation.
In some cases, pre-feasibility studies were conducted before a full blown feasibility
study. Social and environment impact assessments were conducted simultaneously with
the engineering study (Figure 2).
In terms of project financing, it was clear that not all listed projects were to be
funded by ADB. Some national projects, with subregional dimension, were financed out
of the country’s budget. Others are sponsored or cosponsored by ADB or by the other
donors.
Figure 2: Processes for Implementing Listed Projects.
Source: author.
Feasibility
Study
Engineering
Design Project
Implementation
Pre-feasibility
Study
Social/
Environment
Assessment

121
3.3. Third Stage (2001- to Present )
The third stage started on the tenth anniversary of the GMS-ECP in 2001. Being a
memorable year, GMS-ECP started its 10-Year Strategic Program (2002-2011). Projects
were categorized into 10 flagship programs with GMS tourism development as the
eleventh flagship program in 2002.
1) North-South Economic Corridor
2) East-West Economic Corridor
3) Southern Economic corridor
4) Telecommunication Backbone and ICT
5) Regional Power Interconnection and Power Trade Agreements
6) Facilitating Cross-Border Trade and Investment
7) Enhancing Private Sector Participation and Skill Competencies
8) Developing Human Resources and Skill Competencies
9) Strategic Environment Framework
10) Flood Control and Water Resource Management
11) GMS Tourism Development
4. ECONOMIC CORRIDOR 4.1 Transportation Corridors
Transportation sector is considered to be the most important among the GMS-ECP
sectors. As a matter of fact, ADB initially felt the necessities for rebuilding transport
infrastructure that was badly damaged by almost forty years of conflicts. In the 1994 list
of the projects, the nine cross-border transport infrastructure (CBTI) routes were
designated as road improvement projects of the subregional priority projects (Figure 3).

122
R1. Bangkok-Phnom Penh-Ho Chi Minh City-Vung Tau Road Project
R2. Thailand-Lao PDR-Viet Nam East-West Corridors
R3. Chiang Rai-Kunming Road Improvement Project via Myanmar and Lao PDR
R4. Kunming-Lashio Road System Improvement Project
R5. Kunming-Hanoi Road Improvement Project
R6. Southern Lao PDR-Sihanoukville Road Improvement Project
R7. Lashio-Loilem-Kentung Road Improvement Project
R8. Southern Yunnan Province-Northern Thailand-Northern Lao PDR-Northern Viet
Nam Road Improvement Project
R9. Northeastern Thailand-Southern Lao PDR-Northeastern Cambodia-Central Viet
Nam Corridor Project
R1 is the Central Subcorridor of the Southern Economic Corridor (SEC). R2 is part
of the East-West Economic Corridor (EWEC). R3 and R5 are parts of the North-South
Economic Corridor (NSEC). The purpose of the projects is to construct and improve
road infrastructure only. Nevertheless, the economic effects of the cross-border road
infrastructure turned out to be larger based on the concept of the economic corridors and
CBTA.
4.2 Three Economic Corridors
The concept of economic corridors was introduced at the Seventh Ministerial Meeting
in 1998 at the time when its project implementation had been stagnated by the Asian
currency Crisis. It was born to serve as a primer mover to conquer the difficulties after
the crisis.
The basic idea of the economic corridors is to vivify economic activities along the

123
Figure 3: Three Economic Corridors in the Greater Mekong Subregion.
Source: ADB(2002).
Srae Ambel

124
transport corridor through the CBTI. Concrete examples, include: the
establishments of industrial estates on the border area; the construction of
telecommunication and electricity transmission cables; and, natural gas pipelines and
tourism activities along the corridors.
The three economic corridors, composed of the EWEC, the NSEC and the SEC
(Figure 3), were formally launched during the eighth Ministerial Meeting in 2000.
4.3 Cross-Border Transport Agreement
As the program entered into the second stage, some Member Countries emphasized the
need for soft infrastructure or the removal of the nonphysical barriers that hindered free
movements of commodities and people at the borders. Thus, this was considered at
the second meeting of subregional transportation forum (STF) in 1995 and resulted in
an agreement to conduct studies to realize such needs.
The studies examined the problems that prevent the free movement of commodities
and people in the region and the existing international conventions on the cross-border
movement of commodities and people. These studies were the basis of the STF in
drawing the basic framework of the CBTA, that was explained at the seminars of the
Member Countries. Consequently, Thailand, Laos and Vietnam signed the CBTA in
1999. Afterwards, Cambodia signed in 2001, China in 2002, and Myanmar in 2003
through the negotiation and amendment of some articles. Thus, by 2003, all the six
Member Countries had already signed the CBTA.
Details of the CBTA, as provided in its 16 annexes and three protocols, were
agreed by the Member Countries in March 20, 2007. Bilateral memorandums of
understanding (MOU), in line with the CBTA (its annexes and protocols), for the

125
Figure 4: Stratum Structure of CBTA.
Source: Author in accordance with ADB (2002).
following borders were agreed upon (Figure 4).
1) Lao Bao, Vietnam and Danh Savanh, Laos on the EWEC
2) Savannakhet, Laos and Mukdahan, Thailand on the EWEC
3) Aranyaprathet, Thailand and Poipet, Cambodia on the SEC
4) Bavet, Cambodia and Mocbai, Vietnam on the SEC
As a matter of fact, beautiful pictures were drawn in the article of MOU, but
they are far from the realities. Nevertheless, as a trial to realize the CBTA, the “single
stop” inspection had already been undertaken at the borders of Lao Bao, Vietnam and
Danh Savanh, Laos. The process of the single stop inspection involves the following
phases:
Phase 1. Customs of exporting countries and importing countries are integrated
to importing countries. This phase has been started already.
CBTA
3 Protocols 16 Annexes
Bilateral MOU Bilateral MOU Bilateral MOU Bilateral MOU
…

126
Phase 2. Documents for the customs clearance of the two countries are
integrated.
Phase 3. Processes for quarantine of the two countries are integrated with the
importing countries.
Phase 4. Processes for migration of the two countries are integrated to importing
countries.
Furthermore, CBTA is explained to shorten the loading and unloading process
through the release of Truck passport, that is the country’s permit for a vehicle to pass
from one country to another. A good example is the case wherein trucks can cross the
borders between Thailand and Laos, and between Laos and Vietnam; but, trucks of
Thailand and Vietnam cannot cross from each other’s boarders.
4.4 New Economic corridors
The 14th Ministerial Conference of GMS-ECP held in Manila on June 19-21, 2007,
endorsed the Mid-Term Review of its 10-Year Strategic Framework (2002 – 2012). A
draft for discussion, entitled Mid-Term Review of the Greater Mekong Subregion
Strategic Framework 2002 – 2012, was published on ADB website. Based on the map
of GMS economic corridor, new economic corridors were added, and some parts of
North-South Economic Corridor were changed (Figure 5):
The Eastern Economic Corridor (EEC) is based on National Road No. 1 (NR 1) of
Vietnam (between Camau and Dongdang); NR 322 or Expressway No. 075 (between
Youyiguan and Guilin passing through Nanning of Guangxi Zhuang Autonomous
Region); and, Changsha of Hunan Province (through an extension of the road). The
Western Economic Corridor (WEC) is part of the Route No. 1 of Asian Highway and it

127
Figure 5: New Economic Corridors in the Greater Mekong Subregion.
Source: ADB (2007b).

128
Remarks
Eastern Economic Corridor : – Guilin – Nanning – Hanoi – Danang – Ho Chi Minh – Camau
Western Economic Corridor: Tam – Naypydaw – Mawlamyaine
Northern Economic Corridor: Fangcheng – Nanning – Kunming – Mandalay – Tamu
Northeastern Economic Corridor: Bangkok – Lom Sak – Luang Phrabang – Thanh Hoa
North-South Economic Corridor: – Kunming – Tak – Bangkok – Narathiwat –
Central Economic Corridor: Boten – Muang Xai – Luang Phrabang – Vientiane – Pakse – Stung
Treng – Phnompenh – Sihanouk Ville
Other Economic Corridors: Sattahip – Chonburi – Bangkok – Dawei
: Bangkok – Nakhon Ratchasima – Khon Kaen – Vientiane
connects Mawlamyaine and Tam (through the new capital of Naypydaw) and Imphal of
Northern Part of India (extension road). The Northern Economic Corridor (NEC)
connects Guangxi Zhuang Autonomous Region, Yunnan Province, Myanmar,
Fangcheng (the port city), and Imphal (located on the extension of Tam). This economic
corridor plans to connect China and India by road. The Northeastern Economic Corridor
(NEEC) passes in relatively underdeveloped areas. Both peripheries of the North-South
Economic Corridor have changed; the north edge is Shuifemg (border of Yunnan
Province and Sichuan Province); and, Chongqing is located on its extension roads. The
Southern edge is extended from Bangkok to Narathiwat, while Kuala Lumpur and
Singapore is located on its respective extension roads. As a result, the routes were
changed and the junction of the EWEC was transferred from Phitsanulok to Tak on NR
1 of Thailand. The Central Economic Corridor basically connects Laos and Cambodia
from Boten, the Lao border with China up to the port of Sihanouk Ville.
With regards to the other economic corridors: the route between Sattahip and
Dawei connects the Eastern Seaboard Area (the most industrialized area in the region)
to the one route passing through the deepest port of Andaman Sea. In this way, the

129
commodities produced in the Eastern Seaboard Area can be exported to India, the
Middle East, and Europe without passing the Malacca strait. This corridor also gives
Myanmar a short-cut route to the Pacific Ocean. The other route between Bangkok and
Vientiane is the same with that of the NR 2 of Thailand.
5. THE IMPACTS OF ECONOMIC CORRIDORS AND
FAVORABLE PROJECTS 5.1 After the Completion of the Second Mekong International Bridges
EWEC has been opened since the completion of the Second Mekong International
Bridge between Savannakhet, Laos and Mukdahan, Thailand. However, some parts of
the road between Thailand and Myanmar have not been paved and still operate on single
lane. The NSEC is expected to be opened by the completion of another Mekong
international bridge between Chiang Khong and Huay Xai in 2011. The Central
Subcorridor of the SEC is also expected to be opened with the completion of Mekong
River bridge of Neak Loeang in Cambodia.
The completion of the Second Mekong International Bridge is surely an
epoch-making event in the development of the East-West Economic Corridor. However,
the business community paid more attention to the Bangkok-Hanoi Road than the
EWEC (Ishida, 2007a). Part of the EWEC, which also includes some parts of Laos, will
be utilized for the movement of commodities between Bangkok and Hanoi. The
government of Laos expressed worries on this situation, referring to a possibility that
the Lao part of the EWEC is only being utilized for transit trucks between Bangkok and
Hanoi. In the same manner, its government worries that the Cambodian part of the
Central Subcorridor of the SEC will only be utilized for transit of trucks between

130
Bangkok and Ho Chi Minh City.
As a matter of fact, the completion of the abovementioned bridges of Mekong
River will likely to increase transportation among the mega-cities like Bangkok, Ho Chi
Minh and Hanoi. Such increases could cause further agglomeration of people and
industries and expands the gap between major cities and rural communities along the
economic corridors. In order to narrow the gap between rural communities and
mega-cities along the corridors, the Member Countries should consider some favorable
ideas/projects. As mentioned in the preinvestment survey, EWEC was designed to
utilize the geographical features for its effective utilization; border areas, junctions and
ports as gateways (ADB, 2001).
5.2 Special Economic Zones at Border Areas
In the GMS-ECP, the development of border areas has been the focus of intervention.
These areas had been treated not only as peripheries, but also as the battle fields where
opposing military forces faced each other prior the 1992 GMS-ECP inauguration. It is
because border areas have several and unique advantages. For example, in a project at
the border between a higher income country and a lower income country, the former can
utilize labor forces of the latter at lower wages (compared to what they used to pay).
Another example is about the resource endowments between a country with better
economic infrastructures and that with poorer infrastructures. People from the latter can
have access to supply of energy, telecommunication lines, water, and ports. Accordingly,
dynamism can be born out of differences in factors and resource endowments between
the two countries at border areas (Kudo, 2007).
Table 1 shows that special economic zones have been planned and some of them

131
Table 1: Realized and Planned Special Economic Zones.
Borders Provinces Values in Border Provinces as of 2003 Populations Densities GPP/cap. (1,000 persons) (Persons/Km2) ($US) Bavet–Mocbai CV Svay Rieng-Tay Ninh 551.0 1,017.1 185.8 252.4 366.1 Koh Kong–Trat CT 182.0 225.0 16.3 79.8 1,542.2
Poipet-Aranya Prathet CT Banteay Mean Chey-Sa Kaeo
748.0 541.4 75.3 75.3 920.5
Denh Savanh– Lao Bao LV Savannakhet–Quang Tri
833.9 608.5 38.3 128.2 300.9 234.0
Savannakhet- Mukdahan
LT 833.9 339.1 38.3 78.1 300.9 600.6
Thanaleng - Nong Kai LT Vientiane-Nong Khai 650.6 913.3 166.0 124.6 1,005.0 576.5 Huai Xai - Chiang Khong
LT Bokeo-Chiang Rai 141.0 1,214.9 22.8 104.0 231.1 743.7
Myawaddy - Mae Sot MT Karen–Tak 1,607.0 498.7 52.9 30.4 309.3 1,010.8 Tachilek - Mae Sai MT Shan-Chiang Rai 5,142.0 1,214.9 33.0 104.0 448.3 743.7
Remarks: Data for the GPP per capita are very rough estimates. These were obtained using the following processes:
1) The GPP per capita in Vietnam was obtained by multiplying monthly per capita income (based on 2003-2004 household survey), with the population of provinces, by 12 months.
2) The GPP per capita in Laos was is a deflated value of 2005. It was obtained by dividing the GDP per capita ratio of 2005 by that of 2003 (based on ADB’s Key Indicators).
3) The GRP per capita in Myanmar is based on inflated monthly household expenditure values from a 2001 survey. It was calculated by multiplying the GDP per capita ratio of 2003 by that of 2001 (based on ADB’s Key Indicators). Annual expenditure per capita is obtained by dividing the annual expenditure per household by the value of the averaged household size and multiplying its quotient by 12 months.
Sources: Distances: - Vietnam: Giao Thong Duong Bo Viet Nam, Tap Ban Do, Thong Duong Bo Viet Nam. - Laos: measure through an automobile odometer when I traversed the route in August 31,
2006. - Thailand: measured from the Road Map of Thailand 2005-2006, compact disk (CD), think net. - Myanmar: measured with a ruler from the Global Travel Map, Myanmar, Asia Books. Area,
Population and Income. - Vietnam: General Statistics Office (2004) Statistical Yearbook 2003. General Statistics Office
(2006); Results of the Survey on Households Living Standards, a paper presented in a workshop in Hanoi, January, 2006.
- Laos: collected from the Provincial Office of Laos. - Thailand: National Statistical Office (Various Years) Statistical Yearbook Thailand. - Myanmar: Central Statistical Organization (2002) Statistical Yearbook 2002. Exchange Rates - Countries except Myanmar: IMF (Various Years) International Financial Statistics. - Myanmar: the average value of daily exchange rates of the Foreign Exchange Certificate
(FEC) Exchange Center in 2001 (based on the Tokyo Mitsubishi Bank).

132
had already been operating. In the Lao and Thai borders of Thanaleng – Nong Khai, a
lot of manufacturing factories have already been operating along the road between the
center of Vientiane city and Mekong Friendship Bridge even if it was not a GMS
Planned Special Economic Zone. Similarly, an industrial estate had been developed at
Bavet in Cambodia by the Manhattan Development, Ltd. with three foreign companies
operating. In Lao Bao, Vietnam, a special economic zone had been built, also. Several
manufacturing companies had been operating and many imported goods are being sold
at duty free shops at the border area. In Mae Sot, Thailand, a lot of Thai companies
produce garments by employing workers of Myanmar at cheaper wages.
On the other hand, enclosed lands had been prepared and designated for the special
economic zones at Poipet and Koh Kong, but as of 2007, no company has built any
factory in the area. In Savannakhet, a special economic zone had been planned with an
investor intending to build an industrial estate at Savan district near the Second Mekong
International Bridge. To this date, the whole land has not been bought from its
inhabitants. As for the borders of Huai Xai – Chiang Khong and Tachilek – Mae Sai, the
province of Chiang Rai is considered as a gateway for Laos and Myanmar while Chiang
Saen Port of Mekong River plays a strategic gateway for Yunnan Province of China. A
special economic zone has been planned in the area, but no investor has emerged so far.
Examining the provincial values of population, population density and gross
provincial product (GPP) of border provinces in Table 1 revealed that provinces who
have operational special border economic zones have relatively higher population
densities (e.g., Bavet, Lao Bao and Thanaleng), while those some of having not been
realized are caused by other reasons. An exception is the case in Mae Sot, where
garment factories hire legal and illegal migrant workers from Myanmar causing the

133
increase in its population at the border area. It is also important to consider that
provincial data do not always reflect the actual situation at the border, particularly, in
big provinces (by area) like Shan and Karen in Myanmar.
As far as seeing the data of population density, the possibility of Savannakhet as a
location of an industrial estate can be doubted. Although it is the second largest
province in Laos, but the population density is smaller and its population are scattered.
As a matter of fact, most of investors planned to invest in plantation and agricultural
sectors, while the number of approved investors dramatically increased in 2006 before
the completion of Second Mekong International Bridge (Keola, 2007). The population
of Koh Kong is also relatively small and it is in the similar situation. As a matter of fact,
Khon Kaen Sugar Industry Public Company, Ltd. (Thai company) which has been the
share holder of Savannakhet Sugar Corp. and Koh Kong Plantation Co., Ltd., has been
granted concessions of 10,000 and 20,000 ha, respectively in Savannakhet and Koh
Kong (The Nation, August 17, 2007).
Locating industrial estates at border areas with relatively smaller population is not
appropriate as far as a large scale of labor migration does not occur; it cannot make use
of abundant labor force with cheaper wages. Instead, such areas should make use of
other factor endowments with comparative advantages like abundant land and natural
resources. Needles to say, however, developing such border areas should be socially and
environmentally sustainable.
5.3 Making Use of Junctions
The preinvestment survey for the EWEC in 2001 enumerates Phitsanulok, Khon Kaen
and Dong Ha as intersection or junctions of the NSEC, the National Road No.2 (NR 2)

134
of Thailand and the NR 1 of Vietnam, respectively. Specifically in Phitsanulok,
commodities produced at cities or villages along the EWEC can be transported to cities
and villages along the NSEC like Chiang Mai, Kunming, and Bangkok; the same
happens with commodities from the NSEC to the EWEC. Similarly, at Khon Kaen, the
NR 2 of Thailand can transport goods to Vientiane, Nakhon Ratchasima and Bangkok;
and at Dong Ha, NR 1 of Vietnam can transport goods to Hanoi and Ho Chi Minh
Cities.
In addition to the abovementioned junctions, Seno district in Savannakhet, where
the EWEC crosses with NR 13 of Laos, is a very important junction. Savannakhet is a
special economic zone and Seno was either mentioned alone or with Savan. NR 13 is
the most important passage in Laos, that connects major cities like Luang Phrabang,
Vientiane, Savannakhet and Pakse. In fact, Japan Logistic System Corp established a
joint venture with Logitem Laos GLKP Co., Ltd.. It started operating an interland
container depot (ICT) at Seno district on October 1, 2007. The joint venture transfers
freights between Bangkok and Hanoi. This reiterates that Seno is not only an important
junction in NR 13, it also serves as transfer point for freights between Bangkok and
Hanoi. Thus, Savannakhet remains a strategically important location even if it may not
be an appropriate location for industrial estate. Similarly, developing ICT has been
planned at Khon Kaen and Phitsanulok. (Tsuneishi, 2007, p.21). Based on the map of
new economic corridors (Figure 5), Table 2 enumerates all other junctions.
5.4 Major Cities and Ports as Potential Markets
Table 2 enumerates the major cities and ports, which are important and export potential
markets. For CLMV countries, there are many other major markets in Thailand and

135
Table 2: Junctions of Economic Corridors, Major Cities and, Ports along them.
Junctions Country Corridors and Major Cities
and Ports Corridors and Major Cities and Ports
Tak Thailand EWEC Danang, Khon Kaen, Maulamyaine
NSEC Bangkok, Kunming
Phitsanulok Thailand EWEC NSEC Khon Kaen Thailand EWEC NR 2 Bangkok, Vientiane
Savannakhet Laos EWEC CEC Vientiane, Phnom Penh, Sihanouk Ville
Dong Ha Vietnam EWEC EEC Hanoi, Danang, Ho Chi Minh
Luang Phrabang
Laos NEEC Bangkok, Hanoi CEC Kunming, Vientiane, Phnom Penh
Stung Treng Cambodia SEC Siem Reap, Quy Nhon
CEC
Sre Ambel Cambodia SEC Eastern Sea Board Area
CEC Phnom Penh, Vientiane
Source: Prepared by the author based on Figure 5.
China. Provinces near major cities can also serve as potential markets, as in the case of
Ayutthaya and Rayong Provinces in Bangkok. Because of the many factories
established in these areas, income level was found to be relatively higher. And, Member
Countries of the CLMV has many important major cities such as Phnom Penh,
Vientiane, Yangon, Mandalay, Hanoi and Ho Chi Minh. Connecting these major cities
by roads is very strategic in marketing the goods they produced (Table 3).
Along with economic growth is the risk of traffic jams. Major national roads most
likely converge in major cities like Bangkok, Hanoi, Ho Chi Minh and Phnom Penh.
Thus, outer ring roads are needed to connect major national roads while avoiding
possible traffic jams.
Ports are the gateways for export markets. The same is true with bringing the
goods produced in CLMV countries to the overseas market. In the Mekong Region,

136
Table 3: Population and Economic Indicators of Major Cities in GMS Area in 2003.
Area Population Density GPP/Cap. GPP (1,000 Km2) (1,000 Persons) (Persons/Km2) (US$) (million US$)
Phnom Phen Cambodia 267.0 1,283.0 4,805.2 Kampong Cham Cambodia 9,799.0 1,805.0 184.2 Vientiane Laos 3,920.0 650.6 166.0 824.4 536.3 Yangon Myanmar 10,166.9 6,188.0 608.6 208.8 1,292.2 Mandalay Myanmar 37,008.1 7,407.0 200.1 183.6 1,359.7 Ho Chi Minh Vietnam 2,095.2 5,554.8 2,651.2 894.5 4,968.8 Ha Noi Vietnam 921.0 3,007.0 3,264.9 619.6 1,863.2 Danang Vietnam 1,255.5 747.1 595.1 514.7 384.5 Bangkok Thailand 1,565.2 5,844.6 3,734.1 7,215.8 42,173.4 Chiang Mai Thailand 20,107.1 1,603.2 79.7 1,356.5 2,174.7 Nakhon Ratchasima
Thailand 20,494.0 2,591.1
126.4 1,028.2 2,664.0
Khon Kaen Thailand 10,886.0 1,770.6 162.6 1,143.4 2,024.4 Ayutthaya Thailand 5,890.1 751.3 127.5 3,403.1 2,556.6 Rayong Thailand 3,552.0 556.7 156.7 13,726.8 7,642.2 Kunming China 21,582.0 5,008.0 232.0 1,963.8 9,834.6 Nanning China - 6,416.7 - 946.2 6,071.4
Sources and Remarks: Same in Table 1.
Laem Chabang Port and Khlong Toey Port play the most important role in export
marketing. Export goods produced in Laos are usually transported through these sea
ports. Likewise, Cambodia, Myanmar, Southern Vietnam and Northern Vietnam uses
the Sihanouk Ville, Yangon, Saigon and Haiphong ports as feeder ports to Hong Kong
or Singapore, respectively (Table 4).
For the cities and villages in the EWEC, the Danang and Maulamyine ports are
designed as the gateways to the Pacific and Indian Oceans, respectively. Danang port
(Tiensa), specifically, was expected to be one of the deepest ports in Vietnam. However,
the quantity of container cargos is less than those in Saigon and Haiphong. The latter

137
Table 4: Major Sea Ports in the Mekong Region
Port Country Location Depth Container Throughput (m) (TEU/Year)
Sihanouk Ville Cambodia Sea 8.3 231 (2006) Phnom Penh Cambodia River 5 - Yangon Myanmar River 9 129 (1999) Thilawa Myanmar River 10 - Maulamyaine Myanmar Sea - - Dawei Myanmar Sea 12 - Khlong Toey Thailand River 8 - Laem Chabang Thailand Sea 14 4,642 (2006-07) Map Ta Phut Thailand Sea 10 - Saigon Vietnam River 10 1,200 (2005) Thi Vai & Cai Mep Vietnam River 15 - Qui Nhon Vietnam Sea - - Danang Vietnam Sea 12 34 (2005) Hai Phong Vietnam River 8 400 (2005) Cailan Vietnam Sea 12 -
Sources: Ishida (2007b), Port Autonome de Sihanoukville, web sites of Institution for Transport
Policy Studies and News Net Asia on December 4, 2007.
rivers ports, however, are relatively shallow. The smaller quantity of cargo reflects the
level of industrialization in Danang City. If the port city is less industrialized, the
quantity of cargos becomes smaller; thus, lesser ships dock in the port. Furthermore,
lesser ship implies that the location is not attractive for an export-oriented investment.
The development of industries and transport infrastructures mutually need each other.
The port of Maulamyine was expected to reduce the transport time, by passing through
the Malay Peninsula and the Malacca Strait, to exports goods from Thailand to Europe
and the Middle East. However, it has not been developed because the area is shallow
and still needs to be dredged. Dawei is another potential deep sea port. Thus, a road
connecting Bangkok and Dawei has been planned as a new economic corridor.
138
As for the other sea ports, Thilawa, Chi Vai and Cai Mep, and Cailan port will also
be developed to serve as the substitutive sea ports of Yangon, Saigon and Hai Phong,
respectively. The Map Ta Phut Port is being used primarily as an industrial port in a
chemical industrial complex. Lastly, Qui Nhon Port is expected to serve the border areas
of North Sub-Corridor of the SEC.
6. CONCLUDING REMARK
The GMS-ECP has been focused in the development of transport infrastructure. By all
means, spreading and expanding transport infrastructure network is effective for the
remote villages to sell their goods to major markets in the region as well as overseas.
Needless to say, however, to be able to increase the function of transportation network,
efforts to reduce cross-border barriers such as CBTA, the use of junctions, and ports for
exports, are needed. In addition, it is also necessary to recognize the marketing demands
and needs of remote areas.
More than giving opportunities for remote areas to sell their goods, it is also
strategic to develop border areas as special economic regions. At the borders between
relatively developed countries, like Thailand and underdeveloped countries, the
differences of factors and resource endowments can create dynamism for the advantage
of both.
Finally, the GMS-ECP can be considered as the most effective development
scheme in the region among the other economic cooperation schemes that had been
implemented (i.e., AIA and ACMECS). Future development in the region will be
implemented along the railway of the economic cooperation program. As learned from
139
the case of Danang Port, however, developing of infrastructure alone does not bear
fruits but its relation to the overall welfare of every Member Country. Furthermore, the
greater roles played by the public sector in the GMS-ECP is significant in
operationalization of the objectives of GMS-ECP. In the future, however, an industrial
development driven by private sectors maybe explored.
REFERENCES Asian Development Bank ADB. 1993. Subregional Economic Cooperation: Initial
Possibilities for Cambodia, Lao PDR, Myanmar, Thailand, Vietnam and Yunnan Province of the People’s republic of China. Manila: ADB.
ADB. 1996. Economic Cooperation in the Greater Mekong Subregion: Facing the Challenges, Manila: ADB.
ADB. 2001. Preinvestment Study for the Greater Mekong Subregion East-West Economic Corridor, Volume 1, Integrative report, Manila: ADB.
ADB. 2007a. Greater Mekong Subregion Economic Cooperation Program 14th Ministerial Conference, ADB Headquarters, Manila, 19-21 June 2007, Manila: ADB.
ADB. 2007b. Mid-Term Review of the Greater Mekong Subregion Strategies Framework 2002-2012, Manila: ADB.
Central Statistical Organization, Myanmar. 2002. Statistical Yearbook 2002. General Statistics Office, Vietnam. 2004. Statistical Yearbook 2003. General Statistics Office, Vietnam. 2006. Statistical Yearbook 2005. Ishida, M. 2007a. Evaluating the Effectiveness of GMS Economic Corridors: Why is
There More Focus on the Bangkok-Hanoi Road than the East-West Corridor? IDE Discussion Paper No. 123, Chiba: Institute of Developing Economies.
Ishida, M. 2007b. Danang Port as a Key of development of the East West Economic Corridor (in Japanese). In Greater Mekong Subregion Economic Cooperation Program; Realizing Three Economic Corridors, ed. Ishida M. and T. Kudo, Chiba: Institute of Developing Economies.
Keola, S. 2007. “East-West Corridor and Laos: What will change by the completion of Second Mekong International Bridge (in Japanese).” In Greater Mekong Subregion Economic Cooperation Program: Realizing Three Economic

140
Corridors, ed. Ishida M. and T. Kudo. Chiba: Institute of Developing Economies.
Kudo, T. 2007. “Border Industry in Myanmar: Turning the Periphery into the Center of the Growth.” IDE Discussion Paper No. 122. Chiba: Institute of Developing Economies.
National Statistical Office. Various Years. Statistical Yearbook Thailand. Tsuneishi, T. 2007. “Thailand Economic Cooperation with Neighboring Countries and
Its Effects on Economic Development within Thailand.” IDE Discussion Paper No. 115. Chiba: Institute of Developing Economies.

141
Chapter 5
INVESTMENT CLIMATES IN CLMV: THEIR GLOBAL POSITIONS
Souknilanh Keola
ABSTRACT This report attempted to identify investment climates in Cambodia, Lao PDR, Myanmar, and Vietnam (CLMV). First, it re-arranged investment climates into (1) macroeconomic factors, (2) infrastructures, (3) supply and demand factors, and (4) policy factors. Then, it made an attempt to evaluate CLMV’s positions for each factors by making a comparison across as many countries as possible based on statistics and indices made available by international institutions, national statistical authorities etc. A set of possible policy implications have also been provided as possible ways to improve investment climates in CLMV.
1. DEFINITION
Before making any attempt to examine the investment climates in CLMV, it is first
necessary to provide a common definition of investment climate that will be used in this
report. Until now, many academic and nonacademic papers have provided a variety of
definitions.
David et all (2003) defined investment climate as the institutional, policy, and
regulatory environment in which firms operate. The World Bank’s World Development
Report 2005 titled “A Better Investment Climate for Everyone” broadened the
definition to “The investment climate reflects the many location-specific factors that
shape the opportunities and incentives for firms to invest productively, create jobs, and

142
expand.” Phillips (2006) divided investment climates into governance and infrastructure
components while stating that healthy investment climate includes economic and
political stability, rule of law, adequate infrastructure, tax and regulations conducive to
doing business, labor policies, and access to finance. Recently, Ho (2006) described
investment climate constrains to be primarily policies or resources.
It is obvious that government policies and infrastructures are very important factors
determining investment climates based on these definitions. However, few of them put
emphasis, at least explicitly, on supply/demand factors such as population sizes and
other resources in the places of investment. Population is very important for investment
activities in two ways. They can be inputs to production or labor, and can serve as
consumers of the final products. This is termed the "home market effect” and is
regarded as one of most important determinants of agglomeration forces in spatial
economics.
Putting more emphasis on supply and demand factors, this report re-categorizes
investment climates into (1) macroeconomic factors, (2) infrastructures, (3) supply and
demand factors, and (4) policy factors. It is easy to see that these different factors are all
interconnected, and can be substituted. As a result, it is natural to assume that the same
level of investment climates can be achieved by different sets and/or levels of each
factor of investment climates.
Several indicators will be selected and presented to examine the investment
climates in CLMV. Comparison will be made across as many countries or regions as
possible.

143
2. MACRO ECONOMIC FACTORS
While macroeconomic factors can be strongly influenced by policies, they are not
included as policy factors due to their market-oriented nature. As indicators of
macroeconomic factors, the following have been selected: (1) economic growth rate, (2)
GDP deflator, (3) foreign exchange rate, and (4) ratio of trade balance to GDP.
Growth rate was selected because, in general, a place that grows faster may be
considered more attractive as an investment destination due to the higher possibility of
more gain. Figure 1.1 depicts the growth rates of 195 countries and regions from 1977
to 2005. In this period, majority of economies in the world managed to grow in the
range of -10 percent to 10 percent annually. For CLMV, Myanmar was the only country
with data on growth rate available throughout the period. Laos and Vietnam did not
have data until their adoption of policies for transition to market economy in the
mid-1980s. Figures for Cambodia were not available before 1994, or one year after the
civil war in the country was finally ended by active involvement of the United Nations.
Cambodia had been growing steadily since 1994, with a two-digit growth rate in
1999. Laos adopted a policy to transform the economy from a centrally planned to a
market-oriented economy, but only achieved significant growth when it began accepting
foreign direct investment at the end of 1988. Myanmar achieved relatively high growth
from the late 1970s to the mid-1980s, but then experienced a negative growth toward
the end of the 1980s. The economy began to grow again from the mid-1990s with a
quite steep fluctuation from time to time. Vietnam can be considered the country with
the most steadied growth, but with its huge domestic market, the prospect may be even
brighter. Vietnam is actually beginning to compete with some of its former ASEAN
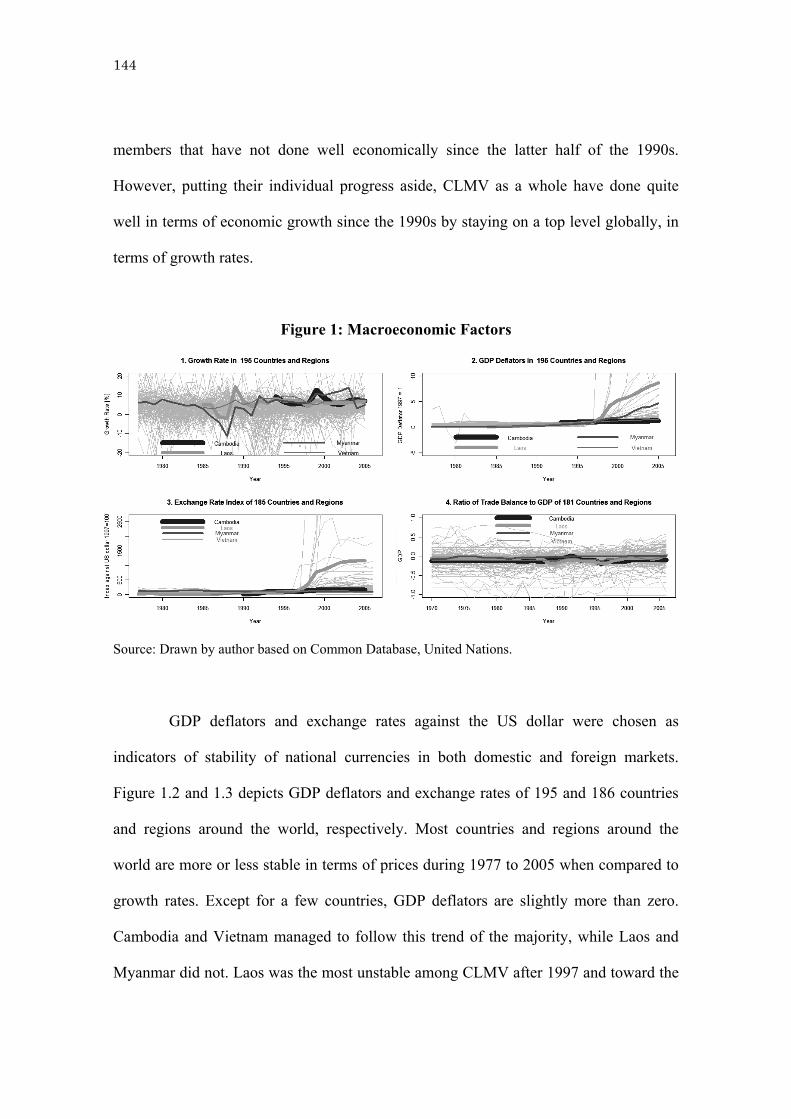
144
members that have not done well economically since the latter half of the 1990s.
However, putting their individual progress aside, CLMV as a whole have done quite
well in terms of economic growth since the 1990s by staying on a top level globally, in
terms of growth rates.
Figure 1: Macroeconomic Factors
Source: Drawn by author based on Common Database, United Nations.
GDP deflators and exchange rates against the US dollar were chosen as
indicators of stability of national currencies in both domestic and foreign markets.
Figure 1.2 and 1.3 depicts GDP deflators and exchange rates of 195 and 186 countries
and regions around the world, respectively. Most countries and regions around the
world are more or less stable in terms of prices during 1977 to 2005 when compared to
growth rates. Except for a few countries, GDP deflators are slightly more than zero.
Cambodia and Vietnam managed to follow this trend of the majority, while Laos and
Myanmar did not. Laos was the most unstable among CLMV after 1997 and toward the
145
beginning of 2000s. GDP deflator, a proxy of consumer price index, inflated to almost
10 times in Laos after the Asian financial crisis that broke out in late 1996. Myanmar
experienced inflation fivefold and a demonetization of its currency in a few occasions.
In terms of the value against the US dollar of the national currencies of 185
countries and regions in the world during 1977 to 2005, a sharp depreciation can be
observed after the Asian financial crisis. Even among former members of ASEAN, a
depreciation from 100 to several thousand percent had been observed. However, among
CLMV, the depreciation of the LAK (Lao Kip), Laos’ national currency, was by far the
largest. Myanmar had been stable according to statistics, although there is a need to take
into account the fact that Myanmar is the only country that still maintains several
exchange rate systems among CLMV.
Figure 1.4 depicts trade balances as percentage to GDP of 181 countries or
regions. It shows that the percentage to GDP of trade balance of most countries and
regions are in the range of -5 percent to slightly above 2 percent. CLMV lie in the range
between -1 percent to about 0 percent of GDP, and are therefore doing “not so bad and
not so good” in terms of trade balance among countries or regions in the world.
Therefore, besides the instability of the LAK during 1997 to early 2000s and
the not-so-stable financial condition in Myanmar, all of CLMV’s macroeconomic
factors have been relatively well since the 1990s by world’s average standard.
3. INFRASTRUCTURES Infrastructures are important to economic activities including investment. Table 1 shows
the indices of general infrastructures such as road, railway, water, electricity, and

146
telecommunication. Those for Malaysia, Singapore, and Thailand have also been added
as the benchmarks that CLMV may aim for.
Among CLMV, road density (total road length divided by total land area) is lowest
in Myanmar, higher in Cambodia and Laos, and highest in Vietnam. While one may
safely say that more roads will need to be constructed in CLMV considering the very
high road density in Singapore or Malaysia, the optimal levels can, however, vary. This
is because differences in population densities and their distributions may also lead to
different lengths and forms of road to be constructed.
Moreover, quality does matter more when it comes to using roads. While road
density is not high in Thailand, its road network is by far better than those in CLMV,
including Vietnam that has a higher road density according to statistics. In Thailand,
most national roads are generally separated from the roads used daily by local people
living along them, making it possible for cars and trucks to travel at a higher speed.
A total of about 650-km-long railway system exists in Cambodia. Though the
construction of a 3-km-long railway from the First Friendship Mekong Bridge between
Laos and Thailand has been in progress since mid-2007, Laos is still the only country in
the ASEAN without a railway besides the city-state of Brunei. Longer railway networks,
mainly connecting cities from north to south, exist in Myanmar and Vietnam, but
improvement is likely necessary for them to be used as economic corridors.
Almost half of households in Cambodia and Laos still have no access to clean
water. The situation is better in Myanmar and Vietnam, but still not good enough when
compared to Malaysia, Singapore, and Thailand. Electricity is not only important for
better livelihood; it is also indispensible for modern economic activities. With
electrification rate lower than 20 percent, electricity is obviously lacking in Cambodia.
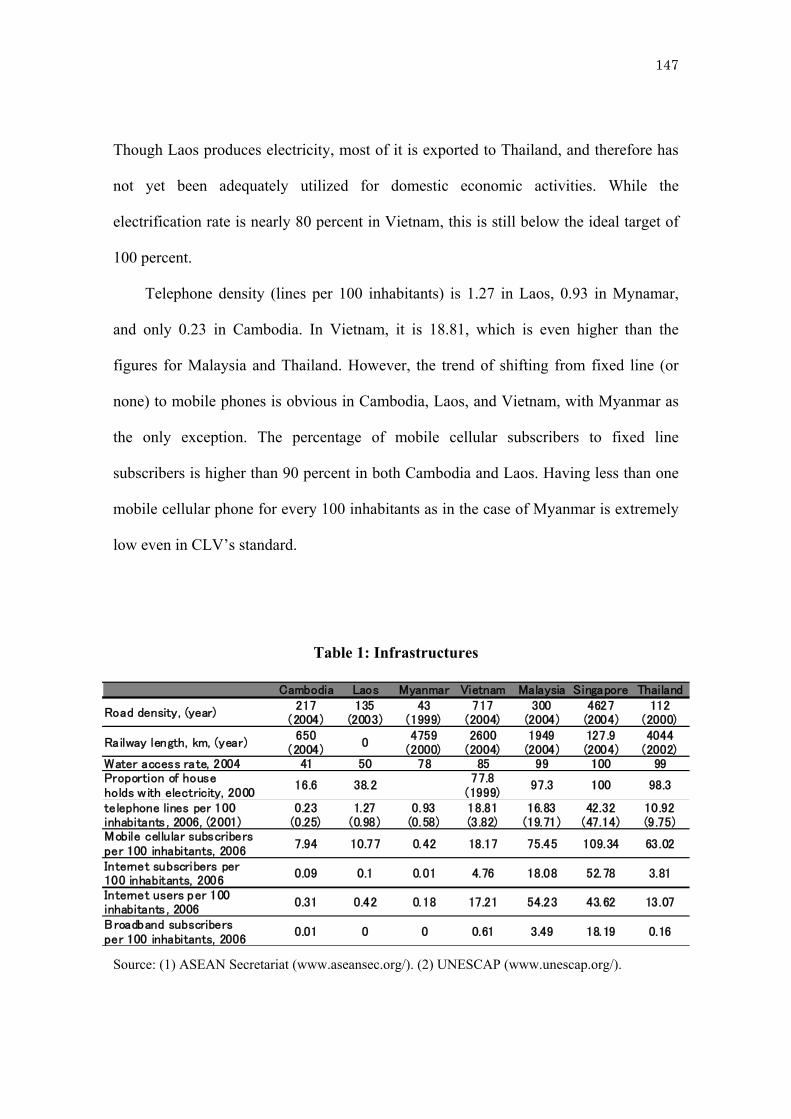
147
Though Laos produces electricity, most of it is exported to Thailand, and therefore has
not yet been adequately utilized for domestic economic activities. While the
electrification rate is nearly 80 percent in Vietnam, this is still below the ideal target of
100 percent.
Telephone density (lines per 100 inhabitants) is 1.27 in Laos, 0.93 in Mynamar,
and only 0.23 in Cambodia. In Vietnam, it is 18.81, which is even higher than the
figures for Malaysia and Thailand. However, the trend of shifting from fixed line (or
none) to mobile phones is obvious in Cambodia, Laos, and Vietnam, with Myanmar as
the only exception. The percentage of mobile cellular subscribers to fixed line
subscribers is higher than 90 percent in both Cambodia and Laos. Having less than one
mobile cellular phone for every 100 inhabitants as in the case of Myanmar is extremely
low even in CLV’s standard.
Table 1: Infrastructures
Source: (1) ASEAN Secretariat (www.aseansec.org/). (2) UNESCAP (www.unescap.org/).
Cambodia Laos Myanmar Vietnam Malaysia Singapore Thailand
Road density, (year)217
(2004)135
(2003)43
(1999)717
(2004)300
(2004)4627(2004)
112(2000)
Railway length, km, (year)650
(2004)0
4759(2000)
2600(2004)
1949(2004)
127.9(2004)
4044(2002)
Water access rate, 2004 41 50 78 85 99 100 99Proportion of households with electricity, 2000
16.6 38.2 77.8
(1999)97.3 100 98.3
telephone lines per 100inhabitants , 2006, (2001)
0.23(0.25)
1.27(0.98)
0.93(0.58)
18.81(3.82)
16.83(19.71)
42.32(47.14)
10.92(9.75)
Mobile cellular subscribersper 100 inhabitants, 2006
7.94 10.77 0.42 18.17 75.45 109.34 63.02
Internet subscribers per100 inhabitants, 2006
0.09 0.1 0.01 4.76 18.08 52.78 3.81
Internet users per 100inhabitants , 2006
0.31 0.42 0.18 17.21 54.23 43.62 13.07
Broadband subscribersper 100 inhabitants, 2006
0.01 0 0 0.61 3.49 18.19 0.16
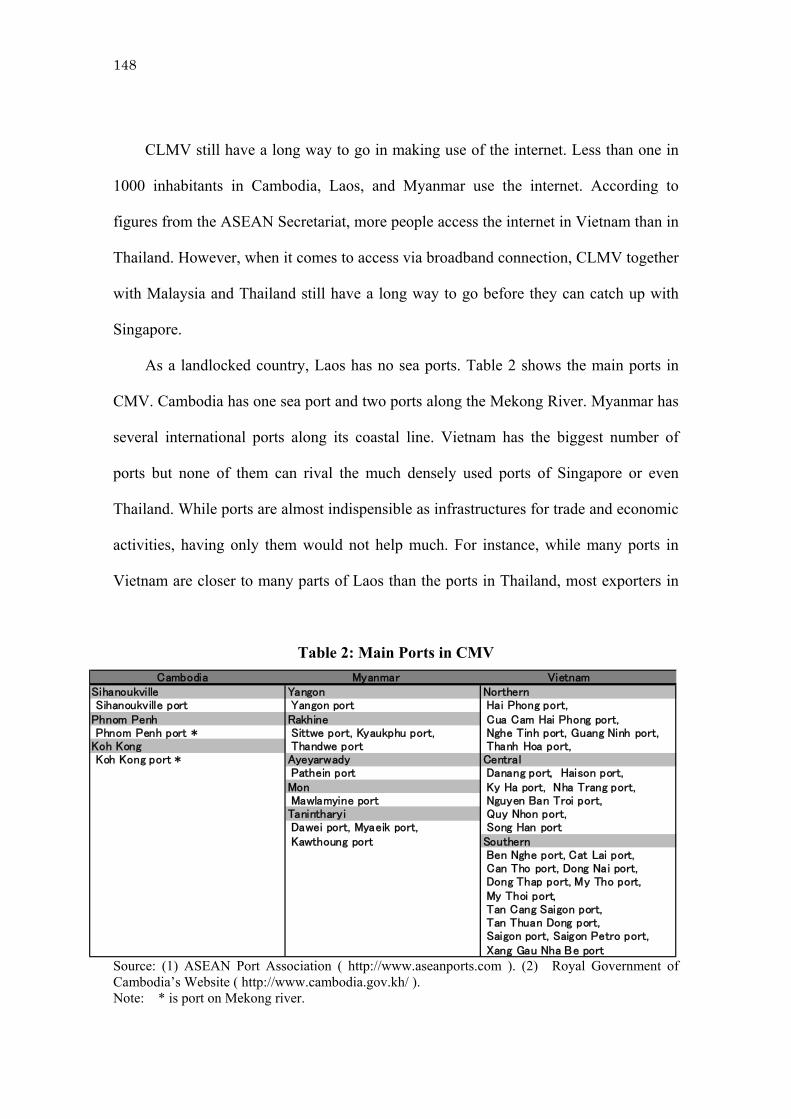
148
CLMV still have a long way to go in making use of the internet. Less than one in
1000 inhabitants in Cambodia, Laos, and Myanmar use the internet. According to
figures from the ASEAN Secretariat, more people access the internet in Vietnam than in
Thailand. However, when it comes to access via broadband connection, CLMV together
with Malaysia and Thailand still have a long way to go before they can catch up with
Singapore.
As a landlocked country, Laos has no sea ports. Table 2 shows the main ports in
CMV. Cambodia has one sea port and two ports along the Mekong River. Myanmar has
several international ports along its coastal line. Vietnam has the biggest number of
ports but none of them can rival the much densely used ports of Singapore or even
Thailand. While ports are almost indispensible as infrastructures for trade and economic
activities, having only them would not help much. For instance, while many ports in
Vietnam are closer to many parts of Laos than the ports in Thailand, most exporters in
Table 2: Main Ports in CMV
Source: (1) ASEAN Port Association ( http://www.aseanports.com ). (2) Royal Government of Cambodia’s Website ( http://www.cambodia.gov.kh/ ). Note: * is port on Mekong river.
Cambodia Myanmar VietnamSihanoukville Yangon Northern Sihanoukville port Yangon port Hai Phong port,Phnom Penh Rakhine Cua Cam Hai Phong port, Phnom Penh port * Sittwe port, Kyaukphu port, Nghe Tinh port, Guang Ninh port,Koh Kong Thandwe port Thanh Hoa port, Koh Kong port * Ayeyarwady Central
Pathein port Danang port, Haison port,Mon Ky Ha port, Nha Trang port, Mawlamyine port Nguyen Ban Troi port,Tanintharyi Quy Nhon port, Dawei port, Myaeik port, Song Han port Kawthoung port Southern
Ben Nghe port, Cat Lai port, Can Tho port, Dong Nai port, Dong Thap port, My Tho port, My Thoi port, Tan Cang Saigon port, Tan Thuan Dong port, Saigon port, Saigon Petro port,Xang Gau Nha Be port

149
Laos still prefer the Thai ports apparently due to their lower prices, safer handling, and
predictable times.
Airports are important to economic activities including investment. Cambodia has
only two international airports but more than 20 airlines, most of them flying
internationally. Laos has three international airports but with only five airlines that fly
to and from the biggest airport in the capital city. Myanmar has two international
airports but with relatively fewer flights compared to Cambodia. Vietnam has two big
international airports in the north and south, and one smaller international airport in the
central part.
While it is obvious that infrastructure development is an urgent need in CLMV to
attract more investment, it is not easy for economies like them with relatively limited
financial resources to develop infrastructures at a steady rate. However, many Asian
Table 3: International Airports and Operating Airlines
Source: Various sources on the WWW.
CambodiaSiem Riep International Airport
AirAsia,Thai AirAsia,Angkor Airlines,Asiana Airlines,Bangkok Airways, Cathay Pacific ,Dragonair, China Airlines,China Southern Airlines, EVA Air,Far Eastern Air Transport,Jetstar Asia Airways,Korean Air, Malaysia Airlines,President Airlines,PMTair,Royal Khmer Airlines, Royal Phnom Penh Airways, Shanghai Airlines, Siem Reap Airways, Singapore Airlines, SilkAir, Thai Airways International, Transmile Air Services, Vietnam Airlines
Phnom Penh International AirportAirAsia, Air Macau, Angkor Airways, Asiana Airlines, Bangkok Airways, China Eastern Airlines, China Southern Airlines, Japan Airlines, Jetstar Asia AirwaysKampuchea Airlines, Korean Air, Lao Airlines, Malaysia Airlines, PMTair, President Airlines, Royal Khmer Airlines, Royal Phnom Penh Airways, Siem Reap ASingapore Airlines, SilkAir, Vietnam Airlines
LaosWattay International Airport
AirAsia, ChChina Southern Airlines, Lao Airlines, Thai Airways International, Vietnam Airlines Luangphabang International Airport
Bangkok Airways, Lao Airlines, Siem Reap Airways, Vietnam Airlines Pakxe International Airport
Bangkok Airways, Lao Airlines MyanmarYangon International Airport
Air Bagan, Air India IC, AirAsia, Thai AirAsia, Air Bagan, Air China, Air Mandalay, ATRAN Cargo Airlines, Bangkok Airways, China Airlines, Mandarin Airlines,China Southern Airlines, Hong Kong Express Airways, Jetstar Asia, Malaysia Airlines, Myanma Airways, Myanmar Airways International, Qatar Airways, Singapore Airlines, Silk Air, Thai Airways International, Vietnam Airlines, Yangon Airways
Mandalay International AirportAir Bagan, Air Mandalay, China Eastern Airlines, Myanma Airways, Yangon Airways
VietnamNoi Bai International Airport
Aeroflot, AirAsia, Thai AirAsia, Air Dream, Air France, Asiana Airlines, Cathay Pacific, China Airlines, China Southern Airlines, EVA Air, Uni Air, Hong Kong Japan Airlines, Korean Air, Lao Airlines, Malaysia Airlines, Pacific Airlines, PMTair, Royal Khmer Airlines, Singapore Airlines, Thai Airways International, NokTiger Airways, Vladivostok Air, Vietnam Airlines
Da Nang International AirportFar Eastern Air Transport, Pacific Airlines, PBair, Singapore Airlines,SilkAir, Vietnam Airlines
Tan Son Nhat International AirportAir China, Air France, All Nippon Airways, Asiana Airlines, Bangkok Airways, Cathay Pacific, Cargolux, China Airlines, Mandarin Airlines, China Airlines CargChina Eastern Airlines, China Southern Airlines, EVA Air, Uni Air, Finnair, Garuda Indonesia, Hong Kong Airlines, Japan Airlines, Jetstar Asia Airways, KLM,Korean Air, Korean Air Cargo, Lufthansa, Malaysia Airlines, Pacific Airlines, Philippine Airlines, Qantas, Jetstar Airways, Qatar Airways, Royal Brunei AirlineRoyal Khmer Airlines, Shanghai Airlines, Shanghai Airlines Cargo, Shenzhen Airlines, Singapore Airlines, Thai Airways International, Tiger Airways,TransaeroUnited Airlines, Vietnam Airlines, Viva Macau

150
countries have shown good examples of how to overcome this constraint since the
middle of the 20th century. Economic zoning, ranging from providing a mere tract of
land to a full package estate, is a good scheme of attracting investment into a
geographical area. In most cases, the chosen site not only provides good access to
facilities and administrative services but also gives investment incentives. These
generally consist of reduced set-up costs and easier mobility for investors. Many kinds
of economic zoning from export processing zone to industrial park, free port, and free
zones in ASEAN are plotted in Figure 2.
Figure 2. Concentration of Industrial Parks in ASEAN (Including Planned)
Source: Drawn by author based on statistics at ASEAN-Japan Centre’s Home Page
(http://www.asean.or.jp/eng/).

151
Larger concentrations of economic zones are seen in more industrialized ASEAN
countries such as Singapore, Malaysia, Thailand, and Philippines. However, a number
of these facilities can also be found in relatively small city-states such as Brunei. For
CLMV, a certain number of economic zoning facilities are seen in growth centers of
Vietnam both in the north and in the south. While Cambodia has small concentrations of
industrial parks in coastal areas, Laos has only two planned sites. There are about 50
various types of industrial estates throughout Myanmar.
4. SUPPLY AND DEMAND FACTORS
As pointed out earlier, this report added supply and demand factors to the general
definitions of investment climate. Figure 3.1 to 3.4 depicts land areas, population sizes,
population densities, and percentages of urban population in 229 countries and regions
around the globe. These were selected to demonstrate some of the potential supply
factors for investment activities within these territories.
In Figure 3.1, CLMV are on the top half, meaning that more than half of 229
countries and regions in the world have areas smaller than CLMV. Myanmar has the
largest area among countries in the Indochinese peninsula. Vietnam is on the top third
among the 229 territories because of its land area which is even larger than Japan.
Despite its small population, Laos is larger than many states in the European Union
(EU). Cambodia is the smallest in terms of land area but still larger than more than half
of 229 territories presented in Figure 3.1.

152
Figure 3: Supply Factors
Source: Drawn by author based on statistics available at United Nation Statistics Division’s Home
Page (http://unstats.un.org/unsd/default.htm).
It is also worth noting that while larger areas do not necessary lead to more natural
resources, most of these resources are in fact under land or sea. CLMV have actually
entered into the era of modern or large-scale commercial exploration of natural
resources since the late 1990s. PetroVietnam’s annual export of crude oil reached US$4
billion in the first several months of 2007. Myanmar’s export of natural gas to Thailand
jumped from several hundred thousands in 1997 to more than US$2 billion in 2006.
Laos began its commercial export of gold in 2003, and the total export value of gold and
copper reached more than US$500 million in 2006. The commercial export of oil under
exploration off the Cambodian shore is expected in 2010. More natural gas mines and
gold mines are being developed in Myanmar and Laos, respectively, while crude oil

153
export from Vietnam is likely to continue increasing. In CLMV, natural resources are
therefore one of the attractive sectors to invest in.
In terms of population, besides China and India (represented by two dots in Figure
3.2) that have more or less than one billion population each, there are not many
countries in the world that have a population much larger than Vietnam (more than 84
million). Myanmar’s population is around 50 million. It is followed by Cambodia with
more than 14 million and by Laos with nearly 6 million. While Laos’ population is
extremely small by ASEAN’s standard, it is actually bigger than many industrialized
states in the EU.
Density is also important when it comes to population. Industrial agglomeration
will not be possible without agglomeration of population as labor cannot pay higher so
people can travel to their place of work. Figure 3.3 reveals that the population density in
Vietnam is high by global standard. Cambodia and Myanmar are in the middle while
Laos has one of the lowest population densities in the world. The population density of
Laos is significantly low because while its population is larger than Singapore and a
little smaller than Hong Kong (China), two of the most industrialized states in Southeast
Asia, its land area is nearly 342 times larger than that of Singapore. Mobilization of
labor force would likely be necessary if Laos is to move forward with the improvement
of investment climate, especially for the manufacturing sector.
As can be gleaned from Figure 3.4, the urbanization level in CLMV is still in its
early stages. The percentage of urban population in Cambodia and Laos is around 20
percent; in Myanmar and Vietnam, the figure is around 30 percent. This may be a
reflection of the stage of industrialization in these countries as well as the potential of
work force mobilization in the face of industrialization.

154
Figure 4: Demand Factors
Source: Drawn by author based on statistics available at United Nation Statistics Division’s Home
Page (http://unstats.un.org/unsd/default.htm).
Figure 4.1 to 4.4 reveal the indicators of CLMV as potential markets among
economies in the world. Based on Figure 4.1, the GDP of Vietnam is in the bottom top
half of 180 countries or regions. Vietnam’s economy is still smaller than all former
members of ASEAN, but the largest among CLMV. With their combination of large
population and small per capita income, Vietnam and Myanmar are certainly by far
more attractive in terms of a single market compared to Cambodia and Laos.
Per capita incomes of CLMV are low or among the lowest in the world as can be
seen in Figures 4.3 and 4.4. While this spells CLMV’s high potential to supply cheap
labor, it also lowers their attractiveness as markets at present.
Although the population sizes of CLMV can be considered both supply and
demand factors of investment climate, the supply and demand factors of these countries
are not necessarily equal. With the ongoing trend in reduction of transportation costs,
development of transportation technologies, and emerging regional integration around

155
the world, the accessible markets for investment activities within a territory are usually
larger than just a domestic market. For CLMV, many efforts within several frameworks,
such as ASEAN, Great Mekong Subregion Program (Asian Development Bank), and
Ayeyawady-Chao Phraya-Mekong Economic Cooperation Strategy, are all aiming at, or
at least moving in, the direction of creating a single market. Therefore, for both
Cambodia and Laos, where domestic markets are relatively small, but are sandwiched or
surrounded by much larger and growing economies such as Thailand, Vietnam, other
ASEAN members, and even China, the accessible market for investment in both
countries may be several times bigger than their domestic markets.
In short, among CLMV, the supply and demand factors of Myanmar and Vietnam
are good even by international standard, while Cambodia and Laos can also be attractive
if certain conditions are met.
5. POLICY FACTORS Tax regimes, governance issues, and government policies or actions that affect the
investment climate can be considered as policy factors. However, making a comparison
of such factors based on statistics across countries in the world would be extremely
difficult. Indexing them would require large funds, time, and manpower for both
surveys and analyses.
This report, instead, makes use of the Doing Business Index compiled by World
Bank, which encompasses mainly policy factors across countries. The index is
composed of 10 detailed indices or rankings, namely, (1) start a business, (2) dealing
with licenses, (3) employing worker, (4) registering property, (5) getting credit, (6)

156
protecting investors, (7) paying taxes, (8) trading across border, (9) enforcing contracts,
and (10) closing a business.
Start a business index ranks the easiness of starting a business in a country or
region based on (1) number of procedures, (2) time (days), (3) cost, and (4) minimum
capital as percentage of per capita income. Table 4 shows CLV scores in the start a
business index. There are more or less 10 procedures to start a business in CLV
compared to 2 to 20 procedures in other countries. However, in term of time to start a
business, more than five months are needed in Laos, nearly three months in Cambodia,
and more than one and a half months in Vietnam. The time needed to start a business in
Cambodia and Laos is many times longer than the world average (47.7 days). Vietnam
is close to achieving the world average, better than Indonesia‘s 97 days, almost the
same as the Philippines’ 48 days, but 20 days longer than Malaysia’s 30 and Thailand’s
33 days and far behind Singapore’s six days and Australia’s best practice of two days.
Minimum capital (as percent of per capita GDP) necessary to start a business is
generally low in ASEAN. However, more than half of per capital GDP is required in
Cambodia and ASEAN. This may not be problem for large scale or foreign investment,
but it is certainly a huge barrier for lower classes.
The processes comprising the start a business index can be taken as the beginning
of investment itself and therefore no benefit from investment may be achieved if
investors cannot pass through them.
Licensing is one of the main obstacles in doing business in many developing
countries. The time and cost associated with obtaining licenses are high, and
unpredictable in many cases. The dealing with licenses index includes (1) number of
procedures, (2) time (days), and (3) cost (as percentage of per capita income). Table 5
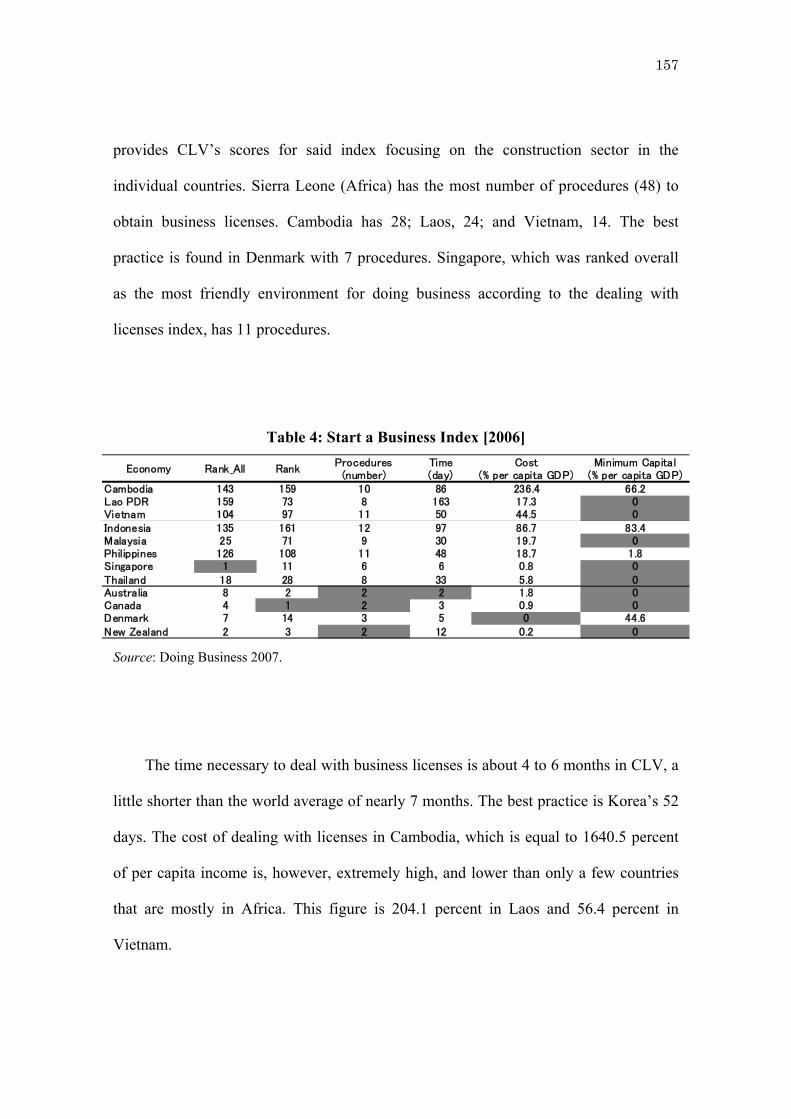
157
provides CLV’s scores for said index focusing on the construction sector in the
individual countries. Sierra Leone (Africa) has the most number of procedures (48) to
obtain business licenses. Cambodia has 28; Laos, 24; and Vietnam, 14. The best
practice is found in Denmark with 7 procedures. Singapore, which was ranked overall
as the most friendly environment for doing business according to the dealing with
licenses index, has 11 procedures.
Table 4: Start a Business Index [2006]
Source: Doing Business 2007.
The time necessary to deal with business licenses is about 4 to 6 months in CLV, a
little shorter than the world average of nearly 7 months. The best practice is Korea’s 52
days. The cost of dealing with licenses in Cambodia, which is equal to 1640.5 percent
of per capita income is, however, extremely high, and lower than only a few countries
that are mostly in Africa. This figure is 204.1 percent in Laos and 56.4 percent in
Vietnam.
Economy Rank_All RankProcedures
(number)Time(day)
Cost(% per capita GDP)
Minimum Capital(% per capita GDP)
Cambodia 143 159 10 86 236.4 66.2Lao PDR 159 73 8 163 17.3 0Vietnam 104 97 11 50 44.5 0Indonesia 135 161 12 97 86.7 83.4Malaysia 25 71 9 30 19.7 0Philippines 126 108 11 48 18.7 1.8Singapore 1 11 6 6 0.8 0Thailand 18 28 8 33 5.8 0Australia 8 2 2 2 1.8 0Canada 4 1 2 3 0.9 0Denmark 7 14 3 5 0 44.6New Zealand 2 3 2 12 0.2 0

158
Table 5: Dealing with Licenses Index [2006]
Source: Doing Business 2007.
The employing worker index was derived from examining government regulation
in the area of employment and social security. The index consists of (1) rigidity of
employment index, (2) nonwage labor cost (% of salary), and (3) firing costs (weeks of
wages). The rigidity of employment index is divided further into (1) difficulty of hiring
index, (2) rigidity of hours index, and (3) difficulty of firing index.
Since employment and social security are decided to protect workers, it is difficult
to determine whether rigid or not rigid regulations are better for both employers and
employees. Therefore, the term “best practice” may not be suitable in this category. The
indices in Table 6 should instead be taken as barometer of rigidity of employment and
social security in a certain country.
Among countries in ASEAN, regulations regarding employment and social security are
not so rigid in Laos, Vietnam, Singapore, and Malaysia. They are more rigid in
Cambodia, Indonesia, Philippines, and Thailand. On the other hand, nonwage salary
cost is almost 0 in Cambodia while it ranges from 5 to about 10 percent of salary for the
rest in ASEAN. Among CLV, firing cost is highest in Vietnam and least in Cambodia
and Laos.
Economy Rank_All RankProcedures(number)
Time(day)
Cost(% per capita GDP)
Cambodia 143 159 28 181 1,640.50Lao PDR 159 130 24 192 204.1Vietnam 104 25 14 133 56.4Indonesia 135 131 19 224 311Malaysia 25 137 25 281 78.2Philippines 126 113 23 197 113.4Singapore 1 8 11 129 22Thailand 18 3 9 127 11.1St. Vincent and the Grenadines 44 1 11 74 10.6Denmark 7 6 7 70 67.8South Korea 23 28 14 52 175.9Palau 62 42 23 114 6.8

159
Table 6: Employing Worker Index [2006]
Source: Doing Business 2007.
According to statistics from Doing Business 2007, land and building account for
between half and three quarters of the wealth of most economies. Registering them has
been proven advantageous for entrepreneurs. The registering of property index is
composed of (1) number of procedures, (2) time (days), and (3) cost (% of property
value). These indices are based on the standard case of an entrepreneur wanting to
purchase land and building in the largest business city in each economy.
In Laos, it takes more than four months to process nine procedures and the cost of
registration is 4.2 percent of the value of the property to be registered. In Cambodia, the
registration time is less than two months for seven procedures and the cost is 4.6 percent
of the value of the property to be registered. The cost of registration is relatively low in
Vietnam at only 1.2 percent of the value of the property and the number of procedures is
less at 4 but processing time is still about two months.
Economy Rank All RankDifficulty of
HiringIndex
Rigidity ofHoursIndex
Difficulty ofFiring Index
Rigidity ofEmployment
Index
Nonwagelaborcost
% salary
Firing costsWeeks of
wages
Cambodia 143 124 56 60 30 49 0 39Lao PDR 159 71 11 40 60 37 5 19.4Vietnam 104 104 0 40 70 37 17 86.7Indonesia 135 140 61 20 50 44 10 108.3Malaysia 25 38 0 20 10 10 12.8 88Philippines 126 118 56 40 20 39 8.5 91Singapore 1 3 0 0 0 0 13 4Thailand 18 46 33 20 0 18 5.2 54.3Marshall Islands 87 1 0 0 0 0 10.5 0Australia 8 9 0 0 10 3 21.3 4Hong Kong 5 16 0 0 0 0 5 62.1Maldives 53 5 0 0 0 0 0 8.7Tonga 51 4 0 20 0 7 0 0

160
Table 7: Registering Property Index [2006]
Source: Doing Business 2007.
Firms consistently rate access to credit as one of the greatest barriers to their
operation and growth (Doing Business 2007). The getting credit index is composed of
(1) legal right index, (2) credit information index, (3) public registry coverage (%
adults), and (4) private bureau coverage (% adults). The strength of legal rights index
measures 10 aspects of the rights of borrowers and creditors in collateral and
bankruptcy laws, including whether:
• General rather than specific description of assets and debt is permitted in
collateral agreements;
• Any legal or natural person may grant or take security in assets;
• A unified registry operates that includes charges over movable property;
• Secured creditors have priority both within bankruptcy and outside it;
• Parties may agree on out-of-court enforcement of collateral by contract; and
• Creditors may both seize and sell collateral out of court, no automatic stay or
“asset freeze” applies upon bankruptcy, and the bankrupt debtor does not retain
control of the firm.
Economy Rank All RankProcedures(number)
Time(day)
Cost(% property
value)Cambodia 143 100 7 56 4.6Lao PDR 159 148 9 135 4.2Vietnam 104 34 4 67 1.2Indonesia 135 120 7 42 10.5Malaysia 25 66 5 144 2.4Philippines 126 98 8 33 5.7Singapore 1 12 3 9 2.8Thailand 18 18 2 2 6.3New Zealand 2 1 2 2 0.1Norway 9 6 1 1 2.5Saudi Arabia 38 4 4 4 0

161
Table 8: Getting Credit Index [2006]
Source: Doing Business 2007.
Data were obtained by examining collateral and bankruptcy laws and legal
summaries, and verified through a survey of financial lawyers (Doing Business 2007).
According to scores in Table 9, legal rights in CLV are still weak. They are 0 in
Cambodia, 2 in Laos, and 4 in Vietnam, all less than 5 in the range from 0 to 10. Among
former member of ASEAN, only Malaysia (8) and Singapore (9) score higher than 5.
The credit information index measures the extent to which the rules of a credit
information system facilitate lending based on the scope of information distributed, the
ease of access to information, and the quality of information. The score of Cambodia
and Laos is both 0. Vietnam’s score is 3, which is higher than Indonesia’s, the same as
the Philippines’, and close to Singapore’s score.
Public and private registry coverage refers to the number of individuals and firms
covered by public and private registry. They are both 0 in Cambodia and Laos. For
Vietnam and the rest of ASEAN, the strategy can be obviously divided into two types.
Economy Rank All RankLegalRights Index
CreditInformation
Index
Publicregistrycoverage(% adults)
Privatebureau
coverage(% .adults)
Cambodia 143 174 0 0 0 0Lao PDR 159 173 2 0 0 0Vietnam 104 83 4 3 2.7 0Indonesia 135 83 5 2 8.4 0.2Malaysia 25 3 8 6 42.2Philippines 126 101 3 3 0 4.8Singapore 1 7 9 4 0 38.6Thailand 18 33 5 5 0 21.7United Kingdom 6 1 10 6 0 86.1Hong Kong 5 2 10 5 0 64.5Japan 11 13 6 6 0Portugal 40 65 4 4 72 9.1Argentina 101 48 3 6 25.4 100

162
While Vietnam, Indonesia, and Malaysia try to cover this by public registry, these are
left mainly to the private sector in the Philippines, Singapore, and Thailand.
If the rights of investors are not protected, having the majority share in the
ownership of a business is the only way to eliminate expropriation. But then, investors
must devote more oversight attention to fewer investments resulting in entrepreneurship
being suppressed (Doing Business 2007).
The protecting investor index is composed of (1) disclosure index, (2) director
liability index, (3) shareholder suits index, and (4) investor protection index. Out of 175
economies, Laos and Vietnam are both ranked 170 while Philippines is ranked 151.
Cambodia is ranked 60, the same as Indonesia. Singapore and Malaysia are ranked 2
and 4, respectively.
Table 9: Protecting Investor Index [2006]
Source: Doing Business 2007.
Economy Rank All RankDisclosure
Index
DirectorLiabilityIndex
ShareholderSuitsIndex
InvestorProtection
IndexCambodia 143 60 5 9 2 5.3Lao PDR 159 170 0 3 3 2Vietnam 104 170 4 0 2 2Indonesia 135 60 8 5 3 5.3Malaysia 25 4 10 9 7 8.7Philippines 126 151 1 2 7 3.3Singapore 1 2 10 9 9 9.3Thailand 18 33 10 2 6 6New Zealand 2 1 10 9 10 9.7Hong Kong 5 3 10 8 9 9New Zealand 2 1 10 9 10 9.7

163
The paying tax index consists of (1) payments (number), (2) time (hour), (3) profit
tax, (4) labor tax and contributions, (5) other taxes, and (6) total tax rate. Cambodia and
Laos are ranked 16 and 36, respectively, in this index, and are between Singapore in
rank 8 and Indonesia in rank 133 in ASEAN. Vietnam is ranked 120, much lower than
Cambodia and Laos mainly due to the time necessary in paying tax. Time in hours
necessary to pay tax in Vietnam is 1,050, which is clearly longer than the time in Laos
(180) and Cambodia (121)
The trading across border index consists of (1) documents for export (number), (2)
time for export (days), (3) cost to export (US$ per container), (4) documents for import
(number), (5) time for import (days), and (6) cost to import (US$ per container).
Laos is among the countries where trading across border is most difficult. It is
ranked 161 out of 175 economies, while Cambodia and Laos are ranked 114 and 75,
respectively. The costs to import (U$1,420) and export (U$1,690) in Laos are nearly
two times higher than those in Cambodia and Vietnam.
Table 10: Paying Tax Index [2006]
Source: Doing Business 2007.
Economy Rank All RankPayments(number)
Time(hour)
Profit taxLabor tax andcontributions
Othertaxes
Total taxrate
Cambodia 143 16 27 121 19.6 0 2.7 22.3Lao PDR 159 36 31 180 26.7 5.8 0 32.5Vietnam 104 120 32 1,050 21.6 19.7 0.2 41.6Indonesia 135 133 52 576 25.2 11.3 0.6 37.2Malaysia 25 49 35 190 17.7 15.8 1.6 35.2Philippines 126 106 59 94 22.7 10.6 19.7 53Singapore 1 8 16 30 12 14.8 2 28.8Thailand 18 57 46 104 29.2 6 5 40.2Maldives 53 1 1 0 0 0 9.3 9.3Saudi Arabia 38 6 14 75 2.1 12.8 0 14.9

164
Table 11: Trading Across Border Index [2006]
Source: Doing Business 2007.
Where contract enforcement is efficient, businesses are likely to engage with new
borrowers or customers (Doing Business 2007). The enforcing contract index is based
on the efficiency of the judicial system to resolve a commercial dispute. The index
consists of (1) procedures (number), (2) time (days), and (3) cost (% of debt).
As can be read in Table 12, it takes more than a year to resolve a business dispute
in Cambodia and Laos, and nearly 10 months in Vietnam. It costs 20 percent more than
the cost of the debt itself in Cambodia. Making processing time shorter and less costly
is certainly what an economy can do to improve its rank in this index. Time and cost are,
however, still high in most of the ASEAN except for Singapore with 120 days and 14.6
percent.
Economy Rank All Rank
Documentsfor
export(number)
Time forexport(days)
Cost toexport
(US$ percontainer)
Documentsfor
import(number)
Time forimport(days)
Cost toimport
(US$ percontainer)
Cambodia 143 114 8 36 736 12 45 816Lao PDR 159 161 12 66 1,420 16 78 1,690Vietnam 104 75 6 35 701 9 36 887Indonesia 135 60 7 25 546 10 30 675Malaysia 25 46 6 20 481 12 22 428Philippines 126 63 6 18 1,336 7 20 1,336Singapore 1 4 5 6 382 6 3 333Thailand 18 103 9 24 848 12 22 1,042Hong Kong 5 1 2 5 425 2 5 425Estonia 17 6 5 3 640 6 5 640Tonga 51 17 6 12 265 9 17 360

165
Table 12: Enforcing Contract Index [2006]
Source: Doing Business 2007.
Lastly but equally important is the closing a business index. The economic crises
of the 1990s in emerging markets—from East Asia to Latin America, from Russia to
Mexico—raised concerns about the design of bankruptcy systems and the ability of
such systems to help reorganize viable companies and close down unviable ones (Doing
Business 2007). In countries where the bankruptcy system is inefficient, unviable
businesses linger for years, keeping assets and human capital from being reallocated to
more productive uses (Doing Business 2007). The closing business index consists of (1)
time (years), (2) cost (% of estate), and (3) recovery rate (cents on the dollar).
Judging from Table 13, it is difficult to close a business in CLV. Cambodia and
Laos are both ranked 151 while Vietnam is ranked 116 out of 175 economies. Recovery
rate is 0 in Cambodia and Laos, and 18 cents on a dollar in Vietnam. The processing
time is five years in Laos and Vietnam, a little shorter than Indonesia’s 5.5 years,
Philippines’ 5.7 years, and clearly much longer than Singapore’s 0.8 years.
Economy Rank All RankProcedures(number)
Time(days)
Cost(% debt)
Cambodia 143 118 31 401 121.3Lao PDR 159 146 53 443 30.3Vietnam 104 94 37 295 31Indonesia 135 145 34 570 126.5Malaysia 25 81 31 450 21.3Philippines 126 59 25 600 16Singapore 1 23 29 120 14.6Thailand 18 44 26 425 17.5Denmark 7 1 15 190 6.5Iceland 12 8 14 352 5.9New Zealand 2 15 28 109 10.9Korea 23 17 29 230 5.5

166
Table 13: Closing a Business Index [2006]
Source: Doing Business 2007.
6. CONCLUSION REMARKS This paper attempted to identify the investment climates in CLMV. First, it re-arranged
investment climates into (1) macroeconomic factors, (2) infrastructures, (3) supply and
demand factors, and (4) policy factors. Then, it tried to reveal CLMV’s position for
each factor by making a comparison across as many economies as possible using
statistics and indices made available by international institutions and national statistical
authorities mainly in CLMV.
Utilizing data from several sources is, in itself, a limitation of this report. While
this made comparison across wider topics and economies possible, ensuring consistency
in degree and scope and accuracy of statistics and data from different sources proved to
Economy Rank All RankTime(year)
Cost
(% estate)
Recoveryrate
(cents onthe dollar)
Cambodia 143 151 0Lao PDR 159 151 5 76 0Vietnam 104 116 5 14.5 18Indonesia 135 136 5.5 18 11.8Malaysia 25 51 2.3 14.5 38.7Philippines 126 147 5.7 38 4Singapore 1 2 0.8 1 91.3Thailand 18 38 2.7 36 42.6Japan 11 1 0.6 3.5 92.7Ireland 10 7 0.4 9 87.9Singapore 1 2 0.8 1 91.3Eritrea 170 151 1.7 14.5 0

167
be difficult. Despite this constraint, however, the report was able to arrive at a number
of conclusions.
According to statistics, the macroeconomic factors in CLMV can be considered
stable in general since the beginning of the 21st century, with a few exceptions. Firstly,
Cambodia and Laos are still heavily dependent on external aid. The sudden stoppage of
aid can lead to extremely unstable macroeconomic conditions. Secondly, Lack of
statistics and very large gaps between information from different sources in the case of
Myanmar, and to less extent Cambodia, Laos and Vietnam, have made it difficult or
impossible to accurately evaluate their macroeconomic factors.
Among CLMV, supply factors, especially in terms of labor, are much better in
Myanmar and Vietnam due to their huge population sizes. The situation is better in
Cambodia than in Laos, because while the population size of Cambodia is only about
three times that of Laos, the higher population density has made the location of
labor-intensive industries more viable in Cambodia. On the other hand, supply factors in
terms of natural resources are getting better recently for all CLMV, due to successful
commercialization of exploitation of different resources in different countries.
There is, however, plenty of room for improvement in both infrastructure and
policy factors in CLMV. For infrastructure factors, sufficient roads and railway
networks are yet to be developed in Cambodia and Laos, while improvement and better
administration are still necessary in Myanmar and Vietnam. This also holds for policy
factors, where Cambodia (143), Laos (159), and Vietnam (104) are still ranked lower
than 100 out of 175 economies according to Doing Business 2007.
Providing better investment climates evenly throughout an economy may be
considered ideal but, in reality, it is often difficult or not possible due to many resource

168
limitations including finance. One way to overcome this may be through economic
zoning. Economic zoning, which ranges from providing a mere tract land to a full
package estate, may make it possible to provide better investment climates within a
certain (smaller) geographical area, with relatively limited resources. This has been
proven practical and effective as a tool for industrialization by many newly
industrializing economies in Asia, former ASEAN members, as well as China during
the mid to late 20th century
REFERENCES Bredo, William 1960. Industrial Estate: Tool for Industrialization. Free Press.
Ho, James K. 2006. Maximum resolution dichotomy for investment climate indicators. INTERNATION JOURNAL OF BUSINESS ENVIRONMENT. Vol. 1, No.1, 2006, pp. 126 - 135.
Ota, Tatsuyuki .2003. The Role of Special Economic Zones in China’s Economic Development As Compared with Asian Export Processing Zones:1979-1995. Asian in Extenso, March 2003. http://www.iae.univ-poitiers.fr/EURO-ASIE/Docs/Asia-in-Extenso-Ota-mars2003.pdf
Phillips, Lauren M. 2006. Growth and the Investment Climate: Progress and Challenges for Asian Economies. Institute of Development Studies. http://www.asia2015conference.org/pdfs/Phillips.pdf Wong, Kyan-Yiu, and David K.Y. Chu. 1984. Export Processing Zones and Special Economic Zones as Generators of Economic Development: The Asian Experience, Geografiska Annaler. Series B, Human Geography, Vol.66,No.1.(1984),pp.1-16. World Bank. 2005. World Development Report 2005. http://siteresources.worldbank.org/INTWDR2005/Resources/complete_report.pdf World Bank. 2007. Doing Business 2007. http://www.doingbusiness.org/documents/DoingBusiness2007_FullReport.pdf

171
Chapter 6 CHINA’S TRADE AND ECONOMIC RELATIONS WITH CLMV Hao Hongmei
ABSTRACT This chapter aims to analyze China’s trade and economic relations with Cambodia, Laos, Myanmar, and Vietnam (CLMV) and gives an objective evaluation of China’s policy (existing and future) on regional economic cooperation, in particular, on China’s impacts on CLMV’s development. The paper also tries to provide an answer--or at least way of thinking--to the question: How will CLMV share in China’s high-gear economic growth and follow up the regional economic integration?
1. CHINA’S TRADE AND ECONOMIC RELATIONS WITH CLMV
1.1 Bilateral trade
1.1.1 Status quo of trade performance in recent years
Cambodia, Laos, Myanmar, and Vietnam (CLMV) are China’s neighbors in the
southwest, all of which have good relations with China. Bilateral trade between China
and CLMV has been growing rapidly in recent years, where China has an overall trade
surplus with the four countries, although it suffers deficits with the ASEAN as a whole.
In 2006, the China-CLMV trade was US$12.4 billion, which increased 584.8
percent from that of 1995. China-Cambodia trade increased 1,178.9 percent from
US$57.3 million in 1995 to US$732.8 million in 2006. China-Vietnam trade in 2006
shared 78.3 percent of total China-CLMV trade and increased by 973.8 percent from
US$927.0 million in 1995 to US$9,954.2 million in 2006. China-Laos trade increased
302.0 percent from US$54.3 million in 1995 to US$218.3 million in 2006.

172
China-Myanmar trade rose 90.3 percent from US$767.3 million in 1995 to US$1,459.9
million in 2006.
China had a surplus in its trade with CLMV. The surplus in 1995 was US$818.4
million, which accounted for 45.3 percent of the total trade between China and CLMV.
The surplus in 2006 was US$6,718.7 million, accounting for 54.3 percent of the total
China-CLMV trade in the year.
Table 1: China’s Trade with CLMV (1995-2006)
(US$ million) China-CLMV
Trade Change
(%) Export to
CLMV Import from
CLMV
Balance
1995 1805.8 - 1312.1 493.7 818.4 Cambodia 57.3 - 51.6 5.7 45.9
Laos 54.3 - 47.8 6.5 41.3 Myanmar 767.3 - 617.8 149.5 468.3 Vietnam 927.0 - 594.9 332.1 262.8
2006 12365.3 584.8 9542.0 2823.3 6718.7 Cambodia 732.8 1178.9 697.7 35.1 662.6
Laos 218.3 302.0 168.7 49.6 119.1 Myanmar 1459.9 90.3 1207.2 252.7 954.5 Vietnam 9954.2 973.8 7468.3 2485.9 5162.4
Source: China Customs.
China’s exports to CLMV are mainly machinery, iron and steel, and textiles. In
2006, China’s export of textiles, footwear, and textile materials to Cambodia were
valued at US$454.7 million, accounting for 65.2 percent of China’s total export to the
country. Machinery and vehicles are China’s major exports to Vietnam, Myanmar, and
Laos. In 1995, China’s export value of these products to Vietnam was US$196.6 million,
which was 27.3 percent of the total export in the year. In 2006, China’s machinery and
vehicles exports to Vietnam increased to US$1,859.2 million, 9.4 times that in 1995,
whereas the share fell to 24.9 percent in 2006. Currently, China’s agricultural machinery

173
(walking tractor, diesel engine) accounts for over 90 percent in Myanmar’s market. Table 2: Composition of China’s Exports to CLMV, 2006
(US$ million) HS Description Value Share % Vietnam 7468.3 10.5 72 Iron And Steel 1346.7 18 84 Machinery 959.0 12.8 27 Mineral Fuel, Oil, Etc 791.2 10.6 Myanmar 1207.2 1.7 84 Machinery 156.6 13 72 Iron And Steel 115.3 9.6 27 Mineral Fuel, Oil, Etc 113.9 9.4 Cambodia 697.7 1 60 Knit,Crocheted Fabrics 207.6 29.8 52 Cotton+Yarn,Fabric 115.1 16.5 84 Machinery 53.2 7.6 Laos 168.7 0.2 87 Vehicles, Not Railway 39.3 23.3 85 Electrical Machinery 34.7 20.6 88 Aircraft, Spacecraft 30.8 18.3
Source: China Customs.
On the other hand, China’s imports from CLMV are mainly raw materials.
Minerals fuels are China’s major imports from Vietnam; however, its share in China’s
total imports from the country declined in recent years---from 69.7 percent in 2004 to
65.2 percent in 2005 and 42.7 percent in 2006. Meanwhile, China’s imports of rubber
from Vietnam grew markedly; such product’s share in total imports grew from 6.6
percent in 2005 to 13.3 percent in 2006. Bilateral trade between China and Vietnam is
targeted to reach US$15 billion in 2010. In the coming years, China’s imports of coffee
and rubber from Vietnam will increase by a big margin. In 2006, its import demands for
Vietnam’s coffee, tea, and rubber was US$100 million, US$50 million and US$2.8
billion, respectively. In comparison, the actual imports of the three products from
Vietnam were only US$13 million, US$7 million and US$773 million, respectively.

174
Here, one sees a fairly large gap between demand and actual import. Finally, wood
enjoys absolute predominance in China’s imports from Myanmar, Laos, and Cambodia. Table 3: Composition of China’s Imports from CLMV, 2006
(US$ million) HS Description Value Share % Vietnam 2485.9 2.8 27 Mineral Fuel, Oil Etc 1061.9 42.7 40 Rubber 331.6 13.3 26 Ores, Slag, Ash 179.3 7.2 Myanmar 252.7 0.3 44 Wood 152.2 60.3 40 Rubber 21.4 8.5 26 Ores, Slag, Ash 16.7 6.6 Laos 49.6 0.1 44 Wood 23.3 46.9 40 Rubber 12.1 24.4 74 Copper+Articles Thereof 4.2 8.4 Cambodia 35.1 0 44 Wood 12.1 34.4 40 Rubber 8.7 24.8 52 Cotton+Yarn, Fabric 6.8 19.3
Source: China Customs.
Rubber is another of China’s major imports from CLMV. China’s demands for this
product will continue to rise due to its rapid industrial expansion. China recorded an
annual growth rate of 22.4 percent from 2000-2005 in its automobile production.
Therefore, the CLMV should take advantage of their proximity to China and expand
their rubber exports to the nation. The surging rubber price in international market will,
to some extent, help to reduce the trade deficits with China.
1.1.2 Analysis of CLMV’s trade dependence on Chinese market
Although CLMV’s trade with China remains small in absolute value, its import
dependence on the Chinese market is relatively high. Myanmar depends heavily on
trade with China while Vietnam’s dependence is to a lesser extent because of the latter’s

175
better-developed trade relations with the rest of Asia and the industrialized countries. If
cross-border informal trade is included, the figure would be even larger. Table 4: CLMV’s Trade Dependence on China, 2006
(US$ million) Exports Imports
Value To China
Share % Value From China
Share %
Cambodia 2602.4 35.1 1.4 2174.0 697.7 32.1 Laos. 254.7 49.6 19.5 423.6 168.7 39.8 Myanmar 3514.8 252.7 7.2 2115.5 1207.2 57.1 Vietnam 39605.0 2485.9 6.3 44410.0 7468.3 16.8
Source: China Customs, http://www.aseansec.org/stat/Table17.xls
Table 5: Comparison of CLMV’s Import Dependence on China, 2001-2006 2001 2002 2003 2004 2005 2006
Cambodia 13.5 12.7 17.2 14.3 18.9 32.1 Laos. 10.2 12.6 18.8 19.9 22.6 39.8 Myanmar 21 31.2 34.9 42.3 53.7 57.1 Vietnam 11.6 11.3 12.8 13.7 15.5 16.8
Source: China Customs, Aseansec (2006), WTO (2001-2005)
Data show that CLMV’s dependence on the Chinese market is increasing.
China’s dependence on CLMV’s raw materials will also increase in the future, but since
China is a big country, it has other sources of imports. Due to China’s industrial
structure and huge domestic market, CLMV is more fragile in terms of trade.
There is, however, potential for more Chinese exports to CLMV in the future. This
is because of the following:
• Favorable political climate between China and CLMV
• China’s low-wage and competitive manufacturing sectors
• Geo-advantage, in particular, China’s southwest region
• Lower tariffs
• Regional and sub-regional trade and investment facilitation in which China and

176
CLMV are members of.
On the whole, China has a relatively complete industrial structure, and can make
most commodities by itself and of better quality than those of CLMV. There are at least
two challenges facing China-CLMV trade relations in the future. One is how, how fast,
and how much more the Chinese market can take of CLMV’s products The answer to
this will partly determine the soundness of the China-CLMV trade relations. There is
little room for import tariff reduction since most products already enjoy zero tariff.
However, to become a big power in the world economic system, China has to show its
ability in taking in CLMV’s products and letting them feel the real interests in
strengthening the trade cooperation. The Chinese government has noticed the problem
of increasing trade surplus with CLMV amid the rapid development of bilateral trade,
and it is possible measures will be taken to reduce the trade imbalance.
The second challenge is how to solve the problem of a similar industrial structure
among these nations. According to the report issued by the US International Trade
Commission, the competitiveness of Vietnam’s textiles is second only to China, and its
target markets are also the United States, European Union, and Japan. Meanwhile,
Vietnam also enjoys a lower cost of labor. Therefore, trade disputes in the future are
likely to occur. China is now stepping up its efforts to move from an export-oriented
and extensive growth strategy in its foreign trade, but instant results will not be abruptly
produced. Labor-intensive products will still be the mainstay for China’s exports over a
longer period of time. With this awareness, China will try to avoid the areas where they
compete with CLMV’s local companies and choose to trade more in areas that are
mutually complementary such as raw materials.
1.1.3 China’s foreign trade policy during 2006-2010 and possible impacts on CLMV
China’s 11th Five-year Plan (2006-2010) will bring its economy into a new phase of
steady growth. China’s annual GDP growth is estimated at above 8 percent, while the

177
total retail sales of consumer goods and production factors will reach around US$4.8
trillion by 2010.
During the 11th Five-year Plan Period, China’s merchandise imports and exports
will reach US$2,500 billion to US$2,700 billion in value terms. With a growth of
around 15 percent, a roughly balanced trade position will be achieved.
Starting 2006, the Chinese government has made drastic adjustments and changes
in its trade policy. The general trend is to transit progressively to a neutralized policy
framework. Its major policy measures include the following:
• The RMB exchange rate is no longer pegged to the American dollar. China has
adopted a managed floating exchange rate regime based on supply and demand;
• Imposition of export duty on high-energy consuming, environmental-harmful and
resource-intensive products;
• A lowering of the export rebate rate for high-energy consuming,
environmental-harmful and resource-intensive products and some labor-intensive
products with lower value added;
• Policy adjustments in processing trade, which prohibited or restrained market access
to high-energy consuming, environmental-harmful and resource-intensive
products and some products with lower value added;
• Unified income tax of domestic enterprises and enterprises with foreign investment;
• Relaxed restrictions on foreign exchange and eliminated forced exchange settlement
system;
• Adjusted import policy, cut-down or eliminated import license or quotas;
• Reduced or exempted import tariff and value-added tax on high-tech products and
some resource products, raw materials and spare parts.
As China’s economic size expands, the import demand will also increase. China’s
import would possibly come up to US$1.2 trillion by 2010. The Chinese economy offers

178
abundant business opportunities in its more open market, and this would spur imports of
natural resources and intermediate products from CLMV.
1.2 China’s outward investment to CLMV
1.2.1 Still in its beginning stage
Mutual investment between China and CLMV is still difficult to achieve mainly due to
the latter’s weak economic standing. Chinese companies invest in CLMV mainly for
three purposes: to ensure a steady and long-term supply of raw materials, to avail of
local market potentials, and to keep an eye on the western markets.
By the end of 2006, China made an investment of US$246 million in Vietnam. The
434 (excluding HK) Chinese-invested projects range from heavy industry, light industry,
construction, hotel, transport, to catering and tourism. In November 2006, during
Chinese President Hu Jintao’s visit to Vietnam, the China Southern Power Grid
Corporation signed an agreement to invest via a build-operate-transfer (BOT) scheme in
the first phase of the coal-burning thermal power plant project in Binh Thuan in the
south of Vietnam. The investment totaled US$900 million and is the largest joint
venture project of Vietnam. Along with the accelerated process of Two Corridors and
One Ring, Vietnam will become a heavyweight choice for China’s outward investment.
By the end-September 2006, China’s investment stock to Laos totaled US$55.86
million, mainly in the field of service trade, manufacturing, and resource development.
China is the top investor in Cambodia. China’s investment in Cambodia
concentrates on forest development, timber processing, power, textile, building material,
contract engineering, and farm production. In the recent 10 years, 107 Chinese
enterprises set up business in Cambodia. Although 28 countries, including the United
States and the European Union, have granted a generalized system of preferences to
Cambodia, only 20 percent of their enterprises can actually make profit.
On November 29, 2006, China reached an agreement with Cambodia over the
Trade and Economic Cooperation Zone in Sihanoukville. The zone covers 2.4 square

179
kilometers and will be jointly established by the China Jiangsu Province and two
Cambodian companies.
By the end of 2006, China had 27 investment projects in Myanmar with a total
contract value of US$475 million, making China occupy the sixth rank in foreign direct
investment (FDI) inflows to Myanmar. In November 2006, during Prime Minister
General Soe Win’s visit to China, both sides agreed to strengthen their cooperation in
power grid and hydropower station.
China’s FDI in CLMV is underestimated because of some unregistered FDI flows,
so it is difficult to create an accurate picture. On the whole, Chinese investment has
achieved better results. For example, in Vietnam, TCL Group has set up a TV factory
that aims to produce 500,000 TV sets annually while Lifan Motor has established an
assembling factory for products that are already widely known in local markets.
Table 6: China’s Investment to CLMV, 2003-2006 (US$10,000)
2003 2004 2005 2006 Stock by end-2006
Total 285465 549799 1226117 1763397 61648 Cambodia 2195 2952 515 981 10366 Laos 80 356 2058 4804 9607 Myanmar - 409 1154 1264 16312 Vietnam 1275 1685 2077 4352 25363
Source: China Commerce Yearbook (2007)
Table 7: FDI Inflows to CLMV, 2006 (US$ million).
2006 Country Intra-ASEAN Extra-ASEAN Total net
inflow Year-on-year change in FDI net inflow
Cambodia 155.5 327.7 483.2 26.8 Laos 10.6 176.8 187.4 575.8 Myanmar 27.8 115.2 143.0 39.4 Viet Nam 181.9 2,178.1 2,360.0 16.8
Source: http://aseansec.org/stat/

180
Table 8: China’s Contract Engineering and Labor Service in CLMV, 2006 (US$10,000)
Contract value Business turnover Total 7164800 3569497 Cambodia 31470 11381 Laos 36380 15207 Myanmar 30935 28158 Vietnam 269520 59275
Source: China Commerce Yearbook (2007)
1.2.2 Barriers and potentials
The CLMV countries have started to open their economies to the outside world and
introduced liberal and attractive foreign investment laws since the late 1980s, but FDI
inflows are slow to come due to a lack of infrastructure and an inefficient bureaucracy.
Although the rate of growth appears very impressive, China’s investment to CLMV
is still made up of small-scale enterprises. That is:
• Most Chinese enterprises that invested in CLMV are small in size and weak in
market development. Mainly medium and small companies, they do not have huge
funds to operate effectively.
• Although there exists rich natural and human resources, the four countries are in the
primary stage of industrialization, the climate for investment and development,
including market scale, is limited, and infrastructure is inadequate (i.e., poor roads,
power, telecom, and water supply). These can raise the cost of the project.
According to the Handbook of Country Risk issued by the China Export and Credit
Insurance Corporation in 2005, indicators show that Vietnam, Laos, and Myanmar
still pose a higher country risk for investors.
• China also lacks in-depth research and rich information of development in CLMV
markets.

181
“Going global” is a major national strategy of the Chinese government. In fact,
China's nonfinancial outward investment totaled US$17.6 billion in 2006, a
year-on-year increase of 43.8 percent. In the Chinese central government's blueprint,
China's overseas investment will hit US$60 billion within the 11th five-year plan
period.
China already stands as the world’s fourth largest economy and has a sizable
foreign exchange reserve. Its urban and rural residents’ savings is over RMB 1.4 trillion.
Meanwhile, statistics from the Ministry of Commerce of the People’s Republic of China
(MOFCOM) shows that of the 600 major domestic commodities, 446 have supply
exceeding demand. Excessive production exists in hardware, textiles, and electrical
household appliances. In addition, avoiding trade barriers is also a factor that motivates
the government to exert every effort to promote outward investment.
China now has outward investment capacity in various sectors such as light
industry, machinery, textile, and electronics. More important, its outward investment in
the resources sector is of long-term strategic significance. Enterprises in China’s coastal
areas currently face rising costs in labor and raw materials. The CLMV is a good choice
for shifting its manufacturing base and expansion. The Chinese government will
seriously consider creating a more favorable condition for its “going abroad” strategy by
arranging for investment liberalization and facilitation in the Free Trade Area. Because
there are characteristic differences across countries and regions, any practical move
toward liberalization and facilitation, including liberalizing sectors and the “negative
list”, will be made and revised flexibly, taking into consideration such differences per
country.
From other countries’ perspective, the potential inflow of Chinese investments is
promising due to the Chinese government’s intent to go global, with priority given to its
neighbors. In the future, Chinese enterprises will be encouraged to engage in
agricultural and forestry resource development, and prospecting and exploitation of
minerals.

182
1.2.3 Policy trends
• For the Chinese government to be able to encourage and help its local enterprises to
invest abroad, it has to establish overseas economic cooperation zones. Haier
Group, one of China's leading home appliance makers, set up the first economic
and trade cooperation zone in Pakistan in November 2006. Similar zones will be
established in ASEAN countries, including CLMV, in the coming years with the
Chinese government adopting some preferential policies concerning financing,
insurance, taxation, entry-exit as well as some nonoperational risks.
• Corporate social responsibility will be highlighted. To gain the local society’s wide
acceptance and achieve sustained and long-term development, the government
will urge local enterprises to improve their sense of social responsibility and
temper their focus on seeking maximum short-term profit. This includes actively
facilitating localization, providing more benefits to local employment, and
participating in local environment protection and poverty relief activities.
• China MOFCOM will provide guidance on foreign investment in industries in
different countries and promote investment facilitation.
• There is a need for systematic arrangements for bilateral economic cooperation---i.e.,
define the sector, project, financing, and cooperative mechanisms through
framework agreements between governments.
1.3 Aid and other cooperation
1.3.1 Features of China’s aids to CLMV
China’s outward aid has three major types:
• Grant aid, mainly for small and medium social welfare projects such as hospitals,
schools, low-cost housing, and water supply. Also includes humanitarian aid and
personnel training.
• Interest-free loan, mainly for infrastructure and civil facilitation.

183
• Preferential loan, a kind of mid- and long-term low-interest loan provided by
financial institutions designated by the Chinese government.
The gap between preferential interest rates and prime rates will be subsidized by
the Chinese government. Preferential loans are mainly provided for joint venture
projects between the recipient countries and China, productive projects, or plant and
electromechanical equipment made in China. The annual interest rate of China’s
preferential loan is about 2 percent, with a maturity period of 20 years. Grant element is
40 percent, as compared with 72.3 percent of Japan and over 60 percent of World Bank.
The Ministry of Commerce is in charge of bilateral economic aid, which accounts
for 80 percent of China’s aid. Multilateral aids and aids in other sectors are managed by
the Ministry of Finance, Ministry of Health, Ministry of Agricultural, Ministry of
Education, etc. However, the lack of a unified administrative system led to a lack of
authoritative and complete statistics on China’s foreign aid.
Over the past 50 years, the Chinese government has provided, as far as its capacity
allows, all types of assistance to CLMV, covering areas such as industry, agriculture,
education, healthcare, transport, broadcasting and communications, hydropower and
electricity, and infrastructure. At the same time, it has provided technical assistance and
trained a large number of technical and administrative personnel.
China’s aid to CLMV countries underwent three stages. The first stage began from
1950 to the early of 1980s, the period when China’s foreign policy was focusing on
building a coalition with developing countries. According to published data, China’s aid
to Vietnam alone was US$20 billion (according to the world commodity price) until
1978. The second stage of China’s aid is from the 1980s to the mid-1990s. During this
period, the policy focus was to develop small- and medium-sized projects to meet local
needs. The third stage started from 1995 until the present. The policy focus now is to
combine aid with bilateral economic cooperation. In November 2006, the Chinese
government announced to write off all government interest-free loans (that matured by

184
the end of 2005) given to least developed countries.
Unlike China’s initial aid to CLMV in 1950-1960s, which aimed to support the
socialist governments, the focus is now on commerce. China has offered a new model
that centers on straight commercial relations and fair market prices without the
ideological agenda. In the long term, China hopes that the overture will not only give
Chinese companies an edge in the competition for local business, but will also tighten
the political relations with those recipient countries. The positive effect of China’s aid
may be summarized as follows:
• Set up a good image in the world
• Help those countries in self-capacity building
• Win the friendship and trust of these countries
• Foster diversified economic cooperation with these countries. Of China’s 50 largest
foreign economic companies, two-thirds grew from enterprises that engaged in
providing foreign aid. In general, China’s aid projects also help to accelerate
contract engineering since such is easier to be approved by the local government
and people.
The economic and technical cooperation between China and Myanmar began in
1961. China supplied 22 complete plants (e.g., sugar factory, textile mill, stadium,
theater, and thermal power plant) as well as technical aid to Myanmar. In February 2006,
when Myanmar’s prime minister visited China, the Chinese government agreed to
provide a US$8.7 million aid and US$200 million worth of loans to Myanmar.
In 1993-2005, China’s economic and technical aid (gratis, interest-free loans,
low-interest loans) to Cambodia totaled RMB 2 billion. China provided training to 294
of Cambodia’s government officials and technicians and dispatched 35 experts to
Cambodia for technical guidance. In more recent years, China has increased its aid to
Cambodia. Specifically, the figures were RMB122 million in 2000, RMB 87 million in

185
2001, RMB 125 million in 2002, RMB 251 million in 2003, and RMB 252 million in
2004.
Meanwhile, from 1989-2000, China’s annual economic aid to Laos accounted for 2
percent of the total aid Laos received from overseas. Two years after Chinese president
Jiang Zemin’s visit in 2000, Laos received RMB 160 million gratis, RMB 80 million of
free-interest loan and RMB 300 million of preferential loans, which is equivalent to the
total aid Laos received from China in the past 10 years. Lao’s Vang Vieng Cement
Factory and National Cultural Centre which set up with Chinese aids received favorable
feedback from local residents.
In 2001, during the Secretary of the Communist Party of Vietnam Nong Duc
Manh’s visit to China, China and Vietnam signed an economic and technical agreement,
wherein China would provide RMB 30 million grant aid and US$40.5 million
preferential loan to Vietnam. In 2002, during Chinese President Jiang Zemin’s visit to
Vietnam, another agreement was signed. This time, the agreement indicated that China
would extend a RMB 50 million aid and RMB 50 million preferential loan to Vietnam.
In 2003, during Nong Duc Manh’s return to China, China decided to exempt Vietnam’s
RMB 420-million debt and to provide an grant aid for the Sino-Vietnam Friendship and
Culture Centre. In 2005, during Chinese president Hu Jintao’s visit to Vietnam, China
provided a RMB 60 million grant aid and RMB 550 million preferential loan to
Vietnam.
Table 9: China’s Major Aiding Projects to CLMV Since 2003.
Country Project Scale Cambodia Highway(Kratie-Cambodia-Laos Border) 186km Laos Na Teuy-Pak Mun highway 166.5km Myanmar International Conference Centre 30000m2 Cambodia Government office building 33970m2 Source: China MOFCOM

186
China’s aid policy and aid programs have the following features:
• The western approach of imposing its values and political system on other countries
is not acceptable to China. The principles of friendship, cooperation and
development underscore China’s pledge not to discriminate or intervene. The
outbound aid from developed countries follows the rules made by the Organisation
for Economic Cooperation and Development (OECD), which takes into
consideration the political condition and economic base of the recipient country.
There are some poor countries in desperate need of assistance but fail to get this
assistance because of the turbulent situation at home. However, China is not bound
by OECD’s rules.
• The aiding projects are determined through bilateral consultation, basically civil
facilities that can truly benefit the people of the recipient country. China’s aid to
CLMV has heavily focused on construction of infrastructure. Taking into
consideration the larger agricultural sector in these countries, China’s aid also
emphasizes agricultural technical training. Its ASEAN Agricultural Technical
Training programs are extended to these four countries.
• Apart from goods and currency, China also sends medical and rescue teams to these
countries.
• China’s economic and technical aid to CLMV is not a unilateral donation. Instead,
China aims to deepen the friendship and to achieve common growth.
1.3.2 Concerns around China’s foreign aid
The cornerstone of China’s foreign policy is the respect on the choice of political
system and development path suited to other country’s own national/specified
conditions. This has been reflected in China’s foreign aid policy. Two concerns arise
regarding China’s foreign aid, though. The first is with regards China’s aid as a having a
mercantilist pattern: that is, the aid helps extract raw materials for its industries and then

187
sell manufactured goods back to these least developed countries while failing to bring
sustained growth to the recipient nation’s local economy. The second concern is that
China’s unrestricted lending will undermine years of efforts to arrange conditional debt
relief. That is, China does not follow the international lending standards intended to
fight corruption in the region.
The fact remains that China’s outbound aid shares many common interests with
developed countries. Most of China’s aiding projects are focused on public health,
education, agricultural, and infrastructure. The bottomline of the Chinese government’s
action is to show solicitude for local people’s livelihood, meet the needs of the public
and provide what is practical for the people. China also hopes that the recipient
countries can improve their public governance and reduce corruption. Whether a
recipient country has a clean and honest government or whether this is a democratic
government, an efficient infrastructure is a great concern of the recipient’s citizens.
Aid programs generally carry a donor country’s major policy goals and
understanding of national interest. Building a harmonious world has become China’s
foreign policy. Its government believes that for any impoverished population, the top
priority is to ensure its development.
China is the world’s largest developing country with a huge population, by the
World Bank’s criteria. Nearly 200 million Chinese are still living on less than US$1 per
day. There are some 60 million disabled people in need of care in China. Despite a
generally sound economic development, some deep-rooted problems such as its
economic structure, extensive economic growth model, deficient mechanisms, and
unbalanced regional development, remain unresolved. Both its economic and social
development aspects still encounter difficulties and challenges: e.g., a less-developed
foundation, a large gap between urban and rural development and among different
regions. Per-capita GDP still ranks 100th in the world. Changing its under-developed
productivity will be a long and arduous task. Therefore, the real challenges facing China
are its financial constraints as well as expectation from CLMV countries.

188
2. PROGRESS OF ECONOMIC INTEGRATION
2.1 Early Harvest Plan (EHP) and ASEAN-China FTA
2.1.1 Analysis of trade interest under Early Harvest Plan
The most important policy China made that had significant impact on CLMV since its
accession to the World Trade Organization (WTO) may be the signing of the free trade
agreement (FTA) with ASEAN. The framework agreement and other subsequent related
agreements are now under implementation. In the agreements, China made great
concessions to the demand of ASEAN to open the agricultural market, especially in the
Early Harvest Plan (EHP). Such made it possible for CLMV to export more products to
China.
The EHP under the FTA, a special arrangement based on the requirements of
ASEAN, commenced in January 2004. It can be regarded as a prelude to the overall
tariff reduction on July 1, 2005. The EHP covered about 600 agricultural products that
the ASEAN had most of the advantages. All 600 products in the EHP were divided into
three categories:
• Category 1: Most-favored nation (MFN) tariff rates higher than 15 percent for China
and ASEAN 6; 30 percent or higher for CLMV.
• Category 2: MFN tariff rates between 5 percent and 15 percent (exclusive) for China
and ASEAN 6; between 15 percent (inclusive) and 30 percent (exclusive) for
CLMV.
• Category 3: MFN tariff rates lower than 5 percent for China and ASEAN 6; lower
than 15 percent for CLMV. China and ASEAN 6 will eliminate the tariff on about
600 tariff lines over three years: to 10 percent before 2004; to 5 percent before
2005; and to zero tariffs not later than January 1, 2006. The CLMV should
eliminate their tariff on the products not later than 2010.

189
Although China enjoys a surplus in its total trade, its trade in agricultural products
shows deficits over the years. So, agricultural products are considered among China’s
products with “comparative disadvantage”. China’s agricultural deficits are mainly from
Indonesia, Malaysia, and Thailand. Therefore, tariff reduction and elimination in
agricultural sector needs China’s real attention. According to statistics from China’s
MOFCOM, by September 2007, China’s imports of over 600 agricultural products
under EHP grew by 500 percent.
In 2003, the average tariff for agricultural products was 16.8 percent for China,
21.9 percent for Vietnam, 20.7 percent for Cambodia, 18.7 percent for Laos, and 8.3
percent for Myanmar. According to the EHP, the MFN tariff rates above 30 percent are
scheduled to be reduced to 20 percent by January 2004, and to 5 percent annually until
it reaches zero. Meanwhile, the MFN tariff rates of 15-30 percent from Vietnam are
scheduled to be reduced to 10 percent by January 2004, 5 percent by January 2006, and
zero by January 2008. That of Cambodia, Laos and Myanmar should be 10 percent by
2006 and 5 percent by 2008.
For existing MFN tariff rates below 15 percent, Vietnam’s are scheduled to be cut
down to 5 percent by January 2004, and to zero by 2006. Similarly, that of the three
other countries will be brought down to 5 percent by January 2006 and zero by 2008.
Table 10: Effects of ASEAN 10 by China’s Export and Import of EHP Products. Increased greatly Increased less
greatly Not or slightly Affected
Decreased
China’s Export (46.49%)
Indonesia (13.14%) Thailand (13.09%) Malaysia (13.05%)
Vietnam (4.05%) Philippines (2.24%) Singapore (1.31%)
Brunei (0.04%) Cambodia (0.04%) Laos (0.02%)
Myanmar (-0.49%)
China’s Import (66.74%)
Thailand (54.92%) Indonesia (8.33%) Vietnam (1.83%) Philippines (1.68%) Malaysia (1.66%)
Brunei (0) Laos (0) Cambodia (-0.03%)
Myanmar (-0.58%) Singapore (-1.08%)
Source: Yuan Bo, CAITEC

190
Apart from providing a five-year transition period, China initiated a special
preferential tariff program to CLM under the EHP. From January 1, 2004, a zero tariff
was applied to CLM’s 707 products (335 for Cambodia, 239 for Laos and 133 for
Myanmar), mainly agricultural products and a few industrial manufactures. Later, China
further confirmed that a zero tariff will be applied to 261 CLM products (83 for
Cambodia, 91 for Laos and 87 for Myanmar) from January 1, 2006. The bottomline is to
improve the bilateral trade position and to import more agricultural products from those
less developed neighboring countries, ultimately to support their development. On the
other hand, the Chinese government is confident it can control the negative influence or
the possible risks arising from the special preferential tariff because China’s imports
from CLM is fairly small (about US$2.8 billion in 2006) and the major imports from
Cambodia and Myanmar is timber while those from Laos, although involving some
agricultural products, are of small volume as well. In sum, the impact on China’s similar
products will be limited.
In the case of China Yunnan Province after the implementation of the preferential
tariff policy, imports from Myanmar increased by a small margin, imports from Laos are
tending downwards, while no imports came from Cambodia. According to China’s
Customs department, RMB 18.4 million and RMB 3.2 million worth of tariffs on
imports from Myanmar and Laos, respectively, were exempted in 2004.
Table 11: Changes in China’s Major Agricultural Imports from Vietnam, 2002-2006. % Change HS Description 06/05- 05/04 04/03 03/02 Vietnam -2.5 2.9 70.4 30.5 07 Vegetables 138.1 1.2 22.3 114.4 08 Edible Fruit And Nuts 59 80.8 -53.6 -0.1 11 Milling; Malt; Starch 110.9 -7.1 50.1 110.6 03 Fish And Seafood -24.2 68.5 28.9 0.7 09 Spices, Coffee And Tea 149.1 -4.7 -3.9 65.0
Source: China customs

191
Table 12: Changes in China’s Major Agricultural Imports from Laos, 2002-2006. HS Description 06/05 05/04 04/03 03/02 10 Cereals 567.3 292.5 679.0 -75.1 12 Misc Grain, Seed, Fruit 76.6 3.4 -7.1 -5.6 13 Lac;Vegetable Sap, Extrct 366.5 0 0 0 09 Spices, Coffee And Tea 0 -100 -43.8 55.7 06 Live Trees And Plants -49.3 471.3 0 0 01 Live Animals 0 0 0 -100 02 Meat 0 0 0 -100 04 Dairy, Eggs, Honey, Etc 0 0 0 0 07 Vegetables 0 0 0 0 08 Edible Fruit And Nuts 0 -100 0 -100
Source: China customs
• The CLMV will possibly become a main source of China’s grain imports. The
CLMV has a stronger comparative advantage in land-intensive agricultural
products. According to the forecast made by China State Development Research
Center, China’s net imports of grain will reach 9.76 million ton in 2010 and 22.24
million ton in 2020. Vietnam is the world’s major rice exporter; and Myanmar,
Laos and Cambodia all have favorable conditions for agricultural development.
The potential, therefore, is promising.
• Technical cooperation in the field of agriculture should be strengthened.
Mechanization of agriculture in CLMV is still low, whereas China has a certain
advantage in agricultural machinery, fertilizer, pesticide, seeds, packing, and
preserving skills, which can help CLMV to improve their agriculture output and
market share.
• The preferential tariff treatment can only be effective when the recipient country has
the appropriate trading ability.
2.1.2 Assist CLMV to effectively participate in and benefit from the ASEAN-China FTA
The ASEAN-China substantive cooperation was further enhanced in 2001 when the
leaders of ASEAN and China endorsed a proposed framework on economic cooperation

192
and an FTA for 10 years as well as identified five priority areas to move cooperation.
This was in the areas of agriculture, information technology, human resource
development, mutual investments, and Mekong cooperation.
The framework agreement designed the timetable of tariff reduction or elimination.
This time, the measures “for promotion and facilitation of trade in goods and services,
and investment” are listed as (1) standards and conformity assessment; (2) technical
barriers to trade/nontariff measures; and (3) customs cooperation. Other measures
mentioned in the framework agreement are: “increasing the competitiveness of SMEs;
promotion of electronic commerce; capacity building; and technology transfer.”
(Framework Agreement, Article 7.3)
According to the feasibility study report of 2001, the ASEAN-China Free Trade
Area (ACFTA) can increase ASEAN’s export to China by 48 percent and China’s
exports to ASEAN by 55.1 percent. The ACFTA can increase ASEAN’s GDP by 0.9
percent (US$5.4 billion) while China’s real GDP can expand by 0.3 percent (US$2.2
billion).
The ASEAN-China FTA is a regional agreement. It includes more contexts than
pure “trade”. In fact, the mechanism will be conducive to improving the geo-political
climate, cracking down cross-border crime, protecting the environment, and stopping
drug smuggling. The cooperation will be also conducive for the two sides to gain more
support in international affairs and regional security.
All cooperation must recognize the different stages of economic development
among member states and the need for flexibility. In particular, it must recognize the
need to facilitate the increasing participation of CLMV in the ASEAN-China economic
cooperation and the expansion of their exports by strengthening their domestic capacity,
efficiency, and competitiveness. Otherwise, fully economic liberalization means that
these less developed economies close all their enterprises.
China is a strategic friend for CLMV. The latter looks to China for development
support and cooperation, as it does its fellow members in ASEAN. The CLMV is

193
seeking to find a place in the ASEAN-China FTA, both on their own and as members of
ASEAN.
To assure the success of the ASEAN-China FTA in the future, one needs to stress
the following:
• Adopt more effective measures to support the economic development in CLMV and
to break through the bottlenecks that limit the bilateral economic plans.
• Strengthen mutual trust and regional recognition among the people. Such trust and recognition
will push the government to make concessions.
• Aim for “bridging the gap” as a long-term priority in ACFTA’s strategy. Desired projects should
focus on the urgent needs of CLMV to improve their national environment, and should be
conducted in a coordinated and effective manner so as to achieve and sustain long-term
positive impacts on economic growth.
• Make sure that adequate funding for the desired projects is guaranteed.
2.2 Greater Mekong Subregion (GMS) cooperation
2.2.1 Progress and future plan
The GMS program, proposed by the Asian Development Bank in 1992---much earlier
than the proposal of ACFTA---is a very important part in the cooperation among China,
Thailand and all CLMV countries that received China’s official assistance over the
years. The GMS is an important corridor linking China with Southeast Asia and South
Asia. The CLMV’s share in the total area of the Mekong basin is 66 percent, while
China Yunnan accounts for 16 percent. The development of GMS depends mostly on
the relationship between China and CLMV countries. Soon after the signing of
Agreement on Commercial Navigation on the Lancang (Mekong) River in 1999 with
Thailand and the CLMV, China invested US$5 million to dredge the upper Mekong
River.
In March 2004, China exchanged letters with Laos and Myanmar, agreeing to
provide aid to their power projects and to grant nearly US$300 million for the highway

194
project within Laos. China and Vietnam also agreed to set up closer working ties. China decided to explore ways to participate in the development of hydroelectric
resources in Laos, Myanmar, and Cambodia, and cooperate with Vietnam in the
feasibility research on the joint development of Vietnam's coal and natural gas. China
will actively exchange information with the relevant countries on economic
development and power systems, and help establish an information exchange platform
on power cooperation.
The GMS program is a choice of CLMV to build closer relations with China. On
the other hand, it is also a strategic choice made by the Chinese government to create an
opening for China’s mid-western areas. The program will integrate the trade, tourism,
transport, power, and information of China’s western area with CLMV, and possibly
shape a regional economic, financing, and logistic center. It will also attract the attention
and participation of China’s coastal areas, which in turn will provide the western area an
opportunity to upgrade its industries.
China is both a beneficiary and a contributor to the GMS program. It provided the
funds for the Kun-Bang Super Highway and local channel improvement in the upper
Mekong River. It conducted 500 person-time training for member-countries in the field
of agriculture, customs, and telecommunication. In 2004, China established a US$20
million special fund in ADB meant for human resource development and poverty relief
in Asian developing countries (in particular, the CLMV countries).
China has made the fastest progress in the area of trade and investment facilitation,
setting an example to member-countries. It created a core group handling trade and
investment activities. This group holds meetings every semester to review the
implementation of the framework action plan. Based on the reviews, China has made its
own action plan and implementation mechanism so as to ensure a stable and smooth
progress. This program warmed up China’s relations with CLMV, speeded up bilateral
economic cooperation, and helped China to regain its influence in the Indo-China
region.
In July 2005, China published the Country Report on China’s Participation in

195
GMS Cooperation, which defines her new plans for the GSM program, to wit:
1) Decide the east-line plan for the Trans-Asian Railway;
2) Improve the technical reliability of power trading by shifting power cooperation from
“End to Lan” to “Lan to Lan”;
3) Speed up the construction for the information superhighway;
4) Start cross-border prevention and control of animal disease;
5) Promote cooperation among GMS countries in environmental protection;
6) Further increase the inputs for training of human resources and lead the establishment
of “the Golden Triangle Tourist zone” and “Tengchong-Myitkyina Tourist Zone”;
7) Provide modern facilities in Kunming and other port cities for commodity fair and
trade talks; and
8) Push for a more stable cooperative mechanism at central government level on drug
abuse and illicit trafficking.
2.2.2 Major contradictions in the cooperation process
Contradiction between upstream and downstream countries. An upstream country is
in an advantageous position since the downstream countries have to passively accept the
negative effects arising from development of water resources. If there is no agreement
on joint management of water resources, disputes between upstream and downstream
countries are inevitable. China’s large-scale dam construction gave rise to great
concerns from downstream countries, who believe this will affect their eco-environment
and livelihood and pose a threat to people’s lives in terms of flood and earthquake.
However, Chinese scientists gave their own explanation, arguing that the bigger factor
affecting the water level is the change in macro environment such as the climate and
land utilization. In all these, China has taken relevant measures to protect the
eco-environment of downstream regions. For instance, the hydropower station in
Lancang River can control and adjust the water flows, which will ensure the safety of
the downstream countries’ production, livelihood and property.

196
Contradiction between government and NGO. Joint actions taken by inward and
outward nongovernmental organizations (NGOs) exert pressures on governments and
international organizations that support the Mekong river development, such as the
ADB and WB.
On the whole, infrastructure will still be the major focus in China’s future
cooperation in GMS, since railway and inland waterway development lag much behind
highway development. China will play an important role in the GMS cooperation since
it has the strongest in comprehensive economic plan and highest economic growth
among the GMS member-countries. From a long-term perspective, China should
establish its leading position in subregional cooperation.
2.3 China’s action
2.3.1 Policy and administration on border trade
In 1992, to push forward the barter trade (including border trade) with the former Soviet
Union and Eastern European countries, a package of policies were implemented, which
shifted China’s border trade into higher gear. However, the problems associated with
disordered markets and low-grade export products emerged simultaneously, which led
the government to rectify the order of border trading in 1994.
Land-growing products such as grain, vegetables and fruits, and textiles and
garments, and light industrial products are the mainstay of China’s border trade exports
to LMV, while the major imports are raw material products, which included timber, steel,
paper pulp, minerals, and nonferrous metals.
China’s border trade system is a combination of centralized and decentralized
administration. Local governments play a significant role in border trade administration,
but as part of China’s foreign trade, a unified administration is also imposed. In this
regard, the Ministry of Commerce and related departments of the State Council are
jointly held responsible for formulating policies and exercising macro administration on

197
border trade.
Border trade has now become a dominant force behind the economic growth of
China’s border areas and plays a substantial role in achieving China’s goal of “vitalizing
border areas, building a well-off society, benefiting the nation and bringing stability to
the country.” Currently, there exist two forms of border trade in China:
(1) Goods exchanged by border residents
Exchange of goods between border residents refers to the trade activity involving goods
that are below the government-designated market’s amount or quantity within 20
kilometers from the boundary line. The government imposes a ceiling on the value of
goods exchanged by border residents. This form of border trading caters to the
economic and daily conveniences of the people living on both sides, so that each makes
up one’s deficiency with the other’s surplus.
(2) Border trade in small amounts
Border trade in small amounts refers to the trade activity between the enterprises or
trading organizations along the borders of neighboring countries, and Chinese
enterprises that are granted operational rights to trade in small amounts in the
administrative areas of open border counties (banners) or towns along the boundary line.
Trade activities other than exchanging goods shall be brought into the common
administrator on border trade and subjected to its related policies.
In the early 1990s, the guiding ideology on border trade was “for each to make up
the other’s deficiency with one’s own surplus”. Its theoretical basis is the international
division of labor in world trade and the principle of geo-economics, which calls for
achieving complementary economic advantage for border regions, and enhancing
regional economic cooperation and interchange.
The principal legal basis for China’s border trade policies is the Law on the
Regional Autonomy for Ethnic Minorities of PRC, Foreign Trade Law of PRC. Article

198
42 of the Foreign Trade Law of PRC stipulates that “the State applies flexible measures,
provides favorable conditions and convenience to the trade between the towns on the
frontier and those towns of neighboring countries on frontier as well as trade among
border residents.”
According to the Circular of the State Council on Issues Covering Border Trade
promulgated in 1996, goods (those for daily consumption only) imported as exchanged
goods by border residents and valued at less than RMB 1,000 (later revised to RMB
3,000) per person per day shall be exempt from import tariffs and import linkage
value-added tax. In case the amount exceeds RMB 1,000, the excess amount shall be
taxed accordingly.
The registered capital of enterprises engaged in border trade of products in small
quantities should not be less than RMB 500,000, and proof of a fixed business site,
facilities, and funds are required. Furthermore, the enterprises should have a sound
organizational system and personnel qualified to carry out the border trading activities.
Except for commodities that call for tender and chemicals for both military and
civil use and as components of drugs, the quota and license system on exports up to the
set quantity shall be eliminated. Enterprises engaged in border exports shall enjoy the
export tax refunding policies that applied to ordinary trade, and go through the same
refunding process.
On the other hand, the import of commodities is subjected to state quota and
licensing system, or quantitative restrictions. The foreign trade and economic
administrative departments of border provinces and regions shall be responsible for
issuing import license.
2.3.2 China’s border trade with CLMV
China’s border trade with LMV is characterized by small-scale, limited varieties,
and flexible trading arrangements. The Renminbi is used in settling trade accounts.

199
Table 13: Time of Border Trade Resumption. 1985 Myanmar, Laos Yunnan Province 1992 Vietnam
Guangxi Zhuang Autonomous Region 1992 Vietnam Source: China MOFCOM
Table 14: Socioeconomic Development of Yunnan and Guangxi.
Unit 2000 2006 Population Yunnan Million
person 42.4 44.8
Guangxi Million person
47.5 46.9
GDP Yunnan CNY Billion 201.1 400.2 Guangxi CNY Billion 205.0 480.2 Annual GDP Growth Rate Yunnan % 7.5 11.9 Guangxi % 7.3 13.5 Growth Rate of Import and Export Value Yunnan % 9.2 31.4 Guangxi % 16.2 28.8 GDP per Capita Yunnan Yuan/person 4742 8961 Guangxi Yuang/person 4319 10240
Source: Commerce Yearbook of Yunnan and Guangxi, 2007
Table15: Imports and Exports of Border Trade in Yunnan Province (RMB 10,000).
Year Exports Imports 1990 72148 35726 1995 96882 93153 2000 230180 64738 2001 190454 95881 2002 191642 115790 2003 209574 137870 2004 257197 179353 2005 321188 224143
Source: Kunming Customs

200
Table 16: China’s Border Trade with Myanmar (US$100m). FY Total trade Border trade Share % 04/05 7.8055 3.5499 45.5% 05/06 8.3309 5.1744 62.1% 06/07(ending in Feb) 10.3168 8.1505 79.0%
Source: Ministry of Commerce, Myanmar.
2.3.3 Some noteworthy problems restricting the development of border trade
After over 10 years, border trade in “small” quantities no longer remains small and
encompasses areas beyond the border’s scope, tending in fact toward transit trade. There
are, however, some noteworthy problems that restrict the development of border trade:
• In border trade, many import and export commodities still have quantitative quotas,
and mobility of business people is still subjected to various formalities.
• China’s policy adjustment on its imports and exports poses a new challenge to
border trade growth. The reduction in export rebate tax somewhat cripples the
competitiveness of export commodities. Approval rights for import, inspection and
quarantine were taken back by the State General Administration. Customs,
forestry and technical quality supervisory entities had all tightened their control
over border trade. State limits on export of grain also tend to tighten. Border
personnel under the Ministry of Public Security are strict in their control over exit
and entry.
• Trade logistics in border areas are still underdeveloped. In recent years,
infrastructure of trading ports in these areas have improved, but because of limited
funds, these have fallen far behind the growth in port logistics, particularly storage,
freight yard, and parking sites. Currently, these ports can only satisfy the basic
customs requirements.
• Highways across borders are not in good condition.

201
3. CHINA’S DEVELOPMENT STRATEGY WITH CLMV
3.1 Policy of friendship and partnership with neighboring countries
3.1.1 China’s peaceful development
Chinese leaders have on various occasions aired their view of building “a coordinated
world” and sticking to peaceful development. The way toward a coordinated world
involves seeking for a common security through multilateralism, aiming for
development and common prosperity through mutually beneficial cooperation, and
working toward harmonious relations through mutual understanding.
After over 30 years since it opened its economy and initiated reforms, China has
accumulated certain political influence, diplomatic skills and economic strength.
Gaining a good impression and goodwill from the international community is the key to
China’s diplomatic affairs.
Peaceful development now has been adopted as a formal government strategy, a
clear blueprint to guide China’s future development in the next 20 years. Achieving
development is the overriding principle.
Peaceful development is also China’s contribution to the current international
system. This concept is China’s answer to the “China Threat” debate and the efforts of
other countries to define China’s evolving role in world affairs.
China’s influence in international economic affairs is increasing. As one of the
world's largest countries, China is ready to shoulder more responsibilities, pay greater
attention to underdeveloped regions and people in poverty, and play an active role in
promoting development, progress and harmony.
China has sent a clear message to the world that it will achieve its development
mainly through its own efforts, which will help assuage the international community’s
notion that China is bound to engage in external plundering and expansion when it
reaches a certain stage of its development. As China develops itself, it will contribution
more to both the development of neighborhood areas and the whole world.

202
China does not use ideology or social system as a criterion in conducting
diplomacy and economic cooperation, nor does it impose its values on others. This
means that China will treat all countries, whether big or small, rich or poor, as equals. It
also means that China will follow the principle of mutual benefit and mutual respect in
expanding overseas business ties.
As China's overall national strength and international standing grow, the
international community will have higher expectation from it. In the future, China will
take an active part in the formulation of international rules for a fair and equitable
international economic order, and in international and regional economic cooperation.
3.1.2 A favorable neighborhood is crucial to China’s peaceful development
China’s development involves striding toward the subcenter and center position of the
global system. In the course of doing so, China needs the understanding and support of
developing countries, particularly neighboring countries. The China-CLMV relations
have come a long way from the initial removal of doubts to commencement of dialogue,
to enhancement of mutual trust, and to establishment of strategic partnership.
In the political field, mutual trust is growing. China was the first ASEAN dialogue
partner to join the Treaty of Amity and Cooperation in Southeast Asia and to establish
strategic partnership for peace and prosperity with ASEAN. The two sides jointly issued
the Declaration on the Conduct of Parties in the South China Sea.
The policy of “pursuing good neighborly relations and partnership with neighbors”
and “fostering a harmonious, secure and prosperous neighborly environment” was first
put forward during the 16th National Congress of the Communist Party of China since
the party realized that China's development needs a peaceful international environment.
China is also aware that in the past there was a good deal of suspicion over its intention.
A harmonious neighborhood means to live in harmony with neighboring countries.
A secure neighborhood, meanwhile, means to solve differences through negotiation and
improve mutual trust. A prosperous neighborhood does not simply mean one who gives

203
money to neighbors. Rather, it means a better use of resources from both sides and an
ability to cooperate in adjusting each side’s economic structure so as to cope with the
challenges posed by economic globalization.
China’s good-neighbor policy during the initial founding of the new China was
determined by the pattern of world political affairs. The starting point was its own
security. In the 1950s, its security threat was mainly from the United States. Now, the
starting point of China’s good-neighbor policy since its reform is its development. Only
by winning over neighboring countries’ trust can China break the anti-China ring and
create a better international environment for its domestic development.
China’s good-neighbor relation, to some extent, is a kind of investment. It will
ultimately improve the nation’s outward investment climate. China’s participation in
the GMS cooperation is a good example: China contributed to the development of the
subregion, while at the same time, became a beneficiary of the subregion’s cooperation.
China’s riparian areas and sectors have all benefited from such cooperation.
China’s relations with her neighbors will give it more room for action in
international affairs. More trading and cooperative partners mean China will not be
controlled easily by world giants. Its success as a good neighbor will also benefit its
image to the world. Now, the real Chinese “threat” is economic, not military strength.
The world no longer worries about how China will feed itself but whether Chinese
products will hit domestic markets.
China’s relations with CLMV now have two features: close high-level contacts,
and brisk economic cooperation. The Chinese government thinks that as a good partner,
neighbor and friend of CLMV, it is obliged to lend a hand. China has experience in
helping small and developing countries. Its government knows exactly what these
countries need and can provide them with very practical skills and technology.
China is convinced that a united, stable, and prosperous neighborhood will make
greater contribution to the world as well as to its own development. On the 15th
anniversary of the China-ASEAN dialogue relations, China announced it will donate

204
US$1 million to the ASEAN Development Fund and provide funding assistance worth
US$1 million to relevant projects under the Initiative for ASEAN Integration. China
also offered to train 8,000 ASEAN professionals in different fields in the next five years
and invited 1,000 young people from ASEAN countries to visit China.
3.1.3 Outside factors affecting China’s long-term economic and trade relations with
CLMV
Peaceful development environment in CLMV. The CLMV’s economic development
lags behind in the region. A large percentage still lives in poverty, which is coupled
always with some form of turbulence. A peaceful development environment will depend
on whether the current governments can commit themselves to improving their people's
livelihood and safeguarding the rights of different ethnic groups. After all, any
insurgency can threaten border security and any proposed economic cooperation.
ASEAN’s diplomatic strategy. The ASEAN’s current strategy is to stand between
China, the United States and Japan, so as to balance their influences in the region. The
ASEAN does not want to fully depend on China, and is unwilling to be forced to make
a choice between big powers.
The ASEAN’s views on the China issue are divergent. Some raise doubts about
whether China’s investment conforms to ASEAN’s long-term interests. Some worry that
China might challenge ASEAN’s value system, and overdependence on China would
isolate the ASEAN and cut itself off from help if China one day changes its policy.
Although the ASEAN clearly defines the strategic partnership with China, its policy on
China remains unclear. In the coming 15 years, China’s position and influence on
ASEAN’s strategy, and the trend of China-ASEAN strategic partnership are issues that
still need to be discussed.
US factor. In the post-cold war era, the United States changed its role in Southeast Asia

205
from peace keeper to coordinator. Today, the United States is still playing an important
economic role in Southeast Asia. At the same time, it retains its military presence in the
ASEAN countries.
China and the United States have different attitudes toward the military
government of Myanmar. The United States appeals for more pressures on Myanmar’s
human rights record and urges Myanmar to release all political prisoners and move
toward democracy, and stop forced labor. It thinks economic sanctions are necessary to
punish Myanmar’s government and force the issue of democratic change. The US trade
sanction and embargo against Myanmar still stands. The US believes that China's
influence on Myanmar is second to none and could be decisive in restraining the
government from a violent confrontation with protesters.
Japan factor. The Indo-China Peninsula---where Laos, Cambodia, and Vietnam are
located---produces a great impact on Japan and is regarded as Japan’s sea lane. If Japan
wants to reinforce its major role in Asia, it has to establish contact with these countries.
The United States-Japan Joint Declaration on Security has extended its application to
the South China Sea. Japan is involved in the Indo-China Peninsula mainly by two
means: its Official Development Assistance and its leadership position in the Asia
Development Bank (ADB).
Contest for South China Sea. The territorial dispute in the South China Sea has been
an obstacle to the development of China-CLMV relations. China claims
sovereignty over the Nansha Island and its surrounding waters, but is open
to shelve disputes and carry out a joint development. The ASEAN worries that China’s
proposal of “shelving sovereignty” only means to put off the negotiations and wait until
it grows strong enough to settle through military might. This is a hidden problem that
can break out any time. It is unreasonable to think that the South China Sea issue will
not lead to a strained relation with surrounding nations. Therefore, how to avoid
206
conflicts as well as to promote trust, understanding, and cooperation is still a challenge.
4. POLICY IMPLICATIONS
• There is a need to conduct more trade and investment promotion activities, so as to
provide a platform for special products from these countries and an opportunity
for Chinese counterparts to know more about the investment climate and policies
in these countries.
• There is a certain difference among CLMV countries; therefore, a detailed
assistance plan should be made for each country. China should continue to develop
infrastructure that is in great demand in CLMV countries and provide assistance to
improve bilateral trade positions.
• To reinforce the trade in border regions, give priority to the export processing
industry and tourism, free administration on exit-entry, money flow, goods
transaction, integration in bonded areas, warehousing, exhibition, packaging,
processing, and tourism. Policies adopted in border regions should be more
preferential than that of the ASEAN-China FTA and Early Harvest Plan.
• Weaken the industrial competition between China and CLMV and set up a
development fund. The starting point is to provide more job opportunities in
CLMV countries. China should pay attention to the political and social problems
arising from the competition between China and CLMV, since market chances
provided by China will first benefit the big companies, not the public, particularly
the poor.
• In spite of material aid, China should help CLMV in systematic improvement.
• The GMS cooperation has brought a general concern: More and more international
organizations are getting involved in this cooperation, which leads to a
co-existence of multi-mechanisms, but lacks both supervising and dispute
settlement mechanisms.

207
• To avoid repetition in scheme and projects, there should be a clear, coordinated and
common target for assisting CLMV among China, Japan, and Korea.
• Consistent and regular studies on the impact of regional economic integration on
CLMV should be jointly carried out so as to ensure their initiative and adopt
effective policy measures, ultimately to help them coordinate with the global
economic system.
• China and CLMV should jointly draw up a development plan for bilateral industrial
cooperation, through which to guide and promote industrial integration and
upgrading, shape up industrial gradient shift system, and better solve the problem
regarding similarity in industrial structures among the nations as well as
competition.
REFERENCES
Bi Shihong. 2007. Japan’s ODA policy toward GMS. Southeast Asia. No.2.
Gu Xiaosong. 2007. Retrospect of Vietnam in 2006 and prospect in 2007. Around
Southeast Asia. No.2.
Li Chenyang. 2007. A Summary of Myanmar’s situation in 2006. Around Southeast
Asia. No.4.
Li Guanghui. 2007. China-Vietnam joint construction of “Two corridors and one ring”
and regional economic cooperation in East Asia. In China-Vietnam Two Corridors
and One Ring Cooperation and Yunnan’s Participation. Edited by He Shengda,
China Commerce and Trade Press.
Li Yushi. 2007. Framework of China’s foreign trade policy. Working paper of CAITEC.
Lu Bo. 2006. ASEAN-China free trade agreement: negotiation, implementation and
prospect. In ASEAN-China Economic Relations. Edited by Saw Swee-Hock.
ISEAS publishing.

208
Sheng Lijun. 2006. China’s economic relations with ASEAN: Development and
strategic implications. In ASEAN-China Economic Relations. Edited by Saw
Swee-Hock. ISEAS publishing.
Support to trade facilitation and capacity building in the GMS (Part I).Funded by the
ADB, Contract Number COCS 60-182, TA No. 6328-REG.
Wang Shilu. 2006. Interpretation of significance of GMS from perspective of
international relations. Contemporary Asia-Pacific Studies. No.12.
Xing Heping. 2007. Cambodia: review of 2006 and prospect of 2007. Around Southeast
Asia. No.4.
Ye Shuguang. 2006. Present state, obstacles and countermeasures for Chinese
enterprises to invest in the GMS. Around Southeast Asia.No.3.
Zhang Haibing. 2006. China’s aid to Southeast Asia. In ASEAN-China Economic
Relations. Edited by Saw Swee-Hock.
Zhang Xizhen. 2007. Progress of, obstacles and outlets to China’s participation in the
cooperation of the GMS. Southeast Asian Affairs. No.3, 2007.
Zhang Yunling. 2007. Building new relationships between China and its neighbors.
Contemporary Asia-Pacific Studies. No.1.
Framework Agreement on Comprehensive Economic Co-operation between ASEAN
and China.

209
Chapter 7
JAPAN’S POLICY AND STRATEGY OF ECONOMIC COOPERATION IN CLMV
Katsumi Uchida and Toshihiro Kudo
ABSTRACT Japan has undertaken three major initiatives for developing Cambodia, Lao People’s Democratic Republic or Lao PDR, Myanmar, and Vietnam (CLMV) since the 1990s: These initiatives were the Forum for Comprehensive Development of Indochina (FCDI) in 1995, the AEM-METI Economic and Industrial Cooperation Committee (AMEICC) established in 1998, and the New Concept of Mekong Region Development announced at the Japan-ASEAN Special Summit in December 2003. The New Concept of Mekong Region Development is a new attempt based on regionwide development. It was included in Japan’s Official Development Assistance (ODA) Charter revised in 2003. While Japan is a top donor to CLMV and Thailand, its regionwide development vision and strategy for these areas are not clear. In order to implement regionwide development efficiently and effectively, it is essential to pursue studies related to regional public goods provided by regionwide development. Despite the huge ODA provisions to CLMV, Japan’s trade and investment relations with these countries are still weak compared to its relations with the original six member-countries of the Association of Southeast Asian Nations (ASEAN). Another challenge for Japan is how to promote trade and investment with CLMV.
1. INTRODUCTION During the Cold War era, Japan extended ODA loans for the Prek Tnaot Multi-Purpose
Dam Construction Project in Cambodia in 1969, the Can Tho Thermal Power Plant
Construction Project in South Vietnam in 1972, and the Hydroelectric Power Project at

210
the Namgum Dam in Laos in 1974 and 1976. After that, however, Japanese assistance to
these three countries was mostly suspended because of the various armed conflicts
during the Cold War.
In contrast, Thailand received a huge amount of aid from the Western countries as
an ally of the western block. The provision of Japanese ODA loans to Thailand began in
1967 with the cumulative ODA to Thailand amounting to ¥1,066,142 as of the end of
March 1990 (Table 1). From the early years of the assistance, the emphasis was placed
on developing infrastructure, especially roads, electricity for rural areas, and irrigation
facilities. The main development objective was to narrow the gap between urban and
rural areas. Thailand effectively used Japanese ODA loans for the improvement of
economic infrastructure. As a result, its economy continuously developed and the influx
of foreign direct investment (FDI) accelerated beginning the second half of the 1980s.
With the economic development of Thailand, grant-based assistance to this country
ended in 1993, in principle.
Myanmar was the second largest recipient country of the Japan’s ODA in the
Indochina region. Myanmar ranked among the top five as one of the largest recipients of
Japan’s ODA in 1985 and 1986. As of the end of March 1988, the cumulative total of
ODA loan commitments to Myanmar since 1969 amounted to ¥402.972 million under
66 commitments. However, Myanmar’s economy declined due to the closed-door policy
of Burmese-style socialism. As a result of the economic collapse, Ne Win’s socialist
government ended in July 1988, and a military government was formed under much
political and economic confusion. Japan stopped extending ODA loans to Myanmar in
1988.

211
Table 1: Japan’s ODA to the Indochina region during the Cold War
Cambodia Laos Myanmar Vietnam Thailand
Yen loan 1,517 5,190 402,972 40,430 833,011
Grant aid 2,637 23,214 97,594 31,292 141,324
Technical 1,706 4,613 15,097 2,449 91,807
Total 5,860 33,017 515,663 74,171 1,066,142
Source: Ministry of Foreign Affairs (MOFA) of Japan.
In 1986, Vietnam and Laos introduced market economy policies known as Doi Moi
(Renovation) and Chin Tanakan Mai (New Thinking), respectively. On the other hand,
Cambodia signed the Paris Peace Agreement in 1991. With the end of the Cold War and
the political stabilization of the Indochina region, the Economic Cooperation in the
Greater Mekong Subregion (GMS) Program was created by the six countries sharing the
Mekong River; namely, Cambodia, Laos, Myanmar, Thailand, Vietnam, and the Yunnan
Province of the People’s Republic of China. This was done with the help of the Asian
Development Bank (ADB). The first GMS Ministerial Conference was held in
November 1992. The aim of the GMS Program is to accelerate economic integration by
stimulating the movement of people, goods, and capital, and to contribute to poverty
reduction by developing infrastructure and promoting industrial competitiveness. ADB
became the secretariat of, and the main coordinating body running, the GMS.
In this paper, the authors first examine Japan’s economic cooperation policy and
strategy for the development of CLMV, and then examine its trade and investment
relations with CLMV.
212
2. JAPAN’S INITIATIVE FOR THE DEVELOPMENT OF CLMV COUNTRIES
Table 2 shows Japan’s major initiatives for the development CLMV countries since the
1990s. There are three major initiatives: the Forum for Comprehensive Development of
Indochina (FCDI) held in 1995; the AEM-METI Economic and Industrial Cooperation
Committee (AMEICC) established in 1998; and the New Concept of the Mekong
Region Development announced at the Japan-ASEAN Special Summit in 2003.
2.1 Forum for the Comprehensive Development of Indochina (FCDI) and the collaboration with ADB-GMS Program
In January 1993 during his tour of the ASEAN nations, Japanese Prime Minister Kiichi
Miyazawa proposed the Forum for the Comprehensive Development of Indochina
(FCDI) as a venue for a debate and exchange of views on the balanced development of
Indochina.. The Ministerial Meeting of FCDI was held in Tokyo in February 1995.
Chaired by Japan, 25 nations, including Vietnam, Cambodia, Laos, the six ASEAN
member countries, and eight international organizations, such as the European
Committee (EC), assembled at the meeting.

21
3
Japa
n's
Initi
ativ
eIn
tern
atio
nal o
rgan
izat
ions
and
AS
EA
N's
Initi
ativ
e19
92E
cono
mic
Coo
pera
tion
in th
e G
reat
er M
ekon
g S
ub-R
egio
n (G
MS
) Pro
gram
was
cre
ated
by
AD
B19
93Fo
rum
for C
ompr
ehen
sive
Dev
elop
men
t of I
ndoc
hina
was
pro
pose
d by
Jap
an19
94W
orki
ng G
roup
on
Indu
stria
l Coo
pera
tion
for C
LM w
as fo
rmed
bet
wee
n Ja
pan
and
AS
EA
N a
nd In
doch
ina
natio
nsJa
pan
host
ed th
e M
inis
teria
l Mee
ting
of th
e Fo
rum
for C
ompr
ehen
sive
Mek
ong
Riv
er C
omm
issi
on w
as re
inog
urat
ed (A
pril)
Dev
elop
men
t of I
ndoc
hina
in T
okyo
(Feb
.)V
ietn
am jo
ined
in A
SE
AN
(Jul
y)19
96Ta
sk F
orce
for S
trate
gies
for D
evel
opm
ent o
f the
Gre
at M
ekon
g A
rea
was
form
ed b
y pr
ivat
e se
ctor
spe
cial
ists
Min
iste
rial M
eetin
g on
AS
EA
N-M
ekon
g B
asin
Dev
elop
men
t Coo
pera
tion
(AM
BD
C)
was
form
ed b
y A
SE
AN
Japa
n-A
SE
AN
Sou
th-S
outh
Coo
pera
tion
Pro
gram
sta
rted
Mek
ong
Pro
ject
Dev
elop
men
t Fac
ility
(MP
DF)
was
cre
ated
by
IFC
(M
arch
)Ja
pan-
AS
EA
N P
rogr
am fo
r Com
preh
ensi
ve H
uman
Res
ourc
es D
evel
opm
ent
Laos
and
Mya
nmar
jjoi
ned
in A
SE
AN
(Jul
y)Ja
pan-
AS
EA
N S
olid
arity
Fun
d (J
AS
F) w
as e
stbl
ishe
dA
EM
-ME
TI E
cono
mic
and
Indu
stria
l Coo
pera
tion
Com
mitt
ee (A
ME
ICC
) was
esta
blis
hed
1999
Japa
n su
ponc
ered
UN
ES
CA
P's
Sym
posi
um o
n th
e C
ompr
ehen
sive
Dev
elop
men
t of t
he G
reat
er M
ekon
g S
ubre
gion
Cam
bodi
a jo
ined
in A
SE
AN
(Apr
il)
Japa
n-AS
EAN
Gen
eral
Exc
hang
e Fu
nd (
JAG
EF)w
as e
stbl
ishe
d (J
uly)
GM
S-B
usin
ess
Foru
m (G
MS
-BF)
was
est
ablis
hed
by th
e A
DB
and
UN
ES
CA
PAM
EIC
C's
Wes
t Eas
t Dev
elop
men
t Cor
ridor
WG
was
form
ed (O
ct.)
Initi
ativ
e fo
r AS
EA
N In
tegr
atio
n (IA
I) la
unch
ed (N
ov.)
Ha
Noi
Dec
lara
tion
on N
arro
win
g D
evel
opm
ent G
ap fo
r clo
ser A
SE
AN
Inte
grat
ion
was
ado
pted
by
AS
EA
N(J
uly)
AS
EA
N in
tegr
atio
n S
yste
m o
f Pre
fere
nces
(AIS
P) S
chee
m e
ndor
sed
(Sep
.)10
th G
MS
Min
iste
rial C
onfe
renc
e an
ounc
ed G
MS
10-
year
Stra
tegy
( N
ov.)
2002
JIC
A-AS
EAN
Reg
iona
l Coo
pera
tion
Mee
ting
(JAR
CO
M) w
as e
stab
lishe
dIA
I Wor
k P
lan
for N
arro
win
g th
e D
evel
opm
ent G
ap w
ithin
AS
EA
N (j
uly
2002
-Ju
ne 2
008)
was
app
rove
d by
AS
EA
N (N
ov.)
Rev
ised
Jap
an's
Offi
cial
Dev
elop
men
t Ass
ista
nce
Cha
rter w
as p
ublis
hed
(Aug
.)Ja
pan
com
mte
d to
fund
six
IAI I
nfra
stru
ctur
e pr
ojec
ts to
CLM
V (U
S$ 0
.5 m
il. )
thro
ugh
JAG
EF (O
ct.)
Japa
n an
noun
ced
New
Con
cept
of M
ekon
g R
egio
n D
evel
opm
ent w
ith U
S$ 1
.5bi
llion
s ec
onom
ic c
oope
ratio
n ov
er th
e co
min
g 3
year
s (D
ec.)
Inte
rgov
ernm
enta
l Agr
eem
ent c
once
rnin
g th
e A
sian
Hig
hway
Net
wor
k w
assi
gned
by
26 c
ount
ries
At t
he E
SC
AP
con
fere
nce
(Apr
il)C
LV D
evel
opm
ent T
riang
le w
as a
nnou
ned
(Nov
.)R
egio
nal C
oope
ratio
n S
trate
gy a
nd P
rogr
am (R
CS
P)(2
004-
2008
) w
asan
noun
ced
by G
MS
with
Dev
elop
men
t Mat
rix (D
ec.)
2005
Japa
n se
nt a
stu
dy m
issi
on to
the
CLV
Dev
elop
men
t Tria
ngle
(Mar
.)20
06 J
apan
-ASE
AN In
tegr
atio
n Fu
nd (J
AIF)
was
est
ablis
hed
(Mar
.)20
07Ja
pan
gran
ted
US$
52
mill
ion
to J
AIF.
US$
41
mill
ion
was
allo
cate
d fo
r as
sist
ance
to th
e de
velo
pmen
t of t
he M
ekon
g re
gion
(CLM
V) a
s w
ell a
s Ja
pan'
s ne
w in
itiat
ive
to e
xpan
d its
OD
A to
the
Mek
ong
regi
on fo
r the
nex
t thr
ee y
ears
(Jan
.)
Tabl
e 2
Japa
n’s
maj
or in
itiat
ive
to th
e de
velo
pmen
t CLM
V c
ount
ries
sinc
e 19
93
(Sou
rce)
MO
FA o
f Jap
an e
tc.
Ayey
awad
y-C
hao
Phra
ya-M
ekon
g Ec
onom
ic C
oope
ratio
n St
rate
gy (A
CM
ECS)
was
esta
blis
hed
unde
r Tha
iland
's In
itiat
ive
(Apr
il)
1995
1997
2004
1998
2000
Japa
n - A
DB
join
t mis
sion
was
dis
patc
hed
to M
ekon
g B
asin
cou
ntrie
s (J
uly)
2001
2003

214
The objectives were the: (1) development of the whole of Indochina from a
regional perspective; (2) international cooperation through voluntary coordination of
assistance based on information exchange among the participating nations and
organizations; and (3) promotion of market economies in the three countries.
At the meeting, an agreement was reached on the establishment of working groups
on infrastructure development and human resources development for the two priority
areas and the establishment of an advisory group on trade and investment. Japan was
chosen to chair the infrastructure development group with the collaboration of the ADB
while France chaired the human resources group with the collaboration of the United
Nations Development Plan (UNDP). Furthermore, Thailand was chosen to chair the
private-sector advisory group with the collaboration of the United Nations Economic
and Social Commission for Asia and the Pacific (ESCAP).
As follow-up to FCDI, a private-sector advisory group on trade and investment
convened in Bangkok in March 1996, a working group on infrastructure development in
Sydney in September 1996, and a working group on human resources development in
Bangkok in December 1996. Since then, however, the Ministerial Meeting of FCDI has
never reconvened.
It seems that Japan failed to take initiative for the Indochina region’s development
through FCDI. However, one of the main objectives of FCDI is coordination among
donors, and Japan has been particularly active in providing assistance to projects related
to the East-West Economic Corridor (EWEC) in accordance with the GMS framework
of ADB1. Japanese ODA loan projects include the construction of the Second Thai-Laos
Mekong Bridge, Route 9, and Highway 1 leading to Da Nang Deep-Sea Port. In 1 The GMS framework became important for Japan because the ASEAN adopted the framework as a master plan for the Mekong Region Development in 1996.
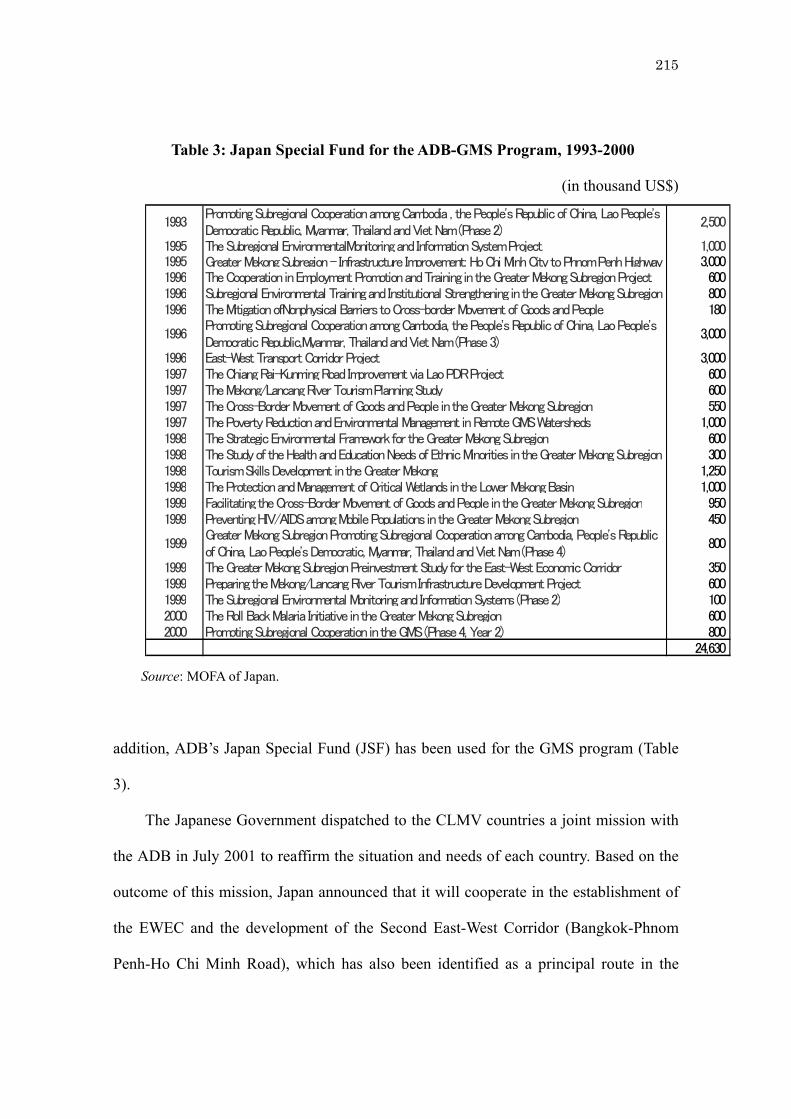
215
Table 3: Japan Special Fund for the ADB-GMS Program, 1993-2000
(in thousand US$)
1993Promoting Subregional Cooperation among Cambodia , the People's Republic of China, Lao People'sDemocratic Republic, Myanmar, Thailand and Viet Nam (Phase 2)
2,500
1995 The Subregional EnvironmentalMonitoring and Information System Project 1,0001995 Greater Mekong Subregion - Infrastructure Improvement: Ho Chi Minh City to Phnom Penh Highway 3,0001996 The Cooperation in Employment Promotion and Training in the Greater Mekong Subregion Project 6001996 Subregional Environmental Training and Institutional Strengthening in the Greater Mekong Subregion 8001996 The Mitigation ofNonphysical Barriers to Cross-border Movement of Goods and People 180
1996Promoting Subregional Cooperation among Cambodia, the People's Republic of China, Lao People'sDemocratic Republic,Myanmar, Thailand and Viet Nam (Phase 3)
3,000
1996 East-West Transport Corridor Project 3,0001997 The Chiang Rai-Kunming Road Improvement via Lao PDR Project 6001997 The Mekong/Lancang River Tourism Planning Study 6001997 The Cross-Border Movement of Goods and People in the Greater Mekong Subregion 5501997 The Poverty Reduction and Environmental Management in Remote GMS Watersheds 1,0001998 The Strategic Environmental Framework for the Greater Mekong Subregion 6001998 The Study of the Health and Education Needs of Ethnic Minorities in the Greater Mekong Subregion 3001998 Tourism Skills Development in the Greater Mekong 1,2501998 The Protection and Management of Critical Wetlands in the Lower Mekong Basin 1,0001999 Facilitating the Cross-Border Movement of Goods and People in the Greater Mekong Subregion 9501999 Preventing HIV/AIDS among Mobile Populations in the Greater Mekong Subregion 450
1999Greater Mekong Subregion Promoting Subregional Cooperation among Cambodia, People's Republicof China, Lao People's Democratic, Myanmar, Thailand and Viet Nam (Phase 4)
800
1999 The Greater Mekong Subregion Preinvestment Study for the East-West Economic Corridor 3501999 Preparing the Mekong/Lancang River Tourism Infrastructure Development Project 6001999 The Subregional Environmental Monitoring and Information Systems (Phase 2) 1002000 The Roll Back Malaria Initiative in the Greater Mekong Subregion 6002000 Promoting Subregional Cooperation in the GMS (Phase 4, Year 2) 800
24,630 Source: MOFA of Japan.
addition, ADB’s Japan Special Fund (JSF) has been used for the GMS program (Table
3).
The Japanese Government dispatched to the CLMV countries a joint mission with
the ADB in July 2001 to reaffirm the situation and needs of each country. Based on the
outcome of this mission, Japan announced that it will cooperate in the establishment of
the EWEC and the development of the Second East-West Corridor (Bangkok-Phnom
Penh-Ho Chi Minh Road), which has also been identified as a principal route in the

216
Asian Highway network.
2.2 Establishment of the AEM-METI Economic and Industrial Cooperation Committee (AMEICC) and Japan’s cooperation with the Initiative for ASEAN Integration (IAI)
The ASEAN was established by five countries in Southeast Asia in 1967. Brunei,
which became independent from the United Kingdom, joined the ASEAN in 1984.
Vietnam became a member in 1995; Laos and Myanmar, in 1997; and Cambodia, in
1999. It became essential for the ASEAN integration to narrow regional disparities
between the newly joined CLMV countries and the developed ASEAN countries.
One of main areas of cooperation between Japan and the ASEAN has been the
AEM-METI Economic and Industrial Cooperation Committee (AMEICC), which was
established under Japan’s initiative in 1998. AMEICC set up the working groups for
eight subsectors during the third meeting held in Chiang Mai in October 2000. Then the
working group on the West-East Corridor Development (WEC-WG) put forward the
West-East Corridor Comprehensive Industrial Development Program, with the aim of
establishing an industrial and distribution network in the West-East Corridor region
from 2004 to 2006. Its activities include entrepreneur support training programs
focusing on promising industries; programs to improve the processing technologies of
companies in rural communities; and training to facilitate trade with CLMV countries
with special focus on improving international business capabilities. WEC-WG presented
the “Study for Special Economic Zone Development in CLMV Countries” at the third
CLMV-Japan Economic Ministers Consultation held in Manila in August 2007.
On the other hand, the ASEAN itself moved to formulate a framework of the
ASEAN Mekong Basin Development Cooperation (AMBDC) program in 1996. It

217
focused on traffic/transportation (including the construction of a railway linking
Singapore and Kunming in China), trade, and human resources development.
Furthermore, in November 2000, the Initiative for ASEAN Integration (IAI) was agreed
upon at the fourth unofficial ASEAN Summit in order to reduce gaps between old and
new ASEAN members and to improve regional competitiveness. Two years later, the
IAI Work Plan for Narrowing the Development Gap within the ASEAN (July 2002-June
2008) was approved at the ASEAN Summit Meeting in Cambodia in November 2002.
Four priority areas were selected: (1) development of infrastructure; (2) human
resources development; (3) information communication technology (ICT) and (4)
regional economic integration.
Japan established the Japan-ASEAN Solidarity Fund (ASEAN Foundation) in
1998 and the Japan-ASEAN General Exchange Fund (JAGEF) at the ASEAN Post
Ministerial Conference in July 2000. Japan is also providing funding support through
the ASEAN Foundation to three IAI HRD projects (jointly financed with Philippines)
and one ICT project (jointly financed with Thailand). Japan’s support for IAI projects
has been continuous. It announced at the Japan-ASEAN Special Summit in December
2003 that was funding six IAI infrastructure projects (total US$500,000) through
JAGEF. Japan’s Ministry of Health, Labor, and Welfare has agreed to fund a three-year
labor and employment project. In addition, Japan also provided the funding for the
Japan-ASEAN Collaboration Programme for Strengthening the Basis of Human
Resources Development in CLMV (2004-2007). After the Republic of Korea, Japan is
the second largest donor country involved in the IAI program.

218
2.3 Revision of the ODA Charter and the announcement of the New Concept of Mekong Region Development
Japan revised the ODA Charter in 1992 and published a new ODA Charter in August
2003. One of basic policies of the charter is partnership and collaboration with the
international community. It mentions the following:
“Japan will actively promote South-South cooperation in partnership with more
advanced developing countries in Asia and other regions. Japan will also strengthen
collaboration with regional cooperation frameworks, and will support region-wide
cooperation that encompasses several countries.”
As one of Priority Regions, it mentions the ASEAN as follows:
“In particular, the East Asian region which includes ASEAN is expanding and
deepening economic interdependency and has been making efforts to enhance its
regional competitiveness by maintaining economic growth and strengthening
integration in recent years. ODA will be utilized to forge stronger relations with this
region and to rectify disparities in the region, fully considering such factors as the
strengthening of economic partnership with East Asian countries.”
Japan announced the new initiative for the Mekong Region Development at the
Japan-ASEAN Special Summit in December 2003. The integrated approach of
economic cooperation and trade-investment facilitation is emphasized in the “New
Concept of Mekong Region Development," which stresses three visions: (1) reinforcing
regional integration; (2) attaining sustainable economic growth; and (3) harmonizing
with the environment (Figure 1). To enhance economic cooperation, Japan announced
that it would provide assistance of approximately US$1.5 billion over the next three
years for the development of the EWEC and the 2nd East-West Corridor of the GMS
Program as well as the improvement of infrastructure (e.g., transport, electricity and

219
ICT) in the CLV. These would be the priority issues for regional development (Table 4).
At the CLV and Japan Summit held in November 2004 in Laos, the Vientiane
Declaration on the Establishment of the Cambodia-Laos-Vietnam Development Triangle
was adopted in order to promote multifaceted relations, mutual understanding, and trust
among the CLV and to contribute to peace, stability, cooperation, and friendship. Japan
supported 16 projects (worth approximately ¥2 billion in total) mainly in the area of
basic human needs (BHN), including the above-mentioned US$1.5 billion funding for
the New Concept of Mekong Region Development (Table 5).
The New Concept of Mekong Region Development is an attempt at regionwide
development mentioned in Japan’s ODA Charter. It crosses national borders and targets
five countries and one area located in the Mekong river basin, namely, Cambodia, Laos,
Myanmar, Thailand, Vietnam, and China’s Yunnan Province. Promotion of the Mekong
regional development is expected to strengthen relations between the countries in the
region; create a more favorable environment for reducing the disparities within the
ASEAN by raising the economic levels of the new ASEAN members; and strengthen
ASEAN integration (Kazuo Sunaga:2004).

220
Figure 1: New Concept of Mekong Region Development

22
1
Tabl
e 4:
Maj
or p
roje
cts o
f Jap
an's
Initi
ativ
e fo
r th
e M
ekon
g R
egio
n D
evel
opm
ent (
2004
-200
6)
Countr
yPro
ject
Nam
eTyp
e o
f O
DA
Dat
e o
f E/N
Am
ount
O M
on T
herm
al P
ow
er
Pla
nt
Unit N
o.2
Const
ruction P
roje
ct
yen loan
31-M
ar-04
275.4
7H
anoi-
Hochim
inh R
ailw
ay L
ine B
ridge
s S
afety
Im
pro
vem
ent
Pro
ject
yen loan
31-M
ar-04
82.2
2V
ietn
amC
ai M
ep-
Thi V
ai Inte
rnat
ional
Port
Const
ruct
ion P
roje
ct
yen loan
31-M
ar-05
363.6
4Phan
Ri-
Phan
Thie
t Irriga
tion P
roje
ct
yen loan
29-M
ar-06
48.7
4Sm
all-
Scal
e P
ro P
oor
Infr
astr
uctu
re D
eve
lopm
ent
Pro
ject
(II)
yen loan
29-M
ar-06
147.8
8R
egi
onal
and P
rovi
siona
l H
osp
ital
Deve
lopm
ent
Pro
ject
yen loan
29-
Mar
-06
18.0
5Pro
ject
for
Impr
ove
ment
of
Saf
ety
Lab
ora
tory
for
Nat
ional
Inst
itute
of
Hyg
iene a
nd
Epi
dem
iogr
ant
aid
28-S
ep-
06
8.9
1C
ambodia
Gre
ater
Meko
ng
Tele
com
munic
atio
ns
Bac
kbone N
etw
ork
Pro
ject
yen loan
16-M
ar-05
30.2
9Sih
anoukv
ille P
ort
SEZ D
eve
lopm
ent
Pro
ject
yen loan
1-M
ar-06
3.1
8Pro
ject
of
the Im
prove
ment
of
the N
atio
nal
Road
No.1
in C
ambodia
gran
t ai
d12-Jun-06
47.4
6Pro
ject
for
Const
ruction
of
Prim
ary
Schools
gran
t ai
d18-Jun-04
4.2
5Pro
ject
for
Renova
tion
of
Technic
al S
chool fo
r M
edi
cal
Car
egr
ant
aid
11-A
ug-
04
7.7
4Lao
sG
reat
er
Meko
ng
Pow
er
Netw
ork
Deve
lopm
ent
Pro
ject
yen loan
7-M
ar-05
33.2
6Pro
ject
for
the im
prove
ment
of
the V
ientian
e N
o. 1 R
oad
gran
t ai
d27-Jul-
05
20.9
2Pro
ject
for
the V
ientian
e W
ater
Supp
ly D
eve
lopm
ent
gran
t ai
d10-Feb-
06
0.4
2Pro
ject
for
the Im
prove
ment
of
Dis
tric
t H
osp
ital
sgr
ant
aid
10-Feb
-06
1.5
0Pro
ject
for
the V
ientian
e W
ater
Supp
ly D
eve
lopm
ent
gran
t ai
d2-Jun
-06
28.7
5Pro
ject
for
the Im
prove
ment
of
Dis
tric
t H
osp
ital
sgr
ant
aid
21-A
ug-06
4.1
3Pro
ject
for
Impr
ove
men
t of
Mat
ern
al a
nd
Chi
ld H
eal
th C
are S
erv
ices
(Phas
e V
)gr
ant
aid
1-M
ar-04
6.6
2Pro
ject
for
Aff
ore
stat
ion in C
entr
al D
ry Z
one
gran
t ai
d9-Jul-
04
3.4
4M
yanm
arPro
ject
for
Aff
ore
stat
ion in C
entr
al D
ry Z
one
(Phas
e II)
gran
t ai
d27-Jun-05
2.9
3Pro
ject
for
Aff
ore
stat
ion in C
entr
al D
ry Z
one
(Phas
e III)
gr
ant
aid
17-A
ug-
06
3.3
0Pro
ject
for
Impr
ove
men
t of
Mat
ern
al a
nd
Chi
ld H
eal
th C
are S
erv
ices
(Phas
e V
I)gr
ant
aid
22-N
ov-
06
3.1
0R
egi
on W
ide
technic
al c
oopera
tion
with T
hai
land
1146.2
0Thai
land
Anim
al D
iseas
e C
ontr
ol in T
hai
land
and
neig
hbo
ring
count
ries
technic
al c
ooper
atio
nH
IV/A
IDS
Regi
onal
Coo
rdin
atio
n C
ente
r Pro
ject
technic
al c
ooper
atio
n
Sour
ce: M
OFA
, JB
IC

222
Table 5: Assistance for the CLV Development Triangle
Vietnam The Project for Constructing Dak Joong Irrigation SystemThe Project for Equipment Supply to Kon Tum Vocational Training SchoolThe Project for Constructing Tran Qui Cap Primary SchoolThe Project for Constructing Kim Dong Primary SchoolThe Project for Construction Le Dinh Chinh Junior High School in Ea Kenh CommuneSmall-Scale Pro Poor Infrastructure Development Project (II)(Vietnam)
Cambodia The Project for Well Construction in Ratanakiri ProvinceThe Project for Labang II Irrigation System Rehabilitation in Ratanakiri Province (Phase II)The Project for the Rural Electrification on Micro-Hydropower in Remote Province of Mondul Kir
Laos Supprting Community Initiative for Primary Education Development in Attapeu & SekongThe Project for Construction of Bridge between Kengkaxar Village and Nongfanyong Village
Source: MOFA of Japan.
At the 10th ASEAN-Japan Summit convened in Manila in January 2007, Prime
Minister Shinzo Abe announced the expansion of Japan’s ODA to the Mekong region
for the next three years and the granting of US$41 million to the Japan-ASEAN
Integration Fund (JAIF) established in March 2006 as assistance for the development of
the CLMV.
3. JAPAN’S ODA TO CLMV COUNTRIES AND THAILAND
3.1 Japan as Top Donor to CLMV Countries
Data from the Organisation for Economic Co-operation and Development (OECD)
show that Japan is a top donor to all CLMV countries and Thailand based on the
2004-2005 average of gross ODA. Japan’s share of each country’s gross ODA are
around one-fourth in each country of CLM, nearly 40 percent in Vietnam and over 80
percent in Thailand (Table 6). Multilateral aid agencies like the World Bank or the ADB
are usually the next largest donors. In Myanmar, however, UN aid agencies are the
major donors. Aside from Japan, Australia is listed as one of the top ten bilateral donors

223
to all CLMV countries and Thailand. Australia also supports the promotion of
regionwide cooperation in the Mekong region and provided funding for the first
Thai-Lao Friendship Bridge over the Mekong. This bridge, which was opened in 1994,
links the Thai province of Nong Khai and the Lao PDR capital of Vientiane. Australia
seems to have a very clear cooperation strategy with the CLMV countries.2
Table 6: Top Ten Donors of Gross ODA, 2004-05 average. (in million US$)
Japan 94 22.4% Japan 65 25.3% Japan 26 24.8% Japan 670 37.5% Japan 765 83.5%AsDF 84 20.0% AsDF 58 22.6% EC 14 13.3% IDA 418 23.4% Germany 31 3.4%US 60 14.3% IDA 42 16.3% UK 11 10.5% AsDF 207 11.6% France 27 2.9%IDA 43 10.2% France 21 8.2% Australia 11 10.5% France 116 6.5% EC 19 2.1%France 28 6.7% Sweden 19 7.4% UNDP 10 9.5% UK 82 4.6% GFATM 19 2.1%Australia 27 6.4% Germany 15 5.8% UNICEF 8 7.6% Germany 79 4.4% Denmark 17 1.9%Germany 24 5.7% Australia 12 4.7% Korea 7 6.7% Denmark 73 4.1% US 16 1.7%Korea 21 5.0% EC 10 3.9% Norway 6 5.7% Netherlan 55 3.1% Australia 8 0.9%UK 20 4.8% Luxembour 8 3.1% GFATM 6 5.7% Australia 50 2.8% Canada 7 0.8%Sweden 19 4.5% Korea 7 2.7% UNTA 6 5.7% EC 35 2.0% Norway 7 0.8%
420 100.0% 257 100.0% 105 100.0% 1785 100.0% 916 100.0%
ThailandCambodia Laos Myanmar Viet Nam
Source: Organisation for Economic Co-operation and Development (OECD).
Large-scale assistance from Japan to the Mekong region started in 1991.Vietnam
received total ¥1,209,778 million through Japan’s ODA between fiscal years (FY) 1991
and 2005. Thailand received ¥1,337,842 million in the same period. On the other hand,
Cambodia received ¥155,774 million; Laos, ¥130,687 million; and Myanmar, ¥97,193
million (Table 7). It is clear that Japan’s ODA to Vietnam is almost ten times bigger
compared to those extended to other CLM countries. The difference comes from the
received amount of ODA loans. Many large-scale projects in Thailand and Vietnam are
financed with yen loans. As for economic assistance to the “Mekong Region
2 Watanabe (2004) had a comparison analysis of the regional cooperation projects by JICA and AusAID. It was found that JICA’s approach had more limited impact compared with AusAID.

224
Development Projects,” the largest amount went to the airport sector, followed by road,
harbor, and bridge sectors.
3.2 Japan’s ODA by Country
Vietnam
Vietnam’s economy has rapidly expanded since the introduction of the Doi Moi policy
in 1986. Large-scale assistance through ODA loans began in 1992. Since 1995, Japan
has been the largest donor country to Vietnam.
The present medium-term strategy of Japan’s ODA loan to Vietnam has two pillars:
(1) sustained economic growth and increased international competitiveness built on
private sector development and (2) rectification of regional gaps, poverty reduction, and
improvement of the standard of living. Additionally, high priority is placed on policy
and institutional reform, environmental countermeasures, and human resource
development. Social development projects have the largest allocation in the technical
assistance program of the Japan International Cooperation Agency (JICA) to Vietnam.
Laos
Laos also adopted a reform and liberalization policy in 1986. Initial assistance involved
technical cooperation for the construction of Luang Prabang Hospital, feasibility studies
for the construction of the Vientiane Airport, and the rehabilitation of the Namgum Dam.
After this, assistance to Laos was extended mainly in the form of grant-based assistance
and technical cooperation. In JICA’s technical assistance program for Laos, human
resources development accounts for a uniquely large proportion of projects at roughly
20 percent, around the same percentage as social development and rural development.

225
Table 7: Japan’s ODA to CLMV countries (in million Japanese yen) Cambodia Laos Myanmar Vietnam Thailand yen loan 1959-1990 1,517 5,190 402,972 40,430 833,011 (E/N basis) 1991-2000 4,142 3,903 0 651,989 1,079,862 2001 0 4,011 0 74,314 6,405 2002 0 0 0 79,330 45,170 2003 0 0 0 79,330 44,852 2004 7,342 3,326 0 82,000 0 2005 318 0 0 90,820 35,453 2006 2,632 500 0 104,078 0 sub-total 15,951 16,930 402,972 1,202,291 2,044,753 grant aid 1959-1990 2,637 23,214 97,594 31,292 141,324 (E/N basis) 1991-2000 68,627 58,030 67,888 58,681 15,825 2001 7,645 7,003 5,993 8,371 315 2002 10,306 6,567 2,162 5,237 354 2003 6,250 4,111 992 5,650 431 2004 6,693 3,017 909 4,914 501 2005 6,909 4,235 1,717 4,465 236 2006 9,025 6,909 640 1,964 0 sub-total 118,092 113,086 177,895 120,574 158,986 technical 1959-1990 1,706 4,613 15,097 2,449 91,807 cooperation 1991-2000 16,769 20,121 6,674 33,111 83,285 (JICA only) 2001 4,306 4,486 3,319 7,909 6,925 2002 4,037 3,545 2,794 6,708 5,677 2003 3,755 2,983 1,658 5,577 4,296 2004 4,082 2,773 1,446 5,711 4,702 2005 4,593 2,576 1,641 5,661 3,553 2006 4,042 2,382 1,725 5,275 2,960 sub-total 43,290 43,479 34,354 72,401 203,205 1959-1990 5,860 33,017 515,663 74,171 1,066,142 1991-2006 171,473 140,478 99,558 1,321,095 1,340,802 Whole ODA
total 177,333 173,495 615,221 1,395,266 2,406,944
Source: MOFA of Japan
226
Japan has been the largest bilateral donor to Laos since 1991. Its cooperation is
focused mainly in the areas of human resources development, BHN, agriculture and
forestry, and industrial infrastructure. In recent years, assistance was provided to
promote private investment and trade as well as tourism development because Laos
aims to participate in the ASEAN Free Trade Area (AFTA) by 2008.
Cambodia
In 1991, after the conclusion of a peace agreement, Japan’s Self-Defense Force took
part in the United Nations’ peace-keeping operations in Cambodia from 1992 to 1993,
and its ODA resumed primarily in the form of grant-based assistance and technical
cooperation. Social development has the largest allocation in JICA’s technical assistance
to Cambodia.
In the infrastructure sector, restoration of national roads, Routes 6 and 7, and
rehabilitation of the Phnom Penh Port were implemented with grant-based assistance. In
response to the 3rd Consultative Group Meeting for Cambodia held in Tokyo in 1999,
Japan extended an ODA loan for the urgent rehabilitation project of Sihanoukville Port
at the request of the Cambodian Government. Japan has contributed greatly to the
realization of peace in Cambodia.
Assistance is also provided to Phnom Penh, the country’s capital, and
Shihanoukville as the growth corridor for infrastructure improvement and policy system
reforms. These reforms are expected to invigorate private economic activities in the
region and lay the foundations that should contribute to the sustained growth of the
tourism industry, a source of precious foreign currency income. Cambodia succeeded in
joining the World Trade Organization (WTO) in 2004, paving the way for its integration

227
in the international economy.
Myanmar
Japan suspended economic cooperation with Myanmar, in principle, following the
military coup d’etat in 1988. The only exception was grant aid for debt relief which was
based on a 1978 resolution of the Trade and Development Board (TDB) of the United
Nations Conference on Trade and Development (UNCTAD). Japan has been providing
debt-relief measures in the form of grant aid equal to the total amount of the principal
and interest on government loans prior to fiscal year 1987 with respect to repayments
from Myanmar (with the result that net payments are zero). In addition, when Aung San
Suu Kyi was released from house arrest in July 1995, the Japanese Government
reviewed its aid policy toward Myanmar and decided to reconsider and implement
suspended ongoing projects, including projects that would directly benefit the people of
Myanmar by addressing their basic human needs (BHN), on a case-by-case basis while
monitoring democratization and the improvement of human rights.
In the absence of progress toward democratization and human rights improvements,
however, Japan’s assistance to Myanmar is limited to small-scale, grassroots assistance
through nongovernmental organizations (NGOs). Development assistance extended to
Myanmar is the lowest among the GMS countries.
3.3 JICA’s South-South Cooperation and Thailand
JICA has supported South-South Cooperation with two schemes: the Third-Country
Training Program initiated in 1975 and the Third-Country Expert Program in 1995.
Among the ASEAN countries, there are already countries that no longer need ODA

228
based on the definition of the OECD-Development Assistance Committee
(OECD-DAC). These countries are Singapore and Brunei. There are also some
countries at a relatively advanced stage of economic development like Thailand and
Malaysia. Overall, the ASEAN member countries have accumulated a variety of
experience and knowledge on economic development. For this reason, agreements have
been made to actively advance South-South Cooperation.
Japan concluded its partnership programs with Singapore and Thailand in 1994.
The South-South Cooperation to CLMV with the latter as recipient countries was
implemented through these programs. CLMV, however, suggested that the support
provided failed to match their needs. JICA, therefore, introduced the JICA-ASEAN
Regional Cooperation Meeting (JARCOM) in 2002 to align donor countries’ resources
with recipient countries’ needs. JARCOM’s main aim is to form south-south
cooperation and regional cooperation projects to redress intraASEAN disparities.
Thailand used to be one of the assistance-receiving countries in the Mekong region,
but in recent years, it has also become a donor country extending assistance to other
countries in the basin through the Ayeyawady-Chao Phraya-Mekong Economic
Cooperation Strategy (ACMECS) established in 2003. In this manner, Japan cooperates
with Thailand as a fellow donor country through the South-South Cooperation scheme.
4. KEY CHALLENGES AND DIRECTION FOR REGIONWIDE COOPERATION
The New Concept of Mekong Region Development announced in 2003 is an attempt at
regionwide development mentioned in Japan’s ODA Charter. It crosses national borders
and targets five countries and one area located in the Mekong river basin; namely,

229
Cambodia, Laos, Myanmar, Thailand, Vietnam, and China’s Yunnan Province.
Promotion of the Mekong Region Development is expected to strengthen relations
between countries in the region and create a more favorable environment for reducing
disparities within the ASEAN by raising the economic levels of the new members
located in this region. Among other things, it is also expected to strengthen ASEAN
integration.
As regionwide development is a new challenge under the Japanese bilateral ODA,
the following difficulties and recommendations have been identified based on a review
of existing papers:
(1) Regionwide development may cause a growth gap between countries or areas that
can enjoy the benefits of development and those unable to access such benefits.
Therefore, countermeasures to alleviate such a gap must be prepared even if the
emergence of such a gap is unavoidable in the process of economic growth. It is
important to provide support, such as social welfare, to areas that cannot receive the
benefits of regionwide development through close coordination.
(2) When providing public goods under regionwide development, it is possible to
create a difference of priorities between regional public goods and domestic public
goods in each country. It is important for Japan to present a clear regionwide
development strategy and to make a master plan in the Mekong region through policy
negotiations in order to provide regional public goods efficiently and effectively. It is
especially important in the fields of navigation, disaster prevention, water utilization,
and environmental conservation in the Mekong River to coordinate the interests of

230
upstream and downstream areas as well as right and left banks where conflicts
naturally tend to occur.
(3) To advance a regionwide development vision and strategy, sharing of information
and cooperation with international organizations such as the ADB and the Mekong
River Commission (MRC) must be started from the policy formulation and planning
stages. It is essential for Japan to actively make technical proposals and offer
information. It is also important to decide on a regionwide development strategy and
financial sharing arrangement in an integrated manner and in cooperation with other
donors on a long-term basis.
(4) To carry out a regionwide development project such as the Mekong Region
Development, a long-term effort and a flexible approach are required as
socioeconomic changes occur very quickly in this region where the speed of growth is
very fast. Development vision, priority projects, and other development-related
matters should be reviewed periodically and then advanced again with necessary
modifications by paying attention to changes in private investment and physical
distribution in the region.
(5) For efficient and effective regionwide cooperation, it is necessary to provide
comprehensive assistance, including improvements in policies, institutions, and
maintenance in order to solve various problems. It is also essential to advance
assistance efforts by interlinking ODA loans, grant aids, and technical cooperation
organically.

231
(6) Development of border areas is key to regionwide development. Japan has
implemented several development studies, such as the Integrated Development Plan
for the Border Region (Laos and Thailand) and the Study on Special Economic Zone
Development Plan in Border Area (Savannakhet Province in Laos). To effectively
promote a regionwide development project spanning multiple countries in the
Mekong region, it is necessary to allocate some amount out of the total budget
appropriated for bilateral assistance in each country to a regionwide project having
cross-border effects.
(7) Cooperation with the private sector should be thoroughly considered for the
efficient operation of infrastructure and for the promotion of market enhancement. In
the case of the Cai Mep-Thi Vai International Port Construction Project in Vietnam,
operation of the new port facilities will be entrusted to private-sector operators to
ensure efficient operations and maintenance management. In general, ODA loans
should be used for market enhancement measures in commercially nonviable fields
because private participation is available in fields where commercial viability has
been realized by market enhancement measures.
5. JAPAN’S TRADE AND INVESTMENT WITH CLMV
While Japan is the top donor country for all CLMV countries, its trade and investment
relations are quite weak. In this section, the authors examine the trade and investment
performance between Japan and CLMV.

232
5.1 Japan’s Trade with CLMV
Bilateral trade between Japan and the ASEAN grew in the 1990s and up to 2006 in spite
of a temporary decline after the Asian Financial Crisis of 1997. Japan’s exports to the
ASEAN increased by 2.3 times from US$ 33,406 million in 1990 to US$ 76,434 million
in 2006. Its imports from the ASEAN increased by 2.7 times, from US$ 29,975 million
in 1990 to US$ 80,197 million in 2006. The ASEAN is an important trading partner of
Japan, accounting for 11.8 percent of Japan’s total exports and 13.9 percent of its total
imports in 2006.
Figure 2: Japan’s Exports to ASEAN and China
0
10,000
20,000
30,000
40,000
50,000
60,000
70,000
80,000
90,000
100,000
1980 1981 1982 1983 1984 1985 1986 1987 1988 1989 1990 1991 1992 1993 1994 1995 1996 1997 1998 1999 2000 2001 2002 2003 2004 2005 2006
(Source) IMF, Direction of Trade. .
ASEAN-6 CLMV CHINA
(US$ Million)

233
Figure 3: Japan’s Imports from ASEAN and China
However, the bulk of trade between Japan and the ASEAN happens between Japan
and the original six ASEAN members while the four new ASEAN member countries,
i.e., CLMV, account for only a small share. CLMV occupied only 5.7 percent in Japan’s
exports to the ASEAN and 7.2 percent in Japan’s imports from the ASEAN. CLMV
have not yet become major trading partners of Japan.
Moreover, Vietnam alone assumed a lion’s share of Japan’s trade with CLMV,
occupying 95.3 percent in Japan’s exports to CLMV and 93.4 percent in its imports
from CLMV in 2006. In other words, Cambodia, Laos, and Myanmar have yet to
become significant trading partners for Japan.
0
20,000
40,000
60,000
80,000
100,000
120,000
1980 1981 1982 1983 1984 1985 1986 1987 1988 1989 1990 1991 1992 1993 1994 1995 1996 1997 1998 1999 2000 2001 2002 2003 2004 2005 2006 (Source) IMF, Direction of Trade.
ASEAN-6 CLMV CHINA
(US$ Million)

234
Figure 4: Japan’s Exports to CLMV
Figure 5: Japan’s Imports from CLMV
0
1,000
2,000
3,000
4,000
5,000
6,000
7,000
1980 1981 1982 1983 1984 1985 1986 1987 1988 1989 1990 1991 1992 1993 1994 1995 1996 1997 1998 1999 2000 2001 2002 2003 2004 2005 2006
(Source) IMF, Direction of Trade .
CAMBODIA
LAO PDR
MYANMAR
VIETNAM
(US$ Million)
0
500
1,000
1,500
2,000
2,500
3,000
3,500
4,000
4,500
5,000
1980 1981 1982 1983 1984 1985 1986 1987 1988 1989 1990 1991 1992 1993 1994 1995 1996 1997 1998 1999 2000 2001 2002 2003 2004 2005 2006
(Source) IMF, Direction of Trade.
CAMBODIALAO PDRMYANMARVIETNAM
(US$ Million)

235
Among the CLMV, Vietnam and Cambodia showed a brisk performance in their
trade with Japan while Laos and Myanmar recorded rather dismal figures. Japan’s
exports to Vietnam increased by 19.3 times from US$ 214 million to US$ 4,140 million
for the period between 1990 and 2006. Japan’s imports from Vietnam increased nine
times for the same period from US$ 597 million to US$ 5,358 million. Japan’s exports
to Cambodia increased by 17.9 times from US$ 5 million to US$ 82 million while its
imports from Cambodia expanded 34.2 times from US$ 3 to US$ 119 for the same
period.
On the other hand, Japan’s exports to Laos stagnated from US$ 20 million in 1990
and US$ 21 million in 2006 while its imports from Laos increased from US$ 5 million
in 1990 to US$ 12 million in 2006. Japan’s exports to Myanmar also stagnated at
US$ 101 million in 1990 and US$ 104 million in 2006, while its imports from that
country showed a steady increase from US$ 42 million in 1990 to US$ 248 million in
2006.
5.2 CLMV’s Trade Dependency on Japan
Although Japan is currently not a major trading partner of CLMV, it was a
relatively important trading partner for CLMV in 1990. Approximately 7 percent of
Cambodia’s, Laos’s, and Myanmar’s total exports went to Japan while Vietnam
exported 13.5 percent of its total exports to Japan in 1990 (Table 8). However, all
CLMV countries reduced their export shares to Japan in 2006. Cambodia and Laos
exported only 1 percent and Myanmar only about 5 percent of their total exports to
Japan in 2006. Only Vietnam exported more than 12 percent of its total exports to Japan
in the same year.

236
Table 8: CLMV’s Trade Dependence on Japan, China, and the United States
CLM’s import dependence also substantially declined. Japan’s share in Cambodia’s
total imports declined from 9 percent in 1990 to 4.3 percent in 2006 while its share in
Laos’s total imports shrank from 14.5 percent in 1990 to 1.4 percent in 2006. Myanmar
followed the same trend, i.e., 16.6 percent in 1990 to 3 percent in 2006. Vietnam is the
only exception; it increased its import dependence on Japan from 5.9 percent in 1990 to
9.5 percent in 2006.
The U.S. opened its markets to Cambodia and Laos, in particular. It absorbed more
than a half of Cambodia’s total exports, mainly garments, and more than 20 percent of
Vietnam’s total exports in 2006, although there were no imports from the United States

237
from the two countries in 1990. On the other hand, China emerged as a major supply
source of commodities and goods to CLMV. China increased its share in Cambodia’s
total imports from 9.1 percent in 1990 to 26.5 percent in 2006. It also increased its share
in Laos’s total imports from 11.6 percent in 1990 to 12.3 percent in 2006. China
supplied more than one-third of Myanmar’s total imports in 2006, which was about 20
percent in 1990. China’s share in Vietnam’s total imports also increased from 7.1
percent in 1990 to 20.6 percent in 2006. On the whole, Japan has reduced its relative
importance in CLMV’s external trade while the United States and China have played a
more active role.
Nevertheless, the relative slow development of trade between Japan and CLMV in
the 1990s does not necessarily mean it has continued to stagnate in recent years. Japan
started to open its markets to CLMV’s products by providing the Generalized System of
Preferences (GSP), development-and-import-formula business activities, and making
FDIs in these countries. Since 2003, Cambodia, Myanmar, and Vietnam have shown
double- digit growth rates in their bilateral trade with Japan although Laos had shown
ups and downs (Table 9). Such a trend is encouraging for both CLMV and Japan.
Japanese markets can contribute more to CLMV trade and industrial development in the
near future.
Table 9: Growth of Japan's Imports from CLMV

238
5.3 Japan’s Trade with Each CLMV
5.3.1 Japan’s Trade with Cambodia
Cambodia is not a major trading partner for Japan since it was ranked 106th in terms of
export and 81st in terms of import among more than 200 of Japan’s trading partners.
However, Japanese trade with Cambodia steadily increased after 2000 for both imports
and exports. Japan’s imports from Cambodia sharply increased after 1998, although it
had been insignificant during the previous years.
Figure 6: Japan’s Trade with Cambodia
Source: World Trade Atlas.
Japanese imports from Cambodia have been historically dominated by forest
products, although these were successfully replaced by footwear after 1998. Therefore,
0
20
40
60
80
100
120
140
160
1994 1995 1996 1997 1998 1999 2000 2001 2002 2003 2004 2005 2006 2007
Export Import
(US$ Million)

239
the increase in Japan’s imports from Cambodia was due to Cambodia’s rapid increase in
footwear exports. At the same time, the volume of all other products gradually
decreased to a very low level. Cambodia’s exports of apparel products also gradually
increased after 2002.
Figure 7: Japan’s Import from Cambodia by Commodity
Note*= Apparel products include knit apparel and woven apparel.
Source: World Trade Atlas.
In terms of Japanese exports to Cambodia, machineries and vehicles dominated all
other products. Even though the share of this product category decreased between 1996
and 2003, it increased dramatically again after 2003. The volume of all other export
products remained stagnant between US$10 million and US$20 million per year.
0
20
40
60
80
100
120
140
1994 1995 1996 1997 1998 1999 2000 2001 2002 2003 2004 2005 2006 2007
(US$ Million)
Foodwear Apparel* All other products

240
Figure 8: Japan’s Export to Cambodia by Commodity
Note: *The category machineries and vehicles include electronic machineries,
railway, ships, boats, and aircraft.
Source: World Trade Atlas.
5.3.2 Japan’s Trade with Laos
Among the CLMV, Laos is the least significant trading partner for Japan. Laos was
ranked 134th for import and 135th for export among Japan’s trading partners. Although
Japan’s trade with Laos has been small, Japan enjoyed a trade surplus in almost all
periods under consideration. In Figure 9, it can be seen that Japan’s trade with Laos
decreased from 1994 to 2001 for both exports and imports, but Japanese exports
gradually increased from 2003 afterwards.
0 10 20 30 40 50 60 70 80 90
100
1994 1995 1996 1997 1998 1999 2000 2001 2002 2003 2004 2005 2006 2007
Machinery and vehicles* All other products
(US$ Million)
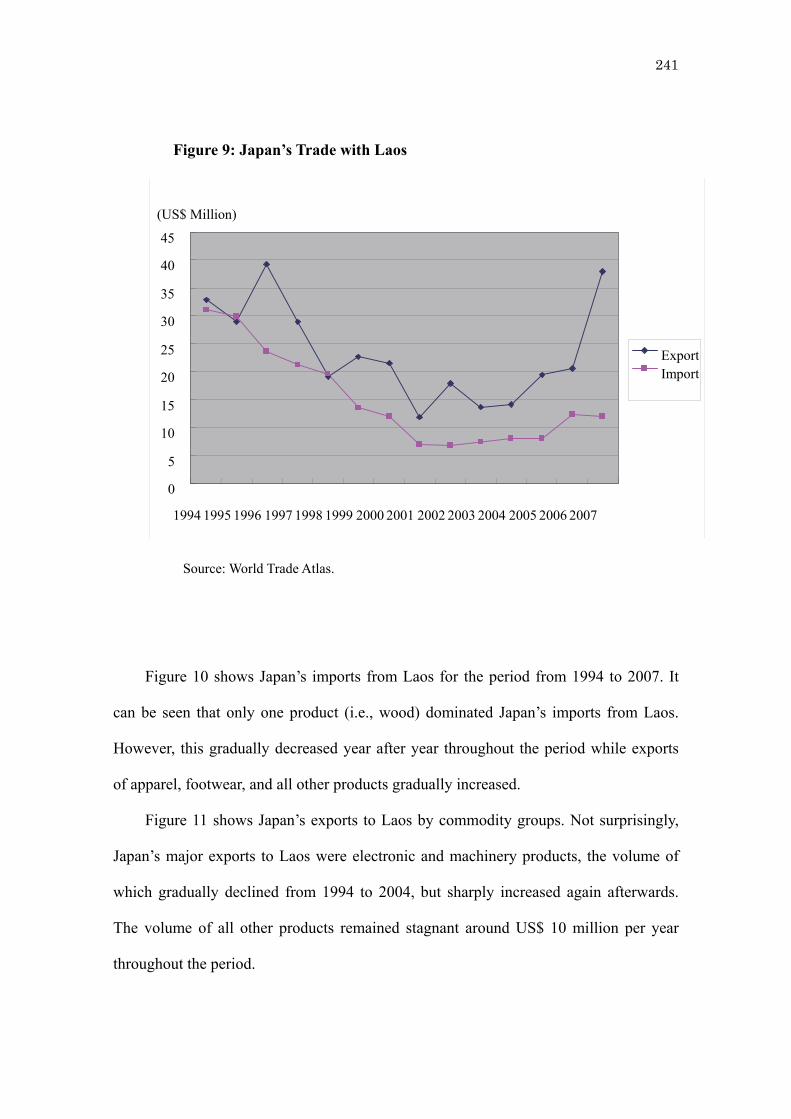
241
Figure 9: Japan’s Trade with Laos
Source: World Trade Atlas.
Figure 10 shows Japan’s imports from Laos for the period from 1994 to 2007. It
can be seen that only one product (i.e., wood) dominated Japan’s imports from Laos.
However, this gradually decreased year after year throughout the period while exports
of apparel, footwear, and all other products gradually increased.
Figure 11 shows Japan’s exports to Laos by commodity groups. Not surprisingly,
Japan’s major exports to Laos were electronic and machinery products, the volume of
which gradually declined from 1994 to 2004, but sharply increased again afterwards.
The volume of all other products remained stagnant around US$ 10 million per year
throughout the period.
0
5
10
15
20
25
30
35
40
45
1994 1995 1996 1997 1998 1999 2000 2001 2002 2003 2004 2005 2006 2007
ExportImport
(US$ Million)

242
Note:*Apparel include knit apparel and woven apparel.
Source: World Trade Atlas.
Source: World Trade Atlas.
0
20
40
60
80
100
120
1994 1995 1996 1997 1998 1999 2000 2001 2002 2003 2004 2005 2006 2007
(US$ Million)
Wood Footwear Apparel* All other products
Figure 10: Japan’s Imports from Laos, by Commodity
0
5
10
15
20
25
30
35
1994 1995 1996 1997 1998 1999 2000 2001 2002 2003 2004 2005 2006 2007
(US$ Million)
Machineries and Vehicles All other products
Figure 11: Japan’s Exports to Laos, by Commodity

243
5.3.3 Japan’s Trade with Myanmar
Japan’s trade with Myanmar is the second largest in CLMV after Vietnam. Myanmar
ranked 64th in terms of Japan’s imports and 89th for exports. Japan enjoyed a trade
surplus with Myanmar up to 2002. However, this situation was reversed in 2003 when
imports from Myanmar sharply increased while exports gradually declined.
Figure 12: Japan’s Trade with Myanmar
Source: World Trade Atlas.
Japan’s imports from Myanmar by commodity groups are shown in Figure 13. Fish
and seafood had long occupied a large share of Japan’s imports from Myanmar. The
volume of fish and seafood still represents significant amount of Japanese imports from
the country. After 2002, woven apparel and footwear accounted for a bigger share of
0
50
100
150
200
250
300
350
1994 1995 1996 1997 1998 1999 2000 2001 2002 2003 2004 2005 2006 2007
Export Import
(US$ Million)

244
Japan’s imports. Specifically, the volume of woven apparel products imported by Japan
from Myanmar sharply increased after 2003; this trend is expected to continue in the
future. It surpassed the imports of fish and seafood in 2007. Wood, precious stones, and
all other products imported from Myanmar remained under US$ 20 million per year.
Figure 13: Japan’s Imports from Myanmar, by Commodity
Source: World Trade Atlas.
On the other hand, Japan’s exports of machineries and vehicles to Myanmar were
the same as for the other CLMV countries.
0
20
40
60
80
100
120
1994 1995 1996 1997 1998 1999 2000 2001 2002 2003 2004 2005 2006 2007
(US$ Million)
Woven Apparel Fish And Seafood Footwear Misc Grain,Seed,Fruit Wood Precious Stones,Metals All other products
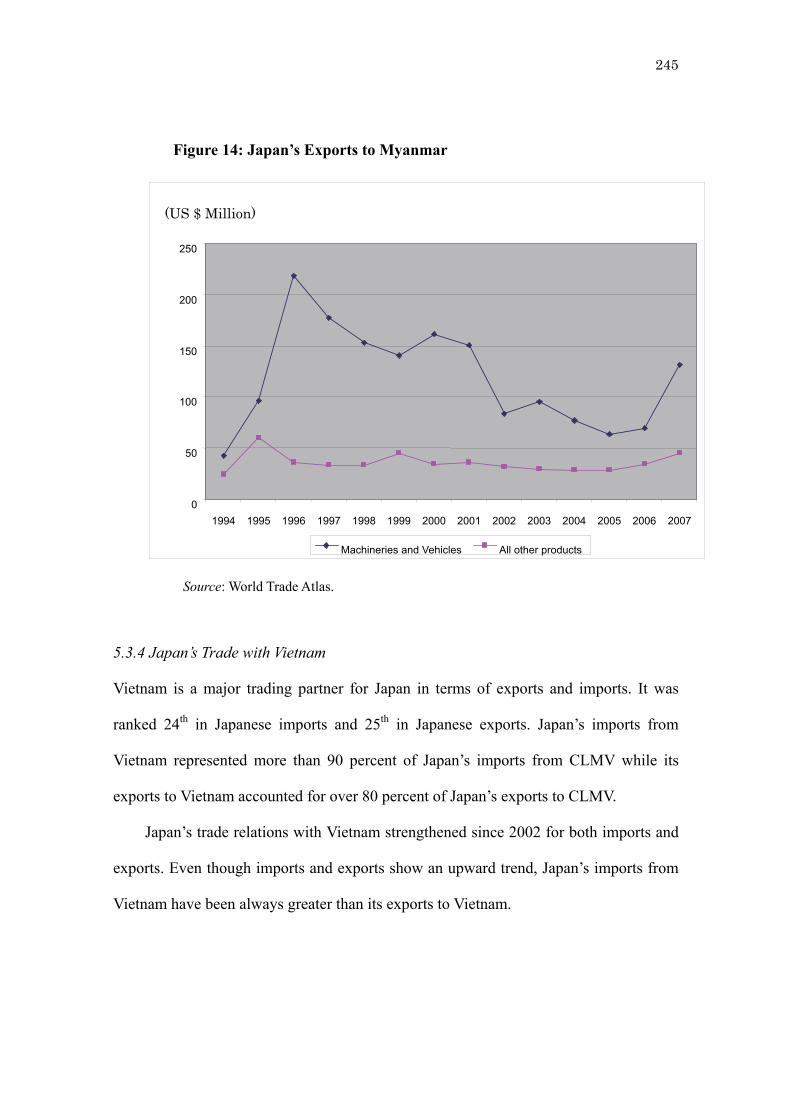
245
Figure 14: Japan’s Exports to Myanmar
Source: World Trade Atlas.
5.3.4 Japan’s Trade with Vietnam
Vietnam is a major trading partner for Japan in terms of exports and imports. It was
ranked 24th in Japanese imports and 25th in Japanese exports. Japan’s imports from
Vietnam represented more than 90 percent of Japan’s imports from CLMV while its
exports to Vietnam accounted for over 80 percent of Japan’s exports to CLMV.
Japan’s trade relations with Vietnam strengthened since 2002 for both imports and
exports. Even though imports and exports show an upward trend, Japan’s imports from
Vietnam have been always greater than its exports to Vietnam.
0
50
100
150
200
250
1994 1995 1996 1997 1998 1999 2000 2001 2002 2003 2004 2005 2006 2007
(US $ Million)
Machineries and Vehicles All other products

246
Figure 15: Japan’s Trade with Vietnam
Source: World Trade Atlas.
As seen in Figure 16, mineral and fuel, fish and seafood, and apparel products
played a dominant role in Japanese imports from Vietnam up to 2002. However, starting
1998, the volume of machinery and vehicle products increased remarkably and
surpassed all other imported products after 2002. Vietnam was the only country in
CLMV that could export capital and intermediate products like machinery and vehicles
to Japan.
0
1000
2000
3000
4000
5000
6000
7000
1994 1995 1996 1997 1998 1999 2000 2001 2002 2003 2004 2005 2006 2007
Export Import
(US$ Million)

247
Figure 16: Japan’s Imports from Vietnam
Note: *Fish and seafood include processed and prepared fish and meat.
Source: World Trade Atlas.
Japan exported mainly iron and steel products to Vietnam. As in the case of other
CLMV countries, machinery and vehicles were also major export products to Vietnam.
Japan’s exports of iron, steel, machinery, and vehicle products gradually increased from
1994 to 2002 and then sharply increased up to 2007. Exports of fabrics, plastic, and
chemical products also gradually increased, but still remained at a low level of less than
US$ 500 million per year. The volume of other exported products also gradually
increased.
0
200
400
600
800
1000
1200
1400
1600
1800
1994 1995 1996 1997 1998 1999 2000 2001 2002 2003 2004 2005 2006 2007
Machineries and vericles Mineral Fuel, Oil Etc Apparel Fish And Seafood* Wood and wood products Footwear All other products
(US$ Million)

248
Figure 17: Japan’s Exports to Vietnam
Source: World Trade Atlas.
All in all, Japan imported from CLMV not only natural resources but also
labor-intensive, manufactured products such as clothes and footwear, the latter of which
has a broader impact on CLMV’s economic and industrial development in terms of
employment and technology transfer. Japan is now heavily dependent on China’s
supplies of such daily products, but it can offer a huge domestic market of such items to
CLMV producers as well. To open Japanese markets to CLMV products is critically
important to enhance bilateral trade between Japan and CLMV in the future.
0
500
1000
1500
2000
2500
3000
3500
4000
1994 1995 1996 1997 1998 1999 2000 2001 2002 2003 2004 2005 2006 2007
(US$ Million)
Machineries and Vehicles Iron and Steel products Plastic and Chemicals Fabrics All other products

249
5.4 Japan’s Investment in CLMV
While Japanese firms vigorously invested in the original ASEAN economies throughout
the 1980s and the latter half of the 1980s in particular, they started investing in CLMV
only in the 1990s and thereafter. According to the figures from Japan’s Ministry of
Finance, the first investment of a Japanese firm in Vietnam was recorded in 1989. After
that, Japanese investments in CLMV gradually increased and reached a peak of 70 cases
in 1996, accounting for approximately 10 percent of Japanese investments to the whole
ASEAN. However, after the Asian Economic Crisis of 1997, Japanese investments in
CLMV substantially declined as did those to the original ASEAN countries.
Figure 18: Japanese Foreign Investments in ASEAN and CLMV, Number
Source: Japanese Ministry of Finance
0
200
400
600
800
1000
1200
FY 1980 FY
1981 FY 1982 FY
1983 FY 1984 FY
1985 FY 1986 FY
1987 FY 1988 FY
1989 FY 1990 FY
1991 FY 1992 FY
1993 FY 1994 FY
1995 FY 1996 FY
1997 FY 1998 FY
1999 FY 2000 FY
2001 FY 2002 FY
2003 FY 2004
ASEAN 10 CLMV
(Number)

250
Among CLMV, Vietnam attracted the most Japanese investors since the mid-1990s
and up to present while Cambodia, Laos, and Myanmar are not yet major host countries
for Japanese investors. A detailed picture for CLMV follows:
5.4.1 Japanese Investment in Cambodia
Cambodia received FDI at a yearly average of US$ 225.7 million between 2000 and
2004. However, the FDI inflows to Cambodia suddenly increased, and it received
US$ 1050.2 million in 2005 and US$ 4414.8 million in 2006. According to Dr. Chap’s
chapter in this volume, Cambodia received FDI equivalent to 4.7 percent of its GDP
between 1998 and 2003, and this figure was the second highest among the ASEAN
countries, coming behind Singapore with 5.9 percent. Cambodia has been attracting an
increasing number of foreign investments recently.
However, Japan accounted for a negligible share (0.2 percent) of total FDI in
Cambodia between 2000 and 2006. In contrast, China accounted for 36.6 percent,
followed by Korea (32.0 percent), and the ASEAN (13.4 percent).
Table 10: Foreign Direct Investments in Cambodia, Approved Based, Share (%)

251
Japanese investors are said to be more sensitive than other Asian countries’
enterprises to good governance, policy consistency and predictability, and law
enforcement. Lack of these factors hinder Japanese firms from investing in Cambodia.
In order to improve investment climate in Cambodia, then Prime Minister Shinzo Abe
and Cambodian Prime Minister Hun Sen, signed the “Agreement between Japan and the
Kingdom of Cambodia for the Liberalization, Promotion, and Protection of Investment”
on June 14, 2007 in Tokyo. Under this agreement, Japanese firms are entitled to be
treated equally in terms of regulation and taxation as Cambodian firms when they invest
in Cambodia. Moreover, Cambodia committed to combat an alleged corruption problem.
Such efforts are expected to promote Japanese investments in Cambodia in the near
future.
5.4.2 Japanese Investment in Laos
Laos received 919 foreign investment projects with a total amount of US$ 5,572.2
million from 2001 to March 2007. In terms of amount, Thailand was the top investor
with US$ 1,334.1 million, occupying 23.9 percent of total foreign investments, followed
by China with US$ 763.6 million (13.7 percent), Vietnam with US$ 463.4 million (8.3
percent), and France with US$ 419.1 million (7.5 percent). Thailand has long been a top
investor in Laos due to geographical proximity, cultural and language similarities, and
economic and industrial complementarities.
However, in terms of number of investments, China ranked 1st with 223 projects
between 2001 and March 2007, followed by Thailand with 157 projects, and Vietnam
with 157 projects. China has invested more rapidly in Laos in recent years. Thailand and
China are currently the two major investors in Laos.

252
In contrast, Japanese investments in Laos have been slow. There were 29 Japanese
investment projects with a total amount of US$ 418.4 million for the same period,
accounting for only 3.2 percent in the number of projects and 7.5 percent in total
amount approved. In order to promote Japanese investments in Laos, Japan and Laos
signed the “Agreement between Japan and the Lao People’s Democratic Republic for
the Liberalization, Promotion, and Protection of Investment” on January 16, 2008 in
Tokyo. As in the case of Cambodia, such efforts are expected to promote Japanese
investments in Laos in the near future.
Table 11: FDI inflows to Laos, 2001 to March 2007
5.4.3 Japanese Investment in Myanmar
In terms of ranking, Japan is not an important investor in Myanmar since its major
foreign investment source countries are from the neighboring countries, including the
ASEAN and China. According to data from the Ministry of National Planning and

253
Economic Development (MNPED) as of August 2007, Japan ranked 12th in foreign
investments received by Myanmar, which represents only 1.5 percent share of
Myanmar’s total foreign investments. Japan’s investment in Myanmar was significantly
smaller than those of Hong Kong (ranked 5th), China (ranked 6th), and South Korea
(ranked 9th).
Japanese investments were quite active in the first half of the 1990s. However,
after the Asian Economic Crisis of 1997, they became dormant, and there were no new
investments from Japan after 2005.
Up to August 2007, 22 Japanese investment projects were approved by the
Myanmar Investment Commission (MIC). Of these, two projects terminated their
operations, leaving 20 projects existing in Myanmar (Table 13). There are 11 Japanese
investments in the manufacturing sector. Even though Japanese investments in
Myanmar are rather small, Japan is one of the major investors in manufacturing.
Japanese firms are more interested in the labor-intensive manufacturing sectors.
However, unlike Chinese and Korean investors, they were not very successful in natural
resources development, such as exploration and exploitation of natural gas and
construction of hydropower plants. In reality, Myanmar’s natural resources are a hot
target of other Asian countries’ investors including China, India, and Thailand.

254
Table 12: FDI inflows to Myanmar

255
Table 13: Japan’s existing investments in Myanmar (as of August 2007)
(US $ Million)
No. Business sector No. of projects undertaken Approved Amount
1
2
3
4
5
6
Fisheries
Manufacturing
Hotel and Tourism
Real Estate
Industrial Estate
Others
2
11
3
1
1
2
13.727
44.383
68.000
31.313
12.000
1.966
Total 20 171.389
Source: Ministry of National Economic Planning and Development
5.4.4 Japanese Investment in Vietnam
Japan is one of earliest and biggest foreign investors in Vietnam. The contribution of
Japanese FDI in terms of percentage of disbursed and registered capital volume is
higher than that of any other investor countries. Aside from this, there are many
Japanese investors registered as originating from other third countries and territories.
These investments were made by Japanese-affiliated firms in third countries.
Japanese FDI inflows to Vietnam started in 1989 through a project establishing the
Mekong Auto Corp. Japanese investments increased considerably after 1994 when the
U.S. embargo against Vietnam was lifted. The first Japanese FDI boom in Vietnam
reached its peak in 1996 and then decreased until 1999. The lost growth momentum of
Vietnam economy, the impact of Asian Economic Crisis of 1997, and

256
Table 14: FDI in Vietnam by Top Five Investor Countries, 1988 – March 2007 (US$ Million, Implemented Capital)
Ranking Country/ Territory
Number of projects
Registered capital
Legal capital
Disbursed capital
1 Japan 903 8,772.1 3,754.7 5,202.9 2 Singapore 529 9,695.5 3,496.5 4,068.73 Taiwan 1,739 9,655.5 4,242.9 3,172.64 Republic of Korea 1,655 n.a. 4,594.9 2,946.35 Hong Kong 432 5,685.3 2,095.5 2,326.1
Source: Department of Foreign Investment, Ministry of Planning and Investment, Vietnam.
Japanese firms’ discontent with Vietnam’s investment climate have been claimed as the
causes of this decline.
Japanese FDI inflows again increased starting 2000. Then Vietnam Prime Minister
Phan Van Khai and former Japan Prime Minister Koizumi signed the “Japan-Vietnam
Joint Initiative to Improve the Business Environment with a View to Strengthening
Vietnam’s Competitiveness” in April 2003. Eventually, the “Agreement between Japan
and the Socialist Republic of Vietnam for the Liberalization, Promotion, and Protection
of Investment” was signed in November 2003. The former contributed to betterment of
the investment climate in Vietnam, and the latter gave more confidence Japanese
investors in Vietnam’s investment environment. Thus, Japanese FDI inflows have
considerably accelerated. The investment promotion and protection agreement between
Japan and Vietnam was the first one Japan signed with the CLMV countries. As
previously mentioned, Cambodia and Laos followed Vietnam’s initiative afterwards.

257
Table 15 : Japanese FDI in Vietnam, 1988 – Oct. 2007
Number of projects Amount of capital
(in mill US dollars)
Year Cumulative New Cumulative New
1988-93 50 -- 378.4 --
1994 76 26 679.0 300.6
1995 n.a. n.a. 1130.0 451.0
1996 177 n.a. 2400.1 1270.1
1997 236 59 3037.5 637.4
1998 256 20 3299.1 261.6
1999 270 14 3360.6 61.5
2000 296 26 3441.2 80.6
2001 336 40 3604.2 163.0
2002 385 49 3706.8 102.6
2003 493 108 4032.5 325.7
2004 551 58 6211.4 2178.9
2005 684 133 6907.2 695.8
2006 838 154 8397.6 1490.4
2007 903 65 8772.1 374.5
Source: Ministry of Planning and Investment and General Statistic Office of Vietnam.
Vietnam ranked 8th on the list of top destinations for Japanese investments in 2000.
It jumped to 4th rank in 2005 after China, India, and Thailand. Japanese FDI projects in
Vietnam are mostly motivated by market-seeking and efficiency-seeking incentives.

258
Japanese enterprises usually take into account such factors as Vietnam’s economic
growth rate, availability of skilled labor, and industrial clusters, when they decide to
invest. Vietnam’s political, social, and exchange rate stabilities also attract Japanese
investors. Vietnam has become a popular investment destination for Japanese firms
seeking to reduce their excessive dependence on China (i.e., China+1 strategy).
Nevertheless, the lack of skilled workers, middle-level managers, and engineers
(especially mechanical and electronic engineers) in Vietnam do not satisfy Japanese
investors. Moreover, there is a shortage of Japanese-speaking staff in Vietnam.
Japanese FDI projects are mostly located in the northern and southern pivotal
economic regions of Vietnam. A large number of Japanese FDI projects are in
manufacturing concerns. There are also quite a number of projects in the service sectors,
including construction, logistics, hotels and restaurants, but few in agriculture,
aquaculture, and the mining industry. Recently, there has been a surge of Japanese
investments in Vietnam’s electronics and telecommunications industries.
Japanese manufacturing FDI enterprises tend to commit high localization. Many
commitments, however, could not be realized due to the underdevelopment of
Vietnam’s supporting industries. Regarding technology transfer, almost all Japanese
manufacturing and construction enterprises have transferred assembly, operating,
maintenance and quality control technology to Vietnam. However, they failed to transfer
more advanced and complex technologies to local business partners and workers in
Vietnam. Technology diffusion from Japanese companies to Vietnamese firms has
generally been rather slow.
Many Japanese firms are interested in investing in CLMV. However, most of them
are still in the stage of gathering information, planning and doing feasibility studies,
259
except the case of Vietnam where Japanese firms are already vigorously doing business.
On the other hand, CLMV governments are also trying to attract and promote Japanese
investments in their countries by, for example, signing investment promotion and
protection agreements with the Japanese government. More and more Japanese
investments will be coming to CLMV countries in the near future, and they are expected
to contribute to the host countries’ economic and industrial development in the long run.
6. CONCLUDING REMARKS
Japan has played an important role in economic cooperation with CLMV. The present
approach of Japanese economic cooperation is on a country-by-country basis. In
contrast, the New Concept of Mekong Region Development is a new attempt based on
regionwide development. This development concept appeared in Japan’s ODA Charter,
which was revised in 2003. Japan will continue to develop economic and social
infrastructure that are in great demand in CLMV countries and provide assistance to
promote sustained growth according to the New Concept.
While Japan, along with Thailand, is a top donor in CLMV, Japan’s regionwide
development strategy and plan for these areas are not yet clear. To implement
regionwide development efficiently and effectively, it is essential to pursue studies
related to regional public goods provided by regionwide development. In this sense, the
Mekong Region Development Scheme provides an important opportunity for China,
Japan, and Korea to cooperate. Through the cooperation process of these three countries
and the ASEAN, East Asia’s sustainable growth will be ensured.
Another challenge for Japan is to promote its trade and investment with CLMV
countries. Japan’s trade and investment relations with CLMV have been relatively weak.

260
However, Japan recently increased its imports from CLMV and showed an increasing
interest in investing in those countries. Japan has been importing from CLMV not only
natural resources but also labor-intensive products such as clothes and footwear, the
latter of which is said to have a broader impact on exporting economies in terms of
employment creation and technology transfer. Japan is currently heavily dependent on
China’s supplies of such items and has been trying to diversify its procurement source
countries. Accordingly, Japan can offer its markets to CLMV, and this will significantly
contribute to CLMV’s economic and industrial development in the long run. Japanese
investments in CLMV will also contribute to export promotion of their products in
Japan. Both the Japanese and CLMV governments are exerting effort to promote
foreign investments by, for example, signing investment promotion and protection
agreements between them. Such efforts to promote trade and investment between Japan
and CLMV will bear their fruits in the near future.
REFERENCES Government of Japan, Ministry of Foreign Affairs, Economic Co-operation Bureau
(2003) Japan’s Official Development Assistance Charter. Institute for International Cooperation, Japan International Cooperation Agency (2007)
“A Report from the Study Group on Assistance to the Southeast Asian Region – Regional Integration and Development Aid”.
International Monetary Fund (IMF), Direction of Trade (various issues). Japan Bank for International Cooperation (2006) “ODA Loan Report 2006”. ---------- (2005) “Basic Strategy of Japan’s ODA Loan”. Kazuo Sunaga (2004) “The Reshaping of Japan's Official Development Assistance
(ODA) Charter”. Kuchiki Akihumi (2007) “Industrial Clusters in Asia”. National Graduate Institute for Policy Studies (2002) “Japan’s Development
Cooperation in Vietnam – Supporting Broad-based Growth with Poverty Reduction”.

261
Nomoto, Keisuke (2002) “International Cooperation for Development in the Mekong Sub-region”.
Watanabe, Keiko (2004) “Japan’s New ODA Approach towards Transboundary Issues: Regional Cooperation Projects in the Greater Mekong Sub-Region (GMS),” Forum of International development Studies, 27 (Aug. 2004).

262
Chapter 8 KOREA’S ECONOMIC RELATIONS WITH CLMV COUNTRIES Jaewan Cheong
ABSTRACT
Korea’s diplomatic relations with Cambodia, Laos, Myanmar, and Vietnam (CLMV) started to normalize in the 1990s. From then on, the CLMV countries have risen to become Korea’s principal target in external trade and overseas direct investment (ODI). Especially in ODI, tourism, and official development assistance (ODA), the CLMV countries have been rapidly rising as preferred destinations of Korea. Vietnam, in particular, has become one of Korea’s major destinations of ODI after the two started forming friendly relations in 1992. The economic cooperation between the two areas has indeed been showing signs of expansion and this is envisaged to continue as long as the economic growth of Korea and CLMV countries continues. For Korea, this can be made possible through the expansion of ODA support and continued application of the Generalized System of Preference to less developed countries, as well as the improvement of its trade imbalance. For CLMV countries, required action points include the development of human resources, improvement of foreign investment environment, systematization and development of aid management organizations, restructuring of state-owned enterprises, promotion of private sector participation, and development of the financial and capital markets. Clearly, the challenge to sustain economic growth is more daunting for CLMV countries given their lower state of economic development. Strengthening the economic cooperation between Korea and CLMV countries could help the latter address this challenge.
1. INTRODUCTION
Cambodia, Laos, Myanmar, and Vietnam—known collectively as CLMV—are rapidly
getting the attention of many as the newly rising economic circle in Asia due to their
investment advantages (e.g., abundant natural resources, and inexpensive labor power).
Their pursuit of economic reforms to achieve progress and development by embracing
an open door policy as manifested in their joining the World Trade Organization (WTO)
recently has added more to their growing popularity in the region. Cambodia and
Vietnam joined the WTO successively (in 2004 and 2007, respectively) while Laos is
seeking admission. (On the other hand, Myanmar was a GATT member and a member
263
of the WTO since the latter came into being in 1995) Accordingly, the economic system
of these countries is changing rapidly, including their foreign trade and investment
environment.
Necessary for the steady development of the ASEAN+3 and the formation of an
economic community in East Asia is the dissolution of development gaps within the
region, which continue to rise. These development gaps between the more advanced
developing countries and the least developed ones as represented by the CLMV
countries are at a serious level. The expansion of these gaps has grave consequences on
the process of economic integration in East Asia.
Simultaneous with the rising economic importance of the CLMV countries is the
rapidly increasing economic cooperation between Korea and the CLMV countries. This
is manifested not only in trade and overseas direct investment (ODI) but also in the
cooperation between and among their governments. Especially in ODI, tourism, and
official development assistance (ODA), the CLMV area is rapidly rising as a newly
emerging market.
This research focuses on the economic cooperation between Korea and the CLMV
countries over the years. It analyzes the scope of this cooperation and suggests policies
for its expansion. The first section examines the international trade policies of Korea
and strategies concerning CLMV countries. Then, the trade and investment of Korea to
CMLV countries through the private sector is analyzed in a second section. The next
section examines the economic cooperation between Korea and the CLMV countries at
the government level. It discusses the ODA policy of Korea, which became official in
the 1980s through the establishment of the Economic Development Cooperation Fund
and later on, the grant-type ODA. The fourth section makes an evaluation of the
economic cooperation relationship between Korea and the CLMV countries. The final
section provides some policy recommendations that are necessary for expanding such
cooperation.
2. KOREAN INTERNATIONAL TRADE POLICIES AND STRATEGIES CONCERNING CLMV COUNTRIES
During the 1950s, there was no significant international trade policy in Korea as the
country was heavily dependent on foreign aids. Significant transformations came,

264
however, beginning the 1960s, when the economic development path of Korea has
centered on international trade, especially exports. From 1964, when exports totaled
almost USD100 million, and up to the present, Korea’s export growth rate was as high
as over 20 percent in yearly average. Accordingly, Korea has found its place among the
12 largest exporting countries. Export has especially played a critical role in its
economic growth and job creation. The international trade policies of the Korean
government have accounted for this highly recognized success along with many other
factors, such as its strong emphasis on training and education toward a well-trained
labor force. Moreover, it was in the 1960s when the foundation for the many trade
policies in Korea such as import and export measures, and trade diplomacy, among
others, were established. In particular, during this period, the economic growth strategy
shifted from the import-substitution type to the export-orientation type.
In the 1970s, the export promotion policies that were started in the previous decade
were continued and intensified, and other policies that encouraged exports were
implemented. Then, in the 1980s, the ballooning trade surplus and increasing trade
pressures triggered the government to adopt a trade liberalization policy. While import
liberalization areas were widened, advancement and globalization of trade management
system were carried out.
In the 1990s, in addition to the trade sector, Korea opened its political, economic,
cultural, and social sectors. Upon closing of the Uruguay Round in 1993 and its
accession to the Organization for Economic Co-operation and Development, otherwise
known as OECD, an omni-directional opening of the country proceeded. Korea even
extended trade diplomacy with northern countries, then Communist ones. Korea formed
diplomatic relations with Vietnam in 1992, with Laos in 1995, and with Cambodia in
1997. Then, beginning year 2000, the Korean government pursued simultaneous
multilateral free trade agreements (FTAs) with these countries and provided support to
companies to move toward globalization. In the same year, the Generalized System of
Preferences (GSP) has been introduced as a means to support the industrialization and
economic development of developing countries. Among the CLMV countries,
Cambodia, Laos, and Myanmar are receiving GSP from Korea.1
1 GSP refers to the preferential system of tariff by developed countries in which a tariff rate lower than the regular rate (in other words, the most favored nation [MFN] tariff rate) or no tariff is imposed on goods imported from developing countries or those that are especially classified as least

265
Meanwhile, Korea’s ODI has seen its active start from the late 1980s when
international trade surplus began to accumulate. Previously, the overseas investment
policy was limited to secondary measures for boosting exports or developing resources
that the country did not produce.
Up to 1979, Korea’s overseas investment policy was a policy-initiating process and
then it became a policy-adjusting process from 1980 to 1985. From 1986, the Korean
government started to deregulate ODI as the won (Korean currency) appreciated,
domestic wage increased, and aggravating trade conflicts from international trade
surplus came to surface. In particular, the government adopted the Negative List System
in ODI. From 1991 to the onset of the East Asian crisis, the Korean government
encouraged ODI not only in the aspect of management of international trade balance but
also in the aspect of industrial policy. Because of these changes in policy, the relocation
of labor-intensive industries was accelerated. Around that time, the Indochina region
was opened to outsiders and it therefore emerged as Korea’s new investment destination.
Since 1999, the private sector has been the leading source of ODI as procedures,
regulations, and preconditions related to the overseas investments have been relaxed.
The government has also been very active in providing ODI since 2005.
Thus, it was during the late 1980s when Korea pursued external economic
expansion in terms of broadening its international trade policy, which was also the same
time when the CLMV countries started to open their market. When CLMV countries
tried to transform into a market-oriented economy and sought for economic reforms,
Korea restored its diplomatic relations with these countries. Since then, trade and
investment between these two regions has considerably increased.
3. ECONOMIC COOPERATION WITH CLMV COUNTRIES: PRIVATE SECTOR
3.1 Trade sector
Trade between Korea and CLMV countries started to grow when the Indochina region
opened its door to outsiders and restored its diplomatic relations with Korea. Before that,
developed countries in order to promote export expansion and industrialization in these countries. GSP plays a key role in supporting the “industrialization through export” strategy of developing countries. Korea is currently applying GSP in 49 least developed countries including 13 countries in Asia, 34 countries in Africa, 1 country in the American continent, and 1 country in the Middle East.

266
only Myanmar had trade relations with Korea, albeit somehow insignificant.
Particularly due to the restoration of diplomatic relations and the effects of the Doi Moi
reforms that invigorated the Vietnamese market and made it the newly emerging market
in the region, the trade between Korea and Vietnam has shown a rapid growth. Over the
years, the trade between these two countries has risen steadily although it fell in the
narrow range right after the East Asian crisis. Trade volume amounted to USD 1,998
million in 1996 right before the East Asian crisis and totaled USD5,320 million as of
2006. Nevertheless, the CLMV region takes up only 0.84 percent of Korea’s total
foreign trade since its total trade has grown rapidly and its trade size with China, Japan,
and the US has expanded.
While Korea’s trade with Myanmar has continued, the other countries were out of
the picture for a while when the communist regimes took charge in the Indochina region.
Table 1: Korea's trade with CLMV by year (1996~2006) (US$ in million, %)
1996 1997 1998 1999 2000 2001 2002 2003 2004 2005 2006
Volume 0 54 63 85 98 109 118 110 133 150 210Cambodia
Growth Rate
16.7 34.9 15.3 11.2 8.3 -6.8 20.9 12.8 40.0
Volume 10 9 5 12 5 6 4 8 10 16 41 Laos
Growth Rate
-10.0 -44.4 140.0 -58.3 20.0 -33.3 100.0 25.0 60.0 156.3
Volume 148 154 161 203 312 283 199 213 192 176 217Myanmar
Growth Rate
48.0 4.1 4.5 26.1 53.7 -9.3 -29.7 7.0 -9.9 -8.3 23.3
Volume 1,831 1,842 1,545 1,709 2,008 2,118 2,710 3,072 3,929 4,126 4,852Vietnam
Growth Rate
18.5 0.6 -16.1 10.6 17.5 5.5 28.0 13.4 27.9 5.0 17.6
Volume 1,989 2,059 1,774 2,009 2,423 2,516 3,031 3,403 4,264 4,468 5,320CLMV
Growth Rate
20.9 3.5 -13.8 13.2 20.6 3.8 20.5 12.3 25.3 4.8 19.1
CLMV/World 0.71 0.73 0.79 0.76 0.73 0.86 0.96 0.91 0.89 0.82 0.84
ASEAN/World 11.56 11.72 10.84 11.37 11.51 11.10 11.18 10.39 9.70 9.80 9.74
Source: Korea International Trade Association (KITA).

267
Table 2: Korea's exports to and imports from CLMV by country and year (1995~2006) (US$ in million)
Cambodia Laos Myanmar Vietnam
Export Import Export Import Export Import Export Import
1995 87 13 1,351 194
1996 8 2 130 18 1,599 232
1997 52 2 7 2 137 17 1,603 239
1998 62 1 5 0 148 13 1,361 184
1999 80 5 10 2 187 16 1,445 264
2000 96 2 4 1 289 23 1,686 322
2001 102 7 6 0 232 51 1,732 386
2002 115 3 4 0 143 56 2,240 470
2003 106 4 8 0 184 29 2,561 511
2004 126 7 9 1 162 30 3,256 673
2005 144 6 14 2 120 56 3,432 694
2006 205 5 23 18 121 96 3,927 925
Source: Korea International Trade Association (KITA).
Trade between Korea and the other countries was reactivated only after the Indochina
region opened its door and started to convert to the market economic system.
Trade with Cambodia started in 1997 when the two countries restored their
diplomatic relation. If the volume of trade was only USD 54 million in 1997, this has
increased almost four times to USD 210 million by 2006. Korea has maintained trade
surplus with Cambodia, which continues to rise.
Korea and Laos reestablished their diplomatic relation in 1995 and started trading
the following year. While there has been trade between the two countries before, the
volume was very small. However, from USD 10 million in 1996, this has increased to
USD 41 million by 2006. Korea’s trade surplus with Laos has been steadily expanding.
Trade between Korea and Myanmar has been ongoing since the 1960s but in small
quantity. Things changed in the 1990s when the two countries began to trade actively.
The trade volume, which was USD 100 million in 1995, reached an all-time high of
USD 312 million in 2000. As of 2006, it was estimated at USD 217 million. Korea has
been maintaining trade surplus with Myanmar as well.

268
Table 3: Korea's exports to CLMV countries by commodity (2006) (US$ in thousand)
Cambodia Laos MTI code Commodity Value MTI
Code Commodity Value
Total Sum 205,093 Total Sum 23,328
43 Fabrics 82,122 74 transporter 18,928
44 made-up textiles 39,437 81 industrial electronic articles 693
74 Transporter 36,185 84 heavy electric equipment 575
81 industrial electronic articles 6,696 32 articles of rubber 435
62 nonferrous metal products 6,499 61 articles of iron or steel 396
72 special machine 6,498 22 precision chemistry 309
22 precision chemistry 4,694 71 general machine 308
33 articles of leather or fur 2,306 1 agricultural products/farm produce 247
71 general machine 2,123 83 electronic components 245
42 Yarn 1,906 43 fabrics 240
Myanmar Vietnam
MTI code Commodity Value MTI
Code Commodity Value
Total Sum 121,311 Total Sum 3,927,47643 Fabrics 18,945 43 fabrics 639,94972 special machine 17,537 13 mineral fuels 524,81521 Petrochemicals 13,918 61 articles of iron or steel 350,40961 articles of iron or steel 9,226 21 petrochemicals 324,510
31 articles of plastic rubber or leather 9,084 81 industrial electronic articles 314,941
44 made-up textiles 8,688 72 special machine 214,37133 articles of leather or fur 7,455 62 nonferrous metal products 212,51222 precision chemistry 7,345 74 transporter 169,795
25 materials of paper or articles of paper 4,313 22 precision chemistry 167,202
51 miscellaneous goods/sundries 3,323 44 made-up textiles 123,417
Source: Korea International Trade Association (KITA).
Korea has been trading with Vietnam since the 1980s although the volume was
small. Changes occurred, however, in 1986 when Vietnam took the road to reform and
opened its market. In 1992, the diplomatic relation between the two countries was
revived and since then, significant improvements in trade were seen. In 1991, trade
volume amounted to USD 240 million but this has increased almost 20 times to USD
4,852 million as of 2006. Same with the others, Korea has been maintaining trade

269
Table 4: Korea's imports to CLMV countries by commodity (2006) (US$ in thousand)
Cambodia Laos
MTI code Commodity Value MTI
code Commodity Value
Total Sum 5,461 Total Sum 17,76044 made-up textiles 3,549 62 nonferrous metal products 14,21174 Transporter 853 51 miscellaneous goods/sundries 1,578
62 nonferrous metal products 430 1 agricultural products/farm produce 1,125
3 forest products 204 3 forest products 615
51 miscellaneous goods/sundries 97 44 made-up textiles 231
1 agricultural products/farm produce 71
33 articles of leather or fur 69
63 table wares 61
81 industrial electronic articles 43
4 fishery products 13
Myanmar Vietnam
MTI Code Commodity Value MTI
Code Commodity Value
Total Sum 96,433 Total Sum 924,85613 mineral fuels 50,738 4 fishery products 206,48244 made-up textiles 18,411 44 made-up textiles 88,161
3 forest products 15,455 1 agricultural products/farm produce 87,479
1 agricultural products/farm produce 5,140 42 Yarn 84,689
4 fishery products 4,715 51 miscellaneous goods/sundries 83,40651 miscellaneous goods/sundries 724 3 forest products 71,45559 other livingware 223 52 Furniture 54,60852 Furniture 172 13 mineral fuels 46,51174 Transporter 160 84 heavy electric equipment 23,89572 special machine 138 43 Fabrics 19,154
Source: Korea International Trade Association (KITA).
surplus with Vietnam, which amounted to USD 3 billion in 2006. This can be attributed
to the rapidly increasing ODI from Korea to Vietnam.
Korea’s export items to CLMV countries (MTI, 2 units) follow a similar pattern
for each country. In general, the foremost item is fabrics followed by mineral fuels,
articles of iron or steel, industrial electronic articles, special machine, and transporter.
Only in Laos is transporter the number one item.

270
In contrast with its export pattern, Korea’s import pattern varies with each country.
Made-up textiles take up over 60 percent of Korea’s import from Cambodia, followed
by transporter. Most of its import from Laos, meanwhile, is nonferrous metal products.
Mineral fuels take up half of its total import from Myanmar, followed by fabrics and
forest products. Fishery products including shrimp are Korea’s foremost import item
from Vietnam, followed by fabrics, agricultural products/farm produce, yarn, and
miscellaneous goods/sundries.
3.2 Overseas Direct Investment (ODI)
3.2.1 Overall feature
Korea’s ODI has been active since the late 1980s. In that period, most investments went
to Southeast Asia, including Indonesia, but scarcely reached the CLMV countries.
Investment to CLMV countries commenced in the early part of 1990s when the region
began to pursue reformation and converted to a market economy. It was also during this
period when CMLV restored their diplomatic relations with Korea. Investments
increased drastically in the early 1990s but fell during the East Asian crisis and again
rose from 2000. Especially in 2005 and 2006, Korea’s ODI to CLMV countries
registered a groundbreaking increase, taking up 5.5 percent and 10.5 percent,
respectively, of the total (in terms of investment approval). Meanwhile, the actually
implemented amount is lower than the numbers and appears to be around 44 percent.
In terms of ODI of CLMV countries to Korea, it is noticeable that the investment of
early-stage developing countries is still small. As of the end of 2006, their ODI to Korea
is only USD 3.2 million from 41 projects, with Vietnam contributing the biggest part.

271
Table 5: Korea's ODI to CLMV countries by year (1980~2006)
(Number, US$ in million, %) Acceptance Investment
Year No. of projects Amounts ASEAN/
World CLMV/World
Amounts ASEAN/ World
CLMV/ World
1980 2 0.02 29.0 0.0 0.02 30.7 0.0
1981 0 0 11.4 0.0 0 14.1 0.0
1982 0 0 0.7 0.0 0 5.8 0.0
1983 0 0 32.8 0.0 0 25.1 0.0
1984 0 0 1.0 0.0 0 18.9 0.0
1985 0 0 2.3 0.0 0 14.3 0.0
1986 0 0 0.3 0.0 0 0.8 0.0
1987 0 0 45.1 0.0 0 31.2 0.0
1988 0 0 73.8 0.0 0 14.8 0.0
1989 0 0 21.6 0.0 0 16.1 0.0
1990 3 58.7 30.4 2.6 9.5 25.0 1.0
1991 2 64.0 22.4 3.6 5.2 29.6 0.5
1992 21 103.5 13.4 5.1 22.4 22.3 1.8
1993 42 118.1 12.6 5.9 29.5 13.3 2.3
1994 60 186.0 15.4 5.1 92.7 11.2 4.0
1995 53 228.0 15.0 4.4 185.5 19.7 6.0
1996 57 247.4 11.5 3.5 109.4 10.3 2.5
1997 54 239.5 17.8 3.9 175.7 16.8 4.7
1998 17 116.2 12.6 2.0 93.9 10.6 2.0
1999 30 78.8 9.2 1.5 53.8 13.9 1.6
2000 48 129.4 11.4 2.1 82.2 9.3 1.6
2001 70 110.0 7.8 1.7 64.0 7.5 1.2
2002 129 395.1 10.3 6.3 150.5 9.5 4.1
2003 113 730.1 22.3 13.1 166.8 13.4 4.1
2004 137 367.9 9.0 4.7 194.6 8.6 3.2
2005 216 494.6 10.3 5.5 336.3 9.9 5.1
2006 348 1,937.2 20.0 10.5 711.7 12.6 6.6
Cumulative 1,402 5,604.5 15.3 5.3 2,483.7 12.3 3.6
Source: The Export-Import Bank of Korea.

272
Table 6: Investment of CLMV and ASEAN to Korea by country (~2006)
No. of Projects Amounts(US$ in thousand)
Singapore 480 2,188,993
Malaysia 482 3,261,036
Indonesia 39 109,494
Thailand 62 9,314
Brunei 7 1,268
Philippines 52 120,284
Cambodia 2 98
Laos 1 202
Myanmar 15 730
Vietnam 23 2,173
CLMV
Sub-total 41 3,203
ASEAN Total 1,158 5,693,594
Source: Ministry of Commerce, Industry and Energy of Korea.
3.2.2 Korea's ODI to Cambodia
Korea’s ODI to Cambodia intensified when their diplomatic relation was restored but it
went down during the East Asian crisis. However, it began to recover beginning in 1999.
The volume amounted to over USD 109 million and 173 million, respectively, in 2005
and 2006. The actually implemented investment reached USD 209.26 million for 151
projects with an implementation rate of 57 percent.
By industry, manufacturing, which includes fabrics and sewing, takes up 28
percent of the ODI. Recently, it is expanding to the sectors of construction, real estate,
and services. Investment on the financial sector, however, has yet to be seen.

273
Table 7: Korea's ODI to Cambodia by year (1992~2006)
(numbers, US$ in thousand) Acceptance Investment
Year No. of Projects Amounts No. of Projects Amounts
1992 1 1,919 1 1,300
1993 0 0 0 319
1994 1 2,300 1 900
1995 1 500 1 258
1996 10 10,157 6 3,798
1997 14 18,067 10 5,845
1998 5 2,176 4 898
1999 7 8,850 8 6,475
2000 6 9,276 6 3,516
2001 7 8,267 5 5,540
2002 9 8,510 9 4,107
2003 9 3,987 9 9,670
2004 9 7,657 8 13,653
2005 35 109,290 31 30,859
2006 51 173,565 52 122,125
Cumulative 165 364,521 151 209,263
Source: The Export-Import Bank of Korea.
According to statistics of the Cambodian government (on approval basis), Korea’s
investment to Cambodia amounted to USD 257 million from 2000 to 2006, making
Korea the third largest investor in Cambodia, next to China and Russia, in terms of total
foreign direct investment. Korea’s investment to Cambodia peaked in 2002, 2005, and
2006.

274
Table 8: Korean investment to Cambodia by sector (cumulative figure to 2006) Acceptance Investment
Sector No. of
Projects
Amount (US$ in
thousand)
No. of Projects
Amount (US$ in
thousand) Agriculture & Fishery 4 3,120 3 380
Mining 3 15,136 3 18,503
Manufacturing 57 101,892 50 58,518
Construction 25 86,422 24 27,350
Whole Sale & Retail 20 23,231 18 9,162
Transport & Storage 5 4,892 4 4,145
Telecommunications 3 9,349 3 8,050
Lodging & Restaurants 8 3,301 8 2,616
Service 31 47,483 30 21,736
Real Estate 9 69,695 8 58,803
Cumulative 165 364,521 151 209,263
Source: The Export-Import Bank of Korea.
Figure 1: Korea's investment approvals by Cambodian government (Total fixed assets: US$ in thousand)
Source: International Monetary Fund (August 2007).
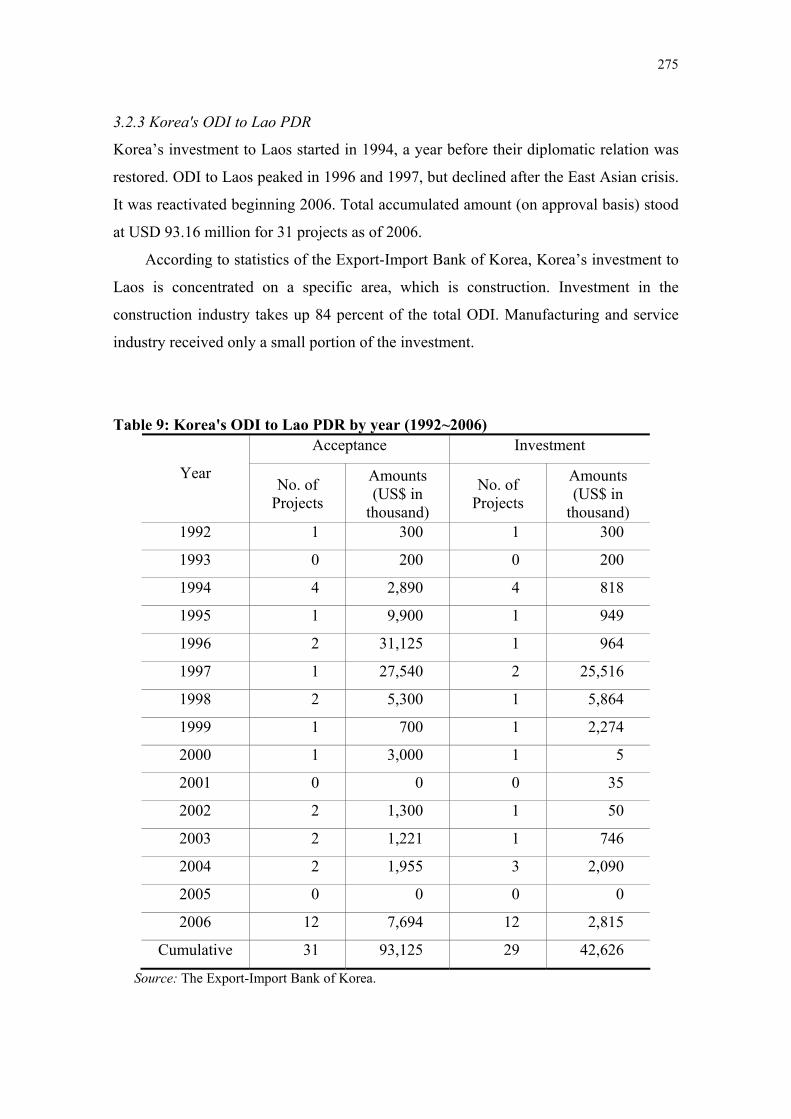
275
3.2.3 Korea's ODI to Lao PDR
Korea’s investment to Laos started in 1994, a year before their diplomatic relation was
restored. ODI to Laos peaked in 1996 and 1997, but declined after the East Asian crisis.
It was reactivated beginning 2006. Total accumulated amount (on approval basis) stood
at USD 93.16 million for 31 projects as of 2006.
According to statistics of the Export-Import Bank of Korea, Korea’s investment to
Laos is concentrated on a specific area, which is construction. Investment in the
construction industry takes up 84 percent of the total ODI. Manufacturing and service
industry received only a small portion of the investment.
Table 9: Korea's ODI to Lao PDR by year (1992~2006) Acceptance Investment
Year No. of
Projects
Amounts
(US$ in thousand)
No. of Projects
Amounts
(US$ in thousand)
1992 1 300 1 300
1993 0 200 0 200
1994 4 2,890 4 818
1995 1 9,900 1 949
1996 2 31,125 1 964
1997 1 27,540 2 25,516
1998 2 5,300 1 5,864
1999 1 700 1 2,274
2000 1 3,000 1 5
2001 0 0 0 35
2002 2 1,300 1 50
2003 2 1,221 1 746
2004 2 1,955 3 2,090
2005 0 0 0 0
2006 12 7,694 12 2,815
Cumulative 31 93,125 29 42,626
Source: The Export-Import Bank of Korea.

276
Table 10: Korea's ODI to Lao PDR by sector (cumulative figure) Acceptance Investment
Sector No. of
Projects
Amounts
(US$ in thousand)
No. of Projects
Amounts
(US$ in thousand)
Agriculture & Fishery 1 980 1 201
Mining 1 2,500 1 1,087
Manufacturing 7 3,524 7 2,536
Construction 6 77,990 6 34,173
Whole Sale & Retail 7 2,360 7 843
Transport & Storage 1 130 0 0
Lodging & Restaurants 2 2,400 2 1,900
Service 6 3,241 5 1,886
Total 31 93,125 29 42,626
Source: The Export-Import Bank of Korea.
Figure 2: Korea's investment approvals by Lao government (Numbers, US$ in million)
Source: Lao Government.

277
Moreover, based on statistics, Korea’s investment to Laos (on the approval basis)
has amounted to USD 274.19 million for a total 99 projects from 2000 to March 2007,
and has posted a rapid growth in 2006 and 2007. As of March 2007, Korea ranked
eighth in total FDI in Laos. It invested heavily on the development of Laos’ waterpower
resources.
Table 11: Korea's ODI to Myanmar by year (1990~2006) Acceptance Investment
Year No. of
Projects
Amounts
(US$ in thousand)
No. of Projects
Amounts
(US$ in thousand)
1990 3 58,700 2 9,450
1991 2 64,034 1 5,188
1992 1 170 1 4,034
1993 2 2,000 2 984
1994 6 1,965 3 399
1995 5 1,490 5 1,410
1996 6 5,344 6 3,302
1997 10 13,165 8 5,481
1998 1 3,768 1 6,106
1999 4 5,485 2 4,843
2000 11 20,473 10 8,699
2001 8 3,178 6 2,948
2002 1 2,401 1 660
2003 1 2,602 1 496
2004 0 455 0 0
2005 0 830 0 969
2006 2 470 2 465
Cumulative 63 186,530 51 55,434
Source: The Export-Import Bank of Korea.

278
3.2.4 Korea's ODI to Myanmar
Korea and Myanmar has maintained diplomatic relation since 1975. Korea’s ODI to
Myanmar peaked in 1990 and 1991 but grew inconsistently since then. The decline has
been drastic from 2001. This decline has been attributed to a number of factors,
particularly to the embargo on Myanmar imposed by the international community, the
ongoing unstable political and social conflicts within the nation, and its poor condition
for investment. Korea’s total ODI (on approval basis) was recorded at USD 186.53
million for 63 projects as of 2006.
Korea’s ODI to Myanmar is focused on the manufacturing industry including
fabrics and sewing, which takes up 58 percent of total investment. In addition to this,
lodging and restaurant business are getting a considerable portion of the investment.
According to statistics from the Myanmar Investment Commission, Korea’s
investment to Myanmar (on approval basis) accumulated to USD 191 million as of June
2006, considered a small amount compared to its investment in other Southeast Asian
countries. Korea ranks in 12th place in total foreign investment in Myanmar.
Table 12: Korea's ODI to Myanmar by sector (cumulative figure) Acceptance Investment
Sector No. of
Projects
Amounts
(US$ in thousand)
No. of Projects
Amounts
(US$ in thousand)
Agriculture & Fishery 1 2,793 1 506
Mining 1 170 1 170
Manufacturing 42 108,029 34 40,792
Whole Sale & Retail 14 14,547 12 13,135
Lodging & Restaurants 1 60,000 0 0
Service 4 991 3 831
Total 63 186,530 51 55,434
Source: The Export-Import Bank of Korea.

279
Table 13: Approved FDI to Myanmar by Country (As of June 2006) Amounts (US$ in million) Share (%)
Thailand 7,375 53.39
UK 1,590 11.52
Singapore 1,434 10.38
Malaysia 660 4.78
Hong Kong 504 3.65
France 470 3.40
USA 243 1.76
Indonesia 241 1.75
The Netherlands 238 1.73
Japan 215 1.56
China 193 1.41
Korea 191 1.38
Total 13,815 100.00
Source: Myanmar Investment Commission.
3.2.5 Korea's ODI to Vietnam
Korea’s ODI to Vietnam has increased drastically since Vietnam emerged as a strong
newly emerging market following its Doi Moi reforms. Korea’s ODI to Vietnam surged
with the restoration of their diplomatic relation but declined after the East Asian crisis.
Nevertheless, it was reactivated from 2002 and reached USD 1,755.52 million for 283
projects in 2006. Vietnam took the third spot in total Korean ODI, following China and
the US. Korea’s ODI to Vietnam started to expand rapidly from the end of 200 and this
trend is expected to last for a while.
The manufacturing industry, including textiles and garments, machine equipment,
electronics and communication equipment, and shoes and leather, receives 50 percent of
total Korean ODI to Vietnam. The mining industry, which is related to oil and gas, takes
up a big portion of investment, and recently, investment on construction, hotel and
restaurant, and real estate is on the rise. Since 2005, when investment started to increase
rapidly, investment on basic materials industry including steel manufacturing, and
development of new cities and resorts for tourists exhibit an increasing trend.

280
Table 14: Korea's ODI to Vietnam by year (1980~2006) Acceptance Investment
Year No. of
Projects
Amounts
(US$ in thousand)
No. of Projects
Amounts
(US$ in thousand)
1980 2 20 2 20
1992 18 101,156 8 16,775
1993 40 115,857 17 28,017
1994 49 178,815 44 90,583
1995 46 216,076 36 182,868
1996 39 200,751 38 101,324
1997 29 180,702 25 138,883
1998 9 104,937 4 81,075
1999 18 63,785 17 40,170
2000 30 96,675 29 69,954
2001 55 98,575 47 55,475
2002 117 382,858 100 145,686
2003 101 722,351 96 155,886
2004 126 357,803 112 178,882
2005 181 384,435 172 304,458
2006 283 1,755,523 276 586,321
Cumulative 1,143 4,960,319 1,023 2,176,377
Source: The Export-Import Bank of Korea.
Korean ODI to Vietnam is mainly focused on the manufacturing industry,
particularly on textiles and garments, machine equipment, electronics and
communication equipment, basic metals, and shoes and leather. Investment on
petrochemical products and transportation equipment has been on the rise.

281
Table 15: Korea's ODI to Vietnam by sector (cumulative figure) Acceptance Investment
Sector No. of
Projects
Amounts
(US$ in thousand)
No. of Projects
Amounts
(US$ in thousand)
Agriculture & Fishery 16 18,663 14 8,453
Mining 7 1,471,706 5 456,259
Manufacturing 913 2,516,217 818 1,359,774
Construction 48 274,647 45 52,984
Whole Sale & Retail 32 34,203 26 17,554
Transport & Storage 12 20,248 11 15,853
Telecommunications 2 15,014 1 2,819
Lodging & Restaurants 23 219,204 19 98,747
Service 69 174,637 63 53,710
Real Estate 21 215,780 21 110,224
Total 1,143 4,960,319 1,023 2,176,377
Source: The Export-Import Bank of Korea.
There are many Korean financial institutions in Vietnam as well. Based on the
approval data of the Financial Supervisory Services, three local subsidiaries, four
branch offices, and 11 resident offices opened in Vietnam. These institutions consist of
five banks, four stock/investment trust companies, four nonlife insurance companies,
and one life insurance company. Korea’s investment on Vietnam’s stock market has
been exhibiting a drastic upsurge as well, with over USD 1 billion invested on 13 funds
as of the first half of 2007.
Statistics clearly demonstrate the remarkable increase of Korea’s investment to
Vietnam. On approval basis, Korea emerged as number one foreign investor in Vietnam
as of the second half of 2007. It was the fourth largest investor in 2005 and third in 2006.
The Korean investment boom to Vietnam began toward the end of 2005. By 2006,
Korea’s investment to Vietnam was over USD 2.6 billion and reached USD 1.7 billion
as of August 2007.

282
Table 16: Korea's ODI to Vietnam by manufacturing sector (cumulative figure)
Acceptance Investment
No. of
Projects
Amounts
(US$ in thousand)
No. of Projects
Amounts
(US$ in thousand)
Food & Beverages 34 101,282 30 72,980
Textiles & Garments 320 705,881 289 436,619
Shoes & Leather 100 263,658 95 188,466
Wooden Furniture 24 15,352 23 6,506
Papers & Printing 27 32,475 23 9,719
Petrochemical products 106 169,843 97 84,377
Nonmetallic minerals 20 49,491 14 13,510
Basic metals 30 272,020 25 104,600
Fabricated metals 44 83,680 40 37,192
Machine equipment 58 314,636 52 63,566
Electronics & Communication equipment
35 294,482 28 240,412
Transportation equipment 36 128,756 34 58,891
Others 79 84,661 68 42,936
Total 913 2,516,217 818 1,359,774
Source: The Export-Import Bank of Korea.

283
Figure 3: Korea's investment approvals by Vietnam government (Number, US$ in million)
Source: Ministry of Planning and Investment of Vietnam.
3.3 Tourism and the Korean Wave (Hallyu)
Since the 1990s, increased incomes from economic growth and liberalization on
traveling to foreign countries have increased the Korean overseas tourism. While
Southeast Asia is a popular destination of Korean tourists, CLMV countries are quickly
emerging as a favorite new destination after the region opened its doors to foreigners
and underwent economic reforms in the late 1990s. From year 2000, the Ha Long Bay
in Vietnam, Angkor Wat in Cambodia, and Bagan in Myanmar have emerged as
popular tourist destinations. Many direct flights to the region and increased ODI to
these countries are the other reasons behind this booming tourism.
In particular, Vietnam and Cambodia have interested Koreans. Korean tourists to
Vietnam amounted to over 420,000 out of the total of 3,580,000 foreign tourists in 2006,
or 11.8 percent, the second largest group next to China. From 130,000 in 2003, Korean
tourist arrivals have shown a yearly increase of 30 to 40 percent and this trend is
expected to last in the future. In Cambodia, Koreans occupy the top place since they
have taken 12.2 percent of the total number of foreign tourists in 2004. As of 2006, 16.7
percent of the total of 1,700,000 foreign tourists who visited Cambodia is Korean. In
spite of their rich tourism resources, however, Laos and Myanmar have not been able to

284
Table 17: Korean tourist in Vietnam and Cambodia by year (2003~06) 2003 2004 2005 2006
Tourist (1,000) 130.1 233.0 317.2 421.7
Growth rate (%) 23.8 79.1 36.1 29.4 Vietnam
Korean/Total (%) 5.4 8.0 9.1 11.8
Tourist (1,000) 62.3 128.4 216.6 220.9
Growth Rate (%) 106.1 68.7 2.0 Cambodia
Korean/Total (%) 8.9 12.2 15.2 16.7
Source: Ministry of Tourism of Cambodia, Vietnam National Administration of Tourism
attract Koreans due to their poor infrastructure, although the number of Korean tourist
has recently shown signs of increasing.
In addition, the Korean wave or pop culture, also referred to as “Hallyu,” has
spread everywhere in Vietnam since the 2000s. Due to the expansion of economic and
human resources exchange, the Korean culture has been spreading rapidly in Vietnam.
Korea’s outstanding economic achievements, its success in the World Cup, and the
rapid development of its entertainment industry have all contributed to the success of
the Korean pop culture. From TV dramas, movies, music, and games, to fashion and
food, the Korean wave has invaded the CLMV region. Now very popular in Vietnam,
the Korean wave has also begun to penetrate Myanmar and Cambodia.
4. ECONOMIC COOPERATION WITH CLMV COUNTRIES: GOVERNMENTAL COOPERATION
4.1 Korea’s ODA policy and strategy toward CLMV countries
Having reached the status of a newly industrialized economy (NIE), Korea started
providing official development assistance (ODA) in mid-1980s. The establishment of an
Economic Development Cooperation Fund (EDCF), a kind of concessional loan, in
1987, under the auspices of the Export-Import Bank of Korea (Korea Eximbank),
marked the beginning of Korea’s ODA. While the EDCF provided loans to developing
countries to help strengthen their industrial capacity, assist in the stabilization of their

285
economies, and promote economic ties with Korea, the Korean government went
another step forward. In 1991, it established the Korea International Cooperation
Agency (KOICA), which has since then been responsible for grant-type ODA. The
development assistance programs of Korea are largely managed by these two
institutions. Considering the fact that (East) Asia emerged as Korea’s largest trading
partner, the recent ODA of Korea has concentrated in this region. To assist in the
economic development and public welfare improvement in developing countries, Korea
has been increasing its ODA on a regular basis. Between 1995 and 2005, it increased
from USD 110 million to USD 750 million.
Table 18: ODA and EDCF primary aid recipients of Korea (2006) Region KOICA(18 Countries) EDCF(11 Countries)
Asia Vietnam, Indonesia, Philippines, Cambodia, Laos, Mongolia, Bangladesh, Sri Lanka
Vietnam, Indonesia, Philippines, Cambodia, Bangladesh, Sri Lanka, Pakistan
Latin America and the
Caribbean
Guatemala, Paraguay, Peru Guatemala, Colombia
East Europe and CIS
Uzbekistan, Kazakhstan
West Asia Yemen
Africa Ghana, Ethiopia, Kenya, Congo, Tanzania
Angola
Source: The Office for Government Policy Coordination (2006).
Korea has raised the loan to Southeast Asian countries through the EDCF and has
maintained close relations in politics and economy. In particular, Korea plans to include
Vietnam along with Indonesia and Philippines in the category of primary aid recipients,
and expand the aid for these countries after 2007. By making a Framework Agreement
with these primary recipient countries, the Korean government plans to simplify the aid
procedure. Meanwhile, Cambodia is selected as a secondary aid recipient. Myanmar and
Laos are also included in the list of aid recipient countries.2
2 In the ODA policy of Korea, primary aid recipients are selected among countries with GDP of less than 5,000 per capita and in consideration of the development potential of the recipient country, the economic cooperation level of the two countries, and diplomatic considerations. While there are

286
Similar to the EDCF, grant-type ODA has been enhanced for Southeast Asian
countries as well. This aid has especially focused on CLMV countries to support these
emerging markets and build a base to expand economic cooperation with Korea. The
increasing demands for development and the high potential for economic collaboration
in this region account for this aid strategy.
4.2 EDCF and grant-type ODA
4.2.1 Overall feature
From the beginning, Southeast Asia has been the biggest recipient of Korea’s EDCF;
about one third of EDCF has gone to this region. From a total of 80 countries worldwide,
Indonesia had the biggest share; Vietnam was in third place; Cambodia was in sixth
place; and Philippines was in seventh place. Myanmar and Laos were in the twelfth and
twenty-eighth spots, respectively. The CLMV region has received a total of USD
494.65 million or 18 percent of the total EDCF. This ratio would be higher if the aid to
Vietnam of USD 100 million in 2007 is added.
As for bilateral grant support, Southeast Asia has been the main recipient;
one-fourth of total grant-type ODA has gone to this area. Again, Indonesia, Vietnam,
Philippines, Cambodia, and Laos were among the main recipients. The CLMV region
has received 45 percent of the aid allocated to Southeast Asia.
currently 80 EDCF aid recipients at the end of 2006, these countries are classified into 11 primary aid recipients and 69 common countries. The selection is made by considering the income standard of the concerned participant and its economic cooperation relationship with Korea, among other criteria. The interest rate (0.5~3.0%) and repayment period (25~30 years) are applied in grades by classifying them into groups from I to V by considering their income standard, among other factors. In case of the grant administered by the KOICA, the government of the recipient country makes the request directly to the Korea government or is selected by the embassies and delegations abroad, the regional office of KOICA, or through the Ministry of Foreign Affairs.

287
Table 19: Korea's usage of EDCF to ASEAN by country (~2006)
Loans Overseas Investment
Credit Rank1) Country
No. of Projects
Amounts (US$ in million)
Share(%)1) No. of Projects
Amounts (US$ in million)
1 Indonesia 13 271.70 9.8 1 1.28
3 Vietnam 10 227.96 8.1
6 Cambodia 6 159.29 6.4
7 Philippines 8 130.78 4.6 1 0.86
12 Myanmar 6 84.70 2.9
28 Lao PDR 1 22.70 0.9
ASEAN Total 44 897.13 32.7 2 2.14
CLMV Total 23 494.65 18.3
Remark: 1) Rank and Share are from Korea's total EDCF amount.
Source: The Export-Import Bank of Korea.
Table 20: Korea's grant-type ODA to ASEAN countries by year (2000~2006) (Approval, US$ in thousand)
Country 2000 2001 2002 2003 2004 2005 2006
Brunei 49 10 18.0 26 21 19 -
Indonesia 1,984 1,939 2,544 2,613 6,545 9,305 17,650
Malaysia 259 128 83 139 120 122 40
Philippines 2,224 3,038 1,729 5,964 6,366 5,059 6,644
Singapore - - - - - 0.2 -
Thailand 651 599 869 904 1,990 3,150 1,349
Cambodia 637 1,057 1,467 2,341 3,341 5,813 6,328
Lao PDR 629 681 1,262 2,048 3,379 2,119 4,243
Myanmar 730 651 1,406 1,460 2,045 3,407 2,794
Vietnam 4,880 4,814 4,700 3,515 9,789 9,290 7,873
ASEAN Total 12,043 12,917 14,078 19,010 33,596 38,284 46,921
ASEAN/World(%) 31.4 27.5 23.0 15.3 18.9 18.2 24.2
Source: Korea International Cooperation Agency.

288
4.2.2 Country-specific features
Korea’s grant to Cambodia has increased every year. Beginning 1991, Cambodia was
ranked 100th in terms of the amount of grant it received from Cambodia. By 2006, it has
jumped to sixth place. The main areas of aid are infrastructure construction, volunteers,
and projects.
Korea’s grant to Laos has been rapidly increasing as well. In 1991 when KOICA
started to offer grants, Laos ranked at 114th in terms of total received. However, in 2006,
it occupied the ninth spot out of 138 recipient countries. The main areas of aid are
volunteers, invitation of trainees, and infrastructure construction.
Table 21: Korea's grant to Cambodia (2001~06) Projects Unit 2001 2002 2003 2004 2005 2006
Total Amount 1,000 USD 1,056.06 1,764.85 2,340.72 3,340.97 5,813.20 6,328.39
1,000 USD 0 537.58 520.15 1,117.65 2,473.25 2,230.53Infra Construction
Number 0 1 1 2 4 3
1,000 USD 129.66 181.84 66.32 0 0 0Materials, Facilities
Number 3 3 2 0 0 0
1,000 USD 49.49 59.51 69.26 95.01 77.53 74.91Taekwondo Teachers
Number 1 1 1 1 1 1
1,000 USD 429.55 228.36 960.91 686.21 939.05 1,196.67Projects
Number 1 2 2 3 3 3
1,000 USD 366.09 589.94 534.68 437.38 477.64 619.37Invitation of Trainees
Number 112 128 136 108 92 113
1,000 USD 35.14 52.61 39.60 152.76 0 97.80Invitation of Experts
Number 3 2 2 3 0 2
1,000 USD 46.12 115.02 121.71 145.41 150.69 81.31Medical Doctors
Number 1 1 1 1 1 1
1,000 USD 0 0 24.79 678.34 1,542.56 1,728.60Volunteers
Number 0 0 4 43 75 113
1,000 USD 0 0 3.30 28.21 33.73 47.29Cooperation Agents
Number 0 0 1 2 5 5
1,000 USD 0 0 0 0 0 49.40Cooperation Doctors
Number 0 0 0 0 0 1
1,000 USD 0 0 0 0 118.74 202.52Assistance to NGOs
Number 0 0 0 0 3 3
Source: Korea International Cooperation Agency.

289
Table 22: Korea's grant to Laos (2001~06) Projects Unit 2001 2002 2003 2004 2005 2006
Total Amount 1,000 USD 680.4 1,418.99 2,028.35 3,378.88 2,118.64 4,242.53
1,000 USD 175.35 450.68 1,122.39 1,435.72 414.2 728.23Infra Construction
Number 2 2 3 3 3 2
1,000 USD 66.99 232.81 49.98 407.34 0 23.2Materials, Facilities
Number 2 3 1 1 0 1
1,000 USD 10.2 0 0 0 0 0Emergency Relief
Number 1 0 0 0 0 0
1,000 USD 0 0 0 0 0.35 519.53Projects
Number 0 0 0 0 0 1
1,000 USD 189.7 436 297.38 277.31 268.49 731.11Invitation of Trainees
Number 59 92 75 58 58 101
1,000 USD 0.53 0 29.1 109.03 63.96 100.18Invitation of Experts
Number 1 0 1 1 5 2
1,000 USD 58.15 0 0 0 0 0Medical Doctors
Number 1 0 0 0 0 0
1,000 USD 137.14 193.34 329.06 920.78 1,167.29 1,985.08Volunteers
Number 7 11 14 34 49 81
1,000 USD 8.1 65.15 94.63 113.82 104.24 99.71Cooperation Agents
Number 4 7 11 14 12 18
1,000 USD 0 0 53.73 68.01 69.92 55.48Cooperation Doctors
Number 0 0 1 1 3 2
1,000 USD 34.24 41.02 52.08 46.88 30.19 0Assistance to NGOs
Number 1 1 1 1 1 0
Source: Korea International Cooperation Agency.
Myanmar has also been one of main recipients of Korean aid but the amount of aid
is smaller than that for other East Asian countries due to Myanmar’s deteriorating
political and economic conditions. As of 2006, it ranked sixteenth out of 138 recipient
countries. The project area takes about half of its aid amount while the rest goes to
volunteers and invitation of trainees.

290
Table 23: Korea's grant to Myanmar (2001~06) Projects Unit 2001 2002 2003 2004 2005 2006
Total Amount 1,000 USD 651.2 1,574.4 1,460.42 2,045.07 3,407.37 2,794.24
1,000 USD 0 0 6.81 769.36 460.77 37.03Infra Construction
Number 0 0 0 2 2 1
1,000 USD 0 151.16 7.79 20.43 13.85 0Materials, Facilities
Number 0 1 1 1 2 0
1,000 USD 0 0 0 0 101.63 0Emergency Relief
Number 0 0 0 0 1 0
1,000 USD 171.82 297.81 520.35 235.59 947.33 1,441.94Projects
Number 1 2 2 3 3 3
1,000 USD 222.97 564.20 409.52 336.65 528.37 338.28Invitation of Trainees
Number 64 106 96 74 105 54
1,000 USD 69.19 42.43 21.63 37.43 25.94 0Invitation of Experts
Number 3 2 1 1 1 0
1,000 USD 44.58 111.32 107.40 129.49 55.04 0Medical Doctors
Number 1 1 1 1 1 0
1,000 USD 61.40 259.80 295.33 339.96 1,069.74 828.50Volunteers
Number 11 15 14 24 37 41
1,000 USD 5.26 35.82 59.37 101.26 81.87 74.73Cooperation Agents
Number 2 4 8 10 13 11
1,000 USD 75.98 83.14 1.83 47.33 32.26 73.76Taekwondo Teachers
Number 1 1 1 1 1 1
1,000 USD 0 28.71 30.38 27.57 90.57 0Assistance to NGOs
Number 0 1 1 1 2 0
Source: Korea International Cooperation Agency.
Since the restoration of diplomatic relation in 1992, the economic exchange
between Korea and Vietnam has increased tremendously. In 1991, Vietnam ranked
104th in terms of amount of aid received. By the 2000s, it has jumped to third place out
of 138 recipient countries. Foremost area of aid is infrastructure construction, which has
been heavily in demand considering the growth of the economy. Other areas include
volunteers, invitation of trainees, projects, and assistance to NGOs.

291
Table 24: Korea's grant to Vietnam (2001~06) Projects Unit 2001 2002 2003 2004 2005 2006
Total Amount 1,000 USD 4,814.11 4,705.65 3,514.61 9,789.17 9,289.57 7,873.33
1,000 USD 2,776.47 2,393.39 1,911.04 7,035.94 5,736.51 2,856.41Infra Construction
Number 7 8 7 5 8 8
1,000 USD 0 129.78 0 0 22.24 44.23Materials, Facilities
Number 0 2 0 0 1 1
1,000 USD 0 10.13 10.14 30.27 20.70 49.97Emergency Relief
Number 0 1 1 1 1 1
1,000 USD 546.11 580.33 15.09 95.04 526.85 826.20Projects
Number 2 2 1 1 2 3
1,000 USD 758.32 846.39 713.41 730.28 731.19 1,144.99Invitation of Trainees
Number 221 227 175 180 143 166
1,000 USD 75.85 50.24 37.82 45.80 23.02 69.40Invitation of Experts
Number 3 2 3 4 2 11
1,000 USD 0 0 0 104.76 72.63 96.57Medical Doctors
Number 0 0 0 1 1 1
1,000 USD 44.15 55.64 58.40 72.25 23.09 0Taekwondo Teachers
Number 1 1 1 1 1 0
1,000 USD 292.49 439.02 490.49 1,339.41 1,888.93 2,427.31Volunteers
Number 21 27 26 65 98 127
1,000 USD 124.75 76.11 118.36 188.46 142.79 169.59Cooperation Agents
Number 8 10 9 16 16 23
1,000 USD 87.67 53.25 80.85 26.56 0 0Cooperation Doctors
Number 2 2 1 1 0 0
1,000 USD 108.30 71.37 78.98 120.41 101.64 188.66Assistance to NGOs
Number 4 3 3 4 3 3
Source: Korea International Cooperation Agency.
4.3 Participation in programs to narrow the development gap within the East
Asian region Many programs and joint projects are being conducted in Southeast Asia to narrow the
development gap. This movement has been active since the inception of the “ASEAN
Plus Three (Korea, China, Japan) Framework.” These programs can be classified by a
program initiator or program objective, and the number of programs would increase if
specific programs or enterprises by certain countries are included. The best known

292
programs include the Greater Mekong Sub-region Economic Cooperation Program
(GMS Program) by the Asian Development Bank; the ASEAN - Mekong Basin
Development Forum, Initiative for ASEAN Integration (IAI), and Vientiane Action
Program (2005-2010) by the ASEAN; and the Plan for Private Sector Development in
the Greater Mekong Subregion by the United Nations Economic and Social
Commission for Asia and the Pacific (UNESCAP).
Korea has not only been working on concessional loan and grant for the least
developed among developing countries (LDDC) within Southeast Asia but also
participating in many projects to narrow the economic gap. Its support for the IAI and
the Korea·ASEAN Cooperation Project is a good example. Korea provided IAI with
USD 5 million for five projects until 2005. Korea also sent survey workers to inspect
the needs for additional aid and small-area development projects. The Korea-ASEAN
Cooperation Project, which began in 1990, has supplied a total of USD 34 million to
about 100 projects for human resource development and technology transfer by the end
of 2006. The yearly fund amount was USD 2 million, but the Korean government
increased it to USD 3 million yearly in recognition of ASEAN’s importance.
Table 25: Korea's assistance to IAI (5 projects)
project name(total amounts) recipient amounts
(USD)
1 TRN/02/005-Feasibility Study for the Missing Links and Spur Lines of the Singapore-Kunming Rail Link Project in CLMV(USD 830,000)
Cambodia Laos
Myanmar Vietnam
2 ETF/02/003-ICT Legislation(USD 2,635,656) Vietnam
3 ETF/02/005-e-Government(USD 3,800,380) Laos
4 EFT/02/002-National ICT Development Master Plans(USD 3,800,380) * ASEAN Request: USD 5,881,824
Myanmar
5 TRA/02/001-Capacity Building in the Trade in Goods and Trade in Services for CLMV Countries (USD 3,474,929)
Cambodia
5,000,000
Source: Jaewan Cheong, Yul Kwon, Yunjong Wang, and Satoru Okuda.(2005).

293
5. EVALUATION AND PROSPECTS OF THE ECONOMIC COOPERATION WITH CLMV COUNTRIES
5.1 Review and sector characteristic
Korea’s constant economic growth and the CLMV region’s rapid economic growth as a
newly emerging market call for increased economic cooperation between the two
regions. Above all, exchanges in the private sector, including export and import,
investment, tourism, and the diffusion of the Korean, wave, have been expanded.
Governmental cooperation through EDCF and grant has increased over the years.
Compared to others regions, CLMV have been a major recipient of Korean ODI. While
the economic exchange between Korea and Vietnam has increased rapidly since the Doi
Moi, that with Myanmar has been slow despite its high potential for development, due
to its deteriorating political and economic situation, and the international embargo.
Some specific patterns can be found in the economic exchange between Korea and
CLMV countries. First, Korea has maintained trade surplus with CMLV countries, a
good example of which is the USD 3 billion worth of surplus in trading with Vietnam.
The characteristics of the import-export structure follow some distinct pattern. Fabrics
are one of main export items of Korea to CLMV countries. Articles of iron or steel,
industrial electronic articles, special machine, and transporter are other main export
items of Korea to CLMV countries. As for imports from CMLV, made-up textiles,
nonferrous metal products, mineral resources, and agricultural products are among the
biggest items.
Second, Korea’s ODI has been focused on Vietnam. The Vietnam investment
boom, which started in the second half of 2005, has been active not only on “green
field-type FDI” but also on international portfolio investment (IPI) for stock and real
estate. In addition, the invested sectors have been diversified from the traditional
labor-intensive industries to basic materials industry such as steel, real estate
development, construction, and finance. In other countries, investment is concentrated
on manufacturing (Cambodia and Myanmar) and construction (Laos).
Third, in terms of governmental cooperation, CLMV countries have been receiving
more support as main recipients compared to other countries. In particular, Vietnam
earned the main recipient status and started to receive increased EDCF from 2007.
With the trend toward regionalism, many movements supporting economic

294
integration have emerged in the East Asian region. However, there has not been any
significant change between Korea and CLMV countries. Korea has been pursuing
simultaneous and multilateral FTA and a unified FTA with ASEAN so bilateral FTA
with CLMV countries seems not to be in the priority list. Meanwhile, support to narrow
the development gap in the region continues to become active, as the East Asian region
moves toward one unified market.
5.2 Prospects of economic cooperation with CLMV countries
The economic exchange between Korea and CLMV countries is expected to increase
steadily in the future as long as there is no sudden economic depression or crisis like the
one in 1997. The entire aspect of economic cooperation between the two areas such as
in the field of investment cooperation and foreign trade is expected to expand. Various
factors like the following would seem to make the economic cooperation between Korea
and CLMV countries more active.
First, the economic growth of the two areas would continue. On top of this, the
CLMV area is expected to grow even higher as a newly emerging market and
accordingly, the import market of the two areas would become even greater. Second, the
economic exchange between the two areas is envisaged to expand more as the pace of
economic integration within the region accelerates. This is because among the areas of
the Korea-ASEAN FTA, the field of commercial article has taken effect since June
2007 while the services field has also reached an agreement in 2007. Moreover, the fact
that discussions for economic integration of East Asia has intensified suggests that
greater economic cooperation between the two areas is underway. Third, the risks posed
by China due to sudden changes in the exchange rate of the yuan, expansion of
anti-foreign investment within China, increase in wages, and strong demands of the
Chinese government for technology transfer are expected to shift investment priorities
to CMLV countries. Specifically, Vietnam and Cambodia are anticipated to emerge as
supplementary investment destinations and this will further expand Korea’s investment
into CMLV. Such movement is already becoming a reality in Vietnam. Fourth, with
Korea’s goal of assuming a greater role in the international community, it is expected
that cooperation among the governments of the two regions will increase considerably.
Most of all, because Korea has achieved much success from being a recipient of

295
international aid after World War II to becoming an aid-giving country later, it will
steadily expand ODA funds into CLMV.
6. POLICY RECOMMENDATION FOR EXPANSION OF ECONOMIC COOPERATION
6.1 Policy recommendation for Korean government
To expand the economic cooperation between Korea and CLMV countries, a steady
economic growth for the latter is necessary most of all. While these development
countries lack experience or knowledge of economic development, Korea has a
successful experience in shifting from being a development aid recipient to a
development supporter by achieving the “miracle of Han River” and being recognized
globally for its information technology and infrastructure. Therefore, for a steady
economic growth of CLMV countries, the support of Korea in the areas of education
and training and transfer of economic development experiences is necessary. Especially,
the capacity building of CLMV countries is also important.
Considering the fact that the CLMV area consists of least developed countries and
the economic status of Korea is considerably higher, the support of the latter through the
expansion of ODA support and the application of the GSP is very important. Korea, in
fact, has been promoting to increase the ODA scale and preparing for its accession to
the OECD Development Assistance Committee. Improvement of the currently operated
GSP is also necessary. The preferential tariff toward least developed countries by Korea
is only applicable to 480 items in 2005, is very restrictive to the extent that it has not
even reached 0.1 percent, and mainly consists of the primary products manufactured by
least developed countries even for the subjected item. Accordingly, the GSP is unable to
materialize the initial purpose of the policy to support the industrial development of
developing countries. Therefore, it is necessary to expand the GSP so that the least
developed countries for which it is intended could benefit more.
Finally, improving the deepening trade imbalance between Korea and CLMV
countries is necessary. Such trade imbalance is in part a consequence of the expansion
of economic cooperation between the two areas. There are two explanations. First, the
mechanical equipment and material parts brought by Korean companies to CMLV as
part of their investment have increased rapidly. Second, a lot of machines, equipment,

296
materials, and parts for manufacturing export products are imported by CMLV from
East Asia including Korea, as part of CLMV’s export-driven growth strategy centered
on foreign invested companies. Despite this fact, the trade imbalance is an important
problem that needs an immediate solution. To make this improvement diversification of
import items by Korea is required.
6.2 Policy suggestion for CLMV countries
For CLMV countries to achieve a steady economic growth, the following policies
should be prioritized.
First, the development of competent workers who are key resources to manage the
national economy is necessary. Because this is a required factor for the establishment,
operation, and management of economic policy from the drafting of mid- to long-term
economic development plans, it should be a priority of CLMV countries.
Second, with CLMV countries shifting to a market economy system and adopting
an open door policy, the improvement of foreign investment environment is required
given that FDI and external trade act as driving forces of economic growth. Improving
the investment environment is necessary to attract more FDI inflows, which are
necessary to make up for the insufficient domestic capital and technology. To make this
happen, the improvement of transportation, power and communication infrastructure, as
well as law and system, is necessary.
Third, the aid provided by developed countries and international organizations is
an important development resource for least developed countries. Recently, a lot of aid
is going to CLMV countries. Therefore, in order to utilize such aid more effectively and
properly, the systematization and development of aid management organizations is also
necessary.
Fourth, continued restructuring of SOEs and further promotion of private sector
participation are required. The fact that all of the CLMV countries are called
“economies in transition” suggests that the restructuring of SOEs is extremely important.
In addition, the extended role of the private sector is also required for a steady economic
growth.
Finally, promoting the financial and capital markets is necessary. The development
of the financial industry, which is in charge of mobilizing and arbitrating financial

297
capital, is a crucial and indispensable precondition to manage the national economy
efficiently. The absence of a sound financial system leads to problems in raising enough
operation funds and investment capital. The introduction of an effective and clear
financial policy is clearly important to bring about effective reforms in CLMV
countries.
REFERENCES
Cheong, Jaewan,Yul Kwon, Yunjong Wang and Satoru Okuda. 2005. The Evolution of
ASEAN Plus Three Framework and Its Future Challenges. Seoul: Korea Institute
for International Economic Policy. (in Korean)
Cheong, Jaewan, Sung-Hoon Park, and Soonchan Park. 2006. Mid & Long-Term
Strategies towards an Advanced Trading Economy: Strengthening Cooperation in
the Global Economy. (in Korean)
International Monetary Fund. 2007. Cambodia: Selected Issues and Statistical Appendix.
Washington, D.C.
Korea International Cooperation Agency. 2007. 2006 KOICA Aid Statistics. Seoul. (in
Korean)
Korea International Trade Association. http://www.kita.net (Accessed 1 September
2007)
Ministry of Commerce, Industry and Energy of Korea. http://www.mocie.go.kr
(Accessed 2 September 2007)
Ministry of Finance and Economy of Korea. http://www.mofe.go.kr (Accessed 8
September 2007)
Ministry of Tourism of Cambodia. http://www.mot.gov.kh (Accessed 25 August 2007)
The Export-Import Bank of Korea. http://www.koreaexim.go.kr (Accessed 26 August
2007)
Vietnam National Administration of Tourism. http://www.Vietnamtourism.com
(Accessed 25 August 2007)

298
Chapter 9
THAILAND AND ITS COOPERATIVE DEVELOPMENT STRATEGIES FOR CLMV1 Santi Chaisrisawatsuk
“… (I)t’s important to remember the big picture: success means sustainable, equitable, and democratic development that focus
on increasing living standards, not just on measured GDP. Income is, of course, an important part of living standards, but
so too is health (measured, for instance, by life expectancy and infant mortality) and education.”
Joseph Stiglitz,
Making Globalization Work (2006)
1. INTRODUCTION: A REVIEW OF ECONOMY-WIDE
DEVELOPMENT in THAILAND
Thailand, like other developing countries, searches for policies that stimulate growth,
promote income distribution, reduce poverty and vulnerability, improve quality of life
and social welfare, diminish depletion of the environment and natural resources, and
ensure sustainability of overall economic development, and so on. With limited
available resources, Thai policymakers inevitably encounter several tradeoffs and 1
The introduction part of this paper was written in part by Dr. Anan Wattanakuljarus, Lecturer at School
of Development Economics, National Institute of Development Administration (NIDA), Bangkok,
Thailand. More details of the paper is given in “A Review of Economy-Wide Development Perspectives
in Thailand” Thai Journal of Development Administration, forthcoming.

299
opportunity costs as a result of their decisions. Once they choose one option, they may
lose on others. Once they solve one problem, others may arise. The forgone options and
side effects should not be ignored but must be taken into account anytime they make
critical decisions. Questions such as how choice of policies might affect various
economic development objectives; how impacts may be brought to bear on the
economy; how production and consumption patterns might change due to choice of
policies; how factor returns and resource allocation might alter, among others, should be
assessed thoroughly. By so doing, policymakers can optimize benefits and avoid
mistakes in the Cambodia, Laos, Myanmar, and Vietnam (CLMV) subgrouping.
From the policy point of view, such impacts are interrelated and should be
systematically observed and examined collectively in anticipation of the potential
repercussions of specific decisions. One of standard approaches serving this
requirement is the economy-wide approach. This first section aims to review some of
many works that provide an economy-wide perspective on Thailand’s economic
development. Although these works apply a similar approach, they focus on different
issues and views, and thus contribute distinct lessons.
The paper reviews literature that describes stylized facts and structural changes in
the Thai economy, provides possible effects of national and international policies on
Thailand’s economic development, and illustrates some issues in specific sectors of the
country. The final objective is to review major results, not methods, of these works.
Although a number of literature reviewed here may seem insignificant and a lot of
missing areas and contexts need to be reviewed further, at least it is the preliminary
attempt to provide a preliminary study of gather several works on the economy-wide
development of Thailand.

300
1.1 Thai Economy: Stylized Facts and Structural Changes
Facts or features of the Thai economy vary across studies, yet they are not totally
unique. They share some common characteristics even as they differ in other areas.
Some works attempt to describe and investigate ‘factors’ or ‘drivers’ for growth in
Thailand; some examine a decline in agriculture and a rise in manufactures and
services; still others study the possible side effects or adverse impacts of such structural
changes on Thailand.
A study of Siksamat (1998) examines five contributions to the economic growth of
the Thai economy during the period 1990-1995, namely, technology changes, changing
preferences, trade, investment, and general macroeconomic situation. The study finds
that the large and positive shift in exports and the favorable investment climate such as
a decline in required rate of return on capital are major sources of growth. Although
huge foreign direct investments or capital inflows strengthened growth in capital-
intensive manufacturing and service sectors, technology as a whole contributed little to
growth. This is a major concern for future policies.
The same study showed that primary agricultural sectors gained slightly from the
abovementioned growth factors. One possible reason for this is the lack of industrial
linkages, forward and backward, between agriculture and other growing sectors.
(Evidence of the lack of linkages between booming tourism service sectors and
agricultural sectors is also found in Wattanakuljarus (2006), which noted that only small
benefits from tourism service sectors are distributed among agricultural and poor
households.)
The above findings are similar to a work done by Diao et al. (2006), who, having
explored a Ramsey growth model for Thailand, has found that the extended high growth

301
in the country is not directly associated with advanced technology or high-skill intensity.
Openness and structural changes, they said, are the main sources of such growth. In
particular, these are the labor-intensive export manufacturing sector, an expansion of
domestic backward linkages, and a structural shift from agriculture to exportable
products.
Thailand has in fact experienced a relative decline in agriculture. This is the
conclusion of Martin and Warr (1994), who state that supply-side influences, e.g.,
capital accumulation, are the most important determinants of the decline in agriculture’s
share of GDP. Demand-side influences, operating through relative commodity prices,
are much less important. They suggest that further research on the cause of agriculture’s
relative decline in the process of economic development focus on the role of supply-side
influences, especially factor accumulation. Their findings also bear important
implications for policies affecting on economic development and structural changes.
Although agriculture becomes relatively less important to the Thai economy in
terms of GDP shares compared to manufactures and services, it has contributed to the
economic growth of Thailand (Warr 2006). He examines how agriculture contributes to
economic growth in Thailand and Indonesia during 1981-2002. He argues that although
agricultural output growth is slower than other sectors, agriculture is actually not a
stagnant sector. If agriculture had really been stagnant, economic growth would have
been substantially lower, because it would not have been possible to raise productivity
significantly within agriculture or to release resources massively while still maintaining
moderate growth of output. Warr concludes that the major contribution of agriculture to
economic growth is a reallocation of resources from agriculture to other sectors (i.e.,

302
industry and services) that can use these resources more productively, rather than an
expansion of agricultural outputs.
Growth and structural changes in Thailand are typically associated with
environmental and natural resource problems. Therefore, Thailand’s economic
development should be investigated within the framework of “development –
environment” relationship and vis-à-vis other economic “drivers” such as export-
oriented industries (EOI), import-substituting industries (ISI), domestic-oriented
industries (DOI) and factor intensity.
Coxhead and Jayasuriya (2003) view Thailand as a net food exporter with EOI
policies. Thailand has natural comparative advantage in food production. Growth in
manufactures is based on the expansion of labor-intensive, export-oriented
manufactures. Food crops are more relatively labor-intensive while tree crops are more
relatively land-intensive. The loss of forest cover or deforestation, the degradation of
arable land, and the pollution and emission from agriculture and manufactures are major
environmental problems for policy makers. They explain that growth of manufactures
generates a large increase in labor demand which is typically met by migration from
agricultural sector. This structural change raises the opportunity cost of agricultural
labor. The higher labor costs tend to reduce the profitability of forest clearance for
upland agriculture and to increase the relative returns to the less labor-intensive
plantation crops rather than labor-intensive food production. Given this occurrence,
higher labor costs tend to reduce deforestation although this may be offset to some
extent by the switch to relatively land-intensive plantation crops.
Empirically, Coxhead and Jayasuriya (2003) also investigate the environmental
effects of investment and trade policy reform during Thailand’s economic “miracle.”

303
They find that the growth of the Thai economy from the mid-1980s through 1997 was
driven by a boom in domestic and foreign investment. They assert that “rapid growth
created scale effects that have placed environmental and natural resources under
tremendous stress, while the composition effects of both the investment boom and trade
policy reform are mixed. Both appear to have been generally favorable for the
conservation of upper-watershed and forest resources, by raising labor wages and
making it more costly to engage in labor-intensive farming practices at the arable
margin. These environmental gains in rural areas have been offset, to an extent, by
increased demands on resources and environmental services in urban and industrial
areas.”
A study done by Coxhead and Plangpraphan (1998) concerns trends of land use
and employment in Thai agriculture during an economic boom. They conclude that land
use trends have been influenced by agricultural wage growth. Wage growth has been
driven by investment in the non-agricultural sectors. The economic boom stimulated a
pattern of change in economic structure that induced the terms of trade against
agriculture through wage growth. The boom generated incentives for agricultural
mechanization and land use shifts that may in turn have created irreversible changes in
agricultural technology and the resource base. Evidence shows that cultivation of
erosive and nutrient-depleting crops such as corn has actually expanded in upland and
highland provinces. This expansion of a relatively low value-added crop in more remote
and less productive upland and highland areas is because lower labor mobility
diminished the effects of the economy-wide boom on such areas.
Thailand’s economic development mentioned above is explored through structural
changes and key features of Thailand. Besides, Thailand’s path toward economic
304
development is partially from national toward international policies. Side-effects and
challenges of such policies are reviewed next.
1.2 Possible Effects of National and International Policies on Thailand’s Economic Development and Issues in Particular Sectors of Thailand
Munasinghe and Cruz (1995) cite several country-specific studies related to the links
between economy-wide policies and the environment. Firstly, Panayotou and
Sussangkarn (1991) argue that without a clear description of property rights, incentive
policies induced farmers to over-exploit fragile lands. Without adequate regulatory or
economic instruments, an industrial growth in Thailand came with major environmental
damages. Secondly, World Bank (1994) reports that the environmental impacts of
economic growth on Thailand are not only determined by the scale of economic activity
but also by the structure of the economy, the efficiency of input-use in energy and
industry, and the types of production technologies used. The Bank further states that
environmental concerns should be addressed earlier in the transition to growth so that
the adverse environmental impacts of expanded economic activities can be controlled or
prevented. Thirdly, short-term adverse effects of government cutbacks as a result of
high government expenditures for other areas may lead to a budgetary cut for
environmental activities. A study (Reed 1992) shows that a reduction in government
expenditures for adequate infrastructure can increase air pollution.
The environmental effects of tax reforms in Thailand are examined by Coxhead
(2000). Command-and-control measures such as emission regulation or specific
location of new factories have a more significant role than environmental taxes.
Consistent with the characteristics of protected industries in developing countries, the
import-substituting industries (ISI) of Thailand are relatively emissions-intensive than

305
other industries. Hence, any policies inducing a reduction of ISI’s outputs should gain
positive environmental effects. Thailand’s ISI are relatively less labor-intensive than the
economy-wide average. Based on this observation, Coxhead argues that trade
liberalization can generate two benefits: 1) a reduction of emissions due to a contraction
of ISI; and 2) an increase in labor demand and wage as other labor-intensive industries
expand. However, he suggests that even if the environmental benefits of general trade
liberalization are still uncertain due to a possible increase in overall emissions as
economy expands, selective reductions in trade barriers might reduce emissions.
For decades Thailand imposed rice export tax to raise government revenues and to
lower the domestic price of rice so that poor households that were not surplus rice
producers could purchase. Thailand’s rice export tax harmed the poor in rural and urban
areas (Warr 2001), as it reduced the income of unskilled workers who worked
intensively in the rice industry. Reducing the producer prices of rice also lowered the
real incomes of those rice farmers who either had or had no surplus to sell. It also
reduced the income of unskilled laborers engaged in non-farm activities. Such effects
actually dominate the gains from imposing a cheaper consumer price of rice. Warr
concludes, “ Cheap food policies are not necessarily in the interests of the poor--rural or
urban--because in addition to lowering the prices of staple foods, these policies can also
depress the equilibrium wages of unskilled labor, and the latter effect can dominate.” He
adds that the effects on equilibrium wages of unskilled labor become smaller as the
economy develops.
Trade liberalization. Thailand has entered into a series of trade liberalization
agreements, which are either multilateral or bilateral in nature. Stoeckel et al. (1997)
studied the benefits of the Asia Pacific Economic Cooperation (APEC) liberalization for

306
Thailand. They project that GDP growth in Thailand could be nearly 3.3 percent higher
in 2020 than it might otherwise be, and exports nearly 25 percent higher and welfare
over 6 percent up by 2020. Capital inflow – most of which comes from the United
States and other Organisation for Economic Co-operation and Development (OECD)
economies – allows Thailand to increase investment, production, and consumption. In
sum, trade and investment liberalization generates significant gains for Thailand. The
extra capital inflow makes the adjustment easier with careful management. They
suggest policymakers and financial markets be clear about what is driving the changes
as a result of liberalization. Also, the design of liberalization needs to be carefully
crafted.
Secondly, trade liberalization between Thailand and Japan is a source of
macroeconomic benefits for both countries, according to a report by the Japan-Thailand
Economic Partnership Agreement (JTEPA) task force (December 2003). The dynamic
impact of trade liberalization includes capital formation mechanism (i.e., an
accumulation of induced income, savings and investment), international capital
movements, and pro-competitive productivity growth effects. Gains in real terms could
be more significant in Thailand, but gains in absolute terms may not be so different. The
direction of the impacts on balance of payments is different between Japan and Thailand.
Trade balance tends to deteriorates in Japan but improves in Thailand. There are
international capital inflows in Japan but outflows in Thailand. The capital formation or
liberalization of investment has macroeconomic effects for Thailand. However,
successful structural adjustments such as trade reform, technical requirement, health and
quality standards are essentially required for Thailand to gain from this trade
liberalization.

307
Thirdly, according to Australia-Thailand Free Trade Agreement: Economic Effects
Report (2004), the gains to Thailand are larger than Australia’s, because the former has
higher barriers to trade, making it a less efficient economy than Australia. Thailand’s
GDP is projected to be 0.45 percent higher from 2020 onwards. The net present value of
the stream of production and welfare gains over 20 years are worth US$6.8 billion to
Thailand. It also improves efficiency in the domestic sectors, and so an increase in real
investment. Investment is expected to increase 0.38 percent above baseline in 2013, and
then reduce to 0.22 percent above baseline in 2026. The lowering of trade barriers is
associated with more efficient domestic industries, while improving access to markets
of the bilateral trading partner. All sectors experience an increase in output to meet
increased consumption, export, and investment demand. The largest absolute increase in
output will be in the services sector (0.7 percent higher output in 2025) due to the cost
reducing effect from trade liberalization.
The above results are beneficial sides of trade liberalization. Karunaratne (1998)
identified the favorable effects of trade liberalization as follows: lower wage inflation,
an increase in skilled and unskilled employment, gains to owners of factors used
intensively in export-oriented industries (EOI), cheaper imported inputs for EOI, an
increase in manufactured exports, significant improvement in industries that had been
protected during an import-substituting industrialization regime, and an improvement in
income distribution. The unfavorable or side effects of trade liberalization, according to
him, are loses to owners of factors used in import-substituting industries, an increase in
environmental pollution, a deterioration of Thai traditional culture, and greater
dependence of key sectors of the economy on foreign investments. These effects could
raise serious political and social threats.

308
Openness to world trade requires the economy as a whole and the sectoral
economies to adjust properly so that gains from trade liberalization are attained. Several
changes in health and quality standards and other non-tariff barriers are challenges to
policymakers and entrepreneurs. A case in point is an expansion or emergence of
seafood and other non-traditional export industries. The seafood industries are natural
resource-based export sectors for which the world demand has been strong and
increasing (Andersson et al. 2005).
The development of Thailand’s seafood industry started during the import
substitution period and relied on joint-ventures with foreign companies for acquiring
expertise and penetrating foreign markets. Since then the industry has received public
support for production and technology transfer and is increasingly becoming an active
export sector. However, issues such as natural resource management, access to
sustainable raw material, and non-tariff barriers in export markets (e.g., sanitary and
phyto-sanitary measures) are challenges for the industry. The active involvement of
industry associations in national policymaking can help design effective policy
responses to these issues, such as setting up of specialized agencies to enhance quality
control and certification and an awareness of standards among producers (e.g.,
Thailand’s National Food Institute). Industry players believe that a key factor for
successful adjustment has been the pro-active role of government in establishing an
enabling economic and policy environment that allows local firms to operate on a level
playing field and strengthen their competitive edge in international markets.
Another booming sector in Thailand is tourism. Tourism as a development strategy
in developing countries has steadily gained acceptance owing to three factors: it
contributes to economic growth, improves income distribution, and benefits the

309
environment. That the Thai economy depends on tourism could be gleaned from the fact
that more than half of Thai industries benefit from tourism. Any changes in tourism
could have substantial impacts on the economy. According to a study done by
Wattanakuljarus (2006), a tourism boom in Thailand can stimulate real GDP. It
increases imports of intermediate inputs in manufacturing, although the current account
deficit declines owing to extra foreign receipts. Tourism benefits all household classes
in terms of an increase in consumption, utility, and income. However, it is not pro-poor
or pro-agriculture as long as the owners of primary factors in agriculture do not
participate in tourism-related activities.
A tourism boom induces reallocation of primary factors toward domestic-oriented
production and away from export-oriented production and import-substituting
production. It widens the gap between the agriculture and non-agricultural sectors in
terms of labor wages and rates of return on capital. A tourism boom stimulates demands
for piped water and increases the total costs of an existing water subsidy.
Wattanakuljarus finds that subsidy removal can reduce demands for piped water while
causing only minimal effects on other sectors. It tends to benefit low-income and
agricultural households. Hence, lifting water subsidy can be considered as a pro-poor or
pro-agricultural household policy. The government can use savings from water subsidy
removal to fund additional pro-poor or pro-growth projects while correcting an
environmental distortion (e.g., excessive demand for water and production of
wastewater). This is evidence of a double dividend.

310
2. THAILAND’S CONTRIBUTIONS: PAST, PRESENT, AND FUTURE
It is interesting to note what Thailand has done to narrow the development gap in the
region. one of the factors that has played a significant role in this regard is trade.
Contributions through trade
Increasing trade between Thailand and its neighboring countries is seen to improve
benefits from international trade, assuming trade between Thailand and its CLMV
trading partners is complementary. Moreover, issues concerning GSP and the utilization
rate as well as the GSP scheme, that will support sustainable economic development,
will be discussed to some extent. Increasing trade through trade liberalization could lead
to welfare improvement. For developing and least developed countries (LDCs), the
focus of trade is to reduce poverty by increasing income level and/or better income
distribution. Consideration of Thailand’s contribution to narrow development gaps in
CLMV will be extended to cover other aspects such as whether revenue from trade
directed to the poor, supporting development process, improving conditions and
creating better opportunities for economic development (import products used to build
infrastructure), and promoting investment in the countries.
This section examines the nature and pattern of trade in Thailand and her LDCs
trading partners, with emphasis on its CLMV neighbors, namely, Cambodia, Lao PDR,
Myanmar, and Vietnam. The importance of Thailand’s trade liberalization and
facilitation in enhancing economic development in CLMV is also explored by
examining the preferential trade agreements between Thailand and its trading partners.
This includes a study on the Generalised System of Preferences (GSP) that Thailand

311
provides for CLMV, tariff reduction either from economic integration or preferential
trade agreements, and the effects of Thailand’s non-tariff barriers (NTB) imposed on
LDCs.
Data on trade flows and gross domestic product for each country are obtained from
the Asian Development Bank Annual Report. More disaggregated data are collected
from the United Nations Comtrade statistic database. Specific information on
Thailand’s tariff structure, tariff reduction, non-tariff barriers, and preferential trade
agreement is derived from relevant agencies in Thailand such as the Customs
department and Ministry of Finance.
Measuring openness. Trade to GDP ratio, export to GDP ratio and import
to GDP ratio are indicators used to express a country’s openness to international
trade. The more open the country to trade, the greater are benefits to the country
in terms of welfare improvement.
To determine the significance of trade on economic development, the trade to GDP
ratios for Thailand and CLMV are calculated. The higher the trade to GDP ratio, the
more important trade is to the economy. The volume of international trade has been
increasing not only for Thailand but also for its neighboring countries. With Thailand
leading the pack, the role of international trade in improving per capita income has been
significant, especially in Cambodia and Vietnam. Trade between Thailand and its
neighbors has also been increasing in the last decade. Furthermore, the average export
and import growths for Thailand and its CLMV neighbors, from 1995 to 2006, are in
double digits, ranging from 11.11 percent to 21.43 percent. Vietnam has the highest

312
average export growth at 21.43 percent and import growth at 19.35 percent, followed by
Cambodia with an average growth of export and import equal to 20.63 percent and
17.80 percent, respectively. Share of Thailand’s regional trade has been increasing since
1990. Thailand’s shares of exports and imports over the last decade, on average, are
5.44 percent and 6.02 percent, respectively. The contribution of Thailand to narrowing
development gap in the region through trade is gleaned from the country’s trade with its
neighbors. Thailand’s export to and import from her CLMV neighbors over the last
decade are at 2.19 percent and 1.02 percent, on average, with a strong increasing trend.
The number has been rising since 1990, changing only slightly during the Asian finance
crisis. Thailand exports to CLMV accounted for 3.77 percent of the total in 2005,
compared to 2.96 percent in 2000, 1.87 percent in 1995 and 0.48 percent in 1990. A
similar pattern was noted in the share of Thailand’s imports from CLMV; while the
share of Thailand’s imports from CLMV was 0.45 percent in 1990 and 2.21 percent in
2005.
Figure 12 shows the trade to GDP ratio for Thailand and CLMV. In all four
countries except Myanmar, the trade to GDP ratio had been increasing throughout the
period 1990-2005. This suggests the increasingly important role that international trade
plays in the development process alongside greater collaboration between Thailand and
its neighboring LDCs. Furthermore, the numbers above show more liberalized trade in
the countries above, thus moving toward developing an open, rule-based, predictable,
non-discriminatory trading system.
Tables A2 and A3 (see appendix) show exports to GDP and imports to GDP ratios for
CLMV and Thailand, respectively. In these countries, both export and import to GDP
2 Details of the table are provided in the appendix.

313
ratios are increasing. For instance, the proportion of Cambodia’s export to GDP rose
from 2.4 percent in 1990 to 64.2 percent in 2005 (from 9.1 percent to 19.3 percent in
Lao PDR, from 36.0 percent to 69.4 percent in Vietnam, and 34.1 percent to 73.8
percent in Thailand). Export and import have played a significant role and increasingly
crucial to these economies. Cambodia, Vietnam and Thailand have export and import
accounted for more than 50 percent of GDP since 2000. And thus, this suggests such a
significant impact of trade liberalization on the economic development of the region
particularly CLMV in narrowing development gaps.
Figure 1: Countries’ Openness to trade
Thailand and CLMV Trade Openness
0
20
40
60
80
100
120
140
160
1990
1991
1992
1993
1994
1995
1996
1997
1998
1999
2000
2001
2002
2003
2004
2005
2006
Year
Cou
ntry
's O
penn
ess
Cambodia
Lao PDR
Myanmar
Vietnam
Thailand
Poverty Reduction. An increase in volume of international trade
contributes to poverty reduction by raising the income level, improving living
standards, and creating more and better opportunities. Exports and imports can
be viewed as an engine or a catalyze in stimulating the development of the

314
economy. Thus, growth of exports and imports together with an increasing in
GDP can be used as an indicator to signify the important of trade in reducing
poverty.
Compared to developed and developing countries, LDCs’ export and import
growths vary widely. Generally, less fluctuation is preferable to economic development.
Export and import growths for CLMV from 1995 to 2006 fluctuated to a great degree.
For example, Cambodia’s export growth varies from -24.6 percent to 74.3 percent
despite a smoother pattern in the recent years. Thailand has experienced a more stable
growth in export and import compared to its LDC neighbors. Stabilizing the growth of
export and import is crucial to narrowing the development gaps in CLMV economies as
well as in fostering economic stability and creating sustainable economic growth. The
argument is reinforced by evidences of a more stable export and import growth in more
developed economies. (Growth rates of exports and imports in Thailand and CLMV are
calculated from 1995 to 2006 and expressed in Tables A4 and A5 in the appendix.)
Thailand’s trade liberalization is non-discriminatory to its LDC trading partners,
particularly CLMV. While a proportion of trade in regional trade is rather stable
throughout the period, with an increasing international trade volume, Thailand’s
export and import shares with the CLMV have risen over the past decade. Table A63
illustrates the proportion of Thailand’s export and import in world trade, regional trade,
and CLMV trade. The share of Thailand’s export and import in the regional trade and
CLMV trade is minimal but increasing. Thailand’s export and import in regional trade
varies from 4.75 percent to 6.06 percent and 5 percent to 7.10 percent, respectively,
3 For more details see in appendix.

315
during 1990-2005. Moreover, while the volume of trade has been increasing, the share
of Thailand’s export and import in CLMV trade also steadily increased from 0.48
percent to 3.09 percent and from 0.45 percent to 1.67 percent during the same period.
This implies a rising trade volume between Thailand and its LDC neighbors.
Thailand’s trade with CLMV specifically has been increasing throughout the last
decade. Table A7 (see the appendix) shows the amount of CLMV’s export to and
import from Thailand from 1985 to 2005. Although the trends of CLMV’s trade with
Thailand are increasing, there are fluctuations in some periods. Thailand has been in the
top ten of the CLMVs’ export partners from 1985 to 2005 except for Vietnam and
Cambodia in recent years, and CLMV’s import partners from 1985 to 2005. The
evidence suggest a close and strong trade linkages between Thailand and her neighbors.
Thus, the trade connection present a crucial channel in which both sides can benefit
from economic integration and narrowing economic development gap.
Tables A8.1 through A8.4 , in the appendix, demonstrate the ranking and direction
of exports for Cambodia, Lao, Myanmar, and Vietnam. Although Thailand does not
rank in the top ten export partners of Cambodia and Vietnam, it ranks first in Lao’s and
Myanmar’s lists, with an export value of US$ 454.7 million and US$2,134.8 million,
respectively in 2006. Thailand does not rank in the top ten of Vietnam’s export partners.
The ranking is based on an average of export for the last the period 2002-2006. On
average (from 2002 to 2006), Myanmar’s export to Thailand accounted for 48.95
percent of its total exports; Lao’s export to Thailand is 43.10 percent of its total export.
The ranking and direction of imports for Cambodia, Lao, Myanmar, and Vietnam
are shown in Tables A9.1 through A9.4 in the appendix. Thailand ranks third in
Cambodia’s and first in Lao’s imports, with US$ 767.4 and 1,127.6 million in 2006,

316
respectively. The ranking is based on an average of import from 2002 to 2006.
Moreover, Thailand has also contributed as a major exporter to Myanmar and Vietnam.
Myanmar’s and Vietnam’s 2006 imports from Thailand were valued at US$837.4 and
3,407.7 million, respectively.
Measuring trade intensity index. Trade Intensity Index (TII)
determines whether the value of trade between two countries is greater or
smaller than expected by measuring the proportion of one country’s exports
going to a particular trade partner divided by the proportion of world’s exports
going to the trade partner. TII greater than one indicates that the bilateral trade
flow between the two countries is larger than expected, i.e., the two countries are
“natural” trade partners. If TII is less than one, the bilateral trade flow is smaller
than expected, the two countries are not “natural” trade partners.
The trade intensity index between Thailand and ASEAN countries (see Table A10
in the appendix) shows that TII is greater than one in almost every cases. This indicates
that the bilateral trade flow between Thailand and its ASEAN trading partners is larger
than expected. Furthermore, there are greater trade intensities between Thailand and
CLMV compared to the rest of the ASEAN, further suggesting that Thailand has been
trading extensively with its LDC neighbors.
The study at a more disaggregated level illustrates that Thailand’s import
composition has changed in favor of LDCs, particularly CLMV. It has also been
importing more from its neighbors, including its ASEAN partners. Although only in its

317
early stage, Thailand’s importation from CLMV consists only of primary or
intermediate goods, these products have comparative advantages for its trading partners.
In the early 90s, Thailand incurred trade deficits with some of its LDC trading
partners. However, the gaps have since narrowed or eliminated in some cases. Trade
balances between Thailand and CLMV have been in favor of Thailand recently.
Thailand’s exports to CLMV consist of products that help improve the country’s living
standards as well as build infrastructure for further economic development such as
foods and beverages, pharmaceutical products, cement, etc.
Measuring comparative advantage. Revealed Comparative Advantage
(RCA) is one of the key indicators used to measure a country’s competitiveness
in producing certain products. By comparing the proportion of a country’s
export of a specific product to the country’s total export and the proportion of
the world’s export of the product to the world total export, the RCA index
provides useful information on a country’s trade potential. If the RCA index of
country I for product J exceeds unity, the country is said to have a revealed
comparative advantage in product J and thus there is a trade potential for product
J. On the contrary, if the value of the index is less than unity, the country has a
revealed comparative disadvantage and has no trade potential.
Trading according to countries’ comparative advantage implies welfare
improvement both to the world and the trading partners themselves. The benefits from
trade are realized through more efficient allocation of resources and division of labor.
Thailand has illustrated its contribution as a partner for development with its LDC

318
neighbors in this aspect. The RCA index for the top 20 products Thailand imported
from Cambodia, Lao PDR, Myanmar, and Vietnam in 2001 are calculated and shown in
Tables A11.1 through A11.4 in the appendix. Almost every one of Cambodia’s top 20
products exported to Thailand in 2001 has RCA greater than unity, which indicates that
Thailand imports mostly the products over which the latter has trade potentials. In
particular, the top five products (HS 720429, 410130, 040299, 440799 and 010290)4
have RCAs equal to 43.22, 178.64, 27.91, 5.56 and 2.23, respectively. This suggests
that greater benefits from trade expansion between Thailand and Cambodia can be
captured by improving market access for these products. For Laos, Myanmar, and
Vietnam, the RCA patterns are similar to Cambodia. The RCA index for the top 20
products exported to Thailand in 2001 are greater than one in most cases. The top five
products Lao exported to Thailand, which account for the majority of total export to
Thailand in terms of value, have RCA greater than unity, i.e., 174.85, 276.64, 153.76,
108.55 and 31.48, respectively.
Recently, Thailand has been importing significant amounts of natural gas and tin
ores (HS 271121 and 260900) from Myanmar. The corresponding RCAs of these two
products are 39.10 and 83.14. Vietnam’s key exports to Thailand also have RCA values
greater than one. Among the top 20 products Vietnam exported to Thailand in 2001, 17
products have trade potential, i.e., RCA greater than unity. The study of a country’s
comparative advantage, by determining the RCA index, suggests that trade expansion
between Thailand and CLMV could pave the way for further benefits to the trading
partners, thus highlighting the role of Thailand as an international partner for
development.
4 Details on product description are provided in table A11.1. in the appendix

319
Over the last decade, the tariff structure in Thailand has undergone many reforms
based on its trade agreements under APEC, AFTA, and other bilateral agreements. In
addition, there are also reforms of applied Most Favored Nation (MFN) tariffs in
Thailand. The reduction of tariff structure in Thailand has been a crucial factor for
improving market access for its trading partners, which include not only developing
countries and LDCs but also developed economies. A simple average of Thailand’s
tariff schedule from 1999 to 2003 is shown as follows.
1999 2002 2003
Simple average applied rate 17% 15% 14.7%
Agricultural products (HS 01-24) 32.7% 26% 25.4%
Industrial products (HS 25-97) 14.6% 13.1% 12.9%
Source: WTO, Trade Policy Review: Thailand, 15 October 2003.
The simple applied MFN average declined from 17 percent in 1999 to 14.7 percent
in 2003. Tariff on agricultural products was cut from 32.7 percent to 25.4 percent in
2003 while the average tariff rate on industrial products was reduced to from 14.6
percent to 12.9 percent in 1999.
Since CLMVs have already been accepted as new ASEAN members, the tariff
structure under AFTA agreement is appropriate to these countries. The average tariff
rates are calculated for products under chapter 01 to 97 (HS 2 digits) using the 2001
tariff structure. Both applied MFN tariff rates and the tariff rates implemented under
AFTA are considered for comparison purposes.

320
Simple average tariff rate
Applied rate
(2001)
Agricultural products
(HS 01-24)
Industrial products
(HS 25-97)
Applied MFN tariff 17.19% 26.26% 14.17%
AFTA 4.53% 5.42% 4.23%
Source: Calculated by author using information obtained from the Ministry of Finance.
In terms of tariff reduction, CLMV benefits greatly from being new ASEAN
members. Thailand’s implementation of AFTA agreement brought down the average
applied MFN rate from 17.19 percent to 4.53 percent. Compared to the applied MFN
tariff rate, the AFTA average tariff is 20.84 percent lower for agricultural products, and
9.94 percent lower for industrial products.
With limited resources available, Thailand has granted GSP privileges to
Bangladesh and CLMV for various products. Thailand agreed, in the first phase, to
reduce the tariff rate to 0 percent and 5 percent in six product groups, which consist of
128 subgroups: 1) jute and jute products, 2) leather and leather products, 3) frozen
foodstuffs, 4) ceramic products, 5) pharmaceutical items, and 6) agricultural produce. In
the second phase, 10 more product groups consisting of 101 subgroups were added to
the list of products whose tariff rates Thailand agreed to reduce to 5 percent, namely, 1)
footwear, 2) electric cables and wire, 3) cosmetics and toiletry, 4) processed foods, 5)
furniture, 6) melamine and plastic products, 7) transformers, 8) specialized textiles, 9)
tea, and 10) zipper. Thailand, as an ASEAN member, has agreed to grant GSP
privileges to CLMV under the ASEAN Integration System of Preferences (AISP).
According to a recent revision in 2003, Thailand agreed to extend the tariff preferential
rates for products listed in the AISP to CLMV for another year. Moreover, 249 products

321
were added to the AISP list for Cambodia, 152 products for Lao, 378 products for
Myanmar, and 15 products for Vietnam.
2.1 Trade and Development Index
Trade and development index in 2006 created by UNCTAD provides useful information
in narrowing economic development gaps for developing countries as well as LDCs.
2.2 Input and Outcome Measure Index
A closer look at the input measure index as driving forces to simulate trade and
development measured in terms of trade performance and economic and social well-
being of the nation indicates similar patterns of development between Thailand and its
neighbors, namely, Vietnam and Cambodia5.
Table 1: TDI, Input and outcome measure index for Thailand, Vietnam, and Cambodia
TDI InputMI OutcomeMI Country
2005 2006 2005 2006 2005 2006
Thailand Score 537 551 635 657 439 445
Rank 31 29 38 36 35 36
Vietnam Score 496 503 563 566 428 439
Rank 44 44 63 70 37 38
Cambodia Score 438 452 524 538 351 365
Rank 75 75 96 90 64 61
Note: InputMI: Input Measures Index
OutputMI: Outcome Measures Index
Source: Developing Countries in International Trade 2007: Trade and Development Index
5 The indices for Lao PDR and Myanmar are not available as of 2007.

322
Table 2: Year 2006 Input and Outcome Measure Index
Input/Outcome measures Thailand Vietnam Cambodia
Human Capital (HC) 20 19 14
Physical Infrastructure (PI) 38 4 5
Financial Intermediation (FI) 45 24 4
Domestic Finance Resources (DF) 66 62 46
International Finance Resources (IF) 102 133 139
Institutional Quality (IQ) 59 41 44
Economic Structure (ET) 60 52 44
Macroeconomic Stability (MS) 101 82 91
Environmental Sustainability (ES) 17 12 10
Openness to Trade (OT) 72 67 69
Input
Measures
Market Access, Foreign (MA) 77 72 73
Trade Performance (TP) 124 104 66 Outcome
Measures Economic and Social Well-being (EW) 321 335 299
Source: Developing Countries in International Trade 2007: Trade and Development Index
Of the three countries, Thailand has performed best in the overall performance
index. However, scores on economic and social well-being are not too far apart.
Vietnam and Cambodia have performed well in trade, thus scoring well on economic
and social well-being. Input measures, however, point to the weakness of Cambodia in
financial intermediation, physical infrastructure, environmental sustainability, and
human capital. Vietnam’s performance in these areas is also below par, albeit to a lesser
degree. This highlights the need to enhance its trade and development efforts. Physical
infrastructure improvement is still crucial to narrowing the development gap in Vietnam
and Cambodia alongside accumulation of human capital.

323
2.3 Contributions through Investment
Aside from trade liberalization, it is also important to understand the role of investment
liberalization and the relationship between trade and investment (inward and outward
investment) in narrowing the development gap. Thailand’s development path over the
past three decades has shed some light on the crucial role of foreign investment in a host
country’s economic development. Thus far, Vietnam has successfully attracted foreign
direct investment, which has hastened its economic growth. Many developing
economies have either successfully channeled benefits derived from foreign investment
to the development process, or not at all. In many cases, capital flows, especially foreign
portfolio investments, have been cited as sources of instability and, worse, economic
crisis. The Asian financial crisis in 1997 is a case in point. Still, it cannot be denied that
developing countries need foreign capital to push forward their development process.
Therefore, it illustrates how important the role of foreign investment is in narrowing the
development gap.
Intra-ASEAN foreign investments in Thailand and CLMV are not uncommon,
sine the region consists primarily of developing countries (with the notable exception of
Singapore). As such, the development process among ASEAN members is dependent
on developed economies outside the range of ASEAN. Still, it is worthwhile to note the
growing share of intra-ASEAN foreign investment in CLMV, since it represents the
contribution of ASEAN in narrowing the development gap. It also indicates efficiency
gains from industry restructuring, especially in CLMV. Thus, emphasis should be
placed on intra-ASEAN foreign investment stimulation as a means for narrowing
development gap.

324
Thailand, along with other ASEAN members, particularly Singapore and Malaysia,
and Japan, plays an important role as an investing country in CLMV. As host countries,
CLMV members benefit from income growth, increasing employment, productivity
improvement through efficient use of production factors and better allocation of
resources. How well the CLMV as host countries utilize these benefits will be the
Table 3: Foreign Direct Investment Net Inflow, intra- and extra-ASEAN (2004-2006)
Mil. US$ / percent 2004 2005 2006
Country Intra- Extra- Total Intra- Extra- Total Intra- Extra- Total
Thailand 688.7 5,173.3 5,862 762.2 8,194.8 8,957 2,822.1 7,933.9 10,756
Y-o-Y Change
10.7% 58.4% 270.2% -3.2%
Share 11.75% 88.25% 8.51% 91.49% 26.24% 73.76%
Cambodia 31.9 99.5 131.4 129.2 252.2 381.4 155.5 327.7 483.2
Y-o-Y Change
304.8% 153.4% 20.4% 30.0%
Share 24.28% 75.72% 33.88% 66.12% 32.18% 67.82%
Lao, PDR 7.8 9.2 17 6.7 21.0 27.7 10.6 176.8 187.4
Y-o-Y Change
-13.8% 129.4% 58% 740.2%
Share 45.88% 54.12% 24.19% 75.81% 5.66% 94.34%
Myanmar 9.3 241.8 251.1 38.4 197.5 235.9 27.8 115.2 143
Y-o-Y Change
311.9% -18.3% -27.5% -41.7%
Share 3.70% 96.30% 16.28% 83.72% 19.44% 80.56%
Vietnam 242.9 1,367.2 1,610.1 164.7 1,856.1 2020.8 181.9 2,178.1 2,360
Y-o-Y Change
-32.2% 35.8% 10.4% 17.3%
Share 15.09% 84.91% 8.15% 91.85% 7.71% 92.29%
Source: ASEAN Foreign Direct Investments Database (using data gathered from central banks, national statistical offices, and other relevant government agencies).

325
ultimate determinants of their development efforts. In this sense, domestic policies that
ensure a favorable investment climate and consequently aster economic development
cannot be emphasized enough. Thailand’s contributions as a investing country are
illustrated in the following table.
Table 4: Thailand’s Share of Direct Investment in CLMV Mil. US $
Cambodia Laos Myanmar Vietnam*
2005 F/Y 2005 1988-May 2006 Accumulation
2005
Country Amount Country Amount Country Amount Country Amount
China 451.96 Thailand 450.91 Thailand 7,375.6 Japan 842.22
Thailand 81.29 France 370.25 UK 1,591 Luxemburg 771.88
S. Korea 55.97 China 58.12 Singapore 1,434.2 S. Korea 755
Malaysia 25.87 Vietnam 43.27 Malaysia 660.7 Samoa 747.36
Singapore 25.42 Australia 21.29 Hong Kong 504.2 Taiwan 721.25
France 7.64 S. Korea 10.22 France 470.4 Hong Kong 490.42
Taiwan 7.51 Japan 4.40 USA 243.6 USA 255.61
UK 6.40 Malaysia 3.37 Indonesia 241.5 Virgin Is. 245.20
Canada 5.48 Canada 2.93 Netherlands 238.8 Singapore 238.91
USA 4.38 Singapore 1.20 Japan 215.3 Malaysia 179.59
Others 378.35 Others 279.35 Others 840.6 Others 770.66
Total 1,050.2 Total 1,245.31 Total 13,815.9 Total 6,018.10
Note: Amounts are on an approved basis. Cambodia and Laos figures include domestic investment.
* Thailand ranks 14th as investor in Vietnam
Source: Takao TSUNEISHI (2007)

326
Table 5: ODA to Least Developed Countries: Thailand and Selected OECD-DAC Countries (2003)
Country ODA
as % of GNI
% of
ODA to LDCs
Country ODA to LDCs
as % of GNI
Norway 0.92 39 Belgium 0.35
Sweden 0.79 34 Norway 0.35
Belgium 0.60 59 Sweden 0.29
France 0.41 41 France 0.17
United Kingdom 0.34 36 Thailand 0.12
Germany 0.28 37 United Kingdom 0.12
Australia 0.25 21 Germany 0.10
Japan 0.20 22 Italy 0.08
Italy 0.17 45 Australia 0.05
United States 0.15 28 Japan 0.04
Thailand 0.13 93 United States 0.04
OECD-
DAC Average
0.25 33 OECD-
DAC Average
0.08
Source: Global Partnership for Development: Thailand’s Contribution to Millennium Development
Goal 8, Ministry of Foreign Affairs of Thailand
2.4 Contributions through Capacity Building (Infrastructure Development)
Capacity building is just as crucial to narrowing the development gap. Efforts in this
regard necessarily include infrastructure development programs such as efficient
transportation systems, particularly roads and rail. Admittedly, there have been
infrastructure development programs in the CLMV. Yet, infrastructure improvements
are still in order such as those involving network and logistics management. Key to
bringing this about is collaboration among countries that share borders. This is an
important condition for cluster formation and efficient industrial restructuring.
327
Official Development Assistance (ODA)
Thailand has performed considerably better in the efforts to assist least developed
countries compared to OECD countries in relative terms as a percentage of gross
national income (GNI), estimated at 93 percent of its total ODA, which far exceeds the
OECD average.
3. DEVELOPMENT STRATEGY THROUGH ECONOMIC INTEGRATION
Economic integrations, particularly at the sub-regional level, have played a
significant role in economic development as well as narrowing development gaps in the
region. In relevant undertakings in this regard, the Great Mekong Subregion (GMS)
economic cooperation stands out, based on its programs that simulate trade, investment,
and capacity building, which in turn have created opportunities for CLMV countries to
advance their development process.
Collaborative efforts toward economic integration have paved the way for
infrastructure development such as those involving transportation. Infrastructure
development alongside economic activities that include the creation of economic zones
are supposed to follow along the path to economic integration. Tsuneishi (2007)
outlines the investment and capacity building programs that have come on the heels of
economic cooperation at the sub-regional level such as the North-South Economic
Corridor (NSEC), the East-West Economic Corridor (EWEC), the Southern Economic
Corridor (SEC), GMS economic cooperation (GMS-EC), and ACMECS. These sub-
regional economic cooperation efforts have significantly improved the economic
conditions of CLMV and successfully brought the countries onto the path to narrowing

328
their development gaps. Although more work needs to be done, the initiation of
programs under sub-regional agreements together with the provision of assistance from
international organizations such as the Asian Development Bank are keys to the
successful development of CLMV.
4. DEVELOPING A COHERENT DEVELOPMENT STRATEGY Following are conclusions and proposed policy measures drawn from the foregoing
discussions and evaluation of key issues in narrowing the development gap in the region.
a. Prevent development imbalance between industry and agriculture to forestall
income inequality and economic instability. Thailand’s experience brings to the fore an
important lesson: Its pursuit of development following a severe economic crisis failed to
stave off political unrest and economic instability.
b. Avoid economic distortions resulting from a chaotic tariff structure. A growing
number of free trade agreement (FTA)—at the bilateral, regional, and multilateral levels,
could usher in trade diversion that exceeds trade creation. Pursuing a uniform tariff
structure is a viable alternative in trade agreement negotiation.
c. Harmonization of tariff structure between Thailand and CLMV accordingly
with AFTA.
d. To a certain degree, it seems international trade and investment have already
been utilized as a significant tool in economic development and CLMV members have
already benefited from increased trade liberalization in the region. The issue then
becomes how we can further benefit from international trade and investment activities,

329
especially for CLMV, so that shrinking and finally eliminated development gaps can be
achieved. In this aspect, it is crucial for the trading partners to ensure that the increasing
trade activities among countries in the region are based on their comparative advantage.
e. Although physical improvement (“hardware”) is still needed in all CLMV,
some are needed more than the other, a number of infrastructure development programs
have been installed and now it is time to focus more on improving human capital
(“software”) to better utilized the better economic environment. Building economic
networking in the region will be one of the significant factors to achieve the goal of
narrowing development gap.
f. Strengthening the linkages between Thailand’s regional development and
Thailand economic cooperation with neighboring countries. Thus far, the existing sub-
regional economic cooperation were to develop physical infrastructure needed to
improve economic conditions between Thailand and CLMV particularly at the border
area, i.e., building roads, bridges, and so on. However, it is lacking of regional
economic development program such that better collaboration can be generated between
economies in the border area. In some sense, the development programs implemented
under sub-regional economic cooperation have not been fitting well with the local
regional development policy. As evidences pointed out, border-trade between Thailand
and CLM has increased but not being fully utilized the physical infrastructure installed
up to its potential. Economic growth in the provincial area at the border has not been
able to excel and catch up on development in other areas. Therefore, the objectives of
narrowing development gap within the country (Thailand) need to tied up as a strategy
for narrowing development gap in the region.

330
REFERENCES Andersson, J., Bonaglia, F., Fukasaku, K. and Lesser, C. 2005. Trade and Structural
Adjustment Policies in Selected Developing Countries. OECD Development Center working paper 245.
Australia-Thailand Free Trade Agreement: Economic Effects Report. 2004. Prepared for the Department of Foreign Affairs and Trade. Centre for International Economics Canberra and Sydney.
Coxhead, I, and J. Plangpraphan. 1998. Thailand’s Economic Boom and Agricultural Bust: Some Economic Questions and Policy Puzzles. Staff Paper Series 419. University of Wisconsin-Madison. Department of Agricultural and Applied Economics.
Coxhead, I. 2000. Tax Reform and the Environment in Developing Economies: Is a Double Dividend Possible? Staff paper series 431. Department of Agricultural and Applied Economics. University of Wisconsin-Madison.
Coxhead, I. and S. Jayasuriya. 2003. The Open Economy and the Environment: Development, Trade and Resources in Asia. Edited by E. Elgar.
Diao X., Rattso, J. and H. Stokke. 2006. Learning by Exporting and Structural change: A Ramsey Growth Model for Thailand. In Journal of Policy Modeling 28: 293-306.
Japan-Thailand Economic Partnership Agreement (JTEPA) task force report. 2003. Karunaratne, N. D. 1998. Macroeconomic Insights on the Liberalized Trading Regime
of Thailand. In International Journal of Social Economics, 25 (6/7/8):1142-1159 Martin, W. and P. Warr. 1994. Determinants of Agriculture’s Relative Decline:
Thailand. In Agricultural Economics 11(1994) 219-235. Ministry of Foreign Affairs of Thailand and United Nation Country Team in Thailand,
Global Partnership of Development: Thailand’s Contribution to Millennium Development Goal 8, 2005.
Miranda K. and T. Muzondo. 1991. Public Policy and the Environment. Finance and Development, 28(2):25-27. Paper cited in Munasinghe and Cruz “Economy wide Policies and the Environment: Lessons from Experience.” 1995.
Munasinghe, M. and W. Cruz. 1995. Economy wide Policies and the Environment: Lessons from Experience. World Bank Environment Paper, 10, January.
Panayotou, T. and C. Sussangkarn. 1991. The Debt Crisis, Structural Adjustment and the Environment: The Case of Thailand. Paper prepared for the World Wildlife Fund Project on the Impact of Macroeconomic Adjustment on the Environment. cited in Munasinghe and Cruz . 1995.

331
Reed, D. (ed.). (1992). Structural Adjustment and the Environment. Boulder, Colorado: Westview Press. cited in Munasinghe and Cruz (1995)
Siksamat, S. 2001. A Measurement of Structural Changes in the Thai Economy (1990-1995): A Computable General Equilibrium Approach. BOT Working Paper 10/2001, Monetary Policy Group, Bank of Thailand.
Stoeckel, A., W. McKibbin, T. Feridhanusetyawan, and K. Khatikarn. 1997. Effects of APEC Liberalization Focus on Thailand and Indonesia. Center for International Economics. Commonwealth of Australia.
Warr, P. 2001. Welfare Effects of an Export Tax: Thailand’s Rice Premium. In American Journal of Agricultural Economics 83(4): 903-920.
______________. 2006. Productivity Growth in Thailand and Indonesia: How Agriculture Contributes to Economic Growth. Working Paper in Economics and Development Studies.
Wattanakuljarus, A. 2006. The Nationwide Economic and Environmental Impacts of Tourism: A Computable General Equilibrium Approach for Thailand. A dissertation submitted for the degree of Doctor of Philosophy of the University of Wisconsin-Madison, USA, June.
World Bank. l994. Thailand: Mitigating Pollution and Congestion Impacts in a High-Growth Economy. Report No. 11770-TH. Cited in Munasinghe and Cruz “Economy wide Policies and the Environment: Lessons from Experience.” 1995.

332
APPENDIX
Table A1: Trade to GDP ratio (percent) Year Cambodia Lao PDR Myanmar Vietnam Thailand 1990 10.84 30.5 5.58 81.32 75.78 1991 10.47 25.4 4.42 66.95 78.47 1992 12.44 33.7 3.59 73.58 77.95 1993 49.21 50.6 3.37 66.21 80.16 1994 65.61 56 2.91 77.47 82.59 1995 79.95 50.4 2.54 74.72 90.43 1996 70.66 53.7 2.18 92.71 84.78 1997 80.94 55 1.86 94.34 94.60 1998 77.36 69.2 1.47 97.00 101.87 1999 89.18 58.8 1.06 102.79 104.02 2000 113.86 50 1.08 112.53 125.08 2001 118.88 47.3 1.00 111.56 125.70 2002 119.50 40.8 0.7 118.80 121.70 2003 123.30 37.5 0.4 127.00 124.6 2004 135.10 42.9 0.3 139.00 136.5 2005 137.10 50 - 142.90 148.9 2006 144.6 - - 150.30 143.5
Source: Estimated figures using Asian Development Bank data, culled from various annual report issues (years).
Table A2: Export to GDP ratio (percent)
Year Cambodia Lao PDR Myanmar Vietnam Thailand 1990 2.4 9.1 1.9 36.0 34.1 1991 4.5 9.4 1.6 30.9 36.0 1992 5.0 11.2 1.4 34.7 37.0 1993 16.4 18.1 1.2 28.7 38.0 1994 26.2 19.5 1.1 34.0 38.9 1995 31.7 17.3 0.8 32.8 41.8 1996 25.9 16.9 0.7 40.9 39.3 1997 34.4 17.9 0.6 43.1 48.0 1998 32.1 26.2 0.4 44.8 58.9 1999 38.0 20.7 0.3 50.0 58.3 2000 50.9 19.1 0.5 55.0 66.9 2001 54.4 18.2 0.5 54.6 66.1 2002 55.5 16.4 0.4 56.8 64.2 2003 56.6 15.8 0.2 59.3 65.7 2004 63.9 14.5 0.2 65.7 70.7 2005 64.2 19.3 - 69.4 73.8 2006 68.8 - - 73.5 73.7
Source: Estimated figures using Asian Development Bank data, culled from various annual report issues (years).

333
Table A3: Import to GDP ratio (percent)
Year Cambodia Lao PDR Myanmar Vietnam Thailand 1990 8.4 21.4 3.6 45.3 41.7 1991 6.0 16.0 2.9 36.0 42.5 1992 7.4 22.5 2.2 38.8 41.0 1993 32.8 32.5 2.2 37.5 42.2 1994 39.4 36.5 1.8 43.5 43.7 1995 48.2 33.1 1.7 41.9 48.6 1996 44.8 36.8 1.5 51.8 45.5 1997 46.6 37.1 1.3 51.2 46.6 1998 45.3 43.0 1.0 52.2 43.0 1999 51.1 38.1 0.7 52.8 45.7 2000 63.0 30.9 0.6 57.5 58.2 2001 64.5 29.1 0.5 56.9 59.6 2002 64.0 24.4 0.3 62.0 57.5 2003 66.7 21.7 0.2 67.7 58.9 2004 71.2 28.4 0.1 73.3 65.8 2005 72.9 30.7 - 73.5 75.1 2006 75.8 - - 76.8 69.8
Source: Estimated figures using Asian Development Bank data, culled from various annual report
issues (years).
Table A4: Growth of Exports
Export Growth Countries 1995 1996 1997 1998 1999 2000 2001 2002 2003 2004 2005 2006
Thailand 23.6 0.4 27.9 24.4 -1.4 25.2 4.0 1.4 13.7 16.5 14.6 11.4Cambodia 74.3 -24.6 33.9 -6.9 40.9 23.6 12.5 12.6 17.9 24.1 12.4 26.8Lao PDR 2.4 3.1 -1.4 7.7 -10.5 9.6 -3.3 -5.9 11.6 8.3 52.2 59.5Myanmar -6.7 8.8 17.5 4.8 32.4 42.3 34.5 16.5 -29.2 18.3 23.7 - Vietnam 34.4 33.2 26.6 1.9 23.3 25.5 3.8 11.2 20.6 31.4 22.5 22.7
Source: Estimated figures using Asian Development Bank data, culled from various annual report
issues (years).

334
Table A5: Growth of Imports
Import Growth Countries 1995 1996 1997 1998 1999 2000 2001 2002 2003 2004 2005 2006
Thailand 28.8 3.9 5.0 -7.8 7.5 30.8 10.4 0.8 13.1 21.1 25.1 2.5 Cambodia 59.5 -9.7 1.9 6.7 36.5 21.6 8.2 12.7 13.0 22.5 20.1 20.6Lao PDR 4.4 17.1 -6.1 -14.7 0.3 -3.4 -4.7 -12.4 3.4 54.2 23.8 20.2Myanmar 23.6 14.3 22.0 17.4 -3.6 -7.3 21.9 -18.9 -10.1 -15.4 1.5 - Vietnam 40.0 36.6 4.0 -0.8 2.1 33.2 3.7 21.8 27.9 26.6 15.0 22.1
Source: Estimated figures using Asian Development Bank data, culled from various annual report
issues (years).
Table A6: Share of Thailand’s exports and imports in world trade, regional trade, and CLMV trade
World Trade Regional Trade CLMV Trade Year Exports Imports Exports Imports Exports Imports 1990 0.67 0.97 5.10 7.10 0.48 0.45 1991 0.80 1.06 5.51 6.99 0.37 0.29 1992 0.87 1.06 5.55 6.67 0.76 0.48 1993 0.99 1.21 5.69 6.70 1.24 0.52 1994 1.06 1.27 5.88 6.78 1.70 0.58 1995 1.11 1.38 6.06 7.17 1.87 0.48 1996 1.06 1.37 5.73 7.10 2.13 0.33 1997 1.04 1.11 5.52 5.95 1.90 0.63 1998 1.00 0.77 5.52 4.89 2.26 0.92 1999 1.04 0.87 5.56 5.26 2.81 0.96 2000 1.09 0.95 5.45 5.27 2.91 1.13 2001 1.06 0.98 5.46 5.54 3.28 1.85 2002 1.07 0.97 5.29 5.32 2.90 1.78 2003 1.07 0.98 5.13 5.17 3.09 1.67 2004 1.05 1.00 4.90 5.02 3.53 1.98 2005 1.06 1.10 4.75 5.40 3.77 2.21
Source: International financial statistics (International Monetary Fund: IMF) Various issues.

335
Table A7: CLMV’s Trade with Thailand (Mil. US$)
Cambodia Lao PDR Myanmar Vietnam Year Export
to Import from
Export to
Import from
Export to Import from
Export to
Import from
1985 - 0.4 1.1 21.7 2.4 1.5 - - 1986 - - 1.2 32.9 2.3 1.7 - - 1987 - - 5.4 40.9 1.7 1.5 - 0.2 1988 - 0.7 20.4 56.4 1.2 1.3 - 3.8 1989 2.2 0.1 39.7 70.2 1.7 1.1 15.25 2.3 1990 8.6 0.9 40.3 72.3 48.9 19.8 52.34 17.0 1991 10.5 5.1 42.7 84.3 - 4.2 57.74 14.2 1992 84.7 72.4 37.3 133.1 - - 71.50 41.2 1993 94.9 197.3 74.8 164.8 - - 71.77 99.5 1994 114.7 286.4 77.2 270.3 28.8 - 97.65 225.7 1995 146 367.5 83.3 287.8 36.5 - 101.30 439.8 1996 43.4 398.9 96.7 310.0 - - 107.36 494.5 1997 131.5 198.1 34.3 336.7 - - 235.30 575.2 1998 77 168.5 28.8 411.3 - - 295.39 673.5 1999 18.5 195.2 51.6 452.0 102.6 435.3 312.70 561.8 2000 22.9 221.8 68.9 419.1 233.0 554.7 372.31 810.9 2001 7.6 503.9 81.0 451.7 735.4 390.5 322.77 792.30 2002 7.94 238.38 85.0 444.0 831.2 355.9 227.25 955.24 2003 11.78 215.96 94.35 501.54 826.96 483.34 335.41 1,282.192004 17.14 231.35 104.28 639.55 1,230.34 665.86 515.10 1,858.602005 7.65 141.45 204.42 846.24 1,623.04 777.30 779.70 2,393.20
Source: Asian Development Bank Annual Report (various issues 1985-2007)

336
Tab
le A
8.1
Cam
bodi
a’s D
irec
tion
of E
xpor
ts (i
n U
S$ m
illio
ns; c
alen
dar
year
)
1 2
3 4
5 6
7 8
9 10
Y
ear
Total
U.S.
Germany
U.K.
Hong Kong
France
Canada
Viet Nam
Japan
Singapore
Malaysia 19
89
20.7
0.
30.
40.
3-
-2.
00.
1-
4.2
0.0
1990
41
.7
-0.
80.
10.
3-
3.2
0.9
-7.
00.
119
91
57.4
-
15.2
0.0
0.2
1.1
5.0
2.6
-4.
7-
1992
16
5.3
0.1
24.3
0.0
0.5
5.7
8.5
3.1
7.3
6.1
0.4
1993
26
7.3
0.5
26.6
1.0
0.7
0.8
78.5
0.7
18.8
6.9
1.0
1994
24
3.1
1.0
12.3
2.4
3.9
0.1
8.0
3.6
29.4
16.1
0.7
1995
35
7.3
5.1
17.6
10.8
11.2
0.5
6.7
6.8
38.4
21.4
2.5
1996
29
2.9
4.1
41.6
31.1
13.7
1.0
6.0
11.5
43.3
16.2
4.7
1997
62
5.8
85.7
17.9
31.3
12.7
0.7
6.3
9.7
73.9
156.
90.
619
98
933.
5 29
2.9
71.8
24.9
26.8
1.9
7.9
12.2
133.
017
5.9
0.6
1999
10
40.1
23
5.8
40.4
53.4
38.3
3.2
9.3
20.7
181.
710
6.8
1.8
2000
11
22.7
73
9.7
66.0
81.6
7.3
4.9
10.7
27.7
18.0
19.4
6.4
2001
12
95.8
83
2.2
98.7
126.
34.
510
.413
.335
.028
.024
.56.
720
02
1488
.7
960.
411
8.2
132.
76.
0-
18.9
38.4
26.6
32.4
-20
03
1770
.7
1126
.415
4.4
143.
54.
9-
21.7
48.8
29.1
39.2
-20
04
2187
.7
1312
.023
7.7
175.
35.
294
.525
.162
.510
.542
.430
.620
05
1368
.8
665.
977
.352
.733
3.5
62.8
47.6
22.4
6.6
18.1
13.8
2006
33
44.6
21
16.6
335.
415
4.1
7.3
124.
810
3.2
44.1
101.
021
.285
.9So
urce
: Asi
an D
evel
opm
ent B
ank
Ann
ual R
epor
t (va
rious
issu
es 1
985-
2007
)

337
Tab
le A
8.2:
Lao
’s D
irec
tion
of E
xpor
ts (i
n U
S$ m
illio
ns; c
alen
dar
year
)
1 2
3 4
5 6
7 8
9 10
Y
ear
Total
Thailand
Viet Nam
France
Germany
China
Belgium
U.K.
Netherlands
Malaysia
Italy
1989
95
.439
.72.
50.
20.
211
.4…
1.
90.
00.
30.
419
90
64.4
40.3
3.6
2.5
1.7
5.9
…
0.1
0.2
0.1
0.3
1991
82
.142
.73.
08.
18.
62.
0…
0.
11.
70.
10.
919
92
103.
537
.37.
012
.15.
33.
4…
0.
35.
70.
11.
319
93
240.
574
.823
.112
.69.
025
.5…
-
3.6
-1.
919
94
300.
477
.281
.210
.311
.88.
1…
0.
95.
0-
0.7
1995
31
1.2
83.3
87.7
11.1
12.7
8.8
…
0.9
5.4
-0.
819
96
320.
796
.715
7.6
8.2
4.8
0.8
…
6.6
--
1.0
1997
19
2.1
34.3
0.2
20.0
16.2
0.3
17.9
14
.90.
1-
9.3
1998
37
0.8
28.8
119.
523
.321
.47.
212
.7
7.7
5.4
0.0
9.5
1999
46
2.5
51.6
179.
418
.227
.08.
713
.5
12.5
8.9
0.0
5.9
2000
39
1.1
68.9
96.1
27.1
20.8
5.8
13.6
7.
210
.00.
19.
220
01
375.
581
.061
.833
.725
.56.
810
.4
9.3
9.6
0.3
10.8
2002
38
5.9
85.0
56.9
33.8
22.0
8.8
13.6
13
.410
.60.
410
.120
03
437.
494
.355
.233
.623
.610
.218
.0
14.1
10.4
0.2
10.3
2004
53
5.4
104.
367
.543
.428
.711
.413
.4
26.8
10.9
0.1
11.8
2005
69
4.6
204.
486
.741
.931
.623
.215
.6
8.3
13.4
11.8
8.9
2006
10
55.0
454.
710
1.8
27.9
34.6
45.1
16.5
1.
412
.844
.66.
6So
urce
: Asi
an D
evel
opm
ent B
ank
Ann
ual R
epor
t (va
rious
issu
es 1
985-
2007
)

338
Tab
le A
8.3:
Mya
nmar
’s D
irec
tion
of E
xpor
ts (i
n U
S$ m
illio
ns; c
alen
dar
year
)
1 2
3 4
5 6
7 8
9 10
Y
ear
Total
Thailand
India
China
Japan
U.S.
Germany
Malaysia
U.K.
Singapore
France 19
89
214.
5 1.
7 4.
9 2.
6 18
.0
1.6
8.0
4.7
3.7
20.8
2.
3 19
90
408.
7 48
.9
44.2
33
.3
28.4
9.
4 8.
7 8.
6 4.
7 46
.2
3.3
1991
52
7.0
- 46
.6
96.3
44
.9
26.6
7.
2 15
.6
4.4
81.0
2.
9 19
92
683.
6 -
94.6
11
9.3
43.0
37
.8
9.9
17.1
8.
0 98
.4
3.9
1993
86
4.4
- 10
6.5
149.
765
.0
45.5
12
.9
52.4
12
.4
101.
32.
4 19
94
939.
8 28
.8
109.
512
9.8
68.8
66
.0
16.9
25
.0
19.3
12
7.5
4.6
1995
11
97.9
36
.5
145.
913
6.0
85.5
79
.0
24.2
37
.6
13.3
19
2.0
7.3
1996
11
83.1
-
134.
912
5.0
93.9
10
5.6
28.2
36
.3
19.5
19
0.7
17.2
1997
11
32.1
-
168.
666
.7
90.0
11
2.2
34.2
51
.0
29.0
15
7.2
33.5
1998
11
38.6
-
169.
456
.0
81.3
15
8.9
45.0
52
.1
26.3
10
9.1
39.3
1999
13
93.3
10
2.6
156.
592
.3
92.2
22
2.2
54.4
52
.2
35.0
90
.3
56.3
2000
19
79.3
23
3.0
162.
911
3.5
108.
444
2.7
77.8
63
.2
67.3
99
.8
71.3
2001
26
24.7
73
5.4
179.
812
2.0
92.8
45
6.2
100.
3 71
.1
87.4
10
2.1
72.1
2002
27
52.5
83
1.2
314.
212
4.5
100.
334
5.4
73.1
69
.8
87.8
97
.3
79.5
2003
27
67.3
82
7.0
355.
215
4.1
126.
926
8.6
94.0
72
.6
92.6
76
.2
56.7
2004
31
58.8
12
30.3
363.
718
7.7
163.
5-
118.
3 97
.1
122.
664
.5
71.2
2005
37
01.5
16
23.0
449.
124
9.5
184.
8-
102.
2 12
1.5
58.0
98
.5
39.7
2006
43
61.0
21
34.8
526.
922
9.7
223.
3-
114.
8 11
3.5
44.6
63
.2
33.5
Sour
ce: A
sian
Dev
elop
men
t Ban
k an
nual
repo
rt va
rious
issu
es.

339
Tab
le A
8.4:
Vie
tnam
’s D
irec
tion
of E
xpor
ts (i
n U
S$ m
illio
ns; c
alen
dar
year
)
1 2
3 4
5 6
7 8
9 10
Y
ear
Total
U.S.
Japan
China
Australia
Singapore
Germany
U.K.
Malaysia
France
Philippines
1989
2472
.2
-26
1.0
0.3
0.8
70.7
8.7
1.5
2.5
79.7
-19
9025
24.6
0.
034
0.3
7.8
7.7
194.
541
.21.
95.
011
5.7
57.0
1991
2188
.9
0.0
719.
319
.35.
242
5.0
6.7
2.4
14.5
83.1
0.7
1992
2917
.7
0.1
833.
995
.621
.440
1.7
34.4
27.5
68.4
132.
31.
019
9329
85.2
0.
193
6.9
135.
854
.738
0.3
50.1
23.0
55.8
95.1
1.6
1994
4054
.3
94.9
1179
.329
5.7
46.0
593.
511
5.2
55.7
64.8
116.
83.
619
9556
21.4
16
9.7
1461
.036
1.9
55.4
689.
821
8.0
74.7
110.
616
9.1
41.5
1996
7463
.2
204.
215
46.4
340.
264
.812
90.0
228.
012
5.1
77.7
145.
013
2.0
1997
9484
.3
286.
816
75.4
474.
123
0.4
1215
.941
1.4
265.
214
1.6
238.
124
0.6
1998
9307
.0
468.
915
14.5
440.
147
1.5
740.
955
2.5
335.
811
5.2
297.
340
1.1
1999
1154
1.4
504.
117
86.2
746.
481
4.6
876.
465
4.3
421.
225
6.5
354.
939
3.2
2000
1448
2.5
733.
025
75.2
1536
.412
72.5
885.
973
0.3
479.
441
3.9
382.
747
8.4
2001
1501
9.7
1065
.725
09.8
1417
.410
41.8
1043
.772
1.8
511.
633
7.2
468.
936
8.4
2002
1670
4.7
2453
.224
37.0
1518
.313
28.3
961.
172
9.0
571.
634
7.8
439.
131
5.2
2003
2014
3.8
3939
.629
08.6
1883
.114
20.9
1024
.785
4.7
754.
845
3.8
497.
234
0.0
2004
2648
5.0
5024
.835
42.1
2899
.118
84.7
1485
.310
64.7
1010
.362
4.3
555.
149
8.6
2005
3244
1.9
5930
.644
11.2
2916
.025
70.2
1808
.510
86.7
1015
.894
9.3
652.
782
9.0
2006
4020
2.5
8422
.749
27.5
2259
.936
56.5
1499
.917
89.9
1356
.812
86.8
872.
395
9.6
Sour
ce: A
sian
Dev
elop
men
t Ban
k an
nual
repo
rt va
rious
issu
es.

340
Tab
le A
9.1:
Cam
bodi
a’s D
irec
tion
of Im
port
s (M
il. U
S$; c
alen
dar
year
)
1 2
3 4
5 6
7 8
9 10
Y
ear
Total
Hong Kong
China
Thailand
Viet Nam
Singapore
Korea
France
Indonesia
Japan
Malaysia 19
89
51.9
0.
11.
61.
4-
12.0
- 0.
62.
13.
914
.919
90
56.0
0.
91.
83.
3-
10.0
- 0.
12.
95.
011
.419
91
61.9
5.
15.
92.
4-
6.9
- 2.
04.
77.
46.
019
92
751.
2 72
.424
.814
.027
6.2
7.1
- 9.
414
.825
1.7
26.0
1993
98
1.4
197.
333
.922
.440
5.8
105.
8-
13.6
22.2
54.8
43.6
1994
11
51.5
28
6.4
35.4
38.8
421.
385
.0-
51.5
46.9
71.0
48.6
1995
15
73.5
36
7.5
43.0
56.8
550.
210
4.1
- 85
.367
.084
.488
.019
96
1632
.0
398.
949
.469
.756
7.0
108.
9-
57.8
53.0
62.1
66.4
1997
11
16.4
19
8.1
67.1
56.6
6.2
107.
811
4.9
0.6
41.4
83.7
14.7
1998
11
28.9
16
8.5
129.
895
.73.
390
.795
.8
1.2
40.5
71.1
28.0
1999
12
43.0
19
5.2
185.
785
.999
.085
.679
.9
49.9
41.9
73.9
50.9
2000
14
24.4
22
1.8
254.
311
2.9
106.
091
.576
.8
64.2
39.3
58.4
68.4
2001
14
55.6
50
3.9
116.
986
.939
9.5
109.
549
.6
19.3
12.6
19.7
9.9
2002
16
74.7
23
8.4
371.
719
7.8
122.
598
.494
.8
58.5
52.0
63.9
77.6
2003
17
32.3
21
6.0
408.
922
3.4
119.
711
9.2
80.7
77
.838
.274
.882
.020
04
2074
.6
231.
441
3.1
341.
814
4.5
168.
799
.6
77.7
47.7
83.7
78.6
2005
12
68.3
14
1.4
204.
217
2.3
62.5
90.1
95.1
42
.015
4.0
52.6
40.7
2006
42
35.5
13
78.1
612.
176
7.4
505.
610
5.7
111.
6 11
9.2
70.2
83.1
51.1
Sour
ce: A
sian
Dev
elop
men
t Ban
k an
nual
repo
rt va
rious
issu
es.

341
Tab
le A
9.2:
Lao
’s D
irec
tion
of Im
port
s (in
US$
mill
ions
; cal
enda
r ye
ar)
1
2 3
4 5
6 7
8 9
10
Yea
r
Total
Thailand
China
Viet Nam
Singapore
Japan
Australia
Germany
Korea
France
Hong Kong 19
89
128.
770
.24.
93.
0-
26.8
0.5
1.9
-1.
80.
619
90
148.
672
.315
.917
.6-
21.6
1.2
1.0
-3.
11.
319
91
154.
384
.312
.33.
9-
23.5
0.4
0.9
-3.
33.
619
92
258.
413
3.1
30.6
17.6
4.7
30.8
15.8
1.4
-3.
34.
119
93
431.
916
4.8
18.1
19.7
19.2
56.1
3.4
-2.
36.
64.
319
94
564.
127
0.3
20.2
22.5
14.7
45.8
0.4
-2.
25.
97.
019
95
588.
828
7.8
21.5
23.9
15.7
48.8
0.4
-2.
36.
27.
519
96
689.
631
0.0
23.2
25.8
16.9
52.5
0.5
-2.
56.
78.
119
97
408.
533
6.7
4.9
25.1
0.6
10.4
0.3
0.9
3.3
1.7
9.5
1998
64
4.6
411.
319
.680
.722
.121
.02.
315
.45.
36.
28.
719
99
808.
945
2.0
24.4
181.
837
.024
.92.
59.
511
.97.
611
.020
00
689.
841
9.0
37.9
77.7
32.9
23.6
4.2
3.6
4.9
27.5
7.9
2001
71
9.5
451.
759
.970
.828
.913
.08.
37.
46.
98.
510
.120
02
722.
244
4.0
59.7
71.2
29.1
19.6
12.6
4.1
4.9
8.9
6.1
2003
80
8.8
501.
510
8.1
57.0
22.4
15.0
7.9
7.5
8.7
11.8
8.1
2004
10
55.7
639.
510
8.8
75.2
42.3
15.4
18.3
28.0
9.9
10.5
8.0
2005
12
67.3
846.
211
5.9
73.5
44.1
21.3
19.9
11.3
15.3
13.5
8.3
2006
16
32.7
1127
.618
5.6
86.2
45.2
22.7
20.5
12.0
18.0
11.3
15.5
Sour
ce: A
sian
Dev
elop
men
t Ban
k an
nual
repo
rt va
rious
issu
es.

342
Tab
le A
9.3:
Mya
nmar
’s D
irec
tion
of Im
port
s (in
US$
mill
ions
; cal
enda
r ye
ar)
1
2 3
4 5
6 7
8 9
10
Yea
r
Total
China
Singapore
Thailand
Malaysia
Korea
Japan
India
Indonesia
Hong Kong
Korea 19
89
194.
3 6.
111
.31.
15.
00.
175
.8
0.9
0.0
1.2
3.3
1990
66
7.7
137.
711
9.2
19.8
31.6
23.3
110.
8 1.
43.
28.
64.
019
91
1067
.9
314.
829
5.8
4.2
73.7
31.7
90.8
4.
27.
314
.74.
419
92
1045
.8
284.
928
8.6
-98
.634
.310
6.1
4.6
15.6
16.6
4.8
1993
12
80.1
35
7.2
368.
0-
114.
346
.211
0.0
15.9
43.7
44.7
5.8
1994
15
38.2
40
6.0
430.
3-
243.
562
.074
.6
26.4
38.7
48.8
6.9
1995
23
41.6
67
9.6
701.
2-
252.
395
.017
3.4
23.4
66.5
69.2
8.4
1996
26
77.8
57
3.2
794.
1-
242.
814
3.9
279.
4 50
.585
.810
0.8
9.9
1997
28
61.5
62
6.7
777.
3-
407.
515
0.5
232.
2 50
.216
4.7
77.7
10.9
1998
23
58.5
58
6.2
501.
3-
322.
616
3.7
205.
5 38
.418
4.1
51.1
12.4
1999
25
27.7
44
7.2
460.
243
5.3
257.
720
5.9
203.
5 36
.481
.870
.713
.120
00
3039
.2
546.
047
9.7
554.
725
4.1
318.
221
5.6
52.9
71.2
97.9
15.0
2001
26
62.8
54
7.3
465.
639
0.5
216.
725
5.3
205.
3 58
.475
.970
.116
.620
02
2968
.0
797.
357
6.6
355.
926
3.1
157.
812
6.9
78.7
59.8
69.9
18.0
2003
32
25.9
99
8.7
716.
048
3.3
154.
320
2.4
137.
0 94
.650
.248
.422
.820
04
3451
.8
1029
.271
7.1
665.
916
4.3
178.
211
5.8
115.
266
.348
.730
.020
05
3569
.1
1028
.465
6.1
777.
327
0.3
132.
010
1.0
121.
885
.839
.434
.220
06
3909
.6
1328
.061
9.6
837.
418
1.5
154.
910
5.7
142.
910
7.9
44.2
40.2
Sour
ce: A
sian
Dev
elop
men
t Ban
k an
nual
repo
rt va
rious
issu
es.
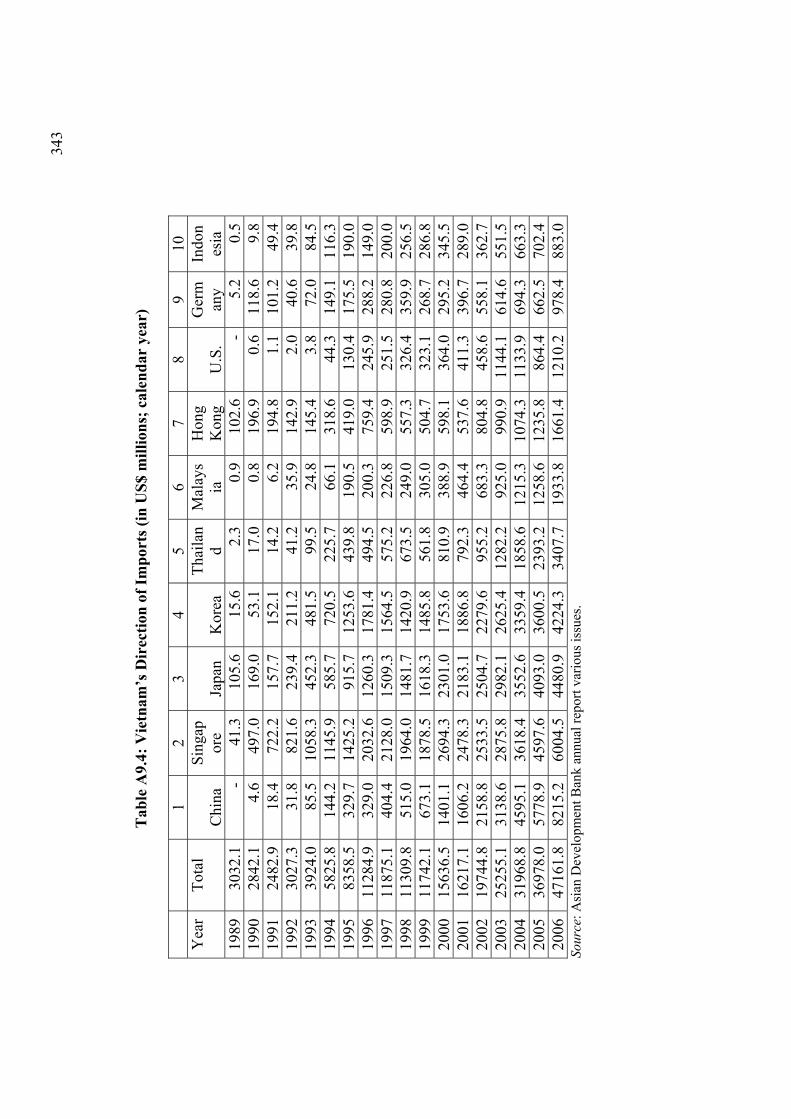
343
T
able
A9.
4: V
ietn
am’s
Dir
ectio
n of
Impo
rts (
in U
S$ m
illio
ns; c
alen
dar
year
)
1 2
3 4
5 6
7 8
9 10
Y
ear
Tota
l C
hina
Si
ngap
ore
Japa
n K
orea
Th
aila
nd
Mal
ays
ia
Hon
g K
ong
U.S
. G
erm
any
Indo
nes
ia
1989
3032
.1
-41
.310
5.6
15.6
2.3
0.9
102.
6-
5.2
0.5
1990
2842
.1
4.6
497.
016
9.0
53.1
17.0
0.8
196.
90.
611
8.6
9.8
1991
2482
.9
18.4
722.
215
7.7
152.
114
.26.
219
4.8
1.1
101.
249
.419
9230
27.3
31
.882
1.6
239.
421
1.2
41.2
35.9
142.
92.
040
.639
.819
9339
24.0
85
.510
58.3
452.
348
1.5
99.5
24.8
145.
43.
872
.084
.519
9458
25.8
14
4.2
1145
.958
5.7
720.
522
5.7
66.1
318.
644
.314
9.1
116.
319
9583
58.5
32
9.7
1425
.291
5.7
1253
.643
9.8
190.
541
9.0
130.
417
5.5
190.
019
9611
284.
9 32
9.0
2032
.612
60.3
1781
.449
4.5
200.
375
9.4
245.
928
8.2
149.
019
9711
875.
1 40
4.4
2128
.015
09.3
1564
.557
5.2
226.
859
8.9
251.
528
0.8
200.
019
9811
309.
8 51
5.0
1964
.014
81.7
1420
.967
3.5
249.
055
7.3
326.
435
9.9
256.
519
9911
742.
1 67
3.1
1878
.516
18.3
1485
.856
1.8
305.
050
4.7
323.
126
8.7
286.
820
0015
636.
5 14
01.1
2694
.323
01.0
1753
.681
0.9
388.
959
8.1
364.
029
5.2
345.
520
0116
217.
1 16
06.2
2478
.321
83.1
1886
.879
2.3
464.
453
7.6
411.
339
6.7
289.
020
0219
744.
8 21
58.8
2533
.525
04.7
2279
.695
5.2
683.
380
4.8
458.
655
8.1
362.
720
0325
255.
1 31
38.6
2875
.829
82.1
2625
.412
82.2
925.
099
0.9
1144
.161
4.6
551.
520
0431
968.
8 45
95.1
3618
.435
52.6
3359
.418
58.6
1215
.310
74.3
1133
.969
4.3
663.
320
0536
978.
0 57
78.9
4597
.640
93.0
3600
.523
93.2
1258
.612
35.8
864.
466
2.5
702.
420
0647
161.
8 82
15.2
6004
.544
80.9
4224
.334
07.7
1933
.816
61.4
1210
.297
8.4
883.
0So
urce
: Asi
an D
evel
opm
ent B
ank
annu
al re
port
vario
us is
sues
.

344
Table A10: Trade Intensity Index Among ASEAN (TII)
1997 1998 1999 2000 2001 TII (TH-CAM)
22.30 23.77 24.10 17.48 22.58
TII (CAM-TH)
6.11 2.88 1.40 0.50 0.72
TII (TH-LAO) 46.64 56.75 59.20 53.80 60.69 TII (LAO-TH) 13.23 10.00 17.34 19.10 23.30 TII (TH-MM) 13.93 11.94 13.30 18.14 11.13 TII (MM-TH) 5.99 6.05 7.71 12.07 26.22 TII (TH-VN) 3.72 4.36 3.89 4.06 3.81 TII (VN-TH) 1.49 2.68 1.84 1.93 1.76 TII (TH-BN) 2.58 2.77 - - - TII (BN-TH) 2.36 1.11 - - - TII (TH-IN) 2.36 3.14 3.23 3.00 3.40 TII (IN-TH) 1.22 1.94 2.11 1.75 1.96
TII (TH-MA) 2.52 2.61 2.61 2.61 2.88 TII (MA-TH) 2.78 3.20 2.76 2.87 2.84 TII (TH-PH) 1.42 2.03 2.27 2.41 2.85 TII (PH-TH) 1.61 2.25 2.16 2.46 2.84 TII (TH-SG) 3.81 3.93 3.65 3.37 3.52 TII (SG-TH) 1.85 2.33 2.41 2.08 1.90
Note: CAM = Cambodia, LAO = Lao PDR, MM = Myanmar, VN = Vietnam, BN = Brunei, IN = Indonesia, MA = Malaysia, PH = the Philippines, SG = Singapore, and TH = Thailand.
Source: Calculated using PC-TAS database.
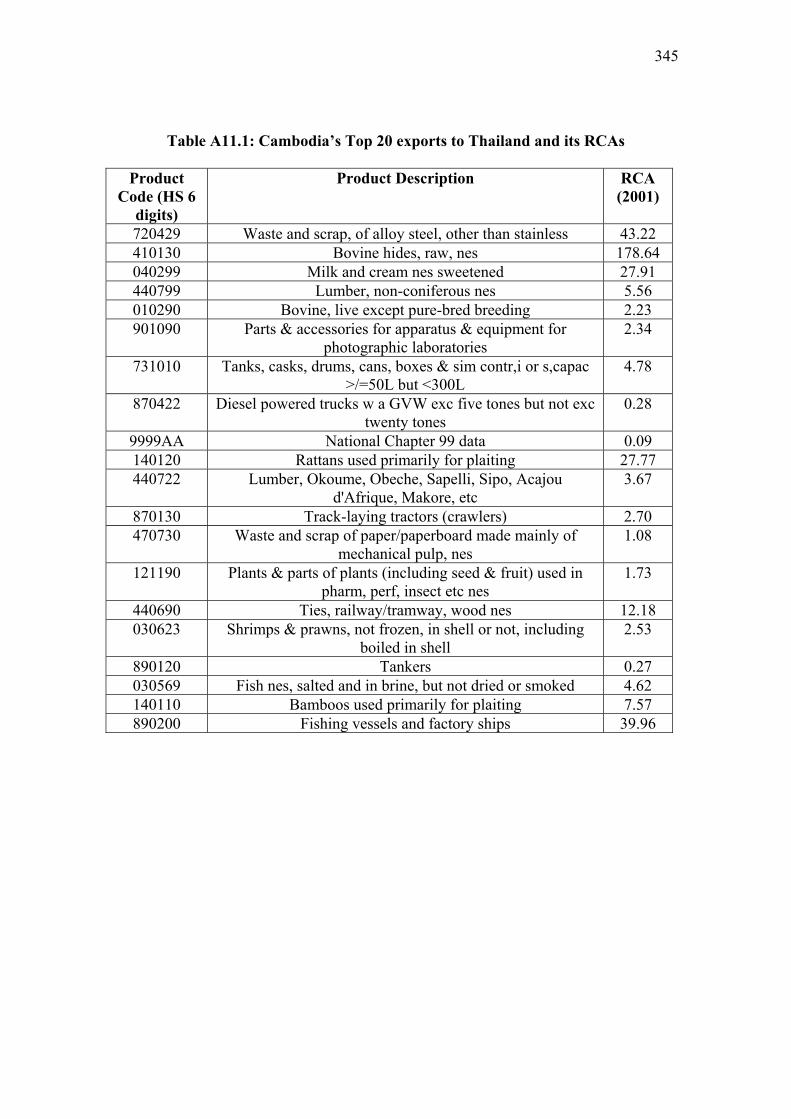
345
Table A11.1: Cambodia’s Top 20 exports to Thailand and its RCAs
Product Code (HS 6
digits)
Product Description RCA (2001)
720429 Waste and scrap, of alloy steel, other than stainless 43.22 410130 Bovine hides, raw, nes 178.64 040299 Milk and cream nes sweetened 27.91 440799 Lumber, non-coniferous nes 5.56 010290 Bovine, live except pure-bred breeding 2.23 901090 Parts & accessories for apparatus & equipment for
photographic laboratories 2.34
731010 Tanks, casks, drums, cans, boxes & sim contr,i or s,capac >/=50L but <300L
4.78
870422 Diesel powered trucks w a GVW exc five tones but not exc twenty tones
0.28
9999AA National Chapter 99 data 0.09 140120 Rattans used primarily for plaiting 27.77 440722 Lumber, Okoume, Obeche, Sapelli, Sipo, Acajou
d'Afrique, Makore, etc 3.67
870130 Track-laying tractors (crawlers) 2.70 470730 Waste and scrap of paper/paperboard made mainly of
mechanical pulp, nes 1.08
121190 Plants & parts of plants (including seed & fruit) used in pharm, perf, insect etc nes
1.73
440690 Ties, railway/tramway, wood nes 12.18 030623 Shrimps & prawns, not frozen, in shell or not, including
boiled in shell 2.53
890120 Tankers 0.27 030569 Fish nes, salted and in brine, but not dried or smoked 4.62 140110 Bamboos used primarily for plaiting 7.57 890200 Fishing vessels and factory ships 39.96

346
Table A11.2: Lao’s Top 20 exports to Thailand and its RCAs
Product Code (HS 6
digits)
Product Description RCA (2001)
440799 Lumber, non-coniferous nes 174.85 440722 Lumber, okoume, Obeche, sapelli, sipo, acajou d'Afrique,
makore etc 276.64
440333 Logs, keruing, ramin, kapur, teak, jongkong, merbau, etc. 153.76 440399 Logs, non-coniferous nes 108.55 010290 Bovine, live except pure-bred breeding 31.48 260900 Tin ores and concentrates 259.94 440710 Lumber, coniferous (softwood) 6 mm and thicker 4.92 260800 Zinc ores and concentrates 20.55 270119 Coal nes, whether or not pulverized but not agglomerated 9.00 9999AA National Chapter 99 data 0.28 870410 Dump trucks designed for off-highway use 14.04 440920 Wood (lumber) continuously shaped non-coniferous
(hardwood) 51.07
130190 Natural gums, resins, gum-resins and balsam, except Arabic gum
265.35
441299 Panels, 1 outer ply coniferous wood nes 27.63 440110 Fuel wood 207.60 410422 Bovine leather, otherwise pre-tanned, nes 3.29 710239 Diamonds non-industrial nes excluding mounted or set
diamonds 0.54
850450 Inductors, electric 1.79 121190 Plants & pts of plants(incl seed & fruit) used in pharm,
perf, insect etc nes 31.13
870590 Special purpose motor vehicles nes 5.02
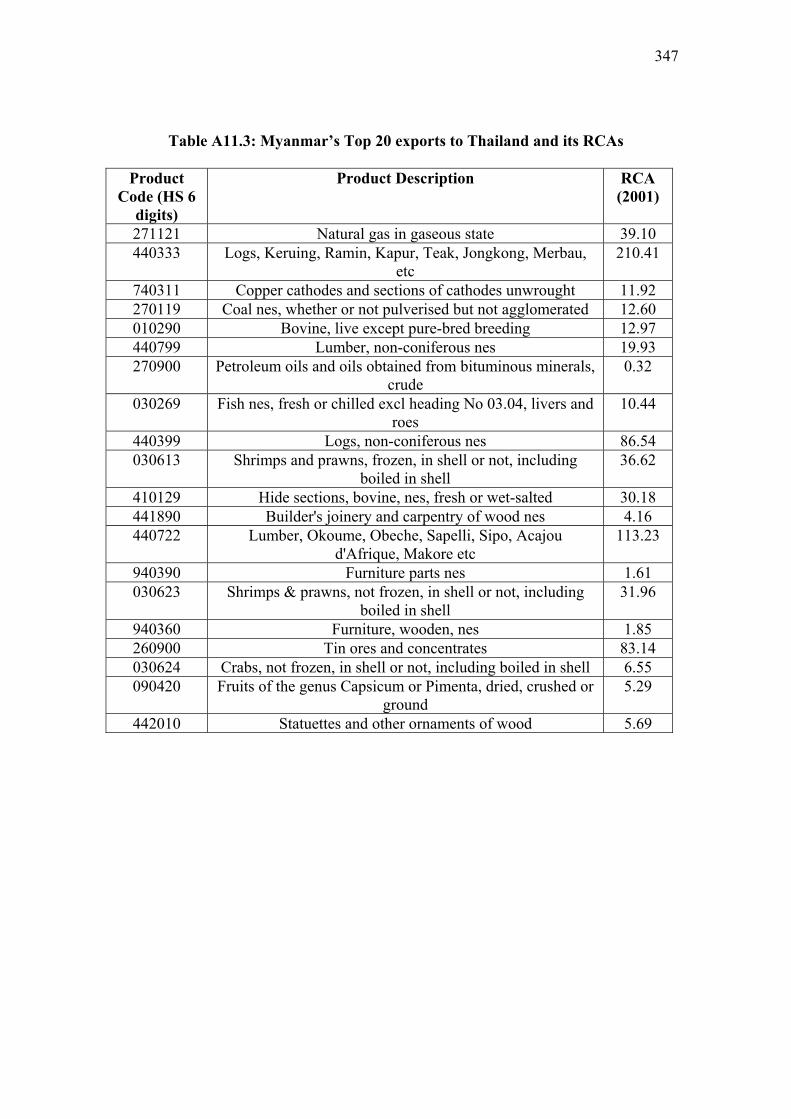
347
Table A11.3: Myanmar’s Top 20 exports to Thailand and its RCAs
Product Code (HS 6
digits)
Product Description RCA (2001)
271121 Natural gas in gaseous state 39.10 440333 Logs, Keruing, Ramin, Kapur, Teak, Jongkong, Merbau,
etc 210.41
740311 Copper cathodes and sections of cathodes unwrought 11.92 270119 Coal nes, whether or not pulverised but not agglomerated 12.60 010290 Bovine, live except pure-bred breeding 12.97 440799 Lumber, non-coniferous nes 19.93 270900 Petroleum oils and oils obtained from bituminous minerals,
crude 0.32
030269 Fish nes, fresh or chilled excl heading No 03.04, livers and roes
10.44
440399 Logs, non-coniferous nes 86.54 030613 Shrimps and prawns, frozen, in shell or not, including
boiled in shell 36.62
410129 Hide sections, bovine, nes, fresh or wet-salted 30.18 441890 Builder's joinery and carpentry of wood nes 4.16 440722 Lumber, Okoume, Obeche, Sapelli, Sipo, Acajou
d'Afrique, Makore etc 113.23
940390 Furniture parts nes 1.61 030623 Shrimps & prawns, not frozen, in shell or not, including
boiled in shell 31.96
940360 Furniture, wooden, nes 1.85 260900 Tin ores and concentrates 83.14 030624 Crabs, not frozen, in shell or not, including boiled in shell 6.55 090420 Fruits of the genus Capsicum or Pimenta, dried, crushed or
ground 5.29
442010 Statuettes and other ornaments of wood 5.69

348
Table A11.4: Vietnam’s Top 20 exports to Thailand and its RCAs Product
Code (HS 6 digits)
Product Description RCA (2001)
853710 Boards, panels, including numerical control panels, for a voltage </=1000 V
7.09
270900 Petroleum oils and oils obtained from bituminous minerals, crude
4.38
270119 Coal nes, whether or not pulverized but not agglomerated 2.14 120220 Ground-nuts shelled, whether or not broken, not roasted or
otherwise cooked 13.91
410129 Hide sections, bovine, nes, fresh or wet-salted 13.99 030749 Cuttlefish and squid, shelled or not, frozen, dried, salted or
in brine 31.86
270111 Anthracite, whether or not pulverised but not agglomerated 55.54 030613 Shrimps and prawns, frozen, in shell or not, including
boiled in shell 33.76
391990 Self-adhesive plates, sheets, film etc, of plastic nes 0.70 850110 Electric motors of an output not exceeding 37.5 W 2.80 160510 Crab, prepared or preserved 13.97 854449 Electric conductors, for a voltage not exceeding 80 V, nes 0.51 260800 Zinc ores and concentrates 1.33 420212 Trunks, suit-cases & sim container w/outer surface of
plastics/textiles 7.44
550953 Yarn of polyester staple fibers mixed with cotton, not put up, nes
14.28
730890 Structures & parts of structures, i/s (ex prefab bldgs. of head’g no.9406)
0.35
701339 Table/kitchenware (excluding drinking glasses) other than glass-ceramics nes
1.27
853400 Printed circuits 4.00 030420 Fish fillets frozen 8.62 030759 Octopus, frozen, dried, salted or in brine 17.56

351
Chapter 10
CHALLENGES, POROSPECTS AND STRATEGIES FOR CLMV DEVELOPMENT: THE CASE OF CAMBODIA
Chap Sotharith
ABSTRACT
After achieving peace and national reconciliation through the 1991 Paris Accord and the
1993 General Election, Cambodia has enjoyed macroeconomic and political stability for
the past 10 years. Though starting from a very low base, Cambodia is considered one of
the fastest-growing economies in the region with a double-digit growth for the past five
years. Many reforms have been well underway for its successful transformation, from a
country in intense conflict to a country in postwar reconstruction committed to peace-
building and democratic reforms. However, the development challenges persist,
including high poverty rate, wide income gap, low production base, and poor human
resources. The country remains poor and governance weaknesses limit both critical
spending and the environment for broad-based development. Growth has been narrowly
based on garment exports and tourism. This paper explores the challenges, prospects,
and strategies for Cambodia to narrow the development gap in the age of regional
integration and globalization.
1. INTRODUCTION
Throughout her long history, Cambodia has experienced many regime changes,
including coup, political strife, civil war, and genocide, which resulted in the destruction
of social and economic infrastructures. With the 1991 Paris Peace Accord and the 1993
General Election, Cambodia has regained full political legitimacy, undertaking various

352
reforms to change from a planned to a market economy and has become a member of
the Association of South East Nations (ASEAN) in 1999 and the World Trade
Organization (WTO) in 2004.
Cambodia has enjoyed macroeconomic stability in recent years, underpinned by
prudent fiscal and monetary policies. Though starting from a very low base, Cambodian
economy is considered one of the fastest-growing economies in the region, with a
double-digit growth for the past five years and remarkable macroeconomic stability.
Though unemployment and underemployment still exist, the economy has successfully
created new jobs to absorb the rising working-age population, which has been growing
faster than the population at three percent annually.
Many reforms have been well underway for its successful transformation, from a
country in intense conflict to a country in postwar reconstruction committed to peace-
building and democratic reforms, including economic rehabilitation especially in the
new age of globalization. Nevertheless, Cambodia is still facing a huge challenge in
fighting poverty, narrowing gaps in wealth among its people as well as development
gaps within regions of the country, both in the rural and urban areas.
2. DEVELOPMENT TREND AND ISSUES
2.1 Macroeconomic situation
After achieving full peace in 1999, the Cambodian economy has become more resilient
and dynamic despite major challenges faced by the regional and global economy and

353
the unfavorable natural disasters in the country. For the period 2000-2006, it has
achieved an average growth of approximately 9.4 per annum. In particular, during the
last three years, economic growth reached unprecedented double-digit rates of 11.4
percent per year on the average, with 2005 as its peak year for reaching 13.5 percent. In
2006, economic growth was 10.8 percent and is projected to be 9.5 percent in 2007. The
average per capita income almost doubled from US$288 in 2000 to US$513 in 2006.
Inflation has been kept low at an average of below three percent between 2000 and 2006
(Source: Prime Minister Hun Sen’s Speech at the 1st Cambodia Development
Cooperation Forum, Phnom Penh, 19 June 2007). The exchange rate has been broadly
stable at around 4,050 riels per US dollar. During the same period, the country’s
international reserves doubled from about US$500 million in 2000 to more than US$1
billion in 2006 or about three months of imports. Inflation will continue to be
maintained under a five percent rate and the exchange rate will be stable.
Figure 1: Cambodia Economic Growth Rate (1996-2008)
Cambodia Economic Growth rate (1996- 2008)
0.00%
2.00%
4.00%
6.00%
8.00%
10.00%
12.00%
14.00%
16.00%
1996
1997
1998
1999
2000
2001
2002
2003
2004
2005
2006
2007
e20
08e
Growth rate
Source: Hang (2007)
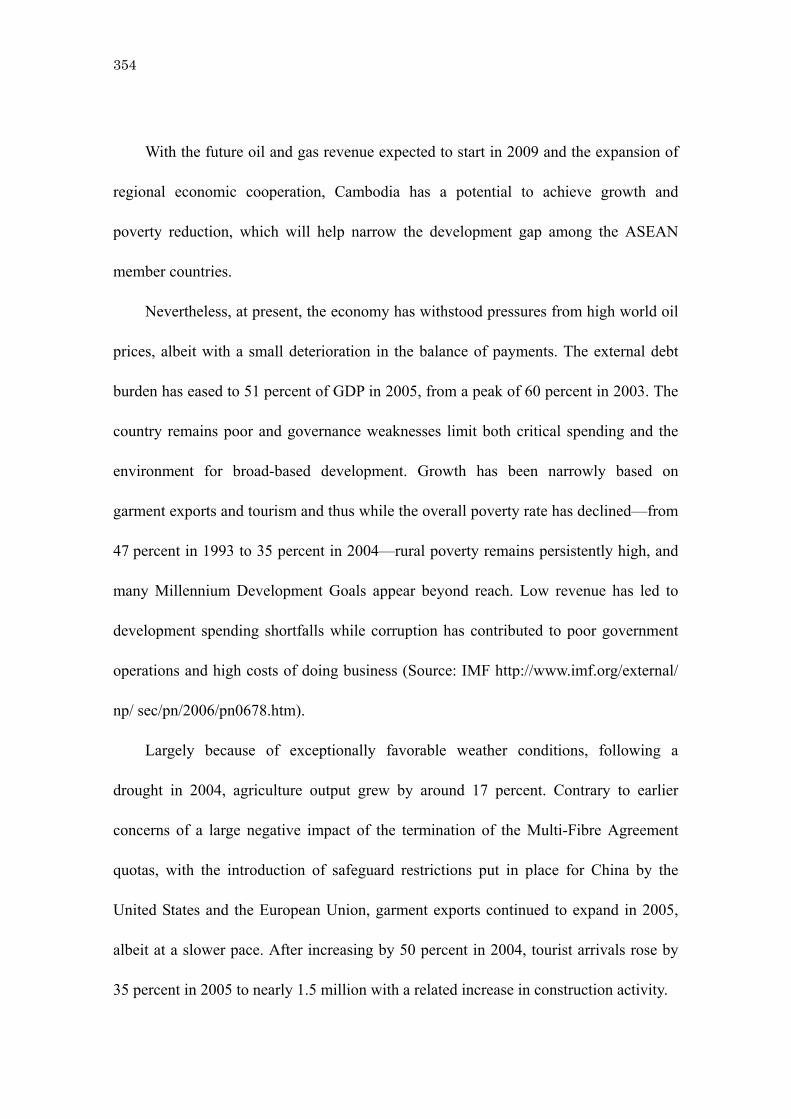
354
With the future oil and gas revenue expected to start in 2009 and the expansion of
regional economic cooperation, Cambodia has a potential to achieve growth and
poverty reduction, which will help narrow the development gap among the ASEAN
member countries.
Nevertheless, at present, the economy has withstood pressures from high world oil
prices, albeit with a small deterioration in the balance of payments. The external debt
burden has eased to 51 percent of GDP in 2005, from a peak of 60 percent in 2003. The
country remains poor and governance weaknesses limit both critical spending and the
environment for broad-based development. Growth has been narrowly based on
garment exports and tourism and thus while the overall poverty rate has declined—from
47 percent in 1993 to 35 percent in 2004—rural poverty remains persistently high, and
many Millennium Development Goals appear beyond reach. Low revenue has led to
development spending shortfalls while corruption has contributed to poor government
operations and high costs of doing business (Source: IMF http://www.imf.org/external/
np/ sec/pn/2006/pn0678.htm).
Largely because of exceptionally favorable weather conditions, following a
drought in 2004, agriculture output grew by around 17 percent. Contrary to earlier
concerns of a large negative impact of the termination of the Multi-Fibre Agreement
quotas, with the introduction of safeguard restrictions put in place for China by the
United States and the European Union, garment exports continued to expand in 2005,
albeit at a slower pace. After increasing by 50 percent in 2004, tourist arrivals rose by
35 percent in 2005 to nearly 1.5 million with a related increase in construction activity.

355
Fiscal policy was cautious, as expenditure restraint and slower donor project
execution led to a decline in the overall deficit to 3.5 percent of GDP in 2005, from 4.75
percent in 2004. The deficit was again more than financed by external aid. Despite
greater than budgeted tax revenues and one-off receipts from the privatization of a state
bank, the revenue-to-GDP ratio in 2005 was only 10.5 percent. Expenditure declined as
a share of GDP as capital spending continued its downward trend—in line with external
financing—and current spending grew only moderately.
Financial intermediation continued to expand, in the context of extremely high
dollarization. Broad money and bank deposits grew by about 16 percent (year-on-year)
in 2005 and have picked up pace in early 2006. The banking system, however, remains
relatively undeveloped and concentrated, financial intermediation remains low, and
private sector credit averaged less than 10 percent of GDP in 2005, allocated mainly to
the services and retail sectors.
External developments were mixed. Robust tourism earnings and tourism only
partly offset higher petroleum prices and strong nongarment imports. The current
account deficit (excluding transfers) widened to 9.5 percent of GDP in 2005, but this
was financed by an upswing in foreign direct investment (FDI), which was concentrated
on the garment, tourism, and construction sectors. The riel was fairly stable both in
terms of dollars and partner country currencies.
Progress has been made on the wide-ranging structural reform agenda. The
authorities are implementing their flagship Public Financial Management (PFM) reform
program, which addresses the weaknesses of Cambodia’s public expenditure

356
management system. In the area of land policy, the issuances of subdecrees on
economic land concessions and on state land management were significant
developments.
2.2 Economic Structure
Cambodia’s economy is based mainly on garment export, services (in which tourism is
the biggest part), and agriculture. The composition of real GDP is shown in Figure 2.
Comparing real GDP composition in 1999 and 2005, the most distinctive change found
is the drop in the share of agriculture, from 39.4 percent to 31.4 percent, while that of
manufacturing has seen a rapid growth, from 18.0 percent to 27.0 percent (Council for
the Development of Cambodia 2006).
Figure 2: Composition of GDP by Industry
Source: CDC (2006).
Growth of agriculture gross value added (GVA) increased by 28 percent, the

357
highest agriculture sector production on record. This stellar performance was
attributable to excellent weather conditions, improved irrigation, and increased acreage
under cultivation. Fisheries GVA increased by 5.6 percent, and livestock and poultry
GVA grew by 5.8 percent. Forestry GVA increased by 5.4 percent, with logging for
domestic use being partly offset by the decrease in illegal logging for export.
As for industry, garment (and apparel) has drastically increased in share from 5.9
percent to 14.9 percent, becoming the single dominant manufacturing subsector of
Cambodia. The industry sector grew by 12.1 percent in 2005, accounting for 27 percent
of total GDP in constant 2000 prices. It should be noted that the share held by industry
declined in 2005 owing to the exceptional growth in agriculture and services, which
grew at the same rate as industry. The main contributors to the growth of the industrial
sector were garment manufacturing and construction. Textiles, wearing apparel, and
footwear manufacturing GVA increased by 10.3 percent in 2005 (24.9% in 2004 and
16.8% in 2003). However, export products under the Generalized System of Preferences,
mainly manufactured garments, declined from 83 percent of Cambodia's total goods
exports in 2004 to 82.4 percent in 2005 in constant 2000 prices. Construction GVA also
made a large contribution to 2005 growth, increasing by 20.1 percent (13.2% in 2004
and 11.l% in 2003). Significant increases in construction of residential dwellings, hotels,
and factories have been among the main contributors to the high GDP growth rates
during the last four years.
The services sector has had a relatively stable share, between 36 percent and 38
percent, in recent years. It grew by 12.1 percent in 2005, accounting for 36.2 percent of
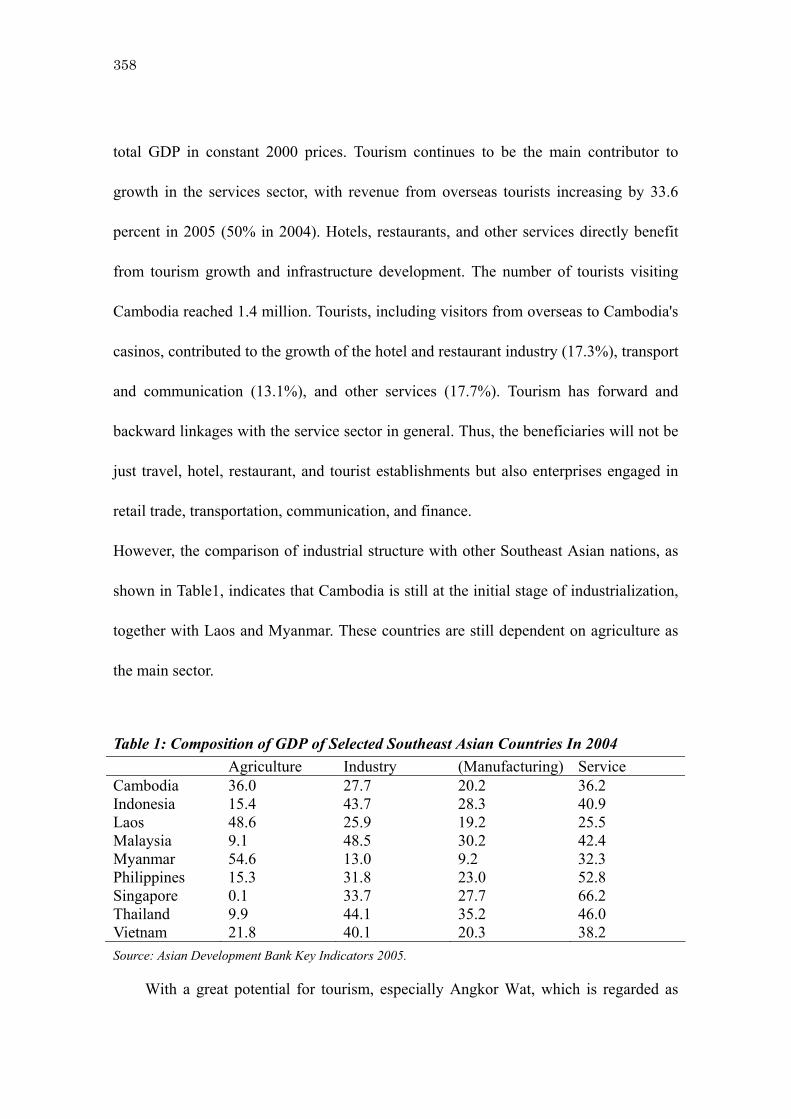
358
total GDP in constant 2000 prices. Tourism continues to be the main contributor to
growth in the services sector, with revenue from overseas tourists increasing by 33.6
percent in 2005 (50% in 2004). Hotels, restaurants, and other services directly benefit
from tourism growth and infrastructure development. The number of tourists visiting
Cambodia reached 1.4 million. Tourists, including visitors from overseas to Cambodia's
casinos, contributed to the growth of the hotel and restaurant industry (17.3%), transport
and communication (13.1%), and other services (17.7%). Tourism has forward and
backward linkages with the service sector in general. Thus, the beneficiaries will not be
just travel, hotel, restaurant, and tourist establishments but also enterprises engaged in
retail trade, transportation, communication, and finance.
However, the comparison of industrial structure with other Southeast Asian nations, as
shown in Table1, indicates that Cambodia is still at the initial stage of industrialization,
together with Laos and Myanmar. These countries are still dependent on agriculture as
the main sector.
Table 1: Composition of GDP of Selected Southeast Asian Countries In 2004 Agriculture Industry (Manufacturing) Service Cambodia 36.0 27.7 20.2 36.2 Indonesia 15.4 43.7 28.3 40.9 Laos 48.6 25.9 19.2 25.5 Malaysia 9.1 48.5 30.2 42.4 Myanmar 54.6 13.0 9.2 32.3 Philippines 15.3 31.8 23.0 52.8 Singapore 0.1 33.7 27.7 66.2 Thailand 9.9 44.1 35.2 46.0 Vietnam 21.8 40.1 20.3 38.2 Source: Asian Development Bank Key Indicators 2005.
With a great potential for tourism, especially Angkor Wat, which is regarded as

359
one of the World’s Wonders, Cambodia can use tourism as an engine of growth.
Revenue from tourism amounted to more than US$2 billion in 2006 or about 20 percent
of the GDP (Source: Ministry of Tourism). At 1.7 million in 2006, tourist arrivals are
expected to reach 2 million in 2007, with the largest number likely to come from South
Korea and Japan (See figure 3).
Figure 3: Tourist Arrivals 2004- 2007
Tourist arrivals 1994- 2007
177000466000
1,055,202
1,421,6151,700,000
2,000,000
0
500000
1000000
1500000
2000000
2500000
1994 2000 2004 2005 2006 2007e
Tourist arrivals
Source: Ministry of Tourism
Progress has been made on the wide-ranging structural reform agenda. The
authorities are implementing their flagship Public Financial Management (PFM) reform
program, which addresses the weaknesses of Cambodia’s public expenditure
management system. In the area of land policy, the issuances of subdecrees on
economic land concessions and on state land management were significant
developments.

360
2.3 Trade Pattern
Cambodia’s exports increased by 102 percent from 2002 to 2006 (US$1.7 billion to
US$3.6 billion. Exports continued to rise at about 27.5 percent in 2006 from US$2.9
billion in 2005 due to the continued increase of textile and garment exports (Hang 2007,
p.22). Garment exports increased by 18.2 percent from US$2.2 billion in 2005 to
US$2.6 billion in 2006. Garment exports accounted for 75.7 percent of total export in
2006, followed by paper and pulp (18.6%) (Table 2). Cambodia’s trade deficit is about
US$1 billion in 2006 (Chap 2007, p.15).
Though Cambodia is an agricultural country, trade in agriculture is conducted
mainly within Cambodia. It exports garment and textile products and some primary
agro-product such as paddy, rice, rubber, raw fish, maize, and others. In 2006, export in
agriculture covered only about one percent of total export, and was dominated by textile
and apparel products (see Table 2).
The current underperformance of agricultural exports in Cambodia is the result of
several problems such as high cost of production, processing, and transportation, lack of
a developed marketing and postharvest system, difficulty in procurement of raw
materials, widespread corruption practices, an underdeveloped financial system, and the
lack of certification for Cambodian products (Ministry of Commerce 2001). In spite
of all these constraints, export potential is still present and could be seized if adequate
institutional, policy, and investment measures are set in place. The potential of export
Table 2: Comparison of Cambodia Export 2002 and 2006 Chapter Section 2002 ($) 2006 ($) % change % of 2006

361
5-Jan Live Animal 6,080,158 6,273,395 3% 0.2%14-Jun Vegetable Products 5,568,898 11,262,225 102% 0.3%15 Fats and Oils 5,549 1,152,871 20677% 0.0%16-24 Prepared Foodstuffs 3,985,993 9,485,156 138% 0.3%25-27 Mineral Products 14,386 2,290 -84% 0.0%28-38 Chemicals 440,259 1,404,812 219% 0.0%39-40 Plastics 29,641,234 50,502,456 70% 1.4%41-43 Hides and Leather 1,571,501 2,384,672 52% 0.1%44-46 Wood and Wood articles 15,906,674 10,132,098 -36% 0.3%47-49 Pulp and paper 423,231,534 662,468,337 57% 18.6%50-63 Textiles and apparel 1,206,864,927 2,700,415,433 124% 75.7%64-67 Footwear 41,963,995 67,661,560 61% 1.9%68-70 Stone/Cement/Ceramics 32,238 1,281,611 3,876% 0.0%71 Gems 16,525,788 15,880,087 -4% 0.4%72-83 Base metal and Metal articles 1,141,799 4,161,898 265% 0.1%
84-85 Machinery and Electrical Appliances 7,778,520 18,242,805 135% 0.5%
86-89 Vehicles 5,466,119 582,316 -89% 0.0%
90-92 Optical, precision & musical instruments 996,637 1,010,408 1% 0.0%
93 Arms 9,250 106,321 1,049% 0.0%
94-96 Miscellaneous Manufactured articles 1,635,521 4,648,143 184% 0.1%
97-98 Antiques and works of art 287,352 376,385 31% 0.0% Total 1,769,148,331 3,569,435,279 102% 100.0%
Source: Using Data provided by Ministry of Commerce.
already exists in the case of high-quality rice, fishery products, live cattle, soybean,
maize, rubber, sesame, and pepper.
Lack of processing plants for agro-products, lack of access to market information,
and poor-quality agricultural commodities are among the biggest challenge. High
domestic cost, poor infrastructure, administrative inefficiencies, and lack of investment
in processing capacity all discourage formal trade. Farmers and wholesalers often take
the easiest option—selling to traders from neighboring markets who are able to bear the
informal costs of moving commodities out of Cambodia for processing and onward
sales. The regulatory reforms that WTO membership requires, and preferential market
access, should improve the situation. The global trading environment, however, is

362
improving only gradually under WTO rules. High tariff barriers, poor quality of goods,
and food safety requirements will need to be understood to take advantage of new
opportunities (Ministry of Commerce and Mekong Private Sector Development Facility
2005).
2.4 Foreign Direct Investment
Information from the Council for the Development of Cambodia (CDC) shows that FDI
inflows to Cambodia have been very high. Cambodia attracted about US$924 million
per year from 1994 to 2007. The peak years were 1995 and 2006.
From 1998 to 2006, the actual FDI inflow to Cambodia was recorded at about
US$222 million per year compared to US$1.6 billion that went to Vietnam, US$5.6
billion received by Thailand, US$3.47 billion that went to Malaysia, and US$14.4
billion given to Singapore. However, Cambodia received more FDI than Lao PDR,
which received only US$47.9 million per year during the same period (see Table 4). The
biggest parts of FDI are from China, Korea, and other countries in the region.

363
Table 3: Proposed FDI in Cambodia (1994- 2007) Year FDI % increase Projects Capital per
Project 1994 505,698,494 100 26 19,449,942 1995 2,242,890,373 344% 124 18,087,826 1996 766,662,160 -66% 188 4,077,990 1997 744,510,560 -3% 205 3,631,759 1998 853,924,698 15% 144 5,930,033 1999 356,655,269 -58% 91 3,919,289 2000 218,037,881 -39% 61 3,574,391 2001 204,683,613 -6% 39 5,248,298 2002 235,602,572 15% 32 7,362,580 2003 251,233,736 7% 47 5,345,399 2004 210,440,247 -16% 52 4,046,928 2005 962,378,619 357% 91 10,575,589 2006 3,467,851,384 260% 86 40,323,853 2007* 1,925,728,571 -44% 90 21,396,984 Total 12,946,298,177 1,276 Average 924,735,584 Source: CDC database Note: * From January to September 2007
Table 4. Comparison of FDI in ASEAN (1998- 2006) (million of USD)
Country 1998 1999 2000 2001 2002 2003 2004 2005 2006 Average 1998-2006
Brunei 573.3
747.60 549.20
526.40
1,035.30
3,123.00
212.01
288.54
433.50 832.09
Cambodia 242.9
232.30 148.50
149.40
145.10
84.00
131.38
381.22
483.24 222.00
Indonesia -356 -
2,745.10 - 4,550.00
- 3,278.50
144.70
- 595.60
1,894.50
8,335.98
5,556.24 489.58
Lao, PDR 45.3
51.60 34.00
23.90
25.40
19.50
16.92
27.73
187.40 47.97
Malaysia 2,714.00
3,895.10 3,787.60
553.90
3,203.40
2,473.20
4,623.89
3,964.79
6,059.73 3,475.07
Myanmar 683.4
304.20 208.00
192.00
191.40
291.20
251.13
235.85
142.96 277.79
Philippines 1,718.00
1,725.00 1,345.00
982.00
1,111.00
319.00
687.80
1,854.00
2,345.01 1,342.98
Singapore 7,594.30
16,067.40 16,485.40
14,121.70
5,821.30
9,330.60
19,827.50
15,001.90
24,055.40 14,256.17
Thailand 7,491.20
7,491.20 3,350.30
3,886.00
947.00
1,952.00
5,862.00
8,957.00
10,756.06 5,632.53
Viet Nam 1,700.00
1,483.90 1,288.70
1,300.30
1,200.10
1,450.10
1,610.10
2,020.81
2,360.00 1,601.56
Source: ASEAN Statistical Year Book 2005 and ASEAN Website: http://www.aseansec.org/Stat/Table25.xls

364
Table 5. Comparison of GDP of ASEAN Countries
Country 1998 1999 2000 2001 2002 2003 2004 2005 2006
Brunei 3,865 4,190 4,315 4,176 5,847 6,540 7,864 9,528 11,551Cambodia 3,027 3,427 3,546 3,702 4,028 4,634 5,311 6,250 7,257Indonesia 97,808 140,787 150,567 143,602 204,499 237,663 251,647 280,265 364,259Lao, PDR 1,286 1,451 1,733 1,754 1,805 2,135 2,518 2,860 3,522Malaysia 72,237 79,149 90,320 88,001 95,266 103,992 124,750 137,180 156,924Myanmar 2/ 6,953 9,275 10,549 8,281 7,095 11,747 10,585 11,169 11,950Philippines 65,548 76,076 74,837 71,985 76,648 79,578 86,912 98,757 117,457Singapore 81,940 81,414 91,429 84,909 88,106 92,372 107,464 116,639 132,273Thailand 112,751 122,698 122,969 115,601 126,880 142,863 161,386 176,207 206,645Viet Nam 27,209 28,677 31,319 32,647 35,066 39,535 45,544 52,953 60,965
Source: ASEAN Statistical Year Book 2005 and ASEAN Website: http://www.aseansec.org/Stat/Table5.xls
Table 6. Comparison of FDI per GDP of ASEAN Countries
Country 1998 1999 2000 2001 2002 2003 2004 2005 2006 Average 1998-2006
Brunei 14.8% 17.8% 12.7% 12.6% 17.7% 47.8% 2.7% 3.0% 3.8% 14.8%Cambodia 8.0% 6.8% 4.2% 4.0% 3.6% 1.8% 2.5% 6.1% 6.7% 4.9%Indonesia -0.4% -1.9% -3.0% -2.3% 0.1% -0.3% 0.8% 3.0% 1.5% -0.3%Lao, PDR 3.5% 3.6% 2.0% 1.4% 1.4% 0.9% 0.7% 1.0% 5.3% 2.2%Malaysia 3.8% 4.9% 4.2% 0.6% 3.4% 2.4% 3.7% 2.9% 3.9% 3.3%Myanmar 2/ 9.8% 3.3% 2.0% 2.3% 2.7% 2.5% 2.4% 2.1% 1.2% 3.1%Philippines 2.6% 2.3% 1.8% 1.4% 1.4% 0.4% 0.8% 1.9% 2.0% 1.6%Singapore 9.3% 19.7% 18.0% 16.6% 6.6% 10.1% 18.5% 12.9% 18.2% 14.4%Thailand 6.6% 6.1% 2.7% 3.4% 0.7% 1.4% 3.6% 5.1% 5.2% 3.9%Viet Nam 6.2% 5.2% 4.1% 4.0% 3.4% 3.7% 3.5% 3.8% 3.9% 4.2%
Source: Table 4 and Table 5
It is very difficult to compare the FDI inflow among countries with different sizes of
economies. One US$ billion invested in Thailand is quite different with the same amount
invested in Cambodia. To be fair, FDI can be measured by using FDI per GDP as the
basis for comparison. Using the figures of FDI in ASEAN countries (Table 4) and the
GDP in ASEAN countries (Table 5), the result is presented in Table 6.

365
Based on this method, Cambodia was the third highest FDI recipient in the ASEAN,
next to Brunei and Singapore from 1998 to 2006. In Cambodia, FDI covers 4.9 percent of
the GDP compared with 14.8 percent in Brunei and 14.4 percent in Singapore (see Table
6).
The figures received from the official documents of the CDC only indicate
registered capital or pledges made by investor to make the project look attractive for
incentives. The investors may exaggerate the amount of investment capital in their
applications to gain better incentives from the government as the policy states that the
more investment capital is made, the more incentive the government will offer. No data
were available on actual or realized FDI from the CDC (Chap 2005, p.37).
Some investors were in a hit-and-run position with money laundering and
speculation for a quick profit. “Sincere” investors also face problems with uncertainty of
risks and hesitation to invest in the country. Many middlemen (intermediaries) who have a
close link with the Government are involved in corruption to get licenses and concessions,
especially for the exploitation of natural resources (forestry, mining, etc). They sell the
licenses for a profit, or delay or cancel them completely if they could not find potential
buyers.
3. ECONOMIC DEVELOPMENT POLICY
3.1 Five-Year Plans
Cambodia has implemented its five-year plans, namely: first Socio-Economic

366
Development Plan, SEDP I (1996-2000); second Socio-Economic Development Plan,
SEDP II (2001-2005); and the third five-year plan, whose name has been changed to
National Strategic Development Plan, NSDP (2006-2010). The third five-year plan,
NSDP, focuses on the following three main points: (1) to speed up and ensure
sustainable economic growth of 6-7 percent per annum; (2) to implement population
policy adopted by the Royal Government by focusing on birth spacing and ensuring the
quality and health of human resources; and (3) to rigorously implement governance
reform especially corruption eradication to equally distribute economic outcome (Royal
Government of Cambodia 2006). The NSDP has integrated many policy instruments
such as Rectangular Strategy, 73-point Government Political Agenda, Cambodian
Millennium Development Goal, and National Poverty Reduction Strategy.
3.2 Development Strategies
The Government of the second legislative (1997-2003) used a political strategy called
the triangular strategy (1997-2003) consisting of political stability, economic
integration, and poverty reduction. The present Government (2003-2008) is
implementing the so-called “Triangular Strategy” with the motto of “for growth,
employment, equity, and efficiency.”
The rectangular strategy is an integrated structure of interlocking rectangles, as
follows:
First, the core of the rectangular strategy is good governance, focused at four
reform areas: (1) anticorruption, (2) legal and judicial reform, (3) public administration,

367
and (4) reform of the armed forces, especially demobilization. Second, the overall
environment for the implementation of the rectangular strategy consists of four
elements: (1) peace, political stability, and social order; (2) partnership in development
with all stakeholders, including the private sector, donor community, and civil society;
(3) favorable economic and financial environment; and (4) the integration of Cambodia
into the region and the world. Third, the four strategic “growth rectangles” are: (1)
enhancement of agricultural sector; (2) private sector development and employment
generation; (3) continued rehabilitation and construction of physical infrastructure; and
(4) capacity building and human resource development (see Figure 4).
Figure 4: Rectangular Strategy of Royal Government of Cambodia (2003- 2008)
Source: Council for Administration Reform

368
3.3 Regional and Global Integration
The Royal Government is committed to integrate Cambodia into the regional and global
economies, specifically focusing on bridging the development gaps among member
countries of the ASEAN by promoting full partnership in the implementation of the
various elements of the Initiatives for ASEAN Integration as adopted by the ASEAN
Summits, in particular the measures and projects adopted by the 8th Summit in
November 2002 in Phnom Penh. The Royal Government will also continue its active
participation in the implementation of the Greater Mekong Sub-region Program,
especially the flagship programs adopted by the 1st Summit of Greater Mekong Sub-
region Program in Phnom Penh in November 2002, and the projects under the
“Development Triangle Zones” among Cambodia, Viet Nam, and Lao PDR, the
“Development Triangle Zones” among Cambodia, Lao PDR, and Thailand, and the
“Economic Cooperation Strategy” among Cambodia, Lao PDR, Thailand, and Myanmar.
To maximize the gains from international integration, Cambodia must strengthen its
institutional capacity to implement cooperative strategies with neighboring countries
such as the concept of “Four Countries-One Economy,” the creation of the triangles for
economic growth, and the establishment of cross-border Economic Processing Zones
(Royal Government of Cambodia 2004).
There is worldwide recognition that free trade significantly contributes to the
reduction of poverty and improvement of the living standards of the people. Thus, the
Royal Government will continue to liberalize trade and ensure free flow of goods and
services both within the country and between Cambodia and other key partners in the

369
region and the world. Increasing the unfettered access of Cambodian products to the
regional and world markets will provide Cambodia with the economies of scale and
opportunities that attract investment, create employment, generate increased incomes,
and promote accelerated economic growth that will result in poverty reduction. Indeed,
Cambodia’s participation in the ASEAN Free Trade Area (AFTA) and accession to the
WTO constitute strategic and historical steps in the rehabilitation and development of
Cambodia.
The Royal Government will strictly implement its obligations under the WTO,
recognizing that Cambodia’s membership in the WTO requires great efforts in the
formulation, adoption, and implementation of laws, regulations, procedures, and
methodology for valuation, assessment report on the effects of trade protection, studies
on rice production and agricultural markets, agricultural value chain analysis,
handicrafts, pure drinking water, fisheries, factories, tourism, and other labor services
that Cambodia can benefit from the WTO. The Royal Government is strongly
committed to using this opportunity to embark on reforms in all sectors.
4. COUNTRY’S STRENGTH IN COMPETITIVENESS
(1) Competitive Advantages
Cambodia has potentials for development in many sectors such as agriculture, agro-
industry, tourism, and labor-intensive industry. Cambodia is located in the fastest-
growing economic region of the world in which foreign and investment interlinkages

370
are higher than in any other developing regions. The country is also relatively richly
endowed with agricultural, forest, and marine resources, and thus possesses a good
foundation for a range of natural resource-based industrial processing activities.
(i) Potential in Agriculture
Cambodia’s economy is based on agriculture. About 85 percent of its population is
dependent on agriculture, which has not been modernized yet. It depends almost
completely on natural condition yet the country can still sustain food sufficiency and
surplus for export. At present, the agriculture sector, which is the backbone of the
Cambodian economy, has been opened for FDI. Therefore, agricultural development is a
big potential for future development. Transfer of technology in agriculture will follow
the flow of FDI and will contribute to agricultural modernization. With the low cost of
labor, agriculture has a huge potential for attracting foreign investments into Cambodia.
(ii) Potential in Tourism
Located in Southeast Asia, where tourism is booming especially in countries like
Thailand, Malaysia, and Singapore, Cambodia can catch this opportunity in tourism
development by using Bangkok, Kuala Lumpur, and Singapore as regional hubs.
Cambodia has an advantage in international tourism because of its historical heritage,
unpolluted scenic attractions, and central location in Southeast Asia. Cambodia, the
successor of the Khmer Empire and Khmer civilization, had a great influence on the
cultural and artistic evolution of the region. The Angkor Temple Complex, represented

371
Figure 5: Tourist arrivals 1995- 2007
219,680466,365
1,055,202
1,421,1651,700,000
2,000,000
-
500,000
1,000,000
1,500,000
2,000,000
2,500,000
1995 2000 2004 2005 2006 2007
Source: Ministry of Tourism
by Angkor Wat and Angkor Tom, is one of the most significant cultural heritages in the
world and is promising enough to develop as an international tourist destination. Other
than historical heritage, the rural landscape is also an important attraction for tourists in
Cambodia. The Mekong River, the Tonle Sap Lake, and the beautiful beaches in
Sihanoukville and Kompot province will also attract nature tourists. Furthermore,
Phnom Penh, the capital of Cambodia, is an international gateway and its French-
influenced atmosphere will be enhanced for tourists after renovation of buildings and
streets. Major tourist attractions in the city are the Royal Palace, the National Museum,
the view of the Mekong River, and the areas surrounding with mountains, forests, lakes,
and streams. The government has concentrated on three poles of tourism development
(Phnom Penh, Siem Reap, Sihanoukville) by inviting national and international
investment companies to develop tourism through the construction of hotels and tourist
sites following international standards. This indicates that tourism is the most attractive

372
sector for investment. At present, it can be the backbone of the economy instead of
agriculture. Tourist arrivals have increased year by year with an average of about 20
percent annually from only 118,228 in 1993 to 604,919 tourists in 2001, 1,055,202 in
2004, 1,700,000 in 2006, and about 2 million in 2007 (See figure 5).
(iii) Potential in Natural Resources
Cambodia will build on its comparative advantage by developing natural-resource-
based industries of different kinds, including agro-based, wood-based, fisheries-based,
and industry-based (nonmetallic mineral resources). This is a big potential for attracting
foreign investment. If Cambodia is successful in expanding rice production to the point
where it is exporting significant quantities of rice, this will itself create employment and
value added in processing. Other possibilities in agro-processing include sugar and
vegetable oil processing. Products and animal feed production will need to be given
more systematic economic evaluation. Moreover, the widespread rural small-scale
manufacture of tobacco products suggests that further scope exists for large-scale
production, yielding higher quality product and higher value added.
Oil and gas exploration recommenced in Cambodia in 1991, following earlier
efforts in 1969-74, and has already produced very promising results. Altogether, 16,000
line kilometers of high-quality seismic data have been obtained, giving good geological
information, which indicates the potential for substantial oil and gas generation (Royal
Government of Cambodia 1997, p.156).
For the purpose of exploration, both land and sea areas of Cambodian territory

373
have been divided into blocks, 32 altogether, of which the offshore blocks I-IV have so
far been explored. Three major oil companies, with 30-year contracts, have been
engaged in drilling. Positive results from drilling in Block III in late 1993 were
followed by the most successful test so far, carried out in Block I and Block III in late
1993 were followed by the most successful tests so far, carried out in Block I and Block
II in the first part of 1994, which produced a maximum flow rate of 4.7 m cubic feet of
gas and 180 barrels of condensate per day. Another company testing in Block IV in the
same year produced a maximum flow rate of 1.3 m cubic feet of gas and 1,180 barrels
of oil per day (Royal Government of Cambodia 1997, p.156).,
The government now plans to offer further acreage for licensing. The licensing
regime embraces royalties and a tax system, controlled by production-sharing contracts,
which provide attractive terms for exploration and production projects. The successful
development of oil and gas production could do much to transform Cambodia’s
economic situation by providing current revenues to cover the recurrent costs of social
and economic development programs—the costs of which at present constitute a severe
constraint—and the heavy funding required for new infrastructure development.
Although Cambodia has good mineral resources potential, events of the last two
decades have prevented the development of the mineral sector. This has been
compounded by factors such as scarcity of capital, high costs of exploration and
exploitation, lack of expertise, and absence of effective mining laws and regulations.
Potential exists with respect to gold, gemstones (ruby, sapphire, zircon), phosphates (for
fertilizer), limestone (for cement and building stone), bauxite, clay, sand/gravel, and

374
granite, with the first two as commercially most promising. Copper and zinc also exist
but require more exploration work. Exploration for gold by three companies has been
initiated.
Mitsubishi Corporation and BHP Billiton have signed a mineral exploration
agreement with the Royal Government of Cambodia to explore for bauxite and to
evaluate the potential for an alumina refinery. The agreement requires a detailed
evaluation of the Mondolkiri exploration licences in Eastern Cambodia to determine
resource size and quality, environmental and community issues, risks from unexploded
ordinances, and the appropriate mining, processing, and transport options. Following
studies due in the first half of 2008, the partners have the exclusive rights to negotiate a
mining agreement with the government to develop the project. BHP Billiotn and
Mitsubishi Corp previously partnered on the Mozal aluminium smelter in Mozambique
(Japan’s Corporate News Network, Tokyo, 11 October 2006 at
http://www.japancorp.net/Article.Asp?Art_ID=13537, accessed on 6 January 2008).
As in the case of oil, the government is in the process of developing national policy
guidelines, legislations, and regulations for mining exploration and exploitation
designed to provide incentives and protection to investors while also ensuring
protection of the environment. Once the details are clarified, a new Mining Law will be
prepared and submitted to the National Assembly for Adoption.

375
(2) Economic Freedom
Cambodia is classified as one of the most liberal economies in economic freedom.
According to the “2006 Index of Economic Freedom” by the Heritage Foundation in the
US, Cambodia ranked 9th out of 32 countries and regions in Asia in terms of absence of
government coercion or constraint on economic activities. Among ASEAN countries,
only Singapore is above Cambodia. Cambodia is categorized as “Most Free,” in which
Japan, Taiwan, and South Korea are included as well. In the last 10 years to 2006,
Cambodia’s index has improved, although it has been relatively flat over the last three
years. The improvement in Cambodia’s index is very obvious in contrast to Thailand, as
shown in Figure 6 and Box 1.
Figure 6: Comparison of Index of Economic Freedom in selected countries
Source: 2005 Index of Economic Freedom by Heritage Foundation/ Wall Street Journal.
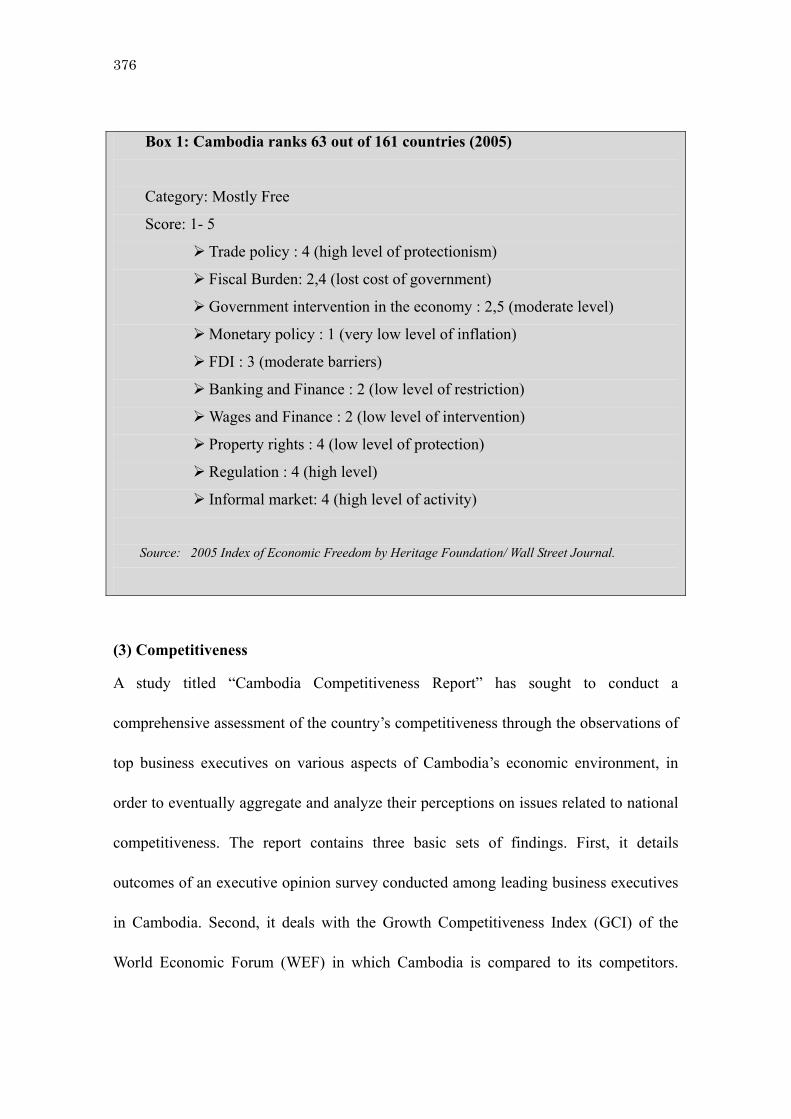
376
Box 1: Cambodia ranks 63 out of 161 countries (2005)
Category: Mostly Free
Score: 1- 5
Trade policy : 4 (high level of protectionism)
Fiscal Burden: 2,4 (lost cost of government)
Government intervention in the economy : 2,5 (moderate level)
Monetary policy : 1 (very low level of inflation)
FDI : 3 (moderate barriers)
Banking and Finance : 2 (low level of restriction)
Wages and Finance : 2 (low level of intervention)
Property rights : 4 (low level of protection)
Regulation : 4 (high level)
Informal market: 4 (high level of activity)
Source: 2005 Index of Economic Freedom by Heritage Foundation/ Wall Street Journal.
(3) Competitiveness
A study titled “Cambodia Competitiveness Report” has sought to conduct a
comprehensive assessment of the country’s competitiveness through the observations of
top business executives on various aspects of Cambodia’s economic environment, in
order to eventually aggregate and analyze their perceptions on issues related to national
competitiveness. The report contains three basic sets of findings. First, it details
outcomes of an executive opinion survey conducted among leading business executives
in Cambodia. Second, it deals with the Growth Competitiveness Index (GCI) of the
World Economic Forum (WEF) in which Cambodia is compared to its competitors.

377
Third, Cambodia’s performance is assessed within the framework of the Business
Competitiveness Index of Michael E Porter (Economic Institute of Cambodia 2005).
The WEF views national competitiveness as a set of factors, policies, and
institutions that determine the level of productivity of a country. Raising productivity is,
according to WEF, the driving force behind the rates of return on investment, which, in
turn, determine the aggregate growth rates of an economy. This means that a more
competitive economy will be one that will grow faster in a medium to long-term
perspective. Based on this perspective, the WEF defines three stages of economic
development: factor-driven stage, efficiency-driven stage, and innovation-driven stage.
With GDP per capita of about US$500, Cambodia is undoubtedly treated as a factor-
driven economy that competes based on factor endowments, primarily unskilled labor
and natural resources. According to the above study, Cambodia remains among the least
competitive countries in the world. This year’s ranking, the WEF’s GCI 2006-2007,
places Cambodia at 103rd among 125 countries in the assessment. The country’s
performance is slightly behind Bangladesh (99), but lags far beyond its neighboring
countries such as Thailand (35), Indonesia (50), China (54), and Vietnam (77).
Switzerland is the world’s most competitive country, while Angola is at the bottom of
the WEF’s GCI 2006-2007 (Economic Institute of Cambodia 2006).
However, the above study was not positively received by the Government as it is
said to be creating a negative image for the country. The Government reasoned that the
study is giving an inaccurate picture of Cambodia because in reality, there are booming
businesses by local and foreign investors and business persons, especially in the
378
construction and services sectors, and more increasing inflow of FDI to Cambodia,
especially from China, Korea, and other countries in the region.
(4) Credit Rating
For the first time in history, the Royal Government of Cambodia assigned the Credit
Suisse to act as its rating advisor in coordinating a sovereign credit rating. Cambodia
has secured a B+ rating for long-term foreign and local currency government bonds
from Standard & Poor’s and B2 ratings for foreign currency and local currency
government bonds from Moody’s. The outlook for all ratings is stable. According to
Agost Bernad, Standard & Poor’s primary credit analyst:
“Real GDP growth averaging 9% over the past six years boosted per-
capita GDP by 64%. There is reason to expect similar robust growth
performance in the medium term, given the policy continuity, which focuses
on export-led growth and stability in price and exchange rates.”
Meanwhile, Standard & Poor’s recognized Cambodia’s track record of strong
economic growth and the underlying prudent macroeconomic policy mix, as well as the
ongoing donor engagement that provides a policy anchor and underpins domestic and
external liquidity. Moody’s Vice President Thomas Byrne notes:
“Cambodia has recently attracted significant inflows of foreign direct
investment into sectors such as tourism, garments and energy, which should
379
help to continue to boost the overall level of investment in the economy as
well as to strengthen the balance of payments” (Government and Credit
Suisse Press Release, May 2007).
According to its press release, Moody’s acknowledged that such inflows, coupled
with steady disbursements of concessional official development assistance, have offset
current account deficits and have contributed to a build-up in official foreign exchange
reserves to a level that is adequate in relation to the country’s near-term debt
repayments, thereby providing some buffer to external shocks. Moody’s expects that
improved competitiveness in the garment sector, continued growth in tourism, and a
timely, well-managed development of Cambodia’s relatively large proven reserves of oil
and gas would strengthen the fiscal and external payment positions of Cambodia.
Moody’s also gave credit to Cambodia’s stable political system and noted that continued
institutional improvement should improve the country’s investment climate and thereby
boost long-term economic growth.
Standard & Poor’s assigned a short-term foreign and local currency rating of B.
Moody’s also assigned a foreign currency bond ceiling of B1, a foreign-currency ceiling
for bank deposits of B3, a local currency bond ceiling and a local currency deposit
ceiling of Ba1.
This positive rating has opened the way for Government in issuing commercial
bonds both in local and foreign currency to mobilize money in financing government
projects in addition to the bilateral and concession loan that is tied to many conditions.

380
It has also helped in improving investor confidence in Cambodia and in showing
Cambodia’s financial health.
5. CHALLENGES
(1) Poverty
Though the decline in poverty has been significant and widespread due to the rise in
average per capita consumption, Cambodia is still facing a major challenge in having a
high poverty rate. Within the geographical sampling of the first survey, the headcount
fell from 39 to 28 percent. Backward projection based on this observed trend suggests
that the national poverty rate fell by 10-15 percent over the last decade (from 45-50
percent in 1993/4 to 35 percent in 2004). Moreover, poverty is very likely to have fallen
further in 2005 and 2006 due to the exceptionally high growth rates in those years,
especially in agriculture. Projections put the poverty rate at about 32.5 percent in 2006
(Hang 2007, p. 2).
(2) Inequality
Cambodia is facing a growing tendency to exacerbate the inequality between the rich
and the poor, and aggravate the regional disparity between urban and rural areas. Due to
lack of social safety net and protection, the poor are very vulnerable to fall into a higher
poverty status. Among the areas, Phnom Penh is the fastest developing urban area due
to the availability of infrastructure and public utilities, and land concentration.

381
(3) Insufficient Infrastructure
Due to a long protracted war, international isolation, and political strife, the
infrastructure in Cambodia is still in poor condition compared to other countries in the
region. At present, Cambodia does not have sufficient financial, technical, and human
resources that are necessary for infrastructure construction. Inadequate physical
infrastructure, including road transportation, electricity, irrigation and water systems,
and port facilities, is a major barrier to economic development and poverty reduction in
Cambodia. Hence, infrastructure networks can be assigned a leading role in supporting
the development process. Overcoming this bottleneck involves considerable investment,
capacity building, new policies, and institutional reform.
(4) Land Dispute
Though Cambodia has a low density of population per land compared to many countries
in the region, land becomes scarce as the demand for investment and agriculture
increasingly rise. Because land is more expensive due to robust economic development,
land possession is the most difficult problem. The poor and the farmers are vulnerable
to the problem of “landlessness” because they sell their land to solve urgent problems
such as paying off debts and paying health and medical care. Land grabbing by the
powerful and the rich and granting of economic concessions for investors’ plantation
and logging also often lead to land disputes and violence at times.
(5) Lack of Information and Understanding on Economic Integration
Except for foreign investment firms, Cambodian enterprises, especially small and

382
medium enterprises (SMEs), experience many difficulties in entering export markets
and in expanding exports. Familiarity with modern data and information sources is low
and sometimes nonexistent. As a result, SMEs are not aware of the design and quality
requirements of foreign markets. The private sector also has little or no idea about the
benefits of economic integration. There is also limited support from the Cambodian
government to keep the private sector informed on commodity prices and market access.
This lack of knowledge results in missed opportunities for Cambodia to exploit the
export markets under the AFTA and other free trade arrangements.
(6) Lack of Trade Promotion Activities
Cambodia has very limited funds for conducting activities in promoting trade abroad.
Unlike Thailand, Vietnam, China, Korea, Taiwan, and other countries in the region,
Cambodia seldom conducts trade fairs and trade promotion events except when the
country is provided free space during international conventions or exhibitions abroad.
The role of Cambodian embassies abroad for trade promotion is also very limited.
In conducting international business, especially trading, activities such as
promotion, marketing, and finding appropriate business partners are essential.
Cambodian producers and traders have difficulty in exploring trading opportunities
because they lack experience in dealing with the international market. Foreign
producers and traders have an edge because they receive strong support from the
Government through trade fairs and other trade promotion activities.

383
(7) Complicated Bureaucracy for Trade in Cambodia
Though the market is available for the country in the framework of AFTA, Cambodia is
beset by domestic problems especially in dealing with complicated procedures and
corrupt practices in exporting products. Fisheries, rice, and other agro-products still
require various permits (transportation permits, export permits, etc.). Firms frequently
face delays in clearing imported inputs through customs, thereby jeopardizing their
production schedule and ability to meet the delivery dates required by their clients
abroad.
(8) High Cost of Doing Business in Cambodia
As the country is in transition, corruption in the administration (and particularly in
business operation including import-export activities) is a serious problem. Local
business people have identified other problems such as lack of infrastructure; protracted
customs clearance procedure; high cost of electricity, internet, and telephone; and high
cost of transportation. Phnom Penh and many other major cities often face electricity
blackout due to inadequate supply or unreliable source of electricity.
(9) Low Production Base
Economy of scale is very favorable for trading, especially for agricultural products.
However, most of Cambodia’s agricultural products are small-size family ventures that
are not appropriate for export as some importers require big volume of products.
Intermediate traders (or middlemen) usually exploit the market and extort price that

384
may lead to losses in revenue for smallholders. On the other hand, most of Cambodia’s
agricultural products are available only seasonally and not all-year round. For example,
rice in Cambodia can be harvested only once a year between November and January. It
is difficult to supply rice to the market all-year round unless Cambodia has a good
technology in postharvest storage and quality control.
(10) Poor Technology
Cambodia has limited production bases, especially the processing industry. With limited
support from the State and poor status of human resource, Cambodian farmers and
producers depend primarily on traditional style of production. Thus, with poor
technology, productivity is low compared to competing countries, resulting in huge
losses for Cambodia in the global competition.
(11) Lack of Credit Access and Insurance
To promote commercialization of Cambodia’s agro-products, financial resources are
required to invest on land, fertilizers, machineries, transport and marketing of produce,
insurance, hiring of labor, etc. At present, farmers and producers are in dire need of
credit for business start-up or expansion. However, they cannot get a loan without
condition or collateral, which is normally required by commercial banks. International
trade finance activities carried out by banks in Cambodia also tend to be limited to
payments and collections and letters of credit. Pre-and post-shipment finance is not
easily available from banks in Cambodia. Insurance is also not well developed.
Factories and the transport of merchandise within Cambodia are rarely insured.

385
6. CONCLUSION
Cambodia has conducted many economic reforms to promote economic growth and
reduce poverty. Though the country has been admitted to most of the regional
cooperation mechanisms such as ASEAN, AFTA, and WTO, the benefits of market
access are still limited and thus, it is still premature to evaluate the costs and benefits.
The country is still facing many constraints in the process of economic development
such as high poverty rate, growing inequality, insufficient infrastructure, and low
production base. Private sector participation in trade to benefit from AFTA and
ASEAN+3 (such as the ASEAN-China FTA) is very limited. There are many constraints
to overcome this shortcoming.
Cambodia has few finished products that are usually in poor quality so they cannot
compete with similar products imported from neighboring countries. Though the trade
volume has increased yearly, the trade deficit keeps on growing. With its active
participation in trade promotion activities such as the World Expo and China-ASEAN
Expo, Cambodia can promote its products internationally. Examples are Muscle Wine,
palm wine and Angkor Beer, which Cambodia can promote to huge markets like Japan
and France. Other promising export products are handicrafts, rice, fish, rubber, and
wood.
Cambodia has no other viable alternative to realize ASEAN integration but to
effectively address the imbalanced development in the region on the one hand, and
move ahead toward enhancing and deepening East Asian cooperation, on the other hand.

386
The disparity in ASEAN today constitutes a real major challenge, which the member
countries must overcome at any cost. A fully integrated ASEAN will sustain its
relevance, boost its competitiveness in the face of increasing challenges of globalization
and regionalization, and revive its strength as a catalyst for strengthening East Asia.
Moreover, an economically strong ASEAN will not only benefit ASEAN but also its
partners. Therefore, the integration of ASEAN remains a critical factor that will bestow
significant benefits to East Asia as a whole and to ASEAN’s other partners as well.
7. POLICY RECOMMENDATION
(1) Tax on Assets
In Cambodia, the revenue from tax collection is still very low compared to other
countries in the region. One of the major reasons is because the government does not
impose tax on property and land as this is a sensitive political issue in Cambodia. At
present, the price of land and real estate is skyrocketing in Cambodia, especially in
urban areas like Phnom Penh, Sihanoukville, and Siem Reap. However, the government
has not tapped the benefit from the rising land price and booming real estate businesses.
Though there is a small tax (seal tax) on land title transfer, the agreement on sales
without transfer of land title may lead to huge losses from tax evasion throughout the
country. Therefore, land tax, especially on unused land, should be strongly
recommended even at a low rate. This will generate revenue for the local and central
governments and will reduce land speculation as well.

387
(2) Enhancing Agricultural Productivity
The government should implement agriculture-led strategies to achieve accelerated
progress in quantity and quality. Growth in the agricultural sector can result from
increased production through higher productivity, containment of losses (which, at
present, could be as high as 35-40 percent), sound postharvest support systems, crop
diversification (including horticulture and floriculture), and increased emphasis on
animal husbandry and fisheries. The concept of “Green Belt” should be promoted for
booming urban areas.
(3) Promotion of Infrastructure Linkages to Countries in the Region
The focus for transport infrastructure for the rehabilitation of high-priority trunk and
feeder roads and bridges, especially the regional highways linking countries in the
region, should remain to realize the potential of agriculture, tourism, and trade in the
rural areas. There is also a need to develop a comprehensive transport policy framework,
addressing issues such as development of a balanced construction and maintenance
program, increased involvement of the private sector, and financing of road
maintenance and cost recovery mechanisms. With regard to institutional strengthening,
the Ministry of Public Works and Transport will formulate strategies to improve its
capacity to plan, manage, and implement road operations.
Major investments are now being made to improve the physical transport
infrastructure linking Cambodia with Thailand and Vietnam, as well as to improve sea
and air access to international destinations, especially China. Energy, port, and airport

388
should be promoted to meet the increasing demand of production and trade. These
developments could greatly reduce transport costs and increase the competitiveness of
Cambodian products on export markets. However, the full benefits of such
developments will only be realized if people and goods can move across borders at
minimal cost.
(4) Investment Promotion
Cambodia is one of the most attractive destinations of FDI in the region due to its
abundant natural resources, low labor cost, and liberal laws. There is a huge potential
for Cambodia to attract FDI from rich countries. Investment promotion should be
organized locally and abroad. In-country campaigns should include seminars and
debriefings to business communities and foreign diplomats to familiarize them with the
legal and institutional framework, investment incentives, and investment opportunities.
The products and services of the CDC should be promoted to satisfy investors.
Successful cases should be documented and featured in promotional instruments like
leaflets, brochures, and investment guides.
Campaigns for investment promotion abroad may include sending investment
promotion missions, participating in regional fora and seminars, networking through
Cambodia’s embassies abroad or the ASEAN business centers as channel of
communication, and setting up information service centers. Trade fairs promoting
Cambodia’s products and services will also help attract foreign investment.
As the Government decentralized to the provincial and municipal levels the

389
decision on project investments amounting to less than US$2 million, investment
promotion should be conducted at the provincial level as well to present the investment
opportunities in the area. The CDC should invite the provincial investment promotion
agencies to participate in campaigns to attract investment and technology transfer.
(5) Urbanization and Zoning
Huge regional disparity exists in Cambodia. It is therefore important to promote
the regional growth corridors, such as Phnom Penh, Siem Reap, Sihanoukville, and the
Northeastern region. The most crowded areas are the plain plateau and along the
Mekong River, where soil condition is favorable for agriculture. The least crowded is
the coastal area. Most economic activities concentrate only in Phnom Penh and a few
other urban areas such as Siem Reap and Sihanoukville. The government should
develop an appropriate urbanization plan by assigning growth corridors to spread
development benefits to other regions and down to the provinces and districts.
Autonomous regions or cities such as Poi Pet, Kep, Pailin, Sihanoukville, Neak
Leung, Soung, Steng Treng, and other strategic locations should be developed as FDI
destinations by building the necessary infrastructure and facilities. Special economic
zones (export processing zone, free trade zone) should be put in place by government
and the privates sector to attract investment and promote equitable economic
development in these cities.
(6) Trade Facilitation
The Government should play an active role in supporting farmers by providing

390
standard certificate, credit access, and market information. The role of the Government
in trade promotion and trade support services is in its infancy. At present, the
Government does not effectively promote trade or provide trade support services.
Although the Ministry of Commerce has recently established a trade promotion
department, it is not yet fully operational due to lack of funding. Developing effective
mechanisms such as, for example, training officials for effective trade promotion and
trade support services is clearly an area that is greatly needed by Cambodia. Thus far,
the Phnom Penh Chamber of Commerce has not actively promoted trade among its
members or the Cambodian private sector at large.
Assistance is needed in all aspects of creating an effective export promotion
mechanism, including the elaboration of an export promotion strategy, developing and
managing the necessary national and international databases, and training trade officials
and staff on techniques for organizing trade fairs and other trade promotion activities.
Promoting the exports of SMEs should also be given attention.
Assistance is also required in completing the task of putting in place an appropriate
legal and regulatory framework for the financial sector. Training on trade finance and
trade insurance is required for both the private sector and government officials (in
particular those dealing with export promotion). Help is needed in setting up proper
mechanisms to supervise the implementation of the forthcoming legislation on
insurance.
In the area of business information, training on international marketing is required
for those involved in export promotion and for private traders associations as well.

391
Assistance is also needed in establishing a “trade point” to facilitate the exchange of
information needed by exporters and importers. Assistance is required in putting in
place more effective customs procedures, allowing Cambodia to benefit fully from
customs automation through the Automated System for Customs Data. In addition to
allowing more efficient customs clearance for traders, automation will enhance the
capacity of the customs department to generate timely trade data, and improve revenue
collection.
Export credit and investment insurance agencies, commonly known as ECAs, play
a critical role in international trade and finance in developing countries, and thus have a
great impact on sustainable development. ECAs provide government-backed loans,
guarantees, and insurance to corporations seeking business opportunities in developing
countries and emerging markets that are often considered too risky for conventional
corporate financing. They are primarily public or publicly mandated institutions that
support and subsidize exports and investment of companies from their home country.
Cambodia should recognize ECA as part of trade facilitation. (For more details about
the ECA, see Center for International Environmental Law 2002.)
(7) Access to Market Information
Information gathering and dissemination on trade, agro-business, and potential markets
should be strengthened as this will be useful for the business community in analyzing
trading potentials. The government should establish information broadcasting through
TV or radio and encourage the people to use the internet and other information

392
communication technologies (ICTs) by reducing internet fee and other means.
(8) Technology Transfer
Cambodia cannot move fast enough to catch up with its neighbors in the region if the
level of technology and science will remain low. Technology transfer should fit the
overall strategy of the government’s priority. Investment encouragement to succeed
would have to take emphasis on job creation, research and development (R&D), and
effective knowledge and technology transfer.
The government may wish to consider the following measures:
• Ensure assessment of local needs in technology as well as the social impacts of
technology
• Expand R&D programs in technology development including adaptation to local
needs
• Create awareness on technology transfer
• Improve transfer of technology among developing countries including joint R&D and
opening of markets
• Develop the ICT infrastructure to support investments in technology and the operation
of intermediaries
• Establish high-tech parks to attract investment in high technology such as electronics
and computer parts.
• Improve macroeconomic stability for transfer of technology

393
To maximize the benefits of FDI through enhancing technology transfers and
spillovers, Cambodia should make sure that interventions based on anticipated trends of
comparative advantage will be effective, but this would require careful industry-specific
analysis and broad-based consultation with the private sector and other stakeholders.
Cambodia should rely more on comparative advantage, and keep in mind that FDI that
responds to global market forces holds promise, particularly FDI in export sectors.
(9) Industry Diversification and SMEs
So far, Cambodia depends mainly on the garment and apparel industry, tourism, and
agriculture. Diversification of industry and promotion of SMEs are very important to
promote local production. National standard for local products must be strengthened to
meet international benchmark, especially for food and processed products.
REFERENCES
Asian Development Bank. 2004. Asian Development Outlook 2004. Manila: ADB.
Association of Southeast Asian Nations. 2005. ASEAN Statistical Yearbook 2005.
Jakarta: ASEAN Secretariat.
Center for International Environmental Law. 2002. Export Credit and Investment
Insurance Agencies and Sustainable Development. Environmental Law Issue Brief
for the World Summit on Sustainable Development, 26 August - 4 September
2002. Washington, D.C.
Chap, Sotharith. 2005. Foreign Direct Investment and Technology Transfer. Ph.D.
dissertation. University of Sydney, New South Wales, Australia

394
Chap, Sotharith. 2007. Economic and Social Impact of Market Liberalization: A
Cambodian Case Study on Agriculture Liberation under China-ASEAN FTA.
Bangkok: East Asian Development Network.
Council for the Development of Cambodia. 2006. Cambodia Investment Guidebook,
December 2006.
Economic Institute of Cambodia. 2006. The Competitiveness of Cambodia 2006-2007:
Building a Favorable Business Environment for Sustainable Growth.
Hang, Chuon Naron. 2007. Cambodia: Recent Economic Developments. Paper prepared
for the 1st Cambodia Development Cooperation Forum 2007.
Heritage Foundation. 2005. 2005 Index of Economic Freedom, Heritage Foundation/
Wall Street Journal.
Ministry of Commerce. 2001. Integration and Competitiveness Study. Royal
Government of Cambodia.
Ministry of Commerce and Mekong Private Sector Development Facility. 2005.
Cambodia and WTO: A Guide for Business.
Royal Government of Cambodia. 1997. First Five Year Socio-Economic Development
Plan, 1996- 2000, RGC, Phnom Penh.
Royal Government of Cambodia. 2004. Rectangular Strategy for Growth, Employment,
Equity and Efficiency.
Royal Government of Cambodia. 2006. National Strategic Development Plan, NSDP
(2006- 2010).

395
Chapter 11
CHALLENGES, PROSPECTS AND STRATEGIES FOR CLMV DEVELOPMENT: THE CASE OF LAO PDR
Leeber Leebouapao
ABSTRACT Within the context of regional economic integration, Lao PDR is facing numerous challenges for being one of the least developed countries (LDC) in the world. Hence, the Lao Government has called for a long-term socioeconomic development strategy with the goal of graduating from the LDC status by year 2020 To achieve this goal, the Lao Government has made great efforts to build a relatively comprehensive development strategy framework, which includes the Industrialization and Modernization Strategy, the Six National Development Plan(2006-2010), the National Growth and Poverty Eradication Strategy(NGPES), and the sectoral long-term development strategy. However, to implement the Government’s development strategy framework more successfully and narrow the gap of the country’s development in the region, some policy recommendations from a research perspective should be taken into account, namely: 1) Infrastructure development by focusing on land-linked country and economic corridors; 2) Strengthening private sector development by promoting SME development and market development (financial market development, labour market development, real estate market development); 3) Tourism development by promoting cultural, eco-based, and historical tourism in the country as a sustainable tourist-friendly destination; 4) Keeping a natural resource-based industry that is both environmental friendly and economically efficient; 5) Developing the processing industry in the country for export and domestic consumption; and 6) Human resource development with focus on vocational schools and training for skilled labour.

396
1. INTRODUCTION This paper, which is under the ERIA research project on CLMV, discusses the Lao
Government’s development strategy and the author’s recommendations from a research
point of view. The paper is broken down into four main parts. Part I provides an
assessment of recent development performance. It gives an overview of the Lao
economy, overall achievements at the macroeconomic and sectoral levels, and some
lessons learned. Part II identifies some of the main challenges and constraints to
economic development. Part III focuses on the development strategy perspective for the
Lao PDR. It examines the potentials and opportunities for development and reviews the
Government’s development strategy framework. Part IV gives some policy
recommendations for promoting sustainable growth in the Lao PDR.
2. RECENT DEVELOPMENT PERFORMANCE
2.1 Context
From mid-1997 to the end of 1999, the economy of the Lao PDR faced arduous
difficulties, especially the significant negative impacts of the Asian economic crisis and
recurring severe natural disasters. However, since 2001, the Lao economy has recovered
and developed under more favourable conditions. The economy has begun to resume
expansion and build up the potential for growing at a faster pace in the following years.
Production forces and socioeconomic elements have built the necessary initial base for
future growth. The legal frameworks were gradually adjusted and their positive impacts
on socioeconomic development have since increased. The market-oriented economy
emerged further and operated in a more efficient manner. Political and social stability

397
were enhanced. Relations with countries in the region and outside on economic and
other fronts were expanded, with significant strengthening of the capacity and standing
of the Lao PDR in the region and the global community. The developments outside the
country also significantly provided favourable conditions. Stability and economic
recovery in the Asian region and at the global level, scientific and technological
innovations, and globalization brought about many opportunities to overcome the
difficulties and obstacles.
Meanwhile, the global situation developed in a complex manner after the 11th
September 2001 event in the United States and the Afghanistan and Iraq wars that
followed. Terrorism and antiterrorism became dominant issues, but peace and
development cooperation remained major priorities at the international level. The global
and regional economies have been recovering, with firm continuation of globalization
and increasing competition. Within Southeast Asia, SARS, Avian Flu, and floods and
droughts have occurred. These developments have imposed severe difficulties on the
Lao social and economic bases.
2.2 Economic Growth
During the five-year period (2001-2005), the Lao economy has maintained rapid and
sustainable growth. On average, the GDP grew at about 6.24 percent per annum, which
is about 0.3 percentage point higher than the average growth rate in the previous five-
year period (1996-2000). The growth rate failed to reach the target set in the
Government’s Plan and the full potential of the economy was not utilized. However, it
is heartening to note that the growth rate achieved is higher than that recorded in the
previous Plan period (1996-2000). It is also useful to highlight the relative growth rates

398
of the domestic private sector output, output from foreign direct investment (FDI)
enterprises, and State output. The average economic growth rate in the Lao PDR during
the past five years is among the highest in the region (e.g., Cambodia, 5.5%; Indonesia,
4.2%; Malaysia, 4.3%; Philippines, 4.2%; Singapore, 3.7%; Thailand, 4%; Hong Kong,
2.8%; South Korea, 4.7%; Taiwan, 4.2%; Viet Nam, 7.5%). By 2005, the GDP per
capita reached US$491.
2.3 Sectoral Performance
All the economic sectors experienced growth, which has been linked to structural
changes and the enhancement of product quality. The sectoral performance is presented
in the following:
2.3.1 Agriculture Sector
During the past five years, the Government, line ministries, and sectoral and local
authorities of the Lao PDR have concentrated on the development of agricultural
production, following the direction set, i.e., orienting the agriculture sector from
subsistence and semisubsistence to commercial production to ensure the enhanced
supply of raw materials to processing industries, meeting the growing domestic
requirements for agricultural products, and rapidly expanding agricultural exports. The
composition of production and products has been restructured positively with increasing
economic effectiveness. This therefore allowed a stable growth in agriculture, forestry,
and fisheries production, albeit under constrained development conditions. Over the last
five years, the value of production in the agriculture sector has increased on average by
3.4 percent per year.

399
By 2005, the production of many crops increased significantly compared to the last
year of the fourth five-year Plan (2000). For example, maize (corn) production tripled to
372,560 mt as compared to that in 2000. Maize is grown largely in the northern
provinces, such as Bokeo, Sayaboury, Houaphanh, and Xiengkhouang, and in some
central provinces. The production of coffee, which is concentrated in the provinces of
Champasack, Saravane, and Sekong, increased by six percent reaching 25,000 tons.
Peanut production, largely found in the provinces of Sayaboury, Luang Prabang,
Vientiane, Saravane, and Champasack, doubled to 26,990 tons. Soybean production,
which is concentrated in the provinces of Luang Prabang, Bokeo, Houaphanh, and
Champasak, also experienced a two-fold increase to 11,100 tons. Sesame plantation
yielded 8,710 tons, up by 2.6 times, and was largely found in the provinces of Luang
Prabang, Sayaboury, Oudomsay, and Vientiane. Mungbean production was up by three
times to 3,700 tons, and was concentrated in the provinces of Luang Prabang, Vientiane,
and Champasak. Tobacco planted in the provinces of Borikhamsay, Khammouane, and
Savannakhet provided a total harvest of 28,100 tons. Sugarcane, which is concentrated
in Vientiane Capital and in the provinces of Luang Namtha, Phongsaly, and
Borikhamsay, had a harvest of 196,100 tons. Vegetable production increased by 17
percent to 744,450 tons. Most noticeable are the plantations of vegetables, such as
cabbage, Chinese cabbage, bananas, potatoes, and ginger, on the Boloven Plateau for
export. Having won popularity, rubber trees are extensively planted in the provinces of
Luang Namtha, Oudomsay, Bokeo, Khammouane, Champasak, Saravane, Sekong, and
Attapeu. Orchards are being grown in a number of provinces, particularly orange
plantations in Luang Prabang, Sayaboury, Borikhamsay, Vientiane, and Vientiane
Capital.

400
The move to commercial production is growing strongly in the high-potential areas.
Prominent among these are the emphasis on the cultivation of rubber in Luang Namtha;
cashew nuts in Oudomxay and Phongsaly; corn, vegetables, and fruit trees in Vientiane
Province and Vientiane Capital; seeded trees for oil extraction and sugarcane in
Savannakhet; and rice in Vientiane Province.
Emphasis is placed on research and the adoption of high-yield/high-productivity
crops and livestock. Currently, several new varieties have been introduced, such as rice,
maize, vegetables, beans, coffee, tobacco, tea, and fruit trees, as well as a number of
domestic animals. By 2005, the farming sector ensured 80 percent of the seed
requirements for the rainy season crop and 100 percent for the dry season crop. Many
modern cultivation and animal raising techniques have been introduced.
The number of irrigation schemes has continued to increase from 19,170 in 2000 to
24,695 by the end of 2004. Irrigated crop areas during the dry season increased from
197,100 ha in 2000 to 215,000 ha in 2004, while the irrigated area during the rainy
season increased from 296,000 ha to 315,000 ha. Due to the increase in irrigation and
the introduction of new crop varieties, rice yield increased from less than 3.06 mt per
hectare in 2000 to 3.6 mt per hectare in 2005. Rice production reached 2.65 million mt
in 2005, which translates to an average per capita availability of approximately 457 kg
per capita.
The livestock and fisheries sectors are developing quite rapidly mainly due to the
industrial farming systems applied in many localities and because of increased market
opportunities and reductions in marketing costs. In 2005, the livestock numbers rose to
1.09 million buffalos (6% increase over 2000), 1.27 million cows (15.6% increase),

401
1.82 million pigs (28% increase), 19.8 million poultry (51% increase), and 190,000
goats and sheep (56% increase).
Thanks to such rapid development, meat production in 2005 was projected to reach
96,000 mt (an increase of 17.5% over 2000). It is notable that about 10.2 percent of the
meat production is provided by industrial farms with high technology, which grew at the
rate of 9.8 percent in the 2003-2004 period. At the end of 2005, about 10 percent of the
cattle and 20 percent of the poultry were raised in the commercial farms. More
specifically, the farms have focused on raising new high-quality cattle and poultry
species, with high productivity in the production of swine, chicken, and ducks.
Also, fish production rose to 143,000 mt (an increase of 15%), with fish farms
accounting for 68.5 percent of the total and capture fisheries accounting for the rest
(31.5%). Fish fingerling production rose to 320 million, which was adequate to meet
about 50 percent of the national demand. Fish farms have achieved high productivity in
the production of fish raised in baskets. In 2005, both meat and fish production met a
large part of the population’s consumption demands.
Forest conservation and development are given increased attention by line
ministries and local authorities compared to the previous plans. The forestation
movement by the people has regained momentum, especially in the central provinces,
such as Vientiane, Borikhamxay, Khammuane, and Savannakhet,
More specifically, many areas have combined forestation with the development of
high-commercial-value industrial trees, such as teak in the provinces of Luang Prabang,
Sayaboury, Vientiane, Bokeo, Champasak, Bolikhamxay, and Attapeu, and rubber in
the provinces of Luang Namtha, Khammouane, Champasack, Saravane, Sekong,
Attapeu, Bokeo, and Oudomxay.

402
Between 2001 and 2005, about 325 tree nurseries were set up for the germination
of tree saplings for afforestation and forest restoration. About 240,000 kg of tree seeds
were used for the production of some 119 million tree saplings. During 2001-2005,
afforestation covered 91,000 ha, accounting for 91 percent of the target (100,000 ha)
while efforts were made on forest restoration on 481,000 ha.
According to data on forest exploration in 2002, the area of dense forest, which
included forests of high and medium density with a canopy of over 20 percent,
accounted for 41.5 percent (9,724,700 ha) of the country’s total land surface. If the
brushwood, bamboo forests, degraded forests, and mixed deciduous forests with a
canopy of less than 20 percent were combined with the dense forests, the forestry
coverage accounted for 72 percent (17 million ha) of the country’s land surface.
The exploitation of perennial trees has reduced significantly in the last five years.
In 2001, about 300,000 cubic meters of natural trees were exploited, which declined to
150,000 cubic meters in 2005. Wood exploitation is currently subject to more careful
consideration (e.g., combining exploitation with the plantation of alternative trees).
In the past five years, over 1.09 million ha of arable land and 3.6 million ha of
forestry land were allocated to 7,125 villages composed of 419,250 households, to
reduce the practice of shifting cultivation while ensuring sedentary highland and
lowland cultivation to reduce poverty among the ethnic people. As a result, the area
under shifting cultivation declined from 118,900 ha in 2001 to 29,400 ha in 2005,
mainly in the northern provinces (26,800 ha), with the remainder in the central region
(2,600 ha). Shifting cultivation has ceased completely in the southern provinces. The
number of farm families practicing shifting cultivation has reduced from 174,036 in
2000 to 32,790 in 2005.

403
The development of agricultural and rural economies has begun to diversify. A
large number of farms have been established and the production of traditional
handicrafts has been resumed. The development of traditional handicrafts has generated
additional jobs for the local people and contributed to the changes in the rural economic
structure as well as the improvement of the population’s living conditions. The
government has removed barriers to private sector investment and trade in the
agricultural sector. At the same time, it has increased the population’s purchasing power
and contributed to the eradication of poverty in rural areas.
2.3.2 Industry and Construction Sector
Industrial production has grown at a steady and rapid rate, with the sector-wide
average growth reaching 11.3 percent per year, exceeding the Plan target of 10-11
percent. The mining industry increased by 33.87 percent; food processing, 9.17 percent;
tobacco, 20.75 percent; textiles, 20.11 percent; garments, 11.15 percent; footwear, 7.57
percent; and wood processing, 1.17 percent. The sectors receiving foreign investment
have achieved an impressively rapid growth, followed by the nonstate sector, with the
domestic private sector growing slowly. In the past five years, the industrial sector has
implemented several significant activities, such as the exploitation of gold and copper at
Sepon; zinc in Vientiane Province; construction of a cement plant in Vangvieng and a
steel factory in Vientiane; setting up of a number of motorcycle assembly plants;
completion of the Nam Leuk and Nam Mang III hydropower plant and a number of
other hydropower projects; expansion of the installed capacity of the Nam Ngum 1 from
150 MW to 155 MW; completion of a number of high-voltage transmission lines; and
pilot installation of solar energy production systems. The total installed capacity of
power plants by 2005 reached approximately 690 MW. The construction of some other

404
major power plants/projects, as part of the five-year Plan has commenced, including the
Nam Theun 2 Hydropower Project. Trade liberalisation, improvements in the enabling
environment for business, and reduced logistics and transport costs contributed to
increasing incentives for investment in industrial production.
Most of the industrial products have achieved higher growth rates compared to
2000, including coal, salt, beer, soft drinks, tobacco, animal feed, soap, leather shoes,
pharmaceutical drugs, plastic products, furniture, ready-made clothing, bricks, cement,
manual agricultural instruments, and agricultural machinery. In particular, the operation
of the Sepon gold mine in Vilabouly District, Savannakhet Province, started in 2003
with a production of approximately six mt each in 2003 and 2004, with a projected
increase to 6.5 mt in 2005. The mining industry has developed rapidly, as illustrated by
the investments by 90 companies in mining at the end of 2005, of which 34 are foreign
and 56 are domestic. The number of handicraft businesses in the country also increased
rapidly in the last five years, especially in Vientiane City and in a number of major
urban centres. By 2005, there were 26,200 industrial-handicraft units (rising from
23,574 units in 2001).
Currently, a number of industrial zones have been established in such places as
Vientiane and Savannakhet. They include many standard to modern technology zones,
attracting investment from many enterprises. The development of such industrial zones
has helped to attract more foreign investment. Industrial development in certain areas
and focal economic zones was firmly maintained. Areas with a high proportion of
industries, such as Vientiane City and the provinces of Champasak, Khammouane,
Bolikhamxay, Luang Namtha, Xayaboury, and Savannakhet, maintained high growth
rates.

405
The participation of different economic sectors (such as domestic and foreign
private investors and the State) in the manufacturing industries has facilitated its
diversification in terms of manufacturing scale, level of technology, types and quality of
products. The industries are thus able to meet the various demands of the market. The
industrial sectors were responsible for creating the most jobs.
2.3.3 Services Sector
The services sector has taken positive steps forward to better meet the requirements of
production, trading, and daily life. The availability and quality of products and services
are higher compared to the beginning of the period. Over the five-year period (2001-
2005), the growth in total retail sales and revenues from services averaged at 10 percent
per year. The value added in the services sector grew at an average of 6.7 percent per
year over the five years, which exceeded the GDP growth rate, although the growth rate
was still less than the Plan target of 8-9 percent per year.
A number of services have developed quite effectively, such as trade, transport,
telecommunications, tourism, hotels, and restaurants. More specifically, several services
sectors essential for the development of new economic bases such as finance, banking,
and insurance have experienced strong growth. An increasing and more diversified
number of enterprises are entering the trade and services markets. In 2003, about 61,200
enterprises were registered. Trade infrastructure has been improved. By the end of 2003,
there were 209 large markets, including 11 markets at international border cross-points
and 28 markets at local border cross-points.
The service subsectors are currently being restructured and moved toward the
market mechanism under state guidance. The legal framework has clearly defined the

406
direction for market operations. The Business Law, the Investment Law, decrees
relating to business operations within the country, and export and price regulations have
been put in place with increasing efficiency. The central Government is currently
continuing the process of decentralization in order to enhance local ownership of the
regulation of commerce, mainly in such areas as investment licensing, business
licensing, issuing certificates of origin, and export permits.
The tourism sector has also developed rapidly compared to the 1990s, despite the
unfavourable international context during the first three years including the Iraq War
and the outbreak of SARS. Since 2004, with more favourable domestic and international
conditions, tourism has regained momentum and resumed strong development. Tourism
infrastructure was quite efficiently improved, with the number of hotels and guesthouses
increasing from 468 in 2000 to 887 in 2003 and about 1,200 in 2005. The number of
hotel rooms increased from 7,333 in 2000 to 20,000 in 2005. A number of new tours,
including tours among countries in the Mekong Basin, have been designed and
introduced, and are attracting a substantial number of international tourists. The
different types of tourism are growing in a diversified manner, offering more attractive
tourism products. By mid-2005, the country had 364 tourism sites to attract domestic
and foreign tourists.
In the five-year period (2001-2005), about four million foreign tourists visited the
Lao PDR, averaging at about 800,000 tourists per year, with 900,000 in 2004 and about
1.05 million in 2005. Overall, the total number of foreign tourists to the Lao PDR over
the five-year period (2001-2005) increased annually by nine percent. The sector
revenues reached over US$100 million per year. The number of tourists from wealthy
regions and countries, such as the United States, Canada, Belgium, Germany, Holland,

407
Norway, the United Kingdom, France, Japan, Sweden, and Switzerland, is increasing.
Specifically, the proportion of tourists from the European countries increased from 11.7
percent in 2000 to 14.8 percent in 2003 and about 16.5 percent in 2005.
The strong growth experienced by the tourism sector in recent years was supported
by the Government’s increasingly open tourism policy, which upholds tourism as one of
the eight focal economic sectors to be developed in the Five-Year Plan. The Lao PDR
has established tourism relationships with many countries around the world with a focus
on ASEAN members and countries in the Mekong Sub-Region. By the end of 2005,
entry visa requirements were lifted for tourists from several countries in the region.
Thirteen land border crossing-points were upgraded into international border crossing-
points to welcome tourists, and facilities were provided for the issuance of visas on
arrival. Also, participation in different events was ensured to attract tourism from
different markets and a number of events relating to domestic and international tourism
were organized in the Lao PDR. The country hosted an ASEAN Tourism Forum in
2004 (ATF 2004) in Vientiane Capital, which marked a cornerstone in the opening of a
new era in tourism in the Lao PDR. In 2006, Luang Prabang was awarded a gold medal
for being voted as the most popular town in tourism in a survey answered by over 100
travel companies in the UK.
The transport and freight services have shown quite positive and uniform
development, with initial improvements in the quality of services, in spite of the severe
impacts of the Iraq War and the SARS outbreak. The freight volume increased at an
annual average rate of about 11 percent and circulation by 15 percent. The passenger
volume increased by about seven percent per year and circulation by five percent per
year. In particular, the volume of transborder shipping increased strongly at an average

408
of over 20 percent per year. The number of deaths due to road accidents was reduced
significantly from 19 per 10,000 vehicles in 2001 to 10 in 2005.
During the last five years, the transportation sector emphasized the implementation
of different projects, including the maintenance of existing roads and bridges and the
transportation system as a whole. Simultaneously, the construction of regional roads,
national roads, a railway system, airports, bridges, and a number of important local
roads has continued. Significant achievements include the completion of the
construction or paving of many roads to ensure smooth year-round transport. A number
of important projects including new construction, improvement, and upgrading of over
1,130 km of roads and 39 bridges with a total length of 2,611 metres were completed.
The number of transportation services by land and river has increased by about 10-12
percent per year. At the same time, many ports were built and upgraded, especially
along the routes of the Mekong River. The airport system was also built and upgraded,
including the improvement of the Wattay International Airport and the upgrading of the
Luang Prabang and Pakse airports to international standards. About 14 kilometres of the
railway along the Friendship Bridge to Khamsavat village was surveyed and designed.
Also, the survey and feasibility study of the railway project from Thakhek to Kiumuya
was carried out.
The telecommunications services have continuously developed and reached both
urban and rural centres, including in mountainous and remote areas, with the quality of
services significantly improved. The number of telephone users has increased, with the
landline and mobile telephone subscribers reaching 87,500 and 327,000, respectively,
by the end of 2004/05. The number of public telephone booths increased to 404. In
general, telephone subscribers of all types reached 415,900, with an average coverage of

409
7.3 lines per 100 people, which exceeded the Plan target of 2.5 lines per 100 people by
2005. There are 2,570 internet shops all over the country. By 2005, 80 percent of the
districts and 60 percent of the communities will be contactable by telephone. There will
be around 130 post offices in 104 districts and about 23,247 public post boxes. Postal
and telecommunications services are being provided to accelerate modernisation.
Freight, mail, and money order (transfer) services in the country and internationally
have increased at a moderate level.
The finance, banking, insurance, and other services have also continued to be
established and expanded. The insurance market has been established with the
participation of both domestic and foreign actors.
2.4 Foreign Trade
Foreign economic activities developed well. The Lao PDR has been more proactive in
regional and global economic integration. The Lao Government needs to work with
potential domestic and foreign investors to ensure that the country benefits from the
liberalisation of trade in agriculture products under the ASEAN Free Trade Agreement
and various bilateral agreements.
2.4.1 Exports
The aggregate value of exports over the five-year period (2001-2005) is expected to
reach US$1.83 billion. Export growth rate averaged at about seven percent per year,
exceeding that achieved in the previous five-year period (1996-2000) (average of 1.6
percent per year). However, the growth rate was lower than the Plan target of 8.6

410
percent per year. The average value of exports per capita was US$86.7 in 2005; it
remains far lower than that in other countries in the region.
Until now, a group of key export products have been developed, including
electricity, coffee, wood, handicrafts, garments, and minerals, in addition to a number of
new emerging products with potential such as tea, rubber, vegetables, fruits, oil plants,
fragrant rice, corn, and many types of beans. The share of agriculture, forestry, and
fishery products in export revenues shows a decreasing trend. In contrast, the proportion
of light industry and small industry products in exports increased significantly with
garments ranking at the top.
Conducive foreign policy has allowed the Lao PDR to gradually integrate into the
regional and international economies and has helped to diversify its markets. From the
period when traditional markets consisted of Thailand, Viet Nam, and China to the end
of the Plan, exports are now destined to 40 markets, which include the larger markets
such as the European Union, USA, Japan, Australia, the United Kingdom, France, and
Germany. Border trade has also developed strongly. More prominently, during 2001-
2005, many FDI enterprises have invested in export-oriented manufacturing activities.
In 2005, export revenues reached approximately US$456 million (US$ 500 million
was planned for 2005) of which agriculture and forestry exports represented 10.2
percent, heavy industry (electricity, electronics, machinery, etc.) and minerals covered
42.8 percent, with light industry and handicraft products accounting for the rest (47
percent). The exports accounted for 1.5 percent of GDP.
2.4.2 Imports
The total value of imports over the past five years amounted to US$2.86 billion
with an average annual increase of 4.9 percent, exceeding that in 1996-2000. However,
411
it remains lower than the Plan target of 8.6 percent per year. The value of imports per
capita in 2005 was about US$122.30. The composition of imports has changed in
accordance with the capacity and requirements of the economy. More importantly, the
proportion of rice and food products in imports declined significantly from 32.6 percent
in 2000 to 9.9 percent in 2002 and approximately 4 percent in 2003. By 2005, the value
of imports is expected to reach approximately US$595 million, with equipment,
machinery, and parts making up 39.2 percent; raw materials and fuel at 47 percent; and
consumption goods at 13.8 percent. By 2005, imports accounted for 1.9 percent of GDP.
2.5 Foreign Direct Investment
From 2001 to 2005, the Lao PDR has received 585 FDI projects with a total committed
capital of US$2.8 billion. However, only US$1.07 billion worth of funds were actually
brought in (disbursed) during the period. The agriculture sector received 14 percent of
the total number of projects accounting for seven percent of the total investment capital;
the industry and construction sector received 48 percent of the projects and 79 percent
of the investment capital; and the services sector received 38 percent of the projects and
14 percent of the investment capital. In particular, in fiscal year (FY) 2004/05, a total of
US$1.3 billion of FDI projects were approved, with US$449 million brought into the
country during the year. In the five-year period, FDI disbursements reached US$933
million of which US$326 million was received in 2005. Capital injected from abroad
reached US$855 million, accounting for 91.6 percent of the total. Disbursements in the
industry and construction sectors account for 69 percent, in the services sector at 27
percent, and in the agriculture, forestry, and fisheries sectors at 4 percent. The

412
proportions of investment in the agriculture and services sectors show an increasing
trend.
Overall, FDI has made a positive contribution to the manufacture of goods,
economic growth, and the restructuring of the economy. It also helped to develop the
private sector. These achievements were attributed to the incentives provided by the
Government and other measures, such as the decentralization of foreign investment
licensing. From 2005 onwards, provinces have been delegated by the authorities to
license foreign investment projects valued up to US$2 million. This has led to
significant increases in FDI compared to the beginning of the Plan period. Annual
forums with investors and businesses were organized to discuss constraints and explore
solutions. At the same time, the infrastructure has been improved rapidly providing
better facilities to attract FDI. In October 2004, the National Assembly revised the Law
on Foreign Investment including the incentives, thereby paving the way for more FDI in
2005 and thereafter.
2.6 Labour and Employment
During the past five years (2001-2005), a number of articles in the Labour Code have
been amended and supplemented. A Government decree guiding the implementation of
the revised Labour Code, the Civil Service Law, the Law on Minimum Wages, and the
Law on the Establishment of the Social Welfare and Social Security Reserves was
promulgated. A vocational training centre was set up in Vientiane. From 2001 to 2005,
about 100,000 people have undergone vocational training, lagging behind the Plan
target of 300,000.

413
A new policy on foreign workers in Laos has been drawn up, especially applicable
to technical workers in industrial plantations such as rubber, coffee, and cashew, and in
a number of industries such as electricity, coal, cement, and agro-processing. Thanks to
the policy, thousands of foreign workers (from Viet Nam, China, and Thailand) poured
into the country and facilitated technology transfer. At the same time, sister cities and
provinces in Viet Nam and the Lao PDR have established business networks to
exchange experiences.
A number of labour centres were set up providing opportunities for Lao labourers
to go to Japan, Malaysia, and Singapore. A Government decree guiding the movement
of Lao labourers overseas was promulgated. Two state-owned enterprises (SOEs) and
some private enterprises were established for employment promotion. Additionally, an
Agreement on Labour Cooperation was signed between the Lao PDR and Thailand.
One of the aims of the Government’s policy is to encourage private enterprises to
provide technical and vocational training. By the end of 2004/05, there are over 100
private training centres in operation in the country. In particular, they provide training
for highly profitable and low investment professions, such as English language,
computer applications, and accounting. The Government also promulgated a policy,
which allows foreign workers to open a human resources training centre in the country.
2.7 Poverty Reduction
Poverty reduction is the core task in the socioeconomic development guidelines of the
Party and the Government of the Lao PDR. Promulgated were the Prime Minister’s
Decree No. 10 and other resolutions to implement poverty reduction efforts, which have
progressed significantly during the past five years. These initiatives have been

414
implemented aggressively by CPI (Committee of Planning and Investment), public
organizations, and the four priority sectors (agriculture and forestry, education, health
and infrastructure) in the localities with the participation of poor people, especially in
the 10 pilot districts selected from the 47 poorest districts. The latter (47 poorest
districts) include 2,935 communities with a population of around 1.2 million people in
111,850 poor households, which account for 55.4 percent of the total poor households in
the country.
In 2003/04, CPI issued regulations and mobilized village development funds
(including from the budget) for poverty reduction. By 2005, there were 192 village
development funds with 10,925 members. The Government injected an input of 18.3
billion kip into the funds. With a loan of US$20 million from the World Bank, the
Poverty Reduction Fund has implemented 1,212 projects, valued at US$8 million in
1,913 villages in 20 districts in five provinces. There are also other poverty eradication
projects, including the projects supported through foreign cooperation that made
progress and are well organised.
So far, the land-forest allocation program has presented 1.09 million ha of
agricultural land and 3.6 million ha of forested land to 419,259 households in 7,125
villages. Areas under slash-and-burn cultivation have been reduced from 118,900 ha in
2001 to 29,400 ha in 2005, fulfilling 75 percent of the Fifth Plan target. Of this, 72,870
ha have been put under industrial trees.
Shifting cultivation and opium production have reduced in a most noticeable way.
Almost 19,000 ha of opium fields were destroyed and nearly 30,000 ha of slash-and-
burn fields were converted into industrial tree plantation areas. By the end of 2004/05,
10 provinces—Oudomxay, Luang Namtha, Bokeo, Vientiane, Phongsaly, Huaphan,

415
Xiengkhuang, Xayaboury, and Bolikhamxay—and one special zone were officially
declared to be free from opium production.
The Government has designed and implemented economic development projects
(in different sectors, including agriculture and forestry, and industry and construction)
and invested in the construction of infrastructure, such as roads, schools, and electricity
grids, as well as in the social sectors, such as health, education and training, culture, and
communications with the purpose of reducing poverty. The labour and social welfare
line authorities actively built and developed forms of model families in the poverty
reduction movement through reorientation from shifting cultivation and opium
production to the production of industrial crops, livestock, handicrafts, trade, and
services to gradually uplift the quality of life of the affected populations.
In 2000/01, about 38 percent of the population was below the national poverty line
(or classified as poor). According to the reports from the provinces, there were 304,100
poor households1 in 2002 and the Plan target was to move some 150,050 households out
of poverty. From 2001 to 2005, some 137,500 families graduated from poverty,
achieving about 90 percent of the Plan target. Model associations of villages and groups
were formed and tested for the development of commercial production including the
establishment of development funds promoting commercial production. Similar models
1 The definition of poor families is based on the standards specified in the Prime Minister’s
Instruction No. 10, which includes income and access criteria. However, the number of poor
households in 2004/05 will be much larger if the national (income) poverty line from the Second or
Third Lao Expenditure and Consumption Surveys (LECS II or III) is used.

416
were formed and tested for the elimination of shifting cultivation and the eradication of
opium production. Local potentials have been tapped to generate incomes for the poor.
Savings groups were being organized and credit funds were established by
mobilizing the participation of poor households to assist the households to develop their
production and increase their incomes through low interest loans. These funds are
closely managed and shared equitably as demonstrated by the Women’s Union Group of
Somsavi Village (Saithany District, Vientiane Capital).
3. CHALLENGES AND CONSTRAINTS
Although the achievements attained in the five-year period (2001-2005) are highly
positive and praiseworthy, a number of challenges and constraints still remain, which
are enumerated briefly in the following:
3.1 Economic Growth in Real Sectors
The growth of the economy remains unstable, and has not generated adequate
investments nor realised its full potential. Although there has been progress, the quality
of growth and the efficiency and competitiveness of the economy remain low and slow.
3.1.1 Agriculture Sector
In the agriculture sector, small-scale and subsistence production is still widespread. The
production in this sector has not achieved the planned target and its full potential. The
introduction of modern cultivation systems remains slow. Agriculture production is still
concentrated on rice. Animal husbandry needs to be further developed. Crop production,

417
animal husbandry, and the quality of agricultural products, albeit increasing, are still
low and seasonal, dependent on the weather. The structural modification of agriculture
production and the composition of the rural economy are still slow and do not yet
guarantee stable components. Commercial production in several areas is not linked to
processing industries and market demands. Overall food production is sufficient to meet
the domestic demand, but about one-third of the districts do not yet have a sufficient
production of rice to meet the consumption requirements for the whole year. The most
important constraints to agriculture development are weak market institutions, formal
and informal barriers to national and regional trade, high transport costs, and lack of
supporting urban infrastructure and service.
The use of inputs in the agriculture sector remains inefficient, more particularly in
the irrigation subsector. Although agricultural production has increased significantly, it
has not met the economic requirements. Many goods could be produced locally and
efficiently, but insufficient efforts for their development resulted in substantial imports
of these goods. The sector-wide quality and efficiency needs to be improved further.
3.1.2 Industry and Construction Sector
The production costs in the industrial sector remain quite high. Very few enterprises use
modern technologies and most of these are foreign-owned. Public investment in the
industrial sector remains low due to the excessive focus on the agriculture sector
(particularly irrigation), infrastructure (mainly roads and ports), and services. There is a
lack of incentives for different economic actors to invest in industrial development.
Coordination between line agencies and local authorities to encourage industrial

418
development remains weak. The handicrafts sector is not sufficiently developing at the
local level. Although advanced techniques are used, its development remains limited.
3.1.3 Services Sector
The services sector infrastructure is still very limited and is not adequate to meet the
socioeconomic development requirements. As a result, the quality of many types of
services is still low. Management of services shows several shortcomings, including
control on investors, personnel management, and the management of family and private
enterprises engaged in the provision of services. The coordination between Government
officers and sectors at the local level in planning the development of infrastructure,
tourism, and others is still very weak, resulting in low efficiency.
3.1.4 Infrastructure Use
The application/use of infrastructure in the activities of many sectors is still very low
since production is not developed at the same pace as the development of physical
infrastructure. Most prominent is the very limited capacity to make efficient use of
irrigation schemes, ports, airports, etc. This results in waste and a reduction in the cost-
effectiveness of investments.
3.2 Financial Sector
3.2.1 Savings and Investment
The ratios of savings and investment to GDP, although significantly improving, are still
low compared to the potentials and the development requirements. The difference
between domestic savings and public investment is significantly high and requires the

419
use of foreign funds, mostly in the form of loans. The mobilization of savings for
investment is still limited since the Government has not yet secured the sources of
adequate revenues and the enterprises in different economic sectors have not yet
sufficiently developed. Also, there are still no policies and detailed mechanisms to
convert land and other resources into sources of capital.
The mobilized funds for investments are limited and are not concentrated on
strongly encouraging structural adjustments for the development of the potentials of
different areas, developing the skills of the labour force, eradicating hunger (scarcity of
rice), and reducing poverty. Investments in infrastructure are scattered and the
implementation of projects is often delayed. Debts incurred for financing the
construction of infrastructure are substantial, and the debt service obligations create
pressure on the budget and prices.
3.2.2 Financial Sector
The use of foreign currencies in transactions by enterprises and the general population is
still widespread.
Interest rates on loans extended to economic entities remain substantially high
although the rate of inflation has declined significantly, thereby adversely affecting
economic growth.
The financial market is developing within a limited scope. Credit is limited and
meets only 15 percent of the requirements. The loan amortization periods are short and
there is pressure on the operations of enterprises and the capacity of the commercial
banks to recover loans. The volume of repayments overdue in the banking system is
substantial and is concentrated mainly in the domestic commercial banks, which suffer

420
from poor financial capacity and quality of transactions. High nonperforming loans
(NPL) are a drag on credit flow and high interest rates remain.
3.3 Economic Fundamentals
Until now, the economic base of the country remains to be relatively small. The total
GDP in 2005 amounted to only US$2.8 billion, with an average GDP per capita of
US$491. These indicators for the Lao PDR are among the lowest for the countries in the
region, and it remains one of the poorest countries in the world. The economy’s growth
rate is yet to reach its full potential. With the low economic base, even if the rate of
growth of the economy accelerates significantly, the absolute value added to the GDP
would remain modest. The gap between the GDP per capita of the Lao PDR and that of
other countries in the region continues to widen.
3.4. Structural Adjustment of the Economy
3.4.1 Structure of the Economy
The adjustments in the structure of the economy largely focus on the sectoral
composition of GDP, concentrating on the rate of industrialization. They do not take
into account adequately the goals in structural adjustment in line with the direction of
industrialization and modernization, with strong technological and technical
developments. Therefore, the development of domestic industries is characterised by
obsolete technologies, high costs, and low efficiencies. This requires high
protection/subsidies, thus reducing the competitiveness of the economic sectors in the
long run in the process of international integration. Structural adjustments in the
agriculture sector have only recently been initiated with the conversion of low-

421
productivity (and low-value) rice cultivation lands into industrial plantations. The
economic components of the agriculture sector are not strongly linked to the processing
industries and markets. The economic structure in rural areas is mainly and solely
reliant on agriculture, which accounts for 84 percent of the people’s livelihood. The sale
of a number of agricultural products is difficult due to high production costs and low
quality. Many products are not competitive.
3.4.2 Geographic (Spatial) Structure
The geographic (spatial) structure of the economy shows considerable disparity, with
large variations in the growth rates and a relatively low level of development in many
northern and southern provinces. The economies in many areas remain unbalanced and
the territorial potentials have yet to be strengthened. At the same time, the economic
transition still remains slow, and a large share of the land is in agro-forestry. The
development gaps between urban and suburban, provinces/territories, economic sectors,
and the ethnic groups are large. Therefore, it is difficult to identify the intrinsic (but
concealed) potentials in each province/territory.
3.4.3 Labour Force
The skill level of the labour force is developing slowly compared to the improvements
in the economic components in each sector and area. The capacity development of the
labour force is characterized by self-improvement, with only occasional opportunities
for training, resulting in casual labour. Without proper institutional arrangements and
training programmes, it would be difficult to achieve the objective of appropriately

422
redistributing the labour force and population to meet the requirements of
industrialization and modernization.
3.5 External Economic Relations
3.5.1 Foreign Trade
Exports and imports still face severe constraints. Exports per capita are still extremely
low due to constraints in large-scale commercial production and in processing higher
quality products. The export of unprocessed and low value added agricultural products
accounts for a major proportion (about 50%) of the export revenues. Therefore, the
value of exports is low and may be reduced easily due to fluctuations in price. Moreover,
more than half the revenues from Lao exports are generated from products for which
markets are unstable (e.g., garments), or the volume has reduced (e.g., wood), or which
suffer from price declines (agricultural products). Interestingly, the rate of growth of
exports is not yet stable and is lower than the GDP growth rate, while the exports of
many countries in the world are increasing twice as fast or faster than the growth in their
GDP.
The foreign trade management policy framework and measures need to be further
developed in detail. The existing framework and measures do not ensure overall
coverage and lack long-term vision, affecting their efficiency. In many cases, they
demonstrate a lack of ownership, especially in the management of imports.
Coordination between central and local authorities on exports and imports is still weak
and inefficient. There is still a widespread shortage of management officers, technical
staff, and workers with high technical skills.

423
Even though substantial imports have significantly contributed to the successful
growth of domestic production and exports, they are increasing faster than the rate
outlined in the Fifth Plan. The management of imports still faces severe difficulties.
There is a general lack of market information and most of the imports are concentrated
on smaller markets, and many technologies have been imported but obsolescence is still
pervasive.
3.5.2 Foreign Investment
Foreign investment increases at a slow pace. Investments in the agriculture, forestry,
and fisheries sectors and areas with difficult access are very limited. At the same time,
the capacity to attract investments in the industrial sector remains low. The licensing
process is time consuming and cumbersome. Foreign investors face many difficulties
due to the insufficiently open investment environment, inadequate facilities, and the
lack of consistency and predictability. The costs of inputs such as fuel, electricity,
telecommunications, and shipping are much higher than in many other countries in the
region, restricting the competitiveness of Lao products and services and the
attractiveness of the Lao PDR to foreign investors. Also, there are very few investors
with the capacity to raise large volumes of funds from the regional and international
economic groups.
One of the main causes restricting the growth of foreign investment in the Lao
PDR is the insufficiency of skilled labour. Currently, skilled labour represents only two
percent of the total labour force and is not able to meet the requirements of foreign
enterprises that need highly skilled labour.

424
3.6 Social Development
3.6.1 Education and Training
In the education and training sector, repetition and dropout rates are high and increasing.
In 2005, the dropout rate was 8.9 percent at the primary level, 7.2 percent at the lower
secondary level, and 3.2 percent at the upper secondary level. The repetition rates at
primary schools, mostly in year 1, stood at 34.1 percent. Due to the low quality of
graduates, few are accepted in the labour market, while the remainder are forced to
work in sectors other than their areas of training.
The issue of insufficient teachers and substandard teachers has dragged on for
many years, but efficient solutions have still not been applied. By 2005, about 19
percent of the teachers had not been properly trained. The curriculum is obsolete, while
enrolment at the lower and upper secondary levels remains generally high. Current
treatment of teachers and the management of the teaching corps are characterized by
many inconsistent elements and fail to encourage teachers to undertake proper training
as well as capacity enhancement activities. Teachers are paid very low salaries
irregularly. Classrooms are insufficient to accommodate the rising number of students.
This leads to a phenomenon where classes need to be rescheduled in lower and upper
secondary schools. The ratio of students per class is high at around 70-80.
The literacy rate remains very low. The survey data show that in 2005, only about
68.2 percent of the people aged 15 years and over are literate, which include the 15-39
years age group with a literacy rate of 78.6 percent. According to another review, only
about 45.2 percent of the population are literate with a breakdown of 53.7 percent for
men and 36.3 percent for women. This review also indicated that only 37.7 percent of

425
the literate population have a normal level of application of their literacy skills and 30.8
percent are able to make good use of their literacy skills in their activities.
The training of personnel, workers, and skilled artisans does not meet the
requirements of the labour market and the society. The development of education in
isolated, ethnic, and highland areas is very slow. Illiteracy eradication efforts are not yet
based on strategic plans and detailed procedures, and a substantial portion of the
population is still illiterate.
The implementation of scholarship awards is slow. In 2005, only about 7.5 percent
of persons with merit have received assistance, representing only 30 percent of the Plan
target. (The Plan provides for the provision of assistance to 25 percent of students
through different means.)
The education sector suffers from a severe lack of equipment and tools,
particularly textbooks, learning materials, and school facilities. Teaching fails to meet
the requirements. The ratio of schools meeting the standards set by the Government is
still very low. The budget allocations made to education are very limited and not
constant, with a peak of only 10 percent of the total budget expenditures. Within such
allocations, up to 80 percent are provided from external grants, and the mobilization of
these funds is subject to increasingly difficult conditions. The National Assembly
agreed to allocate 12 percent of the budget to the education and training sector, but none
of the provinces have yet received such an allocation.
3.6.2 Employment
The need for new employment opportunities is huge, but employment generation is
slow and there is a high level of unemployment. The allocation of the labour force is
426
shifting slowly, and has not brought about significant changes in socioeconomic
development. Subsistence production results in the underemployment of labour and
makes the management of social issues more difficult. The lack of external
communication results in an inward-looking (insular) economy. The labour cooperation
mechanism is not yet open to facilitate labour movement among districts and provinces,
as well as other countries in the region.
3.6.3 Poverty Reduction
In poverty reduction efforts, due to insufficiently firm coordination between the relevant
agencies and unified guidance from the Government, each agency is left to carry out
their sector’s activities independently. The overall supervision, assessment, control, and
monitoring of poverty reduction activities have not been entrusted to any agency.
Clear and specific credit policies need to be outlined to allow public funds to reach
producers when required, and proper mechanisms need to be established to mobilize
domestic and foreign resources to establish funds that would extend credit to the poor
for the development of production activities and the reduction of poverty.
Civil servants including the technical staff of local administration authorities are
insufficient in number and have inadequate capacities, and a substantial number have
minimal qualifications. This is a major constraint to the dissemination of policies and
programmes and the implementation of policy guidelines adopted by the Party and the
Government, thereby affecting the efficiency of poverty reduction efforts.

427
3.6.4 Social Security
The establishment of an efficient social security system for all Lao people to alleviate
poverty is a long-term objective. Public servants are covered by a comprehensive range
of provisions including pensions and health care financed partly through a six percent
deduction from salaries and partly from the state budget. In 1999, the Government
adopted a Decree on Social Security System for Enterprise Employees, establishing the
foundation of a National Social Security Scheme. It called for the creation of a Social
Security Organisation (SSO) that began operating in June 2001. The SSO administers
the Social Security Scheme for enterprise workers in the private and the SOE sectors.
The scheme provides protection coverage with respect to a range of contingencies/risks
including the following:
• Access to health care from an approved health care provider for insured workers
and their families;
• Long-term pensions in case of invalidity or old age and to surviving dependants;
• Short-term benefits in the event of incapacity to work by virtue of sickness or
maternity; and
• Benefits in case of incapacity to work by virtue of an employment-related injury
or sickness.
However, a very low proportion of workers are covered under the formal social
security systems. Only 4.7 percent of the total labour force, with about 28 percent in
Vientiane City, has social security coverage. In 2005, care and aid were given to only
7.5 percent of the total beneficiaries, accounting for 30 percent of the set target.

428
4. DEVELOPMENT PERSPECTIVES AND STRATEGIES
4.1 Development Context
On the positive side, there has been political and social stability over the past five years,
and this situation is to be strongly maintained. The production capacities and abilities of
many industries have increased substantially, and the economic structure has changed
significantly. The enterprises and the national economy have adapted better to the
international market, and the competitiveness of Lao products has improved steadily.
The economic structure has changed progressively, and the implementation of the
Party’s instruction has been implemented methodically in priority projects. The market
economy structure has been adjusted and progressively improved. The geographic
location and natural resources of the Lao PDR attract tourism and investment. The
country has been recognized as the transit center of the region.
Over the past five years (2001-2005), the production capacity and ability of many
industries increased substantially, and the economic structure changed significantly. The
quality of growth in many industries and regions has improved somewhat, with the
enterprises and the national economy adapting better to the international markets. New
and more radical policies introduced in the recent five years had positive impacts,
attracting more investment from the society, especially utilizing internal resources for
targeted investments, and bringing about structural changes in the economy.
The country has been recognized in the region and globally as having a dynamic
economy within a stable political situation, and a safe destination for investment and
tourism. Sociopolitical stability is an important foundation and an essential precondition
for socioeconomic development, which is an advantage that the Lao PDR enjoys now.
429
The full membership of the Lao PDR in the regional and global political, economic, and
monetary organizations including the World Trade Organization (WTO) will boost the
dynamism of the economy and accelerate the country’s development.
4.2 Government’s Development Strategy Framework
4.2.1 Overall Development Strategy
The overall development strategy for the Lao PDR is based on the Lao Government’s
national development strategy framework mainly: (i) the Long-Term Strategy of Socio-
Economic Development to the Year 2020; (ii) the Strategy on Industrialization and
Modernization; (iii) the National Growth and Poverty Eradication Strategy (NGPES);
(iv) The Sixth Five-Year National Socio-Economic Development Plan (2006-2010); (v)
the Regional Development Strategy; (vi) various sector, thematic area, and subsector
strategies and plans; and (vii) the analysis of the international and domestic contexts for
the development of the Lao PDR.
The 7th Party Congress has set out the Ten-Year Socio-Economic Development
Strategy (2001–2010) for the country, which includes improving and building the
economic infrastructure to ensure fast and sustainable economic growth, with emphasis
on agricultural production, eliminating forest fires and deforestation, reducing the
number of poor households, and promoting industrialization and modernization. The
country’s human resources are to be developed step-by-step both in quality and quantity
to cater to the emerging needs and make the country a regional centre for exchange of
goods and services. The strategy encourages a socialist-oriented industrialization and
modernization with infrastructure development to prepare the nation for graduation
from the Least Developed Country (LDC) status by 2020 and to achieve improved well-

430
being for all the Lao peoples. The objectives set out in the Strategy support the
achievement of the Millennium Development Goals (MDGs) and the implementation of
the Brussels Programme of Action for Least Developed Countries (2001-2010).
The Sixth Five-Year National Socio-Economic Development Plan (or Sixth Plan)
covering the five-year period 2006-2010 plays a crucial role in implementing the
socioeconomic development policy guidelines set out by the 7th Party Congress. It is
the vehicle for facilitating the implementation of the second half of the Socio-Economic
Development Strategy (2001–2010) approved by the Congress. The Sixth Plan
institutionalizes and concretizes directives and tasks that will be carried out further
during the five-year period 2006-2010, to ensure that the overall targets outlined in the
Ten-Year Strategy (2001-2010) are achieved.
4.2.2 Development Directions
The directions set in the Sixth Plan (2006-2010) are to achieve the highest
outcomes and make general changes along the following lines:
(i) Turn from underdevelopment to fast and stable development, producing high
value-added goods both in quantity and quality step-by-step in order to meet domestic
market demand and increase exports;
(ii) Increase competitiveness and utilize comparative advantages to implement
effectively international economic commitments in the frameworks of ASEAN and
other bilateral and multilateral commitments, including the WTO;
(iii)Strengthen links between economic development and social development, and
protect natural resources and the environment. Social problems should be solved first,

431
with attention paid to such issues as the reduction of poverty, unemployment, and social
evils, and keep the social and political situation stable: and
(iv) Accelerate the building of a comprehensive socioeconomic infrastructure and
finalize the establishment of a market-oriented economy with socialist orientation to
form the basis for industrialization and modernization.
Thus, the Sixth Plan (2006-2010) is seen to be a breakthrough plan for creating a
fast but firm and qualitatively enhanced development, with increased capacity for
economic competitiveness, lifting the society to new heights both in material and moral
wellbeing, significantly improving the quality of life of all the people, and boosting the
nation’s status in the international arena.
4.2.3 Overall Goals of the Development Strategy
The 7th Party Congress identified the general goals of the Socio-Economic
Development Strategy for the 10-year period 2001-2010 as follows: “Improve and
establish the basis for the economy to progress strongly in firm steps, especially to
strongly develop the agriculture sector; entirely eliminate the slash-and-burn
cultivation practices; complete the tasks in solving the problem of poverty of people;
create the foundation for industry; prepare the quality and quantity of human resources
to be ready for industrial development and gradually turn to industrialization; and
develop our country to become the central point of transit of the region in the future. ”
The Party Congress identified the following key expectations: GDP in 10 years (2001-
2010) to increase to an average of 7.5-8 percent per annum; GDP per capita in 2010 to
be US$700-750; and the population growth rate in 2010 to be reduced to about 2
percent per year.

432
The main goals of the Sixth Plan (2006-2010) are to maintain all targets and views
that have been set in the 10-Year Strategy (2001-2010). Therefore, the goals for the
Sixth Plan are as follows:
“Accelerate economic growth and improve the people’s quality of life,
restructuring the economy and employment in building a market economy, based on the
country’s rich resources and international integration. Further build the market
economy with a socialist orientation. Continue to enlarge and develop effective external
economic relations. Create breakthrough changes in education and training in terms of
quality and quantity, utilising the advances in science and technology, protecting the
environment, and taking human, scientific, and technological players as vehicles for
development. Develop culture and society in synchrony with economic growth. Continue
poverty reduction, creating jobs, and eliminating social evils. Continue strengthening
the socioeconomic infrastructure as fundamentals for development in the Sixth five-year
Plan and for the next (Seventh) five-year plan. Maintain political stability and social
security, protecting sovereignty, territorial integrity, and national security.”
Based on the goals set out above, the following tasks and guidelines are to be
followed:
(i) Economic growth should be increased to an average of 7.5–8 percent per annum,
establishing the fundamental economic players to support the next (Seventh) five-year
Plan. Accelerate the progress of economic systems and enhance the potentials of
products by region. To do so, the quantity and quality of goods and services and the
level of competitive ability of all business enterprises and economic sectors must be
improved, paying attention to the development of information technology and
establishing the foundations for human resource development;

433
(ii) Ensure the balance in economic development in parallel with social
development and protection of the environment, solving urgent social problems, and
actively solving other ill behaviours in the society. Create job opportunities, reduce
unemployment, uplift the people’s level of material and mental wellbeing and living
conditions, improve salary scales, reduce poverty, and take care of people who are
national heroes and who have sacrificed themselves for the nation;
(iii)Encourage economic development in the various sectors by paying attention to
the state economy as the leading sector; concurrently establish and develop other forms
of the economy: collectives and private and foreign businesses; establish and implement
the instructions and regulations related to the market economic arrangements with
socialist orientation as a strong step. Pay attention to the creation of facilitating
environments for investment and business activities in a consistent manner, and ensure
transparency and a high level of economic competitiveness in the region;
(iv) Promote and develop small and medium enterprises (SMEs) to expand rapidly,
and create the conditions to strengthen the financial status of state-owned business
enterprises step-by-step, including the improvement of their debt situation;
(v) Ensure the maintenance of existing infrastructure; establish additional
infrastructure specifically to support the socioeconomic development activities aiming
to promote trade, investment, and tourism; increase the investment in the infrastructure
for socioeconomic development; explore national resources including human resources
to be used as potentials for development in an effective manner; establish and prioritize
investment projects to establish effective economic structures and to be in a good
position and ready for competition;

434
(vi) Continue to broaden economic opportunities and upgrade the level of external
economic relations; create facilitating conditions to increase exports; attract investment
in terms of funding and technology as inputs from external sources to support the
production of goods and exports while taking ownership in economic integration at the
international level: and actively and strictly implement bilateral and multilateral
agreements at the central and local levels;
(vii) Continue to improve and strengthen the financial and monetary sectors by
increasing the capacity of the national financial administration bodies; solve the
problem of long-standing debts by utilizing many financial sources including financial
balancing at local levels. Implement national policies on economization strictly;
maintain macroeconomic balance; establish and develop financial markets to meet the
needs of socioeconomic development activities;
(viii)Continue with progress on new changes to create comprehensive development
approaches in the areas of education and capacity building; implement compulsory
primary education programs; apply science and technology; upgrade the level of quality
of human resources to catch up with the new changes in the economic structures; apply
advanced and modern technologies in areas with favourable conditions with primary
focus on economic areas at the center and in the provinces, municipalities, and cities;
(ix) Enhance the public administration activities with strong steps and improve
and upgrade the effectives of state organizations. The relations between the state bodies
and local people and business enterprises must be organized with transparent
approaches allowing audits to be conducted; solve the problems of bureaucratic
phenomena and corruption; and uplift the capacity of government officials in
performing their duties;

435
(x) Strengthen the areas of national defence, public security, social and political
aspects, and broaden foreign relations; maintain the society with stability; and create a
favourable environment to support the development and protection of the nation.
The goals coincide with the MDGs and those in the Brussels Programme of Action
for Least Developed Countries (2001-2010).
4.2.4 National Priority Development Programs:
To implement the overall development strategy successfully, the Lao Government
has determined and approved 11 National Priority Development Programs for 2006-
2010, namely:
1. Stability and Security Development Program
2. Comprehensive Agriculture Development Program
3. Forestry and Wood Processing Industry Management Program
4. Basic National Industry and Industrialization in Potential Sectors Program
5. Tourism and Service Promotion Program
6. Poverty Reduction and Stop Shifting Cultivation Program
7. Economic Integration and Investment Promotion Program
8. Communication and Transportation Development Program
9. Strengthening Macroeconomic Management Program
10. Human Resource and Cultural Development Program
11. Strengthening Effective Governance Management Program

436
5. POLICY RECOMMENDATION Based on the challenges and problems discussed earlier as well as on the Lao
Government’s development strategy framework, policy recommendations for
deepening integration, narrowing development gaps, and promoting sustainable growth
in the Lao PDR are made as follows:
5.1 Infrastructure Development by Focusing on Land-linked Country and Economic Corridors
(i) Improve and developing transportation infrastructure with neighboring countries
(ii) Develop the transport corridors to become economic corridors
(iii) Develop missing links to provide a complete package of infrastructure along main
economic corridors
(iv) Link all provincial capitals (and other key centres) to power, transport, and telecom
networks via the main economic corridors
(v) Develop urban infrastructure in rural villages and towns.
5.2 Strengthening Private Sector Development (SME, Market Development)
a) Promoting private sector development
(i) Clarify and strengthen the supportive role of Government
(ii) Strengthen the Lao National Chamber of Commerce and Industry and Business
Association
(iii)Promote and facilitate substantive dialogue with the business community
(iv) Promote and facilitate public-private development partnerships

437
(v) Simplify and clarify the policy and regulatory framework for private sector
enterprise and investment
(vi) Strengthen trade access to neighbour country markets
(vii) Integrate with production networks, investment clusters, and trade hubs by
establishing national and cross-border production chains and by urban planning
and town development
(viii)Mobilize financial resources and facilitate access to credit
- Establish a sound banking system and extend the services
- Perform selective use of directed credit
- Mobilize and coordinate ODA support
(ix) Strengthen competitiveness through regular training on related activities
b) SME development strategy
(i) Create an enabling regulatory and administrative environment for SMEs;
(ii) Enhance competitiveness of SMEs;
(iii) Expand domestic and international markets for SMEs;
(iv) Encourage investments and improve access to financing by SMEs;
(v) Improve access to appropriate work premises;
(vi) Create favourable conditions for and facilitate establishment of business
organisations;
(vii) Encourage entrepreneurial attitudes and characteristics within the society;
(viii)Finance SME development measures (programmes and projects).
c) Market development

438
Development of Financial Markets
(i) Establish strong regulations to control monetary-financial markets to facilitate
foreign exchange operations and make the transfer (trading) of money in the
market simple and transparent, while monitoring the movement of the
volume of currencies in the market to ensure that it is consistent with sound
monetary management.
(ii) Strongly study the development of the bond market, setting forth the interest
rate to be consistent with the changing situation and the trading within the
bond market. Terminate the sale of government bonds to commercial banks to
solve the problems of triangle debts (of SOEs).
(iii) Consider developing the state-owned banks to enable the Government to
supervise and monitor the performances of the monetary-financial system to
be more transparent in solving doubtful debts through auditing of the accounts
and the categorization of debts in accordance with international standards.
(iv) Promote microfinance , which can provide financial input for small
enterprises in rural areas.
Labour Market Development
(i) The Labour Law should be improved in order to ensure the balance of
benefits between employees and employers, promoting and facilitating the
workforce to have jobs in both domestic and international markets. Promote
all economic players (sectors) to actively contribute to the creation of jobs in
both quantity and quality.

439
(ii) Improve the regulations on employment agencies (job seeking business) and
dispatch of labour to work abroad in accordance with the direction of creating
the conditions to enable multiple players to increasingly provide such services
(more and more), while simultaneously improving the ability of the state to
monitor the situation.
(iii) Establish an effective social insurance system, particularly the unemployment
insurance, creating equality on providing social insurance for the employees
of all economic sectors (e.g., public, private, and voluntary).
(iv) Improve the management system of labour markets within central and local
regions.
(v) Promote the involvement of mass organizations and nongovernmental
organizations (NGOs) in developing the labour market and assign them some
responsibilities, such as training, skills upgrading, performance on the job, job
creation planning, and supporting plans for start-up of enterprises.
(vi) Enhance the role of the trade union as the representative organization of the
employees in order to facilitate the involvement of the labour force in plan
formulation, setting forth policies on the labour (workforce) market, and
monitoring the compliance with (observance of) the Labour Law.
Real Estate Market Development
(i) Consider developing the real estate market, with the rights of land usage and
ownership of dwellings. Create mechanisms for facilitating transfer of rights
of land usage and ownership of real estate. Provide opportunities for the
citizens and enterprises that belong to other economic sectors to be able to

440
own land, and have long-term leases for use in farming, for operating
businesses, and to serve their daily lives.
(ii) Facilitate land usage to establish and develop medium and large-scale farms
in the areas where there are good conditions.
(iii) Continue to disseminate the regulations on land use by Lao people living
abroad and foreigners who invest in Laos.
(iv) Urgently formulate laws, especially the law on the real estate market, and the
regulation on the registration of properties, along with the dissemination of
legal documents.
5.3 Tourism development
(i) Develop and promote cultural, eco-based, and historical tourism in the
country as a sustainable tourist-friendly destination
(ii) Facilitate the development of a more competitive tourism industry
(iii) Link the national and local tourism industry with neighboring countries
(iv) Integrate tourism considerations in town and community planning
5.4 Natural Resource-based Industry
a) Must be an environment-friendly and environment-oriented industry
(i) Implement ecological zoning, establish a strong environment-friendly legal
framework, and develop an appropriate implementation mechanism.
(ii) Cooperate with neighbouring countries to stop illegal logging, especially in
remote border areas (including the NBCAs bordering on China, Thailand, and

441
Viet Nam) that are hard to monitor. Greater cooperation among neighbouring
countries is also needed to stop the illegal trade of endangered flora and fauna.
b) Must be an economically efficient and economic-oriented industry.
(i) Set appropriate resource prices: In addition to timber royalties, prices for
hydropower concessions, water resources, and other natural resources in Lao
PDR are normally set far below their marginal opportunity cost (MOC),
leading to inefficient and wasteful resource use. Forest royalties are far below
the MOC. In addition, pricing does not incorporate environmental externalities;
pricing should not encourage overexploitation, as is now the case.
5.5 Develop the Processing Industry in the Country
(i) Develop agro-forest processing industry for export and domestic consumption.
(ii) Developme mining based construction material industry (brick, cement
industry)
5.6 Human Resource Development
(i) Implement the policy of universal compulsory education at the primary level
and continue to increase participation at the lower secondary level, ensuring
that all people have the opportunity to apply their education to serve the
socioeconomic development programme;
(ii) Strive to completely abolish illiteracy among the population;
(iii)Expand vocational, technical, and higher education to meet the needs of the new
labour market and to improve the economic rates of return;
442
(iv) Train skilled workers, technicians, professionals, and intellectuals to have the
capability to apply modern science and technology to serve the needs of
socioeconomic development;
(v) Raise national education standards gradually to be closer to international
standards;
(vi) Take education as the core of human resource development and invest
appropriately in education; and
(vii) Make education a right and duty of all the people in society.

443
Chapter 12
CHALLENGES, PROSPECTS AND STRATEGIES FOR CLMV DEVELOPMENT: THE CASE OF MYANMAR
Kan Zaw
ABSTRACT Since ASEAN economic integration is more than the liberalization of trade and investment and also linked with each other through many other means, the subregional growth areas of CLMV have been focused from Myanmar’s perspective. This paper gives an overview on and insight into Myanmar economy. Statistical portrayals were updated. Trade indices and prospects were obtained from economic cooperation among ASEAN countries. In Myanmar, the nation-building tasks carried out in the past two decades are regarded as guidelines in carrying out peace and stability, as well as the balanced growth in its states and divisions. This paper highlights the National Development Planning, which focuses on the Development of Border Area: Plan for 24 Special Development Zones and Integrated Rural Development Plan. These remarkable national plans are expected to accelerate economic growth, achieve equitable and balanced development, and reduce the socioeconomic development gap between rural and urban areas all over the country. Also, regional infrastructure developments are included in the Growth Corridor Concept. For such efforts and its location advantage for future prospects, Myanmar deserves a closer look.
1. RATIONALE
The success of ASEAN economy reflects every facet of growth of Myanmar economy.
Moreover, the lessons given by the 50 years of development have brought about new
prospects for global and local economic development. Analyzing the contour of
Myanmar economy and its present status will reveal that the nation has committed to

444
strengthening its economy to move towards a new, modern, and developed nation. The
developmental activities in all sectors and for all of Myanmar people are also within the
nation’s development terrain.
For more than a decade now, Myanmar has been taking several steps and adopting
a number of strategic frameworks as comprehensive initiatives towards economic
development. After going through a socialist period from 1962 to 1988, various reforms
and measures were introduced during the early 1990s. These reforms broadly covered
the areas of foreign trade, foreign investment, tourism, fiscal and financial sectors, legal
system, the establishment of special development zones, and the development of
frontier area administration. Since then, development has been extended to other areas.
Taking its cue from the World Development Report, which prescribes that “a renewed
commitment to comprehensive reform is needed to position the economy for recovery
and growth and to lay foundation for reducing poverty,” Myanmar undertook some
initiatives to fix the economy and catch up with its neighbors.
It is necessary thus to expand the concern of economic integration as the vision of
development strategy towards the age of economic integration, which is a challenging
issue for all CLMV countries. Achieving sustainable development, developing the
financial sector, and establishing the development fundamentals are essential measures
to be undertaken for a comprehensive development of Myanmar. At this transition stage,
Myanmar has declared that its development strategies are regionally feasible.
2. OVERVIEW ON MYANMAR ECONOMY
Adopting the market-oriented policy since 1988 was a significant change in terms of
overall policy framework in Myanmar. The utmost goal of becoming a peaceful,

445
modern, and developed country calls for the shared commitment by its citizens under
the concept of "unity in diversity.”
Three national initiatives or causes—nondisintegration of the union,
nondisintegration of national solidarity, and perpetuation of sovereignty—are regarded
as a national responsibility. Based on these three initiatives, the country has laid down
twelve objectives (four political objectives, four economic objectives, and four social
objectives). The thrusts for national development and the economic objectives laid
down for the mission statements are as follows:
・ Development of agriculture as the base as well as the all-around development of
other sectors of the economy;
・ Proper evolution into a market-oriented economic system;
・ Development of the economy to invite participation in terms of technical know-how
and investments from sources inside and outside the country; and,
・ The initiative to shape the national economy must be kept in the hands of the state
and the people.
To achieve the aforementioned economic objectives, the State Law and Order
Restoration Council (SLORC) 1 initiated the economic reform measures in various
sectors, under the following objectives:
・ To adopt a market-oriented system for the allocation of resources and the
distribution of goods and services;
・ To encourage private investments and entrepreneurial activities in the domestic
arena; and,
・ To open the country to foreign direct investment and promote exports.
1 SLORC was renamed as State Peace and Development Council (SPDC) since 15 November 1997.

446
0
50000
100000
150000
200000
250000
1991
-92
1992
-93
1993
-94
1994
-95
1995
-96
1996
-97
1997
-98
1998
-99
1999
-00
2000
-01
2001
-02
2002
-03
2003
-04
2004
-05
2005
-06
Kya
t
0
2
4
6
8
10
12
14
16
Perc
ent
Per capita GDP (Kyat)(current price)
Real rate of growth;
Target rate of growth
The nation-building tasks carried out in the past two decades are regarded as
guidelines in carrying out peace and stability and the balanced growth of its states and
divisions. The growth of economy is also considered as the basic pillar of development,
too.
The rate at which the economy grows is regarded as one of the key indicators of
economic performance. Annual growth rate of GDP, comparing the targets for the
Second Five-Year Short Term Plan (1996/1997 – 2000/2001) and the Third Five-Year
Short Term Plan (2001/2002 – 2005/2006) and the per capita GDP, are shown in Figure
1. The actual growth rate of GDP surpassed the target rate. Annual average growth rate
of GDP was 12.8 percent during the period 2001-2002 to 2005-2006.
It is apparent that the growth of output in the national economy is taking the upward
trend. Growth rate of GDP in 1999 to 2000 was 10.6 percent, the highest growth rate in
the decade. Growth rate of real GDP surpassed the target rate in the early 2000s and the
per capita GDP also soared. The GDP increased significantly from 2552.7 billion kyat
in 2000-2001 to 4661.3 billion kyat (at constant price) in 2005-2006. The per capita
Figure 1: Rate of Growth of GDP (Actual and Planned) and Per Capita GDP
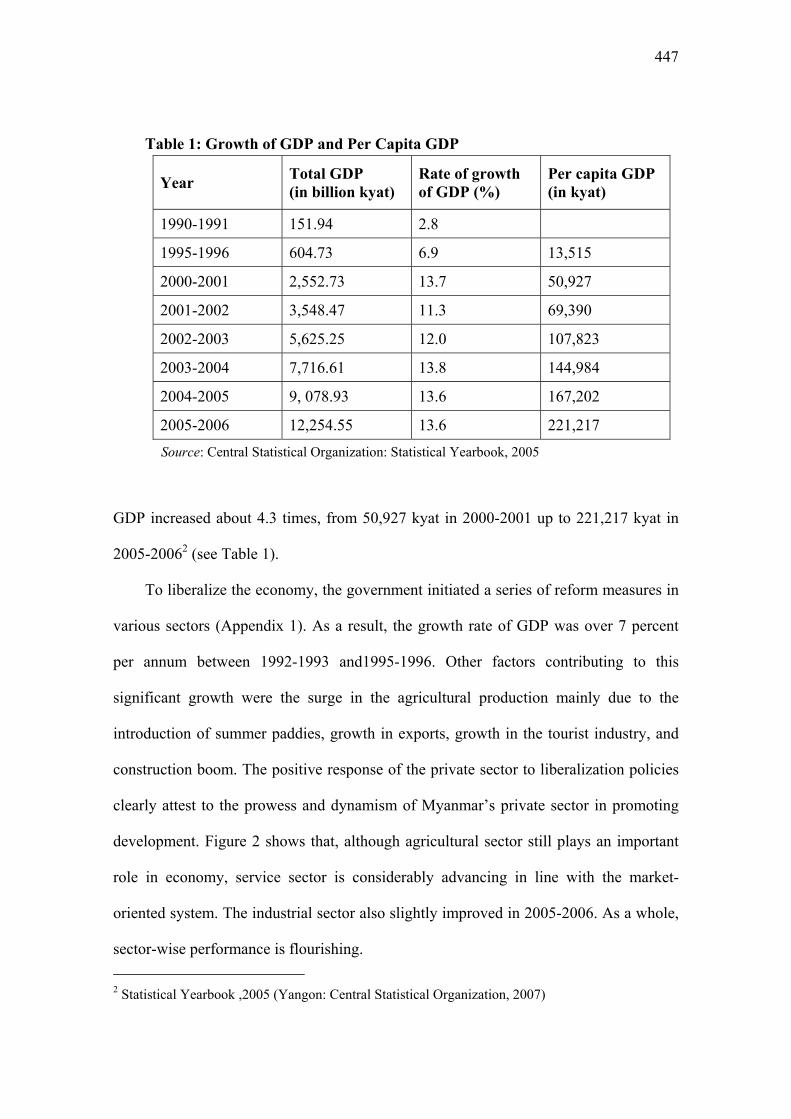
447
Table 1: Growth of GDP and Per Capita GDP
Year Total GDP (in billion kyat)
Rate of growth of GDP (%)
Per capita GDP (in kyat)
1990-1991 151.94 2.8
1995-1996 604.73 6.9 13,515
2000-2001 2,552.73 13.7 50,927
2001-2002 3,548.47 11.3 69,390
2002-2003 5,625.25 12.0 107,823
2003-2004 7,716.61 13.8 144,984
2004-2005 9, 078.93 13.6 167,202
2005-2006 12,254.55 13.6 221,217
Source: Central Statistical Organization: Statistical Yearbook, 2005
GDP increased about 4.3 times, from 50,927 kyat in 2000-2001 up to 221,217 kyat in
2005-20062 (see Table 1).
To liberalize the economy, the government initiated a series of reform measures in
various sectors (Appendix 1). As a result, the growth rate of GDP was over 7 percent
per annum between 1992-1993 and1995-1996. Other factors contributing to this
significant growth were the surge in the agricultural production mainly due to the
introduction of summer paddies, growth in exports, growth in the tourist industry, and
construction boom. The positive response of the private sector to liberalization policies
clearly attest to the prowess and dynamism of Myanmar’s private sector in promoting
development. Figure 2 shows that, although agricultural sector still plays an important
role in economy, service sector is considerably advancing in line with the market-
oriented system. The industrial sector also slightly improved in 2005-2006. As a whole,
sector-wise performance is flourishing. 2 Statistical Yearbook ,2005 (Yangon: Central Statistical Organization, 2007)

448
Figure 2: Sectoral Shares in GDP
2.1 Development of Agriculture Sector
Agriculture contributed 47 percent to GDP in 1991-1992. Its contribution to GDP went
up to 51.9 percent in 2005-2006. It accounted for 18 percent of total export earnings and
employed 63 percent of total labor force in the same period. Seventy-five percent of the
total population residing in rural areas is principally engaged in agriculture, livestock,
and fishery sector. 3 To develop the agriculture sector, the government has taken
measures to ensure sufficient water supply and fulfill the other requirements of this
sector. Moreover, the government is taking steps to expand the yield of major crops:
rice, beans, edible oil crops, jute, palm, rubber, sugar cane, cotton, and caster. For this
purpose, priorities are being given to reclamation of vacant and virgin lands, cultivation
of mixed and double crops, and boosting the per-acre yield. As a result, arable land
3 MNPED, Myanmar Economic Development , 2006 , MNPED
47.0
13.4
39.6
45.0
15.6
39.4
57.2
9.7
33.1
50.1
15.2
34.7
0.0
10.0
20.0
30.0
40.0
50.0
60.0
% o
f tot
al G
DP
1991-92 1995-96 2000-01 2005-06Year
Agriculture Industry Service

449
reached a total of 19.9 million acres in 1988-1989, and increased to 27.3 million acres in
2003-2004 and 28.3 million acres in 2004-2005.
As the liberalization of agricultural sector keeps in line with a market-oriented
economy, agricultural marketing precedes two steps: domestic marketing reform in
1987 and export liberalization in 1988. The first step comprised the abolishment of
compulsory delivery system and admission of private traders into agricultural trading.
The second step covered the authorization of private traders to export freely as long as
they were registered exporters.
As a consequence, both agriculture production and sown acreage increased
dramatically. Paddy production increased from 13,164 thousand metric tons in 1988-
1989 to 30,537 metric tons in 2006-2007. Production of beans and pulses increased
from 371,000 metric tons in 1988-1989 to 4,265 thousand metric tons in 2007/06. In
terms of sown acreage, paddy production increased from 11,807 thousand acres in
1988-1989 to 19,818 thousand acres in 2006-2007. Sown acreage of pulses and beans
went up from 1,803 thousand acres in 1988-1989 to 9,890 thousand acres in 2006-2007.
Employment opportunities of landless laborers increased, as there were more work
offers in harvesting pulses and beans. Moreover, access of landless laborers to credit
increased in the form of advanced wages4.
Due to export liberalization in 1988, export volume of rice and rice products rose
from 134,000 metric tons in 1990-1991 to 182,000 metric tons in 2004-2005, while
exports of pulses and beans increased significantly from 195,000 metric tons to 873,000
metric tons. 4 Okamoto, Ikuko, Agricultural Marketing Reform and Rural Economy in Myanmar; The Successful
Side of the Reform, paper presented at the Parallel Session II, 2004,Institute of Developing
Economies, JETRO

450
With the aim to expand cultivable land, private entrepreneurs and companies were
allowed to reclaim vacant and fallow lands, virgin lands, and wetlands. The state also
supports necessary machinery and equipment, manpower, fuel and communication
network. In 2006, the total area of lands of private entrepreneurs and companies ready
for cultivation reached 2.4 million acres, of which 0.7 million acres were reclaimed
lands and 0.3 million acres were lands under cultivation. Accordingly, the net sown area
increased by 1.5 times, from 19.9 million acres in 1988-1989 to 29.3 million acres in
2005-2006. Mixed and multiple cropping areas increased from 3.9 million acres in
1988-1989 to 19.8 million acres in 2006-20075.
Since agricultural infrastructure development was given priority, the number of
dams and reservoirs increased to 659 in 2005-2006, from 475 in 1988-1989, which
indicates that a total of 189 new dams and reservoirs were built in 2005-2006.
Accordingly, irrigable area increased by 2.2 times, from 2.52 million acres to 5.52
million acres, resulting in an increase in irrigated area to 20.5 percent of cultivated land
area from 12.6 percent.6 Moreover, the total sown acreages of principal crops between
1988-1989 and 2005-2006 doubled. As a result, production of principal crops during the
same period increased (see Table 2).
5 Ibid., MNPED, Myanmar’s Economic Development , November 2006 6 Ibid.

451
Table 2: Changes in Sown Acreage and Production of Principal Crops
Production (in thousand metric tons) Sown Area (in thousand acres)
Crops 1988-1989
2005-2006
Percentage Average Annual Growth Rate
1988-1989
2005-2006
Increase in Amount
Paddy 13,164 27,481 4.4 11,807 18,017 6,210
Beans and pulses 371 4,086 15.2 1,803 9,410 7,606
Oil crops 712 2,334 7.2 4,873 7,971 3,098
Cotton 60 236 8.4 443 820 377
Sugarcane 2,197 7,187 7.2 123 330 207
Culinary crops 389 1,810 9.5 327 852 525
Source: MNPED: Myanmar’s Economic Development (2006).
Since 1992, the government has been implementing various reforms in the
agriculture sector, including double cropping, which increased the number of paddies to
18 million acres in 2005-2006, of which 17 million acres were monsoon paddies and 0.6
acres are summer paddies. Thus, yields from paddies doubled during said period. There
was also an increase in the yield of beans and pulses by 11 times during the same period.
The growth rate of production of beans and pulses averaged 15.2 percent annually. And
the yields of other crops were also increasing faster than domestic consumption. Thus,
the progressive achievements in the agriculture sector covering production, services,
and trade, accrue to national development efforts.
Livestock and fishery, subsectors of agriculture, are also important to Myanmar
economy. These sectors contributed 9.5 percent in GDP in 2005-2006. Concerted
efforts are being made for the development of livestock and fishery sectors to meet
domestic consumption and to promote export. In Myanmar, fish production is still

452
relatively untapped but has vast potential for advancements. Of the maximum
sustainable yield of 1.5 million metric ton of freshwater fish and 1.05 million metric ton
of marine fish, only 80 percent of freshwater fishery and 13.1 percent of marine fishery
are being tapped at present.
2.2 Current Situation of Industry, Trade, and Investment
In industrial development, Myanmar's manufacturing sector accounted for slightly over
15.2 percent of GDP in 2005-2006 and employed approximately 12 percent of the
country's labor force7. The main manufacturing activities are related to the processing of
natural, mostly agricultural resources.
Food and beverages production accounts for about 75 percent of total industrial
output. Private industries, though significantly contributing about 92 percent in the total
industrial gross production, had in the past been confined to small-scale activities that
mainly focused on agro-processing.
In order to promote industrial development, a total of 18 industrial zones were
established across the country in 1995 and 2005. Altogether, 9,915 enterprises are
operating in these zones. (Table 3; the distribution of industrial zones across the nation
is shown in Map-1).
7 Statistical Year Book 2005, CSO, November 2007
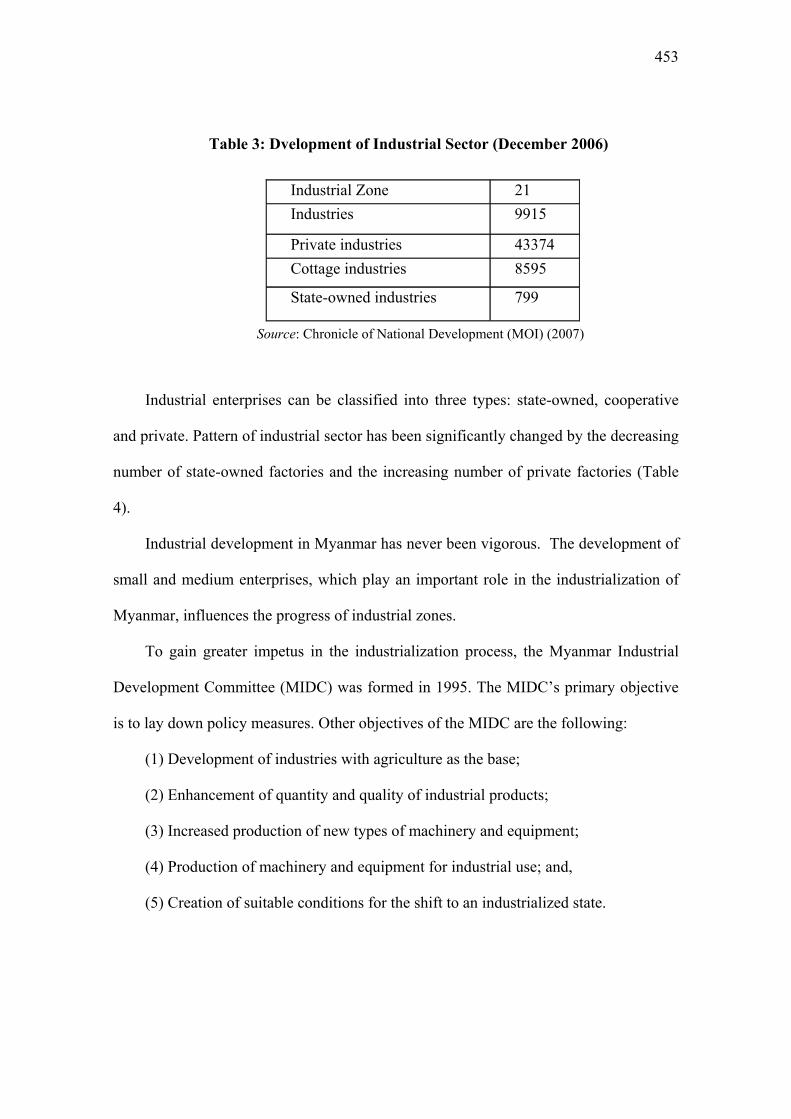
453
Table 3: Dvelopment of Industrial Sector (December 2006)
Source: Chronicle of National Development (MOI) (2007)
Industrial enterprises can be classified into three types: state-owned, cooperative
and private. Pattern of industrial sector has been significantly changed by the decreasing
number of state-owned factories and the increasing number of private factories (Table
4).
Industrial development in Myanmar has never been vigorous. The development of
small and medium enterprises, which play an important role in the industrialization of
Myanmar, influences the progress of industrial zones.
To gain greater impetus in the industrialization process, the Myanmar Industrial
Development Committee (MIDC) was formed in 1995. The MIDC’s primary objective
is to lay down policy measures. Other objectives of the MIDC are the following:
(1) Development of industries with agriculture as the base;
(2) Enhancement of quantity and quality of industrial products;
(3) Increased production of new types of machinery and equipment;
(4) Production of machinery and equipment for industrial use; and,
(5) Creation of suitable conditions for the shift to an industrialized state.
Industrial Zone 21 Industries 9915
Private industries 43374 Cottage industries 8595
State-owned industries 799

454
Table 4: Current Situation of SMEs in Myanmar
Source: Myanmar Industrial Development Committee (2007)
Through the support of government and the assistance of MIDC, advanced foundry
and related workshops were established in industrial zones of Mandalay, Monywa, and
Ayethaya (Taunggyi) to produce machine parts for the state organizations and local
markets. Parallel to the establishment of advanced foundry shops, the government also
assisted in the establishment of mould and die industry to support the manufacturing of
high-quality machine parts. Indeed, setting up of advanced foundry and mould and die
industries was a significant turning point and an important step for industrial
development.
As to international trade, which is also in line with the market-oriented system,
Myanmar’s international trade performance got a boost when open economy and trade
deregulation took center stage. As a result of the liberalization policy, the trade sector
has grown steadily. Figure 3 shows the constant increase in the value of exports and
imports, even as the balance of trade continued to have deficits until early 2000.
1999 2000 2,001 2,002 2,003 2,004 2,0051,593 1,843 2,047 2,304 3,135 3,213 3,438(4.4%) (5.1%) 0 0 0 0 04,033 4,185 4,291 4,342 6,215 6,359 6,430
(11.2%) (11.5%) 0 0 0 0 030,410 30,201 31,393 31,852 33,454 33,863 33,456(84.4%) (83.4%) 1 1 1 1 136,036 36,229 37,731 38,498 42,804 43,435 43,324(100%) (100%) 1 1 1 1 1
Large
Medium
Small
Total

455
However, since 2002, there has been trade surplus due to the increase in total export
volume and new export items in general and surge in natural-gas export in particular.
Figure 3: Changes in Value of Myanmar International Trade
The structure of export commodities obviously changed after 1999-2000. In the
early 1990s, export structure was dominated by agro-based products. Later, resource-
based products became the main export items. As shown in Table 5, agriculture
products, mainly rice and pulse, contributed one-fourth of the total exports.
1990-01 1995-96 1999-002000-012001-02
2002-03 2003-042004-05
2005-06 2006-07
Import
0
5000
10000
15000
20000
25000
30000
35000
Kyat Million Figure (3) Changes in Value of Myanmar International Trade
Export Import

456
Table 5: Structural Changes in Export Commodities (Percentage Share)
No. Commodity 1991-1992 1999-2000 2003-2004
1 Rice and rice products 5.8 0.7 0.9
2 Pulses 17.4 13.2 12.3
3 Maize 0.4 0.6 0.7
4 Oil cakes 0.4 0.0 -
5 Raw rubber 0.1 0.8 0.7
6 Raw cotton - 0.1 -0.1
7 Raw jute - - 0.0
8 Other agricultural products 7.7 2.4 2.0
9 Animal products 0.2 0.3 0.1
10 Fish 1.2 2.6 2.3
11 Prawn 3.8 5.9 4.2
12 Other marine products 0.5 0.5 0.3
13 Teak 25.0 8.1 10.6
14 Hardwood 8.7 2.2 3.9
15 Base metal and ores 2.4 3.2 2.4
16 Silver 0.2 0.0 -
17 Precious stones and pearls 2.7 2.4 2.5
18 Gas - 0.3 24.6
19 Garment 0.3 30.4 13.9
20 Other commodities 23.1 26.0 18.5
Total Export 100.0 100.0 100.0
Source: Ministry of Commerce (2007)
Since 2003-2004, the new export product, natural gas, has been the major export
item. It accounted for 24.6 percent of total export, followed by agricultural products,
accounting 7 percent of the total. In 2006-2007, value of natural gas was the highest (55

457
percent) among the topmost export commodities, followed by forest and agricultural
products, and garments (8 percent each).8
Meanwhile, the structure of importations remained unchanged. The majority of
imports are dominated by capital goods, such as machines and transport equipment,
contributing about 26 percent of total imports. Leading import item in 2006-2007 was
refined mineral oil, which accounted for 32 percent of the total value of the top ten
imported commodities. Other import leaders were machinery (23 percent) and
nonmachinery and transport equipment (10 percent).
In accordance with one of the economic objectives, that is, developing the
economy by inviting participation in terms of technical know-how and investments
from sources inside and outside the country, the government enacted in 1988 the
Foreign Investment Law (FIL). The law permits foreign investments and gives an
opportunity to foreign companies to enjoy up to 100 percent ownership. And to
stimulate investment from the domestic private sector, the Myanmar Citizen Investment
Law (MCIL) was enacted in 1994. Along with these opportunities, joint ventures can be
undertaken with either a private company or a state-owned enterprise. As a result, the
inflow of FDI surged until the middle of 1996 but dropped sharply after 1997 partly due
to the Asian economic crisis and partly due to the economic sanctions imposed on
Myanmar by Western countries.
Under the FIL, 400 enterprises from 29 countries were permitted to invest in
Myanmar, whose total investments were valued at US$13848.86 million as of end of
September 2006. The permitted amount of investment since 1996-1997 is shown in
Table 6.
8 MNPED, Myanmar's Socio-economic Development (2006-07)

458
Table 6: Yearly Permitted Amount of Investment
Year Amount, in Billion US Dollars
1996-1997 2.814 1997-1998 1.013 1998-1999 0.054 1999-2000 0.058 2000-2001 0.218 2001-2002 0.019 2002-2003 0.087 2003-2004 0.091 2004-2005 0.158 2005-2006 6.066 2006-2007 (until September) 0.033
Total 13.848 Source: Ministry of National Planning and Economic Development (2007)
Most of the inflow of foreign investments came from Asian countries, followed by
European countries and the United States. Among Asian countries, ASEAN+3 was the
largest investor. The permitted amount of investment by source countries and the
number of registered enterprises and businesses under FIL are shown in Tables 7 and 8.
Analyzing FDI by sector, it can be noted that electric power sector was the largest
recipient sector of FDI in terms of volume, although there was only one investment
made in this sector. The oil and gas sector takes the second spot in terms of the number
of projects and invested value, followed by manufacturing, real estate development,
hotel and tourism, and mining sectors. Most of the FDIs are resource-seeking and
efficient-seeking, such as oil and gas, fishery, and garment industries due to the richness
of natural resource endowments in the nation. Sectoral investment of permitted
enterprises is shown in Table 9.
It is also noticeable that the domestic investment under MCIL increased annually,
amounting up to Ks 125.34 billion in 2006. According to statistics, 669 enterprises have

459
already been permitted under the MCIL. As to the number of projects and value
invested, the largest player was the manufacturing sector, followed by real estate
development, construction, and transport sectors.
Table 7: Permitted Amount of Investment by Source Countries
Amount (in million US dollars) Share (%)
Asian countries 11,011.649 79.5 -ASEAN+3 10,461.599 75.5 -ASEAN 9,860.787 71.2 -Japan 215.283 1.5 -China 194.221 1.4 - Republic of Korea 191.308 1.4 - India 35.075 0.3 - Others 514.975 3.7 European countries 2,388.231 17.3 -EU countries 23,79.599 17.2 - others 8.632 0.1 American countries 3,33.897 2.4 - United States 243.565 1.8 - others 90.332 0.6 Australia 82.080 0.6 Russia Federation 33.000 0.2 TOTAL 13,848.857 100.0
Source: Ministry of National Planning and Economic Development (2007)

460
Table 8: Number of Registered Enterprises and Business
Enterprise 1990-
1991
2000-
2001
2004-
2005
1 Exporters and Importers 5473 14121 18201
2 Business Representatives 282 2605 2774
3 Myanmar Company Limited 265 9596 14376
4 Partnership Firms 565 1264 1270
5 Foreign Companies and Branches 82 1410 1477
6
Joint-venture Companies Limited (excluding
those under Foreign Investment Law)
State-owned Economic Enterprises and Private
Entrepreneurs
State-owned Economic Enterprises and Foreign
Companies
16
12
4
64
50
14
66
52
14
7 Joint-venture Companies Limited, formed under
Foreign Investment Law 14 77 81
8 Other Organizations 6 39 41
9 Tourist Enterprises - 601 700
10 Tourist Transport Business - 423 378
11 Hotel Business - 336 427
12 Lodging House Business - 178 168
13 Tour Guide Business - 5019 6327
TOTAL 3,923 35,797 46,352
Source: Ministry of National Planning and Economic Development (2006)

461
Table 9: Foreign Investment of Permitted Enterprises
Permitted Enterprises
(as of end September 2006)
Sector
Number Approved Amount
(in million US dollar)
Electricity 1 6,030.00
Oil and Gas 72 2,668.00
Manufacturing 152 1,610.41
Real Estate Development 19 1,056.45
Hotel and Tourism 43 1,034.56
Mining 58 5,34.89
Transport and
Communications
16 313.27
Livestock and Fisheries 24 312.36
Industrial Estate 3 193.11
Construction 2 37.77
Agriculture 4 34.35
Other Services 6 23.69
TOTAL 400 13,848.86
Source: Ministry of National Planning and Economic Development (2007)
3. MECHANISM FOR ECONOMIC DEVELOPMENT IN MYANMAR
3.1 Development Strategies in Myanmar
Myanmar Development Strategy started with the most universal inward-looking
development strategy since the early years of independence (1950- 1960). Myanmar,
similar to other developing countries, practiced import-substituting industrialization led
by the public sector during the socialist period (1962-1988). For external trade, a

462
moderately high tariff wall was put in place to replace the free trade system of the
colonial era. Although, the country’s economy was based on agriculture, the socialist
government gave priority to industrial sector development.
Since the military junta (SLORC) assumed power in 1988, Myanmar economy
was transformed into a market-oriented economic system, initiating an outward-looking
development strategy. Various efforts have been made to achieve sustained
development for the economy. The most significant effort is the structural reform,
which is considered as to be accompanied with stabilization programmes (especially
monetary and fiscal adjustments) based on the following objectives:
・ Adopt a market-oriented system for the effective allocation of resources and the
distribution of goods and services;
・ Encourage domestic private investments and entrepreneurial activities; and
・ Open the economy to foreign direct investment and promote exports.
The main thrusts that direct the development strategies are envisioned towards the
modern, development and peaceful nation with the three main national causes:
nondisintegration of the union, nondisintegration of the national solidarity, and
perpetuation of national sovereignty. With these guided national thrusts, four economic
goals have been laid down as pillars for development strategies:
・ Development of agriculture as the base and all-around development of other sectors
of the economy as well
・ Proper evolution into a market-oriented economic system
・ Development of the economy that invites participation in terms of technical know-
how and investments from sources inside and outside the country

463
・ The initiative to shape the national economy must be kept in the hands of the state
and people
3.2 Strategies towards Agricultural Development
For the development of agricultural sector, the Ministry of Agriculture, as a focal
ministry, has adopted and implemented the following policies and strategies for
agriculture development:
・ To allow freedom of choice in agriculture production;
・ To expand agricultural lands and safeguard the rights of the farmers; and,
・ To encourage the participation of private sector in the commercial production of
seasonal crops and perennial crops and the distribution of farm machineries and
other inputs.
With a view to improve the agriculture sector and uplift the national economy, an
agriculture policy was established in 1992, which declares the following:
・ Production of food crops and industrial crops with no restriction;
・ Permit the production of industrial and plantation crops on commercial scale;
・ Allow private investors and farmers to expand agriculture production in cultivable
wasteland;
・ Encourage the participation of private sector in the distribution of farm machineries
and other farm inputs; and,
・ Utilize agriculturally unproductive land for other production programmes.
The policy objectives are:

464
・ To achieve surplus in paddy production (to increase rice production so that more
surplus of rice could be exported after having reserved enough quantity for local
consumption)
・ To be self-sufficient in edible oil production (edible oil production in Myanmar is
not sufficient and huge amount has to be imported annually. However, Myanmar
plans to stop edible oil importation in the near future.)
・ To increase the production and export of pulses and industrial crops (pulses are one
of the major sources of protein and foreign exchange in Myanmar. Industrial crops
include sugarcane, cotton, rubber, palm oil, of which cotton and sugarcane
production is being intensified to increase export volume.)
To achieve these goals in a more efficient manner, state-private harmonized
approach and rural-welfare orientation approach are being carried out in the long-term.
With a view to accelerate land development, the government has accorded strong
administrative support to national companies, associations, and local citizens by
encouraging and granting rights for the cultivation of paddies, pulses, oil crops, and
industrial crops.
Specifically, Myanmar has five strategic approaches in implementing the policy,
namely:
a. Development of new agricultural land;
b. Provision and adoption of agricultural machineries;
c. Provision of irrigation water;
d. Development and adoption of modern agro-technology; and,
e. Development and utilization of modern crop varieties.

465
In harmony with a market-oriented system, the government has made the most
remarkable reform in the agricultural sector in 2003: the "Decontrolling of Paddy, Rice
and Rice Product Trade", which mentions that the government will directly buy rice
from farmers. This policy aims to ensure a free trade of the crop for the majority of rural
farmers, in accordance with market-oriented policy. Within two decades, there was
evident growth in the investments in agriculture infrastructure and the linkage between
agriculture and industry had become stronger.
Functional and territorial aspects viewed as important factors for harmonious
developments in agriculture, industrial, and infrastructure are taken into account in the
strategies for development. Moreover, national unity, territorial integrity, special
requirements and needs, challenging potentials, necessary reallocation/rehabilitation,
and special plan of actions are covered under the territorial aspects of development. In
order to accelerate economic growth, to achieve equitable and balanced development,
and to reduce socioeconomic development gap between rural and urban areas, the
National Development Plan comes with three national development programs, namely:
1. Development of Border Area
2. Build 24 Special Development Zones
3. Integrated Rural Development Plan
Development of Border Area
To ensure the equitable development all over the country, the programme was started in
1989. Specifically, the Ministry of the Progress of Border Areas and National Races and
Development Affairs was established in 1992 to promote the well-being of border areas.
The main task carried out by the Ministry is upgrading infrastructure in border areas to

466
ensure greater connection with the other parts of the country and thereby narrow down
development gaps. Until 2006, the programme was being carried out in 18 different
areas covering 68 townships.
Plan for 24 Special Development Zones
To facilitate balanced socioeconomic development in all states and divisions, the
government promotes education, health, and infrastructure advancement within the 24
Special Development Zones established in all states and divisions (illustrated in Map-2).
Integrated Rural Development Plan
More than 70 percent of the population live in rural areas in Myanmar and accordingly,
national development will be delayed if improvements in these areas lag behind. In
2001, the Integrated Rural Development Plan was initiated to undertake the following
major tasks:
・ Construction of roads between villages in rural areas to establish a link with urban
areas;
・ Make water available for people as well as for cultivation;
・ Improve and upgrade school buildings and furniture to improve the standard of
education, to improve the quality of teachers, and to encourage school-age children
to attend school;
・ Uplift rural health care system; and
・ Bring about economic growth for the rural populace.

467
With the objectives of enhancing economic development in Myanmar, the First
Short-Term Four-Year Plan was implemented during the periods 1992-1993 to 1995-
1996. It achieved an average annual growth rate of 7.5 percent.
The Second Five-Year Plan was also formulated and implemented from 1996 to
1997 and 2000 to 2001. This achieved an average annual growth rate of 8.5 percent.
The latest initiative, the Third Five-Year Short-Term Plan (covering the periods
2001-2002 and 2005-2006), achieved an average annual growth rate of 12.4 percent.
The main objectives of the Fourth Short-Term Five-Year Plan (2006-2007 and
2010-2011) are:
・ To extend the establishment of agro-based industries and other required industries in
building an industrialized nation;
・ To develop the electric power and energy sectors to conform with the developing
trends in industries;
・ To develop agriculture, livestock, and fishery sectors in order to meet local demand
for self-sufficiency and promote exports;
・ To make initiatives to meet the targeted yield per acre of designated crops;
・ To expand new cultivable lands for agriculture use;
・ To set up a system that will fulfill the demand for edible oil and lubricant oil;
・ To push for the utilization of biodiesel oil to supplement lubricant oil and fuel oil;
・ To establish forest areas for greening;
・ To conserve natural resources and protect the environment;
・ To extend education and health support for human resource development;
・ To build better roads and communication facilities in order to develop commerce
and trade and establish friendly relations with other countries
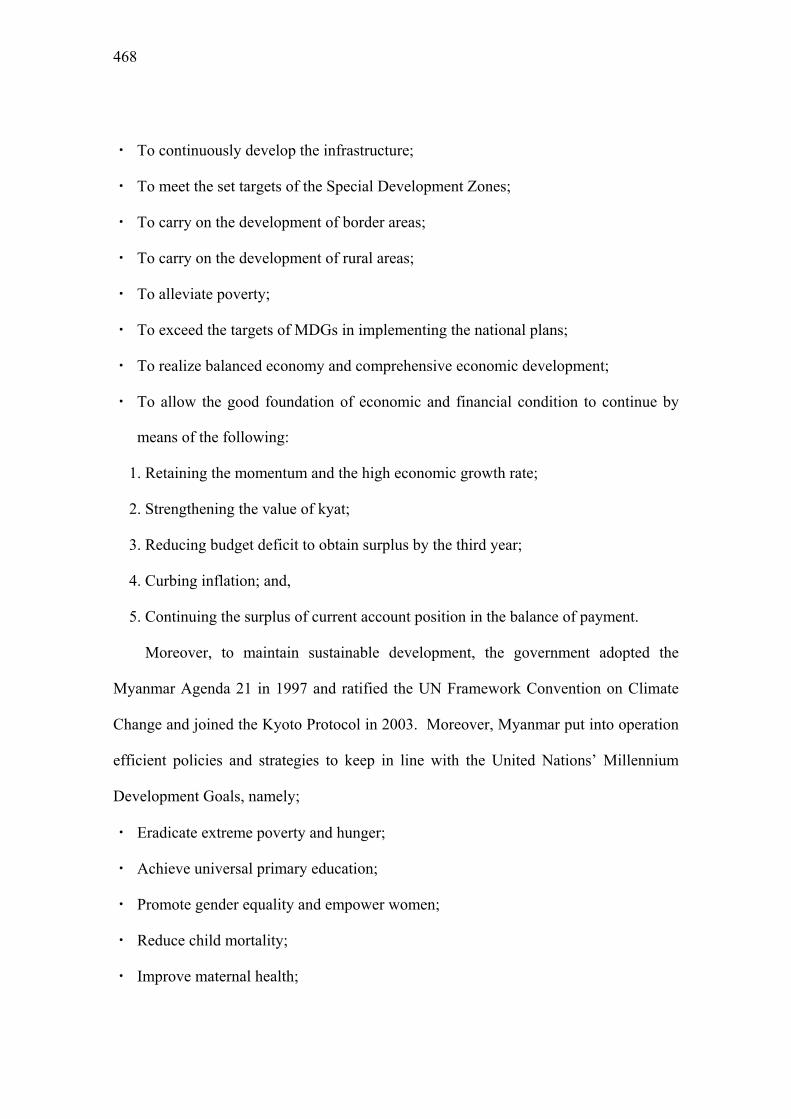
468
・ To continuously develop the infrastructure;
・ To meet the set targets of the Special Development Zones;
・ To carry on the development of border areas;
・ To carry on the development of rural areas;
・ To alleviate poverty;
・ To exceed the targets of MDGs in implementing the national plans;
・ To realize balanced economy and comprehensive economic development;
・ To allow the good foundation of economic and financial condition to continue by
means of the following:
1. Retaining the momentum and the high economic growth rate;
2. Strengthening the value of kyat;
3. Reducing budget deficit to obtain surplus by the third year;
4. Curbing inflation; and,
5. Continuing the surplus of current account position in the balance of payment.
Moreover, to maintain sustainable development, the government adopted the
Myanmar Agenda 21 in 1997 and ratified the UN Framework Convention on Climate
Change and joined the Kyoto Protocol in 2003. Moreover, Myanmar put into operation
efficient policies and strategies to keep in line with the United Nations’ Millennium
Development Goals, namely;
・ Eradicate extreme poverty and hunger;
・ Achieve universal primary education;
・ Promote gender equality and empower women;
・ Reduce child mortality;
・ Improve maternal health;

469
・ Combat HIV/AIDS, malaria, and other diseases;
・ Ensure environmental sustainability; and,
・ Develop a global partnership for development.
3.3 Development of SMEs in Myanmar
In Myanmar, the most distinguishing characteristics of the SME sector are: (1) it is
composed largely of traditional micro and small businesses or enterprises (handicrafts,
traditional weaving, pot making, etc), as well as small and medium manufacturing
enterprises (food processing, oil production, cosmetics, soap and shampoo, herbal
indigenous medicine, etc.); (2) it practices traditional production methods and
techniques; (3) it is labor intensive and has low productivity, unable to meet local
market demands.
Since the introduction of market-oriented policy in 1988, SMEs progressed
vigorously. The enactment of the Private Industrial Enterprises Law of 1990 classified
the industries, as shown in Table 10.
Table 10: Classification of Industries
No. Category Small Medium Large
1. Power used (in horsepower) 3 to 25 Over 25 to 50 Over 50
2. Number of workers 10 to 50 Over 50 to 100 Over 100
3 Capital outlay (in million kyat) Up to 1 Over 1 to 5 Over 5
4. Production value per year (in million
kyat)
Up to 2.5 Over 2.5 to 10 Over 10
Source: Union of Myanmar Federation of Chambers of Commerce and Industry (2005)

470
To develop SMEs in Myanmar, the government promulgated the Cottage
Industries Promotion Law of 1991. The promulgation of this law resulted in the
registration about 600 cottage industries or micro industries, which employ less than 10
workers and utilize less then 3 horsepower of electrical power. In Myanmar, majority of
the SMEs are in food and beverages production, followed by clothing and apparel,
construction materials, household goods, printing and publishing, industrial raw
materials, and agricultural equipment.
At present the Myanmar Industrial Development Committee (MIDC) has set up
policy guidelines for the development of SMEs and the entire industrial structure, based
on following framework:
(a) Development of Industries with agriculture as the base;
(b) Enhancement of quantity and equality of industrial products;
(c) Increased production of new types of machinery and equipment;
(e) Production of machinery and equipment for industrial use; and,
(f) Creation of suitable conditions for a shift to an industrialized state.
Existing institutions involved in the development of SMEs are shown in Appendix
2. Below is the list of organizations that are mainly responsible for SME development in
Myanmar.
(a) Small-scale Industries Development Sub Committee (Myanmar
Industrial Development Committee)
(b) Directorate of Industrial Supervision and Inspection (Ministry of
Industry 1)
(c) Directorate of Myanmar Industrial Planning (Ministry of Industry 2)

471
(d) Myanmar Industries Association (Union of Myanmar Federation of
Chamber of Commerce & Industry)
(e) Small and Medium Enterprise Committee (Myanmar Engineering
Society)
Human resource development programmes for the development of SMEs are
undertaken by government ministries (including the Ministry of Science and
Technology, Ministry of Industry 1 and 2, Ministry of Cooperatives, and Ministry of
Education) and nongovernmental organizations (NGOs), including Union of Myanmar
Federation of Chambers of Commerce and Industry (UMFCCI), MES, etc. Among the
NGOs, the UMFCCI is mandated to:
1. Cooperate and coordinate with the state in economic and social activities;
2. Enhance the competitiveness of Myanmar SMEs; and
3. Lead Myanmar business community in integrating into international trade and
globalized economy.
Moreover, in order to promote SMEs, Myanmar also works with foreign agencies
such as United Nations Development Programme (UNDP), JETRO, and Myanmar-
Japan Association.
3.4 Initiatives for Sustainable Development
Myanmar is indeed very rich in forest resources. Forest covers about 50.81 percent of
the total land area. Various types of forest exist according to the nation’s climatic
zones—from temperate to arid and tropical.
To conserve the forest and the natural environment, the government gives priority
to efforts to protect the soil, biodiversity, plant/animal resources, scenic reserves, and

472
national heritage sites. Sustainable management of the forest is also practiced
simultaneously. It also employs the maintenance and rational use and enhancement of
the forest resource base, to ensure continuous ecological resilience and contribution to
socio-economic growth.
The government has reformulated and adopted the Forest Law in l992, Protection
of Wildlife and Wild Plants and Conservation of Natural Areas Law in 1994, Myanmar
Forest Policy in 1995 and Forest Rules in 1995. Moreover, the Department of Forest
issued the Community Forestry Instructions in 1995 to promote community
participation in forestry. In order to prevent desertification, a new institution, the Dry
Zone Greening Department, was set up in 1997. The institution implemented the
greening program for arid areas in Central Myanmar and Bago Yoma. Likewise, the
National Commission for Environmental Affairs was established.
The forest policy of Myanmar was formulated according to the forestry principles
adopted by the Union Nations Conference on Environment and Development.
Myanmar Forest Policy will be implemented through six main activities, which
comprise the following:
・ Forest protection and conservation and management;
・ Reforestation;
・ Community forestry for local communities;
・ Forest harvesting, processing, and marketing;
・ Research and development, education, and trainings; and,
・ Establishment and management of protected area system.
・ Moreover, major elements integrated in the Forest Policy include:
・ Food security;

473
・ Rural development and viability of rural areas; and
・ Environmental and social aspects.
As shown in Table 11, total forest area has increased about 4,000 square miles all
over the country from 1998 to 2003 due to the massive efforts towards sustainable
development.
Table 11: Distribution of Forest Covered Area by State and Division (in Square Miles)
Forest Area Year Total Land
Area Total Reserved Unclassified Forest Area
Other Land Area
1998-1999 261,228 132,650 44,859 87,791 128,578
1999-2000 261,228 132,650 48,612 84,036 128,578
2000-2001 261,228 132,650 49,979 82,671 128,578
2001-2002 261,228 13,2861 53,992 78,869 128,367
2002-2003 261,228 13,6582 54,756 84,980 124,646
Source: Ministry of National Planning and Economic Development (2006)
3.5 Energy Security in Myanmar
Myanmar is well known for its rich natural resources, including renewable and
nonrenewable resources (Table 12). Myanmar has a very high potential in the oil and
gas and hydro-energy sector—this sector is the most attractive sector for foreign
investment in Myanmar. Off-shore gas fields are operating under the production
sharing contracts with foreign investors. There is, therefore, a lot of potentials in the
establishment of downstream and related industries in this particular sector.

474
Table 12: Energy Resources in Myanmar in 2005
Sr. Subject Count 1988 2005 1 Oil Field (inland) Number 19 18 2 Oil Field (Offshore) Number - 3 3 Gas Pipeline Mile 250.91 1677.29 4 Crude oil production Barrel 6,165,641 6,395,488
5 Gas Production Cubic feet (in million) 41,913.97 371062.1
6 Refining Crude Oil Gallon 156.461 230.796
7
Hydrogen Power Plan Implementing Projects
a. Large Scale b. Medium Scale c. Small Scale
Implementing projects, large scale
Number
14
(2) (1) (11)
44
(10) (10) (24)
20
8
Other Power Plants i. Recycling Power Plant ii. Boiler Power Plant iii. Natural Gas Power
Plant iv. Coal Power Plant v. Diesel Power Plant
(National Grid)
Number
- 3 8 -
588
4 3 11 1
567
9 Present Capacity for Generator Megawatt 4,379.597 102.451 10 Future Capacity of Generator Megawatt 273.755 5,599.34511 Maximum Load Megawatt 363.678 996.761 12 Electricity Consumption Unit (in million) 1,517.570 5,461.089Source: Ministry of Information, Chronicle of National Development (2007)
Hydropower is vital to electrification program for rural hilly regions. The
untapped hydropower resources in Myanmar are estimated to have a total of 6421.4
MW and the present hydropower resources in Myanmar are estimated to be about 10
percent of the potential. Thus, Myanmar still has large renewable energy resources that
can be used for electricity generation.
In Myanmar, electricity is also generated by using natural gas and diesel. The
government also encourages the use of alternative sources of energy, such as solar and

475
wind power, which have practically unlimited supply. The electricity consumption in
Myanmar is still very low compared to other neighboring Asian countries, but the
demand for electricity has rapidly increased since the introduction of market-oriented
economic policy in 1988. The increasing manufacturing activities as well as the
changes in modern lifestyle in Myanmar will continue to push up the demand for
electricity. Therefore, the efficient use of energy and development of alternative sources
of energy are crucial in Myanmar today.
Energy security is a vital part of the foundation on which a country's economy is
built upon, especially for a country which has to depend on external supply of energy.
Energy security consideration entails three distinct aspects:
・ First is the need to maintain secure access to a strategically vital commodity. i.e. to
ensure against energy disruption in order to protect the economy from external
threat of interrupted supplies or infrastructure failure.
・ The second concerns the leverage that oil producers may employ.
・ The third stems from the power that oil wealth can bring to currently or potentially
hostile oil producers.
In Myanmar, the most widely and commercially used nonrenewable energy are
crude oil and natural gas. Exception for the limited joint ventures, oil and natural gas
companies are state-owned. Most of the oil is produced on shore in 17 geological
valleys; offshore production is undertaken in Rakhine, Gulf of Marta Ban, and
Tanintharyi Division. The development of Myanmar's energy sector is presented in
Table 13.
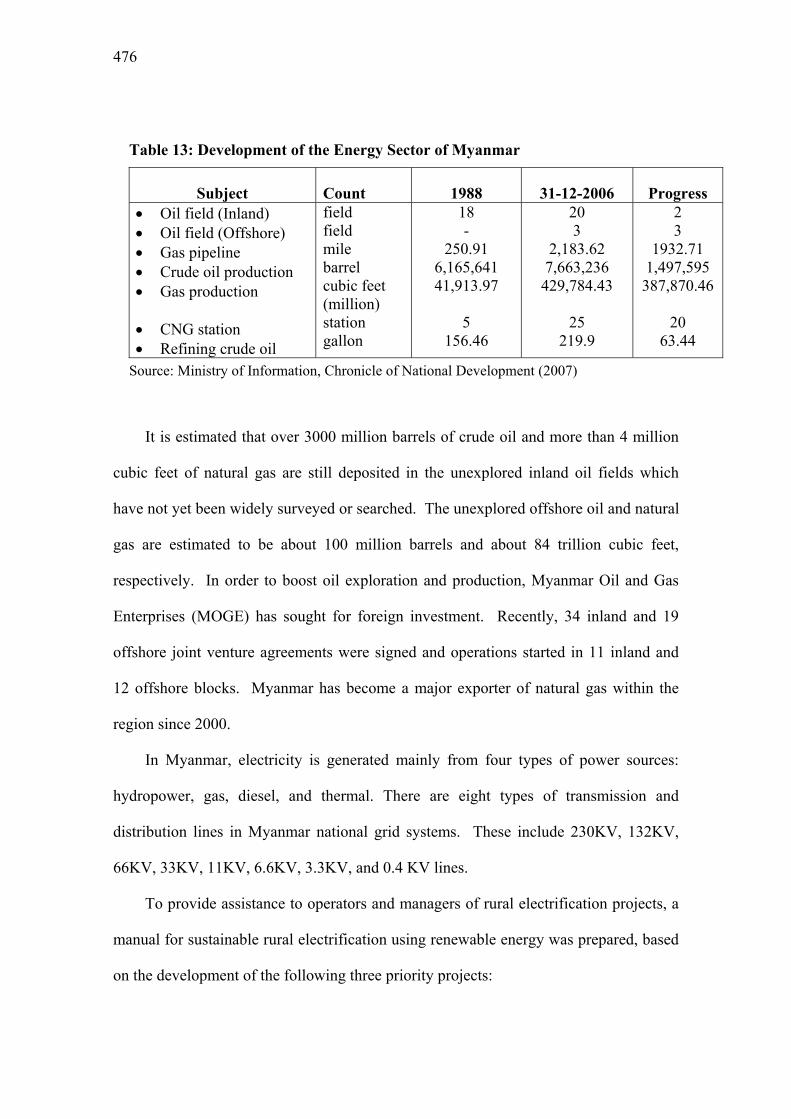
476
Table 13: Development of the Energy Sector of Myanmar
Subject Count 1988 31-12-2006 Progress • Oil field (Inland) • Oil field (Offshore) • Gas pipeline • Crude oil production • Gas production • CNG station • Refining crude oil
field field mile barrel cubic feet (million) station gallon
18 -
250.91 6,165,641 41,913.97
5
156.46
20 3
2,183.62 7,663,236 429,784.43
25
219.9
2 3
1932.71 1,497,595 387,870.46
20
63.44
Source: Ministry of Information, Chronicle of National Development (2007)
It is estimated that over 3000 million barrels of crude oil and more than 4 million
cubic feet of natural gas are still deposited in the unexplored inland oil fields which
have not yet been widely surveyed or searched. The unexplored offshore oil and natural
gas are estimated to be about 100 million barrels and about 84 trillion cubic feet,
respectively. In order to boost oil exploration and production, Myanmar Oil and Gas
Enterprises (MOGE) has sought for foreign investment. Recently, 34 inland and 19
offshore joint venture agreements were signed and operations started in 11 inland and
12 offshore blocks. Myanmar has become a major exporter of natural gas within the
region since 2000.
In Myanmar, electricity is generated mainly from four types of power sources:
hydropower, gas, diesel, and thermal. There are eight types of transmission and
distribution lines in Myanmar national grid systems. These include 230KV, 132KV,
66KV, 33KV, 11KV, 6.6KV, 3.3KV, and 0.4 KV lines.
To provide assistance to operators and managers of rural electrification projects, a
manual for sustainable rural electrification using renewable energy was prepared, based
on the development of the following three priority projects:

477
1. Small Hydro Electrification Plan in Heho of Nyaung Shwe Township
2. Mini Hydro Electrification Plan in Nan Lan Township
3. Lighting by rice husk gas engines in Sama Lauk village.
Economic growth target of the country requires a substantial expansion of the
national power supply. Much emphasis is given to the development of the electric
power sector because of its vital importance to the nation's social and economic
developments. However, commercialization and privatization of the electric power
sector still requires fulfilling the power demand of the country.
Myanmar has an abundance of hydropower potential of more than 100,000 MW
and huge reserves of offshore natural gas. Development of hydropower involves big
capital and longer lead time for commercial production. In order to meet future demand,
hydropower has to be developed on long-term basis and gas turbine will have to be built
to fulfill the current power demand. The abundance of hydropower enables Myanmar to
consider development of hydropower projects not only for domestic power supply but
also for export to the neighboring countries.
4. INITIATIVES FOR BRIDGING THE DEVELOPMENT DIVIDE TOWARDS ASEAN ECONOMIC COMMUNITY (AEC)
4.1 Initiatives for Economic Integration
Since early 1990s, the trend of the global economy has been shifting towards a more
collaborative nature. Economic integration among nations is significant on regional and
global scale, and most economies benefit from this process of integration.
To intensify economic integration, ASEAN countries, both the founding countries
and the newer member-countries, have drawn up road maps for deeper integration,

478
covering a broad range of issues such as elimination of tariffs and nontariff measures
(NTMs), harmonization of customs procedures, standards and conformance, protecting
intellectual property rights, as well as promoting logistic services, free flow of
investments, movement of business persons, skilled labors and professionals, human
resources development, and research and development.
Moreover, ASEAN has envisioned the ASEAN Economic Community (AEC) to
be enjoying a free flow of goods, services, investments, and capital and skilled labor by
2015. The members of the ASEAN have a commitment to achieve these visions at
national level.
Another development which contributed to the impetus for East Asian economic
cooperation was the emergence of China as a powerful economic force, both in the
regional and global scenes. To support the region's economic development, the ASEAN
Free Trade Area (AFTA) was extended to the East Asia Free Trade Area (EAFTA),
which consists of 10 ASEAN countries, China, Korea, Japan, India, Australia, and New
Zealand. The realization of greater East Asian integration offers many opportunities as
well as poses many challenges for countries in the ASEAN. The larger market resulting
from greater trade integration will create greater demand for products, goods, services,
and tourism.
Other initiatives, such as the Initiative for ASEAN Integration (IAI), Greater
Mekong Sub-Region (GMS), Ayeyawady-Chao Pharya-Mekong Economic Cooperation
Strategy (ACMECS), and BIMSTECS Initiatives, as well as the effort to provide
financial and technical resources to assist CLMV, are being implemented. ASEAN+3
countries are also contributing resources to these projects as well as providing bilateral
assistance schemes to CLMV.

479
Since 1988, the government of Myanmar has shifted towards outward-looking
development strategy. Accordingly, Myanmar is actively cooperating with Asian and
international economies. Myanmar's perspectives on economic integration can be
viewed through the development policies in Myanmar, initiatives for promoting trade,
the role of FDI in Myanmar's economy, industrial strategies, and promulgation of laws
related to the economy.
4.2 Initiatives for Domestic Infrastructure Development
Indeed, geographical and communication factors play a significant role in the
development of physical and economic relations between regions. Since the adoption of
an open economy in 1990, Myanmar has realized the importance of infrastructure and
made considerable progress in developing transportation, communications, and energy
infrastructure to bring about a balanced and proportionate growth between regions and
achieve solidarity of its citizens. Thus, infrastructure development has been carried out
to achieve this goal.
However, the rural and border areas were underdeveloped due to insurgency and
instability in frontier areas before 1988. After several negotiations and the state's efforts
for regional development, a total of 17 armed groups joined the state for national
integration. Since then, the state has fostered regional development projects in frontier
areas. These remarkable achievements extended several national projects, including the
Border Areas and National Races Development Project, Rural Development Projects,
and Development of Special Zones, which are being implemented with the collaboration
of government agencies, NGOs, and INGOs. Investments in major infrastructure
development as percentage of total public investment are shown in Table 14.

480
Table 14: Public Investment in Major Infrastructure Development in Myanmar (% of Total Public Investment)
Public Investment by Sector (%)
Infrastructure Year
Production Service Transport and
Communications Power Subtotal
Total
1952/1953-1955/1956 34.2 35.1 20.6 10.1 30.7 100
1955/56-1959/1960 22.3 36.4 25.7 15.6 41.3 100
1962-1963 35.9 36.4 23.5 4.2 27.7 100
1974-1977 58.7 17.7 17.4 6.2 23.6 100
1978-1981 72.0 10.3 12.4 5.3 17.7 100
1987-1988 53.5 16.1 17.8 12.6 30.4 100
1990-1991 24.8 47.4 12.3 8.0 20.3 100
1999-2000 41.8 36.6 15.0 6.6 21.6 100
Source: Ministry of National Planning and Economic Development (2006)
Since 1988, the government has given emphasis to the expansion of highway
network to narrow the gap between regions. Highways, such as the Union Highways
and National Highways, have been constructed and upgraded. Construction of bridges
across the major rivers Ayeyarwaddy, Chindwin, and Thanlwin are also being
implemented under the Special Projects Implementation tasks (Table 15). New roads
constructed across the nation during the period 1988-2005 reached a total distance of
22,451 miles. The upgrade of road network in urban and rural areas is shown in Table
16.

481
Table 15: Number of Bridges (1988-2006)
State/Division Number of Bridges Constructed in 1988
Number of Bridges Constructed in 2006
Kachin State Kayah State Kayin State Chin State Sagaing Divisions Taninthayi Division Bago Division Magway Division Mandalay Division Mon State Rakhine State Yangon Division Shan State (East, South, North) Ayeyawady Division
27 6 8 2 17 8 36 20 18 3 11 7 24 11
45 8 13 5 33 15 55 38 32 7 48 38 41 59
Total 198 437 Source: Ministry of Information, Chronicle of National Development Comparison between
Period Preceding 1988 and after (2007)
Table 16: Upgrading the Road Networks (1988-2005)
Kind of Road Road Distance, 1988-89 (mile)
Road Distance, 2004-05 (mile)
Rural Tarred road Graveled road Granite road Earthen road
280 682 673 2,092
1182 3957 1,689 17,070
Total 3,729 23,900 Urban
Tarred road Graveled road Granite road Earthen road
940 724 190 1,060
1890 997 318 2,088
Total 2,915 5,295 Source: Ministry of Information, Chronicle of National Development Comparison between
Period Preceding 1988 and after (2007)

482
The government is also expanding railroad routes. The number of railroad routes
increased from 2,793.86 miles to 3952.9 miles (Table 17). With the participation of the
private sector, the number of aircraft has increased from 10 in 1988 to 18 in 2005. The
number of airports has been also increased to 38 from 21 during the same period (Table
18). The progress in development of telecommunication sector is illustrated in Table 19.
These progresses in the infrastructure sector can be considered as part of the border
area development to narrow down the gap between regions and to build more
confidence and understanding among the population.
Table 17: Progress in the Rail Transportation Sector Subject 1988 2005
1. Railroad section (a) Railroad (mile) (b) Station (c) Bridge (large/small)
2,793.86 487 5,650
3,952.90 780 9,219
2. Engines and coaches (a) Steam engine (b) Diesel engine (c) Local train
39 150 26
39 292 N/A
3. Passengers and goods (in mil.) (a) Passenger (b) Passenger per mile (c) Goods (d) Goods per mile
36.689 1,870.125 1.269 196.579
58.21 2,604.360 2.878 544.592
Source: Ministry of Information, Chronicle of National Development Comparison between
Period Preceding 1988 and after (2007)
Table 18: Aircraft and Airport (1998 -2005) No. Subject 1998 2005 1. Aircraft (Myanmar Airways) 10 13 2. Aircraft (Private) - 5 3. Airport 21 38
Source: Ministry of Information, Chronicle of National Development Comparison between
Period Preceding 1988 and after (2007)

483
Table 19: Developments in Telecommunication Sector (1988-2005)
1988 2005
1. Post and Telegraph (a) Post office (b) Telegraph office
1,428 1,115 310
1,814 1,331 483
2. Telephone (a) Auto phone exchange (b) Manual phone exchange (c) Phone line
33 212 67,016
163 676 447,097
3. Mobile phone (quantity) (a) Cellular phone system (b) Digital European Cordless Telecommunication system (c) CDMA system (d) GSM Mobile system
- 30.1.97 17.10.97 12.3.02
18,760 2572 12,041 58,442
Source: Ministry of Information, Chronicle of National Development Comparison between
Period Preceding 1988 and after (2007)
4.3 Initiatives in Line with Regional Infrastructure Development
In the context of Myanmar regional cooperation with neighbouring countries, the
government is implementing the Union Highways to facilitate linkages with the
ASEAN and international communities. These are the following:
・ ASIAN Highway
・ ASEAN Highway
・ Greater Mekong Sub-region (GMS) Highway
・ GMS East-West Economic Corridor Highway
・ GMS North-South Economic Corridor Highway
・ BINSTEC Highway
・ India-Myanmar-Thai Tripartite Highway

484
4.4 Related Issues
The challenges that the ASEAN came across with in the last decade have established the
proof that the state and destinies of the Southeast Asian countries are interwoven with
another and have shown how the way towards the AEC. They are in fact regional
challenges that are transnational in scope.
These call for forging a stronger sense of unity in ASEAN and more engagement
and cooperation for regional solidarity and cooperation. That is why the reaffirmation
and acceleration of regional economic integration is seriously taken into account. Here
economic integration means more than removing obstacles to trade—it means bringing
economies closer together through infrastructure linkages at the highest level. To build
the ASEAN Economic Community, ASEAN economic integration is vital.
Undoubtedly, Myanmar has shown its full participation in the regional integration
process of ASEAN. The key measures undertaken include the following:
・ Signing of Protocol for the Accession of the Union of Myanmar (1997);
・ Signing of the Agreement on the Common Effective Prudential Tariff Scheme
(CEPT) for ASEAN Free Trade Area (1997);
・ Signing the ASEAN Agreement on Customs by ASEAN Finance Ministers (1997);
・ Signing the ASEAN Framework Agreement on Services (AFAS) (1997);
・ Adoption of Harmonized Commodities Description and Coding System (1997); and,
・ Adoption of implementation strategies for the realization of ASEAN Investment
Area in 2010.
The role of services in the ASEAN also has to be taken into account in the
economic development in this region. The commitments of each sector under the
ASEAN Framework Agreement in Services (see Appendix 3) have to given national

485
treatment and expanded services liberalization beyond the scope of the GATS. To
facilitate such commitments, Myanmar has to speed up its cooperation and efficiency
efforts through the improvement of market access, as well as the diversification and
facilitation of services suppliers, both within and outside the ASEAN region. Through
an updated and comprehensive understanding of the market access opportunities under
the said commitments, there are more concrete opportunities for Myanmar in service
trade and investment.
Here remarkable initiatives taken by the government can be seen through the
enhancement of the socio-economic life of rural folks and the fulfillment of the fuel
requirements in the country via the plantation of physic nut oil for the energy sector.
That is why cultivation of physic nut oil is given special priority; physic nut oil plays
essential role in the production of biodiesel used to power up agricultural machines,
generators, water pumps, and trailers. To obtain a comprehensive development for
Myanmar, programmes, such as the 24 Development Zones for the Economics and
Social Infrastructure and Rural Development based on five Rural Development
Principles, are actively generating and promoting socio-economic life.
The concept of development and its challenges are moving to new directions as
improving the quality of life and providing better education, higher standards in health
and nutrition to reduce poverty, and adopting a richer cultural life and globalization. By
overcoming the challenges, a new equilibrium may be sought between national
sovereignty and the regional purpose of Southeast Asian community, after a close
integration has been achieved. As ASEAN Vision 2020 is the signal that the ASEAN
gives for a new integrated approach to regional economic cooperation, the challenges,
prospects, and strategies for development should be a two-way linkage between peace

486
and development. At the same time, Myanmar has issued mandates to step up their
economic, social, and cultural development efforts for the welfare of the country and its
people. Hence, being fully prepared for further challenges, Myanmar’s participation in
AFTA and possibly AEC is expected to lead the development of Myanmar based on its
comparative advantage of abundant natural resources, its cheap but literate labor, and
other strategic advantages like its location, which is near China and India.
5. POLICY IMPLICATIONS FOR MYANMAR ECONOMY
The 19 years dedicated to making a turnabout from the 1988 experience that is
characterized by a lot of setbacks and poor performance of national economy for more
than four decades, highlighting the “Growth-first strategy” is a primary concerns of the
country. The Growth-first strategy calls for strong government with high mobilization
force. To have community peace and tranquility and prevalence of law and order, which
will lead to the stability of the state, the welfare of the community should be considered.
In terms of reforms for building a new state, political renewals should bring about
stability of the state, national reconsolidation, building a new nation in accord with the
new state constitution.
Relative to the experiences gained through its legacy, the national development in
the entire country can only be done if peace and tranquility are maintained. The
aspirations to build a sustainable, strong, and modern nation can only be realized if there
is national integration among the ethnic groups. National integration and sustainable
progress of national integration attained by the present government are remarkable
achievements. It has been envisaged that objectives, targets, and strategies elaborated
with state interests are overwhelmed by the major reforms that have made in 19 years.

487
The designation of 24 development regions being pushed for regional prosperity is
part of the improving parallel development in all regions. Throughout their length and
breadth of area, the basic infrastructure development measures, such as the construction
of roads, bridges, dams, and embankments, as well as facilitating requirements for
health, education, and communications, have been extended under multinational
projects. In fact, these developments can assure not only peace and stability but also
nation-building endeavors, in which all members of the entire union take active
participation. The legacy of the past gives many lessons and gives utmost importance to
national thrusts, including national development.
The border area development projects give priority to the development of the
regions where armed groups from national ethnic communities had returned to the legal
fold. In a broader view of regional development, the state aims to ensure balanced and
equitable growth in states and divisions, implement special projects in 24 special zones,
and establishment of five rural development tasks, in addition to the projects for border
areas and development of the ethnic groups. Moreover, the basic need for development
of 43 remaining regions is placed under special projects division.
The overview of production of the manufacturing sector during the productive
years and their structure form has led to sectoral development, fulfilling the
requirements of the urban and rural areas as well as the border regions. By
implementing the national tasks, the development of the manufacturing sector in fact
uplifts the socio-economic life of the people. The tables in this chapter mention the
overall picture of production and developments undertaken from 1988 to present.
Furthermore, the financial crisis in the region attributed to the initial financial
turmoil in some Asian countries in 1997 and the sudden shifts in market expectations

488
and confidence followed by regional contagion has provided many lessons to be learned.
It is suggested that the extent and depth of the crisis should not be attributed to the
deterioration in fundamentals but rather to the misrepresentations on domestic and
international investors.
Nevertheless, Myanmar has to put forward a more realistic approach to be able to
participate in the economic pole in the ASEAN region. Through its bilateral and
multilateral engagements with overseas countries, feasible objectives, regardless of
whether it is profitable or not, are necessary to promote economic relations with
ASEAN in line with the bilateral agreements. A lack of experience in integration before
1988 and the historical setbacks in that year call for rapid achievements at national level
and setting goals unhindered by economic gaps among its states and divisions. However,
Myanmar,having the location advantage—it is located between two giant economies—
can play an active role as a catalyst in achieving the economic pole in the region with
ASEAN + 3 in the near future.
Because of the heterogeneity of the developing world, it will be wise for Myanmar
to combine relevant concepts and theories from traditional economic analysis along
with new models and broader multidisciplinary approaches derived from studying the
historical and contemporary development experience of ASEAN, its immediate
neighbors, and of East Asia. Myanmar’s efforts to push the integration of regional
economies and other forms of regional cooperation should be placed on a stable ground
to earn investor confidence. The call of the hour in the global economy is transparency,
and reliable statistics are recommended for business enterprises and financial
institutions. To take stronger steps to hasten the AFTA process and draw investments
into the nation, some policies have to be put place: to accelerate financial reforms and

489
realign exchange rates which distort resource allocation; to promote the participation of
SMEs in production and distribution networks in the neighboring countries by
improving quality of products; to realize SEZs and FTZs (including industrial export
processing zones); to enhance FDI and foreign exchange; and to take advantage of
geographical location of the country between China and India by developing economic
corridors. In the ASEAN context, national resilience means a degree of economic vigor,
social cohesion, and cultural richness that help make a nation strong. That is why this
collective commitment by the respective leaders of ASEAN is strongly supported by
Myanmar as reinforcement for bringing about national prosperity.
REFERENCES ASEAN Secretariat: ASEAN Statistical Year Book: Various Issues, Jakarta: ASEAN
Secretariat. ----------(2004) “Trade”, Jakarta: ASEAN Secretariat, http://www.
aseansec.org/12021.htm [accessed 30 November 2007]. ---------- (2005) “ASEAN Annual Report 2004-2005, Chapter 2: Economic Integration
and Cooperation” Jakarta: ASEAN Secretariat, http://www.aseansec.org/ ar05.htm [accessed 6 November 2007].
Asian Development Bank: Asian Development Outlook, Various Issues, ADB, Manila. Central Statistical Organization (CSO) Statistical Year Book: Various Issues, Yangon &
Nay Pyi Daw: CSO. Hauff, M. (2007) Economic and Social Development in Burma/Myanmar: the
Relevance of Reforms, Metropolis-Verlag, Marburg. Hew, Denis et al. (2007) Brick by Brick: the Building of an ASEAN Economic
Community. ASEAN Secretariat, Jakarta:. Institute of Developing Economies - Japan External Trade Organization (IDE-JETRO),
(1999) “The Study on Trade and Investment Policies in Developing Countries, Myanmar”. IDE-JETRO, Tokyo, Japan..
Kan Zaw (1998) National Integration and Regional Development in Myanmar. VRF Series, IDE-JETRO, Tokyo, Japan.

490
---------- (2003) “Towards Promotion of the ASEAN-Japan Comprehensive Economic Partnership” in Towards ASEAN-Japan Comprehensive Economic Partnership, ed. Ippei Yamazawa & Daisuke Hiratsuka. Tokyo: IDE-JETRO.
---------- (2004) All Round Development in Myanmar, Seminar on Understanding Myanmar. Yangon: Myanmar Institute of Strategic and International Studies (MISIS).
Kudo, Toshihiro (2006) “Myanmar’s Economic Relations with China: Can China Support the Myanmar Economy?” Discussion Paper Series No. 66. Tokyo: IDE-JETRO.
---------- (2007) “Border Industry in Myanmar: Turning the Periphery into Centre of Growth.” Discussion Paper Series No.122. Tokyo: IDE-JETRO.
---------- (2007) “Trade, Foreign Investment and Myanmar’s Economic Development during the Transition to an Open Economy.” Discussion Paper Series No. 116. Tokyo: IDE-JETRO.
Lloyd, P. and P. Smith (2004) “Global Economic Challenges to ASEAN Integration and Competitiveness: A Prospective Look”, Project Paper, REPSF Project 03/006a. ASEAN-Australia Development Cooperation Program.
Ministry of Information (2007) Chronicle of National Development, Comparison between Period Preceding 1988 and After (Up to 31.12.2006), Yangon: Ministry of Information.
Ministry of National Planning and Economic Development (2006) Review of the Financial, Economic and Social Conditions for 2005/2006, Yangon: Ministry of National Planning and Economic Development.
---------- (2005) Myanmar’s Socio-economic Development (Up to end of March 2006/2007), Yangon: Ministry of National Planning and Economic Development.
Mya Than (2005) Myanmar in ASEAN: Regional Cooperation. Singapore: ISEAS. Mya Than and L. G. Carolyn (2001) ASEAN enlargement: Impacts and Implications.
Singapore: ISEAS. Myat Thein (2004) Economic Development of Myanmar. Singapore: ISEAS. Okamoto, I. (2004) “Agricultural Marketing Reform and Rural Economy in Myanmar,
the Successful Side of the Reform.” Tokyo: IDE-JETRO. Tan, G. (2003) ASEAN Economic Development and Co-operation, Singapore: Times
Academic Press. World Bank (2003) “Trade Bloc.” Washington, D.C.: World Bank. http://www.
worldbank.org/research/trade/ trade-blocs-abs.htm [accessed 15 Oct 2007]

491
MAPS Map 1: Industrial Zones of Myanmar
1. Mandalay
2. Myingyan
3. Meikhtila
4. East Yangon
5. West Yangon
6. North Yangon
7. South Yangon
8. Myaungmya
9. Hinthada
10. Pathein
11. Monywa
12. Kale
13. Pyay
14. Yenanchaung
15. Pakokku
16. Mawlamyaing
17. Taunggyi
18. Myeik
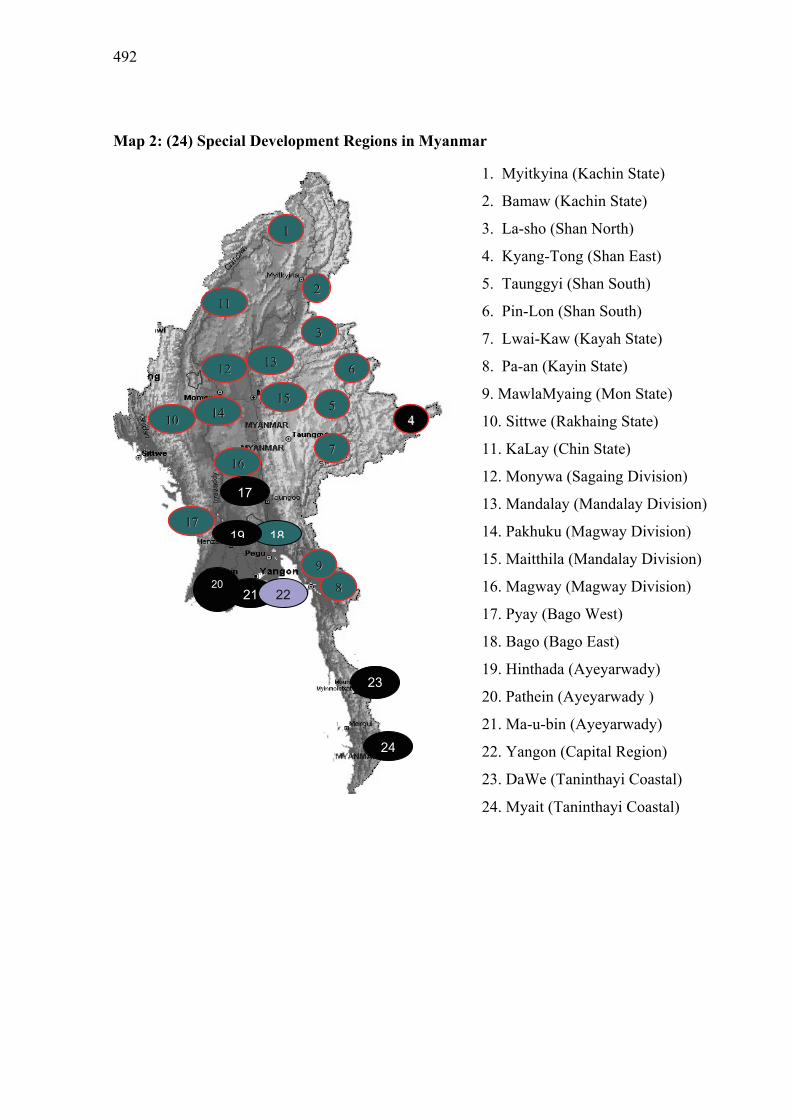
492
Map 2: (24) Special Development Regions in Myanmar
11
22
33
4455
66
77
88
1100
1122 1133
1144 1155
1166
1177
99
1111
17
1819
20 21 22
23
24
1. Myitkyina (Kachin State)
2. Bamaw (Kachin State)
3. La-sho (Shan North)
4. Kyang-Tong (Shan East)
5. Taunggyi (Shan South)
6. Pin-Lon (Shan South)
7. Lwai-Kaw (Kayah State)
8. Pa-an (Kayin State)
9. MawlaMyaing (Mon State)
10. Sittwe (Rakhaing State)
11. KaLay (Chin State)
12. Monywa (Sagaing Division)
13. Mandalay (Mandalay Division)
14. Pakhuku (Magway Division)
15. Maitthila (Mandalay Division)
16. Magway (Magway Division)
17. Pyay (Bago West)
18. Bago (Bago East)
19. Hinthada (Ayeyarwady)
20. Pathein (Ayeyarwady )
21. Ma-u-bin (Ayeyarwady)
22. Yangon (Capital Region)
23. DaWe (Taninthayi Coastal)
24. Myait (Taninthayi Coastal)

493
APPENDICES Appendix 1: Chronology of Major Economic Reforms in Myanmar, 1987-2000 1987 ● Participation of private and cooperative sectors in foreign trade ● Relaxation of government monopoly on the domestic marketing of paddy
and some important crops 1988 ● Removal of restrictions on private-sector participation in domestic and
foreign trade ● Introduction of liberal Foreign Investment Law ● Restitution of small-and medium-size establishments 1989 ● Decontrol of prices ● Official revocation of the 1965 law of establishment of socialist economic
system ● Regularization of border trade ● Introduction of SEE law allowing private sector participation in economic
activities ● Relaxation of restrictions on private investment ● Introduction of the Central Bank of Myanmar Law 1990 ● Introduction of Myanmar Tourism Law ● Introduction of 100-percent retention of Export Earnings Law ● Introduction of Financial Institutions of Myanmar Law ● Introduction of Myanmar Agricultural and Rural Development Law ● Promulgation of the Commercial Tax Law 1991 ● Announcement of the Central Bank of Myanmar’s Rules and Regulations ● Reestablishment of Myanmar Chamber of Commerce and Industry 1992 ● Announcement to lease inefficient state-owned factories ● Announcement of denationalization of nationalized saw mills ● Announcement of the sale of government palm oil firms ● Announcement of the establishment of four private banks 1993 ● Introduction of foreign exchange certificates (FECs) ● Announcement of the establishment of four more private banks ● Issuance of Treasury bonds with five- and seven-year maturity 1994 ● Introduction of the Myanmar Citizens Investment Law ● Announcement of the establishment of three more private banks ● Announcement of licensing of representative offices of 11 foreign banks 1995 ● Announcement of the privatization of 51 establishments ● Announcement of the formation of Privatization Committee ● Permission to establish joint-venture banks between local private banks and
foreign banks

494
● Opening of the foreign exchange center for free exchange of foreign exchange certificates
1996 ● Permission granted to local banks to conduct foreign banking business and to pay interest on foreign currency deposits; basic reforms were introduced in 1989, many of which were delayed because of the political situation. Some significant reforms are highlighted in the following subsections.
● Contract signed between Japan's Daiwa Group and Myanmar Economic Bank to establish a stock exchange company
● Introduction of law on development of computer knowledge 1997 ● Procurement of paddy through a tender bid system in November 1997, but
the plan did not materialize and the requirement to sell paddy to the state has remained as usual
● Joined ASEAN/AFTA 1998 ● Leasing of fallow and virgin land for cultivation or livestock breeding by
private farmers including foreign investors 2000 ● Across-the-board increase of public sector wages and salaries by five to six
times to align these with private sector remunerations 2006 Second across-the-board increase of public sector wages and salaries by five
to 10 times to align these with private sector remunerations

495
Appendix 2: Existing Institutions Working on the Development of SMEs
Government Private Sector 1. Myanmar Industrial Development Committee 2. Myanma Industrial Development Working
Committee and Sub-committee 3. Industrial Zone Supervision Committee 4. Ministry of Industry No.(1) - Directorate of Industries - Industrial Supervision and Inspection Department 5. Ministry of Industry No.(2) - Directorate of Industries - Industrial Supervision and Inspection Department 6. Ministry of Science ad Technology -Myanma Science and Technological Research Department -Technological Transfer and Coordination Department -Atomic Energy Department -Higher Technological Education Dept. 7. Cottage Industries Department, Ministry
of Cooperative 8. Ministry of Education - Human Resource
Development Centers Arts and Sciences Academy Sciences and Technology Academy
1. Unions of Myanmar Federation of Commerce and Industry
2. States and Divisions Chamber of Commerce and Industry
3. Myanmar Rice Millers Association 4. Myanmar Forest Product and Timber
Merchants Association 5. Myanmar Fisheries Federation 6. Myanmar Industries 7. Myanmar Printers and Publishers
Associations 8. Myanmar Women Entrepreneurs
Association 9. Myanmar Garment Manufacturers
Association 10. Myanmar Computer Industry 11. Myanmar Pharmaceutical and
Medical Equipment Entrepreneurs Association
12. Myanmar Construction Entrepreneurs Association
13. Myanmar Engineers Society 14. Myanmar Computer Science
Association
Source: Union of Myanmar Federation of Chambers of Commerce and Industry (2006)

496
Appendix 3: Sector Commitments under the ASEAN Framework Agreement in
Services
Air transport
Business services
Construction
Financial services
Maritime transport
Telecommunications
Tourism
Sales and marketing of air transport services, computer
reservation, aircraft repair, maintenance, etc.
Information technology, accounting, auditing, legal,
engineering, architecture, market research, etc.
Construction of commercial buildings, civil engineering, and
installation works, etc.
Banking, insurance, securities and broking, financial advisory,
consumer finance, etc.
International passenger and freight services, storage and
warehousing
Public telephones services, mobile phone services, business
network services, data and message transmission, etc.
Hotel and lodging services, tour operators, travel agencies,
etc.
Source: ASEAN (2005)

497
Chapter 13
CHALLENGES, POROSPECTS AND STRATEGIES FOR CLMV DEVELOPMENT: THE CASE OF VIETNAM Vo Tri Thanh
ABSTRACT Since 1986, Vietnam has made numerous efforts to reform its economy, while proactive international economic integration is among the key complementary orientations. Vietnam has then achieved significant socioeconomic improvements since 1990, with sustained GDP and export growth, stabilized macroeconomic environment, rapid poverty reduction, and mobilization of large FDI inflows. Nevertheless, Vietnam is still facing many challenges, such as low competitiveness, limited quality of growth, low level of industrialization, and risks of macroeconomic and social instability. To realize its development objectives, Vietnam needs further reforms in some key dimensions, such as institutional reforms, improvement of macroeconomic policies, development of production factor markets, SOE reform and private sector development, adopting an appropriate integration roadmap, and confrontation of social costs.
1. INTRODUCTION
Despite enormous attempts for economic development throughout the South East
Asian region, there remains a large gap between Cambodia, Lao PDR, Myanmar, and
Vietnam (CLMV), and other ASEAN members. To realize the ambitious goal of
having an ASEAN Economic Community (AEC) by 2015, it is essential to reduce
this development gap, which in turn necessitates further reforms in the CLMV
countries.

498
Vietnam has good conditions to progress in reforming itself. The process of
economic reform initiated since 1986, with an important view to proactively engage
in international economic integration, has brought about important socioeconomic
achievements, and laid more concrete foundations for future economic development
in the country. Yet, the country still faces many challenges in further reforming itself,
which makes realizing its development goals a difficult task.
This paper attempts to shed light on the challenges to and prospects for
development in Vietnam and aims to contribute to a broader strategy for enhancing
development in the CLMV countries as a whole. To facilitate a better understanding
of Vietnam’s current stage of economic reform, the next section will briefly review
the reform measures in the country since 1980s, with important reference to the
process of international economic integration. In this light, the section following it
will elaborate further by summarizing the main economic achievements, as well as
remaining issues. Then, the penultimate section will discuss the major development
goals and challenges for Vietnam in the coming years, particularly as the country is
committed to further reforms and development. The final section will identify some
key aspects for further reforms in Vietnam.
2. PROCESS OF REFORM AND INTERNATIONAL ECONOMIC INTEGRATION
Since its reunification in 1975, Vietnam has adopted bold measures to enhance
economic rehabilitation and development. However, prior to 1980, the country
remained under the centrally planned economic regime. Besides, the economy had
been relatively autarkic, with only trade with the former socialist block.

499
Facing sluggish growth, Vietnam moved on to undertake reforms of its
economy. Some microeconomic reforms were implemented, such as the contract
system in rural areas, and the “three plans” for state-owned enterprises (SOEs) in
1981. These microreforms enhanced voluntary and decentralized interactions
between individual agents and created new incentives for producers in raising
outputs during the period 1982-85. As a result, Vietnam enjoyed a rather high rate of
economic growth in the first half of the 1980s. However, there was not any
significant change in macroeconomic management. Inflation became a serious
problem and the failure of the so-called “price-salary-money reform” initiated in
1985 led the economy into crisis with hyperinflation.
In the aftermath of severe crisis and weaknesses in the outdated centrally
planned economic regime, Vietnam started its Doi Moi (Renovation) process in 1986.
The process has witnessed major changes in Vietnam’s ideology of economic
management and development. For the first time, developing an economy of
multicomponents was recognized as a vital need. Meanwhile, SOEs were given
greater autonomy in making decisions on several aspects of business and production
process.
Nevertheless, market-oriented reform package was for the first time
implemented in 1989. Since then, the country has also pursued proactive trade
liberalization and integration with the regional and world economy. Vietnam has
been a signatory in an increasing number of bilateral and regional trade agreements,
such as that with the EU in 1992, with the ASEAN in 1995, and with APEC in 1998,
to name a few. The sector with foreign direct investment (FDI) has step-by-step
become an integral part of Vietnam’s economy. Moreover, to effectively reap the

500
benefits from trade liberalization and integration, Vietnam had to accelerate its
domestic reforms, including structural and legal reforms.
In the years 1996-99, however, the process of economic reforms in Vietnam
slowed down. This period also witnessed the economic crisis in a number of Asian
countries, most of which are important partners of Vietnam. As a result, Vietnam
focused more on demand-stimulus policy, and opted to delay its economic reforms
until a better outlook was justified.
The period 2000-07 marked significant efforts of Vietnam to reform and to
accelerate international economic integration. Specifically, the country has made
further commitments to reforms, both explicitly under international agreements
and/or arrangements, and implicitly as a complementarity to fulfill other obligations.
Those commitments have been, nonetheless, implemented unevenly. For instance,
the SOE reform in Vietnam progressed rapidly in the cases of small and medium
enterprises (SMEs), yet was rather impeded when the country moved on to renovate
large corporations. International economic integration also saw a major change, as
the country more actively participated in bilateral and multilateral negotiation of
economic agreements. The Vietnam-US bilateral trade agreement (VN-US BTA),
signed in 2000 and in effect since late 2001, was the most comprehensive trade
agreement ever to which Vietnam has been a signatory. The country undertook
deeper commitments within the ASEAN Free Trade Area (AFTA) framework, and
started to adopt full AFTA commitments in 2006. Vietnam became an official
member of the World Trade Organization (WTO) in late 2006, with commitments to
be implemented beginning January 2007. Vietnam also participated in other
multilateral agreement such as the ASEAN-China Free Trade Area (ACFTA),

501
ASEAN-Korea Free Trade Area (AKFTA), and others. Finally, it should be
mentioned that the Party Congress X in 2006 and the new Government in 2007 have
pledged commitments to further reform the national economy, with bold measures to
curb corruption and accelerate administrative and SOE reforms, among others. The
new Government is then expected to bring about a new wave of reforms, with more
fruitful achievements, given higher public confidence.
3. ACHIEVEMENTS AND ISSUES
The reforms that Vietnam had been undertaking, particularly since the start of Doi
Moi in 1986, has laid important and concrete foundations for economic growth and
development in Vietnam. This can be reflected by the impressive performance that
Vietnam has achieved in almost all aspects, from growth to structural changes and
poverty reduction. The achievements have been more evident since 1990.
First, Vietnam in general has successfully retained stability of the overall
macroeconomic environment. Inflation has generally been under control since 1990,
except for some years when it was under high pressure. Meanwhile, fiscal deficit and
external debt have also been under control.
Second, the economic growth has accelerated, from 7.2 percent per annum on
average in the 1990s to about 7.5 percent per annum on average in 2001-05, with the
peak of 8.4 percent in 2005. Growth then slowed down a bit, to just over 8.2 percent
in 2006, before rising up high to an estimated level of 8.5 percent in 2007.
Third, economic growth in Vietnam has been accompanied by positive
structural changes toward industrial production and services. As can be seen in Table

502
1, the share of agricultural production in GDP has been on the decline, from over 40
percent in 1991 to just under 25 percent in 2000, and slightly under one-fifth in 2007.
This has largely been induced by the rise in relative importance of industrial
production, including manufacturing. In fact, industrial sector went up as percentages
of GDP from 23.8 percent in 1991 to 36.8 percent in 2000 and just over 42 percent in
2007. The shift toward service provision has been less apparent, as the share of this
sector only went up modestly, from under 36 percent in 1991 to 38.7 percent in 2000,
before decreasing slightly to just over 38 percent in 2007. The shifts in labor force
were more evident. Agriculture still accounts for the highest share of labor, albeit
declining from 73.3 percent in 1991 to under 55 percent in 2007. Services continued
to attract more labor than the industrial sector, yet both of them accounted for larger
shares of labor, of 25.7 percent and 19.6 percent, respectively, in 2007, compared
with their respective shares of 14.3 percent and 12.4 percent in 1991.
Table 1: Contribution to GDP and mobilization of labor by economic sector.
Agriculture Industry (manuf.) Services % GDP
1991 40.5 23.8 (13.1) 35.7 2000 24.5 36.8 (19.6) 38.7 2007 19.8 42.1 (21.6) 38.1
% Labor Force 1991 73.3 12.4 14.3 2000 65.1 13.1 21.8 2007 54.7 19.6 25.7
Source: General Statistics Office (GSO) (Figures for 2007 are estimated).

503
Fourth, impressive economic growth has been significantly attributed to
improvement in Vietnam’s export performance. In the period 1990-2000, export
growth of the country was dramatic, attaining 24 percent per annum on average.
Increase in export somewhat decelerated in 2001, reaching only 3.8 percent. Since
2002, growth started to recover, rising continuously from 11.2 percent in 2002 to
19.1 percent in 2003 and 33.2 percent in 2004. After that, export grew at a slower
pace, at 21.6 percent and 22.1 percent in 2005 and 2006, respectively, though the
pace has itself been impressive in absolute terms. In the first year after its WTO
accession, Vietnam successfully maintained high export growth, at an estimated level
of 20.5 percent, and export value surged dramatically to USD 48 billion in 2007.
Fifth, together with Vietnam’s view to develop the private sector and enhance
its contribution to the national economy, FDI has been playing an integral role in
Vietnam’s socioeconomic development. The foreign-invested sector is contributing
more and more to the national economy, as reflected by its share of 17.1 percent in
GDP and of 57.7 percent in export (or approximately 36 percent if excluding oil) in
2006. Also, FDI presents another source of funds, together with hypothetical positive
spillover effects, to support economic growth and poverty reduction in Vietnam. In
2006, FDI made up a share of 16.4 percent of total investment (Table 2).
Finally, the role of the domestic private sector has been continually enhanced
and consolidated. The sector makes a sharply declining contribution to agricultural
sector in terms of GDP, yet is accounting for an increasing export. Besides, the sector
also contributed up to 33 percent of total manufacturing output. In another aspect, the
private sector also became a major source of employment, absorbing as much as
about 90 percent of about 1.3 million new labor market entrants each year.

504
Table 2: FIEs’ contribution to VN economy. 1992 1996 2000 2004 2005 2006
FIEs contribution to GDP (%) 2.0 7.4 13.2 15.1 16.0 17.1
Share of FDI in total investment (%) 22.0 26.0 18.0 15.5 15.7 16.4
Export by FIEs, excl oil export (USD mil.) 112 920 3320 8601 11,144 14,620
- Share of FIEs' exports (%) 5.3 23.4 22.2 33.1 34.4 36.9
No of employees in FIEs (1,000 persons) n.a. 220 379 739 935 1,129
Source: Ministry of Planning and Investment (MPI).
The abovementioned economic achievements have enabled Vietnam to improve
the social aspects of life for its people. Poverty incidence has been dramatically
reduced, from 70 percent in the 1980s to 58 percent in 1993, 37 percent in 1998, 29
percent in 2002, and 14.7 percent in 2007. It should be mentioned that Vietnam has
adopted a new (higher) poverty line since 2005, which further makes the progress in
poverty reduction impressive. Human development, aggregating from improvements
in life expectancy, education, and GDP per capita, also progressed, at least in
absolute terms, though the improvements have been less impressive relative to other
neighboring countries. In this sense, Vietnam has to a certain extent improved the set
of choices available to its people, though further improvements are still required,
particularly in their capability to exploit the benefits from those choices as well as
newer ones.
Vietnam’s socioeconomic achievements since 1990 can be attributed to four key
factors. First, Vietnam officially acknowledges private ownership and rights of doing
business for the private sector, including individuals, which induces profit-oriented
economic activities on a market basis. Second, the country has pledged, and
effectively implemented its commitments to market-oriented reforms, including

505
liberalization of price regime, and structural reforms. Third, Vietnam has been
proactively undertaking the “open-door” policy and international economic
integration, via trade, investment, and other economic arrangements. These have
brought about significant resources to supplement growth in Vietnam as well as
exerted pressures for the country to carry out reforms. Fourth, the country has been
successful in ensuring a stable macroeconomic and social environment, together with
its growth process, which facilitates effectively economic activities and improvement
of social life of the people.
It should be stated, however, that Vietnam’s achievements are not outstanding,
however impressive they may seem. Many weaknesses are still reflected, even in
Vietnam’s aspects of strong performance. Despite rapid growth in exports, the
country lacks competitiveness. In terms of growth competitiveness index (GCI), the
country was ranked very low by the World Economic Forum, at only 53/59 in 2000,
60/75 in 2001, 65/80 in 2002, 60/102 in 2003, 77/104 in 2004, 81/117 in 2005, and
86/125 in 2006.
Besides, the quality of growth has been under constant review these days, due to
fears that the (inefficient) public investment is playing a too important role in driving
growth than it should be. Foreign investments have been increasing, particularly in
recent years, but the benefits from them, including the positive spillover effects via
technology transfer, competition pressures, and linkages that they may bring, were
not fully reaped. This is perhaps attributed to the lack of medium-sized enterprises.
In fact, most private firms in Vietnam are small in size, and this has seriously
hindered positive spillover effects of FDI. To add to the problem, disbursement of
FDI has been rather slow, and actual contribution of the source to capital stock in

506
Vietnam is much less convincing than what appear from figures on committed FDI.
Moreover, the regional income disparity seems to be increasing. Despite
nationwide reduction, poverty incidence persists at high level in the isolated and
ethnic regions. Another phenomenon is the “new poor” referring to migrants and
farmers who lost land in the process of industrialization and urbanization. Job
training and retraining in these cases turned out to be insufficiently effective, and
thus, new directions should be identified and pursued to deal with this group of poor
people. In addition, income gap—both between rural and urban areas and within
provinces—appears to have widened.
In another aspect, Vietnam is still at a low level of industrialization. Its
manufacturing sector (as percentage of GDP in 2006) is relatively smaller than other
East Asian countries in the 1980s and 1997/1998, while remaining comparable to
those of other developing countries in the 1980s and 1997/1998 (Table 3). This
observation is also reflected in the pattern of manufacturing industry by
technological level. Even in 2006, Vietnam has a very high share of low-tech
products in manufacturing output, roughly 73 percent, while high technology ones
only account for a modest proportion of about 7.3 percent, i.e., far smaller than those
of East Asian countries in 1980 and in 1997/98. The shares of manufacturing and hi-
tech exports of the country in 2006, while being higher than those of other
developing countries 10 years ago, remained significantly smaller than those of East
Asian countries in 1997/98 (Table 3).
More generally, Vietnam has followed similar pattern of the regional linkages
as other EA economies but only at the initial stage. As a result, firms in Vietnam are
still at very weak positions, with low value-added content, in the global/regional

507
Table 3: Level of industrialization of Vietnam (preliminary assessment).
East Asia Developing Cs VN
1980 97/98 1980 97/98 2006
1. Manufacturing (% GDP)
31 31 20 20 21.3
2. % of manufacturing industry by tech. level + Low technology + Medium technology + High technology
58 (73) 26 (20) 16 (7)
51 (69)29 (21)20 (10)
78 16 6
76 19 5
73.1 19.6 7.3
3. Man. exports (% of total) + hi-tech (% of total)
45 -
82 34
23 11
39 29
39 4.5
Notes: The data for East Asian countries are based on those of newly industrialized
economies and ASEAN-4 (excluding Singapore; in brackets).
Source: Cited from CIEM (2007).
value chains, regardless of whether the chains are producer-driven or buyer-driven.
Together with greater involvement in international arrangements, Vietnam is
facing greater macroeconomic and financial risks. After a long period of high growth,
inflationary pressures have seemed to pile up, and the country has recently
experienced rapid changes in consumer price index, by 9.5 percent in 2004, 8.4
percent in 2005, 6.7 percent in 2006, and 12.6 percent in 2007.
Meanwhile, what can be observed over the last two years is an expansion of the
banking system and a “boom” of stock market coupled with rather massive capital
inflows (Table 4 and Table 5). This appears to reflect some overexpectation of
people about how the economy and firms are performing. In addition, there has been

508
Table 4: Some key indicators of Vietnam’s stock market.
2001 2004 2005 2006 2007 Market capitalization (%GDP)
0.3 0.5 1.1 22.8 43.0
VN-index 235 (peak=571)
241 307 752 927 (peak=1170 in
March) HASTC-Index .. .. 91.3 243 324
(peak=460 in March)
Number of listed firms - HOSTC/HOSE - HASTC
10 10
26 26 ...
41 32 9
193 106 87
253 138 115
Investment funds 0 1 1 3 4 Securities companies 8 13 14 55 78 Investment management funds
.. ? 6 18 25
No of investors’ accounts - Institutional - Foreign
8,774 71 0
21,616 193 207
29,026 257 427
≈ 130,000 <500 1700
≈ 300,000 >500
>8000 Source: State Securities Commission (SSC) and other sources (end of the year).
Table 5: Vietnam’s Balance of Payments.
(% GDP; unless otherwise indicated) 1995 1996 … 2005 2006 2007
CA balance -12.6 -9.7 … -0.9 -0.3 -3.1 - Trade balance -15.0 -12.6 … -4.6 -4.6 -7.1 - Transfers (net) 3.0 4.8 … 6.4 6.6 7.4K-A balance 11.1 11.6 … 5.0 7.4 15.0 - FDI 10.8 7.3 … 2.7 2.9 2.9 -L&M loan (net) -1.2 0.4 … 2.6 1.9 2.1- ST capital (net) 1.5 0.9 …. -1.9 0.5 2.2Portfolio Inv … 1.6 2.2 7.9Off. reserves (US$ mill) 1,376 1,797 … 8,557 11,483 19,931External debt (% GDP) 122.63 106.48 … 32.2 30.2 30.8Debt services(%exports) …. 5.6 5.3 5.5
Source: Estimates based on data from IMF (various issues) (Figures for 2007 are projected)

509
a tendency for banks to be “universal”. The large corporations, mostly the SOEs, also
attempt to expand their investment to a wide range of activities. While economies of
scope remain to be seen, this raises a risk of further capital inefficiency, and if one
fails, the effect to the financial system and/or the overall economy may turn out to be
devastating.
Finally, there recently emerged signs of asset price “bubble” in Vietnam. The
surge of capital flows, in the form of indirect investment, has increased the demand
for the stock market, while there is a limitation on the proportion of shares held by
foreigners and equitization of SOEs has been slow. Besides, a large amount of
people’s money is now diverted to the real estate market, which has to date pushed
the price far beyond the intrinsic value. Together with a rather weak capacity to
undertake financial supervision, these problems have given rise to some fear of asset
price “bubbling”.
In all, Vietnam can take pride in what it has achieved so far. Given its low
starting point, with enormous difficulties resulting from the wars, the country has
strived to start and accelerate socioeconomic development. Notwithstanding
occasional failures, Vietnam has generally been on a right track of development.
Weaknesses still remain, however, in a number of aspects, and are becoming clearer
as the market economy in Vietnam is better shaped. Such weaknesses prevent any
assessment of socioeconomic achievements in the country from being too
outstanding, and necessitate further efforts to ensure its end.
510
4. DEVELOPMENT GOALS & MAJOR CHALLENGES
Given the quick pace that the world economy is changing, Vietnam has set some
basic development objectives for the years to come. These objectives are ambitious,
yet are by no means impossible for the country. Specifically, these objectives are to:
1. to sustain high economic growth;
2. to escape the status of a poor country by 2010 (there is a high possibility that the
objective will be realized in 2008);
3. to accelerate industrialization and modernization process so that by 2020, the
country has basically achieved the status of “a modern-oriented industrialized
country”; and
4. to materialize the slogan “Prosperous people, a forceful country, and an
equitable, democratic and civilized society”.
The objectives have reflected Vietnam’s strong determination in developing
itself, with significant attention to both economic and social aspects of people’s lives.
There exist, however, enormous challenges to Vietnam in achieving these
development goals. To begin with, the country is still in transition, with low income,
and needs to strive for industrialization. Besides, weaknesses and even vulnerabilities
persist in some critical areas, such as the SOEs, the financial system and efficiency
of public investment, and others. As discussed above, firms and enterprises in
Vietnam still lack competitiveness, and are mostly small or medium in size. More
and more private firms are established, yet very few of them can become focal or
leading ones in the field. Furthermore, the infrastructure is still underdeveloped.
Infrastructure services and utilities like transportation and electricity remain too

511
expensive and/or inefficient, resulting in high costs of doing business in Vietnam.
Growth performance in the past year has been impressive, but to go further, Vietnam
also needs better human and institutional capacity. Yet, it seems that the capacity is
inadequate, which is highly attributed to the problems of public governance, and the
quality of the education and training system. Finally, macroeconomic and social
instability are still a threat, and have become more evident as a likelihood together
with the country’s deeper involvement in the regional and the world economy.
Managing capital flows, avoiding wider poverty and income inequality, and reducing
social risks and adjustment costs of trade liberalization and international integration
are all but challenges that Vietnam needs to resolve on its way to sounder and more
sustainable development.
5. KEY DIMENSIONS FOR FURTHER REFORM
With its limited resources, Vietnam is unable to deal with all issues, challenges, and
weaknesses at the same time. It is advisable, thus, that the country identifies key
dimensions to undertake further reforms. Many of them can easily be put in place,
and have already been well-documented, yet only some are broad and urgent1.
First, Vietnam needs decisive institutional reform to change the (still) state-led
economic institutions into efficiency-enhancing institutions, with wider participation
of its people. The legal framework should be improved to be better consistent with
market-based economy and the country’s commitments in international arrangements.
1 Some major parts in this section are taken from Bui and Vo (2007), Vo (2005), Vo and Nguyen
(2006), and Vo et al. (2007).
512
Meanwhile, establishing an efficient and effective administrative and enforcement
system should be given no less importance.
Second, Vietnam still needs enormous works to improve its macroeconomic
policies, both in terms of formulation and enforcement. Regarding monetary policy,
the State Bank of Vietnam should be renovated, to be a more modern and relatively
independent central bank, while the money market should be developed with more
monetary instruments available to both the central bank and market participants.
Changes to fiscal policy are also necessary, on both revenue (income, asset taxes)
and expenditure (public salary system, public bond-based investment) sides of the
State Budget. More importantly, the need for an effective coordination between
monetary and fiscal policy should be carefully addressed, to better facilitate growth
and ensure macroeconomic stability.
Third, Vietnam should continue to develop markets for production factors,
particularly in terms of institutions. In the land market, better clarifications and
simplification of procedures are required with respect to ownership, registration, land
clearance, asset/wealth tax, and others. Meanwhile, the supervision system needs
improvement to better contribute to overall financial security, while development of
institutional investors and bond market, especially one for corporate bond, should be
given high priority as complementary measures to support capital market
development. In the labor market, improvements are necessary for improving
employer-employee relations, and for enhancing the role of labor unions, while the
regulations on minimum wage and social safety net should be undertaken in a more
systematic manner, with predictability.
Fourth, Vietnam should accelerate its SOE reform, development of private
513
sector (especially SMEs), and attraction of efficient FDI with high technology and
transfer of skills and knowledge. To begin with, the country should further reduce
any antiexport bias that the incentive structure has created. Besides, work remains to
be done to improve the overall business environment and to create a “level playing
field”, while reducing transaction costs for businesses. Instead of direct intervention
into the economy in an administrative manner, the Government should be redirected
to areas with high positive externalities to the rest of the economy, such as
infrastructure, information, education, and training. To arrive at higher efficiency of
the infrastructure projects, the participation of foreign and private firms in
transparent public- private partnership schemes should be induced. The
establishment of industrial zones with good master planning and appropriate support
by local authorities (e.g., in land-site clearance) is also essential for business
development.
Fifth, given its limited resource, Vietnam needs to identify and adopt an
appropriate integration roadmap, rather than merely follow the current proliferation
of free trade agreements. Having joined the WTO and other agreements, the country
should first implement its commitments effectively. In addition, as a member of the
ASEAN, Vietnam should continue to support and promote the ASEAN integration,
especially the materialization of the AEC, as well as the East Asian integration in
which the ASEAN plays a vital role. Vietnam can benefit substantially from
participation in the East Asian network in manufacturing and tourism. In another
direction, the country should work for appropriate cooperation with advanced
economic partners, i.e., those with strengths in investment, technology transfer, and
human resource development, among others. In this line, the forms of bilateral

514
cooperation can go beyond the economic and trade arrangements.
Sixth, Vietnam needs to find itself appropriately positioned in the game to reap
the benefits from a fast-growing China, as well as in the regional production network
in order to avoid the so-called “low-cost labor trap”. There have been a number of
opportunities for Vietnam to enter a “win-win” game with China. For instance, China
has a huge market, with fast growth in economic size and consumption.
Comprehensive cooperation commitments have also been enacted between Vietnam
and China, both directly under the cooperation between the two countries, and
indirectly under the framework of the ASEAN-China cooperation (including the
Early Harvest Program between China and ASEAN) or the Greater Mekong
Subregion (GMS) cooperation (“Two corridors and 1 belt”, “One axis, two wings”).
Foreign investors also have high expectation of Vietnam’s growth prospects and
many like to invest relying on the “China + 1” strategy.
Despite these, some concerns should be raised, particularly with the widening
trade deficits of Vietnam against China (of over USD 2.8 billion and nearly USD 4.4
billion in 2005 and 2006, respectively) and with the pattern of “North-South trade”
where Vietnam exports primary commodities to, and import manufacturing products
and consumer goods from China. Unless some improvement is made, Vietnam may
risk engaging in a low value-added part in the value chain, and accordingly enjoying
rather low benefits from the regional production network.
Seventh, Vietnam should confront social costs in a determined manner and build
up a social consensus. Encouragement of private sector development, particularly
those of SMEs, is apparently a need, and can be undertaken via a range of measures,
including facilitation of their access to formal finance. Besides, the country should

515
establish its own social safety nets, with views to ensure the (minimum) living
standard for the people and to ensure equity as it endeavors to get income tax from
its people. Also, effective utilization of family and kinship supports may prove to be
a good direction for Vietnam to pursue.
REFERENCES Bui Truong Giang and Vo Tri Thanh. 2007. Approach to Development Gaps in
ASEAN: A Vietnamese Perspective. ASEAN Economic Bulletin 24(1)April:_pp. 164-180.
Central Institute for Economic Management (CIEM). 2007. Vietnam Economy 2006. Hanoi: Finance Publishing House.
General Statistics Office of Vietnam (GSO). Statistical Yearbook (various issues). Hanoi: Statistics Publishing House.
International Monetary Fund (IMF). Country Report–Vietnam: Selective Issues (various issues). Washington, DC: IMF.
Vo Tri Thanh. 2005. Vietnam’s Trade Liberalization and International Economic Integration: Evolution, Problems and Challenges. ASEAN Economic Bulletin 22(1) April: pp. 75-91.
Vo Tri Thanh and Nguyen Anh Duong. 2006. Vietnam in the Regional Industrial Production Network. Annual Bulletin of the Institute for Industrial Research of Obirin University 24, March: pp. 149-175.
Vo Tri Thanh, Serey Chea, Sarat Ouk and Le Xuan Sang. 2007. How Have the CLV Economies Been Exposed to Financial Vulnerabilities? IDS Bulletin 38(4). July: pp. 96-112 .