exergy, economic, and environmental (3e) analysis …
TRANSCRIPT
Shamoushaki, M., et al.: Exergy, Economic, and Environmental (3E) Analysis of a Gas Turbine ... THERMAL SCIENCE: Year 2018, Vol. 22, No. 6A, pp. 2641-2651 2641
EXERGY, ECONOMIC, AND ENVIRONMENTAL (3E) ANALYSIS OF A GAS TURBINE POWER PLANT AND OPTIMIZATION
BY MOPSO ALGORITHM
by
Moein SHAMOUSHAKI a and Mehdi Ali EHYAEI b*
a Department of Mechanical Engineering, Science and Research Branch, Islamic Azad University, Tehran, Iran
b Department of Mechanical Engineering, Pardis Branch, Islamic Azad University, Pardis New City, Iran
Original scientific paper https://doi.org/10.2298/TSCI161011091S
In this paper, exergy, exergoeconomic, and exergoenvironmental analysis of a gas turbine cycle and its optimization has been carried out by MOPSO algorithm. Three objective functions, namely, total cost rate, exergy efficiency of cycle, and CO2 emission rate have been considered. The design variables considered are: compressor pressure ratio, combustion chamber inlet temperature, gas turbine in-let temperature, compressor, and gas turbine isentropic efficiency. The impact of change in gas turbine inlet temperature and compressor pressure ratio on CO2 emission rate as well as impact of changes in gas turbine inlet temperature on ex-ergy efficiency of the cycle has been investigated in different compressor pressure ratios. The results showed that with increase in compressor pressure ratio and gas turbine inlet temperature, CO2 emission rate decreases, that is this reduction is carried out with a steeper slope at lower pressure compressor ratio and gas turbine inlet temperature. The results showed that exergy efficiency of the cycle increases with increase in gas turbine inlet temperature and compressor pressure ratio. The sensitivity analysis of fuel cost changes was performed on objective functions. The results showed that at higher exergy efficiencies total cost rate is greater, and sen-sitivity of fuel cost optimum solutions is greater than Pareto curve with lower total cost rate. Also, the results showed that sensitivity of changes in fuel cost rate per unit of energy on total cost rate is greater than the rate of CO2 emission. Key words: gas turbine, optimization, multi-objective, CO2 emission,
exergy, environmental
Introduction
In recent years, increased use of fossil fuels as well as increase in energy supply costs has led researchers and manufacturers looking for systems with higher efficiency more than ever. Also, with regard to environmental problems caused by emissions of fossil fuels and its effect on global warming and ozone layer, the use of systems with lower contamination is inevitable. Kopac and Hilalci [1] carried out an energy analysis for a thermal power plant in Turkey to inves-tigate the effect of ambient temperature on the rate of irreversibility and overall exergy efficiency of power plant. Ehyaei and Mozafari [2] performed optimization of a micro turbine using exergy, economic, and environmental analysis, taking into account different fuels. Seyyedi et al. [3] car-
* Corresponding author, e-mail: [email protected]

Shamoushaki, M., et al.: Exergy, Economic, and Environmental (3E) Analysis of a Gas Turbine ... 2642 THERMAL SCIENCE: Year 2018, Vol. 22, No. 6A, pp. 2641-2651
ried out thermodynamic, economic, and environmental analysis and optimization of gas turbine cycle. They performed the impact of air preheater on thermodynamic cycle by examining the environmental effect. Ahmadi et al. [4] conducted a multi-objective optimization and exergy analysis for a combined heat and power (CHP) system. They carried out a sensitivity analysis on efficiency of the system for better understanding of design variables. Kaviri Ganjeh et al. [5] carried out thermodynamic modeling of a combined cycle power plant with dual pressure. They also performed its multi-objective optimization by genetic algorithm. Shirazi et al. [6] carried out energy, exergy, economic, and environmental analysis of a gas turbine – fuel cell combined cycle with internal reforming. Sanyeh and Katebi [7] carried out energy, exergy, economic, and environmental analysis as well as a multi-objective optimization of a hybrid fuel cell and gas turbine combined cycle for use in a CHP system. Ehyaei et al. [8] examined thermodynamic modeling of a combined cycle power plant as well as the effects of gas turbine inlet fogging system on the First and Second law efficiency and net output power. Khlijani et al. [9] performed a thermodynamic, exergy-economic, and environmental analysis of a gas turbine combined sys-tem and Rankine organic cycle. Khanmohammadi et al. [10] conducted thermodynamic and economic analysis of a gas turbine combined cycle and Rankine organic cycle with a biomass gasifier. Ahmadi Boyaqchi and Molaei [11] carried out advanced Exergy and optimization anal-ysis of a real combined cycle with duct burners in Iran.
In this article, exergy, exergoeconomic, and exergoenvironmental analysis of a gas tur-bine cycle (Aliabad Katoul power plant, located in northern Iran) and its optimization has been done by multi-objective particle swarm optimization (MOPSO) algorithm. In this paper, three objective functions namely total cost rate, exergy efficiency of cycle and CO2 emission rate have been considered. The main components of the cycle include air compressor, combustion chamber, gas turbine, and air preheater. The design variables considered in this study include: air compres-sor pressure ratio, rAC, combustion chamber inlet temperature, T3, gas turbine inlet temperature, T4, air compressor isentropic efficiency, ηAC, and gas turbine isentropic efficiency, ηGT. Also, sensi-tivity analysis of changes in fuel cost rate per unit of energy has been done on objective functions.
Energy analysis
In order to obtain optimum parameters of the system, gas turbine cycle modeling was performed in MATLAB. The following hypotheses were considered in analysis of the cycle: – All processes are supposed to be steady-state. – Air and combustion products are supposed to be ideal gas. – Air compressor and gas turbine are supposed to be adiabatic. – Heat loss from the combustion chamber has been considered equal to 8% of fuel low heating
value. – Pressure drop in air preheater has been considered to be 5% and 3% of pressure difference
between input and output for air and combustion products, respectively. – Air compressor inlet air temperature is 298 K and its pressure is intended to be equal to 1.013 bar.
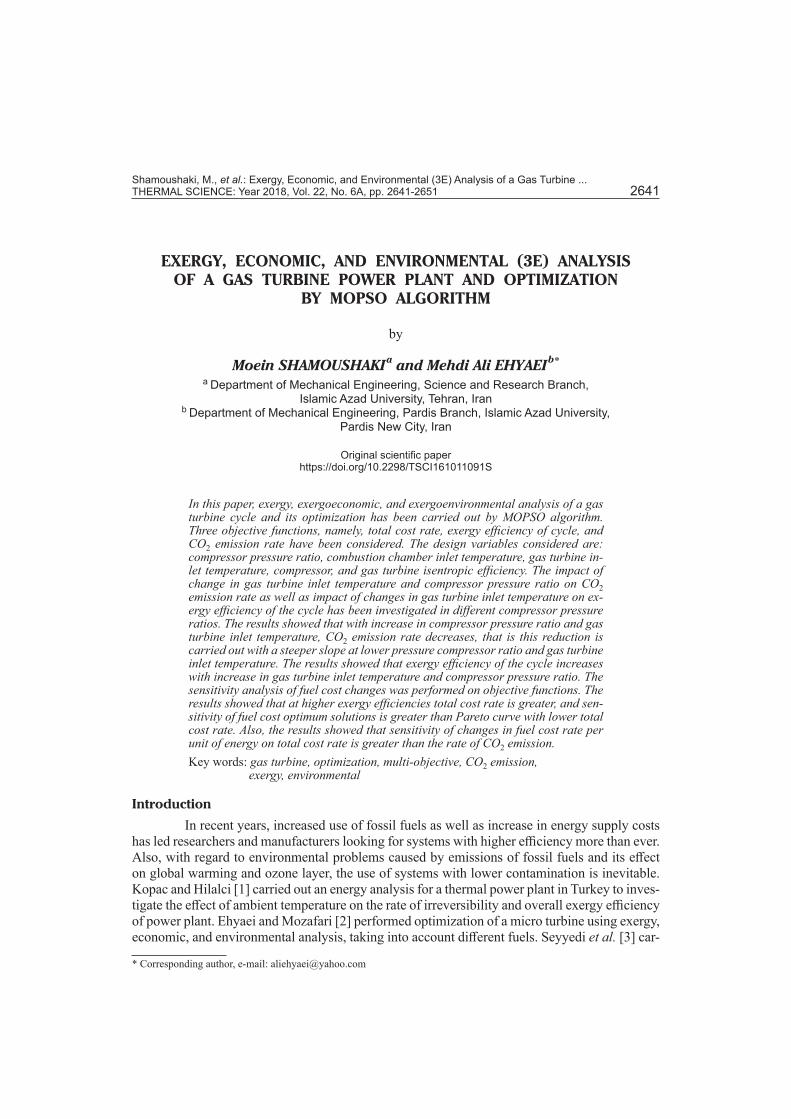
The figure of Aliabad power plant cycle has been shown in fig. 1. Energy balance equations for various components of the cycle are as follows.
– Air compressor
1
22 1
AC 1
11 1a
aPT TP
γγ
η
− = + −
(1)

Shamoushaki, M., et al.: Exergy, Economic, and Environmental (3E) Analysis of a Gas Turbine ... THERMAL SCIENCE: Year 2018, Vol. 22, No. 6A, pp. 2641-2651 2643
AC , 2 1( )a p aW m c T T= −
(2)
where T [K] is the temperature, P [bar] – the pressure, ηAC [%] – the air compressor isentropic efficiency, am [kgs–1] the air mass-flow rate, cp,a [kJkg–1K–1] – the specific heat capac-ity of air at constant pressure, and
ACW – the net-work of air compressor.
– Combustion chamber
( )3 4 CC CC1 , 50000 kJ/kg and 0.92 a f g fm h m LHV m h m LHV LHVη η+ = + − = = (3)
4 3 CC CC1 with = 0.05 bar( ) P P P P= − ∆ ∆ (4)
where LHV [kJkg–1] is lower heating value of fuel, fm [kgs–1] – the fuel mass-flow rate, ηCC [%] – the combustion chamber efficiency. The equation of reaction in the combustion chamber is:
2 2 2 2 2 2
2 2
0 0 0 0 0 04 O 2 N 2 CO 2 H O 2 CO 2 H O 2
0 0O 2 N 2
O N CO H O ( )CO (2 )H O
( 2 )O N
fCH x x x x f x f x
x f x
+ + + + → + + + +
+ − +
where f is the molar ratio of fuel to air.
– Gas turbine
1
45 4 GT
51 1
g
gPT TP
γγ
η
− = − −
(5)
GT , 4 5( )g p gW m c T T= −
(6)
g a fm m m= + (7)
net GT AC net with 150 MWW W W W= − = (8)
Here, gm [kgs–1] is combustion products mass-flow rate, cp,g [kJkg–1K–1] – the specific heat capacity of combustion products at constant pressure, ηGT [%] – the gas turbine isentropic efficiency, and GTW [MW] and netW [MW] – are net-work of gas turbine and cycle, respectively.
– Air preheater
, 3 2 , 5 6( ) ( )a p a g p gm c T T m c T T− = − (9)
3 2 ,APH ,APH1 with 0.05 bar( )a aP P P P= − ∆ ∆ = (10)
6 5 g,APH g,APH1 with 0.03 bar( )P P P P= − ∆ ∆ = (11)
By solving the previous equations, properties and thermodynamic values of the part and different parts of the cycle are obtained.
AirProduct gasFuel
Fuel
Net-work
APH
CC
GT1
23
4
56
7
8AC
Figure 1. The gas turbine cycle of Aliabad Katoul power plant
Shamoushaki, M., et al.: Exergy, Economic, and Environmental (3E) Analysis of a Gas Turbine ... 2644 THERMAL SCIENCE: Year 2018, Vol. 22, No. 6A, pp. 2641-2651
Exergy analysis
Exergy is divided into four parts: physical, chemical, kinetic, and potential exergy. In this study, kinetic and potential exergy are negligible [4]. Chemical exergy is related to the amount of system’s chemical composition diversion from chemical equilibrium. Chemical ex-ergy is one of the important parts of exergy in a combustion process.
ph chEx Ex Ex= + (12)
Physical exergy per mass unit, in general, and considering the air and combustion products in a form of full gas, is defined:
0 0 0 )( ) (phex h h T s s= − − − (13)
In the previous equation T is the temperature in terms of Kelvin and subscript 0 refers to ambient conditions. The mixed chemical exergy per mass unit is obtained [12]:
01 1
R lnin n
chchmix i i i
i iex X ex T X X
= =
= + ∑ ∑ (14)
Considering the fact that for most of fuels the ratio of chemicals exergy to their low heating value is close to 1, for CH4 can be written [13, 14]:
4CH 1,06ζ =
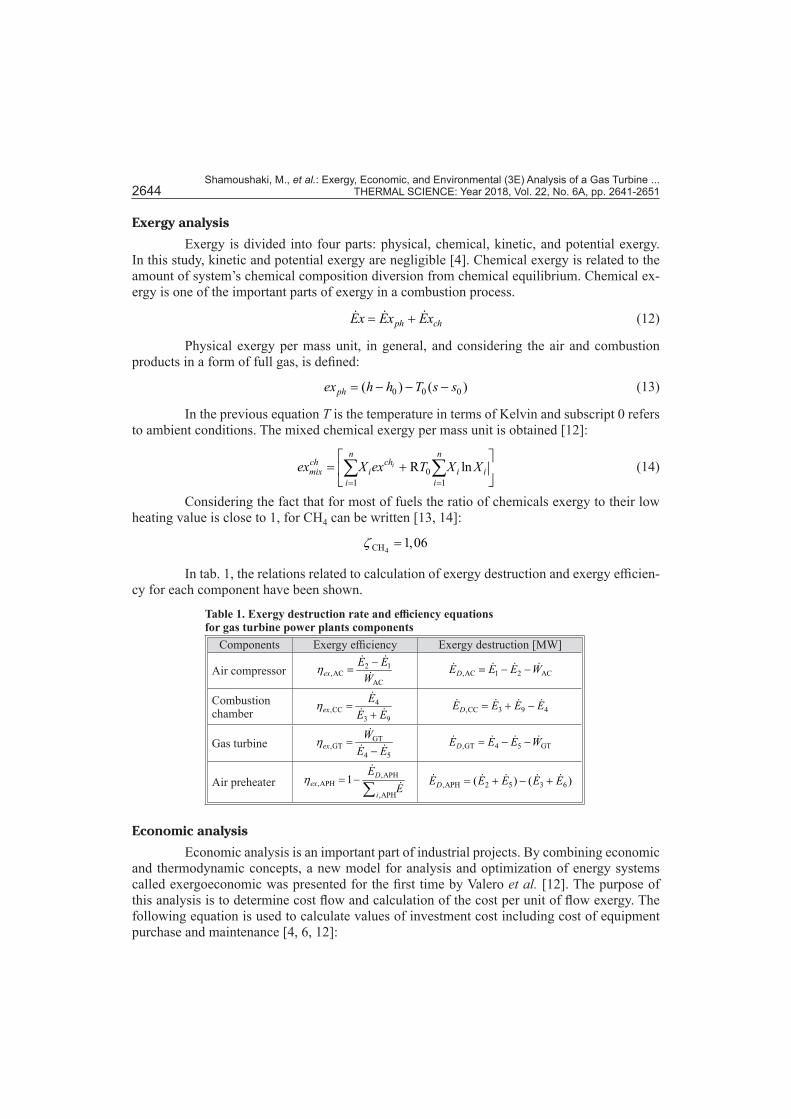
In tab. 1, the relations related to calculation of exergy destruction and exergy efficien-cy for each component have been shown.
Table 1. Exergy destruction rate and efficiency equations for gas turbine power plants components
Components Exergy efficiency Exergy destruction [MW]
Air compressor 2 1,AC
ACex
E EW
η −=
,AC 1 2 ACDE E E W= − −
Combustion chamber
4,CC
3 9ex
EE E
η =+
,CC 3 9 4DE E E E= + −
Gas turbine GT,GT
4 5ex
WE E
η =−
,GT 4 5 GTDE E E W= − −
Air preheater,APH
,APH,APH
1 Dex
i
EE
η = −∑
,APH 2 5 3 6( ) ( )DE E E E E= + − +
Economic analysis
Economic analysis is an important part of industrial projects. By combining economic and thermodynamic concepts, a new model for analysis and optimization of energy systems called exergoeconomic was presented for the first time by Valero et al. [12]. The purpose of this analysis is to determine cost flow and calculation of the cost per unit of flow exergy. The following equation is used to calculate values of investment cost including cost of equipment purchase and maintenance [4, 6, 12]:

Shamoushaki, M., et al.: Exergy, Economic, and Environmental (3E) Analysis of a Gas Turbine ... THERMAL SCIENCE: Year 2018, Vol. 22, No. 6A, pp. 2641-2651 2645
3600k
kZ CRFZ
Nϕ
= (15)
The following equation was used to calculate the fuel cost rate [12]:
f f fC c m LHV=
(16)
where Zk is the purchase cost for kth component in US$ that the rela-tions related to various compo-nents of the cycle have been brought in tab. 2. Also, constant values related to relations of tab. 2 have been brought in tab. 3. The φ is the maintenance factor that it is considered equal to 1.06 in this pa-per [12, 15]. N is the number of power plant operation hours in a year (8000 hours), and CRF is re-turn on capital coefficient that has been considered equal to 0.182 in this study [12]. Also, fc , is fuel cost per unit of energy that has been considered equal to 0.004 US$/MJ [12]. Exergy destruction cost rate can be obtained from the following equation:
, , ,D k F k D kC c Ex= (17)
where ,D kC [$s–1] is exergy destruction cost rate in the kth part of the system, ,F kc [$MJ–
1] – the exergy unit cost for kth input line of the system, and ,D kEx is exergy destruction rate in kth part of the system.
Exergoenvironmental analysis
In recent years, reduction in fuel consumption and GHG emissions has been one of the most important challenges among researchers. The most important GHG which has attracted the attention of researchers is CO2. In this article, polluting gases namely CO2, CO, and NOx have been considered as the main pollutants. The amount of CO and NOx produced in combus-tion chamber and combustion reaction changes greatly with adiabatic temperature of the flame. In order to determine the amount of pollution emission based on gram unit per kg of fuel, the following equation was used [16]:
16 0.5
NOx0.05
3
711000.15 10 exppz
PP
Tm
P
τ ⋅ − =
∆
(18)
Table 2. Cost functions in terms of thermodynamic parameters for the system components [12]
System components Capital or investment cost functions
Air compressor
11 2 2AC
12 AC 1 1lnaC m P PZ
C P Pη
= −
Combustion chamber ( )21
CC 23 4 244
223
1 expaC mZ C T CPCP
= + − −
Gas turbine ( )31 4GT 33 4 34
32 GT 5ln 1 expgC m PZ C T C
C Pη
= + − −
Air preheater
0.65 6
APH 41 ( )( )( )
gm h hZ C
U TLM
−
=∆
Table 3. Constants used in the equations of tab. 2 [12]
System components Constants
Air compressor C11 = 39.5 US$/(kg/s), C12 = 0.9
Combustion chamber
C21 = 25.6 US$/(kg/s), C22 = 0.995C23 = 0.018 K–1, C24 = 26.4
Gas turbine C31 = 266.3 US$/(kg/s), C32 = 0.92C33 = 0.036 K–1, C33 = 54.4
Air preheater
C41 = 2290 US$/(kg/s), U = 0.018 kW/m2K

Shamoushaki, M., et al.: Exergy, Economic, and Environmental (3E) Analysis of a Gas Turbine ... 2646 THERMAL SCIENCE: Year 2018, Vol. 22, No. 6A, pp. 2641-2651
9
CO2
3
78000.179 10 exppzT
m PPP
τ
⋅
=∆
(19)
where τ is the residence time in the combustion zone that its constant value is considered to be 0.002 seconds [17, 18]. The 3P is combustion chamber inlet temperature (ΔP/P) is dimension-less pressure loss in the combustion chamber. Adiabatic flame temperature in the primary zone of the combustion chamber is obtained from the equation [16, 17]:
( )* * *2exp x y z
pzT Aσ β σ λ π θ ψ∝ = + (20)
where π is dimensionless pressure, P/Pref, θ – the dimensionless temperature, T/Tref. Also, ψ is atomic ratio (H/C) that for φ ≤ 1 we have σ = φ (φ is the mass or molar ratio) and for φ ≥ 1 we have σ = φ – 0.7. Moreover, x, y, and z are quadratic functions of the σ which are obtained from the relations:
* 21 1 1x a b cσ σ= + + (21)
* 22 2 2y a b cσ σ= + + (22)
* 23 3 3z a b cσ σ= + + (23)
In the previous relations A, α, β, λ, ai, bi, and ci are parameters with constant values. These constant values have been brought in tab. 4 [3].
Objective functions
Three objective functions have been considered in this paper: total cost rate, exergy ef-ficiency of the cycle, and CO2 emission rate. The first objec-tive function is total cost rate which includes fuel cost rate, cost of purchase and mainte-nance of equipment, cost of exergy destruction, and cost of environmental effects that are as follows:
Tot
, env
f k
D k
C C Z
C C
= + ∑ +
+∑ +
(24)
where fC , kZ , ,D kC , and envC are fuel cost, cost of purchase of equipment, exergy destruction cost and cost of environmental impacts, respectively. The relation of envC is:
env CO CO NOx NOxC C m C m= +
(25)
Table 4. Constants used in the eqs. (24)-(27) [3]1.0 ≤ φ ≤ 1.60.3 ≤ φ ≤ 1.0Constants
2 ≤ θ ≤ 3.20.92 ≤ θ ≤ 22 ≤ θ ≤ 3.20.92 ≤ θ ≤ 21246.1778916.82612315.75202361.7644A
0.38190.2885–0.04930.1157α0.34790.1456–1.1141–0.9489β–2.0365–3.2771–1.1807–1.0976λ0.03610.03110.01060.0143a1–0.0850–0.0780–0.0450–0.0553b1
0.05170.04970.04820.0526c1
0.00970.02540.56880.3955a20.50200.2602–0.5500–0.4417b2 –0.2471–0.13180.13190.1410c20.01700.00420.01080.0052a3–0.1894–0.1781–0.1291–0.1289b30.10370.09800.08480.0827c3

Shamoushaki, M., et al.: Exergy, Economic, and Environmental (3E) Analysis of a Gas Turbine ... THERMAL SCIENCE: Year 2018, Vol. 22, No. 6A, pp. 2641-2651 2647
In the previous equation, CCO = 0.02086 $/kgCO and CNOx = 6.853 $/kgNOx are unit damage costs [3]. Exergy efficiency of the cycle is the second objective function that is defined:
netTot
f
Wm LHV
ηζ
=
(26)
Also, ζ for fuel with the formula CxHy is obtained from the relation:
0.0698
1.033 0.0169yx x
ζ = + − (27)
The third objective is the amount of CO2 emissions resulting from the combustion reaction in the combustion chamber that is defined:
2CO
net
mW
ε =
(28)
Multi-objective optimization
Multi-objective particle swarm optimizer algorithm
This algorithm is a social search algorithm that has been modeled from gregarious be-havior of birds. The MOPSO algorithm was introduced by Coelho [19]. In MOPSO algorithm, a concept called repository has been added into PSO algorithm. Choosing the best general answer and the best personal recollection for each particle is a crucial step in MOPS algorithm. When particles want to move, choose a member from repository as a leader. The leader must be a member of the repository and be non-dominate. Members of the repository represent Pareto front and contains non-dominate particles. So, instead of Gbest, a member of the repository is selected. For this reason, there is no repository in PSO. Because, there is only one target and a particle that is the best. But there are more particles in MOPSO which are non-dominate and are in the answer set.
Results
Design variables
The design variables considered in this article include: air compressor pressure ratio, rAC, combustion chamber inlet temperature, T3, gas turbine inlet temperature, T4, air compressor isentropic efficiency, ηAC, and gas turbine isentropic efficiency, ηGT. Given the different require-ments of design variables in the optimization process, a reasonable range has been considered for each variable that has been brought in tab. 5.
Also, some restrictions and conditions must be determined in each optimization. Thus, for the cycle of fig. 1, following conditions have been intended for the heat exchanger:
3 2 5 3, T T T T> > , 4 3T T> , 6 2T T>
Figure 2 shows Pareto solution for two objective functions namely total cost rate and exergy efficiency. Three points (A, B, and C) have been specified on the figure. Point A has the lowest total cost rate and exergy efficien-cy and point C has the highest total cost rate
Table 5. Model constraintsConstraints Reason6 ≤ rAC ≤ 16 Commercial availability
800 K ≤ T3 ≤ 1100 K Material limitation1200 K ≤ T4 ≤ 1600 K Material limitation
0.7 ≤ ηAC ≤ 0.9 Commercial availability0.7 ≤ ηGT ≤ 0.92 Commercial availability

Shamoushaki, M., et al.: Exergy, Economic, and Environmental (3E) Analysis of a Gas Turbine ... 2648 THERMAL SCIENCE: Year 2018, Vol. 22, No. 6A, pp. 2641-2651
and exergy efficiency. Since total cost rate must be minimal and exergy efficiency must be max-imum and aim of the optimization is to optimize both objective functions (normalization), here, point B that is the closest point to the equilibrium point has been selected as a Pareto solution optimal point. From this figure, it is clear that with increase in total cost rate, exergy efficiency increases. From the figure, it is clear that from exergy efficiency of 45.1% up to about 48%, total cost rate has been increased with a low slope, from 1.91-2.21 US$/s. Whilst from exergy efficiency by 48% to 48.6%, total-cost rate has been increased steeply from 2.21-2.73 US$/s. Figure 3 shows Pareto solution for both objective functions namely total cost and CO2 emission rate. Three points A, B, and C have been specified on the figure. Point A has the lowest total cost rate and the highest rate of CO2 emission and point C has the highest total cost rate value and lowest rate of CO2 emissions. Here, the goal is to minimize both objective functions. Here, nearest point to the balance point has been selected as the optimal point of Pareto solution (point B).
Figure 2. Pareto solution for total cost rate and exergy efficiency objective functions
Exergy efficiency [%100–1]
Tota
l cos
t rat
e [$
s–1] Total cost rate = 2.73 $/s
Exergy efficiency = 0.486 %/100
Total cost rate = 2.20 $/sExergy efficiency = 0.479 %/100
Total cost rate = 1.91 $/sExergy efficiency = 0.451 %/100
cf = 1.91 $/Mj
A
B
C
Equilibrium point
Figure 3. Pareto solution for total cost rate and CO2 emission rate objective functions
CO2 emmision [kgMW–1h–1]
Tota
l cos
t rat
e [$
s–1]
cf = 0.004 $/MjTotal cost rate = 3.03 $/sCO2 emmision = 0.629 kg/MWh
Total cost rate = 2.44 $/sCO2 emmision = 0.706 kg/MWh
Total cost rate = 2.05 $/sCO2 emmision = 0.901 kg/MWh
Equilibrium point
A
B
C
Figure 4 shows changes in CO2 emission rate into changes in compressor pressure ratio. Results show that with the increase in compressor pressure ratio, CO2 emission has de-clined. From the figure it is clear that the rate of CO2 emissions decreases with a steeper slope in the lower pressure ratios. With increasing in compressor pressure ratio from 6 to 12, the rate

Shamoushaki, M., et al.: Exergy, Economic, and Environmental (3E) Analysis of a Gas Turbine ... THERMAL SCIENCE: Year 2018, Vol. 22, No. 6A, pp. 2641-2651 2649
of CO2 emissions has been reduced from 0.89 to 0.71 kg/MWh, where-as, in compressor pressure ratio from 12 to 16, CO2 emission has been re-duced from 0.71 to 0.68 kg/MWh.
Figure 5 shows changes in the rate of CO2 emissions into turbine inlet temperature. From this graph it is clear that by increasing gas turbine inlet temperature, the rate of CO2 emissions reduces. It is clear from the figure that by increasing gas tur-bine inlet temperature from 900 K to 1400 K, CO2 emissions rate decreas-es with a steeper slope compared to higher temperatures.
Figure 6 shows changes in exergy efficiency of gas turbine cy-cle against changes in gas turbine inlet temperature for different com-pressor pressure ratios have been shown. This figure shows that exer-gy efficiency of the cycle increases by increasing of gas turbine inlet temperature. It is also obvious from the figure that by reducing compres-sor pressure ratio, exergy efficiency of the cycle is reduced. From the figure, it is clear that for different pressure ratios, exergy efficiency, at lower temperatures, increases with a steeper slope compared to high-er temperatures. Figure 7 shows a sensitivity analysis for changes in total cost rate and exergy efficiency into fuel cost rate per unit of energy. From the figure, it is clear that the increase in fuel cost rate per unit of energy increases total cost rate. Also, in higher exergy efficiencies, that total cost rate is greater, sensitivity of fuel cost optimum solutions is more than Pareto curve with lower total cost rate. It can be said that sensitivity of changes in fuel cost rate per unit of energy on the total cost rate is more than exergy ef-ficiency. Figure 8 shows the sensitivity analysis of total cost rate and the rate of CO2 emis-sions into changes in fuel cost rate per unit of energy. From the figure, it is clear that the increase in fuel cost rate per unit of energy increases total cost rate. Moreover, the sensitivity of changes in fuel cost rate per unit of energy on total cost rate is greater than the rate of CO2 emissions.
Figure 4. Changes in CO2 emission rate against compressor pressure ratio changes
6 7 8 9 10 11 12 13 14 15 160.65
0.7
0.75
0.8
0.85
0.9
Compressor pressure ratio [–]CO
2 em
issi
on [k
gMW
h–1]
900 1000 1100 1200 1300 1400 1500 16000.872
0.874
0.876
0.878
0.88
0.882
0.884
0.886
0.888
CO2 e
mis
sion
[kgM
Wh–1
]
Gas turbine inlet temperature [K]
Figure 5. Changes in CO2 emission rate against gas turbine inlet temperature changes
900 1000 1100 1200 1300 1400 1500 160039
40
41
42
43
44
45
46
47
48
P2/P1 = 6P2/P1 = 8P2/P1 = 10P2/P1 = 12P2/P1 = 14P2/P1 = 16
Gas turbine inlet temperature [K]
Exer
gy e
ffici
ence
[%]
Figure 6. Changes in exergy efficiency against gas turbine inlet temperature changes for different values of compressor pressure ratio

Shamoushaki, M., et al.: Exergy, Economic, and Environmental (3E) Analysis of a Gas Turbine ... 2650 THERMAL SCIENCE: Year 2018, Vol. 22, No. 6A, pp. 2641-2651
Conclusion
In this article, exergy, exergoeconomic, and exergoenvironmental analysis of a gas turbine cycle and its optimization was carried out by MOPSO algorithm. In this paper, three ob-jective functions namely total cost rate, exergy efficiency of cycle, and CO2 emission rate were considered. By considering effect of changes in compressor pressure ratio and gas turbine inlet temperature on the rate of CO2 emissions, the results showed that with increasing compres-sor pressure ratio and gas turbine inlet temperature, the rate of CO2 emissions decreases, and this reduction occurs with a steeper slope in lower compressor pressure ratios and gas turbine inlet temperatures. Also, the results showed that exergy efficiency of the cycle increases with increasing of gas turbine inlet temperature and compressor pressure ratio. Also, sensitivity anal-ysis of changes in fuel cost rate per unit of energy on objective functions showed that in higher exergy efficiencies that total cost rate is greater, sensitivity of fuel cost optimum solutions is more than Pareto solutions with lower total cost rate. Also, sensitivity of changes in fuel cost per unit of energy on total cost rate is greater than the rate of CO2 emissions.
References[1] Kopac, M., Hilalci, A., Effect of Ambient Temperature on the Efficiency of the Regenerative and
Reheat Catalagzi Power Plant in Turkey, Applied Thermal Engineering, 27 (2007), 8-9, pp. 1377-1385[2] Ehyaei, M. A., Mozafari, A., Energy, Economic and Environmental (3E) Analysis of a Micro Gas Turbine
Employed for on-site Combined Heat and Power Production, Int. J. Energy and Buildings, 42 (2010), 2, pp. 259-264
[3] Seyyedi, S. M., et al., Thermoenvironomic Optimization of Gas Turbine Cycles with Air Preheat, Pro-ceedings of the Institution of Mechanical Engineers – Part A, 225 (2011), 1, pp. 12-23
[4] Ahmadi, P., et al., Multi-Objective Optimization of a Combined Heat and Power (CHP) System for Heat-ing Purpose in a Paper Mill Using Evolutionary Algorithm, Int. J. Energy Res., 36 (2012), 1, pp. 46-63
[5] Ganjeh Kaviri, A., et al., Modeling and Multi-Objective Exergy Based Optimization of a Combined Cy-cle Power Plant Using a Genetic Algorithm, Energy Conversion and Management, 58 (2012), June, pp. 94-103
[6] Shirazi, A., et al., Thermal-Economic-Environmental Analysis and Multi-Objective Optimization of an Internal-Reforming Solid Oxide Fuel Cell-Gas Turbine Hybrid System, International Journal of Hydro-gen Energy, 37 (2012), 24, pp. 19111-19124
[7] Sanaye,, S., Katebi, A., 4E Analysis and Multi Objective Optimization of a Micro Gas Turbine and Solid Oxide Fuel Cell Hybrid Combined Heat and Power System, Journal of Power Sources, 247 (2014), Feb., pp. 294-306
[8] Ehyaei, M. A., et al., Optimization of Fog Inlet Air Cooling System for Combined Cycle Power Plants Using Genetic Algorithm, Applied Thermal Engineering, 76 (2015), Feb., pp. 449-461
[9] Khaljani, M., et al., Comprehensive Analysis of Energy, Exergy and Exergo-Economic of Cogeneration of Heat and Power in a Combined Gas Turbine and Organic Rankine Cycle, Energy Conversion and Man-agement, 97 (2015), June, pp. 154-165
Figure 7. Sensitivity analysis for changes in total cost and exergy efficiency rate into fuel cost rate per unit of energy
0.445 0.45 0.455 0.46 0.465 0.47 0.475 0.48 0.485 0.49 0.4951.6
1.8
2
2.2
2.4
2.6
2.8
3
cf = 0.003 $/MJcf = 0.004 $/MJcf = 0.005 $/MJcf = 0.006 $/MJ
Exergy efficiency [%100–1]
Tota
l cos
t rat
e [$
s–1]
0.90.850.80.750.70.650.60.550.51.5
2
2.5
3
3.5
4
4.5
5
cf = 0.003 $/MJcf = 0.004 $/MJcf = 0.005 $/MJcf = 0.006 $/MJ
Tota
l cos
t rat
e [$
s–1]
CO2 emission [kgMWh–1]
Figure 8. Sensitivity analysis of total cost rate and CO2 emissions into changes in fuel cost rate per unit of energy

Shamoushaki, M., et al.: Exergy, Economic, and Environmental (3E) Analysis of a Gas Turbine ... THERMAL SCIENCE: Year 2018, Vol. 22, No. 6A, pp. 2641-2651 2651
[10] Khanmohammadi, Sh., et al., Exergoeconomic Multi-Objective Optimization of an Externally Fired Gas Turbine Integrated with a Biomass Gasifier, Applied Thermal Engineering, 91 (2015), Dec., pp. 848-859
[11] Ahmadi Boyaghchi, F., Molaie, H., Advanced Exergy and Environmental Analyses and Multi Objective Optimization of a Real Combined Cycle Power Plant with Supplementary Firing Using Evolutionary Algorithm, Energy, 93 (2015), 2, pp. 2267-2279
[12] Valero, A., et al., CGAM Problem: Definition and Conventional Solution, Int. J. Energy, 19 (1994), 3, pp. 279-286
[13] Dincer, I., Rosen, M. A., Exergy: Energy, Environment and Sustainable Development, Elsevier, Amster-dam, The Netherlands, 2007
[14] Kotas, T. J., The Exergy Method of Thermal Plant Analysis, Butterworths, London, 1985[15] Kotas, T. J., The Exergy Method of Thermal Plant Analysis, Krieger Publishing Company, Malabar, Fla.,
USA, 1995[16] Ahmadi, P., et al., Exergy, Exergoeconomic and Environmental Analyses and Evolutionary Algorithm
Based Multi-Objective Optimization of Combined Cycle Power Plants, Energy, 36 (2011), 10, pp. 5886-5898
[17] Toffolo, A., Lazzaretto, A., Energy, Economy and Environment as Objectives in Multicriteria Optimiza-tion of Thermal System Design, Energy, 29 (2004), 8, pp. 1139-1157
[18] Rizk, N. K., Mongia, H. C., Semi Analytical Correlations for NOx, CO and UHC Emissions, Journal of Engineering Gas Turbine and Power, 115 (1993), 3, pp. 612-9
[19] Coelio, C. C. A., Lamont, G. B., Application of Multi-Objective Evolutionary Algorithms, World Scien-tific, Singapore, 2004, pp. 269-294
Paper submitted: October 11, 2016Paper revised: March 21, 2017Paper accepted: March 21, 2017
© 2018 Society of Thermal Engineers of SerbiaPublished by the Vinča Institute of Nuclear Sciences, Belgrade, Serbia.
This is an open access article distributed under the CC BY-NC-ND 4.0 terms and conditions