existing water supply system in vientiane - jicaopen_jicareport.jica.go.jp/pdf/11751260_01.pdf ·...
TRANSCRIPT
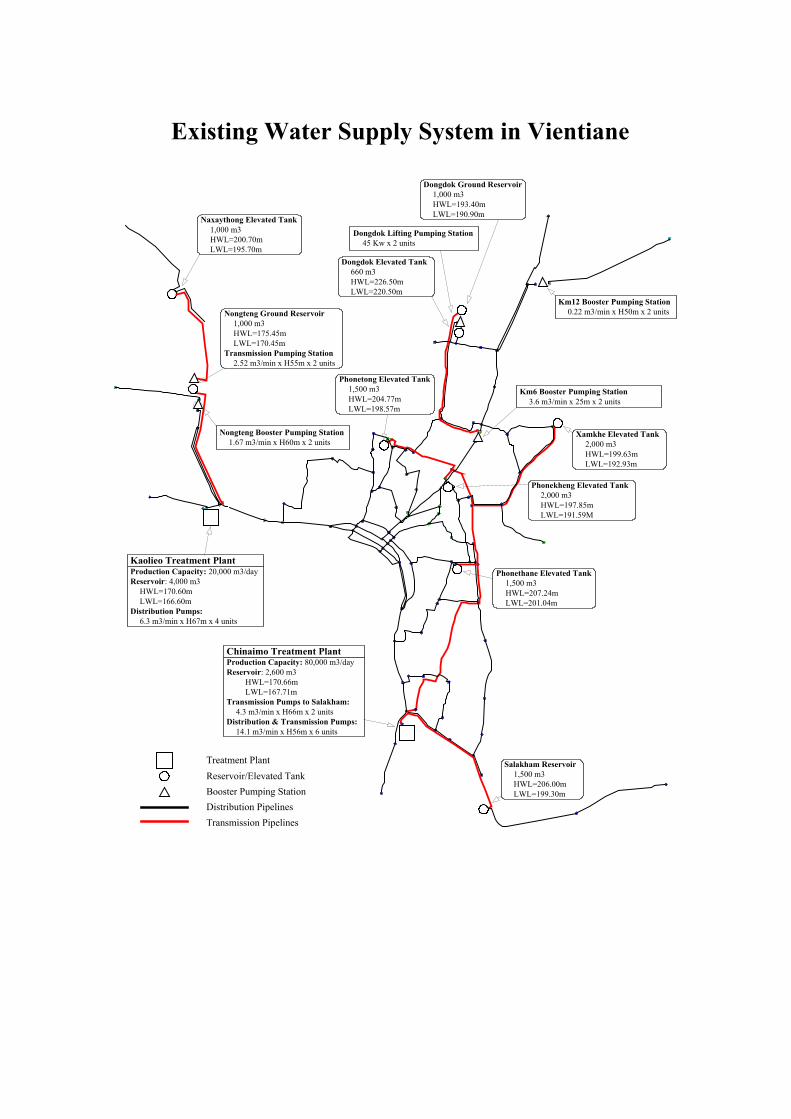
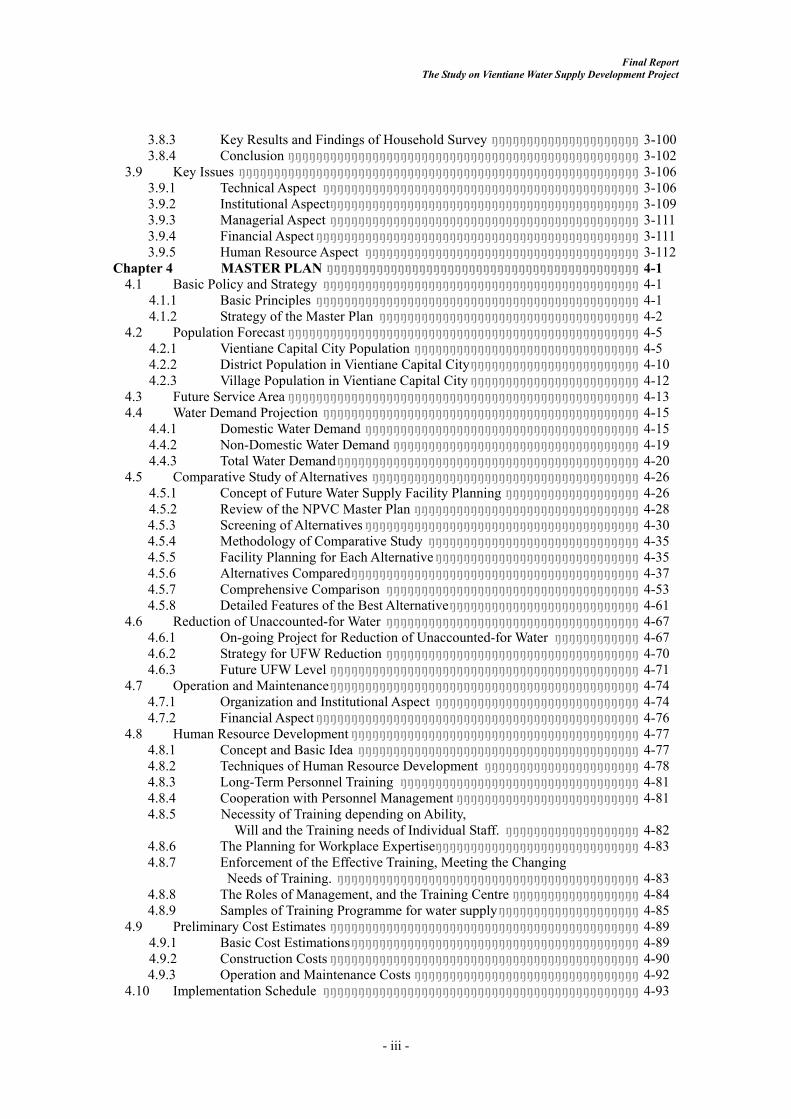
Treatment PlantReservoir/Elevated TankBooster Pumping StationDistribution PipelinesTransmission Pipelines
Production Capacity: 20,000 m3/dayReservoir: 4,000 m3
HWL=170.60mLWL=166.60m
Distribution Pumps:6.3 m3/min x H67m x 4 units
Phonekheng Elevated Tank2,000 m3HWL=197.85mLWL=191.59M
Phonethane Elevated Tank1,500 m3HWL=207.24mLWL=201.04m
Phonetong Elevated Tank1,500 m3HWL=204.77mLWL=198.57m
Xamkhe Elevated Tank2,000 m3HWL=199.63mLWL=192.93m
Salakham Reservoir1,500 m3HWL=206.00mLWL=199.30m
Dongdok Ground Reservoir1,000 m3HWL=193.40mLWL=190.90m
Nongteng Ground Reservoir1,000 m3HWL=175.45mLWL=170.45m
Transmission Pumping Station2.52 m3/min x H55m x 2 units
Naxaythong Elevated Tank1,000 m3HWL=200.70mLWL=195.70m
Km6 Booster Pumping Station3.6 m3/min x 25m x 2 units
Km12 Booster Pumping Station0.22 m3/min x H50m x 2 units
Nongteng Booster Pumping Station1.67 m3/min x H60m x 2 units
Dongdok Elevated Tank660 m3HWL=226.50mLWL=220.50m
Dongdok Lifting Pumping Station45 Kw x 2 units
Kaolieo Treatment Plant
Production Capacity: 80,000 m3/dayReservoir: 2,600 m3
HWL=170.66mLWL=167.71m
Transmission Pumps to Salakham:4.3 m3/min x H66m x 2 units
Distribution & Transmission Pumps:14.1 m3/min x H56m x 6 units
Chinaimo Treatment Plant
Existing Water Supply System in Vientiane

Dongdok
Phonekheng
Phonethane
PhonetongXamkhe
Nongteng
Km6
Km12
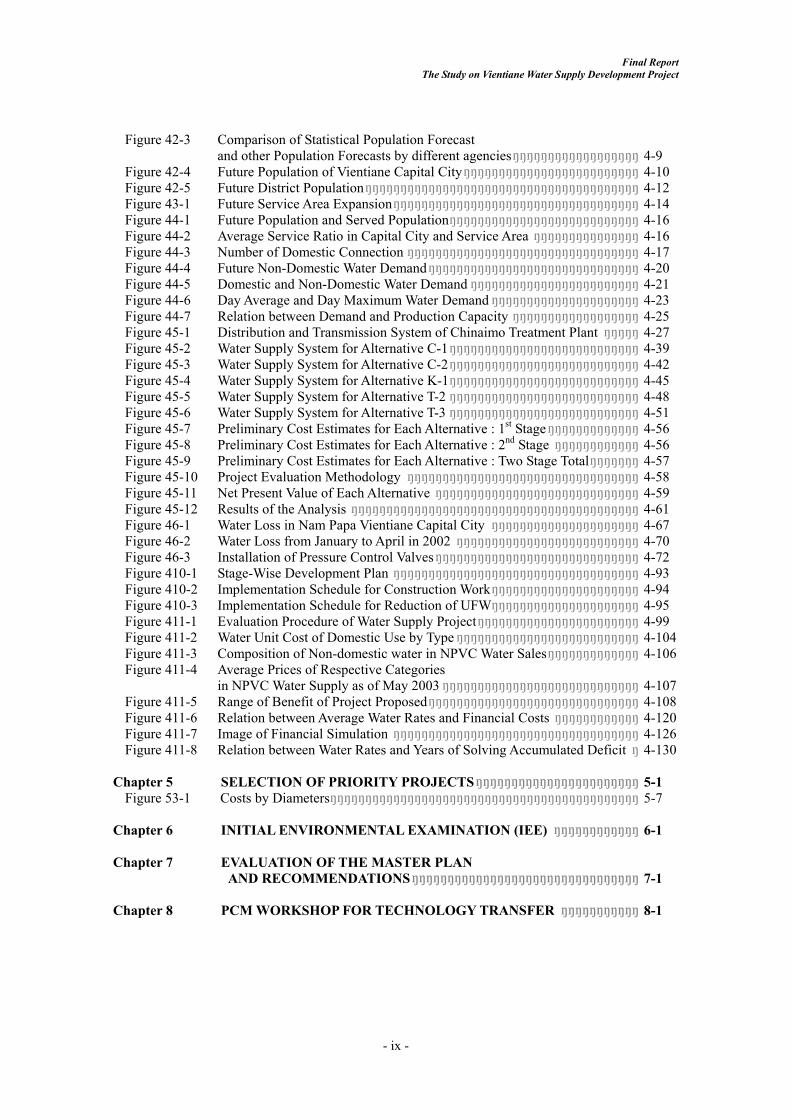
Treatment PlantElevated TankBooster Pumping StationExisting Pipelines
Salakham
Kaolieo WTP: Existing : 20,000 m3/day 1st Stage : 40,000 m3/day
Chinaimo WTP: Existing : 80,000 m3/day
Minimum Required DistributionTrunk Mains
Transmission Pipelines
150
700600 400
450
250
150
700
150
Scope of the Priority Projects

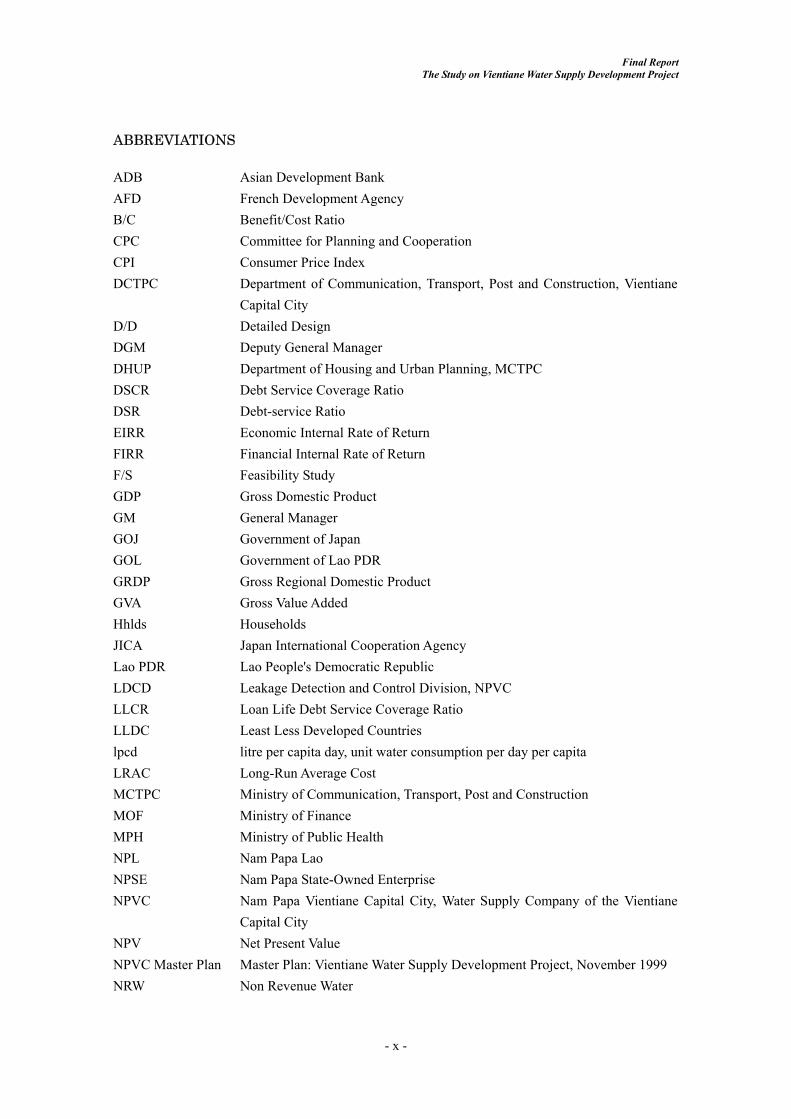
Treatment PlantReservoir/Elevated TankBooster Pumping StationDistribution PipelinesTransmission Pipelines
Production Capacity: 60,000 m3/dayExisting: 20,000 m3/dayExpansion: 40,000 m3/day
Reservoir: 15,000 m3HWL=170.60mLWL=166.60m
Distribution Pumps:6.3 m3/min x H67m x 4 units12.1 m3/min x H67m x 4 units
Phonekheng Elevated Tank2,000 m3HWL=197.85mLWL=191.59M
Phonethane Elevated Tank1,500 m3HWL=207.24mLWL=201.04m
Phonetong Elevated Tank1,500 m3HWL=204.77mLWL=198.57m
Xamkhe Elevated Tank2,000 m3HWL=199.63mLWL=192.93m
Salakham Reservoir1,500 m3HWL=206.00mLWL=199.30m
Dongdok Ground Reservoir1,000 m3HWL=193.40mLWL=190.90m
Nongteng Ground Reservoir1,000 m3HWL=175.05mLWL=170.75m
Transmission Pumping Station2.52 m3/min x H55m x 2 units
Naxaythong Elevated Tank1,000 m3HWL=200.20mLWL=194.61m
Km6 Booster Pumping StationTransmission to Dongdok Reservoir:
4.8 m3/min x H50m x 2 unitsDistribution to North Area from Km6:
6.0 m3/min x 50m x 3 units
Km12 Booster Pumping Station0.22 m3/min x H50m x 2 units
Nongteng Booster Pumping Station1.67 m3/min x H60m x 2 units
Dongdok Elevated Tank660 m3HWL=226.50mLWL=220.50m
Dongdok Lifting Pumping Station45 Kw x 2 units
Kaolieo Treatment Plant
Production Capacity: 80,000 m3/dayReservoir:
Existing: 2,600 m3HWL=170.66mLWL=167.71m
Expansion: 10,000 m3HWL=170.57mLWL=166.57m
Transmission Pumps:4.3 m3/min x H66m x 2 units14.1 m3/min x H56m x 6 units
Distribution Pumps:12.1 m3/min x H67m x 4 units
Chinaimo Treatment Plant
Future Water Supply System in Vientianeupon Completion of the 1st Stage Project
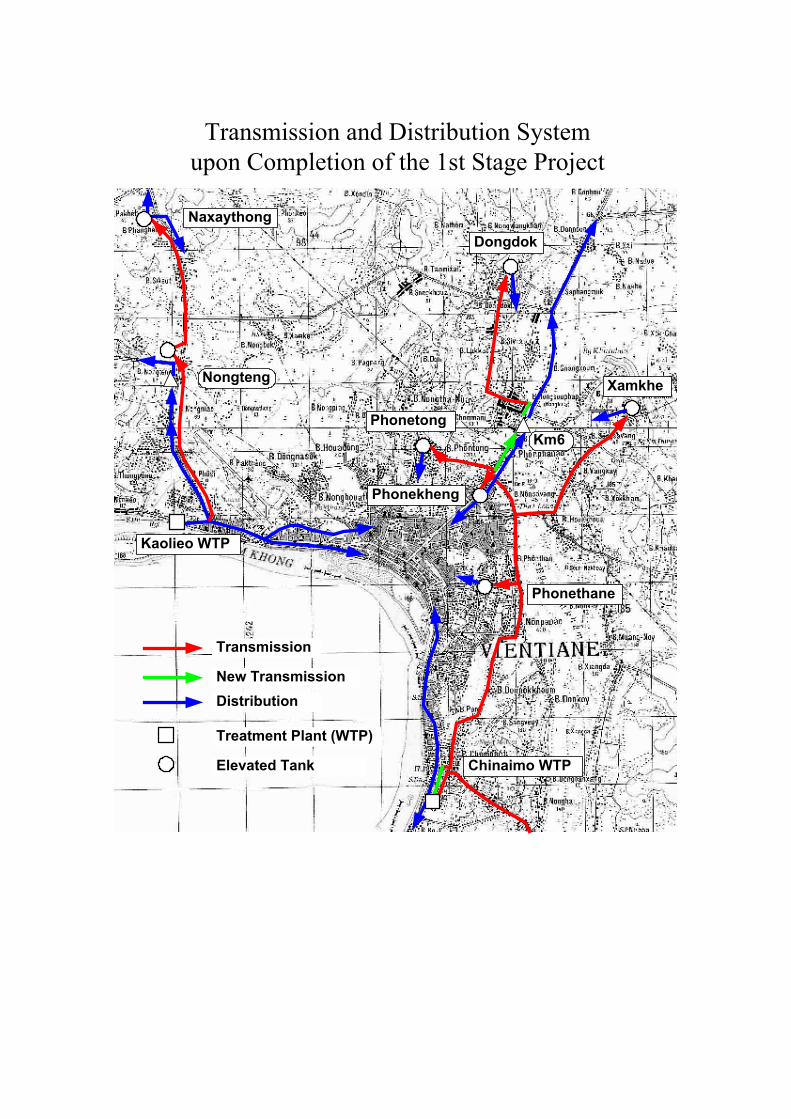
Dongdok
Phonetong
Phonekheng
Phonethane
Xamkhe
Km6
Chinaimo WTP
Kaolieo WTP
Transmission
Distribution
Treatment Plant (WTP)
Elevated Tank
New Transmission
Nongteng
Naxaythong
Transmission and Distribution Systemupon Completion of the 1st Stage Project
Final Report The Study on Vientiane Water Supply Development Project
- i -
THE STUDY ON
VIENTIANE WATER SUPPLY DEVELOPMENT PROJECT IN LAO PEOPLE’S DEMOCRATIC REPUBLIC
FINAL REPORT
Volume II : Main Report : Master Plan
Table of Contents Preface Letter of Transmittal Structure of the Final Report Location Map Existing Water Supply System in Vientiane Scope of the Priority Projects Future Water Supply System in Vientiane upon Completion of the 1st Stage Project Transmission and Distribution System upon Completion of the 1st Stage Project Table of contents ・・・・・・・・・・・・・・・・・・・・・・・・・・・・・・・・・・・・・・・・・・・・・・・・・・・・・・・・・・・ i List of Tables ・・・・・・・・・・・・・・・・・・・・・・・・・・・・・・・・・・・・・・・・・・・・・・・・・・・・・・・・・・・・・・ v List of Figures ・・・・・・・・・・・・・・・・・・・・・・・・・・・・・・・・・・・・・・・・・・・・・・・・・・・・・・・・・・・・・ viii Abbreviations ・・・・・・・・・・・・・・・・・・・・・・・・・・・・・・・・・・・・・・・・・・・・・・・・・・・・・・・・・・・・・ x Summary of the Master Plan ・・・・・・・・・・・・・・・・・・・・・・・・・・・・・・・・・・・・・・・・・・・・・・・・・ S-1 Chapter 1 INTRODUCTION・・・・・・・・・・・・・・・・・・・・・・・・・・・・・・・・・・・・・・・・・・・ 1-1
1.1 Background of the Study ・・・・・・・・・・・・・・・・・・・・・・・・・・・・・・・・・・・・・・・・・・・・・・ 1-1 1.2 Objectives of the Study ・・・・・・・・・・・・・・・・・・・・・・・・・・・・・・・・・・・・・・・・・・・・・・・ 1-2 1.3 Study Area ・・・・・・・・・・・・・・・・・・・・・・・・・・・・・・・・・・・・・・・・・・・・・・・・・・・・・・・・・ 1-2 1.4 Overall Framework of the Study ・・・・・・・・・・・・・・・・・・・・・・・・・・・・・・・・・・・・・・・・ 1-2
1.4.1 Phase I: Reconnaissance Survey・・・・・・・・・・・・・・・・・・・・・・・・・・・・・・・・・・ 1-3 1.4.2 Phase II: Preparation of the Master Plan・・・・・・・・・・・・・・・・・・・・・・・・・・・・ 1-3 1.4.3 Phase III: Feasibility Study of the Priority Project/s・・・・・・・・・・・・・・・・・・・ 1-4 1.4.4 Study Milestones・・・・・・・・・・・・・・・・・・・・・・・・・・・・・・・・・・・・・・・・・・・・・・ 1-5
1.5 Composition of Final Report ・・・・・・・・・・・・・・・・・・・・・・・・・・・・・・・・・・・・・・・・・・・ 1-5 1.6 Acknowledgements ・・・・・・・・・・・・・・・・・・・・・・・・・・・・・・・・・・・・・・・・・・・・・・・・・・ 1-6
Chapter 2 GENERAL CONDITION OF THE STUDY AREA ・・・・・・・・・・・・・・・・ 2-1
2.1 Natural Conditions・・・・・・・・・・・・・・・・・・・・・・・・・・・・・・・・・・・・・・・・・・・・・・・・・・・ 2-1 2.1.1 Climate ・・・・・・・・・・・・・・・・・・・・・・・・・・・・・・・・・・・・・・・・・・・・・・・・・・・・・ 2-1 2.1.2 Topography・・・・・・・・・・・・・・・・・・・・・・・・・・・・・・・・・・・・・・・・・・・・・・・・・・ 2-1 2.1.3 Geology ・・・・・・・・・・・・・・・・・・・・・・・・・・・・・・・・・・・・・・・・・・・・・・・・・・・・ 2-2
2.2 Institutional Situation ・・・・・・・・・・・・・・・・・・・・・・・・・・・・・・・・・・・・・・・・・・・・・・・・ 2-2 2.2.1 Central Administrative Institutes ・・・・・・・・・・・・・・・・・・・・・・・・・・・・・・・・・ 2-2 2.2.2 Local Administrative Institutions・・・・・・・・・・・・・・・・・・・・・・・・・・・・・・・・・ 2-6
2.3 Socio-economic Conditions・・・・・・・・・・・・・・・・・・・・・・・・・・・・・・・・・・・・・・・・・・・・ 2-9 2.3.1 Social Conditions ・・・・・・・・・・・・・・・・・・・・・・・・・・・・・・・・・・・・・・・・・・・・・・・・・・・ 2-9 2.3.2 Macro Economic Features・・・・・・・・・・・・・・・・・・・・・・・・・・・・・・・・・・・・・・・・・・・・ 2-14
Final Report The Study on Vientiane Water Supply Development Project
- ii -
2.4 Population of Vientiane Capital City ・・・・・・・・・・・・・・・・・・・・・・・・・・・・・・・・・・・・・・・・・・ 2-23 2.4.1 Past Trends of Capital City Population・・・・・・・・・・・・・・・・・・・・・・・・・・・・・・・・・ 2-23 2.4.2 Past Trends of District Population・・・・・・・・・・・・・・・・・・・・・・・・・・・・・・・・・・・・・ 2-24 2.4.3 Past Trend of Village Population ・・・・・・・・・・・・・・・・・・・・・・・・・・・・・・・・・・・・・・ 2-26 2.4.4 Household Size ・・・・・・・・・・・・・・・・・・・・・・・・・・・・・・・・・・・・・・・・・・・・・・・・・・・・・ 2-29 2.4.5 Future Population Projections ・・・・・・・・・・・・・・・・・・・・・・・・・・・・・・・・・・・・・・・・ 2-30
2.5 Development Plans・・・・・・・・・・・・・・・・・・・・・・・・・・・・・・・・・・・・・・・・・・・・・・・・・・・・・・・・・・ 2-34 2.5.1 National Development Plans ・・・・・・・・・・・・・・・・・・・・・・・・・・・・・・・・・・・・・・・・・ 2-34 2.5.2 Vientiane Urban Development Master Plan ・・・・・・・・・・・・・・・・・・・・・・・・・・・・ 2-35 2.5.3 GDP Projection ・・・・・・・・・・・・・・・・・・・・・・・・・・・・・・・・・・・・・・・・・・・・・・・・・・・・・ 2-44 2.5.4 Related On-going Projects ・・・・・・・・・・・・・・・・・・・・・・・・・・・・・・・・・・・・・・・・・・・ 2-45
Chapter 3 THE EXISTING CONDITION OF
THE VIENTIANE WATER SUPPLY SYSTEM・・・・・・・・・・・・・・・・・・ 3-1 3.1 Organization ・・・・・・・・・・・・・・・・・・・・・・・・・・・・・・・・・・・・・・・・・・・・・・・・・・・・・・・ 3-1
3.1.1 Organization of NPVC ・・・・・・・・・・・・・・・・・・・・・・・・・・・・・・・・・・・・・・・・・ 3-1 3.1.2 Headquarters・・・・・・・・・・・・・・・・・・・・・・・・・・・・・・・・・・・・・・・・・・・・・・・・・ 3-8 3.1.3 Branch Offices ・・・・・・・・・・・・・・・・・・・・・・・・・・・・・・・・・・・・・・・・・・・・・・・ 3-8 3.1.4 Staff employment and Training of newly employed staff ・・・・・・・・・・・・・・ 3-10
3.2 Basic Framework of Water Supply System ・・・・・・・・・・・・・・・・・・・・・・・・・・・・・・・・ 3-13 3.2.1 Service Area ・・・・・・・・・・・・・・・・・・・・・・・・・・・・・・・・・・・・・・・・・・・・・・・・・ 3-13 3.2.2 Number of Connections and Water Consumption ・・・・・・・・・・・・・・・・・・・・ 3-15 3.2.3 Served Population and Service Ratio・・・・・・・・・・・・・・・・・・・・・・・・・・・・・・ 3-18 3.2.4 Per Capita Water Consumption ・・・・・・・・・・・・・・・・・・・・・・・・・・・・・・・・・・ 3-19
3.3 Water Sources ・・・・・・・・・・・・・・・・・・・・・・・・・・・・・・・・・・・・・・・・・・・・・・・・・・・・・・ 3-20 3.3.1 Mekong River・・・・・・・・・・・・・・・・・・・・・・・・・・・・・・・・・・・・・・・・・・・・・・・・ 3-20 3.3.2 Nam Ngum River ・・・・・・・・・・・・・・・・・・・・・・・・・・・・・・・・・・・・・・・・・・・・・ 3-21
3.4 Treatment Plants ・・・・・・・・・・・・・・・・・・・・・・・・・・・・・・・・・・・・・・・・・・・・・・・・・・・・ 3-25 3.4.1 Kaolieo Treatment Plant・・・・・・・・・・・・・・・・・・・・・・・・・・・・・・・・・・・・・・・・ 3-26 3.4.2 Chinaimo Treatment Plant ・・・・・・・・・・・・・・・・・・・・・・・・・・・・・・・・・・・・・・ 3-33 3.4.3 Thangone Treatment Plant ・・・・・・・・・・・・・・・・・・・・・・・・・・・・・・・・・・・・・・ 3-41 3.4.4 Thadeua Treatment Plant ・・・・・・・・・・・・・・・・・・・・・・・・・・・・・・・・・・・・・・・ 3-42
3.5 Clear Water Transmission and Distribution System ・・・・・・・・・・・・・・・・・・・・・・・・・ 3-44 3.5.1 Organization・・・・・・・・・・・・・・・・・・・・・・・・・・・・・・・・・・・・・・・・・・・・・・・・・ 3-44 3.5.2 Pipe Network ・・・・・・・・・・・・・・・・・・・・・・・・・・・・・・・・・・・・・・・・・・・・・・・・ 3-48 3.5.3 Reservoirs・・・・・・・・・・・・・・・・・・・・・・・・・・・・・・・・・・・・・・・・・・・・・・・・・・・ 3-50 3.5.4 Booster Pumping Stations ・・・・・・・・・・・・・・・・・・・・・・・・・・・・・・・・・・・・・・ 3-51 3.5.5 Unaccounted-for Water ・・・・・・・・・・・・・・・・・・・・・・・・・・・・・・・・・・・・・・・・ 3-52 3.5.6 Analysis of Existing Pipe Network ・・・・・・・・・・・・・・・・・・・・・・・・・・・・・・・ 3-59
3.6 Management Conditions of Waterworks in Vientiane ・・・・・・・・・・・・・・・・・・・・・・・・ 3-64 3.6.1 Management of Vientiane Water Supply Company ・・・・・・・・・・・・・・・・・・・ 3-64 3.6.2 Financial Situation ・・・・・・・・・・・・・・・・・・・・・・・・・・・・・・・・・・・・・・・・・・・・ 3-64 3.6.3 Management Characteristics ・・・・・・・・・・・・・・・・・・・・・・・・・・・・・・・・・・・・ 3-70 3.6.4 Water Production Costs ・・・・・・・・・・・・・・・・・・・・・・・・・・・・・・・・・・・・・・・・ 3-73 3.6.5 Tariff System ・・・・・・・・・・・・・・・・・・・・・・・・・・・・・・・・・・・・・・・・・・・・・・・・ 3-74 3.6.6 Billing System ・・・・・・・・・・・・・・・・・・・・・・・・・・・・・・・・・・・・・・・・・・・・・・・ 3-78
3.7 Human Resource Development ・・・・・・・・・・・・・・・・・・・・・・・・・・・・・・・・・・・・・・・・・ 3-81 3.7.1 Present Situation of Training in NPVC ・・・・・・・・・・・・・・・・・・・・・・・・・・・・ 3-81 3.7.2 Human Resource Development by JICA ・・・・・・・・・・・・・・・・・・・・・・・・・・・ 3-86 3.7.3 The AFD Training Project ・・・・・・・・・・・・・・・・・・・・・・・・・・・・・・・・・・・・・・ 3-95 3.7.4 Training Project of WASA ・・・・・・・・・・・・・・・・・・・・・・・・・・・・・・・・・・・・・・ 3-97
3.8 Social Condition (Household Survey)・・・・・・・・・・・・・・・・・・・・・・・・・・・・・・・・・・・・ 3-98 3.8.1 Backgrounds and Purpose of the Household Survey ・・・・・・・・・・・・・・・・・・ 3-98 3.8.2 Survey Methodology ・・・・・・・・・・・・・・・・・・・・・・・・・・・・・・・・・・・・・・・・・・ 3-99
Final Report The Study on Vientiane Water Supply Development Project
- iii -
3.8.3 Key Results and Findings of Household Survey ・・・・・・・・・・・・・・・・・・・・・ 3-100 3.8.4 Conclusion ・・・・・・・・・・・・・・・・・・・・・・・・・・・・・・・・・・・・・・・・・・・・・・・・・・ 3-102
3.9 Key Issues ・・・・・・・・・・・・・・・・・・・・・・・・・・・・・・・・・・・・・・・・・・・・・・・・・・・・・・・・・ 3-106 3.9.1 Technical Aspect ・・・・・・・・・・・・・・・・・・・・・・・・・・・・・・・・・・・・・・・・・・・・・ 3-106 3.9.2 Institutional Aspect・・・・・・・・・・・・・・・・・・・・・・・・・・・・・・・・・・・・・・・・・・・・ 3-109 3.9.3 Managerial Aspect ・・・・・・・・・・・・・・・・・・・・・・・・・・・・・・・・・・・・・・・・・・・・ 3-111 3.9.4 Financial Aspect・・・・・・・・・・・・・・・・・・・・・・・・・・・・・・・・・・・・・・・・・・・・・・ 3-111 3.9.5 Human Resource Aspect ・・・・・・・・・・・・・・・・・・・・・・・・・・・・・・・・・・・・・・・ 3-112
Chapter 4 MASTER PLAN ・・・・・・・・・・・・・・・・・・・・・・・・・・・・・・・・・・・・・・・・・・・・ 4-1 4.1 Basic Policy and Strategy ・・・・・・・・・・・・・・・・・・・・・・・・・・・・・・・・・・・・・・・・・・・・・ 4-1
4.1.1 Basic Principles ・・・・・・・・・・・・・・・・・・・・・・・・・・・・・・・・・・・・・・・・・・・・・・ 4-1 4.1.2 Strategy of the Master Plan ・・・・・・・・・・・・・・・・・・・・・・・・・・・・・・・・・・・・・ 4-2
4.2 Population Forecast ・・・・・・・・・・・・・・・・・・・・・・・・・・・・・・・・・・・・・・・・・・・・・・・・・・ 4-5 4.2.1 Vientiane Capital City Population ・・・・・・・・・・・・・・・・・・・・・・・・・・・・・・・・ 4-5 4.2.2 District Population in Vientiane Capital City・・・・・・・・・・・・・・・・・・・・・・・・ 4-10 4.2.3 Village Population in Vientiane Capital City ・・・・・・・・・・・・・・・・・・・・・・・・ 4-12
4.3 Future Service Area ・・・・・・・・・・・・・・・・・・・・・・・・・・・・・・・・・・・・・・・・・・・・・・・・・・ 4-13 4.4 Water Demand Projection ・・・・・・・・・・・・・・・・・・・・・・・・・・・・・・・・・・・・・・・・・・・・・ 4-15
4.4.1 Domestic Water Demand ・・・・・・・・・・・・・・・・・・・・・・・・・・・・・・・・・・・・・・・ 4-15 4.4.2 Non-Domestic Water Demand ・・・・・・・・・・・・・・・・・・・・・・・・・・・・・・・・・・・ 4-19 4.4.3 Total Water Demand・・・・・・・・・・・・・・・・・・・・・・・・・・・・・・・・・・・・・・・・・・・ 4-20
4.5 Comparative Study of Alternatives ・・・・・・・・・・・・・・・・・・・・・・・・・・・・・・・・・・・・・・ 4-26 4.5.1 Concept of Future Water Supply Facility Planning ・・・・・・・・・・・・・・・・・・・ 4-26 4.5.2 Review of the NPVC Master Plan ・・・・・・・・・・・・・・・・・・・・・・・・・・・・・・・・ 4-28 4.5.3 Screening of Alternatives ・・・・・・・・・・・・・・・・・・・・・・・・・・・・・・・・・・・・・・・ 4-30 4.5.4 Methodology of Comparative Study ・・・・・・・・・・・・・・・・・・・・・・・・・・・・・・ 4-35 4.5.5 Facility Planning for Each Alternative・・・・・・・・・・・・・・・・・・・・・・・・・・・・・ 4-35 4.5.6 Alternatives Compared・・・・・・・・・・・・・・・・・・・・・・・・・・・・・・・・・・・・・・・・・ 4-37 4.5.7 Comprehensive Comparison ・・・・・・・・・・・・・・・・・・・・・・・・・・・・・・・・・・・・ 4-53 4.5.8 Detailed Features of the Best Alternative・・・・・・・・・・・・・・・・・・・・・・・・・・・ 4-61
4.6 Reduction of Unaccounted-for Water ・・・・・・・・・・・・・・・・・・・・・・・・・・・・・・・・・・・・ 4-67 4.6.1 On-going Project for Reduction of Unaccounted-for Water ・・・・・・・・・・・・ 4-67 4.6.2 Strategy for UFW Reduction ・・・・・・・・・・・・・・・・・・・・・・・・・・・・・・・・・・・・ 4-70 4.6.3 Future UFW Level ・・・・・・・・・・・・・・・・・・・・・・・・・・・・・・・・・・・・・・・・・・・・ 4-71
4.7 Operation and Maintenance・・・・・・・・・・・・・・・・・・・・・・・・・・・・・・・・・・・・・・・・・・・・ 4-74 4.7.1 Organization and Institutional Aspect ・・・・・・・・・・・・・・・・・・・・・・・・・・・・・ 4-74 4.7.2 Financial Aspect ・・・・・・・・・・・・・・・・・・・・・・・・・・・・・・・・・・・・・・・・・・・・・・ 4-76
4.8 Human Resource Development ・・・・・・・・・・・・・・・・・・・・・・・・・・・・・・・・・・・・・・・・・ 4-77 4.8.1 Concept and Basic Idea ・・・・・・・・・・・・・・・・・・・・・・・・・・・・・・・・・・・・・・・・ 4-77 4.8.2 Techniques of Human Resource Development ・・・・・・・・・・・・・・・・・・・・・・ 4-78 4.8.3 Long-Term Personnel Training ・・・・・・・・・・・・・・・・・・・・・・・・・・・・・・・・・・ 4-81 4.8.4 Cooperation with Personnel Management ・・・・・・・・・・・・・・・・・・・・・・・・・・ 4-81 4.8.5 Necessity of Training depending on Ability,
Will and the Training needs of Individual Staff. ・・・・・・・・・・・・・・・・・・・ 4-82 4.8.6 The Planning for Workplace Expertise・・・・・・・・・・・・・・・・・・・・・・・・・・・・・ 4-83 4.8.7 Enforcement of the Effective Training, Meeting the Changing
Needs of Training. ・・・・・・・・・・・・・・・・・・・・・・・・・・・・・・・・・・・・・・・・・・・ 4-83 4.8.8 The Roles of Management, and the Training Centre ・・・・・・・・・・・・・・・・・・ 4-84 4.8.9 Samples of Training Programme for water supply・・・・・・・・・・・・・・・・・・・・ 4-85
4.9 Preliminary Cost Estimates ・・・・・・・・・・・・・・・・・・・・・・・・・・・・・・・・・・・・・・・・・・・・ 4-89 4.9.1 Basic Cost Estimations・・・・・・・・・・・・・・・・・・・・・・・・・・・・・・・・・・・・・・・・・ 4-89 4.9.2 Construction Costs ・・・・・・・・・・・・・・・・・・・・・・・・・・・・・・・・・・・・・・・・・・・・ 4-90 4.9.3 Operation and Maintenance Costs ・・・・・・・・・・・・・・・・・・・・・・・・・・・・・・・・ 4-92
4.10 Implementation Schedule ・・・・・・・・・・・・・・・・・・・・・・・・・・・・・・・・・・・・・・・・・・・・・ 4-93

Final Report The Study on Vientiane Water Supply Development Project
- iv -
4.10.1 Implementation Schedule for Construction Work ・・・・・・・・・・・・・・・・・・・・ 4-93 4.10.2 Implementation Schedule for Reduction of Unaccounted-for Water ・・・・・・ 4-95 4.10.3 Disbursement Schedule ・・・・・・・・・・・・・・・・・・・・・・・・・・・・・・・・・・・・・・・・ 4-96
4.11 Economic and Financial Evaluation ・・・・・・・・・・・・・・・・・・・・・・・・・・・・・・・・・・・・・ 4-98 4.11.1 Economic Evaluation ・・・・・・・・・・・・・・・・・・・・・・・・・・・・・・・・・・・・・・・・・・ 4-98 4.11.2 Financial Analysis ・・・・・・・・・・・・・・・・・・・・・・・・・・・・・・・・・・・・・・・・・・・・ 4-113 4.11.3 Fanatical Simulation・・・・・・・・・・・・・・・・・・・・・・・・・・・・・・・・・・・・・・・・・・・ 4-124 4.11.4 Socio-Economic Impacts ・・・・・・・・・・・・・・・・・・・・・・・・・・・・・・・・・・・・・・・ 4-130
Chapter 5 SELECTION OF PRIORITY PROJECTS・・・・・・・・・・・・・・・・・・・・・・・ 5-1 5.1 Priority Projects ・・・・・・・・・・・・・・・・・・・・・・・・・・・・・・・・・・・・・・・・・・・・・・・・・・・・・ 5-1 5.2 Preliminary Cost Estimates for Priority Projects・・・・・・・・・・・・・・・・・・・・・・・・・・・・ 5-6 5.3 Improvement of Distribution Network System ・・・・・・・・・・・・・・・・・・・・・・・・・・・・・ 5-6
Chapter 6 INITIAL ENVIRONMENTAL EXAMINATION (IEE) ・・・・・・・・・・・・ 6-1
6.1 General・・・・・・・・・・・・・・・・・・・・・・・・・・・・・・・・・・・・・・・・・・・・・・・・・・・・・・・・・・・・ 6-1 6.1.1 Environmental Regulations ・・・・・・・・・・・・・・・・・・・・・・・・・・・・・・・・・・・・・ 6-1 6.1.2 Environment Assessment System・・・・・・・・・・・・・・・・・・・・・・・・・・・・・・・・・ 6-1
6.2 Screening and Scooping ・・・・・・・・・・・・・・・・・・・・・・・・・・・・・・・・・・・・・・・・・・・・・・ 6-2 6.2.1 Project Summary ・・・・・・・・・・・・・・・・・・・・・・・・・・・・・・・・・・・・・・・・・・・・・ 6-2 6.2.2 Condition of the Project ・・・・・・・・・・・・・・・・・・・・・・・・・・・・・・・・・・・・・・・・ 6-3 6.2.3 Screening ・・・・・・・・・・・・・・・・・・・・・・・・・・・・・・・・・・・・・・・・・・・・・・・・・・・ 6-4 6.2.4 Scooping・・・・・・・・・・・・・・・・・・・・・・・・・・・・・・・・・・・・・・・・・・・・・・・・・・・・ 6-5
6.3 TOR for the EIA ・・・・・・・・・・・・・・・・・・・・・・・・・・・・・・・・・・・・・・・・・・・・・・・・・・・・ 6-7 6.3.1 Data Collection・・・・・・・・・・・・・・・・・・・・・・・・・・・・・・・・・・・・・・・・・・・・・・・ 6-7 6.3.2 Key Environmental Issues ・・・・・・・・・・・・・・・・・・・・・・・・・・・・・・・・・・・・・・ 6-8 6.3.3 Preparation of the Environmental Impact Assessment Report・・・・・・・・・・・ 6-10
Chapter 7 EVALUATION OF THE MASTER PLAN
AND RECOMMENDATIONS・・・・・・・・・・・・・・・・・・・・・・・・・・・・・・・・ 7-1 7.1 Evaluation of the Master Plan ・・・・・・・・・・・・・・・・・・・・・・・・・・・・・・・・・・・・・・・・・・ 7-1
7.1.1 Technical Aspect ・・・・・・・・・・・・・・・・・・・・・・・・・・・・・・・・・・・・・・・・・・・・・ 7-1 7.1.2 Socio-economic Impacts ・・・・・・・・・・・・・・・・・・・・・・・・・・・・・・・・・・・・・・・ 7-1 7.1.3 Environmental Impacts・・・・・・・・・・・・・・・・・・・・・・・・・・・・・・・・・・・・・・・・・ 7-3
7.2 Recommendations ・・・・・・・・・・・・・・・・・・・・・・・・・・・・・・・・・・・・・・・・・・・・・・・・・・・ 7-4 7.2.1 Institutional, Organizational, and Legislative Aspects・・・・・・・・・・・・・・・・・ 7-4 7.2.2 Technical Aspect ・・・・・・・・・・・・・・・・・・・・・・・・・・・・・・・・・・・・・・・・・・・・・ 7-6 7.2.3 Managerial Aspect ・・・・・・・・・・・・・・・・・・・・・・・・・・・・・・・・・・・・・・・・・・・・ 7-9 7.2.4 NPVC Financial Aspect ・・・・・・・・・・・・・・・・・・・・・・・・・・・・・・・・・・・・・・・・ 7-13 7.2.5 Improvement in Public / Customer Relations ・・・・・・・・・・・・・・・・・・・・・・・ 7-15
Chapter 8 TECHNOLOGY TRANSFER DURING THE STUDY ・・・・・・・・・・・・・ 8-1
8.1 Overview ・・・・・・・・・・・・・・・・・・・・・・・・・・・・・・・・・・・・・・・・・・・・・・・・・・・・・・・・・・ 8-1 8.2 Planning Stage ・・・・・・・・・・・・・・・・・・・・・・・・・・・・・・・・・・・・・・・・・・・・・・・・・・・・・・ 8-1 8.3 Monitoring and Evaluation Stage ・・・・・・・・・・・・・・・・・・・・・・・・・・・・・・・・・・・・・・・ 8-2

Final Report The Study on Vientiane Water Supply Development Project
- v -
List of Tables
Chapter 1 INTRODUCTION・・・・・・・・・・・・・・・・・・・・・・・・・・・・・・・・・・・・・・・・・・・ 1-1 Chapter 2 GENERAL CONDITION OF THE STUDY AREA ・・・・・・・・・・・・・・・・ 2-1
Table 23-1 Population Density and Average Family Size at 1995 Census・・・・・・・・・・・ 2-10 Table 23-2 Number of Manufacturing Establishments by Size in Lao PDR
and Vientiane Capital City: 1999 – 2001 ・・・・・・・・・・・・・・・・・・・・・・・・・・・・・・・ 2-17 Table 23-3 Household Consumption by Item Group
in Vientiane Capital City: 1997/98 ・・・・・・・・・・・・・・・・・・・・・・・・・・・・・・・・・・・・ 2-22 Table 24-1 Past Trend of Capital City Population ・・・・・・・・・・・・・・・・・・・・・・・・・・・・・ 2-23 Table 24-2 Population Record of Each District in Vientiane Capital City ・・・・・・・・・・・ 2-25 Table 24-3 Number of Villages in Each District・・・・・・・・・・・・・・・・・・・・・・・・・・・・・・・ 2-26 Table 24-4 Household Size in 1995 and 2000 ・・・・・・・・・・・・・・・・・・・・・・・・・・・・・・・・ 2-29 Table 24-5 Household Size of NPVC Consumer ・・・・・・・・・・・・・・・・・・・・・・・・・・・・・・ 2-29 Table 24-6 Population Projection in Lao PDR: 2000 – 2020 ・・・・・・・・・・・・・・・・・・・・・・・・ 2-32 Table 24-7 Future Population Projection ・・・・・・・・・・・・・・・・・・・・・・・・・・・・・・・・・・・・ 2-33 Table 25-1 Projection of Gross Domestic Product at 2001 Constant Prices ・・・・・・・・・・・ 2-45 Table 25-2 Related On-going Projects in Water Supply Sector ・・・・・・・・・・・・・・・・・・・・・・ 2-46
Chapter 3 THE EXISTING CONDITION OF
THE VIENTIANE WATER SUPPLY SYSTEM・・・・・・・・・・・・・・・・・・ 3-1 Table 32-1 NPVC Zones and Branch Offices ・・・・・・・・・・・・・・・・・・・・・・・・・・・・・・・・・ 3-13 Table 32-2 NPVC Sub-Zones ・・・・・・・・・・・・・・・・・・・・・・・・・・・・・・・・・・・・・・・・・・・・・ 3-13 Table 32-3 Number of House Connections and Water Consumption
in March 2003 by NPVC Sub-Zone ・・・・・・・・・・・・・・・・・・・・・・・・・・・・・・・ 3-16 Table 33-1 Results of Water Quality Analysis・・・・・・・・・・・・・・・・・・・・・・・・・・・・・・・・・ 3-24 Table 34-1 Outline of Treatment Plant ・・・・・・・・・・・・・・・・・・・・・・・・・・・・・・・・・・・・・・ 3-26 Table 34-2 Operation Conditions of Treatment Plant in Year 2002 ・・・・・・・・・・・・・・・・ 3-30 Table 34-3 Rehabilitation Works Required in Kaolieo Plant ・・・・・・・・・・・・・・・・・・・・・ 3-32 Table 34-4 Outline of Treatment Plant ・・・・・・・・・・・・・・・・・・・・・・・・・・・・・・・・・・・・・・ 3-33 Table 34-5 Correlation of Raw Water Turbidity between Chinaimo and Kaolieo ・・・・・ 3-36 Table 34-6 Correlation of Alum Dosing Rate between Chinaimo and Kaolieo ・・・・・・・ 3-37 Table 34-7 Correlation of Polymer Dosing Rate between Chinaimo and Kaolieo ・・・・・ 3-37 Table 34-8 Operation Conditions of Treatment Plant in Year 2002 ・・・・・・・・・・・・・・・・ 3-38 Table 34-9 List of Equipment for water quality analysis at Chinaimo WTP ・・・・・・・・・ 3-39 Table 34-10 Parameters of Water Quality Analysis・・・・・・・・・・・・・・・・・・・・・・・・・・・・・・・・・・ 3-40 Table 34-11 Outline of Treatment Plant ・・・・・・・・・・・・・・・・・・・・・・・・・・・・・・・・・・・・・・ 3-42 Table 34-12 Specifications of Treatment Facilities・・・・・・・・・・・・・・・・・・・・・・・・・・・・・・ 3-42 Table 34-13 Outline of Treatment Plant ・・・・・・・・・・・・・・・・・・・・・・・・・・・・・・・・・・・・・・ 3-43 Table 34-14 Specifications of Treatment Facilities・・・・・・・・・・・・・・・・・・・・・・・・・・・・・・ 3-43 Table 35-1 Pipeline Length at Thangone Water Supply System・・・・・・・・・・・・・・・・・・・ 3-46 Table 35-2 Existing Pipeline Length by Material (Kilometres) ・・・・・・・・・・・・・・・・・・・ 3-48 Table 35-3 Details of Reservoirs・・・・・・・・・・・・・・・・・・・・・・・・・・・・・・・・・・・・・・・・・・・ 3-50 Table 35-4 Details of Booster Pumping Stations ・・・・・・・・・・・・・・・・・・・・・・・・・・・・・・ 3-51 Table 35-5 Pilot Zones ・・・・・・・・・・・・・・・・・・・・・・・・・・・・・・・・・・・・・・・・・・・・・・・・・・ 3-54 Table 35-6 Leakage Detection Summary (1)・・・・・・・・・・・・・・・・・・・・・・・・・・・・・・・・・・ 3-55 Table 35-7 Leakage Detection Summary (2)・・・・・・・・・・・・・・・・・・・・・・・・・・・・・・・・・・ 3-55 Table 35-8 Water Meter Investigation Summary ・・・・・・・・・・・・・・・・・・・・・・・・・・・・・・ 3-56 Table 35-9 Discharge from Chinaimo and Kaolieo WTPs ・・・・・・・・・・・・・・・・・・・・・・・ 3-60 Table 35-10 Flow Rate of Major Pipeline・・・・・・・・・・・・・・・・・・・・・・・・・・・・・・・・・・・・・ 3-60 Table 36-1 Analysis of Balance Sheet: 2000-2002 ・・・・・・・・・・・・・・・・・・・・・・・・・・・・・ 3-67 Table 36-2 Break-Even Point and Management Safety ・・・・・・・・・・・・・・・・・・・・・・・・・ 3-69 Table 36-3 Management Analysis: 2000-2002 ・・・・・・・・・・・・・・・・・・・・・・・・・・・・・・・・ 3-72

Final Report The Study on Vientiane Water Supply Development Project
- vi -
Table 36-4 Water Tariff: 2002 ・・・・・・・・・・・・・・・・・・・・・・・・・・・・・・・・・・・・・・・・・・・・・ 3-75 Table 37-1 The time-tables of training for Lao water supply staff 2002-2003 ・・・・・・・・ 3-83 Table 37-2 The 2001 plan for training of executive staff of NP Lao ・・・・・・・・・・・・・・・ 3-85 Table 37-3 The time-table for training in Abroad ・・・・・・・・・・・・・・・・・・・・・・・・・・・・・・ 3-86 Table 39-1 Discharge from Chinaimo and Kaolieo WTPs ・・・・・・・・・・・・・・・・・・・・・・・ 3-107
Chapter 4 MASTER PLAN ・・・・・・・・・・・・・・・・・・・・・・・・・・・・・・・・・・・・・・・・・・・・ 4-1
Table 42-1 Past Capital City Population Trends ・・・・・・・・・・・・・・・・・・・・・・・・・・・・・・・ 4-5 Table 42-2 Results of Statistical Calculation of Future Capital City Population ・・・・・・ 4-6 Table 42-3 Comparison of Statistical Population Forecast
and other Population Forecast by different agencies ・・・・・・・・・・・・・・・・・・ 4-8 Table 42-4 Future Population of Vientiane Capital City・・・・・・・・・・・・・・・・・・・・・・・・・ 4-10 Table 42-5 District Population in 1995 and 2000 ・・・・・・・・・・・・・・・・・・・・・・・・・・・・・・ 4-11 Table 42-6 Future District Population・・・・・・・・・・・・・・・・・・・・・・・・・・・・・・・・・・・・・・・ 4-11 Table 44-1 Future Population and Served Population・・・・・・・・・・・・・・・・・・・・・・・・・・・ 4-15 Table 44-2 Average Service Ratio in Capital City and Service Area ・・・・・・・・・・・・・・・ 4-16 Table 44-3 Number of Domestic Connection ・・・・・・・・・・・・・・・・・・・・・・・・・・・・・・・・・ 4-17 Table 44-4 Served Population, Per Capita Water Demand and
Total Domestic Water Demand ・・・・・・・・・・・・・・・・・・・・・・・・・・・・・・・・・・・ 4-18 Table 44-5 Past Record of Non-Domestic Water Consumption ・・・・・・・・・・・・・・・・・・・ 4-19 Table 44-6 Future Non-Domestic Water Demand・・・・・・・・・・・・・・・・・・・・・・・・・・・・・・ 4-19 Table 44-7 Total Water Demand ・・・・・・・・・・・・・・・・・・・・・・・・・・・・・・・・・・・・・・・・・・・ 4-20 Table 44-8 Summary of Water Demand Projection・・・・・・・・・・・・・・・・・・・・・・・・・・・・・ 4-22 Table 45-1 (1/2) Preliminary Comparison and Evaluation of Alternatives ・・・・・・・・・・・・・・・ 4-32 Table 45-1 (2/2) Preliminary Comparison and Evaluation of Alternatives ・・・・・・・・・・・・・・・ 4-33 Table 45-2 Alternatives by Combination of Locations and Stages・・・・・・・・・・・・・・・・・ 4-34 Table 45-3 Screened Alternatives for Comparative Study ・・・・・・・・・・・・・・・・・・・・・・・ 4-34 Table 45-4 Preliminary Cost Estimates for Alternative C-1 ・・・・・・・・・・・・・・・・・・・・・・ 4-40 Table 45-5 Preliminary Cost Estimates for Alternative C-2 ・・・・・・・・・・・・・・・・・・・・・・ 4-43 Table 45-6 Preliminary Cost Estimates for Alternative K-1 ・・・・・・・・・・・・・・・・・・・・・・ 4-46 Table 45-7 Preliminary Cost Estimates for Alternative T-2 ・・・・・・・・・・・・・・・・・・・・・・ 4-49 Table 45-8 Preliminary Cost Estimates for Alternative T-3 ・・・・・・・・・・・・・・・・・・・・・・ 4-52 Table 45-9 Preliminary Cost Estimates for Each Alternative ・・・・・・・・・・・・・・・・・・・・・ 4-55 Table 45-10 Present Values of Alternatives・・・・・・・・・・・・・・・・・・・・・・・・・・・・・・・・・・・・ 4-59 Table 45-11 Detailed Features of Treatment Plant for the Best Alternative ・・・・・・・・・・・ 4-62 Table 45-12 Improvement of Km6 Booster Pumping Station in the 1st Stage ・・・・・・・・・ 4-64 Table 45-13 Construction of Distribution Centre in the 2nd Stage・・・・・・・・・・・・・・・・・・ 4-64 Table 45-14 Improvement of Km12 Booster Pumping Station in the 1st Stage ・・・・・・・・ 4-64 Table 45-15 Pipeline Length by Diameters in the 1st Stage ・・・・・・・・・・・・・・・・・・・・・・・ 4-65 Table 45-16 Pipeline Length by Diameters in the 2nd Stage ・・・・・・・・・・・・・・・・・・・・・・ 4-65 Table 46-1 Expected UFW Ratio ・・・・・・・・・・・・・・・・・・・・・・・・・・・・・・・・・・・・・・・・・・ 4-74 Table 48-1 Specialized Training for Water Supply Technical Staff ・・・・・・・・・・・・・・・・ 4-88 Table 48-2 Specialized Training for Water Supply Technical Staff (Mechanical, Electrical, Instrumentation Facility) ・・・・・・・・・・・・・・・・・・・・ 4-89 Table 49-1 Costs by Work Components ・・・・・・・・・・・・・・・・・・・・・・・・・・・・・・・・・・・・・ 4-90 Table 49-2 Costs by Stages ・・・・・・・・・・・・・・・・・・・・・・・・・・・・・・・・・・・・・・・・・・・・・・・ 4-91 Table 49-3 Operation and Maintenance Costs ・・・・・・・・・・・・・・・・・・・・・・・・・・・・・・・・ 4-92 Table 410-1 Disbursement Schedule of the Project ・・・・・・・・・・・・・・・・・・・・・・・・・・・・・ 4-97 Table 411-1 Benefits Accruing from Water Supply Project ・・・・・・・・・・・・・・・・・・・・・・・ 4-101 Table 411-2 Systems’ Specification of Potable Water Source Procurement
in Residence in Urban Areas of Vientiane Capital City ・・・・・・・・・・・・・・・・ 4-103 Table 411-3 Estimate of Economic Benefits・・・・・・・・・・・・・・・・・・・・・・・・・・・・・・・・・・・ 4-109 Table 411-4 Change of Water Source Procurement System
under Future Growth Scenario: 2001 and 2020 ・・・・・・・・・・・・・・・・・・・・・・ 4-111

Final Report The Study on Vientiane Water Supply Development Project
- vii -
Table 411-5 Estimate of Economic Benefits under Future Economic Growth Conditions 4-112 Table 411-6 Economic and Financial Costs of Proposed Project ・・・・・・・・・・・・・・・・・・・ 4-112 Table 411-7 Cost and Benefit Stream of Proposed Project under Present Conditions ・・・ 4-114 Table 411-8 Cost and Benefit Stream of Proposed Project
under Future Growth Conditions ・・・・・・・・・・・・・・・・・・・・・・・・・・・・・・・・・ 4-115 Table 411-9 Average Water Consumption and Water Charge from Project Proposed ・・・ 4-116 Table 411-10 New Connections and Connection Fee from Proposed Project ・・・・・・・・・・ 4-117 Table 411-11 Water Meter Rental Fee from Proposed Project ・・・・・・・・・・・・・・・・・・・・・・ 4-117 Table 411-12 Investment Costs of Proposed Project・・・・・・・・・・・・・・・・・・・・・・・・・・・・・・ 4-118 Table 411-13 Cost and Benefit Stream of Proposed Project Applying Present Tariff・・・・・ 4-119 Table 411-14 Relationship between Financial Cost and Average Water Rate ・・・・・・・・・・ 4-120 Table 411-15 Affordability of Water Charge Corresponding to Case 1 to 4
of Financial Cost・・・・・・・・・・・・・・・・・・・・・・・・・・・・・・・・・・・・・・・・・・・・・・ 4-122 Table 411-16 Finances of Financial Plan 1 and 2 ・・・・・・・・・・・・・・・・・・・・・・・・・・・・・・・・ 4-124 Table 411-17 Profit and Loss Table of Financial Plan 1: 2005-2020 ・・・・・・・・・・・・・・・・・ 4-127 Table 411-18 Cash Flow Plan of Financial Plan 1: 2005-2020・・・・・・・・・・・・・・・・・・・・・・ 4-128 Table 411-19 Balance Sheet of Financial Plan 1: 2005-2020 ・・・・・・・・・・・・・・・・・・・・・・・ 4-129
Chapter 5 SELECTION OF PRIORITY PROJECTS・・・・・・・・・・・・・・・・・・・・・・・ 5-1
Table 51-1 Rehabilitation Work of Kaolieo Treatment Plant ・・・・・・・・・・・・・・・・・・・・・ 5-2 Table 51-2 Improvement of Chinaimo Treatment Plant ・・・・・・・・・・・・・・・・・・・・・・・・・ 5-3 Table 51-3 Details of Expansion Work of Kaolieo Treatment Plant ・・・・・・・・・・・・・・・・ 5-4 Table 51-4 Improvement of Km6 Booster Pumping Station・・・・・・・・・・・・・・・・・・・・・・ 5-5 Table 52-1 Preliminary Cost Estimates for Priority Projects ・・・・・・・・・・・・・・・・・・・・・ 5-6 Table 53-1 Pipeline Length by Diameters・・・・・・・・・・・・・・・・・・・・・・・・・・・・・・・・・・・・ 5-7 Table 53-2 Minimum Required Distribution Mains ・・・・・・・・・・・・・・・・・・・・・・・・・・・・ 5-7
Chapter 6 INITIAL ENVIRONMENTAL EXAMINATION (IEE) ・・・・・・・・・・・・ 6-1 Table 62-1 Scooping ・・・・・・・・・・・・・・・・・・・・・・・・・・・・・・・・・・・・・・・・・・・・・・・・・・・・ 6-6
Chapter 7 EVALUATION OF THE MASTER PLAN
AND RECOMMENDATIONS・・・・・・・・・・・・・・・・・・・・・・・・・・・・・・・・ 7-1 Chapter 8 PCM WORKSHOP FOR TECHNOLOGY TRANSFER ・・・・・・・・・・・ 8-1

Final Report The Study on Vientiane Water Supply Development Project
- viii -
List of Figures
Chapter 1 INTRODUCTION・・・・・・・・・・・・・・・・・・・・・・・・・・・・・・・・・・・・・・・・・・・ 1-1
Figure 1.1 Study Schedule ・・・・・・・・・・・・・・・・・・・・・・・・・・・・・・・・・・・・・・・・・・・・・・・ 1-3 Chapter 2 GENERAL CONDITION OF THE STUDY AREA ・・・・・・・・・・・・・・・・ 2-1
Figure 21-1 Organization structure of the Central Government・・・・・・・・・・・・・・・・・・・・ 2-3 Figure 21-2 Organization chart of the MCTPC ・・・・・・・・・・・・・・・・・・・・・・・・・・・・・・・・ 2-4 Figure 23-1 Distribution of Labour Force by Major Economic Sector in Lao PDR ・・・・ 2-11 Figure 23-2 Distribution of Labour Force by Major Economic Sector
in Vientiane Capital City: 1995・・・・・・・・・・・・・・・・・・・・・・・・・・・・・・・・・・・ 2-12 Figure 24-1 Past Trend of Capital City Population・・・・・・・・・・・・・・・・・・・・・・・・・・・・・・ 2-24 Figure 24-2 Districts in Vientiane Capital City ・・・・・・・・・・・・・・・・・・・・・・・・・・・・・・・・ 2-25 Figure 24-3 Population in Each District in 1995 and 2000 ・・・・・・・・・・・・・・・・・・・・・・・ 2-26 Figure 24-4 Location of Villages by Their Population Increase Ratio ・・・・・・・・・・・・・・・ 2-28 Figure 24-5 Number of People per Connection ・・・・・・・・・・・・・・・・・・・・・・・・・・・・・・・・ 2-30 Figure 24-6 Future Population Projections・・・・・・・・・・・・・・・・・・・・・・・・・・・・・・・・・・・・ 2-33 Figure 25-1 Land Use and Development Zone・・・・・・・・・・・・・・・・・・・・・・・・・・・・・・・・・ 2-38 Figure 25-2 National Infrastructure and Services・・・・・・・・・・・・・・・・・・・・・・・・・・・・・・・ 2-39 Figure 25-3 Reserved Areas and Existing Water Service Area・・・・・・・・・・・・・・・・・・・・・ 2-40 Figure 25-4 Satellite Towns ・・・・・・・・・・・・・・・・・・・・・・・・・・・・・・・・・・・・・・・・・・・・・・・ 2-41 Figure 25-5 Future Road Network ・・・・・・・・・・・・・・・・・・・・・・・・・・・・・・・・・・・・・・・・・・ 2-42 Figure 25-6 Drainage System ・・・・・・・・・・・・・・・・・・・・・・・・・・・・・・・・・・・・・・・・・・・・・・ 2-43
Chapter 3 THE EXISTING CONDITION OF
THE VIENTIANE WATER SUPPLY SYSTEM・・・・・・・・・・・・・・・・・・ 3-1 Figure 31-1 Organization Chart of NPVC ・・・・・・・・・・・・・・・・・・・・・・・・・・・・・・・・・・・・ 3-7 Figure 31-2 Organization Chart of Branch Office ・・・・・・・・・・・・・・・・・・・・・・・・・・・・・・ 3-9 Figure 32-1 NPVC Service Area・・・・・・・・・・・・・・・・・・・・・・・・・・・・・・・・・・・・・・・・・・・・ 3-14 Figure 32-2 Water Consumption and Connection by Category ・・・・・・・・・・・・・・・・・・・・ 3-15 Figure 34-1 Existing Vientiane Water Supply System ・・・・・・・・・・・・・・・・・・・・・・・・・・・ 3-25 Figure 34-2 Flow of Treatment Process of Kaolieo Treatment Plan・・・・・・・・・・・・・・・・・ 3-26 Figure 34-3 General Plan of Kaolieo Treatment Plant ・・・・・・・・・・・・・・・・・・・・・・・・・・・ 3-27 Figure 34-4 Organization Chart of Kaolieo Treatment Plant ・・・・・・・・・・・・・・・・・・・・・・ 3-28 Figure 34-5 Flow of Treatment Process of Chinaimo Treatment Plant ・・・・・・・・・・・・・・ 3-34 Figure 34-6 General Plan of Chinaimo Treatment Plant・・・・・・・・・・・・・・・・・・・・・・・・・・ 3-34 Figure 34-7 Organization Chart of Kaolieo Treatment Plant ・・・・・・・・・・・・・・・・・・・・・・ 3-35 Figure 34-8 Flow Diagram ・・・・・・・・・・・・・・・・・・・・・・・・・・・・・・・・・・・・・・・・・・・・・・・・ 3-42 Figure 35-1 Work Flow of New Installation・・・・・・・・・・・・・・・・・・・・・・・・・・・・・・・・・・・ 3-47 Figure 35-2 Work Flow of Leakage Control・・・・・・・・・・・・・・・・・・・・・・・・・・・・・・・・・・・ 3-47 Figure 35-3 Existing Pipeline Network System in Vientiane Water Supply・・・・・・・・・・・ 3-49 Figure 35-4 Water Loss in Nam Papa Vientiane Capital City ・・・・・・・・・・・・・・・・・・・・・ 3-53 Figure 35-5 Computer Displays of WaterCAD 8v6.0 ・・・・・・・・・・・・・・・・・・・・・・・・・・ 3-59 Figure 35-6 Hourly Demand Pattern・・・・・・・・・・・・・・・・・・・・・・・・・・・・・・・・・・・・・・・・・ 3-61 Figure 35-7 Pressures of Three Junctions・・・・・・・・・・・・・・・・・・・・・・・・・・・・・・・・・・・・・ 3-62 Figure 35-8 Pressure Profile from J-26 to J-21・・・・・・・・・・・・・・・・・・・・・・・・・・・・・・・・・ 3-62 Figure 35-9 Water Level of Reservoirs ・・・・・・・・・・・・・・・・・・・・・・・・・・・・・・・・・・・・・・ 3-63 Figure 38-1 Users’ Satisfaction on Current Management/Operation Field ・・・・・・・・・・・ 3-103 Figure 39-1 Problem of Network System in Vientiane Water Supply ・・・・・・・・・・・・・・・ 3-106
Chapter 4 MASTER PLAN ・・・・・・・・・・・・・・・・・・・・・・・・・・・・・・・・・・・・・・・・・・・・ 4-1
Figure 42-1 Past Capital City Population Trends ・・・・・・・・・・・・・・・・・・・・・・・・・・・・・・・ 4-5 Figure 42-2 Results of Statistical Calculation on Future Capital City Population ・・・・・・ 4-7
Final Report The Study on Vientiane Water Supply Development Project
- ix -
Figure 42-3 Comparison of Statistical Population Forecast and other Population Forecasts by different agencies・・・・・・・・・・・・・・・・・・ 4-9
Figure 42-4 Future Population of Vientiane Capital City・・・・・・・・・・・・・・・・・・・・・・・・・ 4-10 Figure 42-5 Future District Population・・・・・・・・・・・・・・・・・・・・・・・・・・・・・・・・・・・・・・・ 4-12 Figure 43-1 Future Service Area Expansion・・・・・・・・・・・・・・・・・・・・・・・・・・・・・・・・・・・ 4-14 Figure 44-1 Future Population and Served Population・・・・・・・・・・・・・・・・・・・・・・・・・・・ 4-16 Figure 44-2 Average Service Ratio in Capital City and Service Area ・・・・・・・・・・・・・・・ 4-16 Figure 44-3 Number of Domestic Connection ・・・・・・・・・・・・・・・・・・・・・・・・・・・・・・・・・ 4-17 Figure 44-4 Future Non-Domestic Water Demand・・・・・・・・・・・・・・・・・・・・・・・・・・・・・・ 4-20 Figure 44-5 Domestic and Non-Domestic Water Demand ・・・・・・・・・・・・・・・・・・・・・・・・ 4-21 Figure 44-6 Day Average and Day Maximum Water Demand ・・・・・・・・・・・・・・・・・・・・・ 4-23 Figure 44-7 Relation between Demand and Production Capacity ・・・・・・・・・・・・・・・・・・ 4-25 Figure 45-1 Distribution and Transmission System of Chinaimo Treatment Plant ・・・・・ 4-27 Figure 45-2 Water Supply System for Alternative C-1・・・・・・・・・・・・・・・・・・・・・・・・・・・ 4-39 Figure 45-3 Water Supply System for Alternative C-2・・・・・・・・・・・・・・・・・・・・・・・・・・・ 4-42 Figure 45-4 Water Supply System for Alternative K-1・・・・・・・・・・・・・・・・・・・・・・・・・・・ 4-45 Figure 45-5 Water Supply System for Alternative T-2 ・・・・・・・・・・・・・・・・・・・・・・・・・・・ 4-48 Figure 45-6 Water Supply System for Alternative T-3 ・・・・・・・・・・・・・・・・・・・・・・・・・・・ 4-51 Figure 45-7 Preliminary Cost Estimates for Each Alternative : 1st Stage・・・・・・・・・・・・・ 4-56 Figure 45-8 Preliminary Cost Estimates for Each Alternative : 2nd Stage ・・・・・・・・・・・・ 4-56 Figure 45-9 Preliminary Cost Estimates for Each Alternative : Two Stage Total・・・・・・・ 4-57 Figure 45-10 Project Evaluation Methodology ・・・・・・・・・・・・・・・・・・・・・・・・・・・・・・・・・ 4-58 Figure 45-11 Net Present Value of Each Alternative ・・・・・・・・・・・・・・・・・・・・・・・・・・・・・ 4-59 Figure 45-12 Results of the Analysis ・・・・・・・・・・・・・・・・・・・・・・・・・・・・・・・・・・・・・・・・・ 4-61 Figure 46-1 Water Loss in Nam Papa Vientiane Capital City ・・・・・・・・・・・・・・・・・・・・・ 4-67 Figure 46-2 Water Loss from January to April in 2002 ・・・・・・・・・・・・・・・・・・・・・・・・・・ 4-70 Figure 46-3 Installation of Pressure Control Valves・・・・・・・・・・・・・・・・・・・・・・・・・・・・・ 4-72 Figure 410-1 Stage-Wise Development Plan ・・・・・・・・・・・・・・・・・・・・・・・・・・・・・・・・・・・ 4-93 Figure 410-2 Implementation Schedule for Construction Work・・・・・・・・・・・・・・・・・・・・・ 4-94 Figure 410-3 Implementation Schedule for Reduction of UFW・・・・・・・・・・・・・・・・・・・・・ 4-95 Figure 411-1 Evaluation Procedure of Water Supply Project・・・・・・・・・・・・・・・・・・・・・・・ 4-99 Figure 411-2 Water Unit Cost of Domestic Use by Type ・・・・・・・・・・・・・・・・・・・・・・・・・・ 4-104 Figure 411-3 Composition of Non-domestic water in NPVC Water Sales・・・・・・・・・・・・・ 4-106 Figure 411-4 Average Prices of Respective Categories
in NPVC Water Supply as of May 2003 ・・・・・・・・・・・・・・・・・・・・・・・・・・・・ 4-107 Figure 411-5 Range of Benefit of Project Proposed・・・・・・・・・・・・・・・・・・・・・・・・・・・・・・ 4-108 Figure 411-6 Relation between Average Water Rates and Financial Costs ・・・・・・・・・・・・ 4-120 Figure 411-7 Image of Financial Simulation ・・・・・・・・・・・・・・・・・・・・・・・・・・・・・・・・・・・ 4-126 Figure 411-8 Relation between Water Rates and Years of Solving Accumulated Deficit ・ 4-130
Chapter 5 SELECTION OF PRIORITY PROJECTS・・・・・・・・・・・・・・・・・・・・・・・ 5-1
Figure 53-1 Costs by Diameters・・・・・・・・・・・・・・・・・・・・・・・・・・・・・・・・・・・・・・・・・・・・ 5-7
Chapter 6 INITIAL ENVIRONMENTAL EXAMINATION (IEE) ・・・・・・・・・・・・ 6-1 Chapter 7 EVALUATION OF THE MASTER PLAN
AND RECOMMENDATIONS・・・・・・・・・・・・・・・・・・・・・・・・・・・・・・・・ 7-1 Chapter 8 PCM WORKSHOP FOR TECHNOLOGY TRANSFER ・・・・・・・・・・・ 8-1
Final Report The Study on Vientiane Water Supply Development Project
- x -
ABBREVIATIONS ADB Asian Development Bank AFD French Development Agency B/C Benefit/Cost Ratio CPC Committee for Planning and Cooperation CPI Consumer Price Index DCTPC Department of Communication, Transport, Post and Construction, Vientiane
Capital City D/D Detailed Design DGM Deputy General Manager DHUP Department of Housing and Urban Planning, MCTPC DSCR Debt Service Coverage Ratio DSR Debt-service Ratio EIRR Economic Internal Rate of Return FIRR Financial Internal Rate of Return F/S Feasibility Study GDP Gross Domestic Product GM General Manager GOJ Government of Japan GOL Government of Lao PDR GRDP Gross Regional Domestic Product GVA Gross Value Added Hhlds Households JICA Japan International Cooperation Agency Lao PDR Lao People's Democratic Republic LDCD Leakage Detection and Control Division, NPVC LLCR Loan Life Debt Service Coverage Ratio LLDC Least Less Developed Countries lpcd litre per capita day, unit water consumption per day per capita LRAC Long-Run Average Cost MCTPC Ministry of Communication, Transport, Post and Construction MOF Ministry of Finance MPH Ministry of Public Health NPL Nam Papa Lao NPSE Nam Papa State-Owned Enterprise NPVC Nam Papa Vientiane Capital City, Water Supply Company of the Vientiane
Capital City NPV Net Present Value NPVC Master Plan Master Plan: Vientiane Water Supply Development Project, November 1999 NRW Non Revenue Water

Final Report The Study on Vientiane Water Supply Development Project
- xi -
NSC National Statistical Centre ODA Official Development Assistance OECD Organization for Economic Cooperation and Development PPP Public Private Partnership popn Population ROE Return on Equity ROI Return on Investment S/V Construction Supervision UFW Unaccounted-for Water UNCHS United Nations Centre for Human Settlements UNDP United Nations Development Program UNEP United Nations Environment Program URI Urban Research Institute, MCTPC V. C. City Vientiane Capital City VUDAA Vientiane Urban Development and Administration Authority VUDMP Vientiane Urban Development Master Plan WASA Water Supply Authority, DHUP, MCTPC WRCC Water Resources Coordination Committee WTP Water Treatment Plant
Final Report The Study on Vientiane Water Supply Development Project
SUMMARY OF
THE MASTER PLAN
Final Report The Study on Vientiane Water Supply Development Project
S - 1
SUMMARY
1. Introduction
In March 2003, a JICA Study Team of 10 study team members from Nihon Suido Consultants Co.,
Ltd., Tokyo, Japan was dispatched to the Lao PDR, and commenced this study after confirmation of
the scope of work, schedule, methodology and undertakings of the GOL of the study through an
inception meeting. The objectives of the Study are:
1. To prepare a long term master plan for the Vientiane water supply. The target year of the
master plan is 2020; target year of facility planning is 2015.
2. To conduct a feasibility study on priority project(s) identified in the master plan
3. To transfer technology to the counterpart personnel in the course of the study.
The study is to cover the present and planned service areas of the “Master Plan: Vientiane Water
Supply Development Project, November 1999” (here in after referred to as “NPVC Master Plan”).
The Study is conducted in three phases as follows:
Phase I: A Reconnaissance Survey
Phase II: The Preparation of a Master Plan
Phase III: A Feasibility Study on the Priority Project
The Phase I of the Study was conducted during the first field investigation in Lao PDR from March
to April in 2003. Phase II of the Study was also conducted during the first field investigation in
Lao PDR from May to July in 2003. During the Phase II, priority projects were identified and
agreement was reached with Lao PDR side that the identified projects should be the subject of a
subsequent feasibility study. Phase III was conducted during the second field investigation in Lao
PDR from August to November in 2003 and the subsequent work from that phase was conducted in
Japan from December 2003 to January 2004. The scope of work during Phase III centred on the
feasibility study of the priority projects and included an overall evaluation and recommendations
concerning the project implementation.
2. Development Plan of Vientiane Capital City
Vientiane Urban Development Master Plan (VUDMP) was formulated in 1991 with UNDP/UNCHS

Final Report The Study on Vientiane Water Supply Development Project
S - 2
support and revised in 2000. The revised VUDMP by the Urban Research Institute, a division of
the MCTPC was approved in 2002 by the Prime Minster, and the implementation of improvements
to roads and drainage systems started. This was financed by the ADB. The implementing agency
of the projects is the Vientiane Urban Development and Administration Authority (VUDAA) of the
Vientiane Capital City Government.
This VUDMP covers the central part of the Vientiane Capital City and the area covered by the
VUDMP is called as “Capital Municipality Zones”. Although the VUDMP covers only the central
part of the Capital City, “Special Development Zones”, “Satellite Towns Zones” and “Long-Term
Expansion Urban Zones” which are outside of the planning zone, are also discussed in the VUDMP
report.
The VUDMP defines the policy for urban development and land use patterns for future development
to achieve a well coordinated development. Although the development policy and land use plans
are defined, specific target years or sources of funds for implementation are not described in the
report.
The Capital Municipality Zones are categorized into 17 kinds of land use zones and areas where
development will take place in the future and areas that should be reserved as green space or paddy
fields are distinguished. For the areas outside of the Capital Municipality Zone, the development
plan is described in the “National Infrastructure and Services” section of the VUDMP.
According to the Decree (No. 37/PM), the water supply sector development in the capital city,
Vientiane, is defined as the first priority and the service ratio in urban area should be increased to
80% by 2020.
3. Existing Conditions of Vientiane Water Supply System
The Vientiane Water Supply Company (Nam Papa Vientiane Capital City: NPVC) was reorganised
from Lao Water Supply Company (Nam Papa Lao: NPL) under the provision of Decree (No.37/PM)
on September 30, 1999. The NPL used to cover the entire country’s water supply services. After
the reorganisation, the NPVC became one of a number of Nam Papa State-owned Enterprises
(NPSE’s), and covers Vientiane Capital City only. In terms of training for water engineers, the
NPVC has trained all the NPSE’s in the country.
Final Report The Study on Vientiane Water Supply Development Project
S - 3
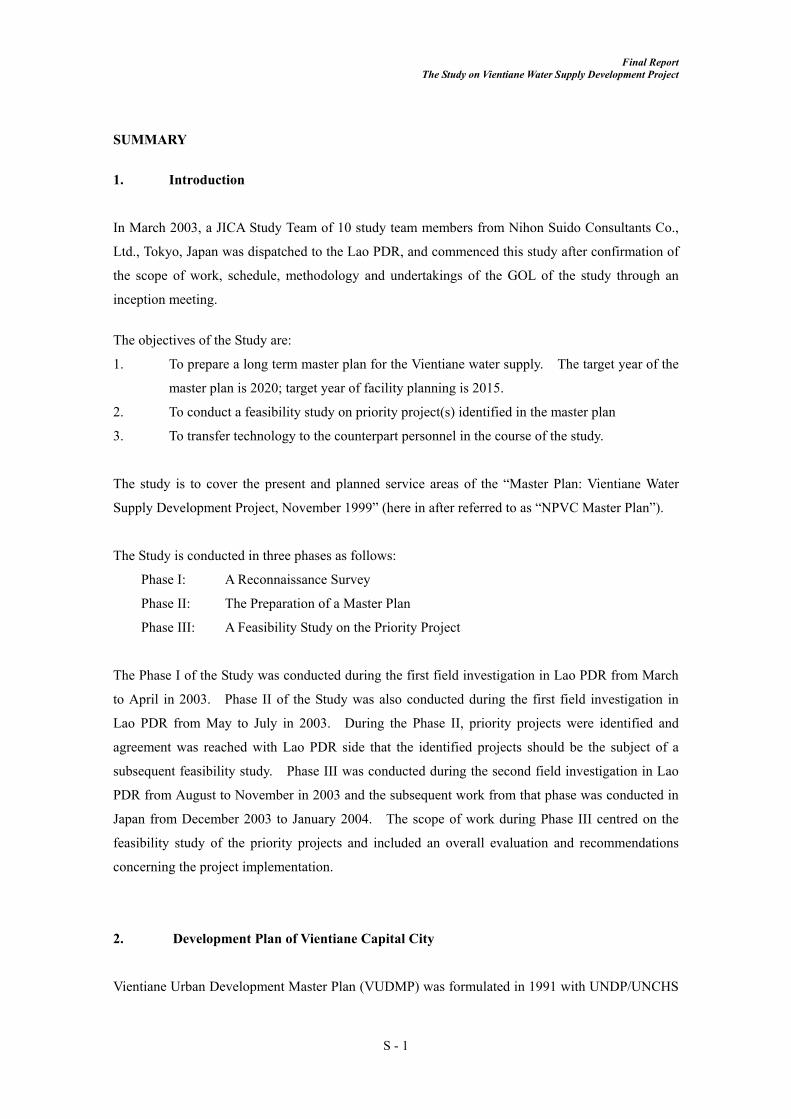
The service area that is supplied by the existing Kaolieo and Chinaimo WTPs covers the central part
of the capital city and the northern area of the capital city along Road No. 13 and Thangone Road.
Thadeua WTP supplies water to the area along the Mekong River near the Friendship Bridge. The
Thangone WTP covers a very limited area in Thangone. The NPVC service area is divided into
seven zones and each zone is managed by a NPVC branch office.
The total number of connections is 43,444 and total metered water consumption is 2,416,152
m3/month (77,940 m3/day), as of March 2003.
The existing Kaolieo WTP is located in the west of the central part of the capital city along the
Mekong River. The Kaolieo Treatment Plant, which has a capacity of 20,000 m3/day, was
constructed in 1964 by Japan’s Grant Aid Project and is the oldest treatment plant in Vientiane. In
1983, rehabilitation works were implemented also by Japan’s Grant Aid. Deterioration of facilities
and equipment have become significant problems for the stable operation of the plant since the last
rehabilitation work was implemented about 20 years ago.
The Chinaimo WTP is located in the south of the central part of the capital city along the Mekong
River. The Chinaimo Treatment Plant which has a capacity of 40,000 m3/day, was constructed in
1980, and financed by the ADB. In 1992 - 1996, rehabilitation and expansion works were
implemented by Japan’s Grant Aid and the total capacity was expanded to 80,000 m3/day.
Compared with the Kaolieo WTP, the condition of facilities and equipment are better. However,
stable water distribution and transmission has not been achieved since the plant only has
transmission facilities and is not designed as a distribution centre.
The total length of pipelines with a diameter greater than 40 mm is estimated to be about 460 km in
length. Pipelines more than 300 mm in diameter are manufactured from Ductile Iron Pipe (DIP)
and Steel Pipe (SP) and pipelines less than 300 mm in diameter are mainly PVC. Pipelines in the
downtown area of the Vientiane Capital City were installed in the 1960s and 1980s at the time of the
construction of the Kaolieo and Chinaimo WTPs respectively. Although the NPVC installed small
diameter pipelines by itself, pipelines of large size diameters made from DIP and SP, were mainly
installed in the 1990s by the Japan’s Grant Aid project, and the projects financed by ADB.
Construction work to extend the water distribution network in 5 areas by AFD aid, commenced in
March 2003 and the pipe materials are currently being delivered. A leakage reduction project is
also underway according to an action plan which was prepared by AFD aid. Water meter
investigations in each zone were also conducted by testing on site, as well as by calibration using a

Final Report The Study on Vientiane Water Supply Development Project
S - 4
meter test bench in the workshop at the NPVC. According to the reports on the leak detection
campaign and the reduction of unaccounted-for water by the NPVC, the losses in terms of volumes
of unaccounted-for water represent about 30% of the total water supply.
Vientiane Water Supply System has 9 reservoirs with a total capacity of 17,460 m3 including 3
ground reservoirs and 6 elevated tanks. The total capacity of the reservoirs is calculated to be
equivalent to 4.2 hours of the total production capacity of the Chinaimo and Kaolieo WTP’s.
A network analysis of the existing system has been conducted using WaterCAD which runs under
the AutoCAD environment, after examination of the existing transmission and distribution pipeline
networks with a diameter greater than 100mm. Survey results of flow and pressure measurements
have been also been taken into account for the calibration of the network model.
4. Financial Conditions of NPVC
The sales revenue of the NPVC comes from water sales, new connection fees, income from projects
undertaken, rental fees of heavy equipment and rental fees of water meters. In 2002, the sales
revenues of the NPVC accounted for 19.8 billion kip. Of these sales revenues, 78% was accrued
from water sales.
In 2002, the total expenditure of the NPVC was 21.6 billion kip. Expenditure is divided into two
main categories: (a) 11.2 billion kip for purchasing of materials and equipment for water production
(52% of the total), and (b) 10.4 billion kip for service and administration expenses supporting water
supply services (48%). At the end of the fiscal year, the total expenditure was reduced through a
closing adjustment of 2.4 billion kip. Accordingly, the net expenditure for the year 2002 was 19.2
billion kip.
Water sales in 2002 increased remarkably, 165% more than in 2000. This was because of an
incremental increase of the average unit price of water from 269 kip/m3 in 2000 to 547 kip/m3 in
2002, in spite of the fact that the volume of water supplied in 2002 increased only 118% more than
in 2000. For the same period, production costs increased 143%. Thus, the gross profit increased
by 218% for these three years.

Final Report The Study on Vientiane Water Supply Development Project
S - 5
Item 2000 2001 2002 Increment (2000~02)
Gross Sales 12.0 15.8 19.8 165% Production Cost 8.4 10.6 12.0 143% Gross Profit 3.6 5.2 7.8 218% Services and Administration Expenses 5.1 5.5 6.3 122% Operating Profit -1.5 -0.3 1.5 - Net non-operating Earnings & Expenses -0.8 -0.8 -0.7 - Net Profit before Tax -2.3 -1.1 0.8 - Appropriation for Tax 0.1 0.1 -0.2 - Net Profit after Tax -2.4 -1.2 0.6 -
The incremental increase of services and administration expenses was 122% for the same period.
As a result, the operating profit generated a surplus of 1.5 billion kip in 2002. Since the net
non-operating earnings and expenses was -0.7 billion kip, the net profit before tax was 0.8 billion
kip.
In 2002, the total assets were estimated at 39.0 billion kip. Fixed assets accounted for 22.6 billion
kip or 58% of the total assets. Current assets accounted for 16.3 billion kip or 42% of the total.
Of the total current assets, accounts receivable was 3.6 billion kip or 9%. This amount is
equivalent to three months’ water sales.
In 2002, the ratio of net profit to total capital was 1.9%, which was not small and was better than the
Japanese index. The ratio of net expense to net sales was almost the same as the Japanese index in
2002, but larger in 2000 and 2001. The ratios in these years indicate unstable conditions for
profitability.
Item Unit 2000 2001 2002 Japanese*1
1. Ratio of Net Profit to Total Capital % - - 1.9 0.7
2. Ratio of Net Expense to Net Sale Amount % 122 109 96 95
3. Current Ratio % 280 228 303 302 4. Ratio of Fixed Assets to
Long-term Capital % 79 77 67 95
5. Ratio of Deprecation of Fixed Assets % 6.1 7.1 9.6 3.4
6. Turnover of Account Receivable 2.7 3.2 3.7 7.9
7. Number of Employees per Water Supplied
Persons/ 104m3/day 44 41 40 12
Note: *1 Quoted from Japanese management indices of water supply services (more than 300,000 consumers) in 2001.
Final Report The Study on Vientiane Water Supply Development Project
S - 6
The current ratio of the NPVC was around 300%, which is a good condition for solvency and for
short-term safety. The ratio of fixed assets to long-term capital was less than 100%, which is also a
fair condition for long-term safety. The ratio of depreciation to fixed assets is usually 3% in every
case for Japanese water supply systems. However, the ratio of the NPVC was almost 2 to 3 times
larger than the Japanese standard.
In terms of the turnover of accounts receivable, the NPVC recorded a worsening index 2.7 to 3.7.
These figures were considerably lower than the Japanese index of 7.9. This means that the NPVC
takes more than 3 months to collect bills.
The number of staff at the water supply services seems to be quite large compared with the Japanese
average. It ranged between 40 and 44 persons per 10,000 m3 per day, which is around 4 times the
Japanese average.
Unit water production costs during the past four years were larger than the average unit prices
compared with the Japanese average. This was the reason why the NPVC recorded a final net
deficit for the three years from 1999 to 2001. The new tariff system in 2002 turned the NPVC
profitable in 2002, but the net profit was comparatively small. The new unit production cost in
2002 was 529 kip/m3. In the same year, the average unit price was calculated at 547 kip/m3. The
unit price after tax was 521 kip/m3, so it still resulted in a profit smaller than the unit production
cost.
People in Vientiane are not always recognising that the cheaper water charges are the best solution
for their social life, according to the JICA household survey conducted in March 2003. They
understand that a shortage of water supply leads to social confusion. During the dry season this
year, there was a shortage of water supply and this led to social confusion. People are aware that a
shortage of water can upset their social life. In general, they are substantially aware of the
importance of maintaining adequate water supplies for their living circumstances.

Final Report The Study on Vientiane Water Supply Development Project
S - 7
5. Master Plan
The Master Plan for the Vientiane Water Supply Development Project is being prepared to solve
existing problems which the NPVC and people in Vientiane presently encounter with the water
supply system, and to increase the water supply capacity with an adequate transmission/distribution
system. This will enable the NPVC to meet future water demands and enable the security of the
sustainable development of Vientiane and to maintain hygienic living environments for the citizens
of Vientiane.
The future population of Vientiane is forecast in three steps, 1) Capital City population forecast, 2)
District level population forecast, and 3) Village level population forecast. Capital City population
is forecast taking account of past trends, other population forecasts conducted by agencies/projects
concerned, the average population increase in the whole the Lao PDR, and applying statistical curves
and lines. After forecasting the total capital city population to 2020, district level populations are
forecast considering past trends of population increases in the respective districts. The total district
level population is forecasted so as to be equal to the forecasted capital city population. Population
increasing ratios for each village are also examined and based on past trends. Future populations in
each village are forecast so as to be equal to the forecasted district population in total.
One of the most important information for the planning of the future service area expansion is future
land use and urban development plans. This information is fortunately included in the VUDMP.
Planned industrial areas and reserved areas are taken into account to outline future water service
areas. The priority areas for expansion of the service area are also studied, considering on-going
projects such as the expansion of the distribution network by the AFD. Expansion of future service
areas is finalised by consultation with the WASA and NPVC.
Future water demand is projected for domestic and non-domestic purposes separately. For the
domestic water demand, future water demand is calculated from village level populations, service
ratios, the calculated served population and the per capita water consumption. Usually per capita
water consumption would be expected to increase in future; per capita water consumption in
Vientiane is expected to decrease from its current level of 174 lpcd to 170 lpcd by 2010. This is
because about 20% of households have in-house leakages not repaired. This situation will be
improved by adequate public relation activities managed by the NPVC. Also, there is expectation
to be some influence on water usage by the tariff increase which is planned under this Master Plan.
Non-domestic water demand is projected from past trends and the industrial area development
planned by the Vientiane Capital City. In this Mater Plan, it is strongly recommended that the

Final Report The Study on Vientiane Water Supply Development Project
S - 8
NPVC promotes water conservation activities and a reduction of UFW to avoid over-scaled project
formation. Table below shows summary of future water demand projection.
Summary of Water Demand Projection Unit 2000 2005 2010 2015 2020Population person 599,000 687,084 788,165 902,716 1,034,521 Served Population person 215,522 275,567 370,269 466,981 564,648 Service Ratio % 36.0% 40.1% 47.0% 51.7% 54.6%Population in Service Area person 297,575 380,342 499,737 586,710 662,441 Service Ratio in Service Area % 72.4% 72.5% 74.1% 79.6% 85.2%Number of Domestic Connections nos. 34,210 43,741 58,773 74,124 89,627 Number of Non-domestic Connections nos. 5,095 6,340 7,889 9,817 12,215 Total Number of Connections nos. 39,305 50,081 66,662 83,940 101,842 Served Population (Incremental) person 60,046 94,702 96,712 97,667 Number of Domestic Connections (Incremental) nos. 9,531 15,032 15,351 15,503 Per Capita Consumption lpcd 174 172 170 170 170Total Domestic Water Demand m3/day 37,501 47,398 62,946 79,387 95,990 Non-Domestic Water Demand m3/day 30,361 37,780 47,011 58,499 72,793 Total Water Demand m3/day 67,862 85,177 109,957 137,885 168,783 UFW Ratio % 33% 28% 25% 25% 25%Day Average Water Demand m3/day 101,286 118,302 146,609 183,847 225,044 Day Maximum Water Demand m3/day 111,415 130,132 161,270 202,232 247,548
To meet the increasing future water demand, the following alternatives were compared and the best
alternative plan was selected.
1. Expansion of the existing Chinaimo Treatment Plant,
2. Expansion of the existing Kaolieo Treatment Plant,
3. Construction of new Thangone Treatment Plant, and
4. Combination of the above three alternatives.
To compare these alternatives, the study team prepared water supply facility plans including intake,
treatment plants, clear water transmission pipelines, and distribution pipelines. Each alternative’s
construction costs, operation and maintenance costs have been calculated. to compare each system as
a whole. The social, environmental, technical, and economic aspects of each alternative has also
been compared. Furthermore, the organization, management, financial condition, and human
resource development areas have been carefully examined for the soundness of the future NPVC
management.
Final Report The Study on Vientiane Water Supply Development Project
S - 9
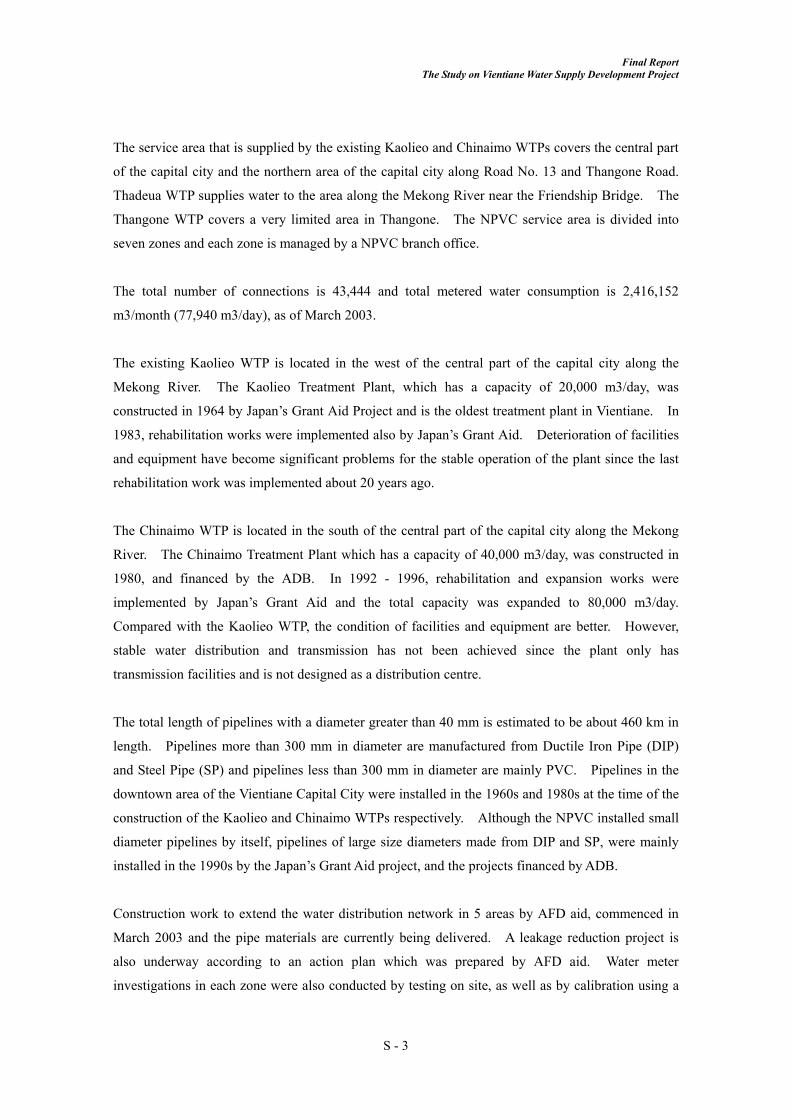
As a result of the comparative study, a plan of expansion of the existing Kaolieo Treatment Plant
under the 1st Stage (by year 2007) and construction of new Thangone Treatment Plant under the 2nd
Stage (by year 2012) (Alternative K-1) has been selected as the best alternative. The components
of alternative K-1 are as follows.
1st Stage: Expansion of Existing Kaolieo Water Treatment Plant
- Intake Facilities: Construction of new intake facilities from the Mekong River
- Treatment Plant: Expansion of 40,000 m3/day
- Clear Water Transmission Pipelines: Installation of 2.2 km of pipelines
- Booster Pumping Stations: Improvement of the Km6 BP Station
- Distribution Trunk Mains: Installation of 24.2 km of pipelines
2nd Stage: Construction of New Thangone Water Treatment Plant
- Intake Facilities: Construction of new intake facilities from the Nam Ngum River
- Treatment Plant: Construction to produce a capacity of 60,000 m3/day
- Clear Water Transmission: Installation of 10.6 km of pipelines
- Distribution Centre: Construction of a new distribution centre with a capacity of 60,000 m3/day
- Booster Pumping Stations: Improvement of the Km12 BP Station
- Distribution Trunk Mains: Installation of 73.6 km of pipelines
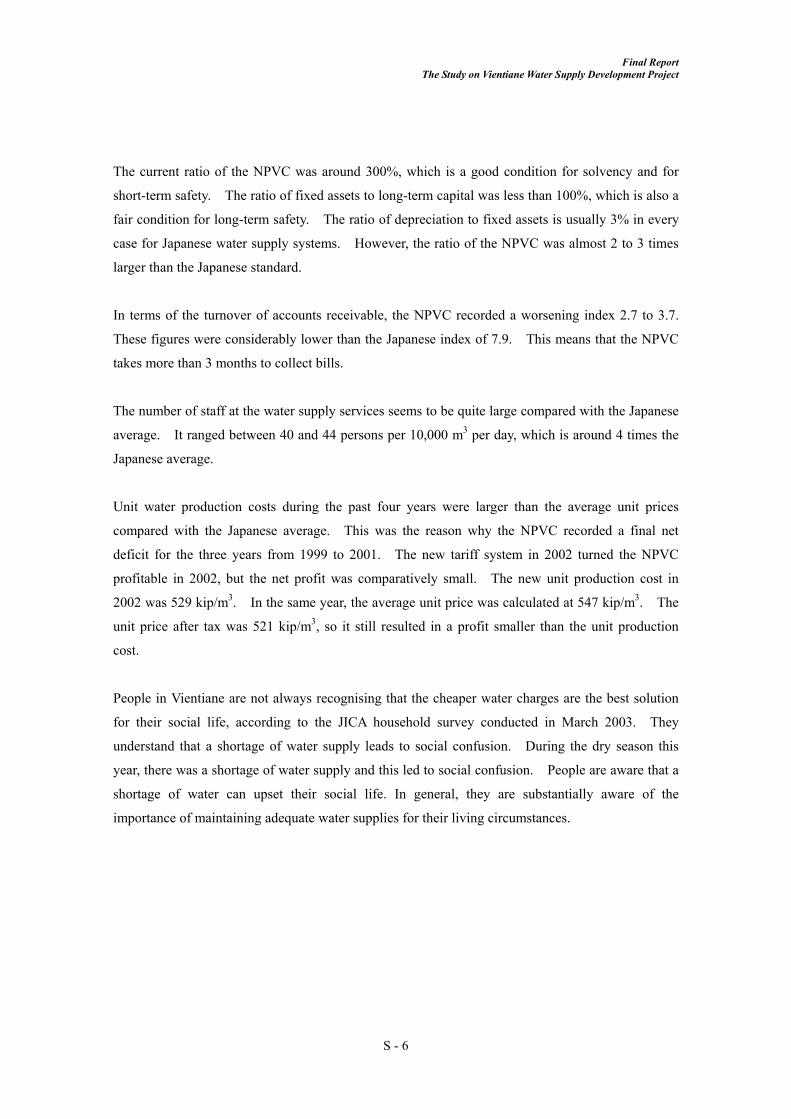
The system expansion plan is shown in the figure below. The 1st Stage Project will be completed
by 2007 and the 2nd Stage Project will be completed by 2012.
-
50,000
100,000
150,000
200,000
250,000
300,000
1995 2000 2005 2010 2015 2020 2025
Year
Wat
er D
eman
d
Day Average Water Demand Day Maximum Water Demand
1st StageExpansion of Kaolieo WTP,
40,000 m3/day
2nd StageConstruction of New
Thangone WTP,60,000 m3/day
Final Report The Study on Vientiane Water Supply Development Project
S - 10
The scale of the 1st Stage Project was decided considering the adequate scale of the project. This
was to avoid difficulties among international lending agencies in finding funding sources for the Lao
PDR. After the completion of the 1st Stage Project, the daily maximum water demand will still not
be satisfied, and the water shortage situation will continue until the completion of the 2nd Stage.
Therefore, it is strongly recommended that the NPVC promotes water conservation activities
through adequate public relations, and to reduce the UFW by intensive measures.
The scale of the 2nd Stage may be rather large for international or Lao PDR’s own funding bodies,
even though the economic and financial viability has been calculated as described in the Master Plan.
Therefore, in order to adapt the 2nd Stage Project at an appropriate capital investment scale, efforts
on water conservation and reduction of the UFW are indispensable by the NPVC.
After completion of the 1st Stage Project, a feasibility study will be required to implement the 2nd
Stage. During the feasibility study for the 2nd Sage, the scale of the 2nd Stage will be reviewed. If
the maximum water demand is reduced by the promotion of water conservation and the reduction of
UFW is less than estimated by the study, the implementation of the 2nd Stage could be divided into
two phases, each stage being a phased production capacity increase of 30,000 m3/day, or,
alternatively, to be reduced to 50,000 m3/day from 60,000 m3/day. Such modifications of scale to
the 2nd Stage will reduce the financial impacts to the NPVC.
Preliminary cost estimates were conducted and the project costs for the 1st and 2nd Stages are
shown below together with the planned implementation schedule.

Final Report The Study on Vientiane Water Supply Development Project
S - 11
(x 1,000 US$)Total Foreign Local
FIRST STAGE 35,372 22,549 12,8231. Construction Cost 26,048 17,122 8,926
1.1 Treatment Plants 15,081 9,055 6,026Expansion of Kaolieo T.P. 9,624 5,762 3,862Rehabilitation of Kaolieo T.P. 3,023 1,951 1,072Expansion of Reservoir in Chinaimo T.P. 2,434 1,342 1,092
1.2 Clear Water Transmission Pipelines 1,234 984 2501.3 Distribution Center 0 0 01.4 Booster Pump Station 737 607 1301.5 Distribution Trunk Mains 6,393 4,694 1,6991.6 Secondary and Tirtially Distribution Mains 606 510 961.7 House Connection Installation 752 620 1321.8 Unaccounted-for Water Reduction 1,245 652 593
2. Consulting Services 1,822 1,540 2822.1 D/D and S/V for Stage 1 (2004 - 2007) 1,822 1,540 282
3. Contingencies 5,817 3,887 1,9303.1 Physical Contingency 2,787 1,866 9213.2 Price Contingency 3,030 2,021 1,009
4. Administration Cost 1,685 0 1,685
(x 1,000 US$)Total Foreign Local
SECOND STAGE 66,065 44,316 21,7491. Construction Cost 41,563 28,801 12,762
1.1 Treatment Plants 13,427 8,693 4,734Construction of Thangone T.P. 13,427 8,693 4,734
1.2 Clear Water Transmission Pipelines 7,521 6,198 1,3231.3 Distribution Center 4,376 2,984 1,3921.4 Booster Pump Station 366 294 721.5 Distribution Trunk Mains 11,156 7,280 3,8761.6 Secondary and Tirtially Distribution Mains 1,202 1,011 1911.7 House Connection Installation 1,874 1,544 3301.8 Unaccounted-for Water Reduction 1,641 797 844
2. Consulting Services 3,505 2,954 5512.1 Feasibility Study for Stage 2 (2008) 595 496 992.2 D/D and S/V for Stage 2 (2009 - 2012) 2,910 2,458 452
3. Contingencies 17,851 12,561 5,2903.1 Physical Contingency 4,507 3,175 1,3323.2 Price Contingency 13,344 9,386 3,958
4. Administration Cost 3,146 0 3,146Total Project Costs 101,437 66,865 34,572
Final Report The Study on Vientiane Water Supply Development Project
S - 12
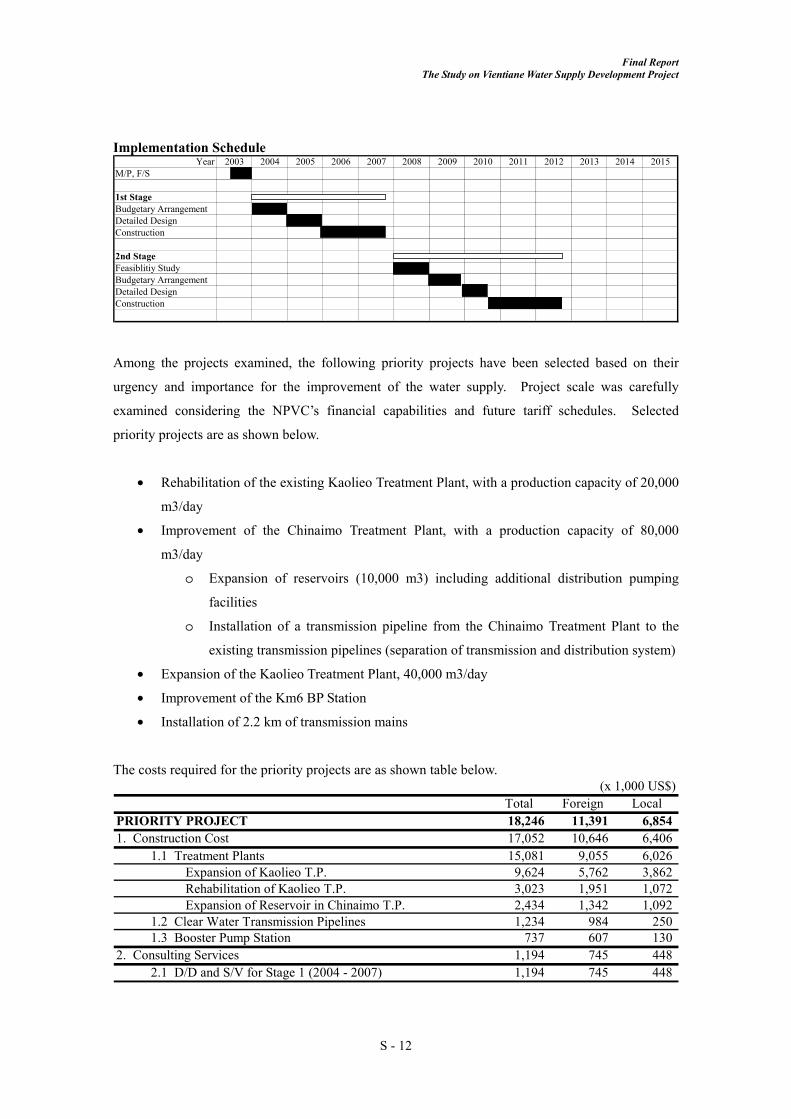
Implementation Schedule Year 2003 2004 2005 2006 2007 2008 2009 2010 2011 2012 2013 2014 2015
M/P, F/S
1st StageBudgetary ArrangementDetailed DesignConstruction
2nd StageFeasiblitiy StudyBudgetary ArrangementDetailed DesignConstruction
Among the projects examined, the following priority projects have been selected based on their
urgency and importance for the improvement of the water supply. Project scale was carefully
examined considering the NPVC’s financial capabilities and future tariff schedules. Selected
priority projects are as shown below.
• Rehabilitation of the existing Kaolieo Treatment Plant, with a production capacity of 20,000
m3/day
• Improvement of the Chinaimo Treatment Plant, with a production capacity of 80,000
m3/day
o Expansion of reservoirs (10,000 m3) including additional distribution pumping
facilities
o Installation of a transmission pipeline from the Chinaimo Treatment Plant to the
existing transmission pipelines (separation of transmission and distribution system)
• Expansion of the Kaolieo Treatment Plant, 40,000 m3/day
• Improvement of the Km6 BP Station
• Installation of 2.2 km of transmission mains
The costs required for the priority projects are as shown table below. (x 1,000 US$)
Total Foreign LocalPRIORITY PROJECT 18,246 11,391 6,8541. Construction Cost 17,052 10,646 6,406
1.1 Treatment Plants 15,081 9,055 6,026Expansion of Kaolieo T.P. 9,624 5,762 3,862Rehabilitation of Kaolieo T.P. 3,023 1,951 1,072Expansion of Reservoir in Chinaimo T.P. 2,434 1,342 1,092
1.2 Clear Water Transmission Pipelines 1,234 984 2501.3 Booster Pump Station 737 607 130
2. Consulting Services 1,194 745 4482.1 D/D and S/V for Stage 1 (2004 - 2007) 1,194 745 448
Final Report The Study on Vientiane Water Supply Development Project
S - 13
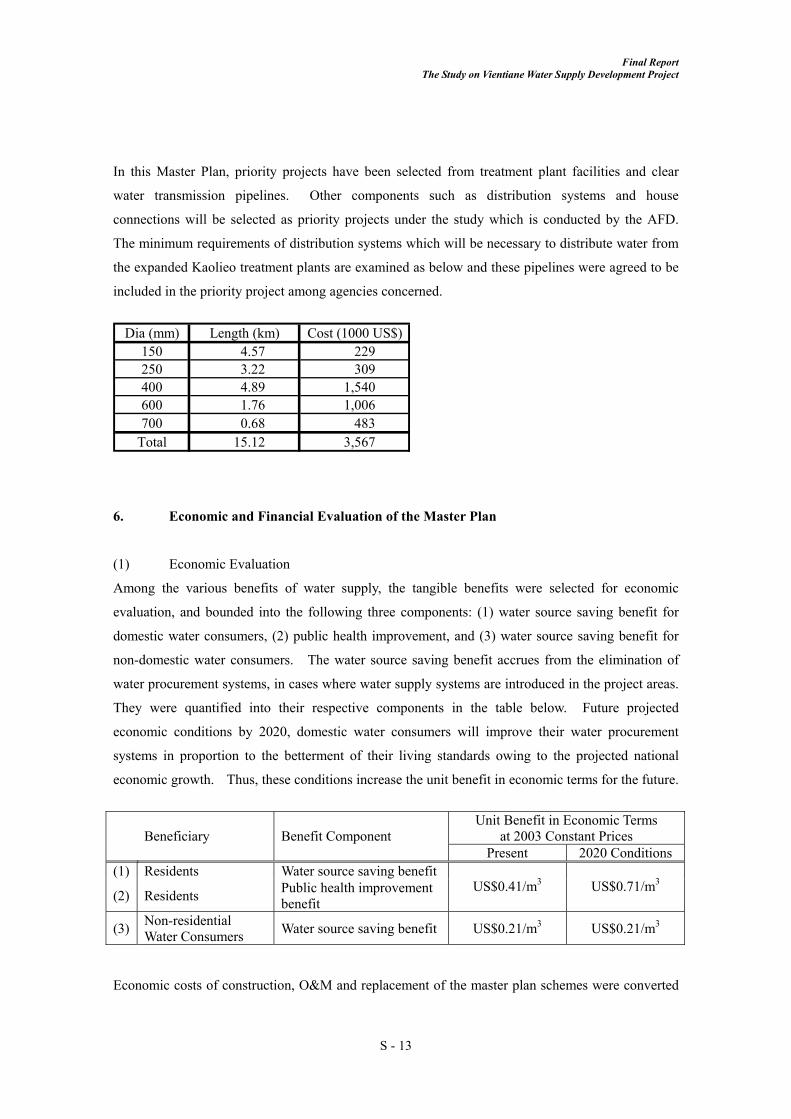
In this Master Plan, priority projects have been selected from treatment plant facilities and clear
water transmission pipelines. Other components such as distribution systems and house
connections will be selected as priority projects under the study which is conducted by the AFD.
The minimum requirements of distribution systems which will be necessary to distribute water from
the expanded Kaolieo treatment plants are examined as below and these pipelines were agreed to be
included in the priority project among agencies concerned.
Dia (mm) Length (km) Cost (1000 US$)
150 4.57 229250 3.22 309400 4.89 1,540600 1.76 1,006700 0.68 483
Total 15.12 3,567
6. Economic and Financial Evaluation of the Master Plan
(1) Economic Evaluation
Among the various benefits of water supply, the tangible benefits were selected for economic
evaluation, and bounded into the following three components: (1) water source saving benefit for
domestic water consumers, (2) public health improvement, and (3) water source saving benefit for
non-domestic water consumers. The water source saving benefit accrues from the elimination of
water procurement systems, in cases where water supply systems are introduced in the project areas.
They were quantified into their respective components in the table below. Future projected
economic conditions by 2020, domestic water consumers will improve their water procurement
systems in proportion to the betterment of their living standards owing to the projected national
economic growth. Thus, these conditions increase the unit benefit in economic terms for the future.
Unit Benefit in Economic Terms
at 2003 Constant Prices
Beneficiary Benefit Component Present 2020 Conditions
(1) Residents Water source saving benefit
(2) Residents Public health improvement benefit
US$0.41/m3 US$0.71/m3
(3) Non-residential Water Consumers Water source saving benefit US$0.21/m3 US$0.21/m3
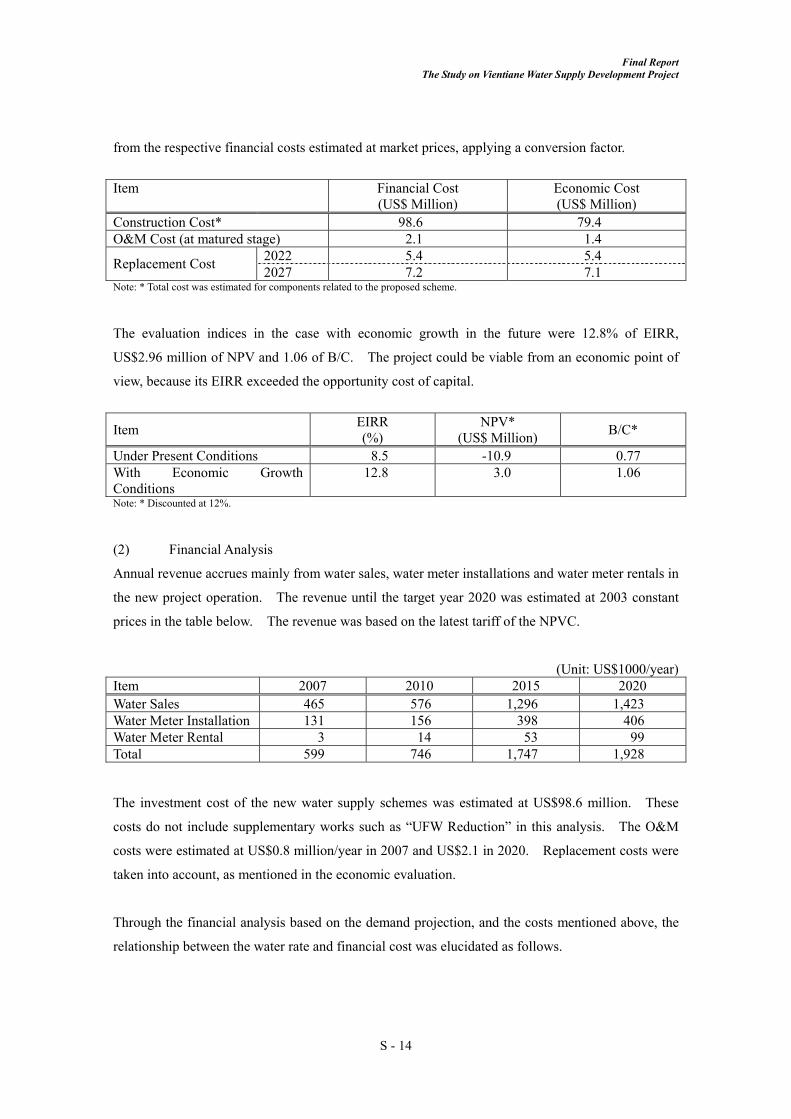
Economic costs of construction, O&M and replacement of the master plan schemes were converted
Final Report The Study on Vientiane Water Supply Development Project
S - 14
from the respective financial costs estimated at market prices, applying a conversion factor.
Item Financial Cost
(US$ Million) Economic Cost (US$ Million)
Construction Cost* 98.6 79.4 O&M Cost (at matured stage) 2.1 1.4
2022 5.4 5.4 Replacement Cost 2027 7.2 7.1 Note: * Total cost was estimated for components related to the proposed scheme.
The evaluation indices in the case with economic growth in the future were 12.8% of EIRR,
US$2.96 million of NPV and 1.06 of B/C. The project could be viable from an economic point of
view, because its EIRR exceeded the opportunity cost of capital.
Item EIRR (%)
NPV* (US$ Million) B/C*
Under Present Conditions 8.5 -10.9 0.77 With Economic Growth Conditions
12.8 3.0 1.06
Note: * Discounted at 12%.
(2) Financial Analysis
Annual revenue accrues mainly from water sales, water meter installations and water meter rentals in
the new project operation. The revenue until the target year 2020 was estimated at 2003 constant
prices in the table below. The revenue was based on the latest tariff of the NPVC.
(Unit: US$1000/year) Item 2007 2010 2015 2020 Water Sales 465 576 1,296 1,423 Water Meter Installation 131 156 398 406 Water Meter Rental 3 14 53 99 Total 599 746 1,747 1,928
The investment cost of the new water supply schemes was estimated at US$98.6 million. These
costs do not include supplementary works such as “UFW Reduction” in this analysis. The O&M
costs were estimated at US$0.8 million/year in 2007 and US$2.1 in 2020. Replacement costs were
taken into account, as mentioned in the economic evaluation.
Through the financial analysis based on the demand projection, and the costs mentioned above, the
relationship between the water rate and financial cost was elucidated as follows.

Final Report The Study on Vientiane Water Supply Development Project
S - 15
Financial Cost Average Water Rate
Case Interest Rate (%) Remark Water Cost (US$/m3)
Ratio to Present Rate
Case 1 0.0% Complete Subsidy 0.19 3.8 times Case 2 3.0% Chinaimo Expansion 0.25 5.0 times Case 3 6.3% International Loan 0.34 6.8 times Case 4 9.9% Private Bank Loan 0.45 9.0 times
According to the surveys listed in the table below, an average water charge for domestic water
consumers ranges between 1.0% and 1.6% of the family income. Affordability-to-pay for water is
considered as not more than 5% of family income, as declared and/or reported by the authorities.
Survey/Report Ratio of Water Charge to Household Income (Expenditure)
LECS2*, 1997/98, NSC 1.0% Household Survey by JICA in March 2003
People Served by NPVC 1.6%
People without Water Supply Service
1.4%
Prime Ministerial Decision
For low-income people Not more than 3%
(37/PM), Sept. 30, 1999 In case of higher water rate Not more than 5% World Bank Report “Investing in Development”, 1985 3% ∼ 5% Note: * “Households of Lao PDR, Lao Expenditure and Consumption Survey”
As shown in the table below, the ratio of water charge to family income in Case 1 was 4.0% which is
within the affordable range of 3% to 5%, so it would be considered that Case 1 is fair for the people.
In Case 2, the rate was 5.4% which is over the range, so it would not be affordable. However, the
water tariff could be made within the affordable range by means of cross subsidization taking
affordability of domestic consumer into consideration.
Water Unit Rate Water ChargePercentage of Water Charge to HH Income Case
(US$/m3) (Kip/m3) (Kip/month) (%)
Affordability*1
Case 1 0.19 2,010 64,000 4.0 〇 Case 2 0.25 2,680 86,000 5.4 △ Case 3 0.34 3,640 117,000 7.3 △ Case 4 0.45 4,820 154,900 9.7 × Note: *1 Signs mean: 〇 - fair, △ – hard, and × - impossible

Final Report The Study on Vientiane Water Supply Development Project
S - 16
(3) Financial Simulation
Through the simulation analysis, the relationship between the water cost and financial cost was
depicted as shown in
the figure on the right.
For instance, if the
average water rate was
cut down to
US$0.225/m3 (10%
down) and the
financial cost went up
to 4.5%/year (around
50% up), the year of
solving accumulated
deficit would be
delayed to 2040 from
2007. In making a management plan for the project, the procurement of financial sources and the
establishment of water rates are important issues.
7. Initial Environmental Examination
Although significant environmental impacts as a result of the implementation of the priority projects
are not foreseen, possible environmental impacts have been listed and screened. A forthcoming
environmental impact assessment will be conducted during the next feasibility study period.
8. Evaluation of the Master Plan and Recommendations
The prepared Master Plan has been evaluated from technical, socio-economic, and environmental
aspects to help confirm the adequacy of the plan. Based on the identified issues of the existing
conditions and development plans, the following recommendations are included in the Master Plan:
(1) Institutional, Organisational, and Legislative Aspects
Expansion of an autonomous, and Legislative Aspects
Promotion of Public Private Partnership
Reconsideration of the roles of Drinking Water Factory
2000
2005
2010
2015
2020
2025
2030
2035
2040
2045
3.0 3.5 4.0 4.5 5.0 5.5
Financial Cost (%/Year)
Yea
r to
Tur
n in
to B
lack
from
Acc
umul
ated
Def
icit
0.200 0.225 0.250
Average water Rate (US$/m3)
Final Report The Study on Vientiane Water Supply Development Project
S - 17
(2) Technical Aspects
Coordination with AFD Study
Reduction of UFW
Monitoring water quality and quantity
Promotion of water conservation
Recruiting and training additional staff
A Feasibility Study and Review of the Master Plan will be required
(3) Managerial Aspects
Maintenance of good customer relations
Strengthening of billing relating works
(4) NPVC Financial Aspects
Improvement of the following issues: (a) expansion of equity instead of liability, (b)
increase of water sales, (c) decrease of water production cost, (d) shortening water
charge collection, and (e) cultivation of versatile workers.
Procurement of financial sources with cheaper financial costs to supply water within
consumers’ affordability-to-pay.
Setting up reasonable water tariffs based on the mutual understanding between water
consumers and the water supplier.
Finding rational water price for motivating water conservation.
(5) Improvement in Public/Customer Relations