expanding access hiv testing phast report
DESCRIPTION
expanding access to HIV testingTRANSCRIPT

!
!
!
001/UK/13(01/MMAR/1018!!!!!!!February!2013! 1! !Final!Report!
!
Gilead UK & Ireland fellowship Programme 2009-11 HIV Testing Findings Review Final Project Report December 2012
Expanding)access:)HIV)testing)in)extended)settings!!
PHAST!review!of!the!Gilead!UK!and!Ireland!Fellowship!
Programme!2009–2011!HIV!testing!projects!
! Final)project)report!February!2013

!
!
!
001/UK/13(01/MMAR/1018!!!!!!!February!2013! 2! !Final!Report!
!!!
The Public Health Action Support Team
The Public Health Action Support Team (PHAST) is a unique public health consultancy with over 100 experienced, expert public health professionals committed to improving the health of the population and reducing inequalities.
PHAST consultants provide evidence based, high quality, outcome-focused public health services and support. Many have worked at high level in the NHS, the Department of Health or in academia. PHAST also has experts in medicine, nursing, pharmacy, health economics, ethics, ecology, psychology, sociology and law.
PHAST has delivered over 360 projects to a wide range of clients such as government departments, Strategic Health Authorities, Primary Care Trusts, Royal Colleges and Charities. Quality assurance and due diligence processes are in place to ensure all associates work to the highest standard. PHAST is a Community Interest Company, which is a type of social enterprise that is committed to using its surpluses and assets for the public good. Social enterprises are social mission driven organisations which trade in goods or services for a social purpose.i
PHAST Project Team Details David Murray BSc MSc FFPH - Director and Consultant in Public Health, PHAST Project design and management, and author ([email protected])
Sarah Seager - Associate Senior Public Health Analyst, PHAST Database design and analysis
Dr Catherine Brogan MBBS MSc FFPH - Chief Executive and Consultant in Public Health, PHAST Quality assurance
!
!
!
i!! Whereas!conventional!businesses!distribute!their!profit!among!shareholders,!in!social!enterprises!the!surplus!goes!towards!one!
or!more!social!aims!which!the!business!has.!PHAST!will!invest!any!surplus!into!development!of!new!products!and!working!with!
charities.!!In!line!with!this!PHAST!directors!and!shareholders!receive!no!dividends!for!their!work!in!managing!PHAST!CIC.!!PHAST!
CIC!is!also!regulated!by!the!CIC!Regulator,!based!at!Companies!House,!to!ensure!it!fulfils!its!Social!Enterprise!objectives!with!a!
mandatory!requirement!for!annual!audit.!!

!
!
!
001/UK/13(01/MMAR/1018!!!!!!!February!2013! 3! !Final!Report!
Contents)))
1.! SUMMARY FINDINGS AND CONCLUSIONS) 5!1.1! INTRODUCTION! 5!1.2! APPROACH! 5!1.3! THE PROJECTS! 6!1.4! OVERALL FINDINGS! 6!1.5! CONCLUSIONS! 7!
2.! INTRODUCTION) 8!2.1! GILEAD AND UK & IRELAND FELLOWSHIP PROGRAMME! 8!2.2! HIV IN THE UK: OVERVIEW! 9!2.3! TESTING POLICY! 10!2.4! SUMMING-UP! 13!
3.! AIM AND OBJECTIVES) 14!3.1! AIM! 14!3.2! OBJECTIVES! 14!
4.! METHODS) 14!4.1! CONCEPTUAL FRAMEWORK! 14!4.2! DATA SOURCES! 14!4.3! LIMITATIONS TO SCOPE! 15!4.4! DATA COLLATION! 15!4.5! ANALYSIS! 16!
5.! RESULTS AND FINDINGS) 17!5.1! OVERVIEW OF REPORTING! 17!5.2! FINDINGS – PROJECT CHARACTERISTICS! 19!5.3! FINDINGS – PROJECT OUTCOMES: TESTING! 29!5.4! FINDINGS – PROJECT OUTCOMES: NON-TESTING! 36!
6.! DISCUSSION) 36!6.1! INTRODUCTION! 36!6.2! IMPACT AND SAMPLE! 36!6.3! LIMITATIONS! 37!6.4! FEASIBILITY! 37!6.5! ACCEPTABILITY! 38!6.6! EFFECTIVENESS! 39!6.7! COMMENTARY ON INDIVIDUAL SETTINGS AND PROJECTS! 39!6.8! OVERVIEW! 40!

!
!
!
001/UK/13(01/MMAR/1018!!!!!!!February!2013! 4! !Final!Report!
7.! CONCLUSION) 41!APPENDIX 1 – DATABASE DATA-ENTRY PAGES) 43!APPENDIX 2 – DATABASE DATA FIELD DEFINITIONS AND SOURCES) 47!APPENDIX 3– PROJECT LOCATION CHARACTERISTICS) 52!APPENDIX 4 – QUALITATIVE FEEDBACK FINDINGS) 53!APPENDIX 5 – PROJECT OUTCOMES: NON-TESTING PROJECTS SUMMARY (N=6)) 58!APPENDIX 6 – REFERENCES) 60!!

!
!
!
001/UK/13(01/MMAR/1018!!!!!!!February!2013! 5! !Final!Report!
!
1. Summary findings and conclusions 1.1 Introduction • In 2008, Gilead Sciences UK & Ireland revised its grants process and created the
United Kingdom and Ireland Fellowship Programme (UKIFP) to issue medical educational grants through a transparent and competitive process in four therapy areas (HIV / hepatitis B virus / cystic fibrosis and invasive fungal disease).
• The aims of the UKIFP are: o Generate evidence and promote best practice in the delivery of patient-
centred care through innovative and reproducible models. o Use evidence from the programme to shape public health policy and to
generate new studies or joint ventures. • Between 2009 and 2011 the programme funded 39 HIV projects on HIV testing
outside traditional settings to improve individual and public health benefits of HIV early diagnosis. This is in line with research evidence and UK and international public health guidance, which recommend the expansion of HIV testing in non traditional settings, but provide less guidance or evidence on delivery.
• Gilead commissioned the Public Health Action Support Team (PHAST), an independent public health consultancy, to review the collective outcome findings of the 2009 and 2011 UKIFP HIV projects. The review focused on the impact, acceptability, feasibility and effectiveness of the projects.
1.2 Approach • PHAST reviewed slide presentations, abstracts and posters of projects presented by
UKIFP grant-holders at three annual Best Practice Sharing Events (BPSE). • In contrast to the studies reported on in the Health Protection Agency ‘Time to Test’
publication, which incorporated more systematic on-going data collection arrangements, reporting of the UKIFP projects was limited to information presented at annual BPSE. This is likely to contribute to some of the inconsistencies between the reports.
• The adequacy and completeness of the available reporting from the BPSE presentations varied substantially between projects. While this could be explained by diversity and varied resourcing of projects, there was often incomplete or inconsistent reporting of:
o The timing and duration of time data referred to. o Testing criteria and service delivery model. o Definitions and reporting of test eligibility, test offer, and accepting versus
actually conducting an HIV test. o Type of HIV test used (Point of care bloodspot test, point of care saliva test,
serology). o Clear definitions of screen-positive versus confirmed-positive or new
diagnoses.

!
!
!
001/UK/13(01/MMAR/1018!!!!!!!February!2013! 6! !Final!Report!
1.3 The Projects • About 40% of projects were in inner London, with most of the rest in other larger
cities. Two-thirds were in highly deprived areas. Two ‘Time to Test’ projects were continued through the UKIFP.
• There was substantial diversity of settings, target populations, and testing approaches/indications:
o 20 projects in hospital settings, mostly in A&E departments, with a few in outpatient clinics or inpatient settings.
o 8 projects in primary care settings. o 15 projects in community settings including: community health clinics, mental
health teams, home sampling, gay community events, and gay saunas. o Projects targeted both general populations in high prevalence areas and high
risk groups. o Projects adopted indications for testing for the provision of both population
screening and diagnostic testing in patients with clinical indicator conditions.
!
1.4 Overall Findings )• Impact: Based on 1 year data, UKIFP projects enabled the offer of at least 25,987
HIV tests, delivered 13,771 tests and identified 103 screen-positive individuals. An audit by Gilead UK&I in 2012 reported that 71% of projects funded in 2009 and 2010 were still operational, and of these 64% reported continuation through NHS funding and 9% through third party funding.
• Feasibility: Most projects did not report the number of people eligible for testing. Among those that did, 37% of those eligible were offered a test, with projects’ rates varying between 10% and 100%. This is similar to the rates reported in the Health Protection Agency’s ‘Time to Test’ report.
• Acceptability: Forty-four percent of those offered a test accepted it, much lower than the 70% reported in the ‘Time to Test’ report. The limited UKIFP patient and participant survey findings available suggest that eligible populations generally find the offer of HIV testing acceptable in non-traditional settings although test acceptance may be low due to risk perception of individuals
• Effectiveness: Based on data from 82% of testing projects, UKIFP projects achieved an overall screen-positive rate of 0.7% (range: 0% to 9.1%). Screen positivity was high: 0.8% (range: 0% to 6.6%) in hospital settings, 0.7% (range: 0% to 9.1%) in community settings and 0.6% (range: 0% to 1.3%) in primary care.
!
!
!
001/UK/13(01/MMAR/1018!!!!!!!February!2013! 7! !Final!Report!
1.5 Conclusions • This report documents the outcomes of the largest collection of HIV testing projects
outside traditional settings in the UK, and complements the findings of ‘Time to Test’. The reliability of overall conclusions from this summary review of 2009 and 2011 UKIFP projects, based on BPSE presentations, is substantially reduced by the limitations of absence of standardised reporting formats across projects. Furthermore, the methodological differences in review approaches mean the findings of this report cannot be directly compared to ‘Time to Test’, but rather should be seen as additional evidence.
• That said, the UKIFP HIV testing projects represent a rich and substantial sample of experience in HIV testing outside traditional settings in the UK and several projects have been published in peer reviewed journals. Further, the results from the sustainability audit provides some encouraging evidence for sustainability of UKIFP projects, evidence not available from ‘Time to Test’ projects
• UKIFP projects enabled a substantial number of HIV tests and identification of screen positives. Apart from potentially having saved individual lives, the findings make a further helpful contribution to the UK knowledge base on what works and what does not.
• Overall HIV test offer rates were low, similar to those reported in the ‘Time to Test’ report. This limits the impact of the initiatives, but the presentations provide too little detail and analysis to enable an exploration of reasons for the low offer rates.
• Overall HIV test acceptance rates were also low, and substantially lower than reported in ‘Time to Test’. Again, the reasons for this cannot not be established from the available information.
• The UKIFP screen positive rates are substantially above the cost effectiveness threshold suggested in the United States (1 new diagnosed case per 1000 tests). Due to methodological differences and in the absence of consistent case definitions across projects in BPSE presentations however results cannot be directly compared to the ‘Time to Test’ report.
• Nonetheless, UKIFP’s HIV testing projects findings appear to lend some measure of further support to the effectiveness of HIV testing in extended settings. A more standardised approach to reporting and evaluation of projects of findings may have significantly increased the utility and impact of UKIFP projects.

!
!
!
001/UK/13(01/MMAR/1018!!!!!!!February!2013! 8! !Final!Report!
2. Introduction 2.1 Gilead and UK & Ireland Fellowship Programme
Gilead Sciences is a biopharmaceutical company that discovers, develops and commercialises innovative therapeutics in areas of unmet medical need, including HIV. In 2009 Gilead Sciences established the United Kingdom and Ireland Fellowship Programme (UKIFP). Full details are available on the UKIFP website (http://www.ukifellowshipprogramme.com).
The stated aims of the UKIFP HIV component include:
1. To generate and promote best practice in the delivery of patient-centred care through innovative and reproducible models in four clinical areas, including HIV.
2. To find undiagnosed HIV patients in the UK and Ireland, across a wide variety of clinical and non-clinical settings.
3. To use evidence generated from the programme to shape public health policy (either at local or national level), or to generate new studies or joint ventures to shape clinical care pathways.
A wide range of projects, diverse in term of approach, setting, tests, and population/client group focus have been supported; and as a consequence the projects offer a potentially rich contribution to the emerging evidence base on HIV testing in extended settings.
Over three annual cycles (2009-2011) the UKIFP has invested a total of £1.6 million, supporting 39 projects examining extended HIV testing (2009 n=9, 2010 n=19, 2011 n=11).
Gilead commissioned PHAST to undertake an independent review of the UKIFP’s HIV testing project outcomes. The review aims to add learning above and beyond consideration of project progress, delivery, continuity, and perceived achievements, consistent with the aims of the UKIFP outlined above and in light of the wider policy context.

!
!
!
001/UK/13(01/MMAR/1018!!!!!!!February!2013! 9! !Final!Report!
!
2.2 HIV in the UK: Overview1 The following section provides a summary overview of recent UK trends in HIV epidemiology, diagnosis, treatment and outcomes, providing the context to the UKIFP projects.
• Over 90,000 people are estimated to be living with HIV, and it is expected that this will increase to over 100,000 in the near future.
• Around half of people living with HIV are heterosexual, and around two-thirds of these are African-born.
• Slightly less than half of people living with HIV are men who have sex with men (MSM).
• The estimated prevalence of HIV in the UK is similar to other western European countries, such as Ireland, the Netherlands, and Germany, and lower than eastern and southern European countries, such as Latvia, Portugal, and Spain.
• HIV prevalence amongst different groups and locations in the UK varies substantially, and is highest in MSM in London and in black-African women.
• In recent years, the year-on-year trend of decline in the total number of new diagnoses has stopped. While the number of new heterosexual diagnoses has fallen, the number among MSM has reached an all-time high.
• Around half of new HIV diagnoses are believed to have been contracted heterosexually (two-third of these overseas), and just under half through sex between men.
• The rate of diagnosis at a late stage of HIV infection (CD4 cell count <350cells/cm3 within three months of diagnosis) has fallen, probably due in part to the routine offer of HIV testing in sexual health and antenatal clinics. However, the rate is still considered high, adding support for expanded HIV testing beyond traditional settings.
• Late HIV diagnosis is more common among heterosexual people, people of black-African and black-Caribbean origins, and older people.
• The numbers of people receiving treatment for HIV continues to rise, and over two-fifths receive treatment in London.
• The introduction of antiretroviral therapy in the mid-1990s has vastly reduced the number of AIDS diagnoses, and improved life expectancy for people with HIV. Levels of diagnosis leading to the initiation of treatment are high.
• There are over 600 AIDS deaths each year, and two-thirds of these occur in people diagnosed late.

!
!
!
001/UK/13(01/MMAR/1018!!!!!!!February!2013! 10! !Final!Report!
2.3 Testing policy 2.3.1 Screening and testing
Strictly speaking, the various ‘testing’ policies and guidelines discussed below mainly concern ‘screening’ of populations at various levels and types of risk. The exceptions are those focussing on clinical indicator conditions, which could be more accurately described as ‘case finding’, or in some cases ‘diagnostic’ testing based on clear clinical symptoms.
2.3.2 Rationale
The rationale for wider HIV testing is driven by UK and international evidence of the:
• The individual health and survival benefits of earlier diagnosis and treatment
• The public health benefits of preventing onward transmission
• The economic benefits of reduced health and other care costs, and increased wider economic productivity.
2.3.3 Evolution of policy
HIV testing has been routinely offered in antenatal clinics since 1999 and in sexually transmitted infection (STI) clinics since 2001.
Over 1.5 million tests are undertaken annually in these ‘traditional’ settings2. In 2010, HIV testing in antenatal clinics attained a national uptake of 96% and reported 1.65 positive tests per 10003. As a result of the introduction of testing, it is estimated that the proportion of women who remain undiagnosed after delivery has fallen from 27% in 2000 to 12% in 2009, and the proportion of newborns at risk of HIV infection who become infected has fallen from 8% to less than 2%2. Also, the median CD4 cell count at HIV diagnosis of women detected through antenatal screening has been found to be higher than among other women and MSM diagnosed with HIV4.
The success of this universal testing approach in a general population has demonstrated the acceptability and successful ‘normalisation’ of HIV testing in those not necessarily at higher risk in UK populations.
Similarly, the acceptability of HIV testing in people attending STI clinics is also high, with 78% (2010) accepting the offer of a test2.
However, studies suggest that overall, a substantial proportion of deaths in adults with HIV are attributable to late diagnosis5; and that previous opportunities to diagnose ‘late presenting’ patients are often missed6.
In addition, the most recent prevention trial (HOPN 052) evidence from the United States has strengthened the case for wider testing from a public health and cost effectiveness perspective7 8 9 10.
The Health Protection Agency (HPA) cites evidence from studies in the USA and France suggesting wider testing in high prevalence areas is cost effective, and UK modelling indicating that earlier diagnosis could be cost saving11. Also, the US Centers for Disease Control (CDC) HIV testing guidelines describe HIV testing as cost effective at a threshold of 1 new diagnosed case per 1000 tests performed based on two studies12 13.
The following table summarises the evolution of UK policy recommendations on extended HIV testing.

!
!
!
001/UK/13(01/MMAR/1018!!!!!!!February!2013! 11! !Final!Report!
Table 1 – Summary of key policy conclusions and recommendations on opt-out testing in extended settings
Source)(and)methods)) Implementation)recommendations)
CMO!and!CNO!letters.!
200714!
(audit/analysis/research)!!
• Clinical! indicator! conditions! (CICs)! presenting! in! non(HIV!
related!hospital!medical!specialties!
• Opportunistic!in!primary!care!in!areas!of!high!prevalence!
British!HIV!Association!
(BHIVA)/British!
Association!of!Sexual!
Health!and!HIV!(BASHH)/!
British!Infection!Society!
(BIS).!UK!National!HIV!
Testing!Guidelines.!
200815!
(opinion!and!review!of!
US!evidence!and!
guidelines)!!
• In!LAs/PCTs!with!high!prevalence!(though!further!evaluation!of!
feasibility!and!acceptability!required):!
o All!people!registering!with!a!GP!
o All!medical!admissions!
• Universal:!
o Termination!of!pregnancy!services!
o Drug!dependency!programmes!
o Healthcare!services!for!those!diagnosed!with:!TB,!HBV,!HCV,!and!
lymphoma!
Health!Protection!
Agency.!Time!to!test.!
20112!!
(Evaluation!of!9!
Department!of!Health!
R&D!pilot!projects)!
• Hospital!medical!admissions!in!high!prevalence!areas!(as!a!priority)!
• General!practice!(exact!model!of!delivery!unclear!and!needs!
further!investigation!(!not!all!practices!undertake!new!patient!
checks)!
NICE!guideline:!Black!
African!communities!and!
others.!201116!!
(Evidence!review)!(2011)!
• High!prevalence!areas:!
o Primary!care!registrations!
o General!medical!admissions!!
o Anyone!having!a!blood!test!
NICE!guideline:!MSM.!
201117!
(Evidence!review)!
• Primary!care!–!men:!
o High!prevalence!areas!
o Areas!with!large!MSM!community!
o MSM!
o CICs!
• Secondary!and!emergency!care!admissions!(!men:!
o High!prevalence!areas!
o MSM!
o CICs!
• MSM!community!out(reach!using!POCT!!
House!of!Lords!Select! • Beginning!in!high!prevalence!areas:!

!
!
!
001/UK/13(01/MMAR/1018!!!!!!!February!2013! 12! !Final!Report!
Committee.!201118! o Primary!care!registrations!
o General!and!acute!medical!admissions!!
• Medical!specialties!associated!with!higher!rates!of!HIV!–!e.g.!TB,!
HBV,!HCV,!and!lymphoma!
• Community!settings!(unspecified)!
Government!response!to!
House!of!Lords!Select!
Committee!report.!
201119!
!
• Confirmed!support!for!the!recommendations!of!the!House!of!
Lords!select!committee.!
• Requested!the!National!Screening!Committee!to!consider!the!
evidence!on!extended!testing!in!areas!of!high!prevalence.!
• Extended!HIV!testing!to!be!covered!in!the!forthcoming!
national!sexual!health!strategy.!
HPA.!Commissioning!
Expanded!HIV!Testing!in!
High!Prevalence!Areas.!
2012!11!
!
Provides!implementation!evidence(base!to!support!commissioners!in!
expanding! routine! HIV! testing! in! general! medical! admissions! and!
primary!care!in!high!prevalence!areas.!
DH.!Public!Health!
Outcomes!Framework.!
201220!
Indicators!of!essential!actions!taken!to!protect!the!public’s!health,!
includes:!‘the!proportion!of!persons!presenting!with!HIV!at!a!late!
stage!of!infection!(CD4<350)’!
Halve It Coalition
The Halve It Coalition, established in 2010, is a coalition of national experts determined to tackle the continued public health challenges posed by HIV. Its goals are to:
• Halve the proportion of people diagnosed late with HIV (CD4 count <350mm3) by 2015.
• Halve the proportion of people living with undiagnosed HIV by 2015.
Its membership includes the following organisations: African Health Policy Network (AHPN), All-Party Parliamentary Group on HIV and AIDS, British Association for Sexual Health and HIV (BASHH), British HIV Association (BHIVA), Gilead Sciences Ltd, HIV Pharmacy Association, Medical Foundation for AIDS and Sexual Health, National AIDS Trust (NAT), National HIV Nurses Association, Royal College of General Practitioners – Sex, Drugs and HIV Group, and Terrence Higgins Trust. Please see http://www.halveit.org.uk/ for more information.

!
!
!
001/UK/13(01/MMAR/1018!!!!!!!February!2013! 13! !Final!Report!
2.4 Summing-up Despite helpful international experience, development of UK national guidelines and the recent adoption of a public health indicator for late HIV diagnosis, the evidence base and policy context for extended HIV testing in the UK has been slow to mature. In addition, the wider evidence on the clinical, public health and cost effectiveness case for earlier HIV treatment also continues to strengthen.
Despite some consistent evidence suggesting the acceptability, feasibility and effectiveness of wider testing in some health care settings and populations, a number of the policies and publications cited in the table above have highlighted the limitations and priorities for further research, monitoring and evaluation.
These relate to the extent and strength of such evidence in relation factors including:
• Specific settings
• Specific population groups
• Eligibility criteria and testing protocols
• Test type
• Clinician beliefs, behaviour and practice
• Effective operational models of test delivery in hospital A&E and in-patient settings
• Effective and sustainable models of extended testing in non-health care community settings.
In the meantime, anecdotal and empirical21 evidence suggests that extended testing is not widespread and that uncertainty remains over the optimal approach in important clinical settings.
It may be that the adoption of the late HIV diagnosis indicator may further encourage implementation. However, referral of the topic to the National Screening Committee, despite the existence of NICE guidance, could be seen as an indication of uncertainty, unless the question they are being asked to review is clarified.
In the meantime, as recognised in the research recommendations made in reports above, we need to add to the evidence-base on the topic and to use evidence to inform policy making and practice.
Consequently the UKIFP HIV testing projects presents a valuable opportunity to contribute learning from a rich sample of locally designed and managed implementation projects, complementing earlier learning from the DH R&D projects reported in Time to Test.
!

!
!
!
001/UK/13(01/MMAR/1018!!!!!!!February!2013! 14! !Final!Report!
3. Aim and objectives In this context, Gilead commissioned PHAST to deliver a project with the following aims and objectives.
3.1 Aim
Provide an independent expert review and advice on analysis and communication of the findings of the UKIFP HIV testing projects (2009-2011) to contribute to the UK evidence base of HIV testing outside specialist settings.
3.2 Objectives
1. Undertake the collation and independent expert review of the available findings of the Gilead UKIFP HIV testing projects (2009-2011), in particular in relation to the following testing outcomes:
• Acceptability (test uptake, participant survey results)
• Feasibility (implementation, delivery, quality, sustainability, staff survey results)
• Effectiveness (screen positives/confirmed cases/new cases)
2. Advise Gilead on the appropriate external communication and use of the findings as evidence.
!
4. Methods 4.1 Conceptual framework To deliver the stated aims and objectives, the project has been conceptualised, designed and delivered as a retrospective evaluation of the outcomes reported by projects within the programme.
4.2 Data sources Data for the evaluation were extracted from a series of slide presentations, abstracts and posters submitted by grant-holders to three annual UKIFP Best Practice Events.
While these were of similar format, no universal prospective evaluation arrangements or guidelines were put in place for UKIFP projects. Consequently local arrangements for the generation of monitoring and evaluation were put in place by individual project grant-holders.

!
!
!
001/UK/13(01/MMAR/1018!!!!!!!February!2013! 15! !Final!Report!
Fuller details of the projects (i.e. background, design, delivery, and outcome data) can be found on the UKIFP website (http://www.ukifellowshipprogramme.com/hiv-section/hiv).
Some projects have also disseminated findings as conference presentations and posters, and as scientific publications. Gilead supplied a small number of conference posters and publications relating to UKIFP projects, and PHAST undertook a literature search to find others. Additional relevant data was extracted from these sources in a small minority of cases. Initial findings of an internal ‘project sustainability audit’ was also made available22.
!
4.3 Limitations to scope The evaluation was limited to the scope outlined above, with only evidence from these data sources considered.
Consequently, the review excludes detailed consideration of the following important themes and issues in HIV testing:
• Costs and cost effectiveness of HIV testing
• Details of and adherence to clinical best practice standards in delivering HIV testing
• HIV testing technology/method (i.e. efficacy of alternative test methods and test technologies)
• Timing of testing/repeat testing
• Consideration of processes for the commissioning of UKIFP projects or their implementation by grant-holders, such as application processes, selection, monitoring and management arrangements, and clinical or research governance.
!
!
4.4 Data collation 4.4.1 Database
A relational database was designed in Microsoft Access to collate and categorise project characteristics and outcomes. The database data entry sheet structure is shown in Appendix 1 and data descriptions and sources in Appendix 2.
4.4.2 Data extraction
Data was extracted, categorised and entered into the database by a single experienced reviewer to ensure internal consistency.
!

!
!
!
001/UK/13(01/MMAR/1018!!!!!!!February!2013! 16! !Final!Report!
4.5 Analysis The analysis was designed to examine the following outcomes and associated measures.
Outcome) Measures)(and)definitions))
Impact! • Volume!of!tests!offered!(No!of!tests!offered)!
• Volume!of!tests!delivered!(No!of!tests!undertaken)!
Feasibility! • Screening!test!offer!rate!(%!of!population!eligible!offered!test)!
• Review!of!staff/volunteer!qualitative!survey!results!
Acceptability! • Screening!test!uptake!rate!(%!of!population!offered!test!in!which!test!
conducted)!
• Review!of!participant!qualitative!survey!results!
Effectiveness! • Screen!positive!rate!(%!of!screen!positive!tests!results!in!population!
receiving!test)!
• Confirmed!positive!case!rate!(%!of!confirmed!positive!cases!in!
population!receiving!screening!test)!
• New!confirmed!positive!case!rate!(%!of!confirmed!and!new!positive!
cases!in!population!receiving!screening!test)!
!
!
!
!
!
!
!
!
!
!
!
!
!
!
!
!
001/UK/13(01/MMAR/1018!!!!!!!February!2013! 17! !Final!Report!
5. Results and Findings 5.1 Overview of reporting 5.1.1 Timeliness and reporting
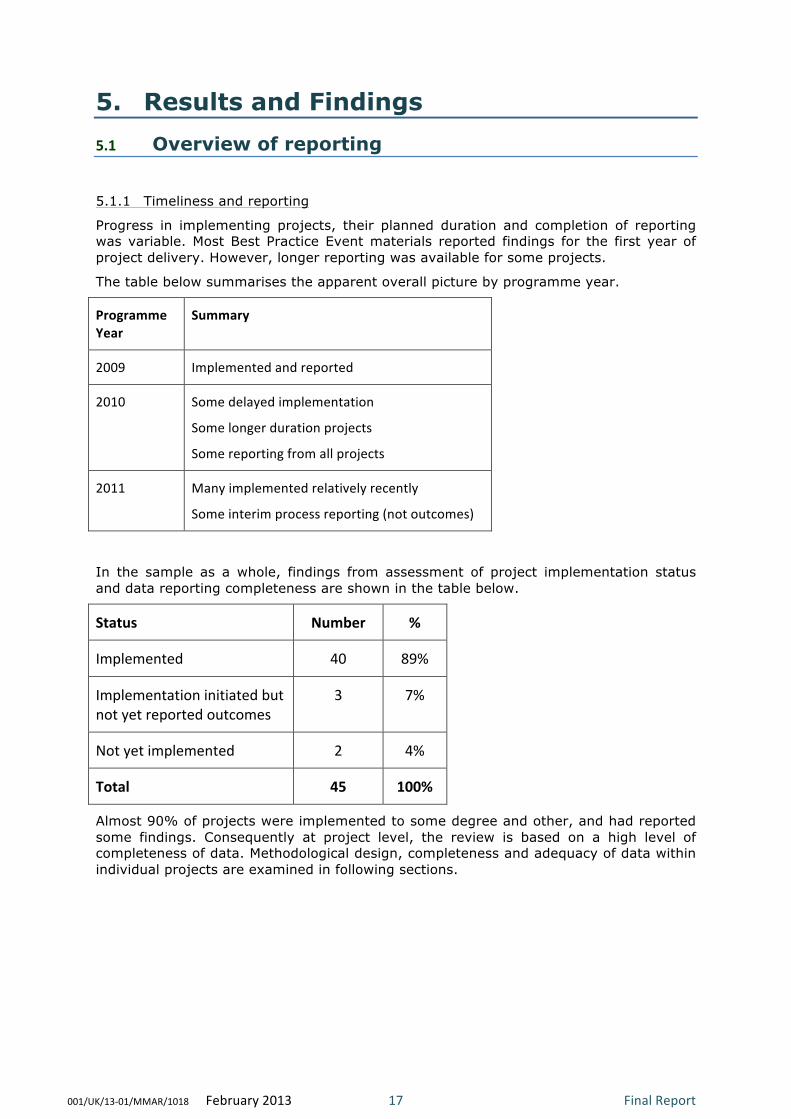
Progress in implementing projects, their planned duration and completion of reporting was variable. Most Best Practice Event materials reported findings for the first year of project delivery. However, longer reporting was available for some projects.
The table below summarises the apparent overall picture by programme year.
Programme)Year)
Summary)
2009! Implemented!and!reported!
2010! Some!delayed!implementation!
Some!longer!duration!projects!
Some!reporting!from!all!projects!
2011! Many!implemented!relatively!recently!
Some!interim!process!reporting!(not!outcomes)!
In the sample as a whole, findings from assessment of project implementation status and data reporting completeness are shown in the table below.
Status) Number) %)
Implemented! 40! 89%!
Implementation!initiated!but!
not!yet!reported!outcomes!
3! 7%!
Not!yet!implemented! 2! 4%!
Total) 45) 100%)
Almost 90% of projects were implemented to some degree and other, and had reported some findings. Consequently at project level, the review is based on a high level of completeness of data. Methodological design, completeness and adequacy of data within individual projects are examined in following sections.
!
!
!
!
!

!
!
!
001/UK/13(01/MMAR/1018!!!!!!!February!2013! 18! !Final!Report!
5.1.2 Design
Given that no universal prospective evaluation arrangements were put in place for UKIFP projects, their methodological design and scope varied widely. Where methods were characterised or explicitly stated, many were described as or could be characterised as prospective audits.
Given that the projects were conceptualised, managed and funded as individual service innovations, as opposed to a coordinated programme of research projects, these pragmatic observational evaluation methods were applied with their acknowledged limitations in terms of depth and power, and potential for bias, in contrast to more powerful and valid longer term and resource intensive research designs. Only a small minority of projects stated that any research governance arrangements had been put in place.
However, many attempted (to variable degrees) to consider the feasibility, acceptability and effectiveness if their projects. A number of projects evaluated these with surveys of participant and staff opinion on the project’s approach to testing. However, often samples were small and methodological details sparse.
5.1.3 Data content and completeness
As a consequence of the findings in relation to design above, the content, timeliness, completeness and quality of the data reporting available from individual projects also varies.
Some reporting was mainly by narrative process description, with limited data to substantiate findings. Even where methods were stated and fuller documentation of reporting was provided, only partial data were provided, and as a result calculations and analyses could not be verified.
Some projects acknowledged that the project was on-going and stated that their submitted data was interim.
Data on key measures was often inadequately defined or incomplete. For example, reporting often neglected to make clear:
• Time periods of implementation/study
• Type of test used
• Clear eligibility criteria
• Full description of testing/service delivery model
• Clear distinctions between the numbers of people eligible for a test, offered a test, accepting a test, and receiving a test.
• Clear distinctions between screen positive/confirmed positive/new diagnoses
However, despite these limitations, the evaluation provides a valuable opportunity to examine a substantial rich sample of UK based HIV testing projects in ‘real world’ situations, beyond more controlled research study environments, and as a result inform future policy-making and practice.
!

!
!
!
001/UK/13(01/MMAR/1018!!!!!!!February!2013! 19! !Final!Report!
5.2 Findings – Project Characteristics 5.2.1 Project sample
The primary unit of analysis was at project level, or where appropriate and necessary to take account of heterogeneity, sub-projects or selected project arms. Six sub-projects were identified for analysis within the original 39 projects. Consequently the total analytic sample was of 45 project units.
Summarised details of project characteristics are shown in the following tables by hospital (table A), primary care (table B) and community settings (table C), including details of the project host organisation, location, grant-holders, setting, type, grant year, implementation status, number of HIV tests conducted and diagnosed HIV prevalence in the host local authority.
)

!
!
!
001/UK/13(01/MMAR/1018!!!!!!!February!2013! 20! !Final!Report!
Table A- Projects in hospital settings (n=20) Project)N
umbe
r)
Subp
roject)Num
ber)
Host)Organisation) Grant)Holder(s)) Setting) Project)
Type)Grant)Year)
2010)diagnosed)
HIV)prevalence)per)1000)population)in)host)LA)
No)of)Tests)
2! !! Royal!Victoria!Infirmary,!
Newcastle!
Ong!&!Ellis! AAU/MAU/EAU! Testing! 2009! 1.62! 396!
3! !! University!College!London!
Hospital!
Burns! AAU/MAU/EAU! Testing! 2009! 7.44! 107!
4! i! Royal!Liverpool!Hospital,!
Liverpool!
Taegtmeyer! Outpatient:!GUM!Clinic! Testing! 2009! 1.6! 405!
10! !! Royal!Free!Hospital,!London! Rodger! Outpatient:!TOP! Testing! 2010! 7.44! 170!
11! !! Homerton!University!Hospital,!
London!
!Anderson! Outpatient:!Other!
(partners!at!ante(natal!
clinics)!
Testing! 2010! 8.5! 430!
18! i! Newham!University!Hospital,!
London!
Noble! A&E! Testing! 2010! 8.6! 91!
18! ii! Royal!London!Hospital! Orkin! AAU/MAU/EAU! Testing! 2010! 5.96! 289!
20! !! University!Hospitals!Birmingham! Manavi! AAU/MAU/EAU! Testing! 2010! 2.2! 6!
21! i! Chelsea!and!Westminster!
Hospital,!London!
Rayment!&!
Sulivan!
A&E! Testing! 2010! 8.61! 1358!
21! ii! St!Mary’s!Hospital,!London! Rayment!&!
Sulivan!
A&E! Testing! 2010! 7.29! 465!
21! iii! Charing!Cross!Hospital,!London! Rayment!&!
Sulivan!
A&E! Testing! 2010! 8.12! NR!
24! !! St!George’s!Hospital,!London! Rosenvinge! Outpatient:!Colposcopy! Testing! 2010! 4.9! 105!
25! !! Homerton!University!Hospital,!
London!
Creighton! Outpatient:!Colposcopy! Testing! 2010! 8.5! 518!
26! !! North!Middlesex!University!
Hospital,!London!
Schwenk! AAU/MAU/EAU! IT!only! 2010! 4.15! NA!
28! !! Berkshire!East!Community!Health!
Services,!Slough!
Dawson! Outpatient:!Other! Testing! 2010! 3.43! NR!
29! !! Chelsea!and!Westminster!
Hospital/!!!!!!!!!!!!!!!!!!!!!!!!!!!!!!!!!!!!!!!!!!!!!!!!!!!!!!
Imperial!College!Healthcare!
Trusts,!London!
Newsom(
Davis!
Inpatient:!Other! Testing! 2011! 7.29! NR!
30! !! University!Hospitals!Birmingham! Manavi! Outpatient:!Other! Testing! 2011! 2.2! NR!
32! ii! Homerton!University!Hospital,!
London!
Coyne! Inpatient:!Mental!Health! Testing! 2011! 8.5! 9!
33! !! Croydon!University!Hospital! Phillips! AAU/MAU/EAU! Testing! 2011! 4.75! 1390!
34! !! Royal!Victoria!Infirmary,!
Newcastle!
Schmid! Outpatient:!Colposcopy! Testing! 2011 1.62! NR!
!
!
!
!
!
!

!
!
!
001/UK/13(01/MMAR/1018!!!!!!!February!2013! 21! !Final!Report!
Table B – Projects in primary care settings (n=8) Project)N
umbe
r)
Subp
roject)Num
ber)
Host)Organisation) Grant)Holder(s)) Setting) Project)Type) Grant)Year)
2010)diagnosed)
HIV)prevalence)per)1000)
population)in)host)LA)
No)of)Tests)
1! !! Barts!&!London!NHS!Trust/!!!!!!!!!!!!!!!!!!!!!!!!!!!!!!!!!!!!!!!!!!!!!!!!!!!!!!!!!!!!!!!!!!!!!!!!!!!
Medical!School,!London!
Estcourt!&!
Hutchinson!
Staff! Training!only! 2009! 5.96! NA!
6! !! Blackpool,!Fylde!&!Wyre!
Hospitals!NHS!Trust/!!!!!!!!!!!!!!!!!!!!!!!!!!!!!!!!!!!!!!
Elizabeth!Street!GP!Surgery!
Blackpool/!!!!!!!!!!!!!!!!!!!!!!!!!!!!!!!!!!!!!!!!!!!!!!!!!!!!!!!!!!!
Royal!Preston!Hospital!
Wasef! All!Appointments! Testing! 2009! 3.62! 100!
8! !! Nottingham!University/!!!!!!!!!!!!!!!!!!!!!!!!!!!!!!!!!!!!!!!!!!!!!!!!!!!!!!!!!!!!!!!!!!!!!!!!!!!!!
Nottingham!Hospitals!
Trust/!!!!!!!!!!!!!!!!!!!!!!!!!!!!!!!!!!!!!!!!!!!!!!!!!!!!!!!
Nottingham!City!PCT!
Neal! Staff! Training!only! 2009! 2.33! NA!
12! !! Manchester!PCT! Griffin! New!Registrants! Testing! 2010! 5.23! 303!
15! !! Newham!University!
Teaching!Hospital/!!!!!!!!!!!!!!!!!!!!!!!!!!!!!!!!!!!!!!!!!!!!!!!!!!!
Newham!PCT/Positive!East,!
London!
Fakoya!&!
O'Connell!
Others! Testing! 2010! 8.6! 118!
16! i! NHS!SE!London! Ruf!&!Peck! New!Registrants! Testing! 2010! 13.9! 905!
16! ii! NHS!SE!London! Ruf!&!Peck! New!Registrants! Testing! 2010! 12.6! 3229!
23! !! St!George's!Healthcare!NHS!
Trust/!!!!!!!!!!!!!!!!!!!!!!!!!!!!!!!!!!!!!!!!!!!!!!!!!!!!!!!!!!!!!!!
Falcon!Road!Medical!
Centre,!London!
Rosenvinge! CIC! Audit!only! 2010! 4.9! NA!
NA!=!Not!Applicable,!NR!=!Not!Recorded!

!
!
!
001/UK/13(01/MMAR/1018!!!!!!!February!2013! 22! !Final!Report!
Table C – Projects in community settings (n=17)
Project)N
umbe
r)
Subp
roject)Num
ber)
Host)Organisation) Grant)Holder(s)) Setting) Project)Type) Grant)
Year)
2010)diagnosed)
HIV)prevalence)per)1000)population)in)host)LA)
No)of)Tests)
4! ii! Royal!Liverpool!Hospital,!Liverpool! Taegtmeyer! Clinic! Testing! 2009! 1.6! 328!
5! !! Birmingham!Heartlands!Hospital! Taylor!&!
Barrett!
Venue! Testing! 2009! 2.2! 129!
7*! !! Chelsea!and!Westminster!NHS!Foundation!
Trust,!London!
Rossi!&!
Natha!
Clinic! Promotional! 2009! 7.29! 18112!
9! !! Dorset!County!Hospital,!Weymouth! Hyett! Prison! Promotional!
only!
2009! 0.86! NA!
13! !! Sheffield!Teaching!Hospitals!NHS!Foundation!
Trust!
Bowman! Out(reach! Testing! 2010! 1.46! 11!
14! !! Belfast!Health!&!Social!Care!Trust/!!!!!!!!!!!!!!!!!!!!!!!!!!!!!!!!!!!!!!!!!!!!!!!!!!!!
Royal!Victoria!Hospital!
Emerson! Venue! Testing! 2010! N/A! 354!
17! !! Guys!and!St!Thomas!NHS!Trust/!!!!!!!!!!!!!!!!!!!!!!!!!!!!!!!!!!!!!!!!!!!!!!!!!!!!!!!!!
Kings!College!London!
Fox! Clinic! Testing! 2010! 13.9! 35!
19! !! Whittall!Street!Clinic,!Birmingham! Manavi! Event! Testing! 2010! 2.2! 398!
22! !! The!Michael!Wood!Centre!(!Leicester!Aids!
Support!Service!
Musonda! Mobile! Testing! 2010! 3.38! 430!
27! !! Chelsea!and!Westminster!NHS!Foundation!
Trust,!London!
McMilan!&!
Jones!
Out(reach! Testing! 2010! 7.29! 163!
31! !! Sheffield!Teaching!Hospitals!NHS!Foundation!
Trust!
Bell! Home! Testing! 2011! 1.46! 36!
32! i! Homerton!University!Hospital,!London! Coyne! CMHT! Testing! 2011! 8.5! 53!
35! !! NHS!Greater!Manchester/Sexual!Health!
Network!
Scanlon! Home! Testing! 2011! 5.23! 1375!
36! !! Brook!Manchester! Williams! Clinic! Testing! 2011! 5.23! NR!
37! !! Barking,!Havering!&!Redbridge!University!
Hospitals!Trust,!!!!!!!!!!!Essex!
Macfarlane! Clinic! Testing! 2011! 5.3! 12!
38! !! Cambridge!Community!Services! Edwards! Venue! Testing! 2011! 1.25! 1!
39! !! Chelsea!and!Westminster!NHS!Foundation!
Trust,!London!
Natha! Mobile! Testing! 2011! 7.29! 152!
NA!=!Not!Applicable,!NR!=!Not!Recorded!
*Project)7:)Despite)UKIFP’s)contribution)to)this)large)service)initiative,)it)would)not)be)appropriate)to)attribute)its)impact)to)UKIFP)&)data)has)been)excluded)from)the)analyses))5.2.2 Project location characteristics
Project locations were analysed in terms of region, London Boroughs, Office for National Statistics (ONS) area classification, Index of Multiple Deprivation score and diagnosed HIV prevalence for the host area.
The findings are summarised below and fuller details are available in Appendix 3.
)
)Region

!
!
!
001/UK/13(01/MMAR/1018!!!!!!!February!2013! 23! !Final!Report!
Projects were distributed across most standard English Regions. However, most were concentrated in London (53%), the North West (Blackpool, Liverpool, Manchester) (16%), and the West Midlands (Birmingham) (9%). One project was located in Northern Ireland. No projects were undertaken in Scotland or Wales.
)
)
))
)

!
!
!
001/UK/13(01/MMAR/1018!!!!!!!February!2013! 24! !Final!Report!
London Boroughs
In London, projects were distributed across 13 Boroughs, with the highest concentrations in Westminster (n=5) and Hackney (n=4).
!
!
ONS Area Classification
The overwhelming majority of projects were located in areas classified by ONS as Cities and Services (40%) and London Central (38%).
Index of Multiple Deprivation (IMD)
A high proportion of projects were in deprived areas, with 67% of projects located in local authorities with IMD scores in the highest quintile for England.
Diagnosed HIV prevalence
As shown in Tables A, B and C earlier, the majority of projects (80%) were in local authority areas with levels of diagnosed HIV prevalence classified by the Health Protection Agency (HPA) as ‘high’ (>2/1000).
!
!

!
!
!
001/UK/13(01/MMAR/1018!!!!!!!February!2013! 25! !Final!Report!
5.2.2 Project type and setting
The figure below sets-out the project sample in terms of project type (i.e. testing and non-testing) and testing setting (i.e. hospital, primary care, community settings).
Of the 45 projects, 39 (87%) involved the provision of testing, and six (13%) involved activities in support of testing, including training, promotion, audit, and IT development. The outcome findings of ‘testing’ and ‘non-testing’ projects are considered separately in the following sections.
As shown in the figure below, given the heterogeneity of project types and settings, a three-level hierarchy or sub-sample structure was adopted to characterise projects adequately.

!
!
!
001/UK/13(01/MMAR/1018!!!!!!!February!2013! 26! !Final!Report!
Figure i – Analysis sample and structure (all projects)

!
!
!
001/UK/13(01/MMAR/1018!!!!!!!February!2013! 27! !Final!Report!
In addition, project sub-group sample sizes for testing projects alone are shown terms of setting in the table below.!
Setting:)SubVgroup)1) Setting:)SubVgroup)2) Setting:)SubVgroup)3)
)) N) %) )) N) %) )) N) %)
Hospital! 19! 48.7%!
A&E! 4! 10.3%! NA! !(! !(!
AAU/MAU/EAU! 5! 12.8%! NA! !(! !(!
Inpatient!Other! 2! 5.1%!Mental!Health! 1! 4.0%!
Other/Oncology! 1! 4.0%!
Outpatient! 8! 20.5%!
Colposcopy! 3! 12.0%!
GUM!clinic! 1! 4.0%!
Other!! 3! 12.0%!
TOP! 1! 4.0%!
Primary!Care! 5! 12.8%!New!Patients! 3! 8.0%! NA! !(! !(!
Other! 2! 5.0%! NA! !(! !(!
Community!
settings!15! 38.5%!
Healthcare! 5! 12.8%!Clinic! 4! 16.0%!
CMHT! 1! 4.0%!
Non(healthcare! 10! 25.6%!
Event(s)! 2! 8.0%!
Home! 2! 8.0%!
Out(reach! 3! 12.0%!
Venue(s)! 3! 12.0%!
Totals! 39! !! !! 39! !! !! 25! !!
5.2.3 Project study population
In addition, through the combination of their setting, approach, and eligibility criteria, the sample of testing projects also included a diverse range of populations, in terms of risk, age, gender, ethnicity, and clinical characteristics.
Consequently, as shown in the table below, a classification was developed and projects assigned accordingly.
Category! Description! Projects!
! ) N) %)High!prevalence!area! General!population!access!in!high!prevalence!area! 19! 48.7%!
High!prevalence!group! Mixed/multiple!or!other!high!risk!groups! 9! 23.1%!
Men!who!have!sex!with!men! Project!focus!on!MSM! 4! 10.3%!
Clinical!indicator!conditions! Eligibility!based!on!CICs!! 3! 7.7%!
Black!African! Project!focus!on!black!African!community! 2! 5.1%!
Low!risk/general! General!population!access!in!low!prevalence!area! 2! 5.1%!
Total) ) 39) 100%)
The majority of projects (48.7%) focussed on the general population in a high risk geographic area. A substantial proportion of projects (23.1%) focussed on multiple high prevalence or high risk groups, including MSM, black African communities, and prisoners. Other projects focussed exclusively on particular high risk groups: MSM (10.3%) and black African communities (5.1%). A small proportion of projects (7.7%) also focussed on testing patients with clinical indicator conditions, and could be considered as ‘case finding’ or ‘diagnostic’ testing, rather than true population screening.
!
!
!
001/UK/13(01/MMAR/1018!!!!!!!February!2013! 28! !Final!Report!
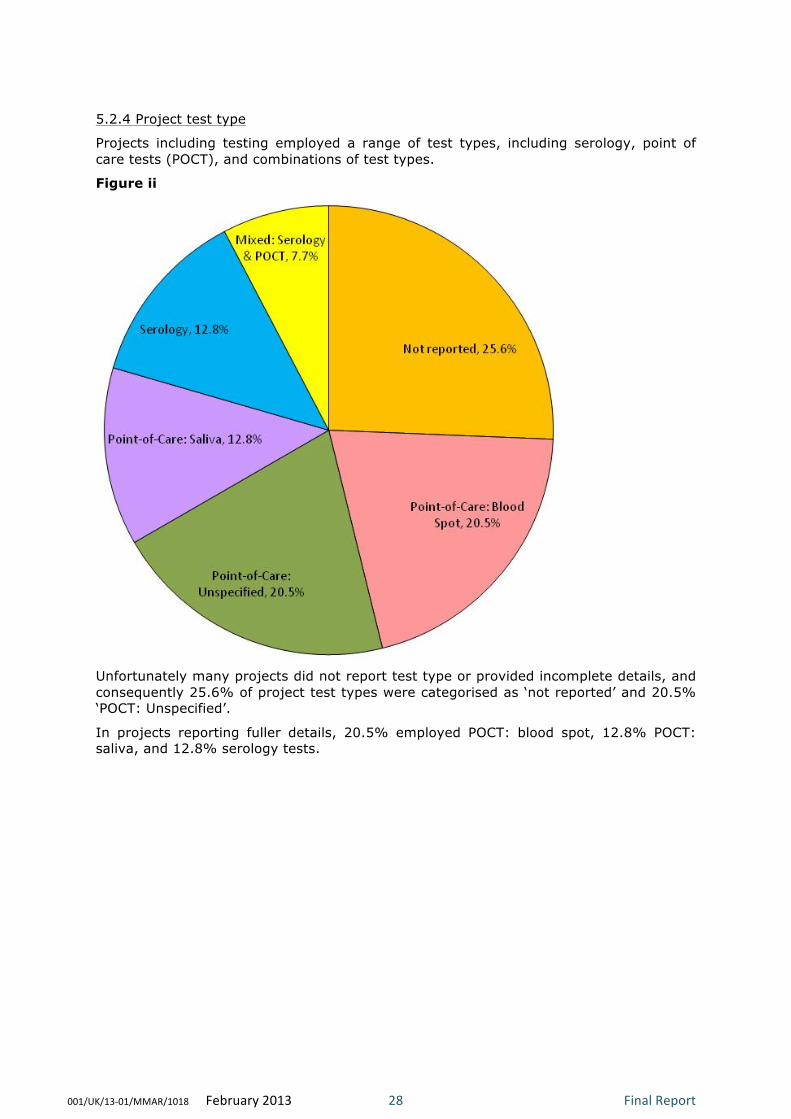
5.2.4 Project test type
Projects including testing employed a range of test types, including serology, point of care tests (POCT), and combinations of test types.
Figure ii
!
Unfortunately many projects did not report test type or provided incomplete details, and consequently 25.6% of project test types were categorised as ‘not reported’ and 20.5% ‘POCT: Unspecified’.
In projects reporting fuller details, 20.5% employed POCT: blood spot, 12.8% POCT: saliva, and 12.8% serology tests.

!
!
!
001/UK/13(01/MMAR/1018!!!!!!!February!2013! 29! !Final!Report!
!
5.3 Findings – Project Outcomes: Testing
As outlined earlier in section 4 on methods, where feasible from the extraction of available data, aggregate analyses of key outcome measures was undertaken.
Full results are shown in tables D to H over the following pages, and detailed consideration of the findings in relation to individual outcome measures follows.
Initially, data completeness is considered immediately below.
5.3.1 Data completeness
There was substantial un-reported data across the key outcome measures, as summarised in the table below.
Measure) No)of)projects)with)))))))))))))))))unVreported)data)
%)of)all)(N=39))
Eligible!population! 23! 59.0%!
No!tests!offered! 16! 41.0%!
No!tests!conducted! 5! 12.8%!
No!screen!positive!tests! 4! 10.3%!
No!confirmed!positive!tests! NA! NA!
No!confirmed!new!positive!
cases!
NA! NA!
Around 60% of projects did not report the true total population eligible for testing in their model of delivery, and 41% did not report the number of tests they were able to offer. Lower proportions of missing data were apparent in reporting of the actual numbers of tests conducted (13%) and in numbers of screen positive test results (10%).
In the case of data on the numbers of confirmed positive tests and new diagnoses, a high proportion of projects failed to provide these data or it was unclear what true result represented a classification as a ‘positive test’ results in their project findings. Consequently, attempts to analyse these variables were abandoned, and screen-positive test results adopted as the main measure of project effectiveness.
Similarly, limitations of completeness of data at setting sub-sample levels 2 and 3 meant that it was not feasible to reliably undertake testing outcome analyses at these levels. Consequently this was limited to level 1 sub-sample settings: hospital, primary care, and community settings.
Because of missing data, the tables below include unadjusted and adjusted totals and sub-totals. Unadjusted figures include all available data. Adjusted figures included only data from projects where both necessary parameters are available for key outcome rate/% calculations shown. Sample sizes for unadjusted (n) and adjusted (N) figures are also show.
)
)

!
!
!
001/UK/13(01/MMAR/1018!!!!!!!February!2013! 30! !Final!Report!
Table D – Testing project outcome results: Hospital settings
Feasibility Acceptability Effectiveness
1- Eligible vs Offered 1 - Offered vs Conducted 1 - Conducted vs Screen positive
Project)N
umbe
r)
Subp
roject)Num
ber)
Host)Organisation) Setting) Eligible)Pop
ulation)
Num
ber)O
ffered)
%)Offe
red)
Num
ber)O
ffered)
Num
ber)o
f)Tests)Con
ducted
)
%)Uptake)
Num
ber)o
f)Tests)Con
ducted
)
Num
ber)o
f)Positive)Screening)
Tests)
%)Screene
d)Po
sitiv
e)
Rate)per)1000)
2! !! Royal!Victoria!Infirmary,!Newcastle! AAU/MAU/EA
U!
3753! 478! 12.7%! 478! 396! 82.8%! 396! 2! 0.5%! 5.1!
3! !! University!College!London!Hospital! AAU/MAU/EA
U!
587! 238! 40.5%! 238! 107! 45.0%! 107! 2! 1.9%! 18.7!
4! I! Royal!Liverpool!Hospital,!Liverpool! Outpatient:!!!!!!!!!!!!!!!!!
GUM!Clinic!
NR! NR! !! NR! 405! !! 405! 12! 3.0%! 29.6!
10! !! Royal!Free!Hospital,!London! Outpatient:!!!!!!!!
TOP!
NR! 202! !! 202! 170! 84.2%! 170! 2! 1.2%! 11.8!
11! !! Homerton!University!Hospital,!!!!
London!
Outpatient:!!!!!
Other!
NR! 1243! !! 1243! 430! 34.6%! 430! 0! 0.0%! 0!!
18! I! Newham!University!Hospital,!!!!!!
London!
A&E! NR! 91! !! 91! 91! 100%! 91! 6! 6.6%! 65.9!
18! ii! The!Royal!London!Hospital! AAU/MAU/EA
U!
1866! NR! !! NR! 289! !! 289! 2! 0.7%! 6.9!
20! !! University!Hospitals!Birmingham! AAU/MAU/EA
U!
10! 6! 60.0%! 6! 6! 100%! 6! 0! ! !!
21! I! Chelsea!&!Westminster!Hospital,!!!!!!!!
London!
A&E! 21750! 2271! 10.4%! 2271! 1358! 59.8%! 1358! 5! 0.4%! 3.7!
21! ii! St!Mary’s!Hospital,!London! A&E! 15569! NR! !! NR! 465! !! 465! 4! 0.9%! 8.6!
21! iii! Charing!Cross!Hospital,!London! A&E! !NR! NR!! !! NR!! NR! !! NR!! NR! ! !!
24! !! St!George’s!Hospital,!London! Outpatient:!!!!!!
Colposcopy!
1078! 794! 73.7%! 794! 105! 13.2%! 105! 0! 0.0%! 0!!
25! !! Homerton!University!Hospital,!!!!
London!
Outpatient:!!!!!
Colposcopy!
687! 687! 100%! 687! 518! 75.4%! 518! 1! 0.2%! 1.9!
28! !! Berkshire!East!Community!!!!!!!!!!!!!!!!!!!
Health!Services!
Outpatient:!!!!!
Other!
NR! NR! !! NR! NR! !! NR! NR! ! !!
29! !! Chelsea!&Westminster!Hospital!
/Imperial!College!Healthcare!,!
London!
Inpatient:!!!!!!!!
Other!
NR! NR! !! NR! NR! !! NR! NR! ! !!
30! !! University!Hospitals!Birmingham! Outpatient:!!!!!
Other!
NR! NR! !! NR! NR! !! NR! NR! ! !!
32! ii! Homerton!University!Hospital,!
London!
Inpatient:!!!!!!!!!!!!!!!!
Mental!
Health!
NR! 33! !! 33! 9! 27.3%! 9! 0! 0.0%! 0!!
33! !! Croydon!University!Hospital! AAU/MAU/EA
U!
3709! 3709! 100%! 3709! 1390! 37.5%! 1390! 8! 0.6%! 5.8!
34! !! Royal!Victoria!Infirmary,!Newcastle! Outpatient:!!!!!
Colposcopy!
NR! NR! ! NR! NR! !! NR! NR! ! !!
)) )) HOSPITAL)SUBVTOTAL)(n=19)) ) 49,009) 9,752) ) 9,752) 5,739) ) 5,739) 44) ) )
) ) ADJUSTED*)HOSPITAL)SUBVTOTAL) ) 31,574) 8,183) 25.9%) 9,752) 4,580) 47.0%) 5,739) 44) 0.8%) 7.7)
! ! Numbers!in!adjusted!calculations! ! ! ! N=7! ! ! N=11! ! ! N=13! N=13!
• Adjusted!calculations!include!only!projects!where!both!necessary!figures!are!available!for!the!rate/percentage!calculation!!

!
!
!
001/UK/13(01/MMAR/1018!!!!!!!February!2013! 31! !Final!Report!
Table E – Testing project outcome results: Primary care settings
!! !! !! ) Feasibility) Acceptability) Effectiveness)
!! !! !! ) 1V)Eligible)vs)Offered) 1)V)Offered)vs)Conducted) 1)V)Conducted)vs)Screen)+ve)
Project)N
umbe
r)
Subp
roject)Num
ber)
Host)Organisation) Setting) El
igible)Pop
ulation)
Num
ber)O
ffered
)
%)Offered
)
Num
ber)O
ffered
)
Num
ber)o
f)Tests)
Cond
ucted)
%)Uptake)
Num
ber)o
f)Tests)
Cond
ucted)
Num
ber)o
f)Positive)
Screen
ing)Tests)
%)Scree
ned)Po
sitiv
e)
Rate)per)100
0)
6! ! Blackpool,!Fylde!&!
Wyre!!!Hospitals!
NHS!Trust/!
Elizabeth!Street!
GP!
All!
Appointments!
475! 475! 100%! 475! 100! 21.1%! 100! 0! 0.0%! 0!
12! !! Manchester!
PCT!
New!
Registrants!
NR! 457! !! 457! 303! 66.3%! 303! 4! 1.3%! 13.2!
15! !! Newham!
University!
Teaching!
Hospital/!
NewhamPCT/!!!
Positive!East!
Others! NR! NR! !! NR! 118! !! 118! 1! 0.8%! 8.5!
16! I! NHS!SE!London! New!
Registrants!
6275! 4925! 78.5%! 4925! 905! 18.4%! 905! 11! 1.2%! 12.2!
16! ii! NHS!SE!London! New!
Registrants!
16241! 6405! 39.4%! 6405! 3229! 50.4%! 3229! 12! 0.4%! 3.7!
)) )) PRIMARY)CARE)SUBV
TOTAL)(n=5))
) 22,991) 12,262) ) 12,262) 4,655) ) 4,655) 28) ) )
) ) ADJUSTED*)PRIMARY)CARE)SUBV
TOTAL)
) 22,991) 11,805) 51.3%) 12,262) 4,537) 37%) 4,655) 28) 0.6%) 6.0)
! ! Numbers!in!adjusted!
calculations!
! ! ! N=3! ! ! N=4! ! ! N=5! N=5!
*!Adjusted!calculations!include!only!projects!where!both!necessary!figures!are!available!for!the!rate/percentage!calculation!

!
!
!
001/UK/13(01/MMAR/1018!!!!!!!February!2013! 32! !Final!Report!
Table F – Testing project outcome results: Community settings (* Excludes Project 7)
!! !! !!) Feasibility) Acceptability) Effectiveness)
!! !! !!) 1V)Eligible)vs)Offered) 1)V)Offered)vs)Conducted! 1)–)Conducted)vs)Screen)+ve!
Project)N
umbe
r)
Subp
roject)Num
ber)
Host)Organisation) Setting) Eligible)Pop
ulation)
Num
ber)O
ffered)
%)Offe
red)
Num
ber)O
ffered)
Num
ber)o
f)Tests)Con
ducted
)
%)Uptake)
Num
ber)o
f)Tests)Con
ducted
)
Num
ber)o
f)Positive)Screening)
Tests)
%)Screene
d)Po
sitiv
e)
Rate)per)1000)
4! ii! Royal!Liverpool!Hospital,!
Liverpool!
Clinic! NR! NR! !! NR! 328! !! 328! 2! 0.6%! 6.1!
5! !! Birmingham!Heartlands!
Hospital!
Venue! 129! 129! 100%! 129! 129! 100%! 129! 6! 4.7%! 46.5!
13! !! Sheffield!Teaching!Hospitals!
NHS!!!!Foundation!Trust!
Out(reach! NR! NR! !! NR! 11! !! 11! 1! 9.1%! 90.9!
14! ! Belfast!Health!&!Social!Care!
Trust!&!!!!!!!!!Royal!Victoria!
Hospital,!Belfast!
Venue! NR! NR! ! NR! 354! ! 354! 5! 1.4%! 14.1!
17! !! Guys!and!St!Thomas!NHS!
Trust,!!!!!!!!!!!!!!!!!Kings!College!
London!
Clinic! NR! NR! !! NR! 35! !! 35! 0! 0%! !0.0!
19! !! Whittall!Street!Clinic,!
Birmingham!
Event! NR! 406! !! 406! 398! 98.0%! 398! 6! 1.5%! 15.1!
22! !! The!Michael!Wood!Centre!(!
Leicester!!!!!!!!!Aids!Support!
Service!
Event! NR! NR! !! NR! 430! !! 430! 4! 0.9%! 9.3!
27! !! Chelsea!and!Westminster!
NHS!!!!!!!!!Foundation!Trust!
Out(reach! NR! 411! !! 411! 163! 39.7%! 163! 0! 0%! 0.0!!
31! !! Sheffield!Teaching!Hospitals!
NHS!!!!Foundation!Trust!
Home! NR! 46! !! 46! 36! 78.3%! 36! 3! 8.3%! 83.3!
32! i! Homerton!University!
Hospital,!London!
CMHT! 79! 79! 100%! 79! 53! 67.1%! 53! 0! 0%! 0.0!!
35! !! NHS!Greater!Manchester/!!!!!!!!!!!!!!!!!!!!!!!!!!
Sexual!Health!Network!
Home! NR! 2750! !! 2750! 1375! 50.0%! 1375! 2! 0.1%! 1.5!
36! !! Brook!Manchester! Clinic! NR! NR! !! NR! NR! !! NR! NR! ! !!
37! !! Barking!,!Havering!&!
Redbridge!!!!!!!!!University!
Hospitals!Trust,!Essex!
Clinic! NR! NR! !! NR! 12! !! 12! 0! 0%! 0.0!!
38! !! Cambridge!Community!
Services!
Venue! NR! NR! !! NR! 1! !! 1! 0! 0%! 0.0!!
39! !! Chelsea!and!Westminster!
NHS!!!!!!!!!Foundation!Trust!
Out(reach! 152! 152! 100%! 152! 152! 100%! 152! 2! 1.3%! 13.2!
COMMUNITY)SUBVTOTAL)(n=15)) ) 360) 3,973) ) 3,973) 3,477) ) 3,477) 31) ) )
ADJUSTED*)COMMUNITY)SUBVTOTAL)(N)) ) 360) 360) 100%)
N=3)
3,973) 2,306) 58%)
N=7)
3,477) 31) 0.9%)
N=14)
8.9)
N=14)

!
!
!
001/UK/13(01/MMAR/1018!!!!!!!February!2013! 33! !Final!Report!
Table G – Testing project outcome results: All projects and all settings*
!! Feasibility) Acceptability) Effectiveness)
!! 1V)Eligible)vs)Offered) 1)V)Offered)vs)Conducted! 1)–)Conducted)vs)Screen)+ve!
) Eligible)Pop
ulation)
Num
ber)O
ffered
)
%)Offered
)
Num
ber)O
ffered
)
Num
ber)o
f)Tests)
Cond
ucted)
%)Uptake)
Num
ber)o
f)Tests)
Cond
ucted)
Num
ber)o
f)Positive)
Screen
ing)Tests)
%)Scree
ned)Po
sitiv
e)
Rate)per)100
0)
GRAND)TOTAL)(N=39))
71,885) 25,512) ) 25,987) 13,871) ) 13,871) 103) ) )
ADJUSTED**)GRAND)TOTAL)
54,925) 20,348) 37%) 25,987) 11,423) 44%) 13,871) 103) 0.7%) 7.4)
Numbers!in!adjusted!
calculations!
! ! N=13! ! ! N=22! ! ! N=32! N=32!
*)Excludes)Project)7)
**)Adjusted)calculations)include)only)projects)where)both)necessary)figures)are)available)for)the)rate/percentage)calculation)
5.3.2 Impact
The table below provides an overview of the total volumes of tests offered and delivered by the programme by main setting type. This gives insight into the overall capacity impact of the UKIFP programme.
Setting) Total)Tests)Offered) Total)Tests)Delivered)
N) %)of)all) N) %)of)all)
Hospital! 9752! 37.5%! 5739! 41.7%!
Primary!care! 12262! 47.2%! 4555! 33.1%!
Community!settings! 3973! 15.3%! 3477! 25.2%!
All) 25987) 100%) 13771) 100%)
Overall, the UKIFP programme enabled the offer of at least 25,987 tests, and delivered 13,771 tests. The majority of test offers were made in a primary care setting (47.2%), and the majority of tests delivered in hospital settings (41.7%).
Also, insight into the on-going impact of the UKIFP projects has been provided by a recent Gilead commissioned audit22 of project sustainability, operational status, and related publications. The audit reported a 66% response rate from HIV projects and drew the following conclusions:
• 71% (17/24) of projects funded in 2009 and 2010 remained operational, and of these 64% reported continuation through NHS funding.
• 57% of project leads considered their project achieved the expected results and 93% regarded the project a success.
!
!
!
001/UK/13(01/MMAR/1018!!!!!!!February!2013! 34! !Final!Report!
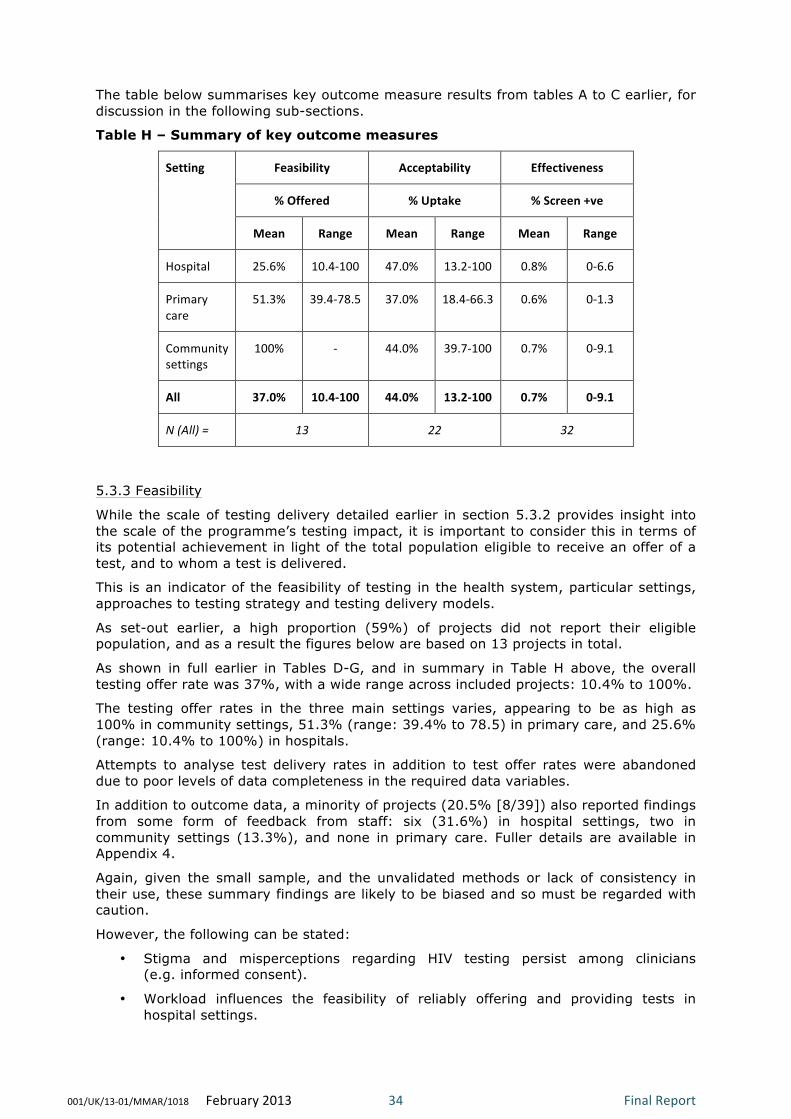
The table below summarises key outcome measure results from tables A to C earlier, for discussion in the following sub-sections.
Table H – Summary of key outcome measures
Setting) Feasibility) Acceptability) Effectiveness)
%)Offered) %)Uptake) %)Screen)+ve)
Mean) Range) Mean) Range) Mean) Range)
Hospital! 25.6%! 10.4(100! 47.0%! 13.2(100! 0.8%! 0(6.6!
Primary!
care!
51.3%! 39.4(78.5! 37.0%! 18.4(66.3! 0.6%! 0(1.3!
Community!
settings!
100%! (! 44.0%! 39.7(100! 0.7%! 0(9.1!
All) 37.0%) 10.4V100) 44.0%) 13.2V100) 0.7%) 0V9.1)
N)(All))=)) 13) 22) 32)
!
5.3.3 Feasibility
While the scale of testing delivery detailed earlier in section 5.3.2 provides insight into the scale of the programme’s testing impact, it is important to consider this in terms of its potential achievement in light of the total population eligible to receive an offer of a test, and to whom a test is delivered.
This is an indicator of the feasibility of testing in the health system, particular settings, approaches to testing strategy and testing delivery models.
As set-out earlier, a high proportion (59%) of projects did not report their eligible population, and as a result the figures below are based on 13 projects in total.
As shown in full earlier in Tables D-G, and in summary in Table H above, the overall testing offer rate was 37%, with a wide range across included projects: 10.4% to 100%.
The testing offer rates in the three main settings varies, appearing to be as high as 100% in community settings, 51.3% (range: 39.4% to 78.5) in primary care, and 25.6% (range: 10.4% to 100%) in hospitals.
Attempts to analyse test delivery rates in addition to test offer rates were abandoned due to poor levels of data completeness in the required data variables.
In addition to outcome data, a minority of projects (20.5% [8/39]) also reported findings from some form of feedback from staff: six (31.6%) in hospital settings, two in community settings (13.3%), and none in primary care. Fuller details are available in Appendix 4.
Again, given the small sample, and the unvalidated methods or lack of consistency in their use, these summary findings are likely to be biased and so must be regarded with caution.
However, the following can be stated:
• Stigma and misperceptions regarding HIV testing persist among clinicians (e.g. informed consent).
• Workload influences the feasibility of reliably offering and providing tests in hospital settings.

!
!
!
001/UK/13(01/MMAR/1018!!!!!!!February!2013! 35! !Final!Report!
• Barriers remain in the implementation of reliable and effective clinical protocols and hospital support services, including phlebotomy.
• The added value of testing patients with CICs in A&E may be low if they are likely to be admitted.
!
5.3.4 Acceptability
The acceptability of a testing offer is a key influence on uptake, and consequently programme strategy success. This is especially the case in programmes providing screening tests in otherwise healthy individuals, as opposed to diagnostic testing in individuals with clinical signs of illness or at particular risk.
Insight into acceptability was examined through consideration of test uptake and the findings are set-out below.
As set-out earlier, unfortunately a moderately high proportion (41%) of projects did not report the number of tests offered, and consequently the results below are based on 15 projects in total.
As shown in full earlier in Tables D-G, and in summary in Table H above, the overall test uptake rate was 44%, with a wide range across included projects: 13.2% to 100%.
The uptake rates in the three main settings ranged from the highest of 47% (range: 13.2% to 100%) in hospitals, 44% (range: 39.7% to 100%) in community settings, and 37% (range: 18.4% to 66.3) in primary care.
In addition, a minority of projects (35.9% {14/39]) reported some form of feedback from patients/participants: five (26.3%) from hospital settings, 3 primary care (60.0%), and six community settings (37.5%). Fuller details are available in Appendix 4.
Given the relatively small sample and the unvalidated or lack of consistent methods or lack of consistency in their use, these summary findings considerable risk of bias and so must be regarded with caution.
However, the following can be stated:
• Testing in extended settings reaches new untested populations
• A common reason for declining testing was low perceived individual risk of HIV
• HIV testing is considered appropriate in various extended settings
• HIV POCT testing in non-health care community settings is considered convenient compared to traditional settings
• Some minority ethnic groups may find testing less acceptable than the general population.
!
5.3.5 Effectiveness
Given the ultimate aims of testing, effectiveness is ideally measured in terms of the number of new confirmed HIV cases detected. Unfortunately, as discussed earlier, the substantial amounts of missing data allowing classification of positive tests as confirmed and new, means that only screen-positive tests results were consider reliable and considered fully below.
As shown in full earlier in Tables D-G, and in summary in Table H earlier, based on the available data (n=32), 103 screen positive cases were identified, yielding an overall screen positive rate of 0.7% [7.4/1000], with a relatively large range across projects: 0% to 9.1%.

!
!
!
001/UK/13(01/MMAR/1018!!!!!!!February!2013! 36! !Final!Report!
The screen positive rates in the three main settings were relatively consistent: 0.8% [7.7/1000] (range: 0% to 6.6%) (No. of cases: 44) in hospitals, 0.6% [6/1000] (range: 0% to 1.3%) (No. of cases: 28) in primary care, and 0.7% [8.9/1000] (range: 0% to 9.1%) (No. of cases: 31) in community settings.
5.4 Findings – Project Outcomes: Non-testing As shown in Appendix 5, six projects in the UKIFP 2009-2011 supported the development of HIV testing but did not directly provide testing. One was in the hospital setting, three in primary care, and two in community settings.
Two of the projects focussed on training and education, one on IT software, one on audit of the feasibility of testing in primary care, one on the promotion of an expanded and re-launched testing service, and one on the promotion of testing locally in the prison service.
Further detail on the impact of the projects is shown in Appendix 5
6. Discussion 6.1 Introduction Chapter 2 of the report set-out the UK context including the following:
• A summary of current trends in HIV and its treatment
• The rationale for HIV testing (i.e. population screening) in extended settings
• A summary and chronology of UK HIV testing (i.e. population screening) policy
• A cursory examination of the evidence base on wider population HIV testing in extended settings.
Chapters 3 to 5 have described the background, aims, characteristics and outcome findings of the UKIFP HIV testing projects 2009-2011.
This chapter seeks to consider the findings of our review of the UKIFP outcomes, and discuss them in light of the wider context, in order to examine their additional contribution to the current evidence base influencing HIV testing policy.
6.2 Impact and sample The UKIFP HIV testing projects covered 39 projects or 45 sub-projects, offering at least 25,987 tests, delivering 13,771 tests, and identifying 103 screen positive cases. They provide a substantial addition to the overall available study sample on the topic in the UK context, and represent a sizeable contribution to the provision of UK HIV testing capacity.
No specific efforts were made to select or coordinate UKIFP projects for research purposes, though despite this the resulting rich project mix is reasonably favourable, providing a helpful opportunistic observational study sample.
Geographically the project sample is dispersed, though skewed to London locations, however this may be considered appropriate given the distribution of HIV and some important risk groups.
The main HIV testing settings (i.e. hospital, primary care, community settings) are well represented in both the project and study population samples, and beyond this, in the setting sub-sample levels (e.g. A&E, AAU/MAU, community health clinics, community

!
!
!
001/UK/13(01/MMAR/1018!!!!!!!February!2013! 37! !Final!Report!
venues/events), a wide rich diversity of project characteristics are represented. These combine variety of settings, approaches to delivering testing, and eligible populations.
6.3 Limitations The priority in delivering the UKIFP was to provide support to grass-roots innovation, rather than as an R&D initiative. As a result individual project grant-holders held responsibility for contributing evaluation and monitoring resources and expertise, and chose their own approaches accordingly. This undoubtedly impacted on the scope, methods and quality of individual project evaluation, monitoring and reporting.
As outlined in more detail in earlier Chapters, the limitations are associated with study design (i.e. retrospective observational), and quality and completeness of reporting of intervention (design, delivery model, and test type), population characteristics, and outcomes.
Unfortunately, the impact of low quality and incomplete reporting is more severe in these small sub-samples, and it was considered methodologically inappropriate to undertake aggregate analysis at these levels in addition to the main setting categories (i.e. hospital, primary care, and community settings).
Despite these limitations, the UKIFP sample provides a rich pool for potential additional learning on extended HIV testing.
Interpreting and attributing the outcome findings requires an appropriate balance to be struck between the strengths and limitations of evaluation design and reporting that are set-out earlier in the report, and some caution to be exercised in the confidence with which conclusions that can be drawn the UKIFP alone.
Consequently while recognising important differences in their respective aims, discussion of the UKIFP’s key outcome findings is put in context with those of the DH pilot projects as reported in the HPA evaluation publication Time to Test2.
6.4 Feasibility Based on a 33% (13/39) sample of total testing projects, UKIFP projects achieved an overall test offer rate of 37% (range 10.4% to 100.0%). This clearly raises doubts regards the feasibility of testing, which merit further examination.
Offer rates varied between settings, with the highest rates (100%) appearing to be achieved in community settings. However, it is likely that this is due to the difficulty of accurately reporting or estimating the true eligible population in such settings.
Rates in primary care (51.3% [range: 39.4% to 78.5%]) were higher than in hospital settings (25.6% [range: 10.4% to 100%]), though again both exhibited broad ranges across projects.
The more straightforward test offer to all new patients in a non-acute less urgent environment, as opposed to more complex clinical protocols, may be easier to administer and deliver than in some hospital environments. This would seem more likely where POCT methods are used, though this analysis has not been able to explore the differences between test methods themselves.
The calculation of the test eligible populations is easier in primary care projects; where available, results from primary care may be more reliable. Also, it is possible that eligible populations in acute settings may have been over estimated, resulting in spuriously low offer rates.

!
!
!
001/UK/13(01/MMAR/1018!!!!!!!February!2013! 38! !Final!Report!
Overall the feasibility findings, albeit from a limited sample of UKIFP, suggest that testing is feasible, possible more so in some settings than others, but that more insight is needed into the delivery issues likely to be mediating success.
It is likely that these include:
• Guidance on how tests should be offered and delivered
• Clarity over matters of informed consent
• An adequately clear rationale for testing being presented to patients (e.g. high prevalence areas)
• Adequate resourcing and effective systemisation of testing protocols, especially in busy hospital settings.
It is helpful to note that these UKIFP offer rate findings appear consistent with those from Time to Test (42.6% [range: 21% to 62%])2.
In summary, the UKIFP offer rate findings are consistent with those from Time to Test (37% vs 42.6%). Taken at face value, they suggest that testing is most feasible in community settings. However, this sub-sample includes heterogeneous projects, and some may not have properly enumerated their eligible populations, resulting in inflated offer rates. Offer rates appear higher in primary care than in hospital. This seems plausible, given that most primary care projects employ a standardised testing policy for all new registrations to which staff more easily adhere. In a more complex and pressured environment such as A&E and AAU/MAU with competing acute health needs, adherence may be harder to achieve.
6.5 Acceptability Based on a 56% [22/39] sample of testing projects, UKIFP projects achieved an overall uptake rate of 44% (range: 39.7% to 100.0%).
Uptake rates in different settings were: 47% (range: 13.2% to 100.0%) in hospital settings, 44% (range: 39.7% to 100%) in community settings, and 37% (range: 18.4% to 66.3%) in primary care.
This overall uptake rate is disappointing, and are also lower than the 69.9% (range: 59% to 91%) reported in Time to Test.
Within the methodological and data completeness limitations of the UKIFP it is difficult to examine the wide variation. However, it is likely to result from actual differences in populations tested, in acceptability across settings and in approaches to operational delivery. It is also difficult accurately to enumerate the population offered tests, especially at community events and some busy hospital settings.
The limited UKIFP patient and participant survey findings available suggest that eligible populations do not generally find the offer of HIV testing unacceptable in extended settings. However, a substantial proportion may not consider it appropriate for themselves as individuals, due to their perception of their level of risk. Some MSM projects highlighted positive feedback of providing POCT tests in non-health care settings. Some projects found lower levels of acceptability in black African populations.
In summary, overall the UKIFP projects reported substantially lower uptake rates compared to Time to Test (44% vs 69.9%). Rates were substantially lower in both settings where comparison was feasible: hospital (47% vs 72.5%) and primary care (37% vs 65.3%). However, both evaluations reported higher uptake in hospital compared to primary care. This could be due to different perceptions of risk between the populations served in these settings (i.e. healthy new registrations in primary care).

!
!
!
001/UK/13(01/MMAR/1018!!!!!!!February!2013! 39! !Final!Report!
6.6 Effectiveness Based on an 82% [32/39] sample of testing projects, UKIFP projects achieved an overall screen positive rate of 0.7% (range: 0% to 9.1%).
Uptake rates in different settings were: 0.8% (range: 0% to 6.6%) in hospital settings, 0.7% (range: 0% to 9.1%) in community settings, and 0.6% (range: 0% to 1.3%) in primary care. Average and maximum rates were both higher in hospital and community settings than in primary care, apparently because some projects targeted CICs (e.g. Project 18i) and high risk MSM groups (e.g. Project 14), compared with the more general risk population presenting in primary care.
The UKIFP test positivity rate and maximum rates (0.7% [range: 0% to 9.1%]) are higher than reported in Time to Test (0.4% [range: 0% to 2.1%]). This is likely to be due to a combination of the wider range of risk populations included in UKIFP, and a key difference in case definition (i.e. Time to Test effectiveness was based on rates of ‘new diagnoses’ and UKIFP on ‘screen positives’ - unconfirmed diagnoses which are not necessarily ‘new’ cases, likely to artificially inflate the UKIFP findings).
In summary, UKIFP positive result rates are higher than in Time to Test. However, these findings may be considered potentially consistent once differences in case definition is considered and if CIC-focussed UKIFP projects excluded.
6.7 Commentary on individual settings and projects As discussed in earlier sections, while it was not feasible to undertake outcome analysis at the level of setting sub-samples, it is helpful to reflect on the findings of some individual projects and their settings from the UKIFP. Consequently a brief commentary is provided on selected project outcomes below.
6.7.1 Hospital
Five testing projects were based in AAU/MAU settings and achieved widely contrasting outcome results, suggesting that more detailed evaluation of the reasons for this could be valuable. Four projects were set in A&E, though unfortunately the minority provided complete reporting at this time. Project No. 18i focussing on CIC criteria found very high screen positive levels. However, from description of the cases, it seems likely that these would have been diagnosed later as in-patients. Consequently, the added value of testing for CICs in A&E appears unclear. Also, it remains unclear as to whether A&E or AAU/MAU settings represent the optimal large through-put hospital setting.
In projects in hospital outpatient settings, one of two projects (No.s 24 and 25) set in colposcopy clinics reported a much lower level of acceptability (i.e. uptake) (13.2% vs 75.4%). This seems to have been due to a lack of dedicated phlebotomy capacity.
Project No.10, set in a termination of pregnancy clinic, reported high levels of uptake (84.2%) and a screen positive rate of 1.2% (11.8/1000). However, this was based on a relatively small sample.
6.7.2 Primary care
Five testing projects were set in primary care.
Despite been located in a local authority with a ‘high’ prevalence of diagnosed HIV (Blackpool), project No.6 testing all attendees, achieved a low uptake rate and a nil screen positivity rate. The participants did not appear to consider themselves to be at high enough risk of HIV, and it is unclear what the population HIV risk profile of the participating GP surgery was.
!
!
!
001/UK/13(01/MMAR/1018!!!!!!!February!2013! 40! !Final!Report!
Another primary care project set in a single large inner city practice (No. 12), testing new registrations, achieved a good uptake rate (66.3%) and a moderate screen positivity rate of 1.3% (13.2/1000).
Two larger connected projects (No.s 16i and 16ii) were in practices across multiple inner London PCT areas and included a mixture of population areas and approaches to testing new registrations. They have so far have reported contrasting findings in terms of offer rates (78.5% vs 39.4%), uptake rates (18.4% vs 50.4%), and screen positivity rates (1.2% vs 0.4%) [12.2/1000 vs 3.7/1000]. This suggests that more detailed examination of the findings would be valuable once final and confirmed data is available.
6.7.2 Community settings
This UKIFP setting sub-sample spans a wide diverse range of testing project settings, types, and target populations. These included projects in community health clinic settings and non-health care venues and events. In general, they were focussed on black African and MSM populations. Consequently, meaningful interpretation of findings across the sub-sample as a whole is limited by this heterogeneity, and by poor data completeness in a high proportion of projects.
The relatively high overall screen positivity rate for projects in community settings may be skewed by a minority of smaller projects in relatively high risk populations, such as No.s 13 (9.1% [90.9/1000]) and 31 (8.3% [83.3/1000]).
The following observations are made on projects in the community setting sub-sample.
Project No.5 based in a city centre Terence Higgins Trust drop-in location mainly serving an MSM population appeared to achieve high levels of test offer and uptake, and a moderately high screen positivity rate of 4.7% (46.5/1000).
A number of particularly innovative projects reported interesting findings, including:
• An out-reach project (No.14) in Belfast saunas used for sex by the MSM population appeared acceptable to a high risk MSM population.
• A project (No.32i) delivered through a community mental health team in London also reported good acceptability with patients.
• Two home sample pilot projects, one focussing on annual partner testing (No.31) and other in a general population, both reported good acceptability levels.
Also, a number of mobile or event-focussed out-reach projects served higher risk groups. These were mainly but not exclusively MSM, and included annual Gay Pride events and gay clubs.
6.8 Overview The UKIFP and Time to Test outcome findings suggest that barriers remain to be overcome in improving the feasibility of offering HIV testing in extended settings. Where tests were offered, uptake rates were variable and often disappointing and substantially lower than in Time to Test. These findings suggest that further insight is required about the operational characteristics of optimally successful models of test delivery.
Despite these apparent limitations associated with feasibility (offer rates) and acceptability (uptake rates), the UKIFP found that population test positive rates (albeit screen positive as opposed to confirm and new positive findings) that are reasonably high when judged by conventional thresholds adopted in HIV testing research.

!
!
!
001/UK/13(01/MMAR/1018!!!!!!!February!2013! 41! !Final!Report!
7. Conclusion There is increasing international evidence of the effectiveness and cost effectiveness of early HIV diagnosis and prevention. This is reflected by the adoption of a Public Health Outcome measure intended to reduce late diagnosis in England. We should therefore make use of any opportunity to increase the knowledge base about the contribution of widespread testing to this goal.
Within the limitations in relation to research conduct and design, which are well documented in this report, the UKIFP HIV testing projects represent a rich and substantial sample. As a result, the findings make a further helpful contribution to the UK knowledge base on the topic. In addition, findings from a project sustainability audit carried out suggest that a significant number of projects funded in 2009 and 2010 report continued operation in 2012 through NHS funding.
Balancing these considerations affects the weight and confidence that can be associated with the findings, and hence their influence in isolation for policy.
However, considered alongside other evidence the following contributions can be drawn:
• Contribution: The UKIFP HIV testing projects have made a substantial additional contribution, both in terms of testing capacity, tests, and learning.
• Feasibility: Measured in terms of test offer rates, in absolute terms, the UKIFP suggests offer rates remain relatively low. Also, in relative terms, UKIFP’s rates are lower than reported in the Time to Test report. It appears that consistently higher rates are possible in primary care, and potentially in community settings. Rates in hospital settings appear lower, probably due to organisational complexities, clinician beliefs regarding consent, workload and urgency of patient needs in some settings.
• Acceptability: Measured in terms of test uptake rates, in absolute terms, the UKIFP results were only moderately high, and compared to the findings in Time to Test, UKIFP uptake results were relatively low. Acceptability appears greater in hospital settings and in some higher risk populations. Some qualitative findings suggest that while people may find the offer of a HIV test in extended settings acceptable in general terms, they may not believe the test necessary for themselves, due to their perception or knowledge of their personal risk. Also, some evidence suggests that convenience appears to be an influence on uptake, and that acceptability may be lower among some black African people. As HIV testing in extended settings becomes more normalised, it seems plausible that acceptability will increase.
• Effectiveness: Measured in terms of screen positive case rates, in absolute terms, the UKIFP results are encouraging. However, the lack of a consistent case definition across projects means that it is unclear how the number of screen positive cases would relate to the true confirmed new case rate. Similarly, in relative terms, as might be expected given that Time to Test reported confirmed new cases, the UKIFP rates were higher. Despite caveats in relation to case definition, UKIFP’s findings appear to lend further support to the effectiveness of HIV testing in extended settings, against conventional thresholds implied or stated in HIV research. Also, by US standards the findings are substantially above accepted cost effectiveness threshold (i.e. 1 new diagnosed case per 1000 tests)12 13.

!
!
!
001/UK/13(01/MMAR/1018!!!!!!!February!2013! 42! !Final!Report!
• Innovation: While the scales of individual projects, and accordingly their sample size, vary widely, a number of UKIFP projects are notable either in terms of their innovative setting or type, and/or the contribution of their findings. For instance:
o AAU/MAU settings appear promising, though issues relating to service integration and staff attitudes require need to be resolved.
o Results from some hospital outpatient clinic settings (e.g. colposcopy, TOP, partners attending antenatal appointments) appear promising. However, more detail insights are required into their optimal delivery design.
o Various out-reach projects in a mix of settings focussing on MSM populations, including non-health care drop-ins, saunas, gay community events and some venues appear successful.
o A CMHT-based approach appeared to be acceptable to patients with mental health problems.
o Home sampling approaches appear promising.
• Evaluation: Future UKIFP projects and other extended HIV testing projects should be subject to higher quality evaluation arrangements. A clearer distinction should be drawn in terms of aims and likely levels of screen positive rates, and between HIV testing as population screening, as opposed to case-finding or diagnosis.

!
!
!
001/UK/13(01/MMAR/1018!!!!!!!February!2013! 43! !Final!Report!
Appendix)1)–)Database)dataVentry)pages)!
!
!
!
!
!
!
!
!
!
!
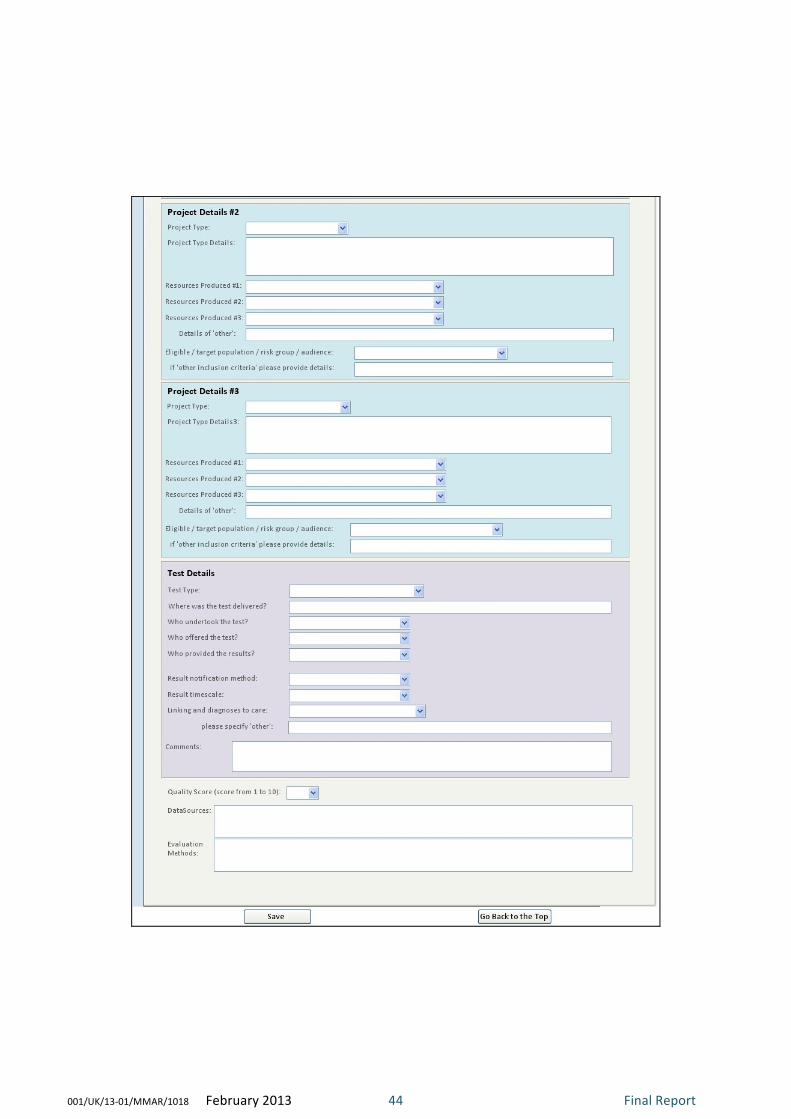
!
!
!
001/UK/13(01/MMAR/1018!!!!!!!February!2013! 44! !Final!Report!
!
!
!
!
!
!
!
!

!
!
!
001/UK/13(01/MMAR/1018!!!!!!!February!2013! 45! !Final!Report!
!
!
!
!
!
!
!
!
!

!
!
!
001/UK/13(01/MMAR/1018!!!!!!!February!2013! 46! !Final!Report!
!
!
!
!
!

!
!
!
001/UK/13(01/MMAR/1018!!!!!!!February!2013! 47! !Final!Report!
Appendix 2 – Database data field definitions and sources !
Field&Name& Field&Type& Field&Description& Data&Source&(if¬&from&project&review)&
Project!Number! Number! Unique!ID!for!each!project!review! !
Subproject!Number! Text! Unique!ID!for!each!sub(project!review! !
Project!Title! Text! Full!project!title! !
Grant!Holder(s)! Text! Name!of!grant!holder(s)! !
Start!Date! Date/Time! Start!date!of!project!review!(if!known)! !
Grant!Year! Text! Grant!year!(if!start/end!date!is!not!available)! !
End!Date! Date/Time! End!date!of!project!review!(if!known)! !
Host!Organisation! Text! Name!of!host!organisation! !
Host!Department! Text! Name!of!host!department! !
Host!BoroughLA! Text! Name!of!host!borough/local!authority! !
Gilead!Project!Scale! Text! Gilead!project!scale! !
LocationType! Text! Details!of!the!type!of!location! !
LocationText! Memo! Further!details!of!the!location!(if!required)! !
Setting! Text! Details!of!the!project!setting! !
Region! Text! Region!the!project!was!set!in! !
Deprivation!Score! Text! IMD2010!deprivation!score! Indices!of!Multiple!Deprivation!2010,!Communities!and!Local!Government!(CLG).!
Deprivation!Rank! Text! IMD2010!deprivation!rank! Indices!of!Multiple!Deprivation!2010,!Communities!and!Local!Government!(CLG).!
ONS!area!classification! Text! ONS!area!classification! Office!for!National!Statistics.!
HIV!prevalence! Text! 2010!HIV!prevalence!(rate!per!1000)! SOPHID!(!Survey!of!prevalent!HIV!infections!diagnosed!2010,!Health!Protection!Agency.!
HIV!prevalence!class! Text! 2010!HIV!prevalence!class! SOPHID!(!Survey!of!prevalent!HIV!infections!diagnosed!2010,!Health!Protection!Agency.!
Black!African!Pop! Number! Proportion!of!black!african!population!(%)! Census!2001,!Office!for!National!Statistics.!
Project!Type1! Text! Details!of!the!project!type!#1! !

!
!
!
001/UK/13(01/MMAR/1018!!!!!!!February!2013! 48! !Final!Report!
Field&Name& Field&Type& Field&Description& Data&Source&(if¬&from&project&review)&
Project!Type!Details1! Memo! Further!details!of!the!project!type!#1! !
Project!AimsObs1! Memo! Details!of!the!projects!aims!and!objectives!#1! !
Resources!Produced11! Text! Details!of!the!resources!produced!#1! !
ResourcesProduced12! Text! Details!of!the!resources!produced!#2! !
ResourcesProduced13! Text! Details!of!the!resources!produced!#3! !
OtherRP1! Text! Details!of!any!other!resources!produced! !
Eligible/targetpop/riskgp1! Text! Details!of!the!eligible/target!population/!risk!group! !
EligibleText1! Text! Further!details!of!the!eligible/target!population!/risk!group! !
Project!Type2! Text! Details!of!the!project!type!#2! !
Project!Type!Details2! Memo! Further!details!of!the!project!type!#2! !
Resources!Produced21! Text! Details!of!the!resources!produced!#1! !
ResourcesProduced22! Text! Details!of!the!resources!produced!#2! !
ResourcesProduced23! Text! Details!of!the!resources!produced!#3! !
OtherRP2! Text! Details!of!any!other!resources!produced! !
Eligible/targetpop/riskgp2! Text! Details!of!the!eligible/target!population/!risk!group! !
EligibleText2! Text! Further!details!of!the!eligible/target!population!/risk!group! !
Project!Type3! Text! Details!of!the!project!type!#3! !
Project!Type!Details3! Memo! Further!details!of!the!project!type!#3! !
Resources!Produced31! Text! Details!of!the!resources!produced!#1! !
ResourcesProduced32! Text! Details!of!the!resources!produced!#2! !
ResourcesProduced33! Text! Details!of!the!resources!produced!#3! !
OtherRP3! Text! Details!of!any!other!resources!produced! !
Eligible/targetpop/riskgp3! Text! Details!of!the!eligible/target!population/!risk!group! !
EligibleText3! Text! Further!details!of!the!eligible/target!population!/risk!group! !
Test!Type! Text! Details!of!the!test!type! !
Facilities! Text! Where!was!the!test!undertaken?! !

!
!
!
001/UK/13(01/MMAR/1018!!!!!!!February!2013! 49! !Final!Report!
Field&Name& Field&Type& Field&Description& Data&Source&(if¬&from&project&review)&
Test!Delivery! Text! Test!delivery! !
Offering!Test! Text! Who!offered!the!test?! !
Undertaking!Test! Text! Who!undertook!the!test?! !
Result!Provision! Text! Who!provided!the!results?! !
Result!Not!Method! Text! What!was!the!result!notification!method?! !
Result!Timescale! Text! What!was!the!timescale!to!receiving!the!result! !
Linking!to!care! Text! Who!linked!the!diagnoses!to!care?! !
Linkingother! Text! Further!details!of!'other'! !
Comment1! Memo! Comments! !
DataSources! Memo! Details!of!data!sources! !
EvaluationMethods! Memo! Details!of!evaluation!methods! !
Quality!Score! Number! Quality!Score!(methods!and!reporting)!(!scoure!out!of!10! !
EligiblePopulation! Text! Number!of!eligible!population! !
Implementation! Text! ! !
NoOffered! Text! Number!offered! !
NoCarePathwayReferrals! Text! Number!of!care!pathway!referrals! !
NoConfirmatoryTestsUndertaken! Text! Number!of!confirmatory!tests!undertaken! !
NoStaffTrained! Text! Number!of!staff!trained! !
Feasibility!Comments! Memo! Feasibility!comments! !
Age!Range! Text! Age!range! !
Average!Age! Text! Average!age! !
GenderMale! Text! Number!of!males! !
GenderFemale! Text! Number!of!females! !
Heterosexual! Text! Number!of!heterosexuals! !
MSM! Text! Number!of!men!who!have!sex!with!men! !
Bi(sexual! Text! Number!of!bi(sexuals! !
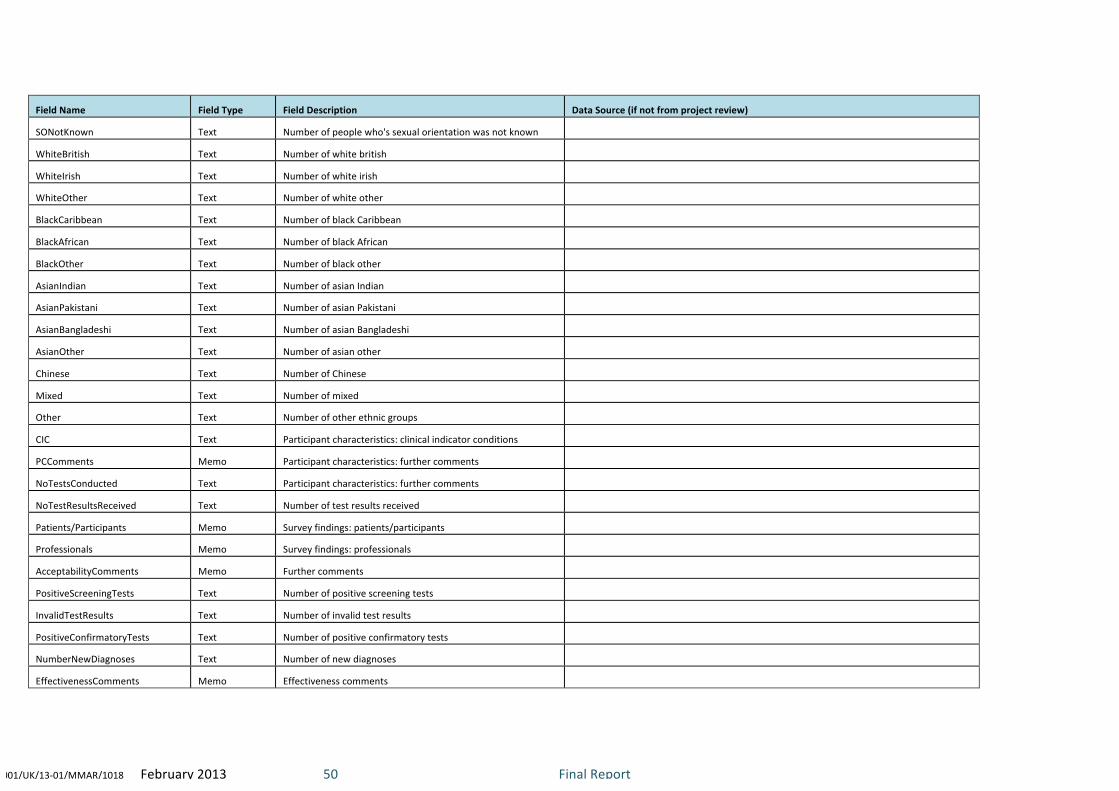
!
!
!
001/UK/13(01/MMAR/1018!!!!!!!February!2013! 50! !Final!Report!
Field&Name& Field&Type& Field&Description& Data&Source&(if¬&from&project&review)&
SONotKnown! Text! Number!of!people!who's!sexual!orientation!was!not!known! !
WhiteBritish! Text! Number!of!white!british! !
WhiteIrish! Text! Number!of!white!irish! !
WhiteOther! Text! Number!of!white!other! !
BlackCaribbean! Text! Number!of!black!Caribbean! !
BlackAfrican! Text! Number!of!black!African! !
BlackOther! Text! Number!of!black!other! !
AsianIndian! Text! Number!of!asian!Indian! !
AsianPakistani! Text! Number!of!asian!Pakistani! !
AsianBangladeshi! Text! Number!of!asian!Bangladeshi! !
AsianOther! Text! Number!of!asian!other! !
Chinese! Text! Number!of!Chinese! !
Mixed! Text! Number!of!mixed! !
Other! Text! Number!of!other!ethnic!groups! !
CIC! Text! Participant!characteristics:!clinical!indicator!conditions! !
PCComments! Memo! Participant!characteristics:!further!comments! !
NoTestsConducted! Text! Participant!characteristics:!further!comments! !
NoTestResultsReceived! Text! Number!of!test!results!received! !
Patients/Participants! Memo! Survey!findings:!patients/participants! !
Professionals! Memo! Survey!findings:!professionals! !
AcceptabilityComments! Memo! Further!comments! !
PositiveScreeningTests! Text! Number!of!positive!screening!tests! !
InvalidTestResults! Text! Number!of!invalid!test!results! !
PositiveConfirmatoryTests! Text! Number!of!positive!confirmatory!tests! !
NumberNewDiagnoses! Text! Number!of!new!diagnoses! !
EffectivenessComments! Memo! Effectiveness!comments! !

!
!
!
001/UK/13(01/MMAR/1018!!!!!!!February!2013! 51! !Final!Report!
Field&Name& Field&Type& Field&Description& Data&Source&(if¬&from&project&review)&
NoCliniciansTrained! Text! Number!of!clinicians!trained! !
NoCommMembTrainer! Text! Number!of!community!members!trained! !
TrainingOutcomesComments! Memo! Comments!of!training!outcomes! !
Limitations! Memo! Details!of!limitations!and!any!remaining!questions! !
LearningPoints! Memo! Learning!Points! !
Costs! Memo! Costs!and!cost!effectiveness! !
Conclusions! Memo! Conclusions! !
Recommendations! Memo! Recommendations! !
!
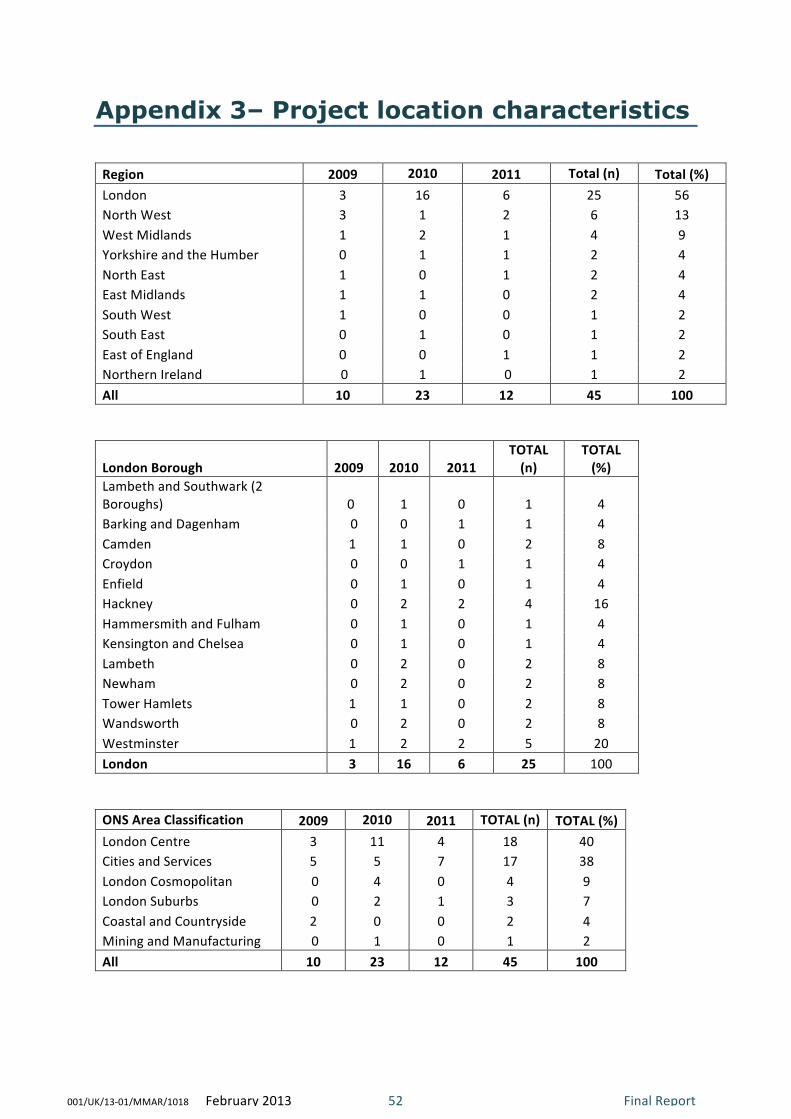
!
!
!
001/UK/13(01/MMAR/1018!!!!!!!February!2013! 52! !Final!Report!
Appendix 3– Project location characteristics
!
Region' 2009' 2010' 2011' Total'(n)' Total'(%)'London! 3! 16! 6! 25! 56!North!West! 3! 1! 2! 6! 13!West!Midlands! 1! 2! 1! 4! 9!Yorkshire!and!the!Humber! 0! 1! 1! 2! 4!North!East! 1! 0! 1! 2! 4!East!Midlands! 1! 1! 0! 2! 4!South!West! 1! 0! 0! 1! 2!South!East! 0! 1! 0! 1! 2!East!of!England! 0! 0! 1! 1! 2!Northern!Ireland! !0! 1! !0! 1! 2!All' 10' 23' 12' 45' 100'
!
London'Borough' 2009''
2010' 2011'TOTAL'(n)'
TOTAL'(%)'
Lambeth!and!Southwark!(2!Boroughs)! 0!! 1! 0! 1! 4!Barking!and!Dagenham! !0! 0! 1! 1! 4!Camden! 1! 1! 0! 2! 8!Croydon! !0! 0! 1! 1! 4!Enfield! !0! 1! 0! 1! 4!Hackney! !0! 2! 2! 4! 16!Hammersmith!and!Fulham! !0! 1! 0! 1! 4!Kensington!and!Chelsea! !0! 1! 0! 1! 4!Lambeth! !0! 2! 0! 2! 8!Newham! !0! 2! 0! 2! 8!Tower!Hamlets! 1! 1! 0! 2! 8!Wandsworth! !0! 2! 0! 2! 8!Westminster! 1! 2! 2! 5! 20!London' 3' 16' 6' 25' 100!
!
ONS'Area'Classification' 2009' 2010' 2011' TOTAL'(n)' TOTAL'(%)'London!Centre! 3! 11! 4! 18! 40!Cities!and!Services! 5! 5! 7! 17! 38!London!Cosmopolitan! !0! 4! 0! 4! 9!London!Suburbs! !0! 2! 1! 3! 7!Coastal!and!Countryside! 2! 0! 0! 2! 4!Mining!and!Manufacturing! !0! 1! 0! 1! 2!All' 10' 23' 12' 45' 100'
'
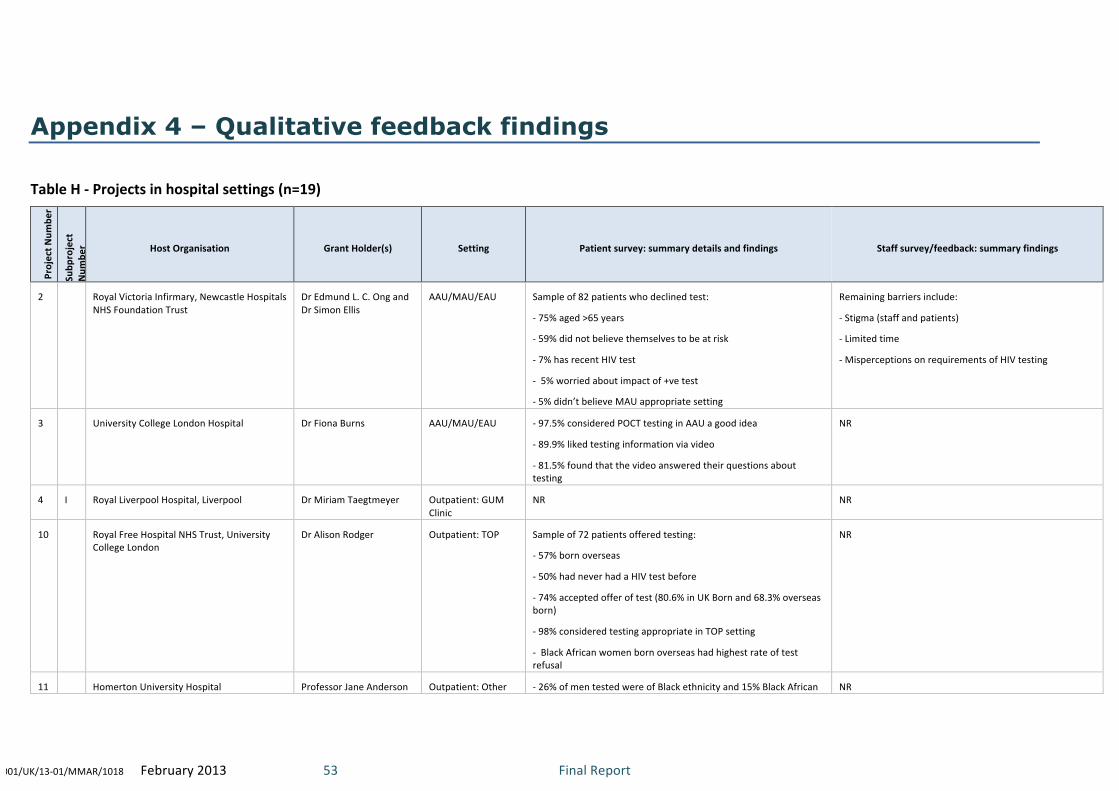
!
!
!
001/UK/13(01/MMAR/1018!!!!!!!February!2013! 53! !Final!Report!
Appendix 4 – Qualitative feedback findings !
Table!H!(!Projects!in!hospital!settings!(n=19)!
Project!N
umbe
r!
Subp
roject!
Num
ber! Host!Organisation! Grant!Holder(s)! Setting! Patient!survey:!summary!details!and!findings! Staff!survey/feedback:!summary!findings!
2! !! Royal!Victoria!Infirmary,!Newcastle!Hospitals!NHS!Foundation!Trust!
Dr!Edmund!L.!C.!Ong!and!Dr!Simon!Ellis!
AAU/MAU/EAU! Sample!of!82!patients!who!declined!test:!
(!75%!aged!>65!years!
(!59%!did!not!believe!themselves!to!be!at!risk!
(!7%!has!recent!HIV!test!
(!!5%!worried!about!impact!of!+ve!test!
(!5%!didn’t!believe!MAU!appropriate!setting!
Remaining!barriers!include:!
(!Stigma!(staff!and!patients)!
(!Limited!time!
(!Misperceptions!on!requirements!of!HIV!testing!
3! !! University!College!London!Hospital! Dr!Fiona!Burns! AAU/MAU/EAU! (!97.5%!considered!POCT!testing!in!AAU!a!good!idea!
(!89.9%!liked!testing!information!via!video!
(!81.5%!found!that!the!video!answered!their!questions!about!testing!
NR!
4! I! Royal!Liverpool!Hospital,!Liverpool! Dr!Miriam!Taegtmeyer! Outpatient:!GUM!Clinic!
NR! NR!
10! !! Royal!Free!Hospital!NHS!Trust,!University!College!London!
Dr!Alison!Rodger! Outpatient:!TOP! Sample!of!72!patients!offered!testing:!
(!57%!born!overseas!
(!50%!had!never!had!a!HIV!test!before!
(!74%!accepted!offer!of!test!(80.6%!in!UK!Born!and!68.3%!overseas!born)!
(!98%!considered!testing!appropriate!in!TOP!setting!
(!!Black!African!women!born!overseas!had!highest!rate!of!test!refusal!
NR!
11! !! Homerton!University!Hospital! Professor!Jane!Anderson! Outpatient:!Other! (!26%!of!men!tested!were!of!Black!ethnicity!and!15%!Black!African! NR!

!
!
!
001/UK/13(01/MMAR/1018!!!!!!!February!2013! 54! !Final!Report!
(partners!attending!ante(natal!clinics)! (!59%!accepting!had!never!been!previously!tested!
18! I! Newham!University!Hospital!Trust! Dr!Heather!Noble! A&E! NR! (!Difficult!to!routinely!embed!testing!in!busy!A&E!department!
(!Testing!of!CIC!cases!would!occur!if!admitted!anyway!
18! Ii! Barts!&!London!NHS!Trust! Dr!Chloe!Orkin! AAU/MAU/EAU! NR! (!Patients!being!bled!in!A&E!before!AAU!admission!is!a!barrier!
(!Some!doctors!have!concerns!over!consent!in!opt(out!testing!
20! !! University!Hospitals!Birmingham! Dr!Kaveh!Manavi! AAU/MAU/EAU! NR! (!Apparent!reluctance!of!some!doctors!to!offer!testing!
21! I! Chelsea!and!Westminster!Hospital!Foundation!NHS!Trust,!London!
Dr!Michael!Rayment!and!Dr!Ann!Sulivan!
A&E! NR! (!Variation!in!testing!rate!relates!to!workload!patterns!
21! Ii! Imperial!College!Healthcare!NHS!Trust,!London!
Dr!Michael!Rayment!and!Dr!Ann!Sulivan!
A&E! NR! NR!
21! Iii! Imperial!College!Healthcare!NHS!Trust,!London!
Dr!Michael!Rayment!and!Dr!Ann!Sulivan!
A&E! NR! NR!
24! !! St!George’s!Hospital!NHS!Trust,!London! Dr!Melanie!Rosenvinge! Outpatient:!Colposcopy!
(!81%!of!those!declining!test!had!recently!been!tested!
(!11%!of!those!declining!did!not!perceive!themselves!to!be!at!risk!
(!40%!of!those!consenting!to!test!but!not!receiving!one!cited!phlebotomy!waiting!times!as!reason!
NR!
25! !! Homerton!University!Hospital! Dr!Sarah!Creighton! Outpatient:!Colposcopy!
NR! NR!
28! !! Berkshire!East!Community!Health!Services! Dr!Stephen!Dawson! Outpatient:!Other! NR! NR!
29! !! Chelsea!and!Westminster!Hospital!Foundation!NHS!Trust/Imperial!College!Healthcare!NHS!Trust,!London!
Dr!Thomas!Newsom(Davis!
Inpatient:!Other!(Oncology)!
NR! NR!
30! !! University!Hospitals!Birmingham! Dr!Kaveh!Manavi! Outpatient:!Other!(Joint!assessment!unit)!
NR! NR!
32! Ii! Homerton!University!Hospital! Dr!Katherine!Coyne! Inpatient:!Mental!Health!
NR! NR!
33! !! Croydon!University!Hospital! Dr!David!Phillips! AAU/MAU/EAU! NR! (!Nursing!staff!are!key!in!increasing!testing!rates!
34! !! Royal!Victoria!Infirmary,!Newcastle!Hospitals!NHS!Foundation!Trust!
Dr!Matthias!Schmid! Outpatient:!Colposcopy!
NR! NR!
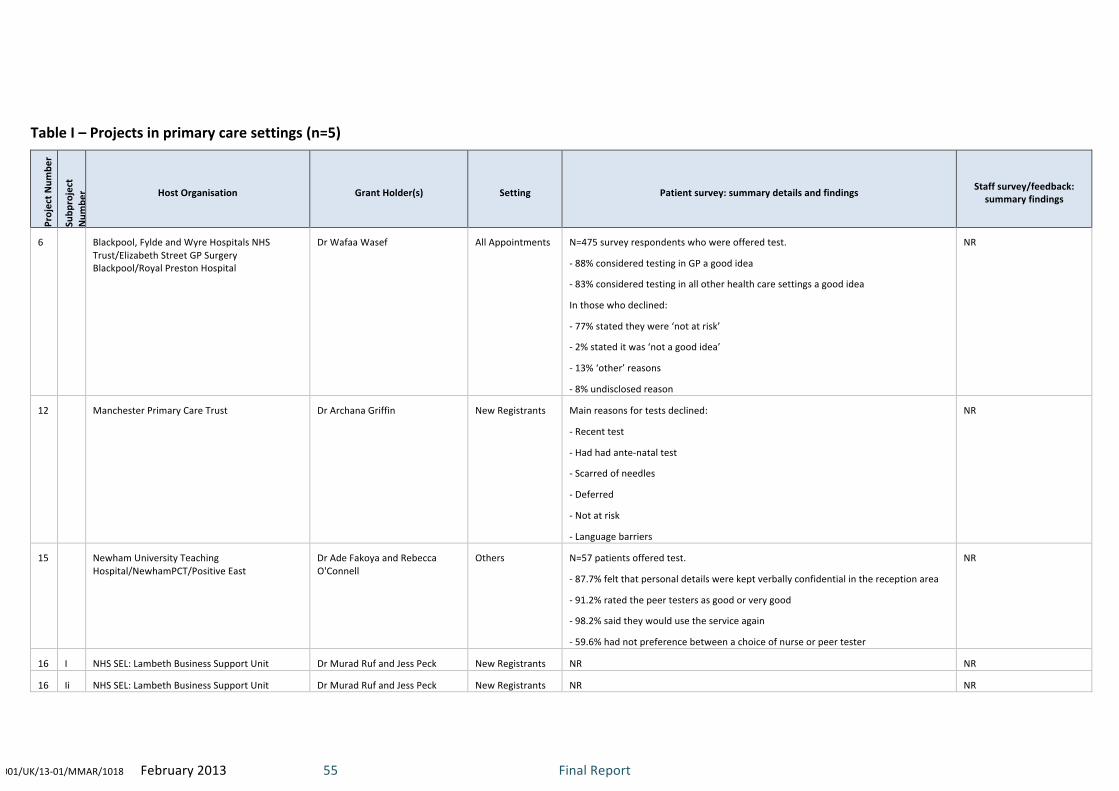
!
!
!
001/UK/13(01/MMAR/1018!!!!!!!February!2013! 55! !Final!Report!
!
Table!I!–!Projects!in!primary!care!settings!(n=5)!
Project!N
umbe
r!
Subp
roject!
Num
ber! Host!Organisation! Grant!Holder(s)! Setting! Patient!survey:!summary!details!and!findings! Staff!survey/feedback:!
summary!findings!
6! !! Blackpool,!Fylde!and!Wyre!Hospitals!NHS!Trust/Elizabeth!Street!GP!Surgery!Blackpool/Royal!Preston!Hospital!
Dr!Wafaa!Wasef! All!Appointments! N=475!survey!respondents!who!were!offered!test.!!
(!88%!considered!testing!in!GP!a!good!idea!
(!83%!considered!testing!in!all!other!health!care!settings!a!good!idea!
In!those!who!declined:!
(!77%!stated!they!were!‘not!at!risk’!
(!2%!stated!it!was!‘not!a!good!idea’!
(!13%!‘other’!reasons!
(!8%!undisclosed!reason!
NR!
12! !! Manchester!Primary!Care!Trust! Dr!Archana!Griffin! New!Registrants! Main!reasons!for!tests!declined:!
(!Recent!test!
(!Had!had!ante(natal!test!
(!Scarred!of!needles!
(!Deferred!
(!Not!at!risk!
(!Language!barriers!
NR!
15! !! Newham!University!Teaching!Hospital/NewhamPCT/Positive!East!
Dr!Ade!Fakoya!and!Rebecca!O'Connell!
Others! N=57!patients!offered!test.!
(!87.7%!felt!that!personal!details!were!kept!verbally!confidential!in!the!reception!area!
(!91.2%!rated!the!peer!testers!as!good!or!very!good!
(!98.2%!said!they!would!use!the!service!again!
(!59.6%!had!not!preference!between!a!choice!of!nurse!or!peer!tester!
NR!
16! I! NHS!SEL:!Lambeth!Business!Support!Unit! Dr!Murad!Ruf!and!Jess!Peck! New!Registrants! NR! NR!
16! Ii! NHS!SEL:!Lambeth!Business!Support!Unit! Dr!Murad!Ruf!and!Jess!Peck! New!Registrants! NR! NR!

!
!
!
001/UK/13(01/MMAR/1018!!!!!!!February!2013! 56! !Final!Report!
Table!J!–!Projects!in!community!settings!(n=15)!
Project!N
umbe
r!
Subp
roject!Num
ber!
Host!Organisation! Grant!Holder(s)! Setting! Patient!survey:!summary!details!and!findings! Staff!survey/feedback:!summary!findings!
4! Ii! Royal!Liverpool!Hospital,!Liverpool! Dr!Miriam!Taegtmeyer! Clinics!(!Various! N=154!World!Aids!Day!event!clinic!attender!survey.!
(!48.8%!never!tested!before!
(!84%!preferred!POCT!to!lab!test!
(!92%!would!recommend!POCT!test!to!others!
!
Speed!of!result!and!outreach!testing!
effective!in!engaging!new!groups/clients!
5! !! Birmingham!Heartlands!Hospital! Dr!Steve!Taylor!and!Dr!Sarah!Barrett! Venue!(THT)! Patient!survey!comments:!
“It’s!nice!to!be!able!to!go!somewhere!not!in!a!hospital!setting!“!
“Flexibility!good!with!appointment!times!,!able!to!come!straight!
from!work”!
“Speed!of!result!excellent!couldn't!believe!I!had!them!within!15!
mins”!
“Staff!were!really!friendly”!
“Not!having!to!book!an!appointment!gives!me!the!opportunity!to!
drop!in!whenever!i!feel!the!need!to”!
NR!
13! !! Sheffield!Teaching!Hospitals!NHS!
Foundation!Trust!
Dr!Christine!Bowman! Out(reach! (!All!but!2!participants!undertaking!test!indicated!that!the!kits!
were!easy!to!use!
(!Salivary!testing!was!unacceptable!to!some!who!suspected!it!may!
be!used!for!DNA!testing!and!stored!for!policing!immigration!issues!
(!Concerns!expressed!over!impact!of!a!positive!HIV!result!
included:!stigma;!status!in!the!family;!future!sexual!activity!
(!Some!cultural!event!co(ordinators!and!church/mosque!leaders!
discouraged!HIV!testing!
NR!
14! !! Belfast!Health!and!Social!Care!Trust!
&!Royal!Victoria!Hospital,!Belfast!
Dr!Carol!Emerson! Venue!(!MSM! NR! NR!
17! !! Guys!and!St!Thomas!NHS!Trust,!! Dr!Julie!Fox! Clinic!–!Drug!&! Attitudes!to!testing:! NR!

!
!
!
001/UK/13(01/MMAR/1018!!!!!!!February!2013! 57! !Final!Report!
Kings!College!London! alcohol!(!82.9%!felt!HIV/HCV!testing!should!be!offered!in!prison!
(!71.1%!felt!this!should!be!done!using!a!mouth!swab!
Concerns!regarding!testing:!
•!35%!had!no!concerns!regarding!HIV/HCV!testing!but,!in!those!
who!did,!dislike!of!needles,!receiving!a!positive!result!and!
confidentiality!were!the!commonest!barriers!to!testing!
19! !! Whittall!Street!Clinic,!Birmingham! Dr!Kaveh!Manavi! Event! NR! NR!
22! !! The!Michael!Wood!Centre!(!
Leicester!Aids!Support!Service!
Julie!Musonda! Mobile! NR! NR!
27! !! Chelsea!and!Westminster!NHS!
Foundation!Trust!
Dr!Stephanie!McMilan!and!Rachael!Jones! Out(reach! NR! NR!
31! !! Sheffield!Teaching!Hospitals!NHS!
Foundation!Trust!
Gillian!Bell! Home! Many!participants!expressed!appreciation!of!the!convenience!of!
home!sampling!and!said!they!would!use!again.!No!problems!were!
identified!with!using!the!kits.!
NR!
32! I! Homerton!University!Hospital! Dr!Katherine!Coyne! CMHT! NR! NR!
35! !! NHS!Greater!Manchester/Sexual!
Health!Network!
Samantha!Scanlon! Home! N=135!test!sample!returners.!
89%!stating!that!the!process!of!collecting!the!sample!was!
acceptable!
NR!
36! !! Brook!Manchester! Medorah!Williams! Clinic! NR! NR!
37! !! Barking!Havering!and!Redbridge!
University!Hospitals!Trust,!Essex,!
UK!
Emma!Macfarlane! Clinic! N=2.!Very!low!uptake.! Staff!feedback!suggested!that!clinic!
attendees!at!2!of!the!selected!sites!
considered!themselves!to!be!low!risk!for!HIV!
and!were!also!considered!low!risk!by!staff.!!
Many!had!had!a!recent!pregnancy!and!had!
been!tested!for!HIV!ante(natally.!
38! !! Cambridge!Community!Services! Dr!Sarah!Edwards! Venue! NR! NR!
39! !! Chelsea!and!Westminster!NHS!
Foundation!Trust!
Dr!Macky!Natha! Mobile! NR! NR!
!
!

!
!
!
001/UK/13(01/MMAR/1018!!!!!!!February!2013! 58! !Final!Report!
Appendix 5 – Project outcomes: Non-testing projects summary (n=6)
Location!Type!Group! Pr
oject!N
umbe
r!
Subp
roject!Num
ber!
Project!Title! Grant!Holder(s)!Grant!Year! Host!Organisation! Project!Type! Output/Impact!Summary!
Hospital!!
(n=1)!
26! !! Testmatch™:!new!software!to!support!(!HIV!testing!in!hospital!and!community!settings!
Dr!Achim!Schwenk! 2010! North!Middlesex!University!Hospital!NHS!Trust,!London!
IT!only!
Development!of!(free)!software!enabling!efficient!management!of!HIV!testing!information!and!communication.
Primary!Care!(n=3)!
1! !! Educating!East!London!primary!care!providers!to!improve!rates!of!HIV!testing!in!an!area!of!high!prevalence!and!late!presentation!
Dr!Claudia!Estcourt!and!Dr!Jane!Hutchinson!
2009! Barts!&!London!NHS!Trust/Medical!School!
Training!only!
26!GPs!&!4!nurses!from!8!PCTs!attended!HIV!and!testing!training!course.!Evaluation!suggested!changes!in!clinical!knowledge,!confidence,!and!practice!in!relation!to!testing.!
8! !! Evaluation!of!an!innovative!“protected!learning!time”!event!for!GPs!to!improve!testing!for!hepatitis!B,!hepatitis!C!and!HIV!
Professor!Keith!Neal! 2009! Nottingham!University/Nottingham!Hospitals!Trust/Nottingham!City!PCT! Training!only!
Delivery!of!protected!GP!learning!time!programme!on!BBV!testing,!including!HIV.!
23! !! Targeted!HIV!testing!in!primary!care!(!Phase!I:!Feasibility!CIC!case!finding!
Dr!Melanie!Rosenvinge! 2010! St!George's!Healthcare!NHS!Trust/Falcon!Road!Medical!Centre,!London! Audit!only!
!Reported!on!feasibility!audit!of!CIC!case(finding!in!primary!care!using!routine!clinical!information!system!data!and!case!notes.!
Community!settings!!
(n=2)!
7*! !! SORTED!!(!A!Rapid,!Walk(In!HIV!Testing!Service!in!Soho,!Central!London!
Marco!Rossi!and!Dr!Macky!Natha!
2009! Chelsea!and!Westminster!NHS!Foundation!Trust! Promotional!
Capacity!and!promotional!support!to!re(launched!NHS!MSM!sexual!health!service.!
9! !! Blood!Borne!Virus!Screening!in!Prisons!(Dorset)!
Sue!Hyett! 2009! Dorset!County!Hospital! Promotional!(organisation!and!clinical)!
!Promotion,!advocacy,!and!facilitation!of!improvements!in!BBV!testing!in!HM!Prison!Service!in!Dorset.!

!
!
!
001/UK/13(01/MMAR/1018!!!!!!!February!2013! 59! !Final!Report!
!
!
!
!
!PHAST Contact Details
Dr Catherine Brogan Public Health Action Support Team CIC
Westlington Farm Dinton Bucks HP17 8UL
Email: [email protected] Tel: 020 3479 5250 Mobile: 07970 622 604 www.phast.org.uk !
!
!

!
!
!
001/UK/13(01/MMAR/1018!!!!!!!February!2013! 60! !Final!Report!
Appendix!6!–!References!
!
!
!
1!HPA.!HIV$in$the$UK:$2011$report.$London:!Health!Protection!Services,!Colindale.!November!2011.!2!Health!Protection!Agency.!Time$to$test$for$HIV:$Expanding$HIV$testing$in$healthcare$&$community$services$in$
England..$Final$Report.!September!2011!3!Health!Protection!Agency.!Summary!of!antenatal!screening!for!infectious!diseases!in!England:!2010!update.!Health$Protection$Report$2011;!34(5).!4!Health!Protection!Agency,!Centre!for!Infections.!The!UK!Collaborative!Group!on!HIV!&!STI!surveillance.!Testing$Times.$HIV$&$other$STIs$in$the$UK.!2007.!5!British!HIV!Association!(BHIVA).!2005H6$mortality$audit.!6!Sullivan!A!K!et!al.!Newly!diagnosed!HIV!infections:!review!in!UK!&!Ireland.!BMJ,!2005,!330,!1301(2.!7!Mayer!K!et!al.!Sustained$treatment$as$prevention:$continued$decreases$in$unprotected$sex$&$virological$
supresssion$after$HAART$initiation$among$patients$in$HPTN$052.!Oral!Poster!Presentation!MOPDC0106.!XIX!International!AIDS!Conference.!July!2012,!Washington!DC.!8!Chen!Y!Q!et!al.!TimeHtoHARTHInitiation:$A$risk$factor$analysis$of$the$HPTN$052$HIVHinfected$partners$on$delayed$
therapy.$Poster!TUPE083.!XIX!International!AIDS!Conference.!July!2012,!Washington!DC.!
!9!Grinsztejn!M!et!al.!Effect$of$early$versus$delayed$initiation$of$antiretroviral$therapy$(ART)$on$clinical$outcomes$
in$the$HPTN$052$randomized$trial.!Late(breaker!Presentation!FRLBC01.!XIX!International!AIDS!Conference.!July!2012,!Washington!DC.!
!10!Walensky!R!P!et!al.!The$costHeffectiveness$of$treatment$as$prevention:$analysis$of$the$HPTN$052$trial.!Late(breaker!presentation!FRLBC01.!XIX!International!AIDS!Conference.!July!2012,!Washington!DC.!
!11!Health!Protection!Agency.!Evidence$&$resources$to$commission$expanded$HIV$testing$in$priority$medical$
services$in$high$prevalence$areas.!April!2012!12!Walensky!R!P!et!al.!Routine!human!immunodeficiency!virus!testing:!an!economic!evaluation!of!current!guidelines.!The$American$Journal$of$Medicine,!118(3),!292(300,!2005.!13!Paltiel!A!D!et!al.!Expanded!testing!for!HIV!in!the!United!States!–!an!analysis!of!cost!effectiveness.!New$England$Journal$of$Medicine,!352(6),!586(595,!2005.!!14!UK!CMOs!&!CNOs.!Improving$the$detection$&$diagnosis$of$HIV$in$nonHHIV$specialties$including$primary$care.!Sept(Oct!2007.!15!British!HIV!Association!(BHIVA),!British!Association!of!sexual!Health!&!HIV!(BASHH),!and!the!British!Infection!Society!(BIS).!UK$National$Guidelines$for$HIV$Testing$2008.!September!2008.!
16!National!Institute!for!Health!and!Clinical!Excellence,!2011.$$$Increasing$the$uptake$of$HIV$testing$among$black$
Africans$in$England.$NICE$public$health$guidance$33.!www.nice.org.uk/guidance/PH33
!
17!!National!Institute!for!Health!and!Clinical!Excellence,!2011.!Increasing$the$uptake$of$HIV$testing$among$men$
who$have$sex$with$men.$NICE$public$health$guidance$34.!www.nice.org.uk/guidance/PH34
!
!
!
!
001/UK/13(01/MMAR/1018!!!!!!!February!2013! 61! !Final!Report!
!
!
!18!Select!Committee!on!HIV!and!AIDS!in!the!United!Kingdom.!No$vaccine,$no$cure:$HIV$and$AIDS$in$the$United$Kingdom.!Sept!2011!
!19!Department!of!Health.!Government$response$to$the$House$of$Lords$Report$of$Session$2010H12:$No$vaccine,$no$cure:$HIV$and$AIDS$in$the$United$Kingdom.$Oct!2011!
!20!Department!of!Health.!Healthy!lives,!healthy!people:!Improving!outcomes!&!supporting!transparency.!Jan!2012!21!Tweed!E,!et!al.!Monitoring!HIV!testing!in!diverse!healthcare!settings:!results!from!a!sentinel!surveillance!pilot!study.!Sex$Transm$Infect!2010:!86(5):!360(364!22!Gilead.!Key$findings$of$the$2009H2011$UKIFP$HIV/HBV$projects$sustainability$audit:$phase$I.!May!2012.!