experian automotive quarterly briefing automotive quarterly briefing ... today’s presentation ......
TRANSCRIPT

© Experian Public
Experian Automotive Quarterly Briefing Second quarter 2017 automotive market share trends and registrations
Marty Miller | Senior Product Manager, Vehicles in Operation (VIO)
2 © Experian Public
Today’s presentation
Presentation will be available 24-48 hours after Webinar
Email with a link will be sent to all registrants to download
Questions? Contact us at [email protected]
What’s on the Road
VIO by model year, segment, age and market share
U.S. light duty vehicles through June 30, 2017
Canada vehicles through June 30, 2017
Hurricane potential impact to TX and FLMarty Miller
Senior Product Manager, VIO

3 © Experian Public
U.S. and Canada total Vehicles in Operation = 315.7M
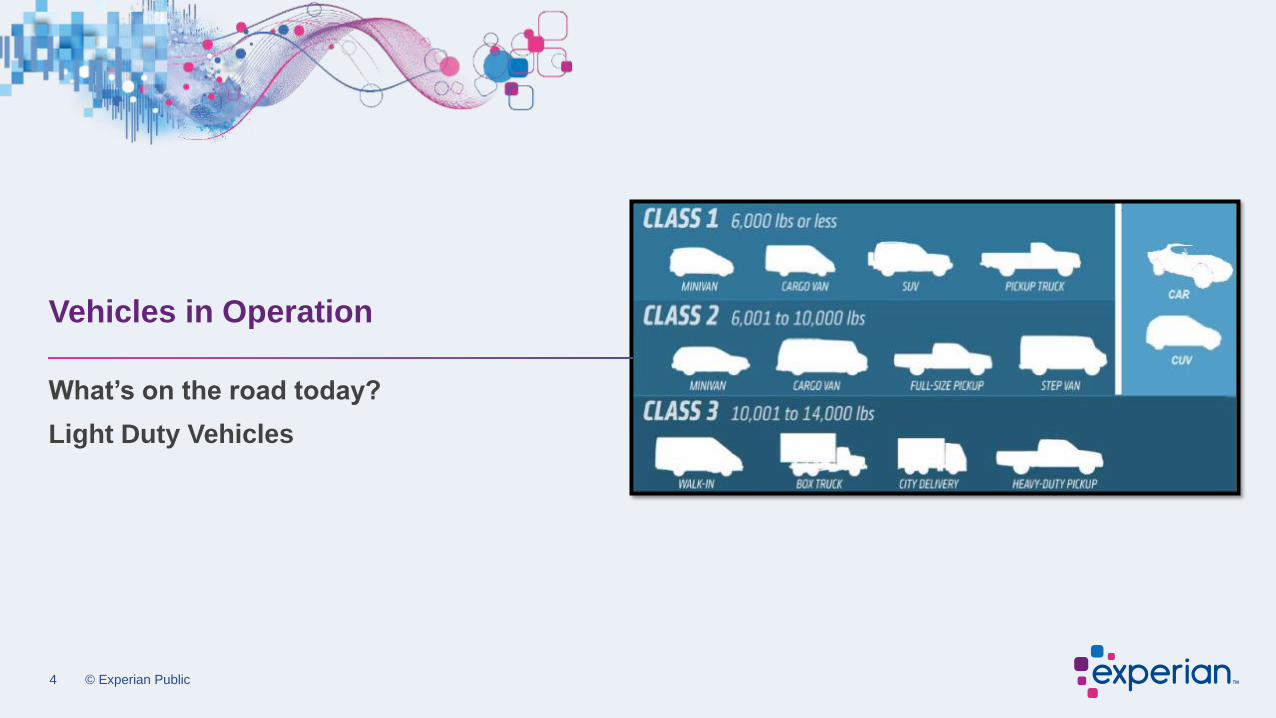
Light Duty
Passenger Cars, Light Trucks, Vans
Cars and GVW Class 1 – 3
Medium & Heavy Duty
Large Vans, Delivery Trucks, Buses, RVs,
Cement Trucks, Semi-Tractors
GVW Class 4 - 8
Power Sports
Motorcycles, All-Terrain,
Utility Task, Snowmobiles
4 © Experian Public
What’s on the road today?
Light Duty Vehicles
Vehicles in Operation
5 © Experian Public
Source: Experian
Automotive as of June
30, 2017 (U.S. light
duty vehicles only)
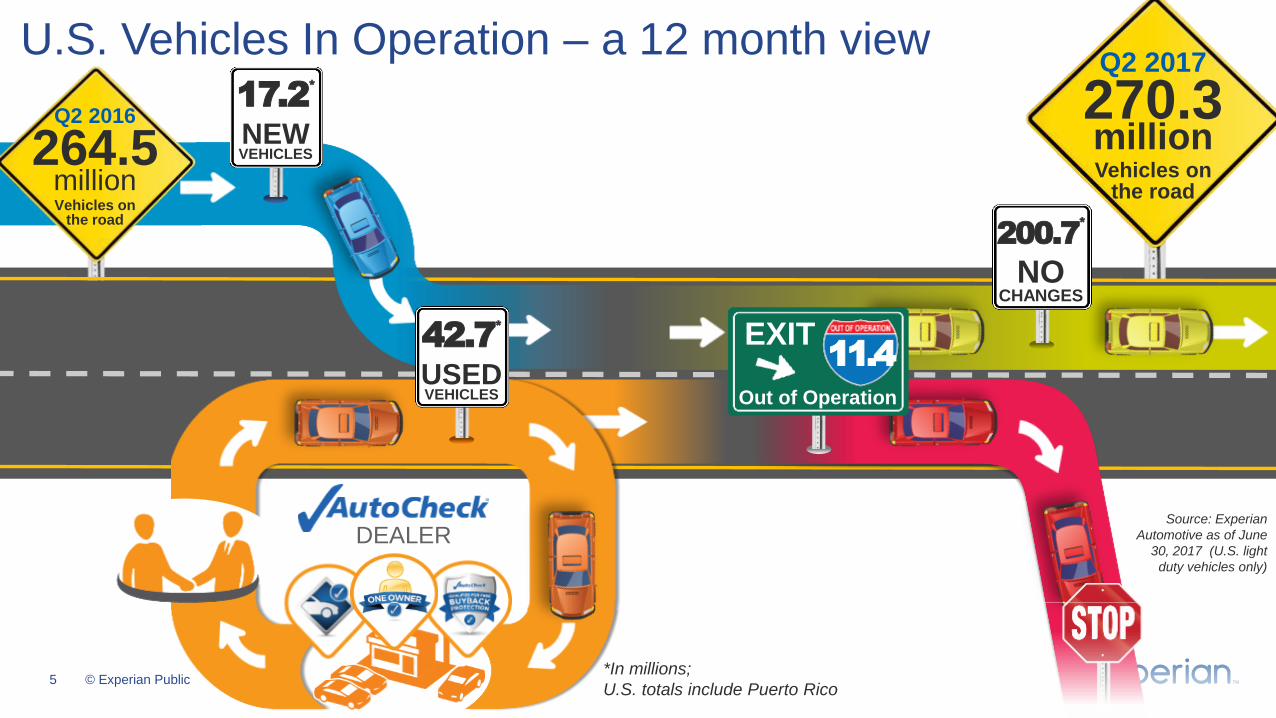
U.S. Vehicles In Operation – a 12 month view
Q2 2016
264.5millionVehicles on
the road
Q2 2017
270.3millionVehicles on
the road
17.2*
NEWVEHICLES
DEALER
42.7*
USEDVEHICLES
200.7*
NOCHANGES
11.4EXIT
Out of Operation
*In millions;
U.S. totals include Puerto Rico
6 © Experian Public
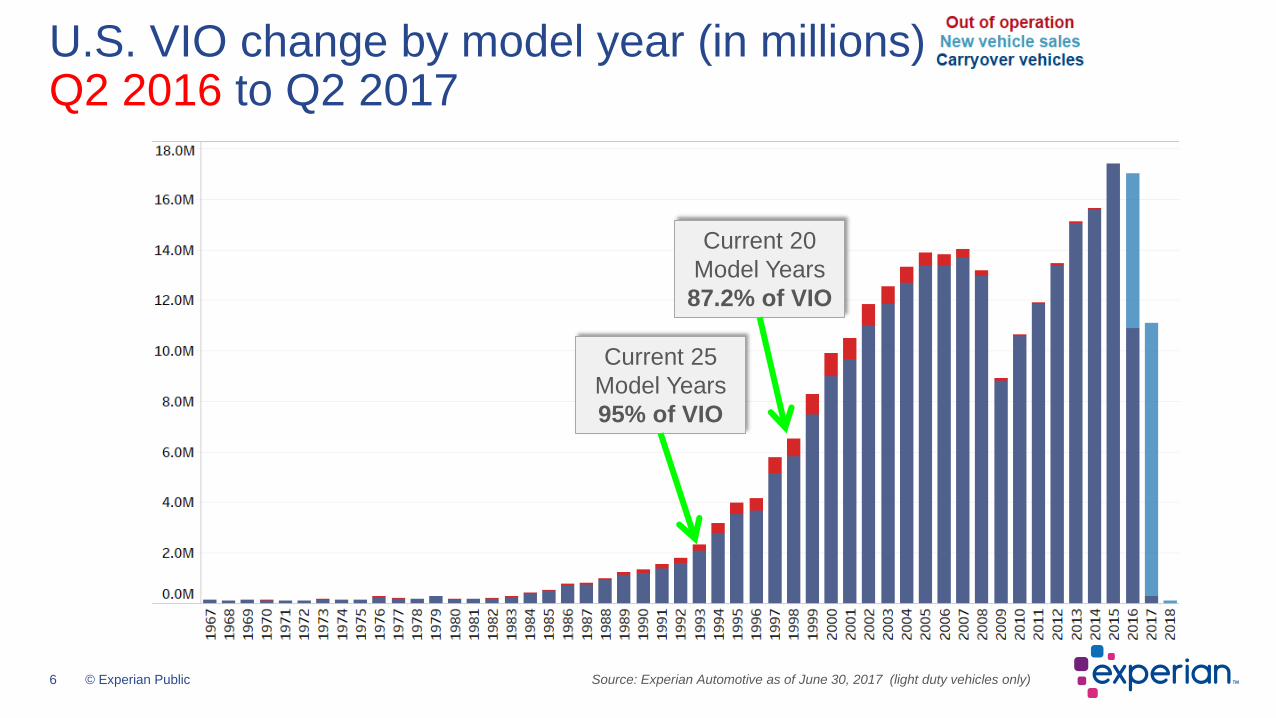
U.S. VIO change by model year (in millions)Q2 2016 to Q2 2017
Current 20
Model Years
87.2% of VIO
Current 25
Model Years
95% of VIO
Source: Experian Automotive as of June 30, 2017 (light duty vehicles only)
7 © Experian Public
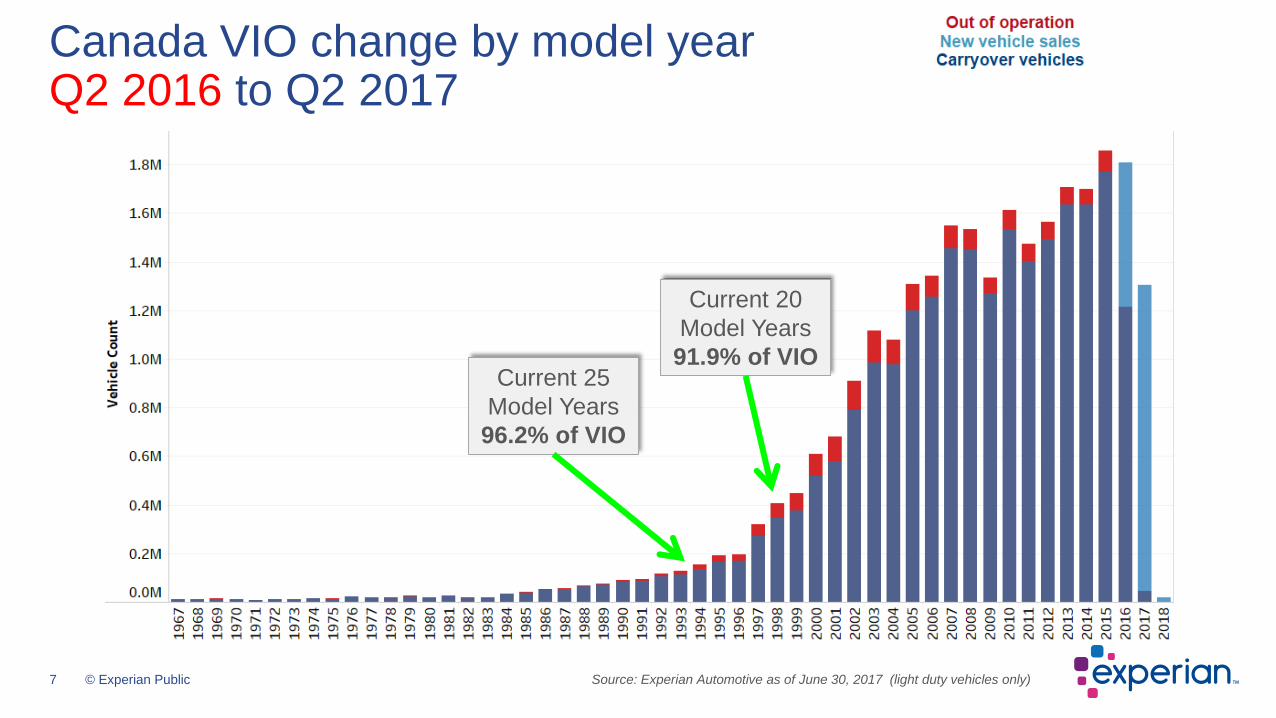
Canada VIO change by model yearQ2 2016 to Q2 2017
Source: Experian Automotive as of June 30, 2017 (light duty vehicles only)
Current 20
Model Years
91.9% of VIOCurrent 25
Model Years
96.2% of VIO

8 © Experian Public
U.S. VIO Top 20 segments on the road market share
Source: Experian Automotive as of June 30, 2017 (light duty vehicles only)
9 © Experian Public
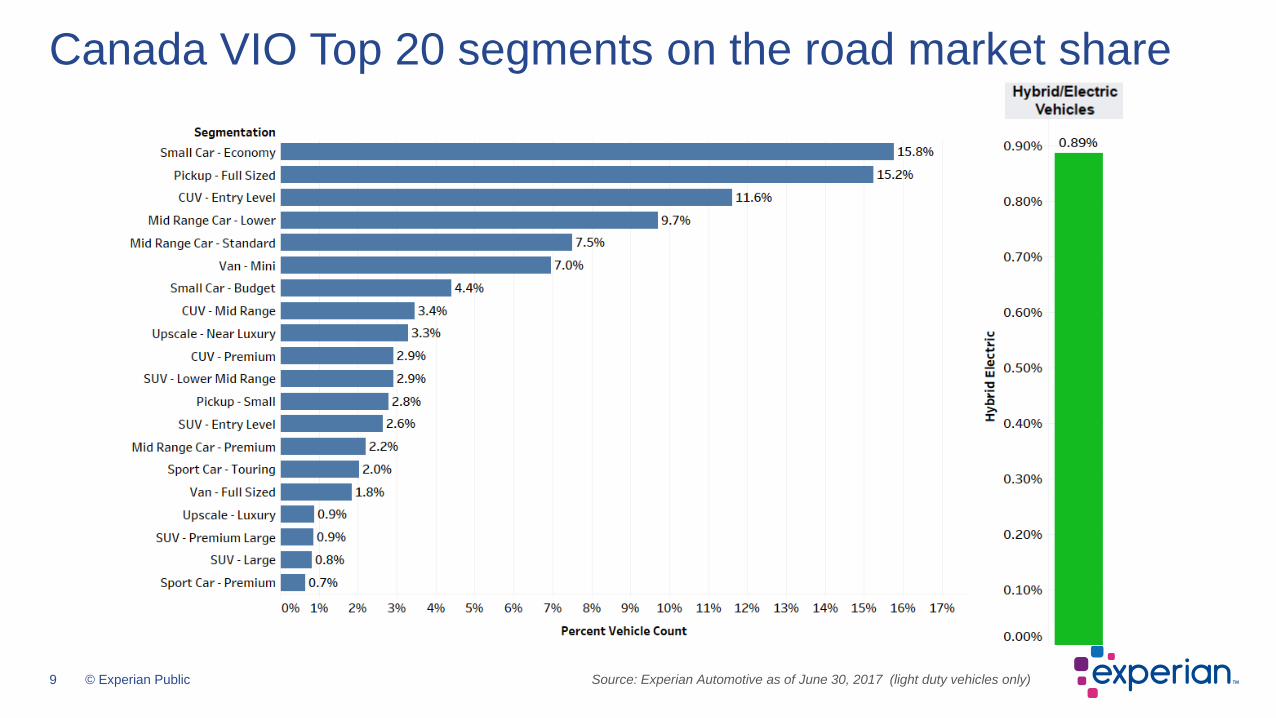
Canada VIO Top 20 segments on the road market share
Source: Experian Automotive as of June 30, 2017 (light duty vehicles only)
10 © Experian Public
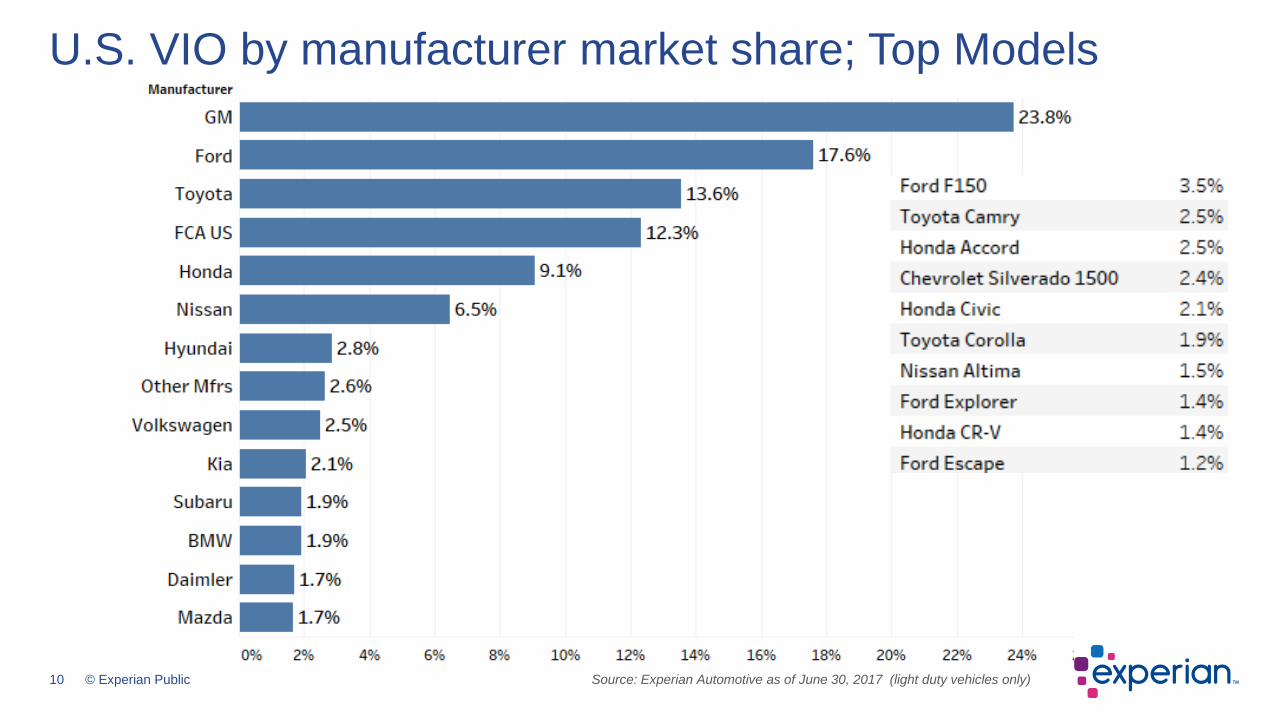
U.S. VIO by manufacturer market share; Top Models
Source: Experian Automotive as of June 30, 2017 (light duty vehicles only)
11 © Experian Public
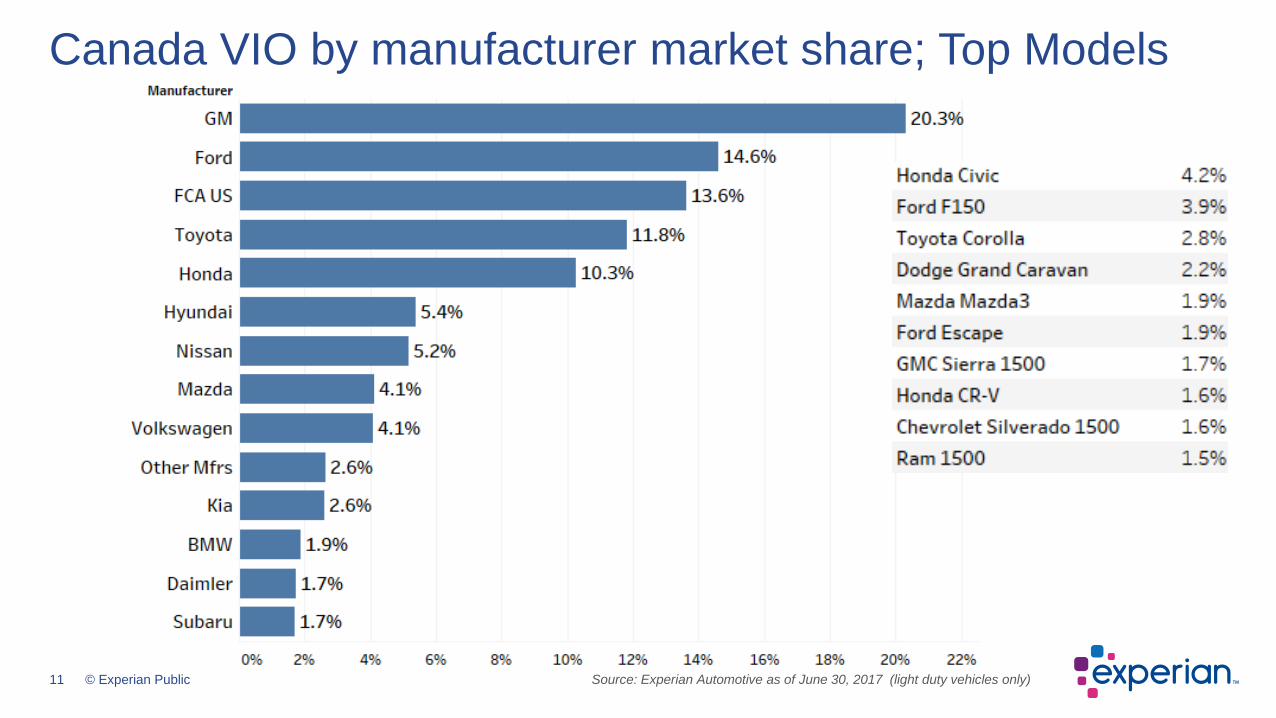
Canada VIO by manufacturer market share; Top Models
Source: Experian Automotive as of June 30, 2017 (light duty vehicles only)

12 © Experian Public
• 6 to 12 model year old vehicles
• Aged out of general OEM manufacturer warranties for any repairs
• Likely require more part replacement & services (e.g. shocks, timing belt service, engine repairs) that may be performed by aftermarket service shops using parts from aftermarket part manufacturers
• Sizing the Sweet Spot helps identify overall market potential and changes can have implications to those that service it
The Aftermarket “Sweet Spot”
• 13 model years old & older
• Less costs may be spent to service them due to their age and vehicle value
“Post Sweet Spot” vehicles
• 5 model years old & newer; many covered by the vehicle’s manufacturer warranty
• Identifies models coming into the Sweet Spot
“Pre Sweet Spot” vehicles
The aftermarket “Sweet Spot” overview“Post” and “Pre” Sweet Spot defined

13 © Experian Public
U.S. trend of total VIO compared to sweet spot volumesVIO by model year (in millions)
31.3% vehicles within
“Sweet Spot”
(MY2006 – 2012)
Pre-Sweet
Spot
Post-Sweet
Spot
Source: Experian Automotive as of June 30, 2017 (light duty vehicles only)
14 © Experian Public
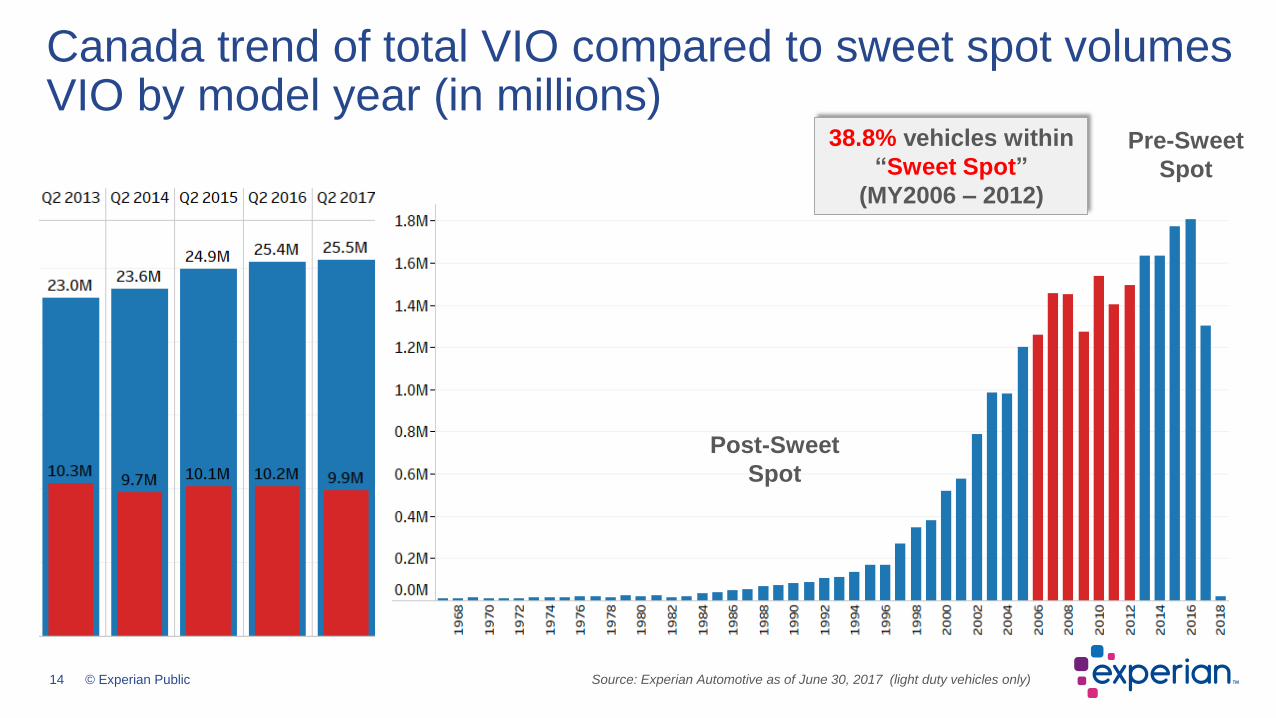
Canada trend of total VIO compared to sweet spot volumesVIO by model year (in millions)
38.8% vehicles within
“Sweet Spot”
(MY2006 – 2012)
Source: Experian Automotive as of June 30, 2017 (light duty vehicles only)
Pre-Sweet
Spot
Post-Sweet
Spot
15 © Experian Public
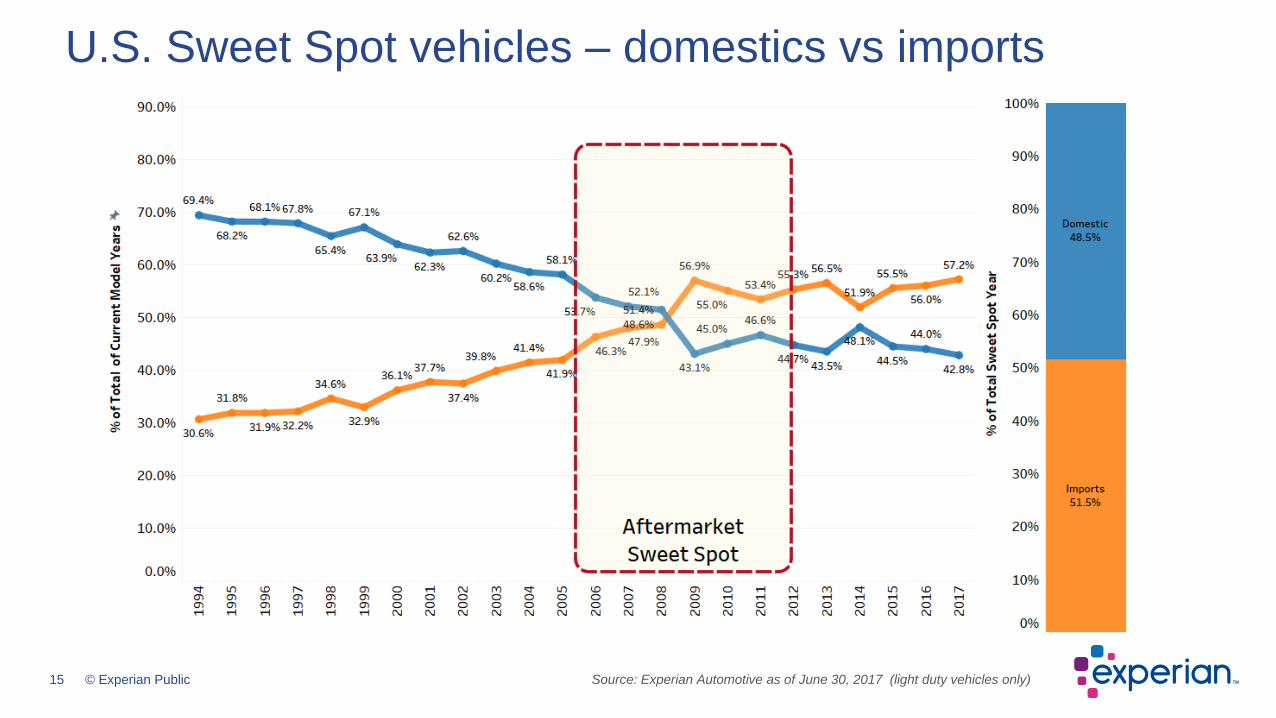
U.S. Sweet Spot vehicles – domestics vs imports
Source: Experian Automotive as of June 30, 2017 (light duty vehicles only)
16 © Experian Public
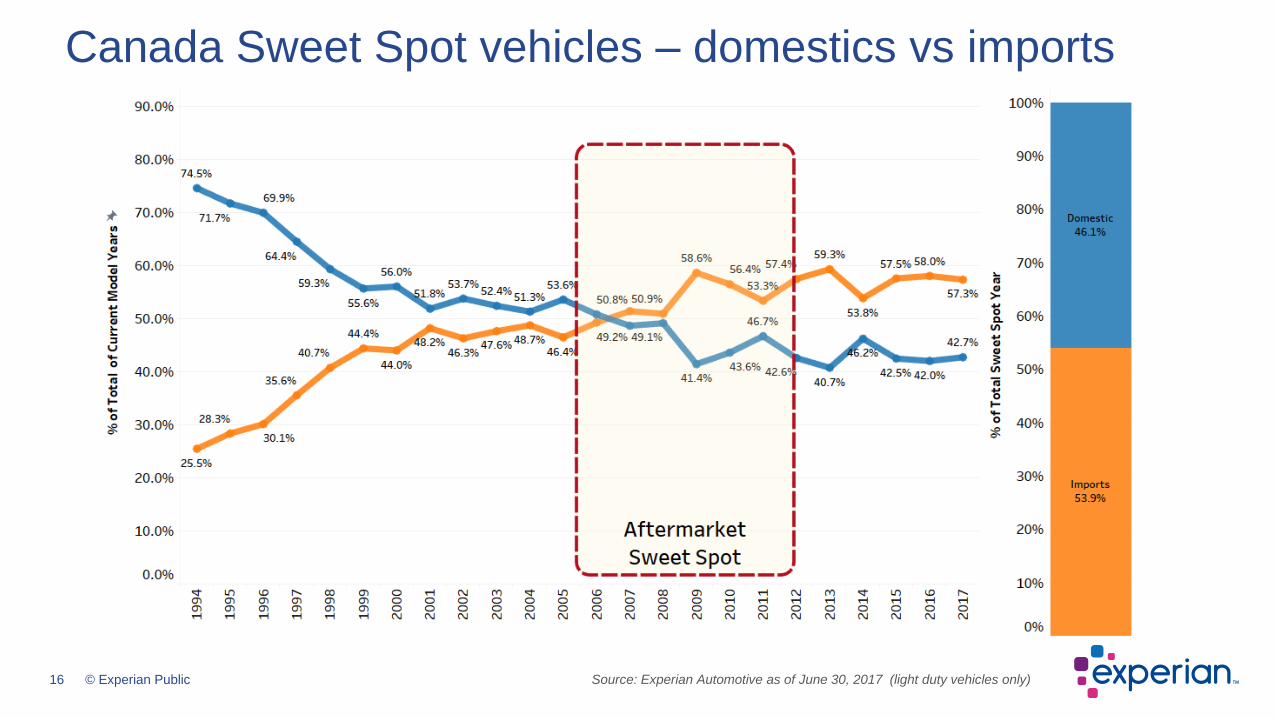
Canada Sweet Spot vehicles – domestics vs imports
Source: Experian Automotive as of June 30, 2017 (light duty vehicles only)
17 © Experian Public
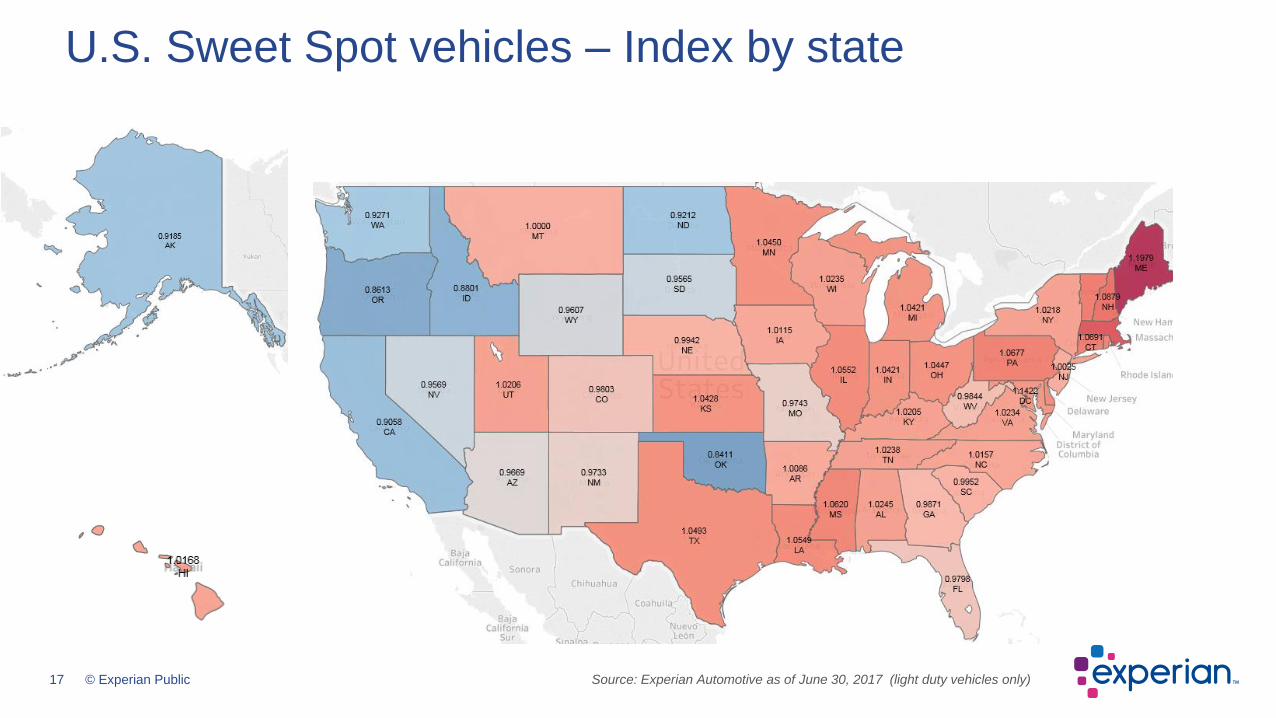
U.S. Sweet Spot vehicles – Index by state
Source: Experian Automotive as of June 30, 2017 (light duty vehicles only)
18 © Experian Public
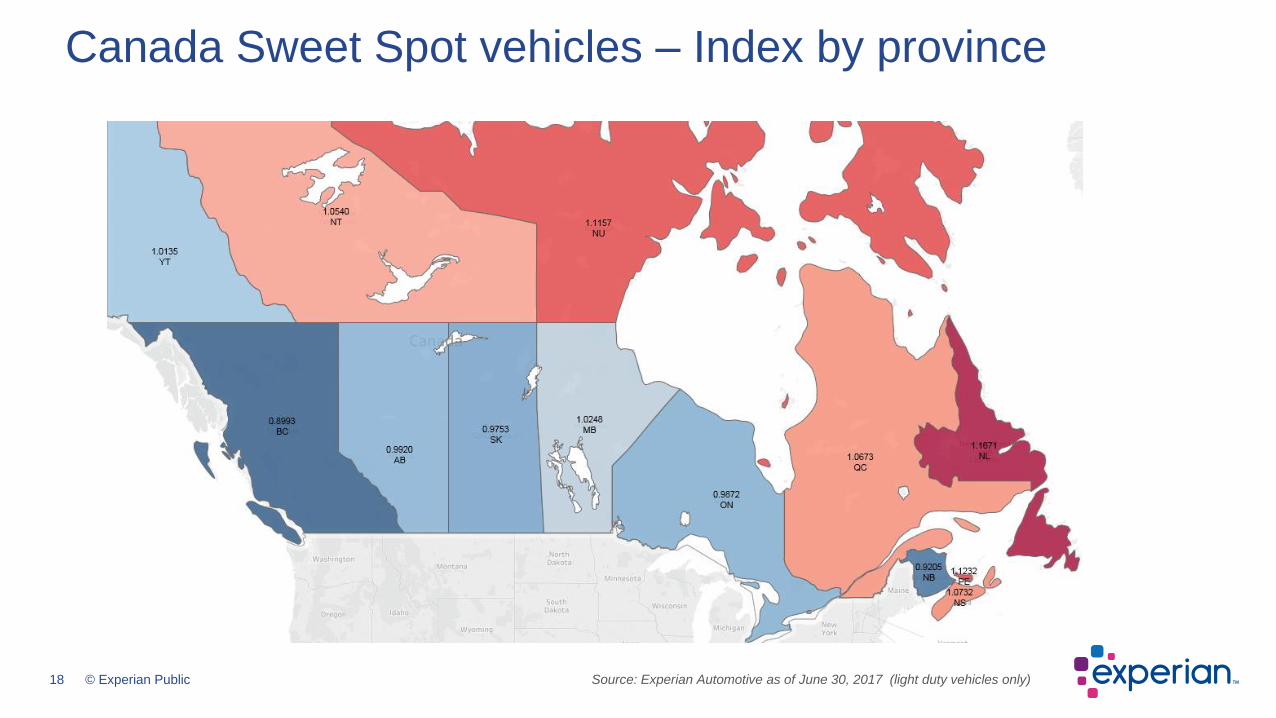
Canada Sweet Spot vehicles – Index by province
Source: Experian Automotive as of June 30, 2017 (light duty vehicles only)

19 © Experian Public
Hurricane potential impacts on TX and FL 2017
Hurricane Harvey – August 25-29, 2017
Hurricane Irma – September 10-11, 2017
New, Used and Vehicles in Operation
20 © Experian Public
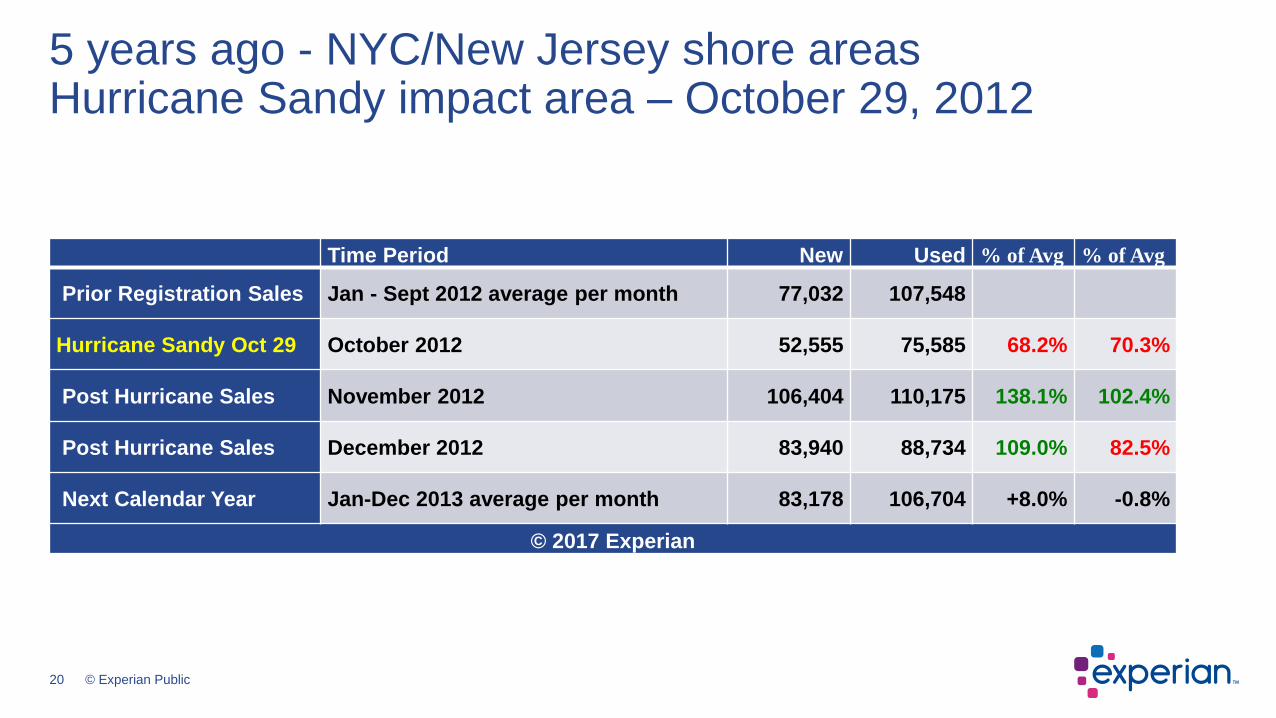
5 years ago - NYC/New Jersey shore areasHurricane Sandy impact area – October 29, 2012
Time Period New Used % of Avg % of Avg
Prior Registration Sales Jan - Sept 2012 average per month 77,032 107,548
Hurricane Sandy Oct 29 October 2012 52,555 75,585 68.2% 70.3%
Post Hurricane Sales November 2012 106,404 110,175 138.1% 102.4%
Post Hurricane Sales December 2012 83,940 88,734 109.0% 82.5%
Next Calendar Year Jan-Dec 2013 average per month 83,178 106,704 +8.0% -0.8%
© 2017 Experian
21 © Experian Public
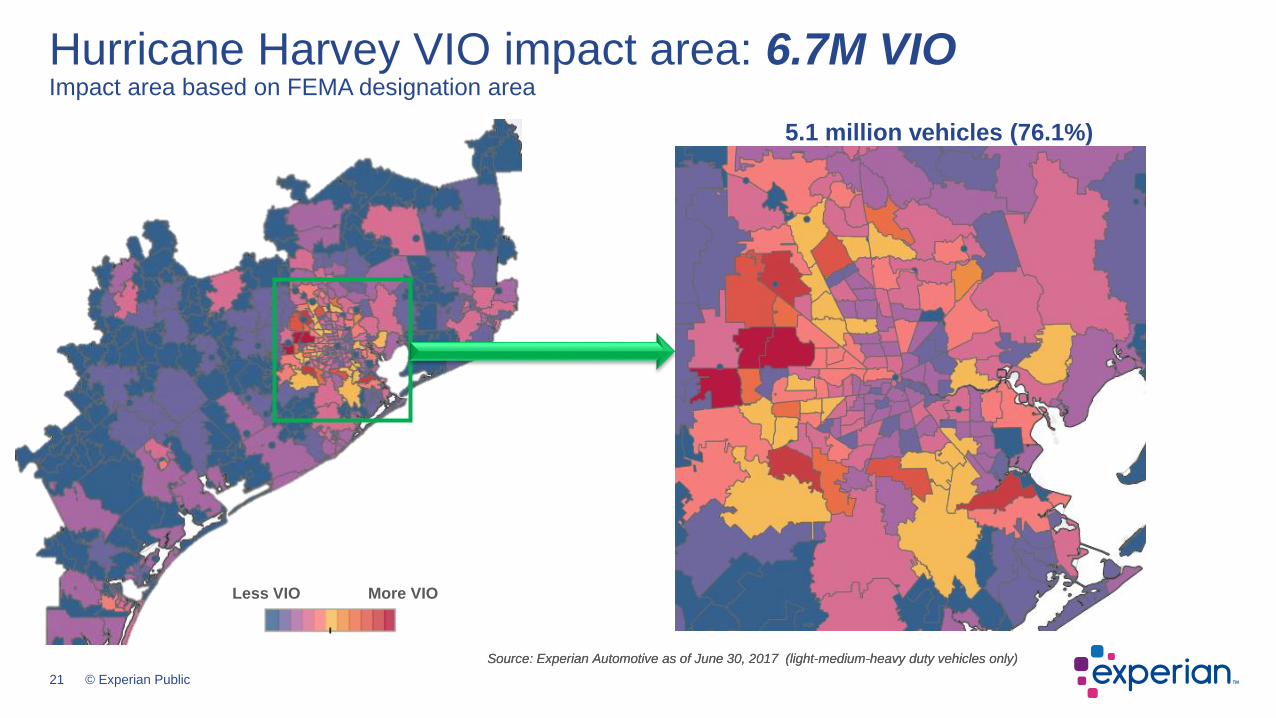
Hurricane Harvey VIO impact area: 6.7M VIOImpact area based on FEMA designation area
Source: Experian Automotive as of June 30, 2017 (light-medium-heavy duty vehicles only)Source: Experian Automotive as of June 30, 2017 (light-medium-heavy duty vehicles only)
Less VIO More VIO
5.1 million vehicles (76.1%)
22 © Experian Public
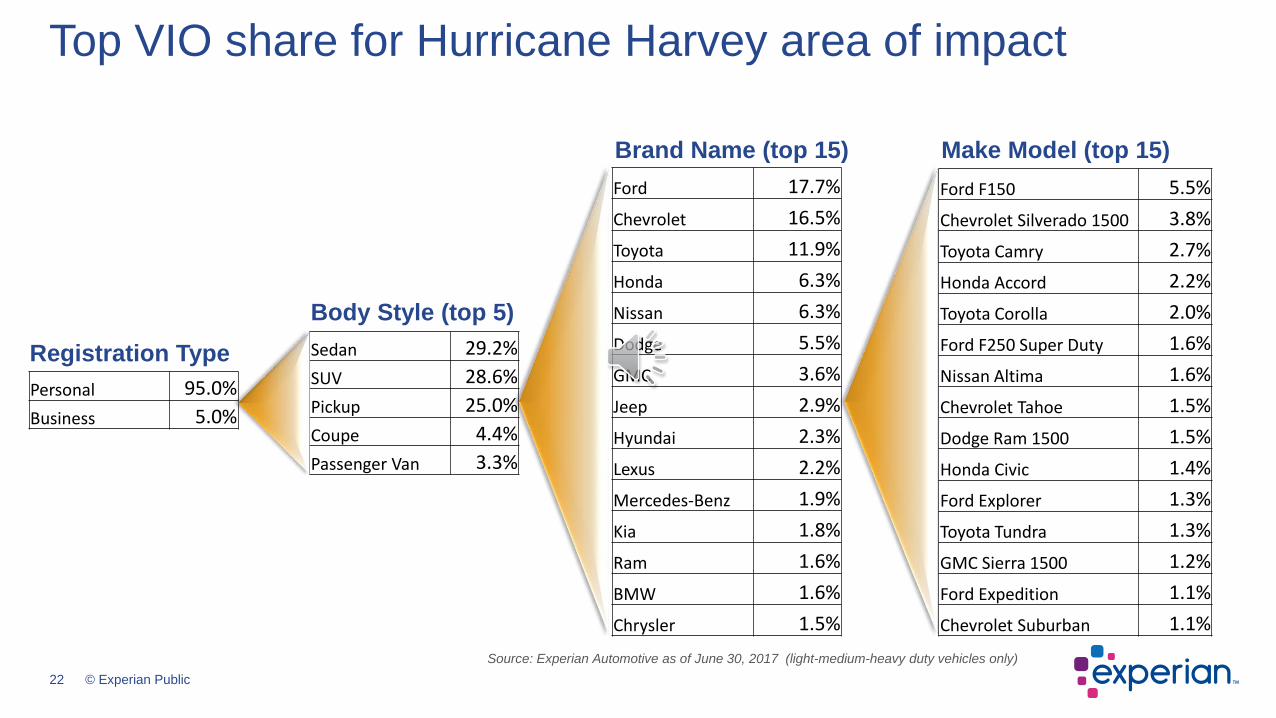
Top VIO share for Hurricane Harvey area of impact
Ford 17.7%
Chevrolet 16.5%
Toyota 11.9%
Honda 6.3%
Nissan 6.3%
Dodge 5.5%
GMC 3.6%
Jeep 2.9%
Hyundai 2.3%
Lexus 2.2%
Mercedes-Benz 1.9%
Kia 1.8%
Ram 1.6%
BMW 1.6%
Chrysler 1.5%
Brand Name (top 15)
Ford F150 5.5%
Chevrolet Silverado 1500 3.8%
Toyota Camry 2.7%
Honda Accord 2.2%
Toyota Corolla 2.0%
Ford F250 Super Duty 1.6%
Nissan Altima 1.6%
Chevrolet Tahoe 1.5%
Dodge Ram 1500 1.5%
Honda Civic 1.4%
Ford Explorer 1.3%
Toyota Tundra 1.3%
GMC Sierra 1500 1.2%
Ford Expedition 1.1%
Chevrolet Suburban 1.1%
Make Model (top 15)
Sedan 29.2%
SUV 28.6%
Pickup 25.0%
Coupe 4.4%
Passenger Van 3.3%
Body Style (top 5)
Personal 95.0%
Business 5.0%
Registration Type
Source: Experian Automotive as of June 30, 2017 (light-medium-heavy duty vehicles only)
23 © Experian Public
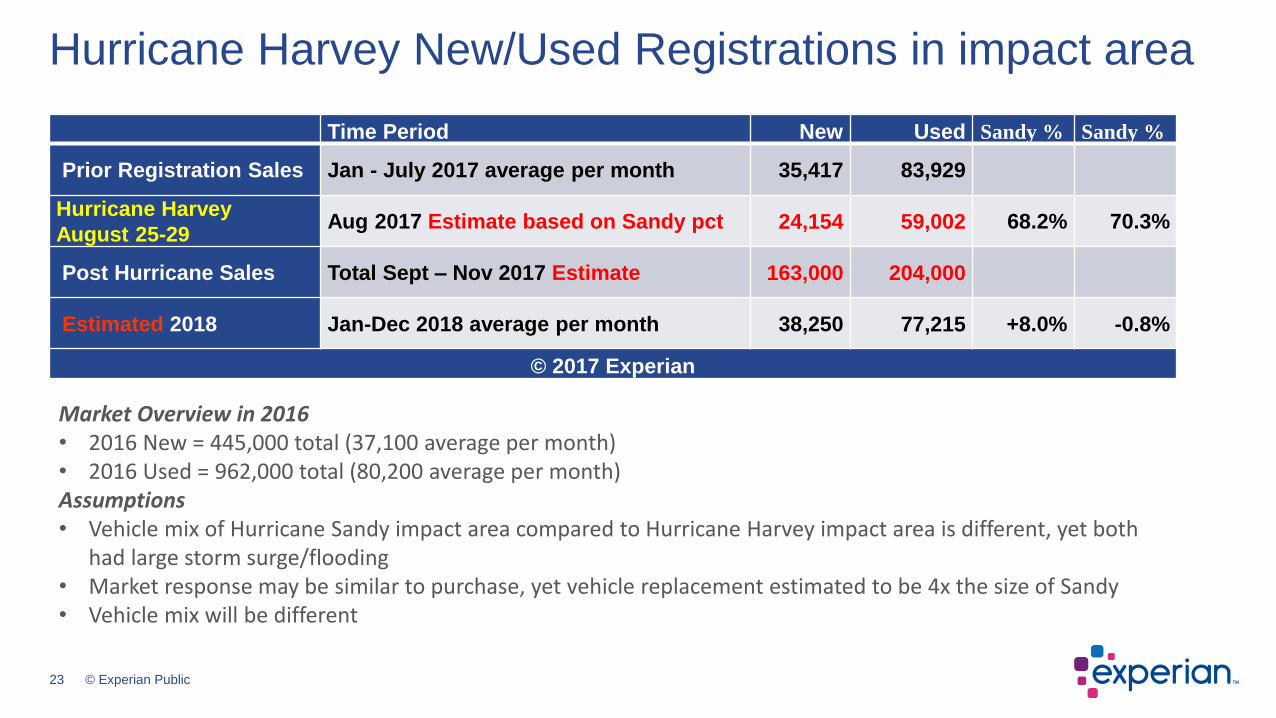
Hurricane Harvey New/Used Registrations in impact area
Time Period New Used Sandy % Sandy %
Prior Registration Sales Jan - July 2017 average per month 35,417 83,929
Hurricane Harvey
August 25-29Aug 2017 Estimate based on Sandy pct 24,154 59,002 68.2% 70.3%
Post Hurricane Sales Total Sept – Nov 2017 Estimate 163,000 204,000
Estimated 2018 Jan-Dec 2018 average per month 38,250 77,215 +8.0% -0.8%
© 2017 Experian
Market Overview in 2016• 2016 New = 445,000 total (37,100 average per month)• 2016 Used = 962,000 total (80,200 average per month)Assumptions• Vehicle mix of Hurricane Sandy impact area compared to Hurricane Harvey impact area is different, yet both
had large storm surge/flooding• Market response may be similar to purchase, yet vehicle replacement estimated to be 4x the size of Sandy• Vehicle mix will be different

24 © Experian Public
Hurricane Irma (Florida, September 9-10, 2017)3.4M coastal VIO
Hurricane Irma Impact Area
Potential
VIO: Florida (16.5M), Georgia
(8.9M), South Carolina (4.6M)
Too early for actual vehicle casualty
estimates
Known impact areas
High winds throughout entire
state of Florida and lower 1/2 Georgia
Higher storm surge, flooding across FL and east coast of GA and SC 3.4M
Reductions in vehicle
casualties
Advance warning led to a large
vehicle evacuation
Out of season for part time residents
(“snow birds”)
Source: Experian Automotive as of June 30, 2017 (light-medium-heavy duty vehicles only)
25 © Experian Public
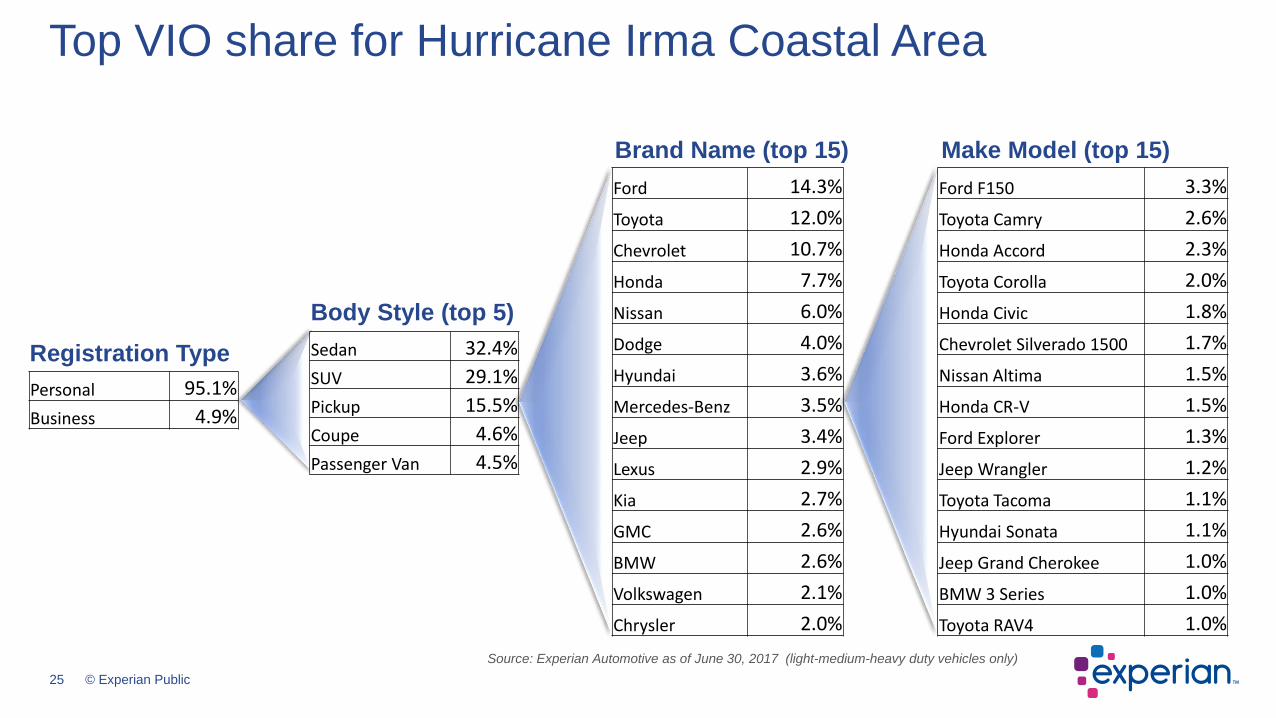
Top VIO share for Hurricane Irma Coastal Area
Personal 95.1%
Business 4.9%
Registration Type Sedan 32.4%
SUV 29.1%
Pickup 15.5%
Coupe 4.6%
Passenger Van 4.5%
Body Style (top 5)
Ford 14.3%
Toyota 12.0%
Chevrolet 10.7%
Honda 7.7%
Nissan 6.0%
Dodge 4.0%
Hyundai 3.6%
Mercedes-Benz 3.5%
Jeep 3.4%
Lexus 2.9%
Kia 2.7%
GMC 2.6%
BMW 2.6%
Volkswagen 2.1%
Chrysler 2.0%
Brand Name (top 15) Make Model (top 15)
Ford F150 3.3%
Toyota Camry 2.6%
Honda Accord 2.3%
Toyota Corolla 2.0%
Honda Civic 1.8%
Chevrolet Silverado 1500 1.7%
Nissan Altima 1.5%
Honda CR-V 1.5%
Ford Explorer 1.3%
Jeep Wrangler 1.2%
Toyota Tacoma 1.1%
Hyundai Sonata 1.1%
Jeep Grand Cherokee 1.0%
BMW 3 Series 1.0%
Toyota RAV4 1.0%
Source: Experian Automotive as of June 30, 2017 (light-medium-heavy duty vehicles only)
26 © Experian Public
• Total light duty VIO continues to grow to over 270.3 million in the U.S and 25.5 million in Canada
• The U.S. and Canada have similar yet different vehicle mix
• Sweet Spot continues to decline, yet beginning to slow
– Opportunities abound for those that can utilize data analysis opportunities
• Hurricanes Harvey and Irma will impact VIO
– Harvey impact area concentrated with potential for many flooded vehicles being taken out of operation
– Irma covered a large area though expectations are for lower out of operation volumes compared to overall market size
– Vehicle mix replenishment between the two storm areas will vary
– Consumers can utilize Experian’s AutoCheck vehicle history reports to help identify flooded vehicles for used vehicle purchases
Summary
27 © Experian Public
Today’s presentation
Follow us on Twitter
#EXPAuto
@Experian_Auto
Connect with us on LinkedIn
Experian Automotive
Presentation will be available shorty after the Webinar
Email with a link will be sent to all registrants to download
Questions? Contact us at [email protected]
28 © Experian Public
Thank youExperian Automotive is prepared to meet your needs with an integrated solution statically designed to drive your business forward

©2017 Experian Information Solutions, Inc. All rights reserved. Experian and the Experian marks used herein are trademarks
or registered trademarks of Experian Information Solutions, Inc. Other product and company names mentioned herein are the
trademarks of their respective owners. No part of this copyrighted work may be reproduced, modified, or distributed in any
form or manner without the prior written permission of Experian.
Experian Public