experience / expertise / excellence the changing landscape …€¦ · · 2017-06-01experience /...
TRANSCRIPT

1 Experience / Expertise / Excellence www.plgconsulting.com
Experience / Expertise / Excellence
THE CHANGING LANDSCAPE FOR ENERGY SHALE OIL & GAS OUTLOOK
Prepared for
Southwest Association of Rail Shippers October 8, 2015 – Dallas, TX Graham Brisben CEO, PLG Consulting

2 Experience / Expertise / Excellence www.plgconsulting.com
Experience ! Delivering value to over 200
clients since 2001
! Real-world, industry veterans
! Logistics, engineering & supply chain experts with operational experience
Core Expertise ! Bulk Logistics
! Freight Rail
! Logistics Infrastructure Design
! Energy & Chemical Markets
! Investment Advisory and Corporate Development
Partial Client List
Services ! Diagnostic assessments &
optimization
! Supply chain design & operational improvement
! Investment strategy, target identification, due diligence, post-transactional support
! Crude by rail (CBR) and rail tank car (RTC) forecasts
! Independent technology assessment & implementation
! Hazmat training, auditing & risk assessment
THE CHANGING LANDSCAPE FOR ENERGY: SHALE OIL & GAS OUTLOOK

3 Experience / Expertise / Excellence www.plgconsulting.com
Source: EIA, May 2014
US Shale
Source: CAPP, About Oil Sands
Western Canadian (WC) Oil Sands
Source: www.epmag.com
SAGD Horizontal Drilling & Hydraulic Fracturing
Source: Marathon, February 2014
“MOORE’S LAW” Exponential advances in technology, resulting in:
-Declining costs
-Surging production of natural gas,
crude oil, and HGLs

4 Experience / Expertise / Excellence www.plgconsulting.com
MMb/d B
cf/d
0
10
20
30
40
50
60
70
80
90
Jan-
2011
M
ar-2
011
May
-201
1 Ju
l-201
1 S
ep-2
011
Nov
-201
1 Ja
n-20
12
Mar
-201
2 M
ay-2
012
Jul-2
012
Sep
-201
2 N
ov-2
012
Jan-
2013
M
ar-2
013
May
-201
3 Ju
l-201
3 S
ep-2
013
Nov
-201
3 Ja
n-20
14
Mar
-201
4 M
ay-2
014
Jul-2
014
Sep
-201
4 N
ov-2
014
Jan-
2015
M
ar-2
015
May
-201
5 Ju
l-201
5 S
ep-2
015
Nov
-201
5 Ja
n-20
16
Mar
-201
6 M
ay-2
016
Jul-2
016
Sep
-201
6 N
ov-2
016
0
2
4
6
8
10
12
Domestic Crude, HGLs, and Dry Gas Production
Crude Oil Production (MMb/d) HGL Production from Processing Plants (MMb/d) Dry Gas Production (Bcf/d)
Source: EIA, October 2015

5 Experience / Expertise / Excellence www.plgconsulting.com
THE CHANGING LANDSCAPE FOR ENERGY: SHALE OIL & GAS OUTLOOK
Source: Petrochemical Update, September 2015
US Oil Production 1950-2015 Canadian Oil Sands Production and Forecast
Source: BMO Capital Markets, September 2015

6 Experience / Expertise / Excellence www.plgconsulting.com
Source: IEA, August 2015
Historical Front Month Oil Futures Prices
Source: EIA STEO, September 2015
U.S. Natural Gas Prices and Storage
Source: EIA STEO, October 2015

7 Experience / Expertise / Excellence www.plgconsulting.com
Pullback in Drilling Rigs, Well Completion
Retrenchment began in earnest 1Q 2015
! Rig count decline of 50% since beginning of the year
! Eliminated exploratory drilling – R&D budgets down by 30-50% for 2015
However, productivity advances from 2013-2014 continue to support production
! Higher yields per well ! Drilling “sweet spots” only ! Focusing on perfecting latest,
most productive fracking techniques
Source: Bentek Energy, September 2015
8 Experience / Expertise / Excellence www.plgconsulting.com
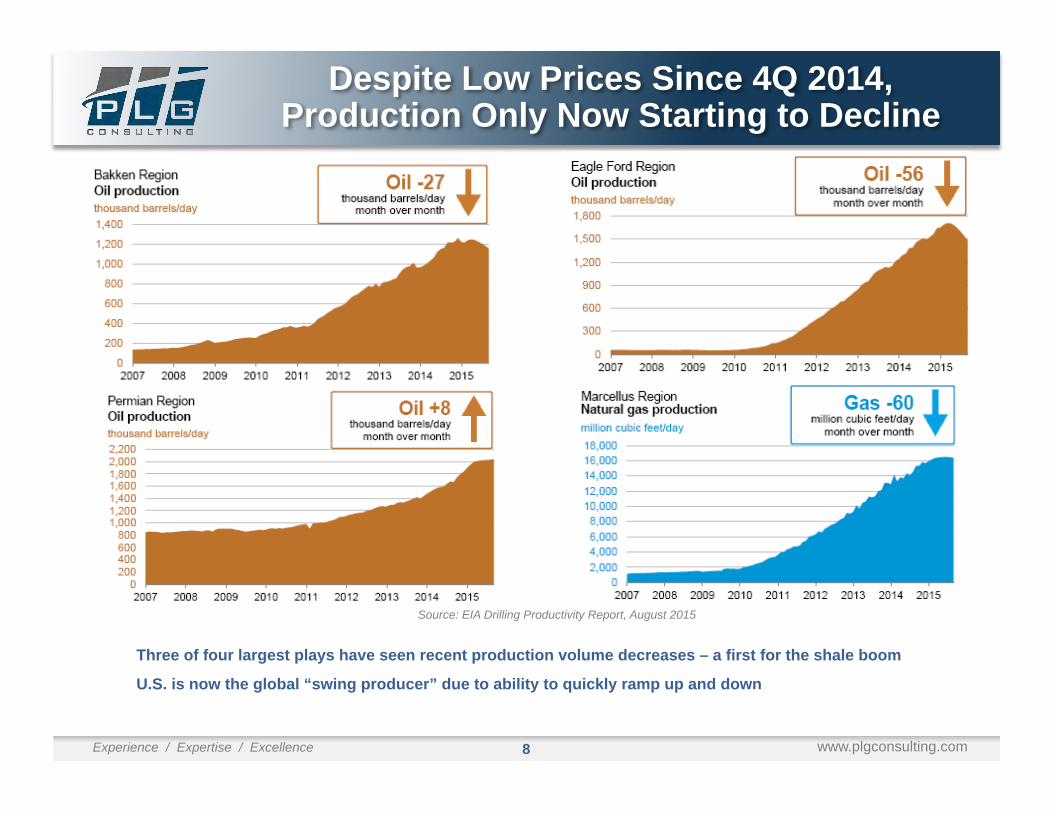
Despite Low Prices Since 4Q 2014, Production Only Now Starting to Decline
Three of four largest plays have seen recent production volume decreases – a first for the shale boom
U.S. is now the global “swing producer” due to ability to quickly ramp up and down
Source: EIA Drilling Productivity Report, August 2015
9 Experience / Expertise / Excellence www.plgconsulting.com
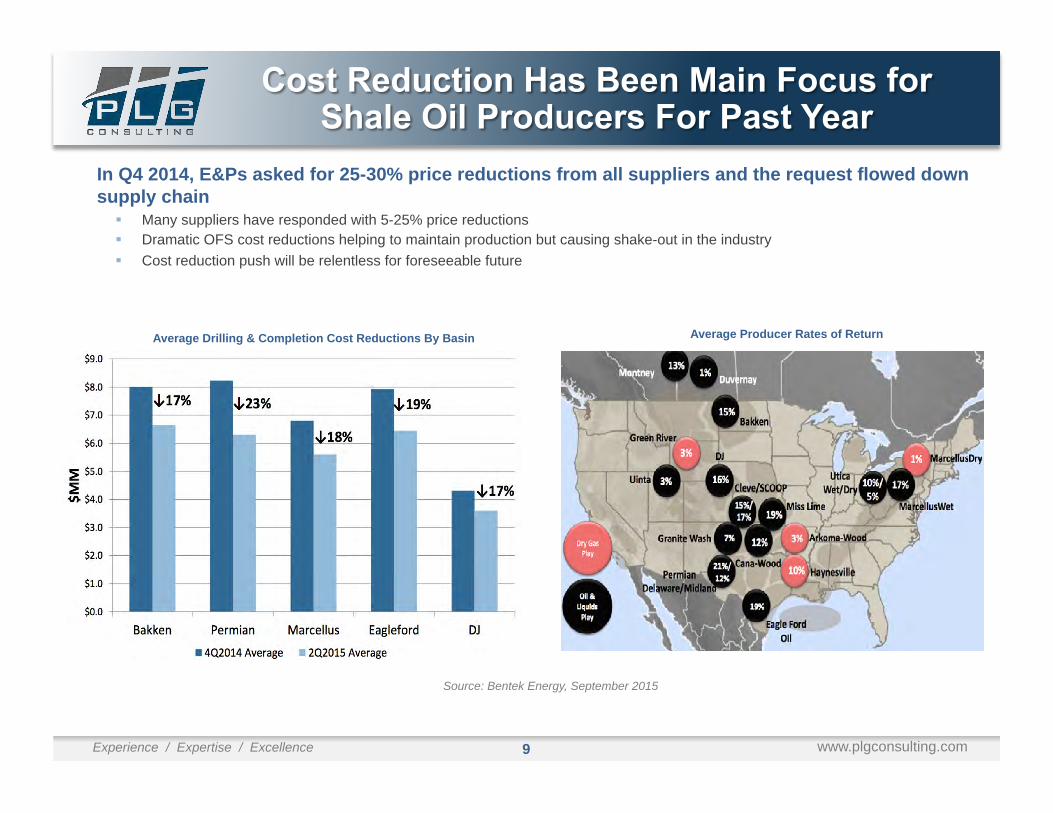
In Q4 2014, E&Ps asked for 25-30% price reductions from all suppliers and the request flowed down supply chain
! Many suppliers have responded with 5-25% price reductions ! Dramatic OFS cost reductions helping to maintain production but causing shake-out in the industry ! Cost reduction push will be relentless for foreseeable future
Average Drilling & Completion Cost Reductions By Basin
Source: Bentek Energy, September 2015
Average Producer Rates of Return

10 Experience / Expertise / Excellence www.plgconsulting.com
Feedstock (Ethane)
Byproduct (Condensate)
Home Heating (Propane)
Other Fuels
Other Fuels
Gasoline
Gas
NGLs
Crude
Proppants
OCTG
Chemicals
Water
Cement
Generation
Process Feedstocks
All Manufacturing
Steel
Fertilizer (Ammonia)
Methanol
Chemicals
Petroleum Products
Petrochemicals
Inputs Wellhead Direct Output Thermal Fuels Raw Materials
THE NEXT WAVE Manufacturing renaissance in the US based on
abundant, low cost energy and feedstocks
IMPACTS TO-DATE INCLUDE Dramatic reduction in crude imports, lower electricity costs, lower gasoline prices, increased refined products exports
Downstream Products
Significant rail impacts noted in red

11 Experience / Expertise / Excellence www.plgconsulting.com
0
500
1,000
1,500
2,000
2,500
0
20,000
40,000
60,000
80,000
100,000
120,000
140,000
160,000
U.S. QUARTERLY CARLOADS ORIGINATED FOR INDUSTRIAL SAND AND U.S. LAND RIGS
U.S. Quarterly Carloads Originated for Industrial Sand (STCC 14413)
U.S. Land Rigs
Shale Gas Boom
Rig Shift from Gas to Liquids
Shale Oil Boom
Oil Price Collapse
Note: PLG utilizes rail car origination loads as the best way to track sand industry volume trends
High Intensity Fracking
Carloads Rigs
Source: Baker Hughes and
Surface Transportation
Board, September
2015

12 Experience / Expertise / Excellence www.plgconsulting.com
Price Pressure Impacts on Sand Sourcing and Transportation
Source: NavPort and Headwaters MB, September 2015
Traditional source areas for Northern White (WI, MN, IL) began to lose market share in 2014
! Change in fracking techniques called for more 100 mesh from IL, MO
! New source areas allowed for barge shipments and more single-line rail hauls
Price pressure encouraging more mines closer to shale plays
! Logistics is by far the biggest cost
! Rail pricing has not followed same cost reductions as other parts of the supply chain
Expect continued innovation in the field to enable lower cost proppants

13 Experience / Expertise / Excellence www.plgconsulting.com
Source: NavPort and Headwaters MB, September 2015
Frac sand industry volume is close to bottoming out…near term volume recovery is unlikely
! Overall volume likely down >30% since 2014 peak
! Excessive capacity throughout each link in the supply chain
! Consolidation among players is expected
Sand and all services in supply chain remain under heavy price pressure
! 20-25% price reductions are “normal” in many areas
Logistics cost are >2/3 of the total delivered cost of sand
! Heavy focus on reducing rail costs
Small covered hopper market in a state of disarray
Impact of Price Collapse on Frac Sand Demand

14 Experience / Expertise / Excellence www.plgconsulting.com
Current market conditions ! Lots of cars in storage starting in Q4 2014
! Minimal outright cancellations of car orders – very difficult contractually; some moving out of new-build delivery schedules
! New-build production schedules are full through 2016 – many new cars direct to storage
Cement consumption is expected to grow by 8%+ in 2015 ! Cement also utilizes small covered hoppers; small help to the
market - may be build/lease opportunities for cement cars with frac sand downturn
Plastic pellet cars market growing and may allow some small hopper car buyers to shift orders to large covered hopper cars
Major questions surround small covered hopper market after backlog build out in 2016
! Gas market growth slowed by low gas prices resulting in low gas rig count; oil price level will be key driver on future oil rig counts and sand usage
! Frac sand industry consolidation will further rationalize the car market
! Industry will continue to slowly move to more unit trains – improved cycle time reduces car volume requirement
! These negative factors could cause extended difficult market conditions
0
1
2
3
4
5
6
0
10,000
20,000
30,000
40,000
Backlog
Orders
Deliveries
Order/Del'y Ratio
Source: Chicago Freight Car Leasing, RSI, March 2015
Small Cube Hopper Car Orders
15 Experience / Expertise / Excellence www.plgconsulting.com
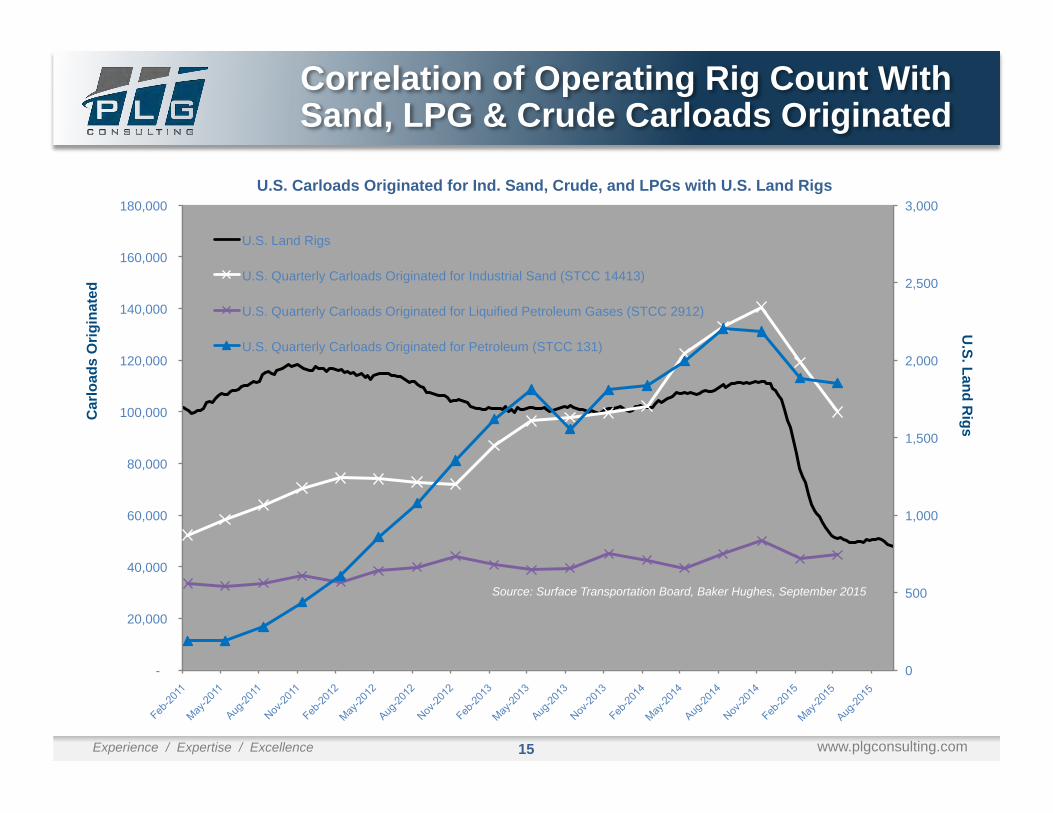
Correlation of Operating Rig Count With Sand, LPG & Crude Carloads Originated
-
20,000
40,000
60,000
80,000
100,000
120,000
140,000
160,000
180,000
0
500
1,000
1,500
2,000
2,500
3,000 U.S. Carloads Originated for Ind. Sand, Crude, and LPGs with U.S. Land Rigs
U.S. Land Rigs
U.S. Quarterly Carloads Originated for Industrial Sand (STCC 14413)
U.S. Quarterly Carloads Originated for Liquified Petroleum Gases (STCC 2912)
U.S. Quarterly Carloads Originated for Petroleum (STCC 131)
Car
load
s O
rigin
ated
U
.S. Land Rigs
Source: Surface Transportation Board, Baker Hughes, September 2015

16 Experience / Expertise / Excellence www.plgconsulting.com
US Crude-by-Rail (CBR) Growth
Source: EIA, March 2015
Bakken play the primary origin area for US CBR ! Rail volumes have flattened since 2014 due to increased
pipeline capacity and smaller Brent-WTI differentials
0
200
400
600
800
1,000
1,200
1,400
Jan-
10
Apr
-10
Jul-1
0 O
ct-1
0 Ja
n-11
A
pr-1
1 Ju
l-11
Oct
-11
Jan-
12
Apr
-12
Jul-1
2 O
ct-1
2 Ja
n-13
A
pr-1
3 Ju
l-13
Oct
-13
Jan-
14
Apr
-14
Jul-1
4 O
ct-1
4 Ja
n-15
A
pr-1
5 Ju
l-15
Oct
-15
Bakken Region Production (kb/d)
PADD 2 Crude by Rail (kb/d)
Source: Data from EIA DPR and EIA Crude Oil by Rail, September, 2015
US Bakken Region Crude Production & PADD 2 CBR (k/bpd)

17 Experience / Expertise / Excellence www.plgconsulting.com
NA Crude Logistics Today
THE CHANGING LANDSCAPE FOR ENERGY: SHALE OIL & GAS OUTLOOK
Light/Sweet
Heavy/Sour
Permian
Bakken
Eagle Ford
Oil Sands
GOM
Light/Sweet
Heavy/Sour
LA Gulf Coast Refiners
TX Gulf Coast Refiners
PADD 3 Demand 8,550
kbpd
Midwest Refiners
PADD 2 Demand 3,575 kbpd
East Coast Refiners
PADD 1 Demand 1,100 kbpd
Pacific Northwest Refiners
California Refiners
PADD 5 Demand
2,525 kbpd
Sources: EIA, PLG analysis (Google Earth)
Rail
Pipeline
Marine
Imports Coming Back?

18 Experience / Expertise / Excellence www.plgconsulting.com
Crude Oil Price Forecast
Crude oil prices forecasted to improve as supply contracts, global demand increases over several years
2015 and 2016 are and will be very challenging
Return of $100/bbl. oil: Don’t hold your breath
“New normal” of $60-$70/bbl. expected to maintain after 2017
Brent-WTI differential expected to continue to be challenging for CBR volumes
THE CHANGING LANDSCAPE FOR ENERGY: SHALE OIL & GAS OUTLOOK
$0
$10
$20
$30
$40
$50
$60
$70
$80
$90
2015 2016 2017 2018 2019 2020 2021 2022 2023 2024 2025
WTI (Cushing) Forecast Pricing Brent - WTI Brent (Sullom Voe) WTI (Cushing)
Source: Turner Mason, October 2015

19 Experience / Expertise / Excellence www.plgconsulting.com
Selected Major Pipeline Projects
Source: CAPP, PLG analysis
Enbridge Mainline
Expansion
Sunoco-ETP Permian Express Phase II
ETP Dakota Access
Enbridge Flanagan South &
Seaway Twin Expansions
Enbridge Line 9
Reversal
Enterprise Midland-to-
Houston
Spectra Platte Twin
KM Trans-Mountain
Expansion & Enbridge Northern Gateway
TransCanada Keystone XL
TransCanada Energy East

20 Experience / Expertise / Excellence www.plgconsulting.com
THE CHANGING LANDSCAPE FOR ENERGY: SHALE OIL & GAS OUTLOOK
CBR share of production expected to decrease due to new pipeline capacity coming online, trend to pipelines in lower price environment, and narrow
WTI-Brent price differentials
-
200
400
600
800
1,000
1,200
1,400
2014 2015 2016 2017 2018 2019 2020
Bakken Takeaway Forecast (kbpd)
Crude by Rail Forecast
Pipeline Forecast
Local Refinery Forecast
Note: Based on $52-64 WTI price
Source: PLG Crude by Rail & Tank Car Forecast, Oct. 2015
Bakken Production and Takeaway Share

21 Experience / Expertise / Excellence www.plgconsulting.com
Western Canada Production and Takeaway Share
THE CHANGING LANDSCAPE FOR ENERGY: SHALE OIL & GAS OUTLOOK
-
500
1,000
1,500
2,000
2,500
3,000
3,500
4,000
4,500
5,000
2014 2015 2016 2017 2018 2019 2020
Western Canada Takeaway Forecast (kbpd)
CBR Forecast
Pipeline Forecast
Local Refinery Forecast
Source: PLG Crude by Rail & Tank Car Forecast, Oct. 2015
Proportion of production handled by rail expected to ramp up through 2016 and then drop back as pipeline capacity starts to develop
Note: Based on $52-64 WTI price

22 Experience / Expertise / Excellence www.plgconsulting.com
North American CBR Forecast Overview
THE CHANGING LANDSCAPE FOR ENERGY: SHALE OIL & GAS OUTLOOK
Source: PLG Crude by Rail & Tank Car Forecast, Oct. 2015
Bakken & Oil Sands are main drivers of CBR volumes
-
100
200
300
400
500
600
700
800
2014 2015 2016 2017 2018 2019 2020
North America Crude by Rail Volume Forecast (kbpd)
Bakken
Western Canada
Niobrara
Permian
Note: Based on $52-64 WTI price

23 Experience / Expertise / Excellence www.plgconsulting.com
DOT 117 Car Specification
Source: AllTranstek LLC
New rules were issued by U.S. DOT on May 1st, and effective July 7, 2015, covering the areas of:
! Tank Car standards for both new and existing cars used in High Hazard Flammable trains
! Enhanced braking systems requirements
! Classification of unrefined petroleum based products
! Rail Routing risk assessments and information
! Rail Network operating speeds
Implementation schedule by car type/commodity that “feathers in” need for new/retrofitted car by up to 10 years vs. NPRM of up to 3 years for PG I and PG II – largely focused on crude and ethanol
Electronically Controlled Pneumatic (“ECP”) braking system requirement for HHFUTs is most contentious area of ruling
U.S. and Canada rules are largely harmonized
Retrofit standard is less than new standard (7/16” shell for retrofit vs. 9/16” shell for new)
2Q 2015 tank car orders down 29% vs. 1Q 2015 and 70% vs. 2Q 2014
Current backlog at ~46,000 cars, down 11% since start of year
Lease rates between $500-$1,000 per car per month based on spec
Similar to small cube hoppers, significant oversupply exists with some new builds going straight into storage
More cars expected to be scrapped than retrofitted ! Soft market conditions and regulatory grace period resulting in
“wait and see” approach
! Backlog of cars will be built to new 117 standard
Tank Car Regulatory and Market Dynamics

24 Experience / Expertise / Excellence www.plgconsulting.com
Regulation & Shale Gas Supply Contributing to Reduced Coal Demand
Source: EIA and Carbon Brief, September 2015
Source: Petrochemical Update, September 2015
US Shale Gas Production

25 Experience / Expertise / Excellence www.plgconsulting.com
0
200,000
400,000
600,000
800,000
1,000,000
1,200,000
1,400,000
1,600,000
1,800,000
U.S. QUARTERLY CARLOADS ORIGINATED
STCC 14413 - Industrial sand and gravel (includes frac sand)
STCC 131 - Crude Petroleum and Natural Gas
STCC 1121 - Bituminous coal
4 Qtr. Avg. 1,754,908
4 Qtr. Avg. 1,466,184
4 Qtr. Avg. 77,644
4 Qtr. Avg. 245,012
-288,724
+167,368
Source: Surface Transportation Board

26 Experience / Expertise / Excellence www.plgconsulting.com
THE CHANGING LANDSCAPE FOR ENERGY: SHALE OIL & GAS OUTLOOK
US gas demand will grow due to: ! Coal-fired generation plant converting to gas
! More industrial use – steel, fertilizer, methanol
! Mexican export via pipeline and LNG export overseas
! Increasing use as transportation fuel
US gas cost competitiveness is sustainable ! 30+ year supply at ~$4 mm/btu; cost of production
decreasing ! Supply will overwhelm demand as prices
approach $5/
Low-cost gas and NGLs driving US industrial “renaissance”
Source: EIA, September 2015
Source: EIA for historical and CME Group Oct 2, 2015 settlements for futures
60
65
70
75
80
85
2013 2014 2015 2016
U.S. Natural Gas Production (Bcf/day)
Historical Projections
0 2 4 6 8
10 12 14
2008 2009 2010 2011 2012 2013 2014 2015 2016 2017 2018 2019 2020
Natural Gas Price at Henry Hub ($/MMBTU)
Historical Futures
27 Experience / Expertise / Excellence www.plgconsulting.com
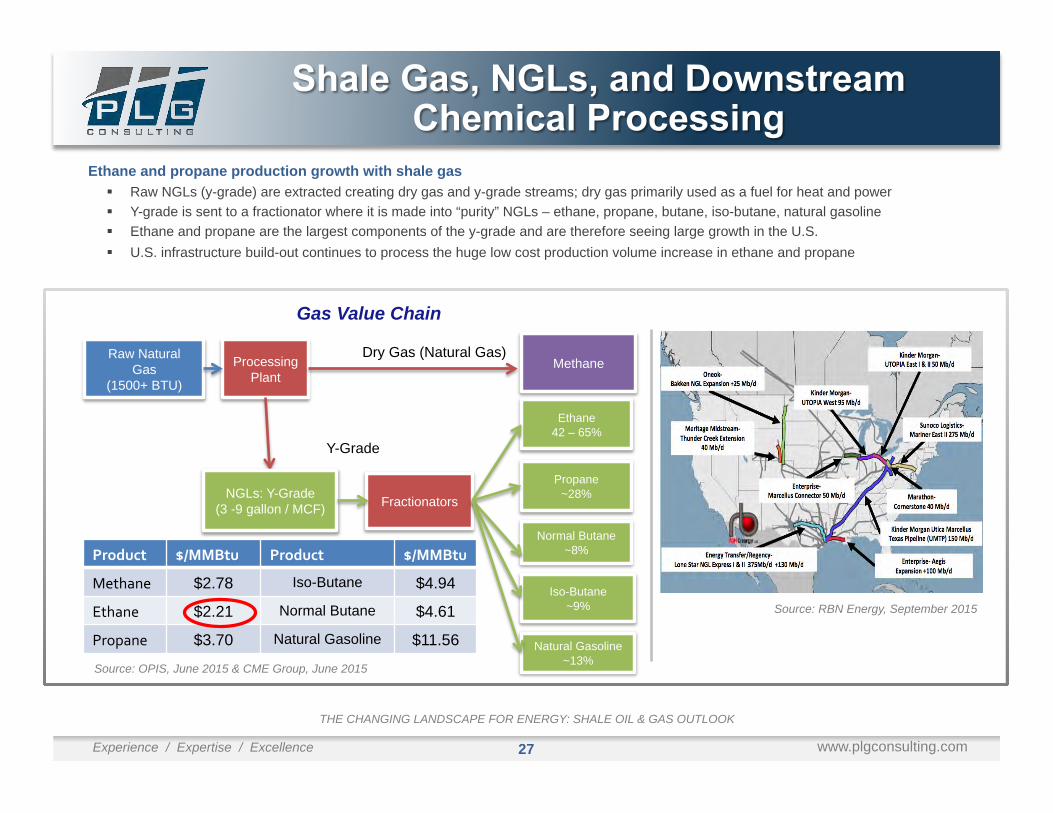
Ethane and propane production growth with shale gas ! Raw NGLs (y-grade) are extracted creating dry gas and y-grade streams; dry gas primarily used as a fuel for heat and power ! Y-grade is sent to a fractionator where it is made into “purity” NGLs – ethane, propane, butane, iso-butane, natural gasoline ! Ethane and propane are the largest components of the y-grade and are therefore seeing large growth in the U.S. ! U.S. infrastructure build-out continues to process the huge low cost production volume increase in ethane and propane
Source: OPIS, June 2015 & CME Group, June 2015
Gas Value Chain
Dry Gas (Natural Gas) Raw Natural Gas
(1500+ BTU)
Processing Plant
Methane
Ethane 42 – 65%
Propane ~28%
Normal Butane ~8%
Iso-Butane ~9%
Natural Gasoline ~13%
Fractionators NGLs: Y-Grade (3 -9 gallon / MCF)
Y-Grade
Product $/MMBtu Product $/MMBtu
Methane $2.78 Iso-Butane $4.94
Ethane $2.21 Normal Butane $4.61
Propane $3.70 Natural Gasoline $11.56
THE CHANGING LANDSCAPE FOR ENERGY: SHALE OIL & GAS OUTLOOK
Source: RBN Energy, September 2015

28 Experience / Expertise / Excellence www.plgconsulting.com
Abundant feedstock, structural cost advantages, and domestic market growth driving US petrochemical industry expansion
Rate of expansion growth will be slowed by ! Volatility of market prices – some based on oil prices
! Lack of EPC capacity
! Shortage of craft labor resources in the U.S. Gulf Coast
! Increasing regulatory hurdles and delays
Expansion peak will be dampened and overall build-out will take longer than announced schedules
! 2nd wave possible early next decade
U.S. chemical industry is entering a historic growth period with incredible growth opportunities and challenges
Sou
rce:
Pet
roch
emic
al U
pdat
e, S
epte
mbe
r 201
5
Oil to Gas Prices
U.S. Ethane Supply Balance
Natural Gas HH Spot Brent Oil

29 Experience / Expertise / Excellence www.plgconsulting.com
Ethylene and Propylene
Ammonia and Deriva=ves
Methanol
Polymers and Resins
Chlor-‐alkali
Other
Source: American Chemistry Council and PLG analysis
PLG’s SHIELD Database
• Shale gas Industrial Expansion Logistics Database
• Interactive information on over 150 projects at launch
• Includes PLG chemical industry expert insights on logistics volumes per project
• Expected release Fall 2015
THE CHANGING LANDSCAPE FOR ENERGY: SHALE OIL & GAS OUTLOOK

30 Experience / Expertise / Excellence www.plgconsulting.com
Shale gas Industrial Expansion Logistics Database (SHIELD) is the first comprehensive, searchable database that provides detailed project information on all the announced shale gas industrial expansion projects. Additionally, PLG’s petrochemical industry experts provide SHIELD’s subscribers with projected logistics volumes by mode for each project.
Features include: ! User-friendly, interactive database with mapping to display
facility locations
! Advanced search and query functionality
! Real time alerts on project updates per subscriber preference
Sample product categories include: ! Ammonia and derivatives
! Ethylene and Propylene
! Methanol
! Polymers and resins
Beta version will be released November 16, 2015 with over 150 projects included
Representative Sample
Sample of searchable fields

31 Experience / Expertise / Excellence www.plgconsulting.com
Thank You!
For follow up questions and information, please contact:
Taylor Robinson President
+1 (508) 982-1319 | [email protected]