experience with ex-ante impact assessments and lessons learned · experience with ex-ante impact...
TRANSCRIPT

Experience with ex-ante impact
assessments and lessons learned
Carlos J. de Miguel
([email protected]) Sustainable Development and Human Settlements Division
OECD WORKSHOP on
“Regional trade agreements and the environment: monitoring implementation
and assessing impacts”
Paris, France, 1-2 June 2010

Socioeconomic Context LAC
- Middle income, strong disparities among countries
- Economic growth (around 4%), but less than other
developing economies
- Per capita income diverges from OECD (1980 + 35%,
2006 + 25%)
- Poverty (2008): slightly positive balance in comparison
to the 2 previous decades (33%, 13% of indigence). Poor
population :180 millions (71 indigents).
- Most uneven region in the world
- Unemployment around 8%, increasing informality

Production and Trade
- Low share in world exports (around 5% vs 4% at early 90s)
- Heterogeneity of productive structure and asymmetries
- Heterogeneity of exports structure
- Mexico & Central America: maquila, dynamic manufactures (ICT)
- Caribbean: services (tourism, financial sectors)
- South America: commodities and natural resources intensive products
- Dynamisms of exports, 7% (with subregional differences linked to the export pattern). Natural resources
- Competitiviness of environmentally sensitive industries
- Decoupling?

LAC and its subregions: evolution of exports, by
technological content, From 1980 to 2008
(In percentages of total exports, 1980-2008)
c) Mexico d) South America
a) Latin America and Caribbean b) Central America
0%
20%
40%
60%
80%
100%
1980-1984 1990-1994 2000-2004 2005-2008
0%
20%
40%
60%
80%
100%
1980-1984 1990-1994 2000-2004 2005-2008
0%
20%
40%
60%
80%
100%
1980-1984 1990-1994 2000-2004 2005-2008
0%
20%
40%
60%
80%
100%
1980-1984 1990-1994 2000-2004 2005-2008
0% 100%
1980-1984 1990-1994 2000-2004 2005-2008
High Technology Medium Technology Low Technology Manufactures based on NN.RR. Primay Products

LAC: MFN tariff levels 1980, 1990 and 2008
AVERAGE MFN TARIFF
Weighted by preferential agreements,
the average regional tariff drops to 4,5%
> 100%
29%
9%

Mercosur – Unión Europea;
CARICOM – Unión Europea;
CARICOM – Canadá
Chile – Canadá, Estados Unidos, Unión Europea, Asociación Europea de
Libre Comercio (AELC), Turquía, Japón;
México – Estados Unidos, Canadá, AELC, Unión Europea, Japón;
CAFTA –RD – MCCA; República Dominicana – Estados Unidos, Unión
Europea; Costa Rica – Canadá; MERCOSUR-Israel; Colombia-Estados
Unidos, Canadá, AELC; Perú – Canadá, Estados Unidos;
Panamá-Canadá ;CARICOM-Unión Europea; MCCA-Unión Europea;
Current Agreements Future Agreements
(subscribed) (Negotiations)
Brasil – Marruecos; Brasil – Egipto
Chile – República de Corea; Chile – Nueva Zelandia, Singapur, Brunei;
Mercosur – India (450 productos); Chile – China, India; Perú – Tailandia,
Singapur, China; Mercosur – Unión Aduanera del África Meridional (SACU);
CARICOM – MERCOSUR;
Comunidad Andina – El Salvador,
Guatemala, y Honduras;
México – Mercosur
Comunidad Andina (CAN): Bolivia, Colombia, Ecuador, Perú y República
Bolivariana de Venezuela;
Mercado Común del Sur (Mercosur): Argentina, Brasil, Paraguay y Uruguay;
Mercado Común Centromericano (MCCA): Costa Rica, El Salvador, Guatemala,
Honduras y Nicaragua;
Chile – CAN, MCCA, México, Panamá;
México – Centroamérica; México – Uruguay;
México – Bolivia; CAN – MERCOSUR;
Comunidad del Caribe (CARICOM); CARICOM – Costa Rica
CARICOM – República Bolivariana de Venezuela; CARICOM – Colombia; Grupo
de los Tres: Colombia, México y República Bolivariana de Venezuela; MCCA –
República Dominicana; Chile -Perú
Norte
Sur
Trade Agreements in LAC
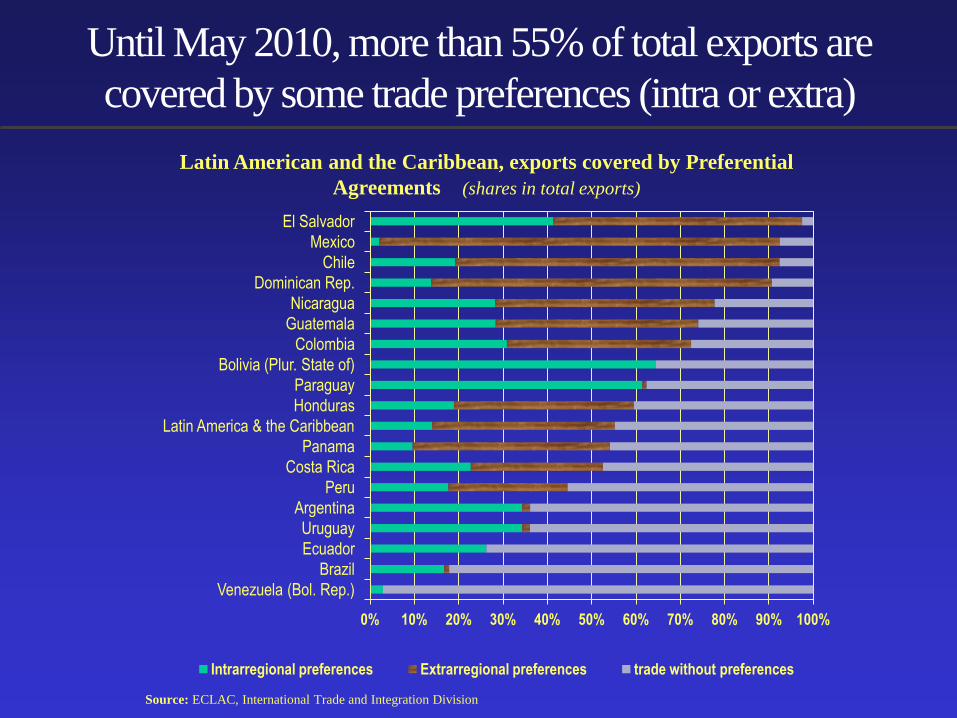
Until May 2010, more than 55% of total exports are
covered by some trade preferences (intra or extra)
0% 10% 20% 30% 40% 50% 60% 70% 80% 90% 100%
Venezuela (Bol. Rep.)
Brazil
Ecuador
Uruguay
Argentina
Peru
Costa Rica
Panama
Latin America & the Caribbean
Honduras
Paraguay
Bolivia (Plur. State of)
Colombia
Guatemala
Nicaragua
Dominican Rep.
Chile
Mexico
El Salvador
Intrarregional preferences Extrarregional preferences trade without preferences
Latin American and the Caribbean, exports covered by Preferential
Agreements (shares in total exports)
Source: ECLAC, International Trade and Integration Division

There are methodologies for
environmental/sustainability
assessment • UNEP (2001), OECD (1994), EU – SIA (1999,
2006), NAFTA/NAAEC-Commission for
Environmental Cooperation (1999), Canada
(2001, 2008), WWF (1994), USA Executive
Order 13141 (1999), etc.
Executive Order 13141: Any process of trade policy, consistent and comprehensive:
• Consider the environmental impacts
• Identify the complementarities between trade and environmental goals

General Objetives of an
Environmental Assessment
1. Promote sustainable development through trade
agreements => improve welfare
2. Create positive synergies and balance among
trade, environmental and social interest (global,
regional and local)
3. Inform negotiators
4. Design sound public policies
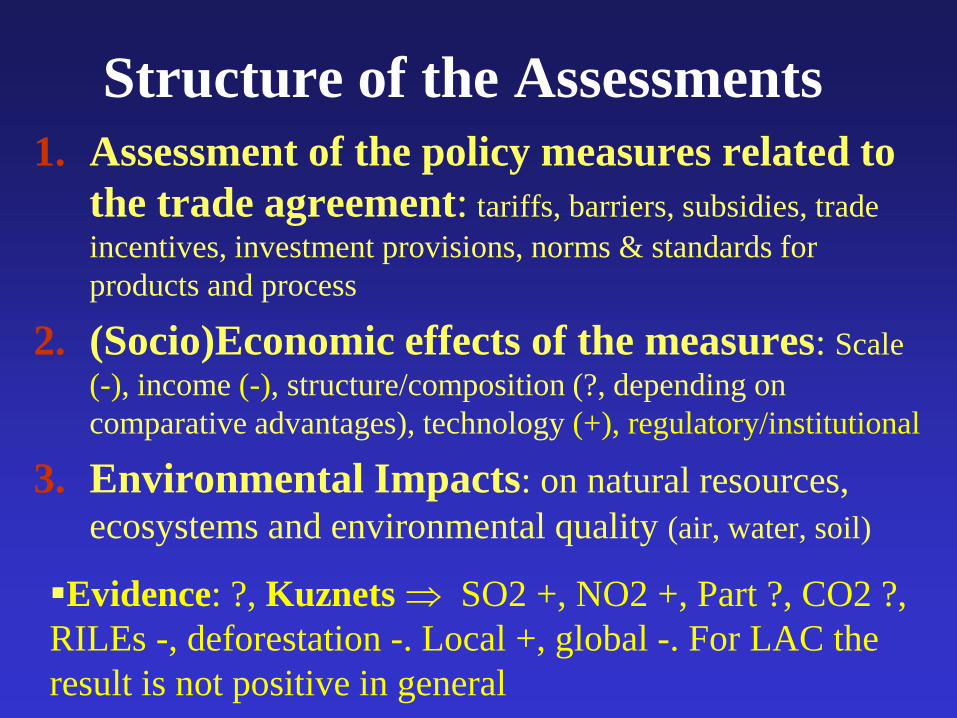
Structure of the Assessments
1. Assessment of the policy measures related to
the trade agreement: tariffs, barriers, subsidies, trade
incentives, investment provisions, norms & standards for
products and process
2. (Socio)Economic effects of the measures: Scale
(-), income (-), structure/composition (?, depending on
comparative advantages), technology (+), regulatory/institutional
3. Environmental Impacts: on natural resources,
ecosystems and environmental quality (air, water, soil)
Evidence: ?, Kuznets SO2 +, NO2 +, Part ?, CO2 ?,
RILEs -, deforestation -. Local +, global -. For LAC the
result is not positive in general

Environmental Assessments usually are not
included explicitly in trade agreements…
Reasons:
- No rule/obligation
- Reluctance to include environmental issues in the
framework of the trade negotiations.
- Complexity of the technical and methodological analysis
- Budgetary constrains for empirical work
- Lack of information, statistics and indicators
- Room for improvement on participation, access to inf. …
In practice increasing number of assessments, but:
- They are economic (mainly macro and sectoral), partial,
Ex-post, without environmental asessments

What say the numbers?
Mainly with CGE models
Confirm theory:
Trade not necessary improve welfare or the
environment (when environmental externalities are
not accounted)
Trade may improve welfare, despite externalities,
if positive composition effects dominate

ECLAC Assessments/Studies
– Raúl O'Ryan, Carlos de Miguel, Sebastian Miller and Mauricio Pereira (2010), “The Socioeconomic and Environmental effects of Free Trade Agreements: A dynamic CGE analysis for Chile”, Environmental Development Economics, forthcoming.
– J. Durán, De Miguel, C., Pereira, M. and Véliz, G. (2010), “Assessing the impact of non-Tariffs Barriers during the global Crisis: the experience in Argentina, Ecuador and Venezuela”, Serie Comercio Internacional, forthcoming CEPAL
– Carlos de Miguel, Carlos Ludena and Andres Schuschny (2010) “Climate change and reduction of CO2 emissions: the role of developing countries in carbon trade markets”, Serie Medio Ambiente y Desarrollo, forthcoming CEPAL
– R.J. Herrera and M. Bonilla (2009) “Guía de Evaluación Ambiental Estratégica” Colección documento de proyecto, CEPAL
– Jose Durán, Carlos Ludeña, Mariano Alvarez and Carlos de Miguel, (2008) “Acuerdo de Asociación Centroamérica-Union Europea: Evaluación utilizando Equilibrio General computable y Equilibrio Parcial”, Colección documento de proyecto, CEPAL
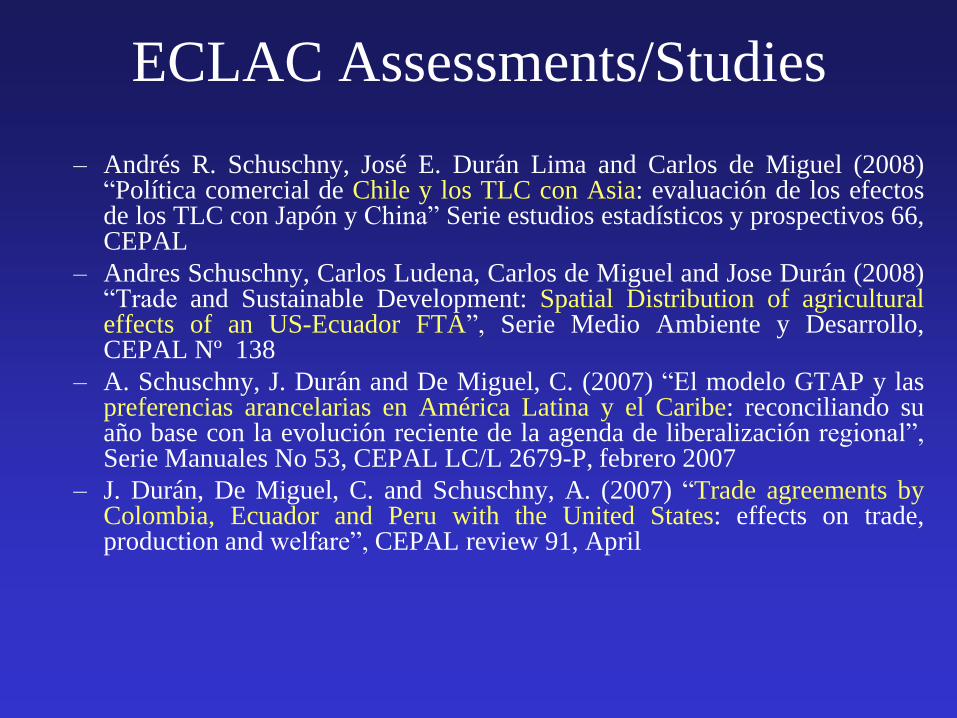
ECLAC Assessments/Studies
– Andrés R. Schuschny, José E. Durán Lima and Carlos de Miguel (2008) “Política comercial de Chile y los TLC con Asia: evaluación de los efectos de los TLC con Japón y China” Serie estudios estadísticos y prospectivos 66, CEPAL
– Andres Schuschny, Carlos Ludena, Carlos de Miguel and Jose Durán (2008) “Trade and Sustainable Development: Spatial Distribution of agricultural effects of an US-Ecuador FTA”, Serie Medio Ambiente y Desarrollo, CEPAL Nº 138
– A. Schuschny, J. Durán and De Miguel, C. (2007) “El modelo GTAP y las preferencias arancelarias en América Latina y el Caribe: reconciliando su año base con la evolución reciente de la agenda de liberalización regional”, Serie Manuales No 53, CEPAL LC/L 2679-P, febrero 2007
– J. Durán, De Miguel, C. and Schuschny, A. (2007) “Trade agreements by Colombia, Ecuador and Peru with the United States: effects on trade, production and welfare”, CEPAL review 91, April

ECLAC Assessments/Studies
– Sánchez, Marco V. (2007) “Liberalización comercial en el marco del DR-CAFTA: efectos en el crecimiento, la pobreza y la desigualdad en Costa Rica ”, CEPAL, Serie Estudios y Perspectivas, No. 80. México, D.F.
– Sánchez, Marco V. y Rob Vos (2006). “DR-CAFTA: panacea o fatalidad para el desarrollo económico y social en Nicaragua?”, CEPAL, Serie Estudios y Perspectivas, No. 57. México, D.F.
– Parada, Soledad and Cesar Morales (2006). Los efectos potenciales del Tratado de Libre Comercio entre Ecuador y los Estados Unidos en las mujeres rurales ecuatorianas. CEPAL-FAO, Serie desarrollo productivo, No 171.
– Ramirez, Juan Carlos (ed) (2005), “Temas no comerciales en la negociación comercial entre Colombia y Estados Unidos”, CEPAL, Serie estudios y perspectivas, No 6, Bogotá.
– De Miguel, Carlos and Georgina Nuñez (2001), “Evaluación ambiental de los acuerdos comerciales: un análisis necesario”, CEPAL, Serie medioambiente y desarrollo, No 41.

SIA in LAC
• EU African Caribbean Pacific (ACP) trade relations: – PricewaterhouseCoopers (2007) “Sustainability Impact Assessment of the EU-
ACP Economic Partnership Agreements”
• EU-MERCOSUR Trade Negotiations: – The University of Manchester (2009) “Trade Sustainability Impact Assessment
(SIA) of the Association Agreement Under Negotiation Between the European Community and MERCOSUR”
• EU-Chile Free Trade Area: – PLANISTAT-LUXEMBOURG and CESO-CI (2002) “Sustainable Impact
Assessment (SIA) of the trade aspects of negotiations for an Association Agreement between the European Communities and Chile”
• EU-Central America: – ECORYS(2009) “Trade Sustainability Impact Assessment of the Association
Agreement to be negotiated between the EU and Central America”
• EU- Andean: – Countries Development Solutions-CEPR-Manchester1824 (2009) “EU-Andean
Trade Sustainability Impact Assessment”

Environmental Reviews
in LAC
• United States Trade Representative (USTR)
– United States-Chile FTA
– United States-CAFTA-DR FTA
– United States - Colombia Trade Promotion Agreement
– United States-Andean Free Trade Agreement
– United States - Panama Free Trade Agreement
– United States - Peru Trade Promotion Agreement

Some results…
• Chile – USA and Chile – EU: improve welfare, reduce poverty, reduce inequality, mix environmental impacts (increase in air pollution)
• Peru – USA: improve welfare (23 plus 8)
• Colombia – USA: may not be welfare improvement
• Ecuador – USA: may not be welfare improvement, agricultural impacts according to accessibility
• Chile – Japan: improve welfare, reduce ESI exports
• Chile – China: improve welfare, increase ESI exports although less in relative terms

FTAs + IVA: Environmental Impacts (%)
-12.0%
-10.0%
-8.0%
-6.0%
-4.0%
-2.0%
0.0%
2.0%
4.0%
TOXAIR
TOXW
AT
TOXSO
L
BIOAIR
BIOW
AT
BIOSO
L
PART
VOC
SO2
NO
2
CO
TSS
BOD
2005
2020

NET NOMINAL WELFARE EFFECTS OF ALL THE SIMULATED SCENARIOS (in million 2001 dollar with regard to the 2004 baseline scenario)
Countries Baseline
2004 AC3 – USA
No FTA /
No ATPDEA (Includes
ATPDEA) Full liberalization
Excluding
sensibles
LAC 864 -442 -335 -220
Andean Community 229 -256 -203 -255
Bolivia 10 -4 -1 -9
Colombia 88 -163 -128 -95
Ecuador 20 -31 -23 -14
Peru 121 -43 -35 -141
Venezuela
MERCOSUR
-10
-90
-15
-89
-15
-61
4
-8
Chile 784 -27 -24 -2
United States -287 759 628 105
World 1005 -133 -75 4
Note: The net effect is the difference between each considered scenario and the 2004 baseline benchmark Base line includes the following trade agreements: Chile – USA, EU, EFTA, Korea; México – Uruguay; ATPDEA
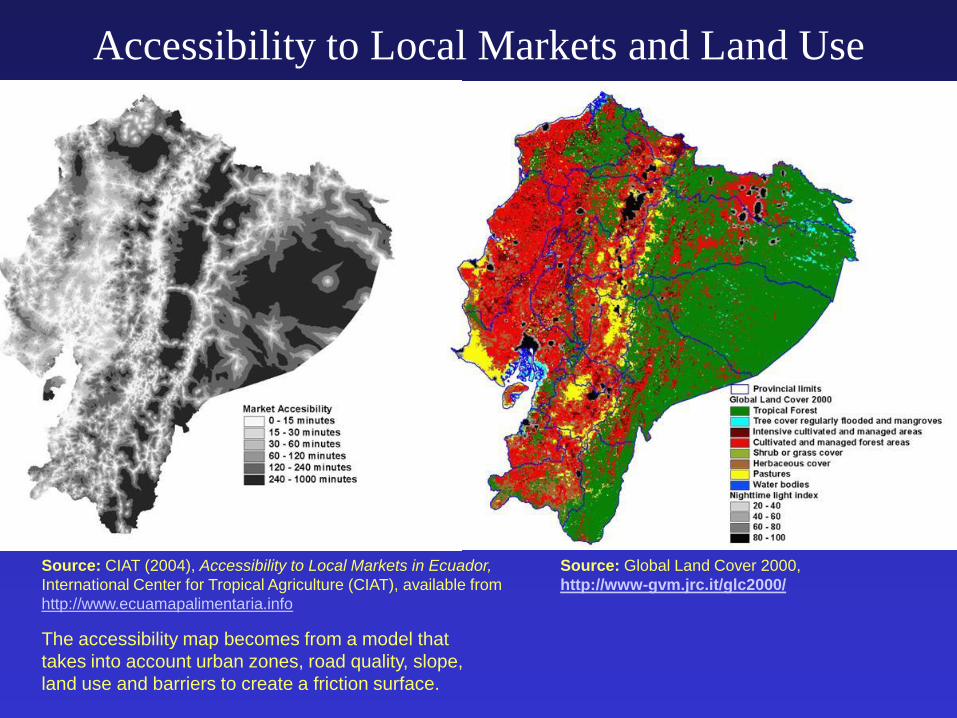
The accessibility map becomes from a model that
takes into account urban zones, road quality, slope,
land use and barriers to create a friction surface.
Accessibility to Local Markets and Land Use
Source: CIAT (2004), Accessibility to Local Markets in Ecuador,
International Center for Tropical Agriculture (CIAT), available from
http://www.ecuamapalimentaria.info
Source: Global Land Cover 2000,
http://www-gvm.jrc.it/glc2000/

Aggregate loses (corn, rice, oil seeds, plant based fibers)
Subsistence Farming
Traditional enterprises Modern enterprises

Environmental sensitive exports
FTA with Japan reduces Chilean dependency in environmental
sensitive exports industries (ESEI), and with China maintains
its ESEI pattern Cuadro 16
Impacto sobre el patrón exportador en función de las industrias ambientalmente sensibles
TLC (liberalización completa) Chile – Japón Chile – China
Grado (mundo)
Sectores Ambientalmente
Sensibles Mundo Japón Mundo China
B Otros alimentos 0.28 13.67 1.08 37.17
A Forestal -2.03 -1.64 -0.31 8.18
B Madera -4.20 -3.22 0.00 26.19
B Minería -2.52 -2.50 -0.25 -0.12
A Derivados del petróleo -0.04 16.65 0.15 0.20
A Química -3.74 -3.61 2.16 49.61
A Metal -5.27 2.38 0.48 14.48
A Productos Metálicos -4.95 -5.36 0.12 183.10
A Otras manufacturas -5.61 -2.75 0.03 1.81
Total IAS -3.60 2.17 0.50 11.85
Total Otros sectores 17.50 1074.00 1.42 193.87
Total Xs bienes 2.56 71.70 0.77 20.67
Fuente: Autores, sobre la base de simulaciones GTAP 6.1
Notas: A = Alta sensibilidad ambiental; B = Baja sensibilidad ambiental.
Policy Options: necessity of
EIA/SIA…
considering:
Encourage a previous economic assessment
Comprehensive and integral assessments
Flexibility in the application of tools/methodologies
Sustain and continuous process (ex-ante, in the
meantime and ex-post)
…always remembering that…
A bad environmental policy and a trade barrier: two different distortions treat it separetely?
When there are a number of distortions, an arbitrary reduction of one of them may reduce or improve welfare. “Second best problems”.
Trade and environmental policies are imperfect substitutes. To use one instrument suboptimum. Coordinated progressive efforts on both policies towards the optimum (zero tariffs and tax on emissions equivalent to marginal damage).
Complement international integration with adequate environmental policy reinforced by a solid institutional structure
Price signals…
• Doha Declaration (paragraph 33): need to share
technical knowledge and expertise with less
developed countries who wish to develop
environmental assessments at a country level.
• Global Alliance for Development (Millennium
Summit, 2000). Goals 7 and 8.
• Climate Change (Copenhagen Declaration) and
the Green Economy
… developed countries have
commitments …

Experience with ex-ante impact
assessments and lessons learned
Carlos J. de Miguel
([email protected]) Sustainable Development and Human Settlements Division
http://www.cepal.org/dmaah/