experiential marketing and long-term salestourism and experiential marketing are tightly linked....
TRANSCRIPT

EXPERIENTIAL MARKETING AND LONG-TERMSALES
Steven S. CuellarRobert C. Eyler
Rich Fanti
ABSTRACT. This study investigates the ability of winery tasting rooms to create brand awarenessand build long-term brand loyalty. Specifically, we test the conjecture that if tasting rooms create brandawareness and a pleasurable tasting room experience, then those visitors are more likely to recognizeand seek out those brands once they leave the tasting room. To measure these effects, we exploitdifferences in tasting room characteristics to conduct a series of natural experiments from which weanalyze differences in off-premise retail sales away from the tasting room. We use scan data on winesold off-premise through traditional retail outlets to then test for differences among tasting roomcharacteristics. Our results indicate that tasting rooms act as a form of experiential marketing forwineries, creating brand awareness and generating greater growth in off-premise retail sales. Finally,we address issues of endogeneity and unobserved heterogeneity as potential sources of bias.
KEYWORDS. Pooled cross section time series analysis, quasi-experiments;brand effects, Tastingrooms
1. INTRODUCTION
Tasting rooms provide wineries a uniqueopportunity to accomplish several goals.Strategically placed tasting rooms generateopportunities to increase winery brand exposureand create brand awareness. Additionally, byallowing patrons to sample wines without pur-chasing, tasting rooms also allow wineries toovercome the problem of asymmetric informa-tion in quality (Akerlof, 1970). Tasting roomsalso act as on-site, direct-to-consumer retailsales outlets. This role is especially attractivesince direct-to-consumer sales through tastingrooms provide wineries with a high-margin
sales opportunity, bypassing distributors and tra-ditional off-premise retail outlets such as groceryand liquor stores. Tasting rooms also provide acontact point from which to solicit wine clubmemberships, another long-term, high-margindirect-to-consumer sales opportunity. Finally,tasting rooms act as a form of experiential mar-keting in which wineries can shape the brand’simage through the tasting room experience. Inthis context, the goal of the winery is to converttasting room patrons into long-term, repeat cus-tomers who purchase wines away from the tast-ing room at retail outlets.
The role of the tasting room experience interms of brand marketing is confounded by
Steven S. Cuellar, Ph.D., Department of Economics, Sonoma State University, Rohnert Park, CAUSA,Phone (707) 664–2305, Fax (707) 664–4009, Steve. (E-mail: [email protected]).
Robert C. Eyler, Ph.D., Department of Economics, Sonoma State University, Rohnert Park, CAUSA,(707) 664–4256. (E-mail: [email protected]).
Rich Fanti, Sonoma Research Associates, Glen Ellen, CAUSA, Richie. (E-mail: [email protected]).Address correspondence to: Steven S. Cuellar, PhD., at the above address.
Journal of Travel & Tourism Marketing, 32:534–553, 2015© 2015 Taylor & FrancisISSN: 1054-8408 print / 1540-7306 onlineDOI: 10.1080/10548408.2014.918925
534
Dow
nloa
ded
by [
Stev
en C
uella
r] a
t 07:
31 1
2 A
ugus
t 201
5

tasting room workers’ incentives to sell at thewinery. As brand ambassadors, tasting roomworkers are tasked with dual roles. On onehand, they must create a pleasant and informa-tive wine-tasting experience. On the other hand,as sales people often incentivized through com-missions, tasting room workers must also sellwine and increase club memberships. Althougha similar conflict exists in many retail outlets, itis especially contentious in winery tastingrooms where visits to wineries and wine tour-ism in general are as much about the “winecountry experience” as about the wine (Beteta,2011). The wineries’ ability to balance thesedual roles ultimately determines the success oftasting rooms and to some extent the brand.While there is no question that tasting roomsprovide a high margin, direct-to-consumer salesopportunity, the ability to create brand aware-ness and brand loyalty resulting in long-term,repeat customers from tasting room activity hasnot been empirically established.
It is here that we turn our attention byanswering two questions: First, are tastingrooms an effective means of increasing on awinery’s long-term off-premise sales awayfrom the tasting room? Second, if tastingrooms are effective in promoting long-termretail sales, what type of tasting rooms aremost effective? The paper proceeds as follows:Section 2 provides a review of the related lit-erature, while Section 3 discusses the data usedas well as our sample areas. Section 4 presentsour empirical analysis, Section 5 summarizesour results and Section 6 discusses the short-comings of the study as well as suggestions offuture research.
2. LITERATURE REVIEW
Experience goods constitute a large portion ofthe retail market. As a result, issues that character-ise experience goods such as asymmetric informa-tion (Akerlof, 1970; Nelson, 1970) and how firmsresolve this asymmetry through the use of priceand advertising (Milgrom & Roberts, 1986;Nelson, 1974), warranties (Grossman, 1981) andexpert opinion (Cuellar & Claps, 2013;Eliashberg & Shugan, 1997; Reinstein &
Snyder, 2005) have been widely covered.Perhaps the most obvious means of overcominginformation asymmetries of experience goods isthrough sampling. Sampling not only allows con-sumers to discern quality, it also serves as a meansof increasing brand exposure and awareness(Freedman, 1986; Heilman, Lakishyk, & Radas,2011; McGuinness, Bernnan, & Gendall, 1995;McGuinness, Gendall, & Mathew, 1992; Meyer,1982). While the use of sampling has been exam-ined for a variety of products, we are unaware ofany similar studies of winery tasting rooms.
In addition to allowing visitors the opportunityto sample its wines, tasting rooms provide anopportunity for a winery to shape the brands’image through the tasting room experience.While Keller and Lehmann (2006) provide anexcellent review of brands and branding, shapingbrand image through the tasting room experiencefalls under the broader rubric of experiential mar-keting (Holbrook & Hirschman, 1982; Schmitt,1999; Senthil, Chandrasekar, & Selvabaskar,2012; Terblanche & Boshoff, 2006) which hasrecently seen a significant increase in use (Clark,2012). Perhaps the highest profile example is thatof the Apple store, whose success was soon fol-lowed by other technology firms Microsoft andDell (Duncan, 2012). Best Buy’s decision toreduce store size and create more of a “show-room” atmosphere where consumers can comein and experience products but purchase online,or elsewhere, is another example (Bustillo, 2012).
Tourism and experiential marketing aretightly linked. Diesbach (2012) suggests thatpersuasion and place are linked and that theuse of icons (brands) and place link that placeto the consumer as a way to cognitively connectfor future trips with the visitor acting as a desti-nation (brand) ambassador to others. Becausetasting rooms are destinations and themselvestourism points of interest, the winery can usethis mix of experience, geography, and brandicons as ways to market sales in the tastingroom and later (repeat consumers).
Clarkson, Janiszewski, and Cinelli (2013)provide experiments for consumers that areseeking breadth and depth knowledge as con-sumers. The wine industry uses tasting rooms toprovide both experiences, and attract consumersto reserve tastings as “depth” versus the general
Cuellar, Eyler, and Fanti 535
Dow
nloa
ded
by [
Stev
en C
uella
r] a
t 07:
31 1
2 A
ugus
t 201
5

tasting room which provides more breadth. Inspecific, the experience provides a tie to futureconsumption. Clarkson et al. (2013) mentionswine tasting indirectly as a way to consider suchexperiences.
“For example, prior experience with adiversity of food flavors, as opposed to asingle food flavor, should allow a personto better appreciate the flavors of foodsthat are eaten on future occasions.Similar claims can be made about the con-sumption of any experiential good that isfrequent, varied, and subjectively appre-ciated (e.g., wine appreciation, art appre-ciation, music appreciation).”
Bruwer and Alant (2009) discuss the winetourist and the role of wine tourism in sales.They use a hedonic approach, where the plea-sure-seeking aspect of wine tourism drives vis-its to winery tasting rooms. From there, theexperiential aspects of the visitor’s time withthe winery may be what drives current andfuture sales; the visit experience links the visitorto the wine brand in a positive way, whichgenerates more consumption of the brand. Aswe discuss below, Bruwer and Alant (2009)suggests that a more relaxed, less-congestedtasting rooms that require a reservation mayhave more ability to generate that positive linkthrough a deeper experience with the winebrands, and thus generate more sales in theretail chain.
In terms of retail experience, Morey (1980)showed that store atmosphere in terms of serviceand attractiveness, were effective at increasingretail sales. A critical issue in this research, Chuand Hess (1995) discuss the costs and benefits ofdifferent sales strategies. More recently Arndtand Karande (2012) note that,
“Salespeople who have a customer orien-tation—i.e., those who attempt to learnabout and satisfy customer needs—tendto build stronger customer relationshipsthan less customer-oriented salespeople.Those stronger relationships, in turn, leadto increased repeat sales, word-of-mouth
referrals, and a more desirable brandimage for the selling firm.”
Although this quote refers to automobile sales-people, we seek to investigate whether tastingroom environment has a similar effect. Namelywhether customer-oriented tasting rooms resultin greater brand loyalty and long-term repeatsales away from the tasting room than moresales oriented tasting rooms? To be sure, however,not everyone is as sanguine about the relationshipbetween customer-oriented sales strategies andlong-term brand loyalty. See Franke and Park(2006) for an elaboration on this point.
In the wine industry, there are severalstudies that examine tasting rooms in particular.From a marketing perspective, Bruwer andLesschaeve (2012a) examine the sources of infor-mation used by tourist traveling to Canadianwinery tasting rooms and find that locally basedvisitors use different sources of information thanoverseas-based travelers to the same region, whileBruwer and Lesschaeve (2012b) show that thetasting room experience is important in shaping awine destinations image. In a similar vein, Barber,Donovan, and Dodd (2008) discuss marketingstrategies for wineries based on size and location.
With respect to tasting room strategies,Nowak and Newton (2006) find that a positivetasting room experience is more likely to lead tofuture sales, while Carmichael (2005) finds thata positive tasting room experience is a signifi-cant factor in creating an enjoyable visit to theNiagara wine region of Canada. O’Neil, Palmer,and Charters (2002) show that service quality ina winery tasting room leads to greater tastingroom sales, while O’Neill and Charters (2000)examine the quality of service at wineries andfind that “responsiveness” of the tasting roomstaff is the main service characteristic driving apleasant tasting room experience. Related to thecurrent research, O’Neill and Charters (2000)note that “[Tasting rooms] are attempting toachieve loyalty to their brand and not to the[tasting room].”
Earlier papers by Dodd (1995), and Doddand Gustafson (1997) examine what factorsattracted visitors to winery tasting rooms inTexas, and note that a positive tasting room
536 JOURNAL OF TRAVEL & TOURISM MARKETING
Dow
nloa
ded
by [
Stev
en C
uella
r] a
t 07:
31 1
2 A
ugus
t 201
5

experience provides an opportunity for wineriesto build brand loyalty, while Dodd (1999)examines the value of repeat customers towinery tasting rooms.
The existing research on tasting rooms makesclear that providing an enjoyable tasting roomexperience is important in building brand loy-alty and generating long-term sales. We add tothe literature by testing this hypothesis. Whilevirtually all of the studies noted above rely onsurvey data of tasting room visitors or profes-sionals, our research examines actual purchasedata to examine differences in tasting roomatmosphere.
3. DATA
To measure the ability of tasting rooms tocreate brand awareness and build brand loyalty,we examine wine sales away from the tastingroom at traditional retail outlets using point-of-sale scanner data of wine in the USA acrossmajor retail channels: drug stores; food or gro-cery stores; and liquor stores. Scanner data,provided by proprietors such as InformationResources Incorporated (IRI) and the NielsenCompany (Nielsen), is increasingly becomingthe primary source of data for analytics in con-sumer packaged goods industries. The data arereadily available at the item or stock-keepingunit (SKU) level on factors such as price, quan-tity, promotional activity, and sales channels. Inthis paper, we use Nielsen Scantrack data toconstruct a pooled, cross section of data onpoint-of-sale purchases of wines from majorUS retail chains, for the years 2007–2011. Thedata consist of national sales of all wines, for-eign and domestic, purchased from major retailchain stores, defined as those with sales of over$2 million US per year. The data are aggregatedfor all markets and include the price paid, quan-tity sold, SKU, and retail channel of each item.For uniformity, we concentrate on wine pur-chases of standard, 750 mL glass bottles(approximately 84% of all purchases) andexclude boxed wine, and other volume units.The benefit of scan data is that it representsactual purchases of wine by consumers and isthus reflective of consumer demand. The
drawback of scan data is that it only recordspurchases in major US retail chains and doesnot represent wine sold on premise at wineries,purchases through wine clubs, or purchases atrestaurants. Despite these limitations, the pointof sale scan data works well for our analysis.
4. ANALYSIS
Our first question of interest is whether tast-ing rooms are effective at creating brand aware-ness and building brand loyalty. If this is true,then tasting rooms that experience more visitortraffic should experience greater retail salesaway from the tasting room than those experi-encing less tasting room traffic. To test thishypothesis, we identify tasting rooms open tothe general public in both low and high trafficwine-tasting corridors in Northern California’swine country.
Experiment no.1―Sonoma County,California
Sonoma County provides a nearly ideal situa-tion to test the ability of tasting rooms to createbrand awareness and build brand loyalty.Sonoma County is a popular wine tourism des-tination with wineries spread out throughout thecounty. We used a map of Sonoma Countytasting rooms to identify clusters winery withtasting rooms open to the public in both highand low traffic regions based on access to mainhighways and proximity to major metropolitanareas. For Sonoma, the nearest, major metropo-litan areas are San Francisco to the south andSacramento to the east. The high traffic regionwe chose is located just outside of the city ofSonoma along Highway 12 that runs throughGlen Ellen and Kenwood. This area is approxi-mately 55 miles from San Francisco and 75miles from Sacramento. Known as the SonomaValley, this is a well-known wine tourism regionwith a relatively high concentration of tastingrooms.
Along this approximately, eight-mile stretchof Highway 12, we were able to identify eightwineries that both have tasting rooms and were
Cuellar, Eyler, and Fanti 537
Dow
nloa
ded
by [
Stev
en C
uella
r] a
t 07:
31 1
2 A
ugus
t 201
5
captured in the retail scan data set. A list of thewineries is shown in Appendix Table A1 alongwith a map of the tasting rooms in Figure A1.We refer to this as the Highway 12 corridor.Within this sample, each winery sells multipleproducts resulting in a total sample of approxi-mately 200 unique wines sold per month overour sample time frame of 52 months for a totalsample of approximately 11,300 observed winesales.
Our control group of low-traffic wineries istaken from the more distant and remote northernSonoma County areas of Dry Creek andAlexander Valley, located to the west andnorth of Healdsburg (North Sonoma). Theseareas are approximately 80 miles from SanFrancisco and 110 miles from Sacramento andare an additional 30 miles from our high trafficHighway 12 corridor. We were able to identify10 wineries in this regions, which we desig-nated Northern Sonoma, that both have tastingrooms and sell through the major retail outlets.Within our North Sonoma region, each winerysells multiple products resulting in a total sam-ple of approximately 100 wines sold per monthover 52 months for a total sample of 5099observed wine sales.
As a second control, we examine retail salesof a large Sonoma County winery (GalloSonoma) with no tasting room. Gallo Sonomawould appear to be an ideal control given thatGallo is one of the largest wineries in the world,with wide distribution and high brand recogni-tion. Finally, as a third control group, we exam-ine the overall sales of all wines (both foreignand domestic) sold in the USA through theretail channel.
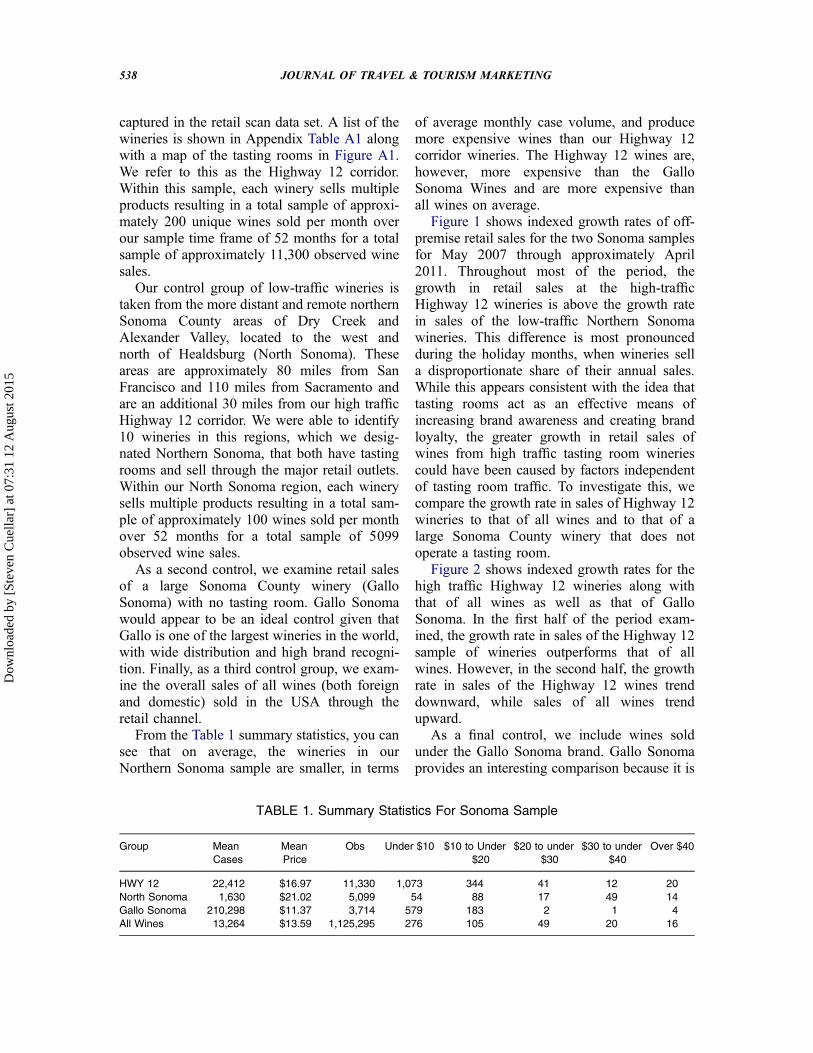
From the Table 1 summary statistics, you cansee that on average, the wineries in ourNorthern Sonoma sample are smaller, in terms
of average monthly case volume, and producemore expensive wines than our Highway 12corridor wineries. The Highway 12 wines are,however, more expensive than the GalloSonoma Wines and are more expensive thanall wines on average.
Figure 1 shows indexed growth rates of off-premise retail sales for the two Sonoma samplesfor May 2007 through approximately April2011. Throughout most of the period, thegrowth in retail sales at the high-trafficHighway 12 wineries is above the growth ratein sales of the low-traffic Northern Sonomawineries. This difference is most pronouncedduring the holiday months, when wineries sella disproportionate share of their annual sales.While this appears consistent with the idea thattasting rooms act as an effective means ofincreasing brand awareness and creating brandloyalty, the greater growth in retail sales ofwines from high traffic tasting room wineriescould have been caused by factors independentof tasting room traffic. To investigate this, wecompare the growth rate in sales of Highway 12wineries to that of all wines and to that of alarge Sonoma County winery that does notoperate a tasting room.
Figure 2 shows indexed growth rates for thehigh traffic Highway 12 wineries along withthat of all wines as well as that of GalloSonoma. In the first half of the period exam-ined, the growth rate in sales of the Highway 12sample of wineries outperforms that of allwines. However, in the second half, the growthrate in sales of the Highway 12 wines trenddownward, while sales of all wines trendupward.
As a final control, we include wines soldunder the Gallo Sonoma brand. Gallo Sonomaprovides an interesting comparison because it is
TABLE 1. Summary Statistics For Sonoma Sample
Group MeanCases
MeanPrice
Obs Under $10 $10 to Under$20
$20 to under$30
$30 to under$40
Over $40
HWY 12 22,412 $16.97 11,330 1,073 344 41 12 20North Sonoma 1,630 $21.02 5,099 54 88 17 49 14Gallo Sonoma 210,298 $11.37 3,714 579 183 2 1 4All Wines 13,264 $13.59 1,125,295 276 105 49 20 16
538 JOURNAL OF TRAVEL & TOURISM MARKETING
Dow
nloa
ded
by [
Stev
en C
uella
r] a
t 07:
31 1
2 A
ugus
t 201
5

FIGURE 1. Indexed Case Volumes of High-Traffic versus Low-Traffic wineries in Sonoma County
–0.3
–0.2
–0.1
0
0.1
0.2
0.3
0.4
0.5
0.6
0.7
1-M
ay
-0
7
1-Ju
l-0
7
1-S
ep
-0
7
1-N
ov-0
7
1-Ja
n-0
8
1-M
ar-0
8
1-M
ay
-0
8
1-Ju
l-0
8
1-S
ep
-0
8
1-N
ov-0
8
1-Ja
n-0
9
1-M
ar-0
9
1-M
ay
-0
9
1-Ju
l-0
9
1-S
ep
-0
9
1-N
ov-0
9
1-Ja
n-1
0
1-M
ar-1
0
1-M
ay
-1
0
1-Ju
l-1
0
1-S
ep
-1
0
1-N
ov-1
0
1-Ja
n-1
1
1-M
ar-1
1
Ind
ex
ed
Ca
se
Vo
lum
e
HWY 12
North Sonoma
FIGURE 2. Case Volume for Highway 12 wineries, Gallo Sonoma and All Wines
–0.9
–0.7
–0.5
–0.3
–0.1
0.1
0.3
0.5
0.7
1-M
ay
-0
7
1-Ju
l-0
7
1-S
ep
-0
7
1-N
ov-0
7
1-Ja
n-0
8
1-M
ar-0
8
1-M
ay
-0
8
1-Ju
l-0
8
1-S
ep
-0
8
1-N
ov-0
8
1-Ja
n-0
9
1-M
ar-0
9
1-M
ay
-0
9
1-Ju
l-0
9
1-S
ep
-0
9
1-N
ov-0
9
1-Ja
n-1
0
1-M
ar-1
0
1-M
ay
-1
0
1-Ju
l-1
0
1-S
ep
-1
0
1-N
ov-1
0
1-Ja
n-1
1
1-M
ar-1
1
Ind
ex
ed
Ca
se
Vo
lum
e
HWY 12
All Wines
Gallo Sonoma
Cuellar, Eyler, and Fanti 539
Dow
nloa
ded
by [
Stev
en C
uella
r] a
t 07:
31 1
2 A
ugus
t 201
5

a large, well-known winery but does not operatea traditional tasting room. Gallo Sonoma did,briefly, operate a small tasting room in thedowntown plaza of Healdsburg, from 2003–2010. As can be seen, Highway 12 winesgrew at greater rate than Gallo Sonoma, whosesales fell throughout the entire period.
Regression Specification
While the graphical analysis is consistentwith the hypothesis that tasting rooms act as abrand ambassador, we measure the ability oftasting rooms to create brand awareness andbuild brand loyalty by estimating the followingregression:
Casesit ¼ β0 þ β1 Timeit þX
θRegion
þX
γHolidayþ uit (1)
Where Casesit is the indexed, 9L equivalentvolume for region “i” in year t. The variable“Time” is a trend in indexed case volume.“Region” is a vector of dummies and interactionterms for each region time. “Holiday” is a vec-tor of dummy and interaction variables for themonths October, November and December andregion. The holiday dummy picks up any addi-tional variation in the data during the retailchain’s major sales season for wine.
The first column of Table 2 presents theregression results for the data represented inFigures 1 & 2. In particular, Table 2 showsthat sales of the Highway 12 wines fell slightlymore than sales of the North Sonoma and allwines. However, if we examine early period ofthe data, the Highway 12 wines grew at agreater rate than the North Sonoma wines. Inaddition, the Highway 12 wines experienced astatistically significant greater increase in sales
TABLE 2. SonomaCounty Regression Results
All Under $10 $10 to Under $20 $20 to under $30 $30 to under $40 Over $40Cases Cases Cases Cases Cases Cases
Time 0.004 0.004 0.005 0.003 0.008 0.008[0.00]** [0.00]** [0.07] [0.44] [0.20] [0.12]
Highway12*Time −0.008 0 −0.009 −0.013 0.016 −0.019[0.00]** [0.88] [0.03]* [0.01]** [0.08] [0.01]**
North Sonoma*Time −0.004[0.00]**
Gallo*Time −0.018 −0.01 −0.024 −0.039[0.00]** [0.00]** [0.00]** [0.00]**
Holiday 0.266 0.234 0.325 0.564 0.823 1.012[0.00]** [0.00]** [0.00]** [0.00]** [0.00]** [0.00]**
Highway 12 0.127 −0.013 0.042 0.274 −0.061 0.176[0.01]** [0.82] [0.74] [0.06] [0.83] [0.41]
North Sonoma −0.003[0.95]
Gallo Sonoma −0.045 −0.11 0.293 0.084[0.32] [0.05] [0.02]* [0.57]
Highway12*Holiday 0.118 0.203 −0.095 −0.119 −0.28 −0.19[0.02]* [0.00]** [0.52] [0.47] [0.38] [0.44]
North Sonoma*Holiday −0.001[0.98]
Gallo*Holiday −0.14 0.002 −0.561 −0.06[0.01]** [0.97] [0.00]** [0.74]
Constant −0.017 −0.055 0.089 0.096 0.064 0.076[0.60] [0.17] [0.33] [0.35] [0.74] [0.61]
Observations 208 156 156 141 104 104Adjusted R-squared 0.85 0.75 0.44 0.61 0.27 0.42
Absolute value of t-statistics in brackets*significant at 5% level; **significant at 1% levelNorth Sonoma Group excluded from price segment regressions due to small sample
540 JOURNAL OF TRAVEL & TOURISM MARKETING
Dow
nloa
ded
by [
Stev
en C
uella
r] a
t 07:
31 1
2 A
ugus
t 201
5

during the important holiday months than theNorth Sonoma and all wines. Finally, Highway12 wines also grew faster and experienced agreater holiday boost than the Gallo Sonomawines.
Both results are statistically significant.While early trend in the data is consistent withthe idea that tasting rooms act as an effectivemeans of increasing brand awareness and creat-ing brand loyalty that results in greater off-pre-mise sales through traditional retail outlets, thelatter half appears inconsistent with that hypoth-esis. We provide an explanation for this appar-ent conflict later.
Experiment no. 2―Napa County,California
The second question we wish to investigateis “which type of tasting room atmosphere ismost effective at creating brand loyalty andincreasing long-term sales away from the tast-ing room?” Specifically, among high traffic tast-ing rooms, we examine the difference in retailsales between wineries that create retail orientedtasting rooms emphasizing tasting room salesand club sign-ups versus those that create amore relaxed, tasting-room environment empha-sizing the wine country experience.
For our high traffic region, we examinedtasting rooms open to the public in NapaCounty, California. As the second most populartourist destination in California, afterDisneyland (according to the Napa Valley website napacountyguide.com), many of the Napawineries can be considered “high traffic,” espe-cially as compared to our North Sonoma sam-ple. However, within Napa, the wineries thatrun along Highway 29 through Yountville,Oakville, Rutherford and St. Helena are themost visited. This region is approximately 60miles from San Francisco and 65 miles fromSacramento. We refer to this approximately 10-mile stretch between Yountville and St. Helenaas our Highway 29 corridor.
As a major tourist destination, many of thetasting rooms along the Highway 29 corridortend to be more congested and commerciallyoriented; emphasizing selling wine and building
wine club memberships rather than creating arelaxed wine country experience. We treat thesewineries, along the Highway 29 corridor, as ourhigh-traffic “commercial” oriented tastingrooms. We are able to identify 16 wineries thathave tasting rooms along our Highway 29 cor-ridor and are represented in the retail sales scandata for major retail outlets. A list of the Napawineries is provided in Appendix Table A2along with a map of the tasting rooms shownin Figure A2. Within this sample, each winerysells multiple products resulting in a total sam-ple of approximately 461 unique wines sold permonth over our sample time frame of 52 monthsfor a total sample of 25,373 observed winesales.
As a control group to our commercialoriented tasting rooms, we select a group ofwineries with tasting rooms along the nearbySilverado Trail that runs parallel to ourHighway 29 group of wineries in Napa,California. This portion of the Silverado Trailis approximately the same distance from themain metropolitan areas of San Francisco andSacramento, and is separated by less than a mileat some points.
Despite their close proximity, the tastingrooms along the Silverado Trail are generallyless crowded, offer a much more relaxed, andless commercial atmosphere than the Highway29 wineries. We are able to identify 28 wineriesthat have tasting rooms along the portion of theSilverado Trail that runs parallel to ourHighway 29 corridor that are represented inthe scan data of major retail outlets. Withinthis sample, each winery sells multiple productsresulting in a total sample of approximately 262unique wines sold per month over our sampletime frame of 52 months for a total sample of13,118 observed wine sales.
Comparisons of sales atmospheres and tech-niques have been widely covered in the retailliterature (Arndt & Karande, 2012; Chu & Hess,1995and Morey, 1980). However, much of theresearch distinguishing between sales and cus-tomer orientation relies on subjective self-reported characteristics of sales people (Arndt& Karande, 2012). Rather than rely on self-reported measures of tasting room environment,we turn to on-line reviews and social media
Cuellar, Eyler, and Fanti 541
Dow
nloa
ded
by [
Stev
en C
uella
r] a
t 07:
31 1
2 A
ugus
t 201
5

opinions as evidence of the difference betweenHighway 29 and the Silverado Trail tastingroom atmospheres.
Reviews
“Most visitors stick to Highway 29, themajor thoroughfare through the NapaValley. While the majority of the valley’swineries are located on the highway, morethan three dozen can be found on the less-traveled Silverado Trail… The SilveradoTrail… is the ideal choice… for peoplewho’d rather spend their time in a winerytasting bar than in the stop-and-go trafficthat clogs the main artery… usually trans-lates to less crowded tasting rooms…”(Olmstead, 2011)
“Yesterday, I had a meeting up inCalistoga and figured I would take a lei-surely drive down Highway 29, whichmost will agree is the most famous wineroad for tourists in Napa. I thought that Iwas going to visit a few wineries to seehow they handle wine tourism… Oh mygod. Bumper to bumper traffic on 29. Myfriends had told me how busy certainwineries got at the height of tourist season,but I was unprepared for such a huge flowof visitors so early in the year. In fact,there were hundreds of people at thewinery between the tasting room, barrelcellar, BBQ cookout, deli, and picnicarea. The tasting room had about 15 peo-ple staffing it, all busy with 3–7 peoplepaying for tasting flights. And then therewere about five cash registers churningthrough very happy customers as fast asthey could.” (O’Connell, 2012)
“Silverado Trail is another popular roadfor wineries and runs parallel to CA 29,this road is less crowded and thereforesometimes it is preferred over CA 29since the traffic moves faster on thisroad.” (Travel and Tourism Info)
“Highway 29 is a straight shot from Napato Calistoga and hits all the big names
such as Opus One and Francis FordCoppola’s Rubicon Estate. But it can getawfully crowded in summer. The otherroute is the Silverado Trail, which avoidsthe towns, is quieter, and has breathtakingviews.” (Locke, 2011)
“Most people visiting Napa Valley stay onthe main Highway 29. That’s understandableas the highway is lined with big name wine-ries all in a row. But parallel to Highway 29 isThe Silverado Trail, the road less travelledbut certainly no less rewarding for thoselooking for scenic travels and great wineriesalong the way. From small boutiques tofamous names, wine caves to wine pairings,The Silverado Trail is the other Napa.” (NapaTourist Guide, 2011)
“Highway 29 is busy enough in certainareas to require four lanes of traffic. TheSilverado Trail, on the other hand, is quietand serene, a winding, two-lane highwayrunning at a slightly elevated position andnestled against mountains on the valley’seastern side.” (Nelson, 2001)
The consensus of online opinions is thatthere is a significant difference in tasting roomexperience between Highway 29 and theSilverado Trail. Moreover, this difference isconsistent with our grouping of tasting roomsinto congested and sales orientated versus morerelaxed customer-oriented atmospheres. As wewill show, however, this is not to say that everytasting room along the Highway 29 corridor iscongested and commercially oriented or thatevery tasting room along the Silverado Trail isrelaxed and enjoyable.
Summary statistics for our Napa sample ofwineries are shown in Table 3, along with thesummary statistics for all wines. As Table 3indicates, the sample of wineries alongHighway 29 are on average bigger in terms ofaverage monthly cases sold and are lowerpriced than their Silverado Trail counterparts.Our methodology combines these elementsinto an estimation of how different tastingroom characteristics generate different retailsales environments for wineries in the Sonomaand Napa wine regions in California.
542 JOURNAL OF TRAVEL & TOURISM MARKETING
Dow
nloa
ded
by [
Stev
en C
uella
r] a
t 07:
31 1
2 A
ugus
t 201
5

Figure 3 shows indexed retail sales of winesfrom our two Napa County samples as well asthat of all wines. There are several points worthnoting in Figure 3. First, the Silverado Trailwineries experienced a growth rate in retailsales equal to or better than their Highway 29counterparts in the off months, although similarto that of all wines. Second, during the all-important holiday months, the growth in salesof the Silverado Trail wineries significantly out-performs both the Highway 29 wineries and allwines. Third, since November 2008, the growthrate in sales of the Silverado Trail wineries hasbeen increasing while that of the Highway 29wineries has remained flat. Fourth, the growthrate in retail sales of all wine is slightly greater
than that of the Highway 29 wineries, but lessthan that of the Silverado Trail wineries.
Once again we measure the effects of tastingroom atmosphere on brand loyalty by re-esti-mating Equation 1 for our Napa sample ofwines. The first column of Table 4 representsthe data shown in Figure 3 and indicates thatwines from the Silverado Trail experienced agreater growth than wines from the Highway29 as well as all wines, although the differencebetween the Silverado Trail and all wines isnot statistically significant. However, theSilverado Trail wines did experience a greaterholiday boost than the Highway 29 wines andall wines, both of which are statisticallysignificant.
TABLE 3. Summary Statistics For Napa Sample
Group MeanCases
MeanPrice
Obs Under $10 $10 to under$20
$20 tounder$30
$30 to under$40
Over $40
Highway 29 159,994 $19.55 25,373 1,651 215 148 30 13Silverado Trail 10,733 $27.97 13,118 610 294 115 37 25All Wines 13,264 $13.59 1,125,295 276 105 49 20 16
FIGURE 3. Case Volume of Silverado Trail, Highway 29 and All Wines
–0.2
0
0.2
0.4
0.6
0.8
1
1-M
ay
-0
7
1-Ju
l-0
7
1-S
ep
-0
7
1-N
ov-0
7
1-Ja
n-0
8
1-M
ar-0
8
1-M
ay
-0
8
1-Ju
l-0
8
1-S
ep
-0
8
1-N
ov-0
8
1-Ja
n-0
9
1-M
ar-0
9
1-M
ay
-0
9
1-Ju
l-0
9
1-S
ep
-0
9
1-N
ov-0
9
1-Ja
n-1
0
1-M
ar-1
0
1-M
ay
-1
0
1-Ju
l-1
0
1-S
ep
-1
0
1-N
ov-1
0
1-Ja
n-1
1
1-M
ar-1
1
Ind
ex
ed
Ca
se
Vo
lum
e
Hwy 29 Open
All Wines
Silverado Trail Open
Cuellar, Eyler, and Fanti 543
Dow
nloa
ded
by [
Stev
en C
uella
r] a
t 07:
31 1
2 A
ugus
t 201
5

Analysis by Price Point
Recall from the Table 1 summary statistics,that the mean prices of our comparison groupwines were all different. This could potentiallybias our results if greater growth of theHighway 12 wines is the result of, for example,lower-priced wines selling at a faster rate thanhigher priced wines and not the result of tastingroom traffic. To control for differences acrossprices, we disaggregate our samples by pricesegment. Columns 4–5 in Table 2 show theregression results for five price segments:Under $10, $10 to under $20, $20 to under$30, $30 to under $40 and over $40.
Table 2 indicates that growth in sales for thelowest price segment (under $10) of Highway12 wines was similar to that of all wines andgreater than that of the Gallo Sonoma wines.Both results are statistically significant.Additionally, the growth in $30 to under $40wines from the Highway 12 sample grew fasterthan all wines, although the difference is notstatistically significant. More importantly,Highway 12 wines experienced a greater boost
in sales than all wines in the under $10 segmentduring the holiday seasons and experienced agreater boost than the Gallo Sonoma winesacross all price segments during the holidayseasons.
The results by price segment from Napa aresimilar to those Sonoma. In particular, Table 4shows that in the under $10 price segment, theSilverado Trail wines grew at a faster rate thanall wines as well as wines from Highway 29.Both results were statistically significant. Again,similar to the Sonoma comparison, wines priced$30 to under $40 from the Silverado Trail grewat a greater rate than all wines and wines fromHighway 29, although neither is statisticallysignificant.
Similar to the Sonoma County sample,Silverado Trail wines priced under $10 experi-enced greater holiday sales than all wines andwines from Highway 29, although neither isstatistically significant. Finally, wines pricedover $40 from Silverado Trail experienced sta-tistically significant greater holiday boost thanwines from Highway 29, but were not statisti-cally different than all wines.
TABLE 4. Napa Regression Results
All Under $10 $10 to Under $20 $20 to under $30 $30 to under $40 Over $40Cases Cases Cases Cases Cases Cases
Time 0.004 0.004 0.005 0.003 0.008 0.008[0.00]** [0.15] [0.00]** [0.22] [0.02]* [0.06]
Napa29*Time −0.004 −0.003 −0.009 −0.005 −0.008 −0.021[0.01]* [0.41] [0.00]** [0.09] [0.09] [0.00]**
Silverado Trail *Time 0.003 0.048 −0.013 −0.007 0.001 −0.001[0.09] [0.00]** [0.00]** [0.03]* [0.90] [0.83]
Holiday 0.266 0.234 0.325 0.564 0.823 1.012[0.00]** [0.01]* [0.00]** [0.00]** [0.00]** [0.00]**
Napa29 −0.005 0.022 −0.011 −0.104 −0.089 0.32[0.92] [0.85] [0.87] [0.26] [0.55] [0.07]
Silverado Trail −0.109 −0.542 −0.019 −0.079 −0.365 −0.11[0.02]* [0.00]** [0.77] [0.39] [0.02]* [0.53]
Napa29*Holiday −0.01 0.047 0.028 0.039 0.098 −0.404[0.86] [0.72] [0.70] [0.71] [0.57] [0.05]*
Silverado Trail*Holiday 0.133 0.209 −0.04 −0.133 −0.618 −0.074[0.02]* [0.12] [0.59] [0.21] [0.00]** [0.72]
Constant −0.017 −0.055 0.089 0.096 0.064 0.076[0.62] [0.50] [0.05] [0.14] [0.55] [0.54]
Observations 156 156 156 156 156 156Adjusted R-squared 0.65 0.82 0.66 0.56 0.51 0.47
Absolute value of t-statistics in brackets*significant at 5% level; **significant at 1% level
544 JOURNAL OF TRAVEL & TOURISM MARKETING
Dow
nloa
ded
by [
Stev
en C
uella
r] a
t 07:
31 1
2 A
ugus
t 201
5

The results from Sonoma and Napa providean interesting insight into the effects of tastingrooms. Much of the increase in long-term off-premise sales comes from the lowest price seg-ment. This is in contrast to the wines offered atthe tasting rooms which are generally thehigher-priced wines. We view this as indicatingthat consumer attachment built at the tastingroom is to the brand and not to the specificwines sampled at the tasting room.
Econometric Issues
Our results from the Sonoma experiment areconsistent with the hypothesis that winerieswith higher traffic tasting rooms experiencegreater retail sales growth through off-premiseoutlets than wineries with lower traffic tastingrooms. Likewise, our results from the Napaexperiment are consistent with the hypothesisthat less congested and more relaxed tastingrooms that create a pleasurable tasting roomexperience are more effective at building brandloyalty which results in greater retail salesgrowth through off-premise outlets than morecongested commercial-oriented tasting rooms.Our results may, however, be biased due toseveral econometric issues.
To begin with, a winery’s decision of whereto locate its tasting room may be dependent onthe level of its off-premise retail sales. Thiswould occur if, for example, wineries withgreater retail sales chose to locate their tastingrooms in high traffic regions. While this type ofendogeneity seems reasonable and would biasour results, it would appear unlikely given thathigh sales wineries would have to have chosenhigh traffic areas in Sonoma but lower-trafficareas in Napa. Nonetheless, we address thisquestion below.
A second problem may exist if the differencein the growth rates of retail sales between wine-ries with high and low traffic tasting rooms wasthe result of some unobserved difference in thewineries unrelated to difference in tasting roomscharacteristics. For example, the difference inthe retail sales growth between Highway 29and Silverado Trail wineries could be attributedto factors such as greater distribution or greater
marketing efforts aimed at off-premise retailsales. This would lead to the spurious conclu-sion that it was the difference in tasting roomsdriving the results.
While this type of unobserved heterogeneitymay exist, it seems unlikely to bias our resultsfor two reasons. First, summary statistics showthat Highway 29 wineries are on average largerthan the Silverado Trail wineries and wouldpresumably have greater distribution and mar-keting efforts. This would be inconsistent withthe Silverado Trail wineries experiencinggreater growth in off-premise retail sales awayfrom the tasting room. Second, if our resultswere driven by unobserved difference in winerycharacteristics, these factors would have to haveopposite effects in Napa and Sonoma given thatthe larger wineries experienced greater growthin retail sales in Sonoma but lower growth inNapa.
Despite our questions as to the effect ofendogeneity and unobserved heterogeneity onour results, we nevertheless attempt to correctfor these with another set of experiments.
Experiment no. 3―Open versus ReservedTasting Rooms
Ideally, we would like to test for differencesamong wineries along the same stretch ofHighway 29 that differ only in tasting roomenvironment. Unfortunately, unlike wine whichhas many third-party rating agencies, there is noformal third-party measure of a tasting rooms’ambiance. Instead, we rely on a proxy variable.All of the tasting rooms we have examined thusfar in both Sonoma and Napa are open to thegeneral public. However, that is not true of allof the tasting rooms in our sample areas.Specifically, we identify a subset of tastingrooms along the same Highway 29 corridorthat require a reservation prior to visiting. Wetest whether a reservation requirement, whichostensibly reduces traffic through a tastingroom, acts as an effective proxy in differentiat-ing our subsample of tasting rooms from thoseopen to the general public. A list of the winerieswith open and reserved tasting rooms is pro-vided in Appendix Table A3. If a reservation
Cuellar, Eyler, and Fanti 545
Dow
nloa
ded
by [
Stev
en C
uella
r] a
t 07:
31 1
2 A
ugus
t 201
5

requirement does differentiate those wineriesfrom the more highly trafficked and commer-cially oriented tasting rooms, then tasting roomsthat require reservations should experiencegreater off-premise retail sales growth thanthose that do not. Since many of the reservedtasting rooms are next to open tasting roomsalong the same Highway 29 corridor, thesewould appear to create an ideal control groupfor the open Highway 29 tasting rooms.
Figure 4 shows indexed retail sales for openand reserved tasting rooms along the Highway29 corridor while Table 4 provides the regres-sion results.
As Figure 4 and Table 4 indicate, not only isthe growth rate in retail sales of wines fromwineries with reserved tasting rooms greaterthan that of wineries with open tasting roomsduring the off season, but also during the criticalholiday season of October, November andDecember. Both results are statistically signifi-cant and are consistent with the idea that wine-ries with reserved tasting rooms along Highway29 benefit from both the high profile ofHighway 29 and the relaxed environment ofthe reservation requirement.
Off-premise retail sales of wines from wine-ries with reserved tasting rooms along Highway29 are not only greater than the growth in retailsales of wines from wineries along Highway 29with open tasting rooms, but they are alsogreater than the growth in retail sales of theSilverado Trail wineries and the Highway 12wineries.
Furthermore, while our comparison of retailsales of wineries with tasting rooms alongHighway 29 and the Silverado Trail may havebeen the result of some unobserved differencesbetween the wineries along Highway 29 and theSilverado Trail, this is clearly not an issue forwineries with open and reserved tasting roomsalong Highway 29.
Figure 5 shows indexed retail sales for openand reserved tasting rooms along the SilveradoTrail. As can be seen in Figure 5, the results aremixed. While the growth in off-premise retailsales of the reserved tasting rooms is less thanthat of the open tasting rooms, off-premise holi-day sales of the reserved tasting rooms’ winesare greater than that of the open tasting rooms.Regression results from Table 5 confirm thegraphical interpretation and indicate that both
FIGURE 4. Case Volume of Open versus Reserved Tasting Rooms along Highway 29, In NapaCounty, California
–0.5
0
0.5
1
1.5
2
2.5
3
3.5
4
4.5
1-M
ay
-0
7
1-Ju
l-0
7
1-S
ep
-0
7
1-N
ov-0
7
1-Ja
n-0
8
1-M
ar-0
8
1-M
ay
-0
8
1-Ju
l-0
8
1-S
ep
-0
8
1-N
ov-0
8
1-Ja
n-0
9
1-M
ar-0
9
1-M
ay
-0
9
1-Ju
l-0
9
1-S
ep
-0
9
1-N
ov-0
9
1-Ja
n-1
0
1-M
ar-1
0
1-M
ay
-1
0
1-Ju
l-1
0
1-S
ep
-1
0
1-N
ov-1
0
1-Ja
n-1
1
1-M
ar-1
1
Ind
ex
ed
Ca
se
Vo
lum
e
Hwy 29
Open
Hwy 29
Reserved
546 JOURNAL OF TRAVEL & TOURISM MARKETING
Dow
nloa
ded
by [
Stev
en C
uella
r] a
t 07:
31 1
2 A
ugus
t 201
5
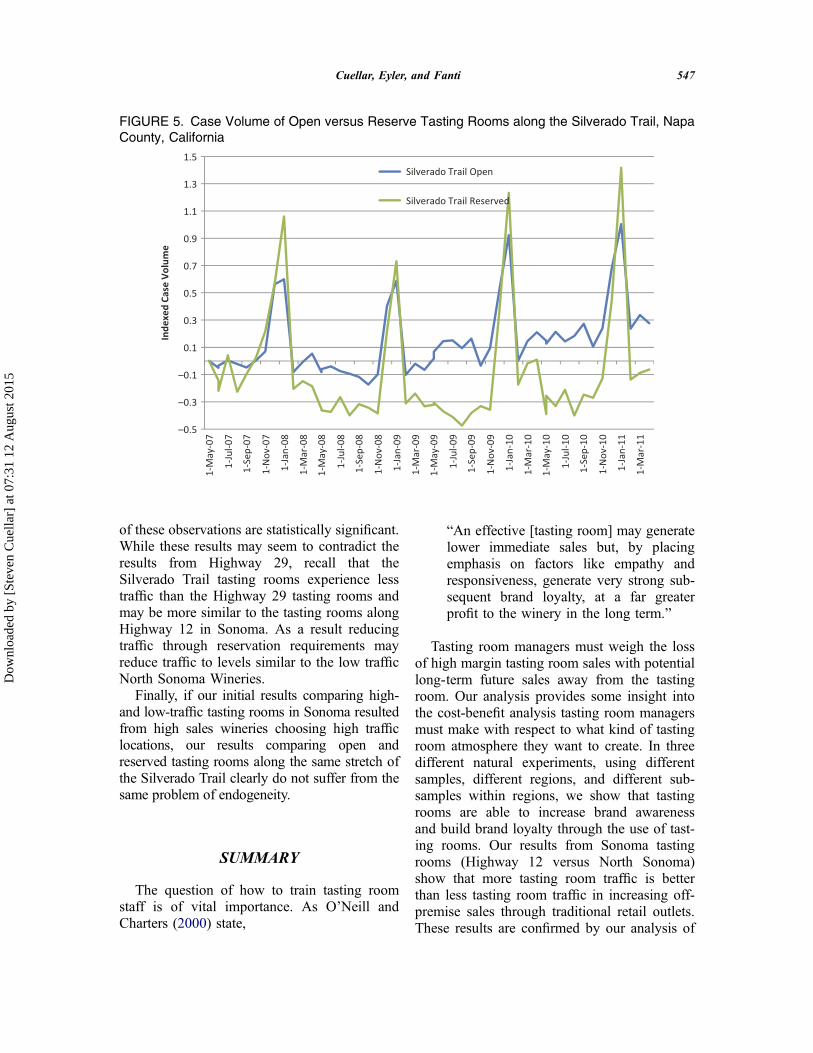
of these observations are statistically significant.While these results may seem to contradict theresults from Highway 29, recall that theSilverado Trail tasting rooms experience lesstraffic than the Highway 29 tasting rooms andmay be more similar to the tasting rooms alongHighway 12 in Sonoma. As a result reducingtraffic through reservation requirements mayreduce traffic to levels similar to the low trafficNorth Sonoma Wineries.
Finally, if our initial results comparing high-and low-traffic tasting rooms in Sonoma resultedfrom high sales wineries choosing high trafficlocations, our results comparing open andreserved tasting rooms along the same stretch ofthe Silverado Trail clearly do not suffer from thesame problem of endogeneity.
SUMMARY
The question of how to train tasting roomstaff is of vital importance. As O’Neill andCharters (2000) state,
“An effective [tasting room] may generatelower immediate sales but, by placingemphasis on factors like empathy andresponsiveness, generate very strong sub-sequent brand loyalty, at a far greaterprofit to the winery in the long term.”
Tasting room managers must weigh the lossof high margin tasting room sales with potentiallong-term future sales away from the tastingroom. Our analysis provides some insight intothe cost-benefit analysis tasting room managersmust make with respect to what kind of tastingroom atmosphere they want to create. In threedifferent natural experiments, using differentsamples, different regions, and different sub-samples within regions, we show that tastingrooms are able to increase brand awarenessand build brand loyalty through the use of tast-ing rooms. Our results from Sonoma tastingrooms (Highway 12 versus North Sonoma)show that more tasting room traffic is betterthan less tasting room traffic in increasing off-premise sales through traditional retail outlets.These results are confirmed by our analysis of
FIGURE 5. Case Volume of Open versus Reserve Tasting Rooms along the Silverado Trail, NapaCounty, California
–0.5
–0.3
–0.1
0.1
0.3
0.5
0.7
0.9
1.1
1.3
1.5
1-M
ay
-0
7
1-Ju
l-0
7
1-S
ep
-0
7
1-N
ov-0
7
1-Ja
n-0
8
1-M
ar-0
8
1-M
ay
-0
8
1-Ju
l-0
8
1-S
ep
-0
8
1-N
ov-0
8
1-Ja
n-0
9
1-M
ar-0
9
1-M
ay
-0
9
1-Ju
l-0
9
1-S
ep
-0
9
1-N
ov-0
9
1-Ja
n-1
0
1-M
ar-1
0
1-M
ay
-1
0
1-Ju
l-1
0
1-S
ep
-1
0
1-N
ov-1
0
1-Ja
n-1
1
1-M
ar-1
1
Ind
ex
ed
Ca
se
Vo
lum
eSilverado Trail Open
Silverado Trail Reserved
Cuellar, Eyler, and Fanti 547
Dow
nloa
ded
by [
Stev
en C
uella
r] a
t 07:
31 1
2 A
ugus
t 201
5

open and reserved tasting rooms along theSilverado Trail in Napa.
Our results from Napa show that wineriesalong the Silverado Trail with more relaxedtasting room environments experienced greatergrowth in off-premise retail sales than the wine-ries along Highway 29 with more commercialoriented tasting rooms. These results were con-firmed even more emphatically in our examina-tion of open and reserved tasting rooms locatedalong Highway 29.
As noted, wine tasting is as much about thewine country experience as it is about the wineand this research has broad implication as towhat kind of tasting room environment wineriesmay want to create and how tasting room staffis trained and incentivized. Instead of
concentrating on high margin tasting roomsales, tasting room managers may want toinstead concentrate on turning “A one off cus-tomer …into a loyal advocate for the winery”(O’Neill & Charters, 2000). While those visit-ing a winery’s tasting room may be a smallsubset of consumers, these “loyal advocates”not only become long-time purchasers, butthey also work to convert others who have notvisited the winery tasting room into regularbuyers.
The conflict between creating a relaxed orcommercial tasting room environment is exem-plified in a recent article in Wines & Vines,where a Napa-based firm that trains tastingroom staff noted that its,
“mantra for tasting room staff is to
● Sell wine● Sell wine club memberships● Capture contact data”
and not to “pour wine and entertain visitors”(Franson, 2012). The results of this researchclearly question that philosophy and its abilityto create brand loyalty and long-term repeatsales away from the tasting room.
DIRECTIONS OF FUTURE RESEARCH
Our results show that tasting rooms are effec-tive at increasing brand awareness and creatingbrand loyalty resulting in long-term repeat salesin off-premise retail outlets. Furthermore weshow that relaxed tasting room environmentsare more effective than commercial tastingroom environments at building brand loyaltyand increasing long-term off-premise sales.There are some limitations to our analysis. Forexample, we do not consider differences inadvertising, promotions or social media thatmay be driving the differences in sales.Additionally, there are several questions thatremain unanswered. For example, for wineriesthat sells exclusively or mostly through tastingrooms, wine clubs and restaurants, our resultsmay not be relevant. A question more directlyrelated to these wineries is “what type of tastingroom environment results in the greatest tasting
TABLE 5. Napa Reserved Regression Results
Estimated Variable Cases
Time 0.004[0.10]
Napa29*Time −0.004[0.28]
Silverado Trail*Time 0.003[0.47]
Napa29 Reserved*Time 0.029[0.00]**
Silverado Trail Reserved*Time −0.005[0.20]
Holiday 0.266[0.00]**
Napa29 −0.005[0.97]
Silverado Trail −0.109[0.33]
Napa29 Reserved −0.177[0.11]
Silverado Trail Reserved −0.213[0.06]
Napa29*Holiday −0.01[0.94]
Silverado Trail *Holiday 0.133[0.30]
Napa29 Reserved*Holiday 0.678[0.00]**
Silverado Trail Reserved*Holiday 0.425[0.00]**
Constant −0.017[0.83]
Observations 260Adjusted R-squared 0.75
Absolute value of t-statistics in brackets* significant at 5% level; ** significant at 1% level
548 JOURNAL OF TRAVEL & TOURISM MARKETING
Dow
nloa
ded
by [
Stev
en C
uella
r] a
t 07:
31 1
2 A
ugus
t 201
5

room sales and the most wine club sign-ups?”Our analysis of third-party sales away from thetasting room does not address this question.
In a broader context, for wineries such asthose included in our study who do sell throughboth the tasting room and traditional retail out-lets, we do not investigation if greater off-pre-mise sales through the retail channel outweighany reduced sales and club memberships thatoccur in a more relaxed tasting room environ-ment that is not emphasizing tasting room salesand club sign-ups. While this would provide amore complete picture of the costs and benefitsof tasting room environment, there are severalobstacles. First, there is no single source of datafor tasting room sales and club membershipsign-ups at tasting rooms. Second, while tastingroom sales and club sign-ups can potentially beextracted from point-of-sales (POS) systems atthe tasting room, these systems are maintainedindividually by each winery and would have tobe obtained on winery-by-winery basis. Third,assuming this information could potentially beobtained through point-of-sale data from a sam-ple of winery tasting rooms, sample size may bean issue as the number of wineries willing tovolunteer proprietary data for analysis is likelyto be small. While these obstacles are clearlynot insurmountable, they will require a signifi-cant undertaking.
REFERENCES
Akerlof, G. A. (1970). The market for ‘lemons’: Qualityuncertainty and the market mechanism. The QuarterlyJournal of Economics, 84, 488–500. doi:10.2307/1879431
Arndt, A. D., & Karande, K. (2012). Is it better for sales-people to have the highest customer orientation or astrong fit with their group’s customer orientation?Findings from automobile dealerships. Journal ofRetailing and Consumer Services, 19(3), 353–359.doi:10.1016/j.jretconser.2012.03.009
Barber, N. A., Donovan, J. R., & Dodd, T. H. (2008).Differences in tourism marketing strategies betweenwineries based on size or location. Journal of Travel& Tourism Marketing, 25(1), 43–57. doi:10.1080/10548400802164889
Beteta, C. (2011, November 16). President of theCalifornia travel and tourism commission.
Presentation at the Wine Tourism Conference, Napa,CA.
Bruwer, J. W., & Alant, K. (2009). The hedonic nature ofwine tourism consumption: An experiential view.International Journal of Wine Business Research,21(3), 235–257. doi:10.1108/17511060910985962
Bruwer, J. W., & Lesschaeve, I. (2012a). Sources of infor-mation used by tourists travelling to visit canadianwinery tasting rooms. Tourism Planning &Development, 9(3), 269–289. doi:10.1080/21568316.2012.672452
Bruwer, J. W., & Lesschaeve, I. (2012b). Wine tourists’destination region brand image perception and ante-cedents: Conceptualization of a winescape frame-work. Journal of Travel & Tourism Marketing,29(7), 611–628. doi:10.1080/10548408.2012.719819
Bustillo, M. (2012, May 29). Best buy forced to rethinkbig box. Wall Street Journal. Retrieved from http://online.wsj.com/article/SB10001424052702303404704577311322427071212.html
Carmichael, B. A. (2005). Understanding the wine tourismexperience for winery visitors in the Niagara Region,Ontario, Canada. Tourism Geographies, 7(2), 185–204.doi:10.1080/14616680500072414
Chu, W., Gerstner, E., & Hess, J. D. (1995). Costs andbenefits of hard-sell. Journal of Marketing Research,32(1), 97–102. doi:10.2307/3152114
Clark, L. (2012). The experiential explosion. B&TMagazine, 62(2779), 14–20.
Clarkson, J. J., Janiszewski, C., & Cinelli, M. D. (2013). Thedesire for consumption knowledge. Journal of ConsumerResearch, 39, 1313–1329. doi:10.1086/668535
Cuellar, S. S., & Claps, M. (2013). Differential effects ofbrand, ratings and region on willingness to pay: Ahedonic price approach. Journal of Wine Research,24(2), 138–155. doi:10.1080/09571264.2013.766160
Diesbach, P. B. (2012). Touristic destination ambassadors,case analysis and conceptualization, how to betterunderstand and use brand ambassadors in cognitive,affective and experiential approaches. Tourism andHospitality Management, 18(2), 229–258.
Dodd, T. H. (1999). Attracting repeat customers to wine-ries. International Journal of Wine Marketing, 11(2),18–28. doi:10.1108/eb008693
Dodd, T. (1995). Opportunities and pitfalls of tourism in adeveloping wine industry. International Journal of WineMarketing, 7(1), 5–16. doi:10.1108/eb008636
Dodd, T., & Gustafson, A.W. (1997). Product, environmental,and service attributes that influence consumer attitudesand purchases at wineries. Journal of FoodProducts Marketing, 4(3), 41–59. doi:10.1300/J038v04n03_04
Duncan, G. (2012, November 22). Why apple stores areraking in bags full of cash, and no one can dupe theformula. Digital Trends. Retrieved from http://www.
Cuellar, Eyler, and Fanti 549
Dow
nloa
ded
by [
Stev
en C
uella
r] a
t 07:
31 1
2 A
ugus
t 201
5

digitaltrends.com/mobile/why-do-apple-stores-make-so-much-money-and-why-cant-anybody-copy-them/
Eliashberg, J., & Shugan, S. M. (1997). Film critics:Influencers or predictors?Journal of Marketing, 61,68–78. doi:10.2307/1251831
Franke, G. R., & Park, J.-E. (2006). Salesperson adaptiveselling behavior and customer orientation: Ameta-ana-lysis. Journal of Marketing Research, 43(4), 693–702.doi:10.1509/jmkr.43.4.693
Franson, P. (2012, January 27). Winery tasting room woes.Wines & Vines. Retrieved from http://www.winesandvines.com/template.cfm?section=news&content=96823
Freedman, A. M. (1986, August 28). Use of free productsamples wins new favor as sales tool. Wall StreetJournal, p. 17.
Grossman, S. J. (1981). The informational role of warran-ties and private disclosure about product quality. TheJournal of Law and Economics, 24, 461–489.doi:10.1086/466995
Heilman, C., Lakishyk, K., & Radas, S. (2011). An empiri-cal investigation of in-store sampling promotions.British Food Journal, 113(10), 1252–1266.doi:10.1108/00070701111177674
Holbrook, M., & Hirschman, E. C. (1982). The experien-tial aspects of consumption: Consumer fantasies, feel-ings, and fun. Journal of Consumer Research,September, 9, 132–140. doi:10.1086/208906
Keller, K. L., & Lehmann, D.R. (2006). Brands and brand-ing: Research findings and future priorities. MarketingScience, 25(6), 740–759. doi:10.1287/mksc.1050.0153
Locke, M. (16 June 2011). abc News. Napa Valley 101:Basics for CA Wine Country Trip. Retrieved fromhttp://abcnews.go.com/Travel/wireStory?id=13858249#.T3t37L9Wo3k
McGuinness, D., Bernnan, M., & Gendall, P. (1995). Theeffect of product sampling and couponing on purchasebehaviour: Some empirical evidence. InternationalJournal of Advertising, 14(3), 219–230.
McGuinness, D., Gendall, P., & Mathew, S. (1992). Theeffect of product sampling on product trial, purchaseand conversion. International Journal of Advertising,11(1), 83–92.
Meyer, E. (1982, July 12). Sampling builds better busi-ness. Advertising Age, p. M–22.
Milgrom, P., & Roberts, J. (1986). Price and advertisingsignals of product quality. Journal of PoliticalEconomy, 94, 796–821. doi:10.1086/261408
Morey, R. C. (1980). Measuring the impact of servicelevel on retail sales. Journal of Retailing, 56(2), 81–81.
Napa Tourist Guide. (2011). Napa’s Best Wineries - TheSilverado Trail. Retrieved from http://www.napatour-istguide.com/wineries-silverado.html
Nelson, P. (1970). Information and consumer behavior.Journal of Political Economy, 78, 311–329. doi:10.1086/259630
Nelson, P. (1974). Advertising as information. Journal ofPolitical Economy, 82, 729–754. doi:10.1086/260231
Nelson, L. (2001). Silverado Trail—Napa Valley WineTours. Retrieved from http://www.inetours.com/PagesWT/WTareas/Silverado_Trail.html
Nowak, L.I., & Newton, S. K. (2006). Using the tasting roomexperience to create loyal customers. InternationalJournal of Wine Marketing, 18(3), 157–165. doi:10.1108/09547540610704738
O’Connell, R. (2012, March 11). Wine tourism on high-way 29 in Napa valley. Kid Napa. Retrieved fromhttp://kidnapa.posterous.com/wine-tourism-on-high-way-29-in-napa-valley
O’Neil, M., Palmer, A., & Charters, S. (2002). Wineproduction as a service experience –the effects of ser-vice quality on wine sales. Journal of ServicesMarketing, 16(4), 212–235.
O’Neill, M., & Charters, S. (2000). Service quality at thecellar door: Implications for Western Australia’s devel-oping wine tourism industry. Managing ServiceQuality, 10(2), 112–122. doi:10.1108/09604520010318308
Olmstead, M. (2011). Golden haven. Retrieved from http://www.goldenhaven.com/wineries/Silverado_Trail_Wineries.html
Reinstein, D. A., & Snyder, C. M. (2005). The influence ofexpert reviews on consumer demand for experiencegoods: A case study of movie critics. Journal ofIndustrial Economics, 53, 27–51. doi:10.1111/j.0022-1821.2005.00244.x
Schmitt, B. (1999). Experiential marketing. Journal ofMarketing Management, 15, 53–67. doi:10.1362/026725799784870496
Senthil, M., Chandrasekar, K. S., & Selvabaskar, S.(2012). Experiential retailing as a strategic tool forretail store differentiation and brand association-A con-ceptual approach. SEIS Journal of Management, 8(1),92–102.
Terblanche, N. S., & Boshoff, C. (2006). The relationshipbetween a satisfactory in-store shopping experienceand retailer loyalty. South African Journal of BusinessManagement, 37(2), 33–43.
SUBMITTED: September 21, 2013FINAL REVISION SUBMITTED:
March 29, 2014ACCEPTED: April 14, 2014
REFEREED ANONYMOUSLY
550 JOURNAL OF TRAVEL & TOURISM MARKETING
Dow
nloa
ded
by [
Stev
en C
uella
r] a
t 07:
31 1
2 A
ugus
t 201
5

APPENDIX
FIGURE A1. Map of Sonoma County Tasting Rooms
Cuellar, Eyler, and Fanti 551
Dow
nloa
ded
by [
Stev
en C
uella
r] a
t 07:
31 1
2 A
ugus
t 201
5

FIGURE A2. Map of Napa Valley Tasting Rooms
552 JOURNAL OF TRAVEL & TOURISM MARKETING
Dow
nloa
ded
by [
Stev
en C
uella
r] a
t 07:
31 1
2 A
ugus
t 201
5

Appendix: Tasting Rooms
TABLE A1. Sonoma County Wineries
High Traffic Low Traffic
Arrowood Alexander Valley VineyardsBlackstone Chalk HillB.R. Cohn Dry Creek VineyardChateau St. Jean Field StoneKenwood HannaKunde Estate Lancaster EstatesLandmark MazzaccoSt. Francis Michael-Schlumberger
QuiviraSbragia Family Vineyars
TABLE A2. Napa County Open Wineries
Highway 29 Silverado Trail
Robert Mondavi Winery AndrettiNickel & Nickel August BriggsTurnbull Black Stallion Estate WinerySt. Supery Chateau MontelenaSequoia Grove Chimney RockProvenance Vineyards Clos Du ValWhitehall Lane Winery Clos PegaseSutter Home Conn CreekFranciscan DarioushFlora Springs Duckhorn VineyardHeitz Cellars Frank Family VineyardsLouis M. Martini Luna VineyardsBeringer MinerBeaulieu Vineyard MonticelloGrgich Hills Mumm NapaCosentino Quintessa
RaymondRegusciRombauerRound HillRutherford HillRutherford RanchSignorelloSilveradoStag’s Leap Wine CellarsSterling VineyardsTwomeyZD
TABLE A3. Napa County Reserved Wineries
Highway 29 Silverado Trail
Ballentine Joseph PhelpsBell Robert SinskeyCakebread Cellars ShaferClif Stags’ LeapElyse SteltznerFar Niente Vine CliffLivingston MoffettNewtonOpus OneRubicon EstateSpottswoodeStaglin Family VineyardSwanson
Cuellar, Eyler, and Fanti 553
Dow
nloa
ded
by [
Stev
en C
uella
r] a
t 07:
31 1
2 A
ugus
t 201
5