experiment 4 the determination of partial molar enthalpy
DESCRIPTION
The Determination of Partial Molar EnthalpyPhysical Chemistry Laboratory ITRANSCRIPT

P a g e | 1
Experiment 4
THE DETERMINATION OF PARTIAL MOLAR ENTHALPY
A Laboratory Report in Partial Fulfilment of the Requirements in Chem116 Laboratory
ARELLANO, LORY MAE
DAGONDON, VANESSA OLGA
(Group 5)
Chem116 Laboratory – Physical Chemistry I Laboratory
Section 1
Performed on October 5, 2015
Submitted on October 22, 2015
ARNOLD C. GAJE
Laboratory Instructor
P a g e | 2
ABSTRACT
The main focus of this experiment is to estimate the values of the partial molar
enthalpy of mixing of glycerol-water mixtures. In order to do so, (8) eight glycerol-water
mixtures were prepared. Tasks dictated by the laboratory manual were distributed to each of
the groups in the class to minimize the use of reagents and equipment. The molar change in
enthalpy of mixing of these glycerol-water mixtures was determined with the use of a
constant pressure calorimeter. These obtained values of molar enthalpy change were plotted
against the mole fraction of glycerol. An outlier was determined in the curve. Personal errors
that might cause this outlier were acknowledged. The outlier was omitted from the data
analysis. The partial molar enthalpy of glycerol and water were estimated by drawing a
tangent at a specific point in the plotted curve which designates the given concentration. The
y-intercepts at both ends of the tangent line represent the partial molar enthalpies. The
estimated values for the partial molar enthalpy of glycerol and water are 135 J/mol and 460
J/mol, respectively.
P a g e | 3
INTRODUCTION
In a solution made my mixing substance 1 of specific number of moles with substance
2 of a specific number of moles, the enthalpy change associated with these two substances is
a function of the number of moles of the components present in the formed mixture.
[1] ∆ H=∆ H (T , P , n1 ,n2)
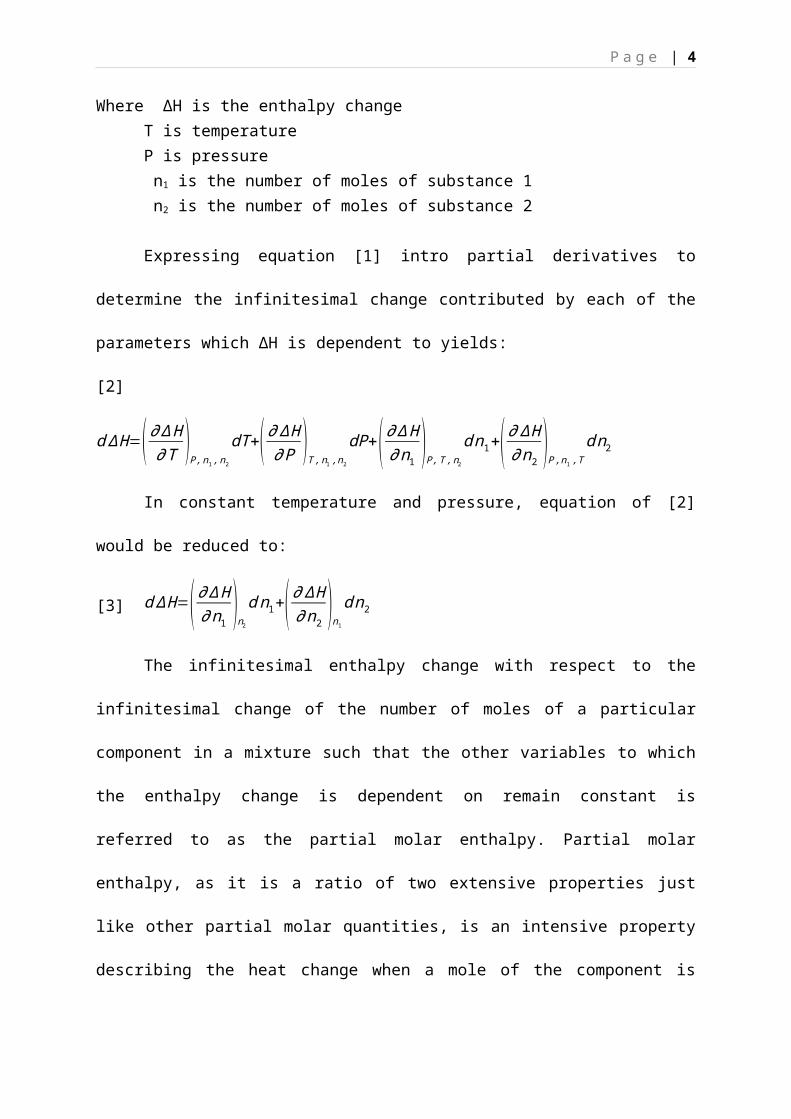
Where ∆H is the enthalpy changeT is temperatureP is pressure n1 is the number of moles of substance 1 n2 is the number of moles of substance 2
Expressing equation [1] intro partial derivatives to determine the infinitesimal change
contributed by each of the parameters which ∆H is dependent to yields:
[2] d ∆ H=( ∂ ∆ H∂ T )
P,n1 , n2
dT +( ∂ ∆ H∂ P )
T , n1 ,n2
dP+( ∂ ∆ H∂ n1
)P, T , n2
d n1+( ∂ ∆ H∂ n2
)P, n1 ,T
d n2
In constant temperature and pressure, equation of [2] would be reduced to:
[3] d ∆ H=( ∂ ∆ H∂ n1
)n2
d n1+( ∂ ∆ H∂ n2
)n1
d n2
The infinitesimal enthalpy change with respect to the infinitesimal change of the
number of moles of a particular component in a mixture such that the other variables to which
the enthalpy change is dependent on remain constant is referred to as the partial molar
enthalpy. Partial molar enthalpy, as it is a ratio of two extensive properties just like other
partial molar quantities, is an intensive property describing the heat change when a mole of
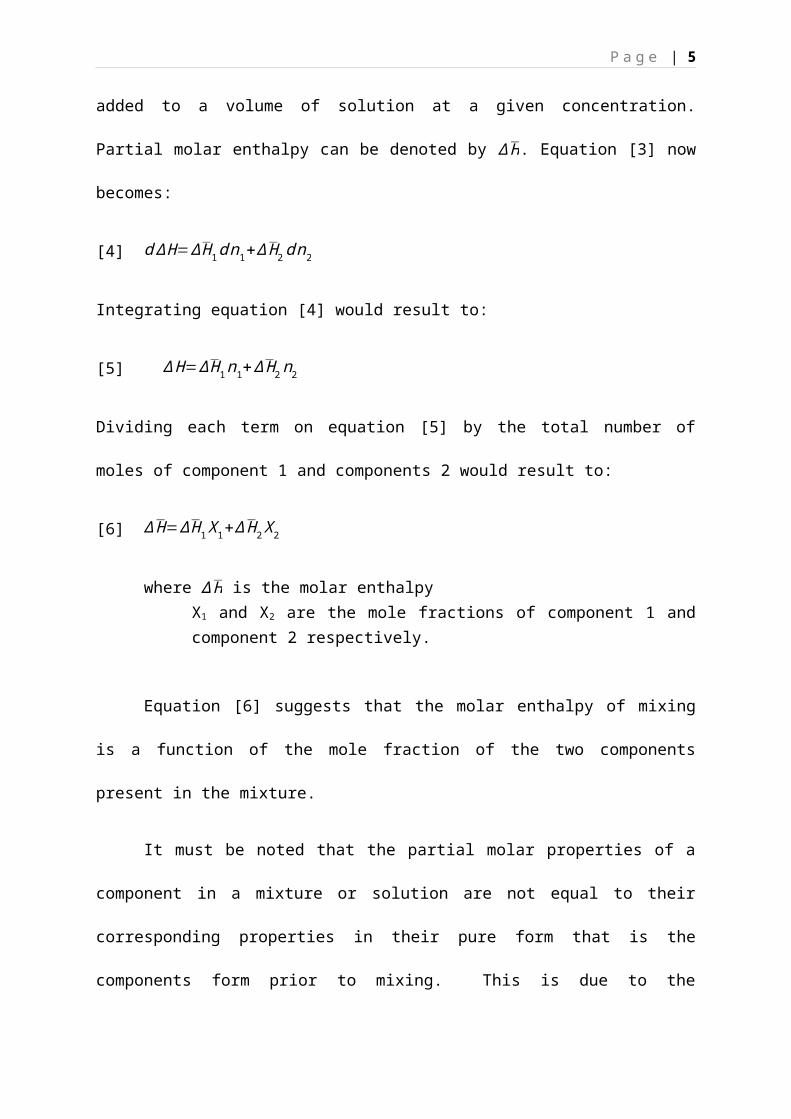
the component is added to a volume of solution at a given concentration. Partial molar
enthalpy can be denoted by ∆ H . Equation [3] now becomes:
[4] d ∆ H=∆ H 1 dn1+∆ H2d n2
P a g e | 4
Integrating equation [4] would result to:
[5] ∆ H=∆ H 1 n1+∆ H 2 n2
Dividing each term on equation [5] by the total number of moles of component 1 and
components 2 would result to:
[6] ∆ H=∆ H 1 X1+∆ H 2 X2
where ∆ H is the molar enthalpyX1 and X2 are the mole fractions of component 1 and component 2 respectively.
Equation [6] suggests that the molar enthalpy of mixing is a function of the mole
fraction of the two components present in the mixture.
It must be noted that the partial molar properties of a component in a mixture or
solution are not equal to their corresponding properties in their pure form that is the
components form prior to mixing. This is due to the differences between the intermolecular
forces in the solution and those in the pure components (Levine, Ira, 2009).
The experiment is designed to estimate the partial molar enthalpies of each of the
components of the glycerol-water mixture. This was done by obtaining the change in
enthalpy of the mixture through constant pressure calorimeter so as to calculate for the molar
change in enthalpy. The equation [6] can be further manipulated such that the relationship
between the molar change in enthalpy and one component in the mixture is linear.
[7] ∆ H=(∆ H 1−∆ H 2 ) X1+∆ H 2
Equation [7] is in the form of the linear equation y=mx +b where the expression
∆ H 1−∆ H 2 is m or the slope of the line and ∆ H 2 which is the partial molar enthalpy of
P a g e | 5
component 2 is just the y intercept. However, it must be noted that both the partial molar
enthalpy of component 1 and 2 are dependent on the mole fraction of the components in the
mixture. This resulted to a nonlinear graph of ∆ H vs. X1. Estimated values of partial molar
enthalpies at a given concentration were still obtained by the intercept method (Chua, Ortillo,
Araullo, et al, 1996).
Partial molar properties such as partial molar enthalpy are essential in determining
values of any extensive properties which define the state of the system in consideration. The
values of partial molar properties are maintained in constant temperature and pressure which
are the conditions in which values of the said extensive properties can be obtained (P. Atkins,
2006).
MATERIALS AND METHODS
MATERIALS
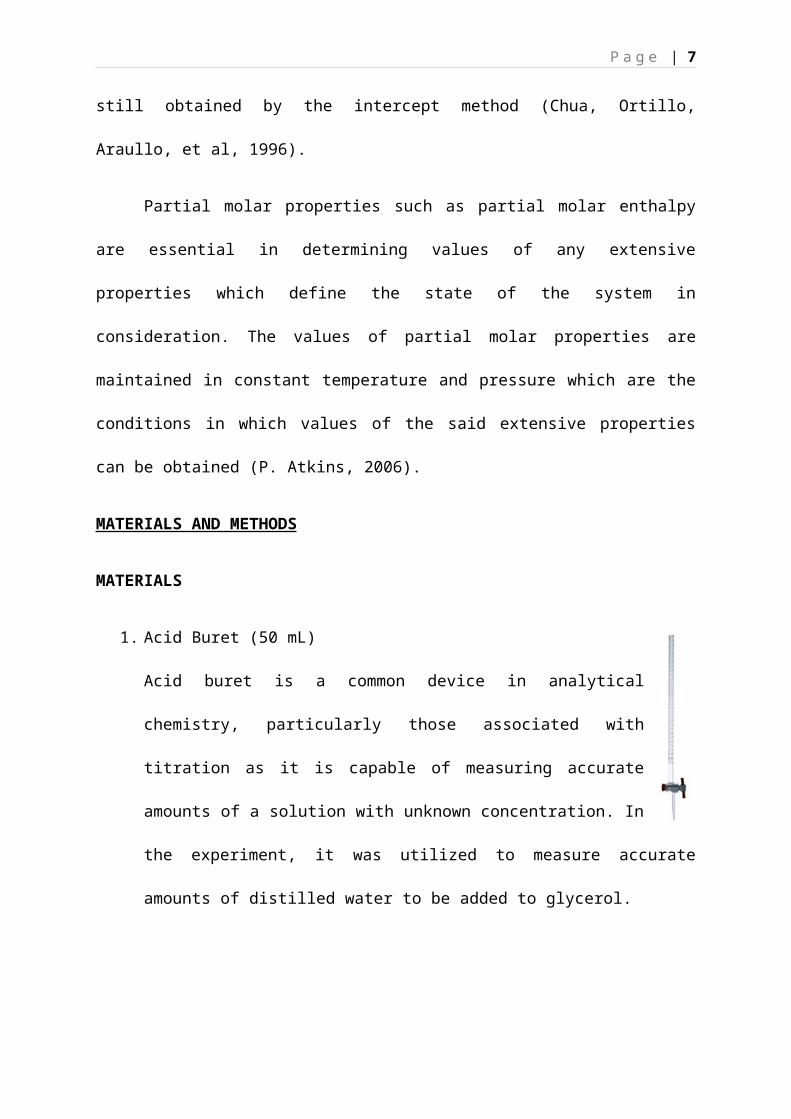
1. Acid Buret (50 mL)
Acid buret is a common device in analytical chemistry, particularly those
associated with titration as it is capable of measuring accurate amounts of a
solution with unknown concentration. In the experiment, it was utilized to
measure accurate amounts of distilled water to be added to glycerol.
Figure 1. Acid Buret
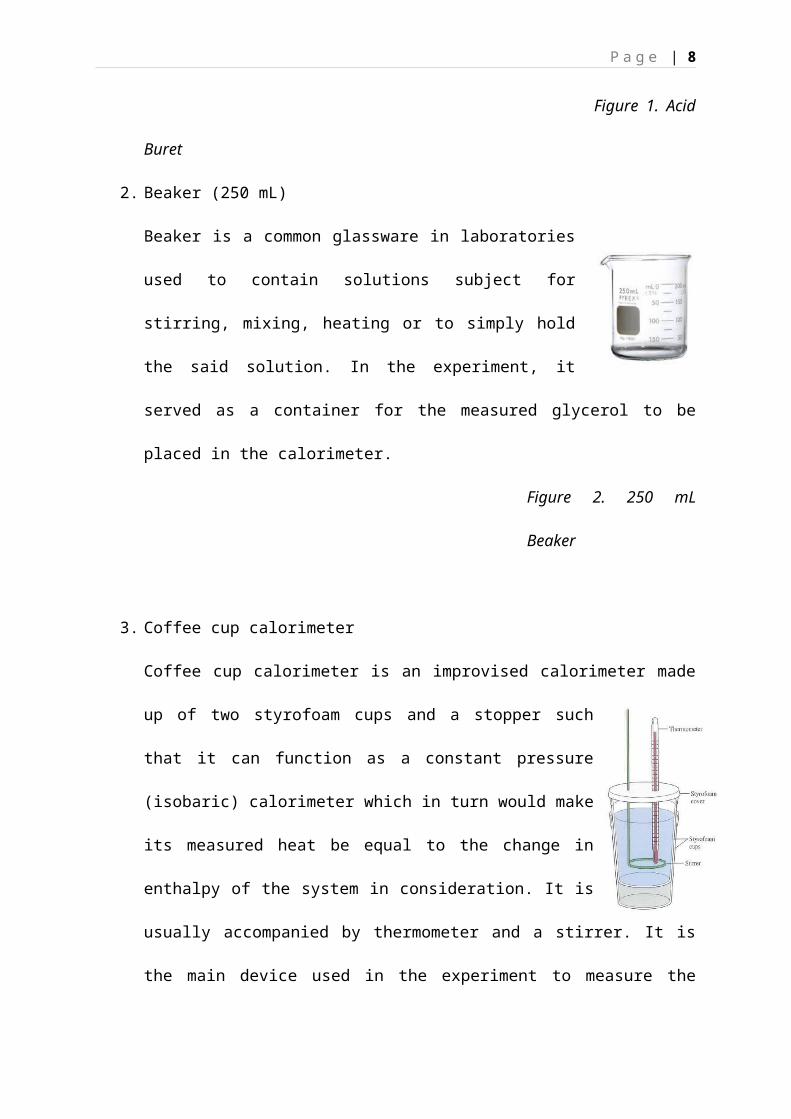
2. Beaker (250 mL)
Beaker is a common glassware in laboratories used to contain
solutions subject for stirring, mixing, heating or to simply hold the
said solution. In the experiment, it served as a container for the
measured glycerol to be placed in the calorimeter.

P a g e | 6
Figure 2. 250 mL Beaker
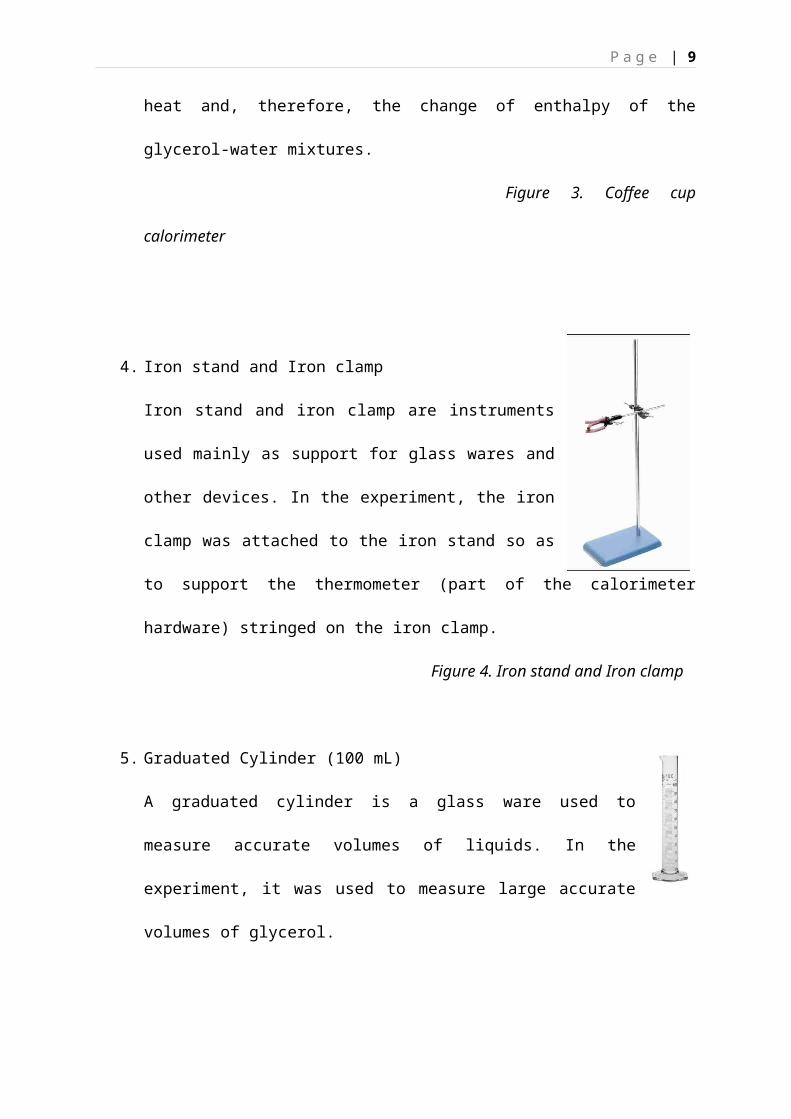
3. Coffee cup calorimeter
Coffee cup calorimeter is an improvised calorimeter made up of two styrofoam cups
and a stopper such that it can function as a constant pressure (isobaric)
calorimeter which in turn would make its measured heat be equal to
the change in enthalpy of the system in consideration. It is usually
accompanied by thermometer and a stirrer. It is the main device used
in the experiment to measure the heat and, therefore, the change of
enthalpy of the glycerol-water mixtures.
Figure 3. Coffee cup calorimeter
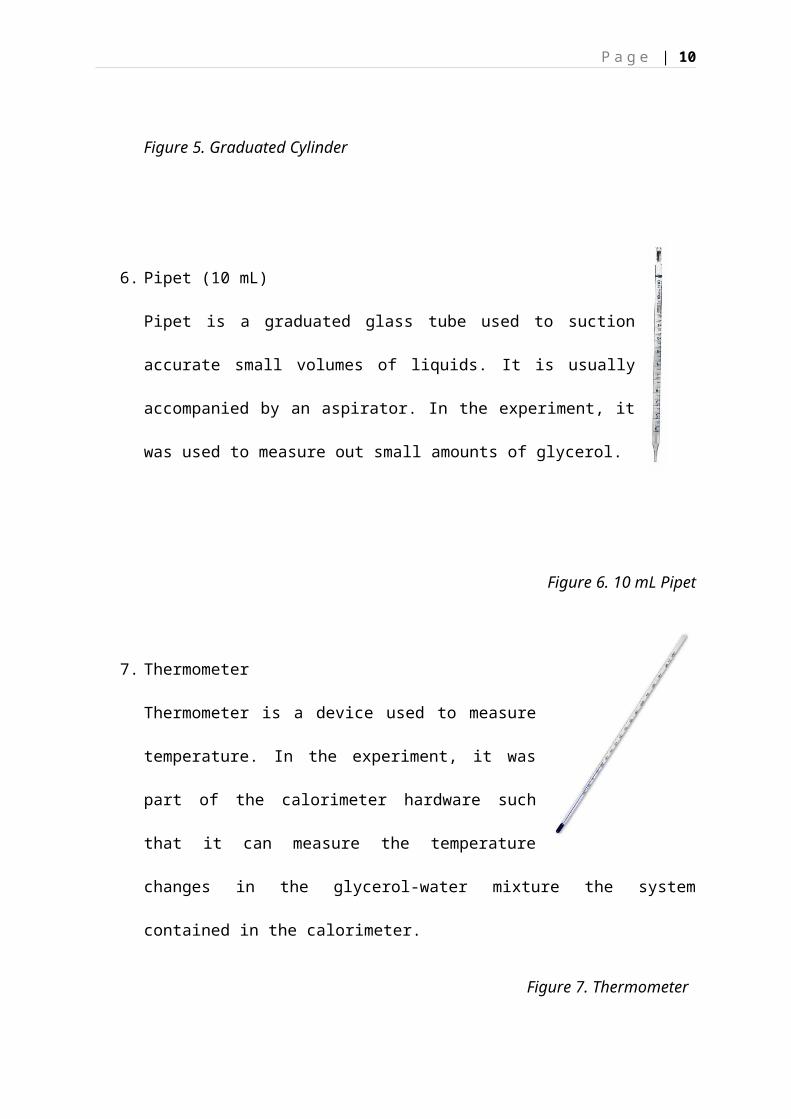
4. Iron stand and Iron clamp
Iron stand and iron clamp are instruments used mainly as
support for glass wares and other devices. In the experiment, the
iron clamp was attached to the iron stand so as to support the
thermometer (part of the calorimeter hardware) stringed on the
iron clamp.
Figure 4. Iron stand and Iron clamp
5. Graduated Cylinder (100 mL)
A graduated cylinder is a glass ware used to measure accurate volumes of
liquids. In the experiment, it was used to measure large accurate volumes of
glycerol.
P a g e | 7
Figure 5. Graduated Cylinder
6. Pipet (10 mL)
Pipet is a graduated glass tube used to suction accurate small volumes of
liquids. It is usually accompanied by an aspirator. In the experiment, it was
used to measure out small amounts of glycerol.
Figure 6. 10 mL Pipet
7. Thermometer
Thermometer is a device used to measure temperature. In the
experiment, it was part of the calorimeter hardware such that
it can measure the temperature changes in the glycerol-water
mixture the system contained in the calorimeter.
Figure 7. Thermometer
METHODS
Molar enthalpies of eight (8) glycerol-water mixtures were determined. Data obtained
in each mixture were used to estimate partial molar enthalpies of each component in the
mixture at a given concentration.
Labour was divided within the seven (7) groups in the class for reasons concerning
the scarcity of reagents and instruments such as coffee cup calorimeters. Each group was
paired with another group to determine the molar enthalpies of two mixtures assigned to them
P a g e | 8
by the instructor. One group, however, the one who got the Dewar flask and thus, was spared
to use the coffee cup calorimeter which was susceptible to errors, were tasked to do two
mixtures.
Preparation of Glycerol-Water Mixtures
Eight (8) glycerol-water mixtures were prepared by the whole class. The composition
of each mixtures were specified in the table 1 (see Appendix I). Preparation of mixture 5 and
6 were assigned to our group.
Indicated volumes of glycerol and water for both mixtures 5 and 6 were measured and
were transferred to a beaker and graduated cylinder, respectively. For mixture 5, 91.0 mL of
glycerol was accurately measured using a 100 mL graduated cylinder. It was then transferred
to a labelled beaker. 22.5 mL of distilled water was measured using a 50 mL acid buret and
was transferred to a labelled graduated cylinder. Same technique was done for mixture 6:
102.0 mL glycerol and 11.0 mL distilled water were measured.
Measuring the temperature change using Coffee cup calorimeter
The measured volume of glycerol from mixture 5 was transferred into the coffee cup
calorimeter. It was then equilibrated for two minutes noting its temperature per minute. Upon
establishing the constant temperature of the glycerol, the measured volume of water was
added into the coffee cup (an estimation of 8 seconds was noted before the water was added)
and was covered immediately. Before covering it was made sure that the thermometer and the
stirrer were assembled on the stopper of the coffee cup calorimeter such that both could not
agitate each other during the whole process of measuring the temperature and constant
swirling. The time-temperature data and the constant temperature were recorded for every
minute until 3 minutes. Same procedure was done for mixture 6. Before proceeding to
P a g e | 9
mixture 6, the coffee cup calorimeter was washed and rinsed. For mixture 6, an estimation of
10 seconds was noted before the water was added.
The change in temperature is the difference between the constant temperature
recorded after mixing the two liquids, glycerol and distilled water and the equilibrated
constant temperature of glycerol prior to the addition of distilled water.
RESULTS
This experiment obtained experimental data essential to estimate the partial molar
enthalpies of each components in different glycerol-water mixtures. The following tables
show the chronological order of values obtained and calculated so as to estimate partial molar
enthalpies. Interpretation of the relationships between these obtained values and target values
are shown graphically.
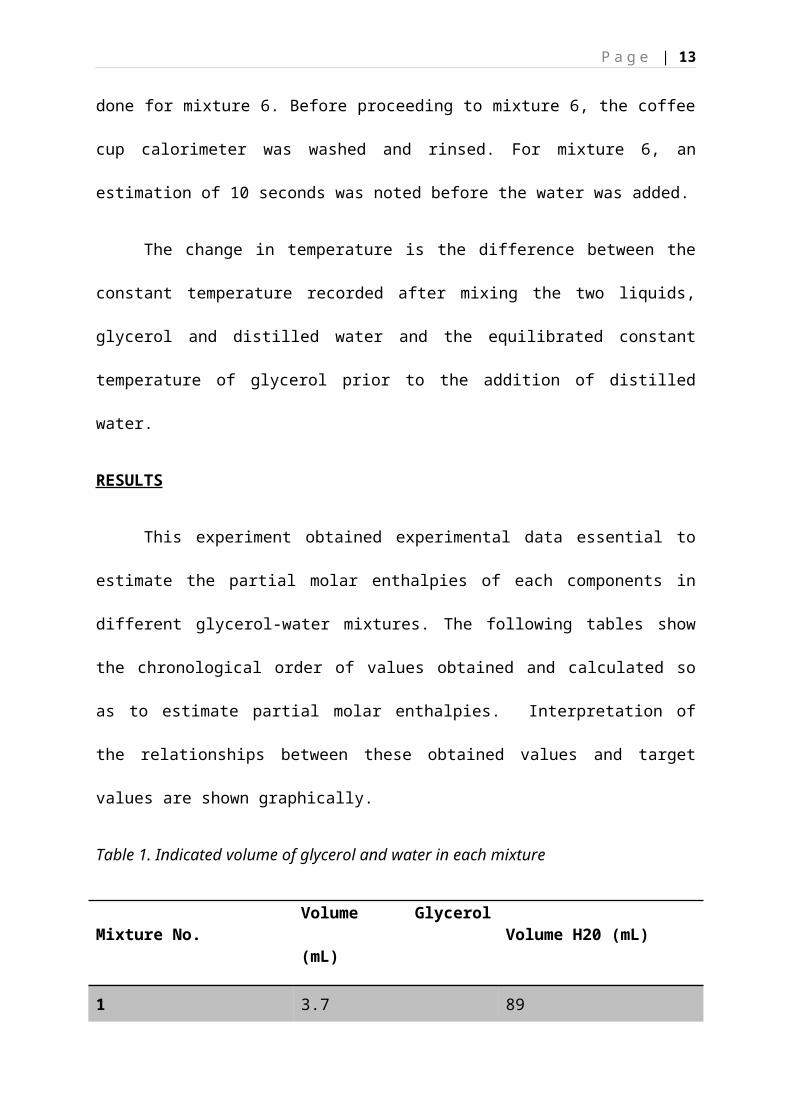
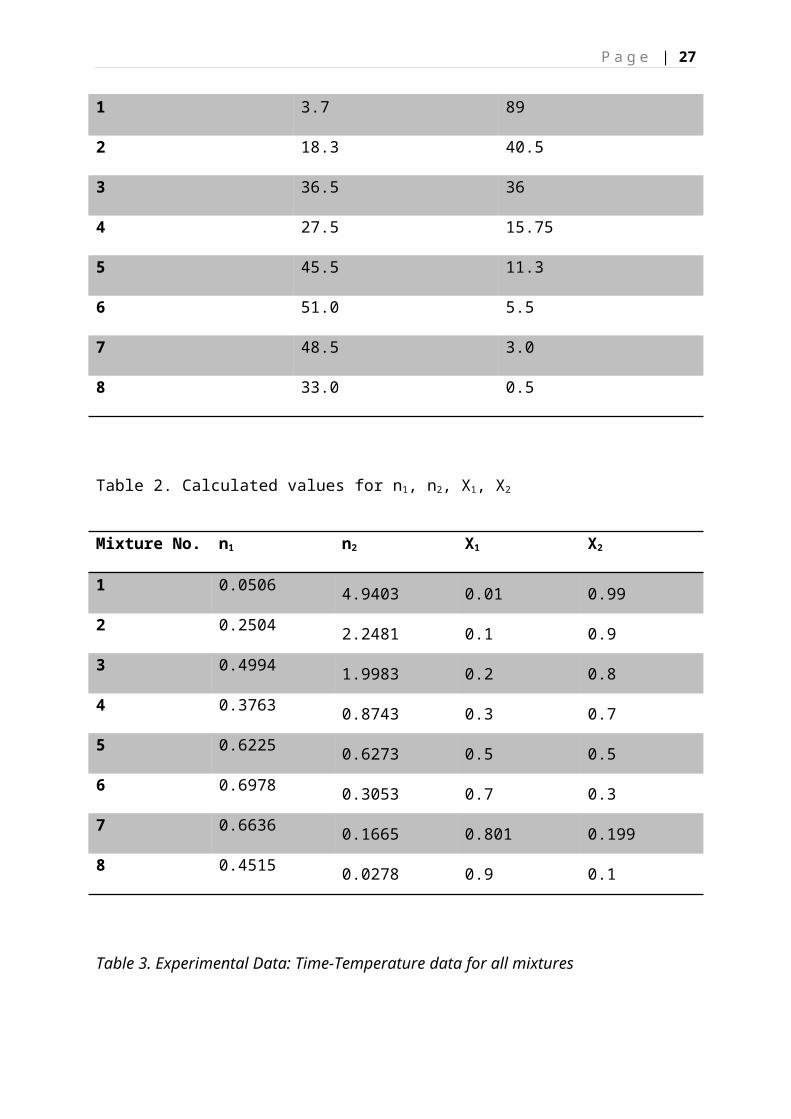
Table 1. Indicated volume of glycerol and water in each mixture
Mixture No. Volume Glycerol (mL) Volume H20 (mL)
1 3.7 89
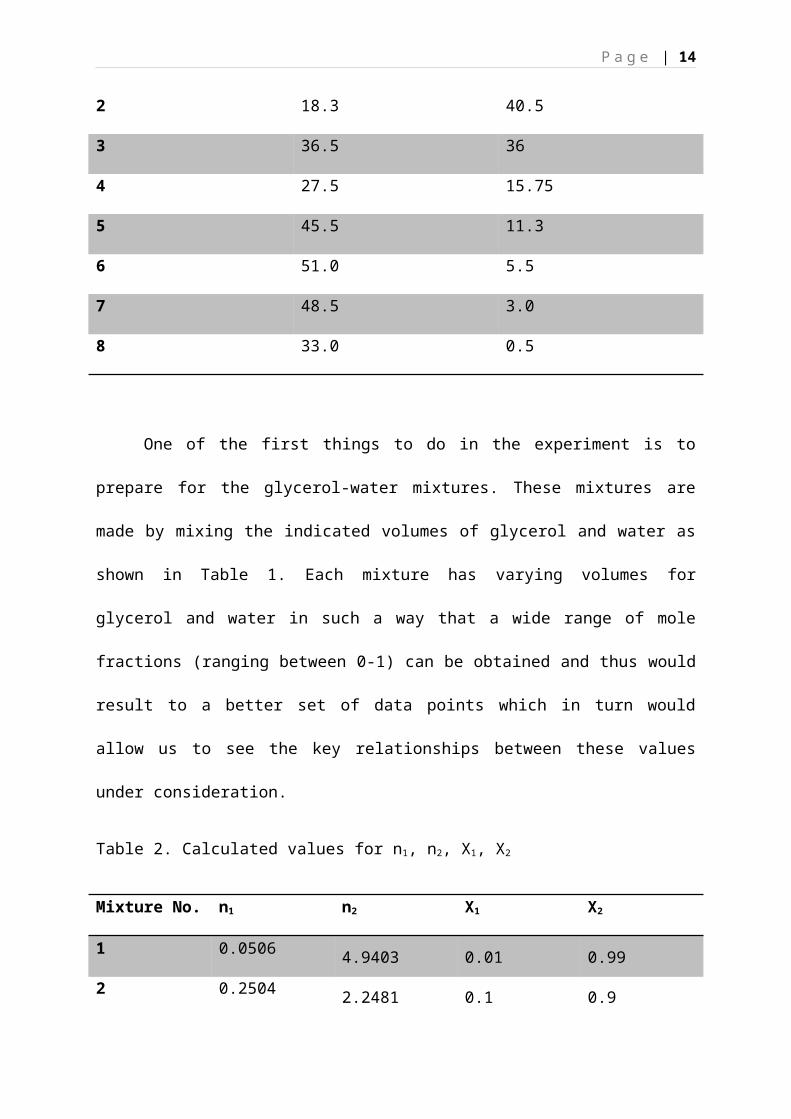
2 18.3 40.5
3 36.5 36
4 27.5 15.75
5 45.5 11.3
6 51.0 5.5
7 48.5 3.0
8 33.0 0.5
P a g e | 10
One of the first things to do in the experiment is to prepare for the glycerol-water
mixtures. These mixtures are made by mixing the indicated volumes of glycerol and water as
shown in Table 1. Each mixture has varying volumes for glycerol and water in such a way
that a wide range of mole fractions (ranging between 0-1) can be obtained and thus would
result to a better set of data points which in turn would allow us to see the key relationships
between these values under consideration.
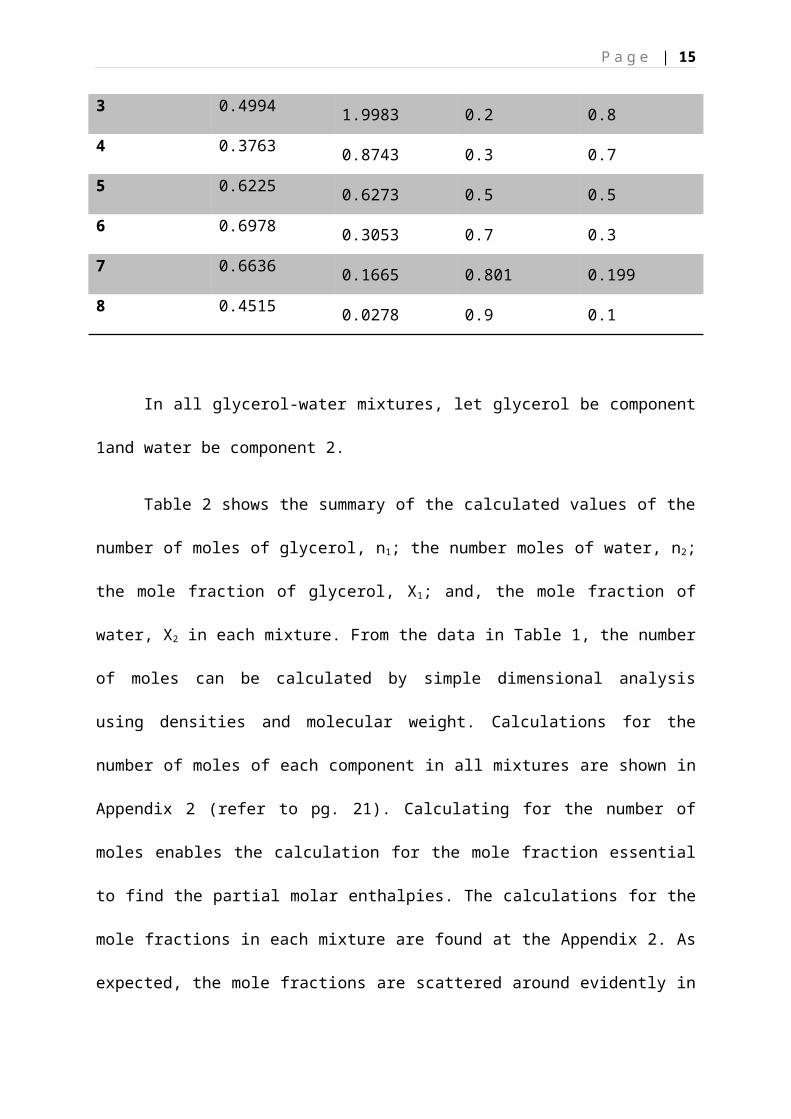
Table 2. Calculated values for n1, n2, X1, X2
Mixture No. n1 n2 X1 X2
1 0.0506 4.9403 0.01 0.99
2 0.2504 2.2481 0.1 0.9
3 0.4994 1.9983 0.2 0.8
4 0.3763 0.8743 0.3 0.7
5 0.6225 0.6273 0.5 0.5
6 0.6978 0.3053 0.7 0.3
7 0.6636 0.1665 0.801 0.199
8 0.4515 0.0278 0.9 0.1
In all glycerol-water mixtures, let glycerol be component 1and water be component 2.
Table 2 shows the summary of the calculated values of the number of moles of
glycerol, n1; the number moles of water, n2; the mole fraction of glycerol, X1; and, the mole
fraction of water, X2 in each mixture. From the data in Table 1, the number of moles can be
calculated by simple dimensional analysis using densities and molecular weight. Calculations
for the number of moles of each component in all mixtures are shown in Appendix 2 (refer to
pg. 21). Calculating for the number of moles enables the calculation for the mole fraction
P a g e | 11
essential to find the partial molar enthalpies. The calculations for the mole fractions in each
mixture are found at the Appendix 2. As expected, the mole fractions are scattered around
evidently in the 0-1 range assuring a good set of data points if done correctly, the
experimental methods that is.
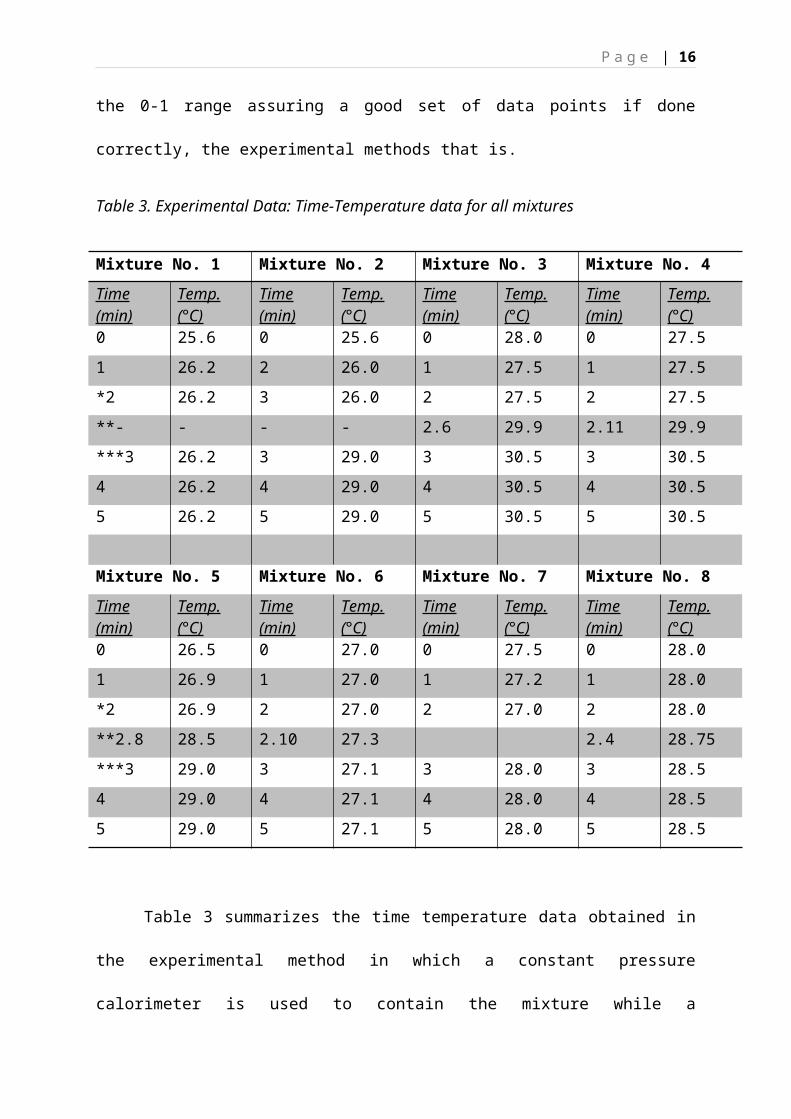
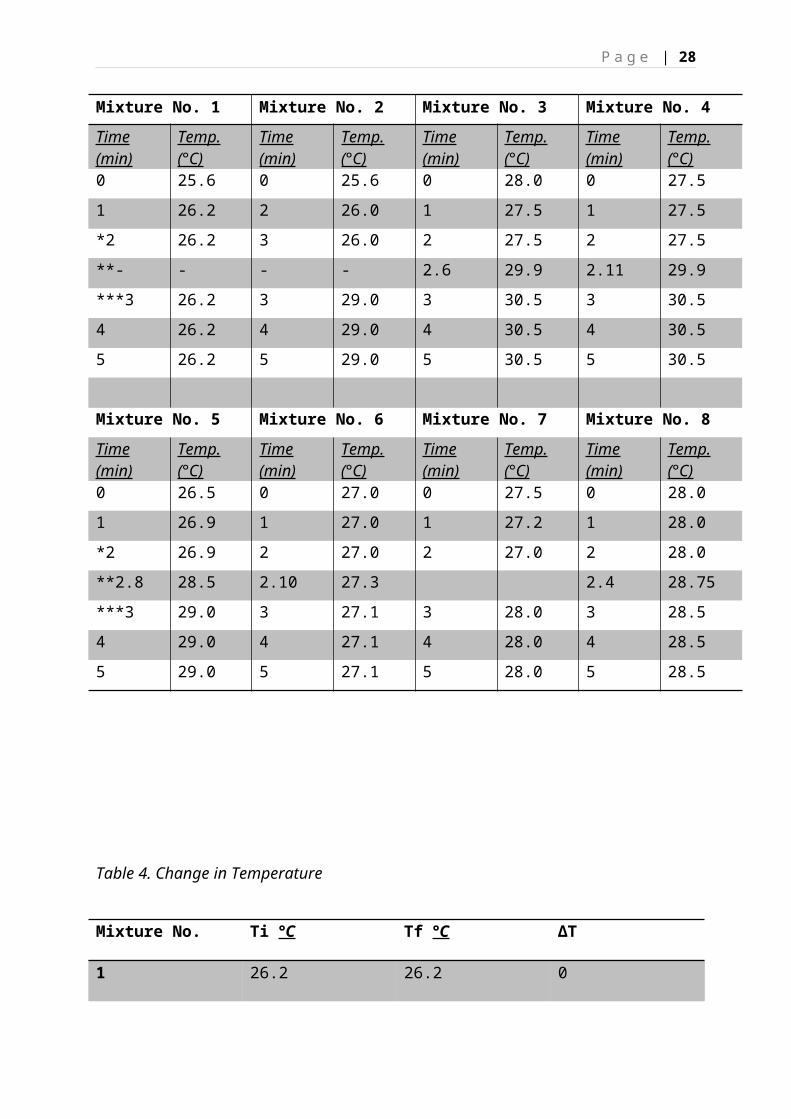
Table 3. Experimental Data: Time-Temperature data for all mixtures
Mixture No. 1 Mixture No. 2 Mixture No. 3 Mixture No. 4
Time (min)
Temp. (°C)
Time (min)
Temp. (°C)
Time (min)
Temp. (°C)
Time (min)
Temp. (°C)
0 25.6 0 25.6 0 28.0 0 27.5
1 26.2 2 26.0 1 27.5 1 27.5
*2 26.2 3 26.0 2 27.5 2 27.5
**- - - - 2.6 29.9 2.11 29.9
***3 26.2 3 29.0 3 30.5 3 30.5
4 26.2 4 29.0 4 30.5 4 30.5
5 26.2 5 29.0 5 30.5 5 30.5
Mixture No. 5 Mixture No. 6 Mixture No. 7 Mixture No. 8
Time (min)
Temp. (°C)
Time (min)
Temp. (°C)
Time (min)
Temp. (°C)
Time (min)
Temp. (°C)
0 26.5 0 27.0 0 27.5 0 28.0
1 26.9 1 27.0 1 27.2 1 28.0
*2 26.9 2 27.0 2 27.0 2 28.0
**2.8 28.5 2.10 27.3 2.4 28.75
***3 29.0 3 27.1 3 28.0 3 28.5
4 29.0 4 27.1 4 28.0 4 28.5
5 29.0 5 27.1 5 28.0 5 28.5
Table 3 summarizes the time temperature data obtained in the experimental method in
which a constant pressure calorimeter is used to contain the mixture while a simultaneous
P a g e | 12
process of swirling and taking down of temperature per minute in a three minute interval took
place. These data were acquired from the class. The row with one asterisk (*) denotes the
constant temperature of the glycerol prior to addition of water on that particular time. The
row with two asterisks (**) and three asterisks (***) denote the time and temperature
recorded on the instant of mixing and the constant temperature of the mixture, respectively.
These values are essential for the calculation of the change of T, ∆T.
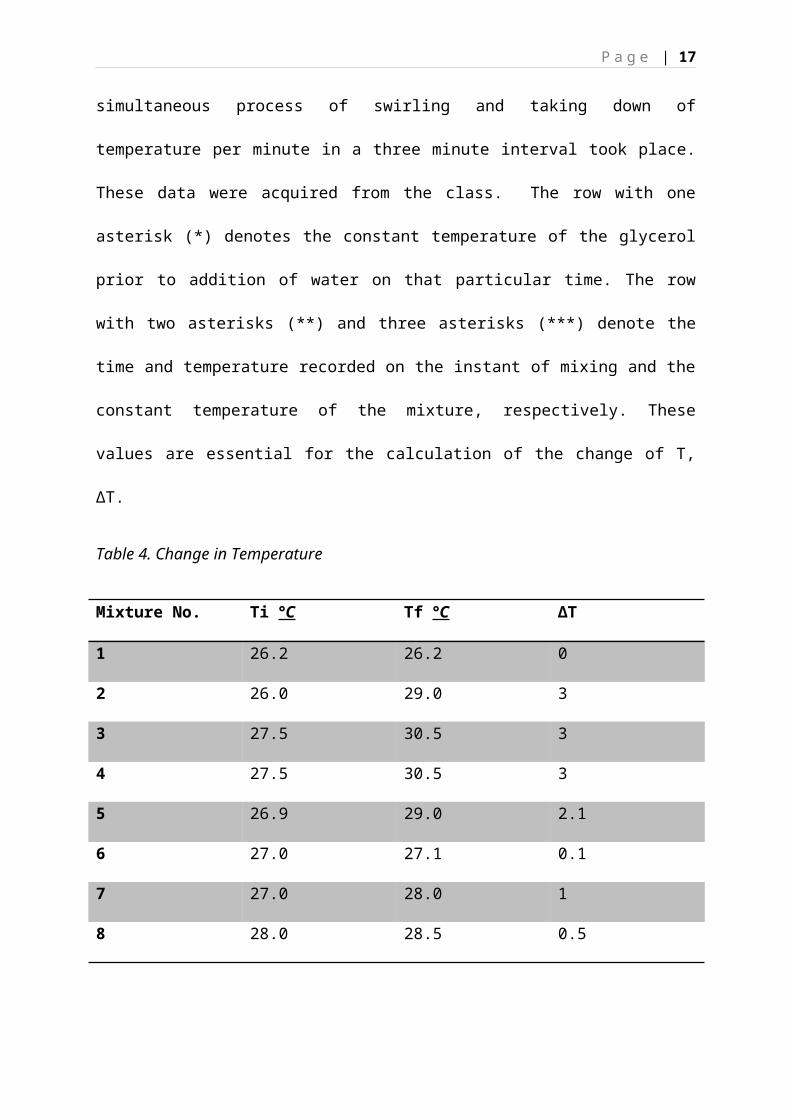
Table 4. Change in Temperature
Mixture No. Ti °C Tf °C ∆T
1 26.2 26.2 0
2 26.0 29.0 3
3 27.5 30.5 3
4 27.5 30.5 3
5 26.9 29.0 2.1
6 27.0 27.1 0.1
7 27.0 28.0 1
8 28.0 28.5 0.5
Table 4 shows the temperature change for each mixture. These temperatures and
obtained via experimental method and was tabulated in the previous graph. The temperatures
in rows with single asterisk (*) and double asterisk (**) are the initial temperature and final
temperature, respectively. The difference between these two values would yield to the
change in temperature. The change in temperature is needed to calculate the molar enthalpy
of mixing.
P a g e | 13
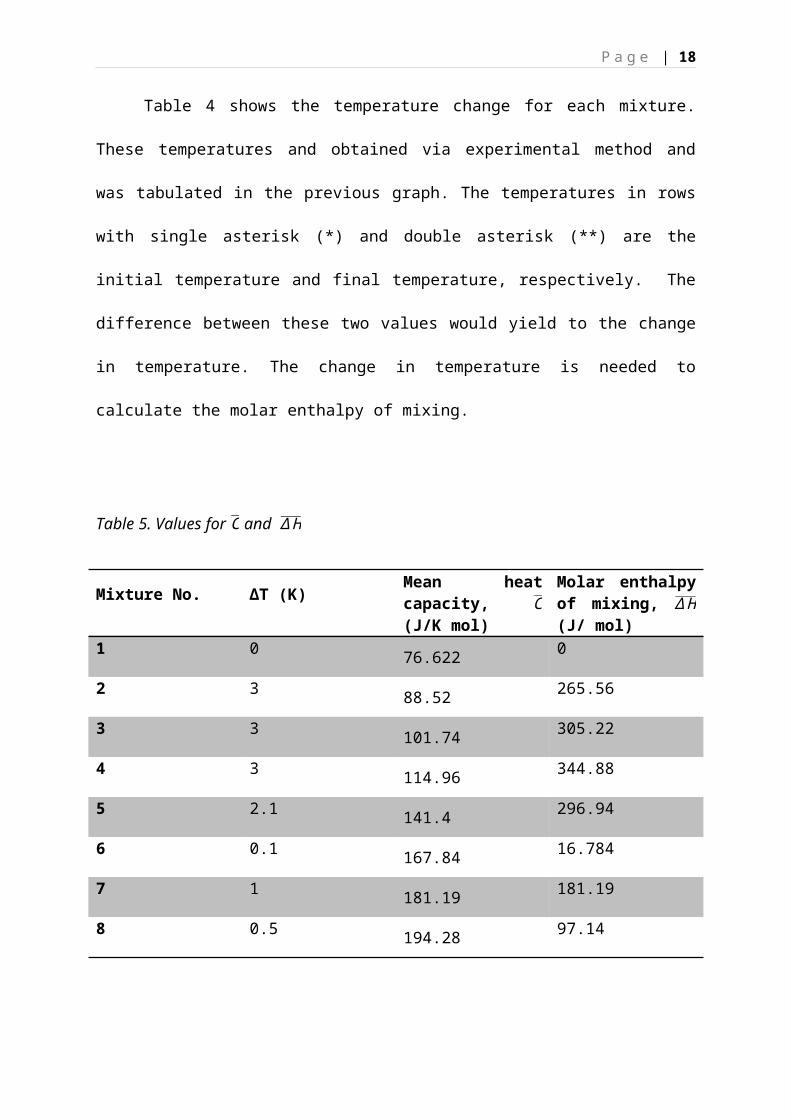
Table 5. Values for C and ∆ H
Mixture No. ∆T (K) Mean heat capacity, C (J/K mol)
Molar enthalpy of mixing, ∆ H (J/ mol)
1 0 76.622 0
2 3 88.52 265.56
3 3 101.74 305.22
4 3 114.96 344.88
5 2.1 141.4 296.94
6 0.1 167.84 16.784
7 1 181.19 181.19
8 0.5 194.28 97.14
The mean heat capacity, denoted byC , is calculated by the sum of the mole fraction of
each component multiplied by the corresponding heat capacities of the components. The heat
capacities of water and glycerol are 75.3 J/K mol and 207.5 J/K mol, respectively. Mean heat
capacities are calculated so as to calculate for the molar enthalpy of mixing which is just the
product of the change in temperature and the mean heat capacities. Values for the molar
change in enthalpy in each mixture are tabulated. As shown in table, the values for the molar
change of enthalpy increases from mixture 1 until it reached its maximum at mixture 4. After
it reached its peak, its value started to fluctuate. However, an outlier was observed in molar
change in enthalpy in mixture 6. From the value of 296.94 J/mol, it drastically decreased to
16.784 J/mol and spiked up again at value of 181.19 J/mol. This outlier is best omitted from
the data.
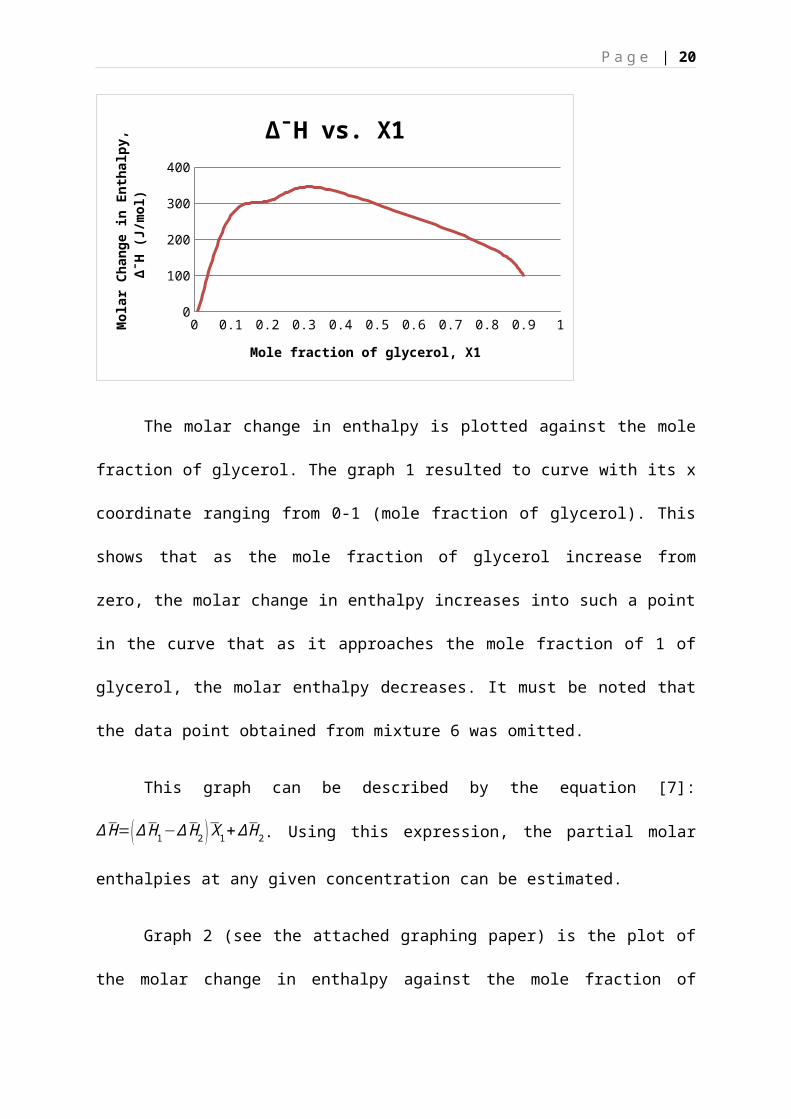
Graph 1. Plot of ∆ H against X1
P a g e | 14
0 0.1 0.2 0.3 0.4 0.5 0.6 0.7 0.8 0.9 10
50
100
150
200
250
300
350
400
∆‾H vs. X1
Mole fraction of glycerol, X1
Mol
ar C
hang
e in
Ent
halp
y, ∆
‾H (J
/mol
)
The molar change in enthalpy is plotted against the mole fraction of glycerol. The
graph 1 resulted to curve with its x coordinate ranging from 0-1 (mole fraction of glycerol).
This shows that as the mole fraction of glycerol increase from zero, the molar change in
enthalpy increases into such a point in the curve that as it approaches the mole fraction of 1 of
glycerol, the molar enthalpy decreases. It must be noted that the data point obtained from
mixture 6 was omitted.
This graph can be described by the equation [7]: ∆ H=(∆ H 1−∆ H 2 ) X1+∆ H 2. Using
this expression, the partial molar enthalpies at any given concentration can be estimated.
Graph 2 (see the attached graphing paper) is the plot of the molar change in enthalpy
against the mole fraction of glycerol made manually. To estimate the partial molar enthalpies,
a tangent line in a certain point in the curve must be drawn.
DISCUSSION
P a g e | 15
The experiment’s main focus is to determine the effect of the composition of each of
the component in the glycerol-water mixture on the molar enthalpy of mixing. Eight (8) sets
of glycerol-water mixture were prepared accordingly. The molar enthalpies of each mixture
were evaluated by simple calorimetric techniques. In order to get the change in molar
enthalpy of mixing, it must be first noted that partial molar properties or quantities vary with
parameters such as temperature, pressure and the composition of each of the component
present in the mixture. Thus to evaluate the molar enthalpy of mixing, pressure and
temperature must be kept constant. With the use of the coffee cup calorimeter which imposes
constant pressure, the molar enthalpies of mixing were obtained. Table 5 show the complete
values of the molar enthalpy of mixing in all mixtures.
The values of partial molar enthalpies for both water and glycerol were estimated
using the intercept method. In order to get the estimated values of the partial molar enthalpies
of each component, the plot of the enthalpy of mixing against the mole fraction of glycerol
was examined. It must be noted that partial molar enthalpies are dependent on the mole
fraction of a particular components, may it be glycerol or water. The graph of the molar
enthalpy of mixing against the mole fraction of a particular component yielded a curve, a
contradiction with equation [7] which suggests that is a straight line. This is because both the
partial molar enthalpies of glycerol and water are dependent on the mole fraction, as stated
previously. At a given concentration there is point in the curve that will give rise to a tangent
line. The slope of the tangent will give the value( ∆ H 1−∆ H 2 ). Therefore, the intercept of this
tangent line at X1= 0 will give the value of∆ H 2. The intercept on the other side of the tangent
line at X1= 1 will give the value∆ H 1.
Graphs 1 show the behaviour of the partial molar enthalpies of with varying
concentration. It was observed that the molar enthalpy of mixing at the X1=0 increases until
P a g e | 16
such a point in the curve where it fluctuates and starts to decrease as it approaches X 1=1.
X1=0 means that the mixture has no component of glycerol and therefore would mean that it
no contribution to the molar enthalpy of mixing. Similarly, as X1=0, the value of X1=1 which
means that the value of the molar enthalpy of mixing is due only to water component. As the
value of X1 increases, the molar enthalpy of mixing increases. This means that the glycerol
and water are mixed and both contribute to the molar enthalpy of mixing.
Graph 2 shows the same graph as graph 1 except it is done manually and a tangent
line identified at X1=0.55 in the curve. To estimate the partial molar enthalpies of glycerol
and water, the intercepts of the tangent line in both sides of the graph must be determined.
Using the graph, a rough estimation can be made. This estimation can induce personal errors.
These personal errors root on the judgement based analysis done. However, this will give us
the idea of how much of the concentration of each of the components in the mixture
contributes to the molar change in enthalpy of mixing. The estimated value for the partial
molar enthalpy of water is 460 J/mol and the estimated partial molar enthalpy of glycerol is
135 J/mol. These values suggest that water has a higher contribution to the molar change in
enthalpy of mixing at that specific concentration. This method in determining the values of
the partial molar enthalpies is known as the method of intercepts.
CONCLUSION
To estimate the partial molar enthalpies of glycerol and water in a mixture is the main
goal of this experiment. To do so, coffee cup calorimeter was used to get the molar enthalpy
of mixing. Series of calculation were done to achieve the goal of this experiment. These
calculations root from the concepts governing partial molar quantities. It is essential to know
that partial molar quantities, such as partial molar enthalpy, depend on the number of moles
of each component in a mixture. The molar change in enthalpy is not equal to the summation
P a g e | 17
of the change in enthalpy of each of the component at its pure form. The same principle
applies for other molar quantities. Thus, it is important to know the effect of each component
in a mixture to the change in enthalpy of mixing.
The plot of the molar change in enthalpy against the mole fraction of glycerol yields a
curve in which a tangent line at a certain point in the x-axis (concentration) will enable the
partial molar enthalpies to be estimated. The intercepts on each side of the graph of the
tangent line represents the partial molar enthalpies of each component in the mixture. This
can be estimated by graphing manually and identifying the tangent line at a certain point in
the graph and trace the tangent line until such time that it reaches its intercepts at both sides
of the graph.
CONTRIBUTION OF AUTHORS
The experiment was conducted by the two members of the group 5, Ms. Dagondon
and Ms. Arellano, together with group 1. All the members of the two groups participated and
were efficient in the experiment. The distribution of duties between the groups was properly
followed by each of the members.
This laboratory report was made solely by Ms. Dagondon. Ms. Arellano had her fair
share of laboratory report duties since it was her that made the laboratory report for the third
experiment and her only.
REFERENCES
Atkins, P. & De Paula, J. (2006). Atkins’Physical Chemistry, (8 th ed.). Great Britain: Oxford
Chang, R. (2007). Physical Chemistry for the Biosciences. United States: McGraw-Hill.
Levine, I. Physical Chemistry, 5th edition, McGraw Hill companies Inc., 1978 edition.
P a g e | 18
Physical Chemistry Laboratory Committee. Experiments in Physical Chemistry Part One. Institute of Chemistry, University of the Philippines, Diliman Quezon City, 1996 edition.
APPENDICES
APPENDIX 1. TABLE AND VALUES
Table 1. Indicated volume of glycerol and water in each mixture
Mixture No. Volume Glycerol (mL) Volume H20 (mL)
1 3.7 89
2 18.3 40.5
3 36.5 36
4 27.5 15.75
5 45.5 11.3
6 51.0 5.5
7 48.5 3.0
8 33.0 0.5
Table 2. Calculated values for n1, n2, X1, X2
Mixture No. n1 n2 X1 X2
1 0.0506 4.9403 0.01 0.99
2 0.2504 2.2481 0.1 0.9
3 0.4994 1.9983 0.2 0.8
4 0.3763 0.8743 0.3 0.7
5 0.6225 0.6273 0.5 0.5
6 0.6978 0.3053 0.7 0.3
7 0.6636 0.1665 0.801 0.199
P a g e | 19
8 0.4515 0.0278 0.9 0.1
Table 3. Experimental Data: Time-Temperature data for all mixtures
Mixture No. 1 Mixture No. 2 Mixture No. 3 Mixture No. 4
Time (min)
Temp. (°C)
Time (min)
Temp. (°C)
Time (min)
Temp. (°C)
Time (min)
Temp. (°C)
0 25.6 0 25.6 0 28.0 0 27.5
1 26.2 2 26.0 1 27.5 1 27.5
*2 26.2 3 26.0 2 27.5 2 27.5
**- - - - 2.6 29.9 2.11 29.9
***3 26.2 3 29.0 3 30.5 3 30.5
4 26.2 4 29.0 4 30.5 4 30.5
5 26.2 5 29.0 5 30.5 5 30.5
Mixture No. 5 Mixture No. 6 Mixture No. 7 Mixture No. 8
Time (min)
Temp. (°C)
Time (min)
Temp. (°C)
Time (min)
Temp. (°C)
Time (min)
Temp. (°C)
0 26.5 0 27.0 0 27.5 0 28.0
1 26.9 1 27.0 1 27.2 1 28.0
*2 26.9 2 27.0 2 27.0 2 28.0
**2.8 28.5 2.10 27.3 2.4 28.75
***3 29.0 3 27.1 3 28.0 3 28.5
4 29.0 4 27.1 4 28.0 4 28.5
5 29.0 5 27.1 5 28.0 5 28.5
Table 4. Change in Temperature
P a g e | 20
Mixture No. Ti °C Tf °C ∆T
1 26.2 26.2 0
2 26.0 29.0 3
3 27.5 30.5 3
4 27.5 30.5 3
5 26.9 29.0 2.1
6 27.0 27.1 0.1
7 27.0 28.0 1
8 28.0 28.5 0.5
Table 5. Values for C and ∆ H
Mixture No. ∆T (K) Mean heat capacity, C (J/K mol)
Molar enthalpy of mixing, ∆ H (J/ mol)
1 0 76.622 0
2 3 88.52 265.56
3 3 101.74 305.22
4 3 114.96 344.88
5 2.1 141.4 296.94
6 0.1 167.84 16.784
7 1 181.19 181.19
8 0.5 194.28 97.14
Graph 1. Plot of ∆ H against X1
P a g e | 21
0 0.1 0.2 0.3 0.4 0.5 0.6 0.7 0.8 0.9 10
50
100
150
200
250
300
350
400
∆‾H vs. X1
Mole fraction of glycerol, X1
Mol
ar C
hang
e in
Ent
halp
y, ∆
‾H (J
/mol
)
APPENDIX 2. CALCULATIONS
Number of moles of glycerol, n1
Formula: n1=(vol. glycerol mL)(density of glycerol g mL−1)(MW of glycerol g mol−1)
Where density of glycerol is 1.26 g ml-1
Mixture 1: n2=(3.7 mLGlycerol ) ( 1.26g mL−1 ) (92.09 gmol−1 )=0.0506 mol
Mixture 2: n2=(18.3 mLGlycerol ) (1.26 g mL−1 ) (92.09 g mol−1 )=0.2504 mol
Mixture 3: n2=(36.5 mlGlycerol ) (1.26 g mL−1 ) (92.09 g mol−1 )=0.4994 mol
Mixture 4: n2=(27.5 mLGlyc erol ) (1.26 g mL−1) ( 92.09 g mol−1 )=0.3793 mol
Mixture 5: n2=(45.5 mLGlycerol ) (1.26 gmL−1 ) (92.09 g mol−1 )=0.6225 mol
Mixture 6: n2=(51.0 mLGlycerol ) (1.26 g mL−1 ) (92.09 g mol−1 )=0.6978 mol
Mixture 7: n2=(48.5 mLGlycerol ) (1.26 gmL−1 ) (92.09 g mol−1 )=0.6636 mol
P a g e | 22
Mixture 8: n2=(33.0 mLGlycerol ) (1.26 g mL−1 ) (92.09 g mol−1)=0.4515 mol
Number of moles of water, n2
Formula:
n2=(vol. water mL)(density of water g mL−1)(MW of water g mol−1)
Where density of glycerol is 1.00 g ml-1
Mixture 1 :n2=(89.0 mL) (1.0 g mL−1) (18.015 gmol−1 )=4.9403 mol
Mixture 2: n2=(40.5 mL ) (1.0 g mL−1 ) (18.015 gmol−1 )=2.2481mol
Mixture 3: n2=(36.0 mL) (1.0 g mL−1 ) (18.015 gmol−1 )=1.9983 mol
Mixture 4: n2=(15.75 mL) (1.0 g mL−1 ) (18.015 g mol−1 )=0.8743 mol
Mixture 5: n2=(11.3mL ) (1.0 gmL−1 ) ( 18.015 g mol−1 )=0.6273 mol
Mixture 6: n2=(5.5 mL) (1.0 g mL−1 ) (18.015 g mol−1 )=0.3053 mol
Mixture 7: n2=(3.0 mL) (1.0 gmL−1 ) (18.015 g mol−1 )=0.1665 mol
Mixture 8: n2=(0.5 mL) (1.0 gmL−1) (18.015 g mol−1 )=0.0278 mol
Mole fraction of glycerol, X1
Formula: X1=n1
n1+n2
Mixture 1: X1=0.0506
0.0506+4.9403=0.01
P a g e | 23
Mixture 2: X1=0.2504
0.2504+2.2481=0.1
Mixture 3: X1=0.4994
0.4994+1.9983=0.2
Mixture 4: X1=0.3763
0.3763+0.8743=0.3
Mixture 5: X1=0.6225
0.6225+0.6273=0.5
Mixture 6: X1=0.6978
0.6978+0.3052=0.7
Mixture 7: X1=0.6639
0.6636+0.1665=0.8
Mixture 8: X1=0.4515
0.4515+0.0278=0.9
Mole fraction of water, X2
Formula: X2=n2
n1+n2
Mixture 1: X2=4.9403
0.0506+4.9403=0.99
Mixture 2: X2=0.2504
0.2504+2.2481=0.9
Mixture 3: X2=1.9983
0.4994+1.9983=0.8
Mixture 4: X2=0.8743
0.3763+0.8743=0.7
Mixture 5: X2=0.6273
0.6225+0.6273=0.5
P a g e | 24
Mixture 6: X2=0.3052
0.6978+0.3052=0.3
Mixture 7: X2=0.1665
0.6636+0.1665=0.2
Mixture 8: X2=0.0278
0.4515+0.0278=0.1
Change in Temperature
Formula: ∆ T=T final−T initial
Mixture 1: ∆ T=26.2℃−26.2℃=0℃
Mixture 2: ∆ T=29.0℃−26.0℃=3℃
Mixture 3: ∆ T=30.5℃−27.5℃=3℃
Mixture 4: ∆ T=30.5℃−27.5℃=3℃
Mixture 5: ∆ T=29.0℃−26.9℃=2.1℃
Mixture 6: ∆ T=27.0℃−27.1℃=0.1℃
Mixture 7: ∆ T=28.0℃−27.0℃=1℃
Mixture 8: ∆ T=28.5℃−28.0℃=0.5℃
Mean Heat capacity, C
Formula: C=X1 Cglycerol+ X2Cwater
Where Cglycerol=207.5J
K mol∧Cwater=75.3
JK mol
Mixture 1: C=(0.1 )(207.5J
K mol )+ (0.99 )(75.3J
K mol )=76.622J
K mol
P a g e | 25
Mixture 2: C=(0.1 )(207.5J
K mol )+ (0.9 )(75.3J
K mol )=88.52J
K mol
Mixture 3: C=(0.2 )(207.5J
K mol )+ (0.8 )(75.3J
K mol )=101.74J
K mol
Mixture 4: C=(0.3 )(207.5J
K mol )+(0.7 )(75.3J
K mol )=114.96J
K mol
Mixture 5: C=(0.5 )(207.5J
K mol )+(0.5 )(75.3J
K mol )=141.4J
K mol
Mixture 6: C=(0.7 )(207.5J
K mol )+(0.3 )(75.3J
K mol )=167.84J
K mol
Mixture 7: C=(0.801 )(207.5J
K mol )+ (0.199 )(75.3J
K mol )=181.19J
K mol
Mixture 8: C=(0.9 )(207.5J
K mol )+(0.1 )(75.3J
K mol )=194.28J
K mol
Molar enthalpy, ∆ H
Formula: ∆ H=C ∆ T
Mixture 1: ∆ H=(75.3J
K mol ) (0 K )=0J
mol
Mixture 2: ∆ H =(88.52J
K mol ) (3 K )=265.56J
mol
Mixture 3: ∆ H=(101.74J
K mol ) (3 K )=305.22J
mol
Mixture 4: ∆ H =(114.96J
K mol ) (3 K )=344.88J
mol
P a g e | 26
Mixture 5: ∆ H =(141.4J
K mol ) (2.1 K )=296.94J
mol
Mixture 6: ∆ H=(167.84J
K mol ) (0.1 K )=16.784J
mol
Mixture 7: ∆ H =(181.19J
K mol ) (1 K )=181.19J
mol
Mixture 8: ∆ H=(194.28J
K mol ) (0.5 K )=97.14J
mol
P a g e | 27
P a g e | 28