experiment hs-7: ventilation and oxygen saturation levels ... · this experiment is a continuation...
TRANSCRIPT
Copyright iWorx Systems Inc. Note: Only for evaluation by prospective customers.
iWor
x Sam
ple La
b
Experiment HS-7: Ventilation and Oxygen Saturation Levels, Part 2
This experiment is a continuation of Experiment HS-6: Ventilation and Oxygen Saturation Levels.
Exercise 1: Normal Breathing and Oxygen Saturation
Aim: To determine the effect of normal breathing on the oxygen saturation levels of the subject’s blood.
Procedure
1. Remind the subject to sit quietly before and during the recordings to prevent the creation of
motion artifacts, to sit erect, and to breathe normally.
2. Begin the recording when the subject’s breathing is regular and predictable.
3. Type <Subject’s Name> Normal Breathing in the Mark box to the right of the Mark button.
4. Click Record. Press the Enter key on the keyboard to mark the recording.
5. Click the AutoScale buttons for all five channels. Record for at least thirty seconds.
6. Click Stop to halt recording.
7. Select Save in the File menu.
Data Analysis
1. Position the data that was recorded while the subject was breathing normally in the Main
window (Figure HS-7-L2).
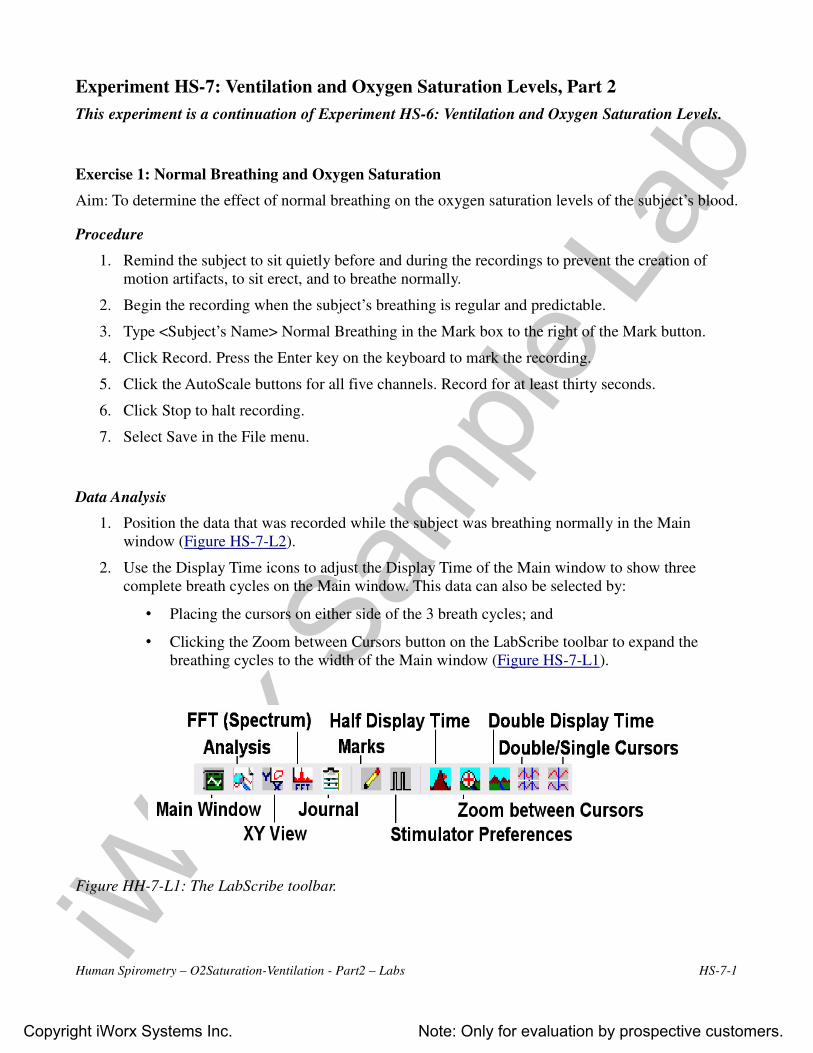
2. Use the Display Time icons to adjust the Display Time of the Main window to show three
complete breath cycles on the Main window. This data can also be selected by:
• Placing the cursors on either side of the 3 breath cycles; and
• Clicking the Zoom between Cursors button on the LabScribe toolbar to expand the
breathing cycles to the width of the Main window (Figure HS-7-L1).
Figure HH-7-L1: The LabScribe toolbar.
Human Spirometry – O2Saturation-Ventilation - Part2 – Labs HS-7-1
Copyright iWorx Systems Inc. Note: Only for evaluation by prospective customers.
iWor
x Sam
ple La
b
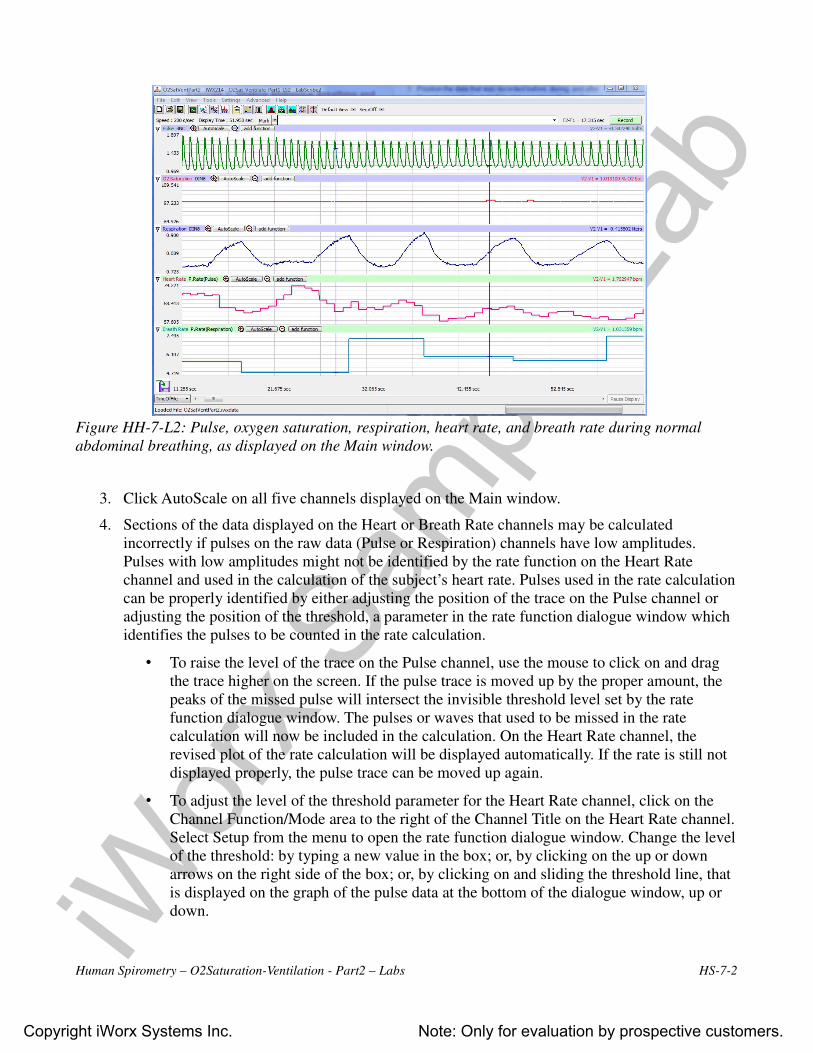
Figure HH-7-L2: Pulse, oxygen saturation, respiration, heart rate, and breath rate during normal
abdominal breathing, as displayed on the Main window.
3. Click AutoScale on all five channels displayed on the Main window.
4. Sections of the data displayed on the Heart or Breath Rate channels may be calculated
incorrectly if pulses on the raw data (Pulse or Respiration) channels have low amplitudes.
Pulses with low amplitudes might not be identified by the rate function on the Heart Rate
channel and used in the calculation of the subject’s heart rate. Pulses used in the rate calculation
can be properly identified by either adjusting the position of the trace on the Pulse channel or
adjusting the position of the threshold, a parameter in the rate function dialogue window which
identifies the pulses to be counted in the rate calculation.
• To raise the level of the trace on the Pulse channel, use the mouse to click on and drag
the trace higher on the screen. If the pulse trace is moved up by the proper amount, the
peaks of the missed pulse will intersect the invisible threshold level set by the rate
function dialogue window. The pulses or waves that used to be missed in the rate
calculation will now be included in the calculation. On the Heart Rate channel, the
revised plot of the rate calculation will be displayed automatically. If the rate is still not
displayed properly, the pulse trace can be moved up again.
• To adjust the level of the threshold parameter for the Heart Rate channel, click on the
Channel Function/Mode area to the right of the Channel Title on the Heart Rate channel.
Select Setup from the menu to open the rate function dialogue window. Change the level
of the threshold: by typing a new value in the box; or, by clicking on the up or down
arrows on the right side of the box; or, by clicking on and sliding the threshold line, that
is displayed on the graph of the pulse data at the bottom of the dialogue window, up or
down.
Human Spirometry – O2Saturation-Ventilation - Part2 – Labs HS-7-2
Copyright iWorx Systems Inc. Note: Only for evaluation by prospective customers.
iWor
x Sam
ple La
b
Note: Setting the proper threshold level also prevents small artifacts in the data from being counted as
pulse waves.
5. Repeat Step 4 for the Breath Rate channel by positioning the threshold on the Respiration
channel as necessary to capture the breath cycles.
6. Click on the Analysis window icon in the toolbar (Figure HS-7-L1) or select Analysis from the
Windows menu to transfer the data displayed in the Main window to the Analysis window
(Figure HS-7-L3).
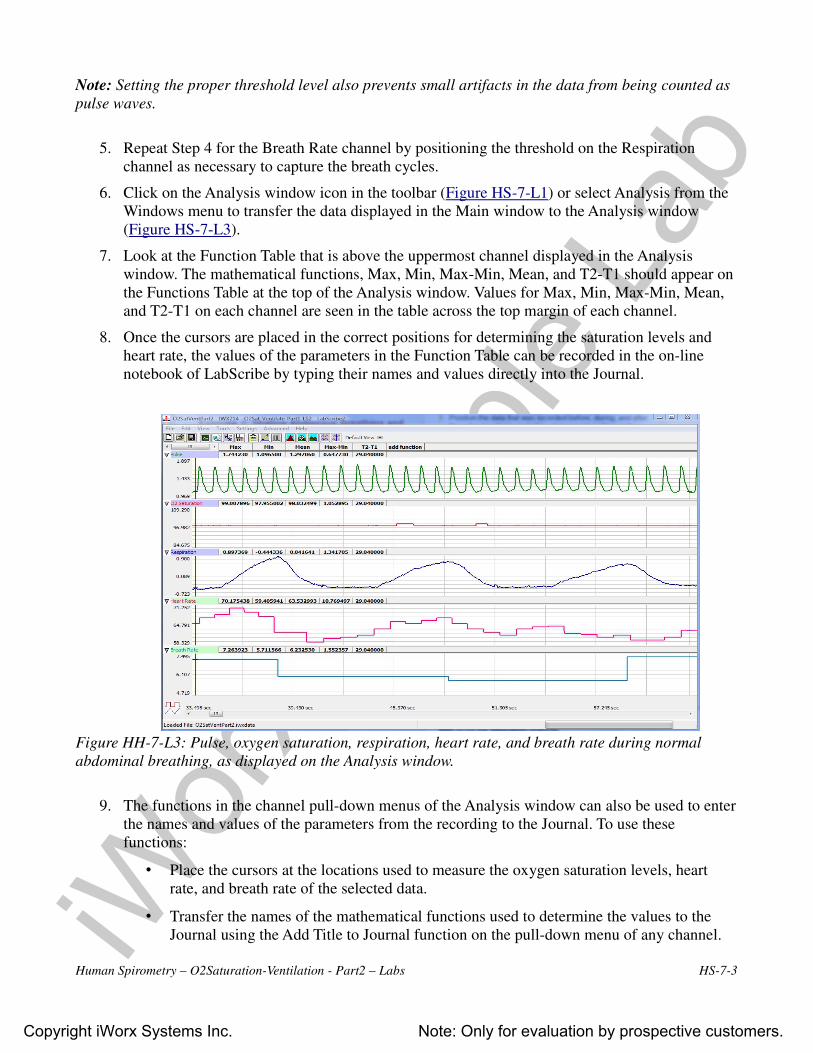
7. Look at the Function Table that is above the uppermost channel displayed in the Analysis
window. The mathematical functions, Max, Min, Max-Min, Mean, and T2-T1 should appear on
the Functions Table at the top of the Analysis window. Values for Max, Min, Max-Min, Mean,
and T2-T1 on each channel are seen in the table across the top margin of each channel.
8. Once the cursors are placed in the correct positions for determining the saturation levels and
heart rate, the values of the parameters in the Function Table can be recorded in the on-line
notebook of LabScribe by typing their names and values directly into the Journal.
Figure HH-7-L3: Pulse, oxygen saturation, respiration, heart rate, and breath rate during normal
abdominal breathing, as displayed on the Analysis window.
9. The functions in the channel pull-down menus of the Analysis window can also be used to enter
the names and values of the parameters from the recording to the Journal. To use these
functions:
• Place the cursors at the locations used to measure the oxygen saturation levels, heart
rate, and breath rate of the selected data.
• Transfer the names of the mathematical functions used to determine the values to the
Journal using the Add Title to Journal function on the pull-down menu of any channel.
Human Spirometry – O2Saturation-Ventilation - Part2 – Labs HS-7-3
Copyright iWorx Systems Inc. Note: Only for evaluation by prospective customers.
iWor
x Sam
ple La
b
10. On the Respiration channel, use the mouse to place a cursor at the beginning of the inhalation of
the first breath being measured. Place the second cursor at the end of the exhalation of the third
breath. Measure the following levels and rates.
• Maximum Oxygen Saturation Level, which is the value for Max on the O2 Saturation
channel.
• Minimum Oxygen Saturation Level, which is the value for Min on the O2 Saturation
channel.
• Mean Oxygen Saturation Level, which is the value for Mean on the O2 Saturation
channel.
• Change (∆) in Oxygen Saturation Level, which is the value for Max-Min on the O2
Saturation channel.
• Maximum Heart Rate, which is the value for Max on the Heart Rate channel.
• Minimum Heart Rate, which is the value for Min on the Heart Rate channel.
• Mean Heart Rate, which is the value for Mean on the Heart Rate channel.
• Change (∆) in Heart Rate, which is the value for Max-Min on the Heart Rate channel.
• Mean Breath Rate, which is the value for Mean on the Breath Rate channel.
11. Record the value in the Journal using the one of the techniques described in Steps 8 or 9, and
on Table HS-7-L1.
12. Click Save to save the file.
Exercise 2: Shallow Abdominal Breathing and Oxygen Saturation
Aim: To determine the effect of shallow abdominal breaths on the oxygen saturation levels of the
subject’s blood.
Procedure
1. The subject should sit quietly and breathe normally before the recording begins. Also, remind
the subject to sit erect and quietly during the recordings, and to breathe normally at the
beginning of the exercise.
2. In this exercise, the subject breathes normally until a regular breathing pattern is established.
Then, the subject takes shallow breaths at the rate of 30 to 40 breaths per minute, using the
diaphragm as the primary force for moving air in and out of the lungs. The subject should take
shallow breaths for 30 to 60 seconds. Finally, the subject returns to breathing normally.
3. Type Normal Breathing in the Mark box to the right of the Mark button.
4. Click Record. Press the Enter key on the keyboard to mark the recording.
5. Click the AutoScale buttons for all five channels. Record until the subject’s breathing is regular
and predictable.
6. Type Shallow Abdominal in the Mark box. Press the Enter key on the keyboard as you instruct
Human Spirometry – O2Saturation-Ventilation - Part2 – Labs HS-7-4
Copyright iWorx Systems Inc. Note: Only for evaluation by prospective customers.
iWor
x Sam
ple La
b
the subject to start shallow abdominal breathing.
7. Type Return to Normal in the Mark box. Press the Enter key on the key board as the subject
exhales and returns to breathing normally. Continue to record until the subject’s oxygen
saturation level is normal.
8. Click Stop to halt the recording.
9. Click Save to save the file.
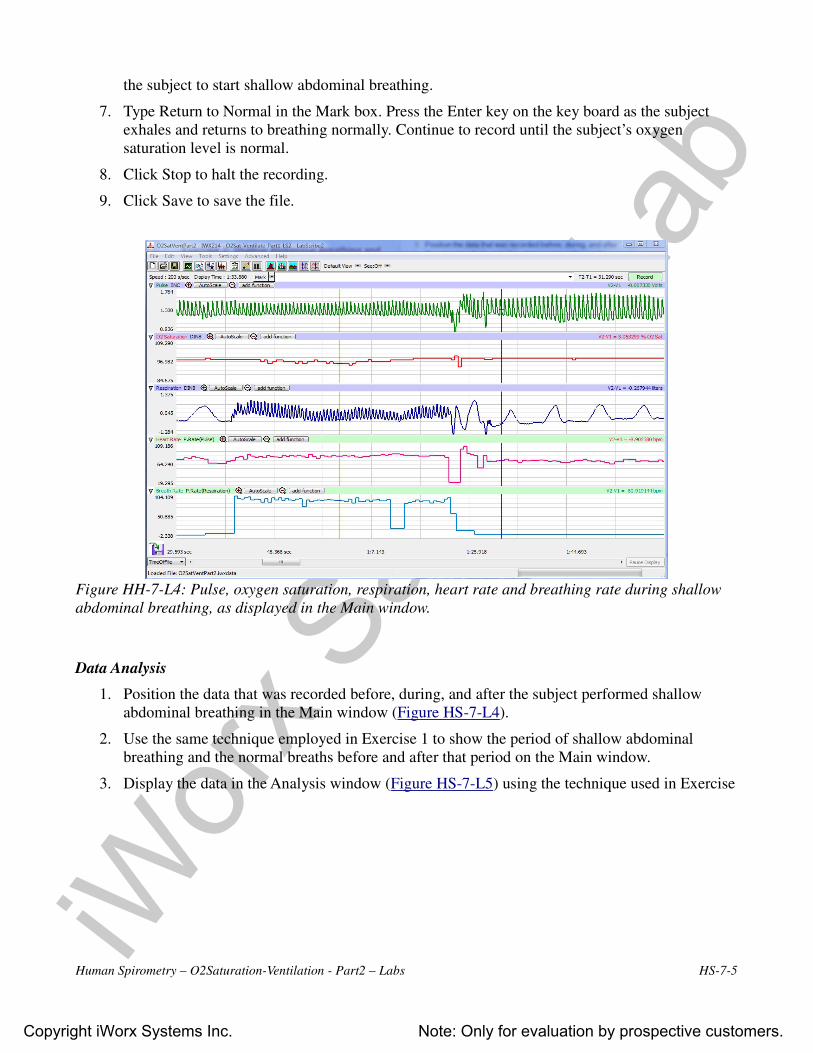
Figure HH-7-L4: Pulse, oxygen saturation, respiration, heart rate and breathing rate during shallow
abdominal breathing, as displayed in the Main window.
Data Analysis
1. Position the data that was recorded before, during, and after the subject performed shallow
abdominal breathing in the Main window (Figure HS-7-L4).
2. Use the same technique employed in Exercise 1 to show the period of shallow abdominal
breathing and the normal breaths before and after that period on the Main window.
3. Display the data in the Analysis window (Figure HS-7-L5) using the technique used in Exercise
Human Spirometry – O2Saturation-Ventilation - Part2 – Labs HS-7-5
Copyright iWorx Systems Inc. Note: Only for evaluation by prospective customers.
iWor
x Sam
ple La
b
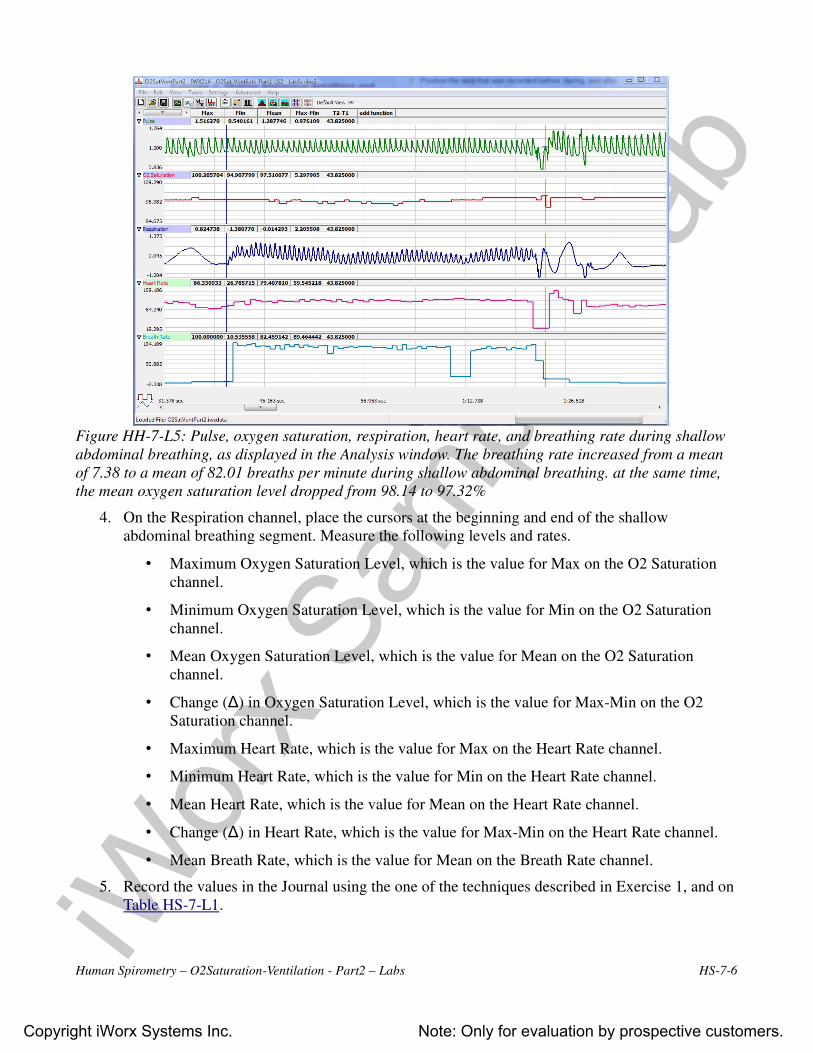
Figure HH-7-L5: Pulse, oxygen saturation, respiration, heart rate, and breathing rate during shallow
abdominal breathing, as displayed in the Analysis window. The breathing rate increased from a mean
of 7.38 to a mean of 82.01 breaths per minute during shallow abdominal breathing. at the same time,
the mean oxygen saturation level dropped from 98.14 to 97.32%
4. On the Respiration channel, place the cursors at the beginning and end of the shallow
abdominal breathing segment. Measure the following levels and rates.
• Maximum Oxygen Saturation Level, which is the value for Max on the O2 Saturation
channel.
• Minimum Oxygen Saturation Level, which is the value for Min on the O2 Saturation
channel.
• Mean Oxygen Saturation Level, which is the value for Mean on the O2 Saturation
channel.
• Change (∆) in Oxygen Saturation Level, which is the value for Max-Min on the O2
Saturation channel.
• Maximum Heart Rate, which is the value for Max on the Heart Rate channel.
• Minimum Heart Rate, which is the value for Min on the Heart Rate channel.
• Mean Heart Rate, which is the value for Mean on the Heart Rate channel.
• Change (∆) in Heart Rate, which is the value for Max-Min on the Heart Rate channel.
• Mean Breath Rate, which is the value for Mean on the Breath Rate channel.
5. Record the values in the Journal using the one of the techniques described in Exercise 1, and on
Table HS-7-L1.
Human Spirometry – O2Saturation-Ventilation - Part2 – Labs HS-7-6
Copyright iWorx Systems Inc. Note: Only for evaluation by prospective customers.
iWor
x Sam
ple La
b
6. Move the first cursor from the beginning of the shallow abdominal breathing period to the point
in the recovery period where the oxygen saturation level returned to normal.
7. Repeat Steps 5 and 6 for the data collected during the recovery period.
8. Measure the following parameters and record their values in the Journal:
• Response Time to Shallow Abdominal Breathing. Place one cursor at the beginning of
shallow abdominal breathing, and the second cursor at the first change in the oxygen
saturation level during shallow abdominal breathing. The value for the T2-T1 function is
this response time. Record the values in the Journal.
• Response Time to Decrease in Oxygen Saturation Level. Place one cursor at the
beginning of shallow abdominal breathing, and the second cursor at the lowest oxygen
saturation level. The value for the T2-T1 function is this response time. Record the
values in the Journal.
• Recovery Time to Normal Oxygen Saturation Level. Place one cursor at the end of
shallow abdominal breathing, and the second cursor at the return of the oxygen
saturation level to normal. The value for the T2-T1 function is this response time.
Record the values in the Journal.
9. Click Save to save the file.
Questions
1. How does the oxygen saturation level at the end of shallow abdominal breathing compare to the
oxygen saturation level during normal breathing?
2. How do the response time to shallow abdominal breathing, response time to the lowest oxygen
saturation levels, and recovery time to normal oxygen saturation level compare?
3. How does the heart rate during normal breathing compare to the heart rate at the end of shallow
abdominal breathing?
4. Ask the subject to describe how he or she felt while performing shallow abdominal breathing?
Dizzy, faint, flush?
Exercise 3: Bellows Breathing and Oxygen Saturation
Aim: To determine the effect of very rapid breathing, often referred as the Bellows Breathing
Technique, on the oxygen saturation levels of the subject’s blood.
Procedure
1. The subject should sit quietly and breathe normally before the recording begins. Also, remind
the subject to sit erect and quietly during the recordings, and to breathe normally at the
beginning of the exercise.
2. In this exercise, the subject breathes normally until a regular breathing pattern is established.
Then, the subject breathes as rapidly as possible for as long as possible, moving air in and out
through the nose while the mouth is gently closed. Bellows breathing can be as rapid as 2 to 3
Human Spirometry – O2Saturation-Ventilation - Part2 – Labs HS-7-7
Copyright iWorx Systems Inc. Note: Only for evaluation by prospective customers.
iWor
x Sam
ple La
b
breaths per second and can lead to dizziness. Finally, the subject returns to breathing normally.
3. Type Normal Breathing in the Mark box to the right of the Mark button.
4. Click Record. Press the Enter key on the keyboard. Click the AutoScale buttons for all five
channels. Record until the subject’s breathing is regular and predictable.
5. Type Bellows Breathing in the Mark box. Press the Enter key on the keyboard as you instruct
the subject to start bellows breathing.
6. Type Recovery from Bellows in the Mark box. Press the Enter key on the key board as the
subject exhales and returns to breathing normally. Continue to record until the subject’s oxygen
saturation level is normal. Click Stop to halt the recording.
7. Click Save to save the file.
Data Analysis
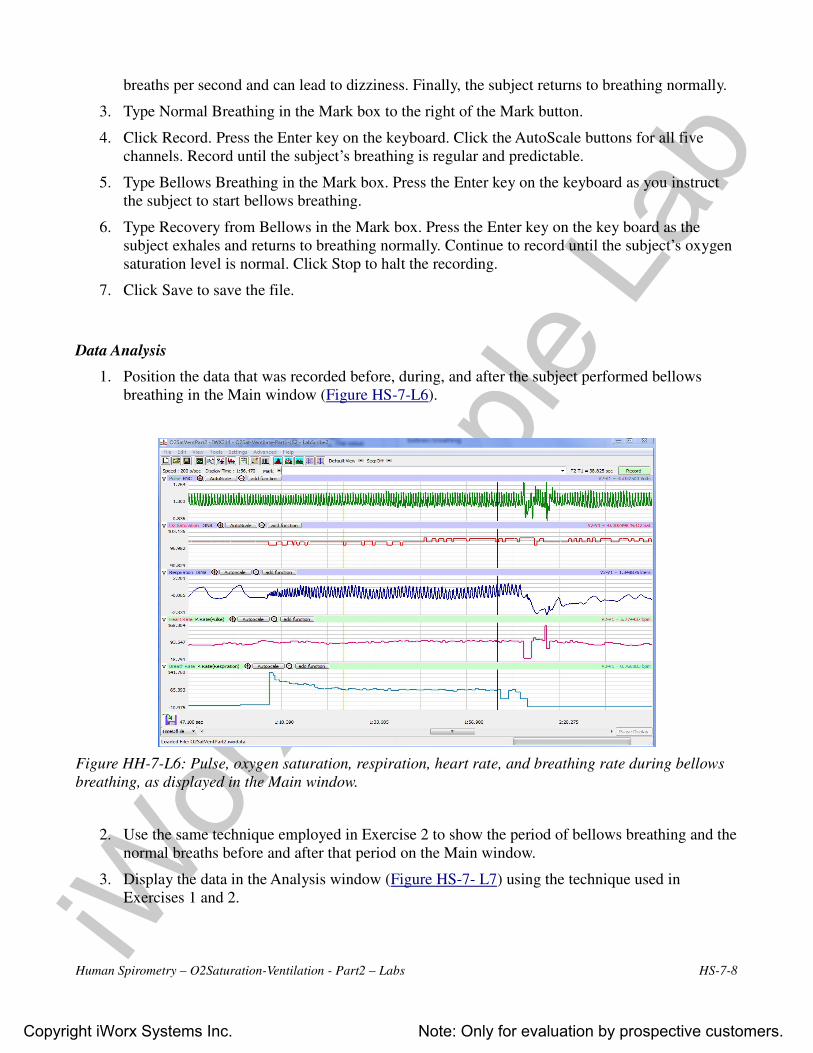
1. Position the data that was recorded before, during, and after the subject performed bellows
breathing in the Main window (Figure HS-7-L6).
Figure HH-7-L6: Pulse, oxygen saturation, respiration, heart rate, and breathing rate during bellows
breathing, as displayed in the Main window.
2. Use the same technique employed in Exercise 2 to show the period of bellows breathing and the
normal breaths before and after that period on the Main window.
3. Display the data in the Analysis window (Figure HS-7- L7) using the technique used in
Exercises 1 and 2.
Human Spirometry – O2Saturation-Ventilation - Part2 – Labs HS-7-8
Copyright iWorx Systems Inc. Note: Only for evaluation by prospective customers.
iWor
x Sam
ple La
b
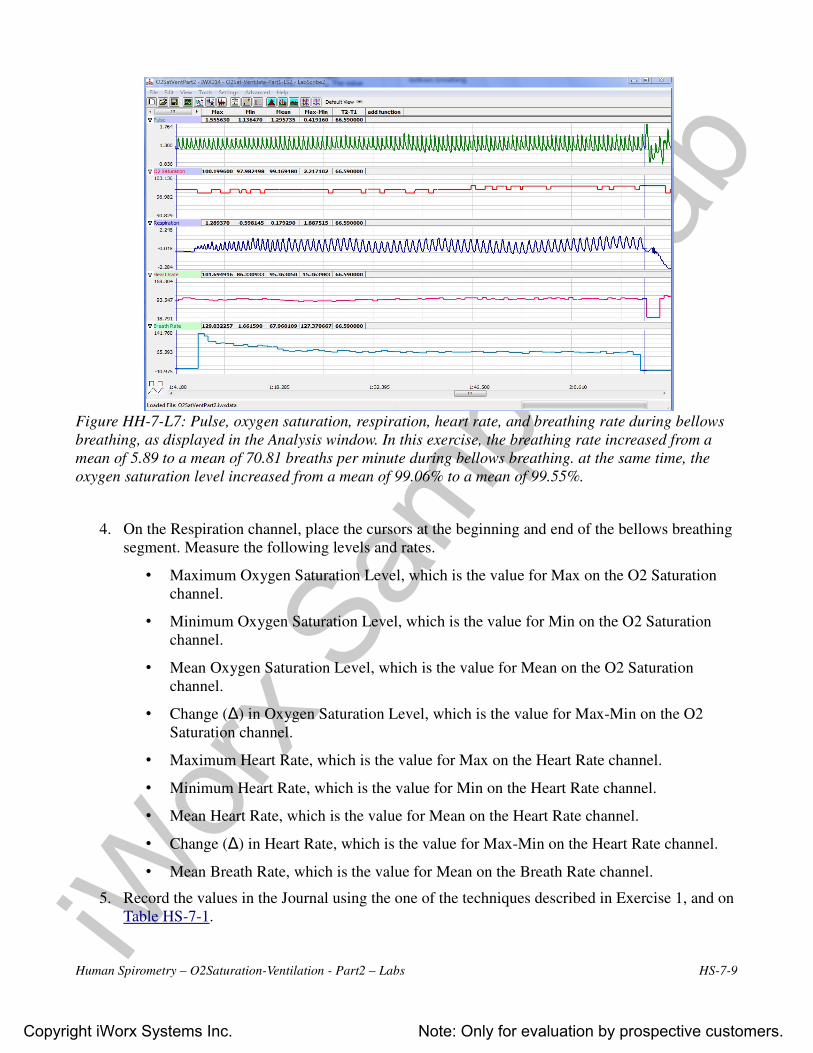
Figure HH-7-L7: Pulse, oxygen saturation, respiration, heart rate, and breathing rate during bellows
breathing, as displayed in the Analysis window. In this exercise, the breathing rate increased from a
mean of 5.89 to a mean of 70.81 breaths per minute during bellows breathing. at the same time, the
oxygen saturation level increased from a mean of 99.06% to a mean of 99.55%.
4. On the Respiration channel, place the cursors at the beginning and end of the bellows breathing
segment. Measure the following levels and rates.
• Maximum Oxygen Saturation Level, which is the value for Max on the O2 Saturation
channel.
• Minimum Oxygen Saturation Level, which is the value for Min on the O2 Saturation
channel.
• Mean Oxygen Saturation Level, which is the value for Mean on the O2 Saturation
channel.
• Change (∆) in Oxygen Saturation Level, which is the value for Max-Min on the O2
Saturation channel.
• Maximum Heart Rate, which is the value for Max on the Heart Rate channel.
• Minimum Heart Rate, which is the value for Min on the Heart Rate channel.
• Mean Heart Rate, which is the value for Mean on the Heart Rate channel.
• Change (∆) in Heart Rate, which is the value for Max-Min on the Heart Rate channel.
• Mean Breath Rate, which is the value for Mean on the Breath Rate channel.
5. Record the values in the Journal using the one of the techniques described in Exercise 1, and on
Table HS-7-1.
Human Spirometry – O2Saturation-Ventilation - Part2 – Labs HS-7-9
Copyright iWorx Systems Inc. Note: Only for evaluation by prospective customers.
iWor
x Sam
ple La
b
6. Move the first cursor from the beginning of the bellows breathing period to the point in the
recovery period where the oxygen saturation level returned to normal.
7. Repeat Steps 4 and 5 for the data collected during the recovery period.
8. Measure the following parameters and record their values in the Journal:
• Response Time to Bellows Breathing. Place one cursor at the beginning of bellows
breathing, and the second cursor at the first change in the oxygen saturation level during
bellows breathing. The value for the T2-T1 function is this response time. Record the
values in the Journal.
• Response Time to Decrease in Oxygen Saturation Level. Place one cursor at the
beginning of bellows breathing, and the second cursor at the lowest oxygen saturation
level. The value for the T2-T1 function is this response time. Record the values in the
Journal.
• Recovery Time to Normal Oxygen Saturation Level. Place one cursor at the end of
bellows breathing, and the second cursor at the return of the oxygen saturation level to
normal. The value for the T2-T1 function is this response time. Record the values in the
Journal.
9. Click Save to save the file.
Questions
1. How does the oxygen saturation level at the end of bellows breathing compare to the oxygen
saturation level during normal breathing?
2. How do the response time to bellow breathing, response time to the lowest oxygen saturation
levels, and recovery time to normal oxygen saturation level compare?
3. How does the heart rate during normal breathing compare to the heart rate at the end of bellows
breathing?
4. Ask the subject to describe how he or she felt while performing bellows breathing?
Exercise 4: Deep Abdominal Breathing and Oxygen Saturation
Aim: To determine the effect of deep abdominal breathing on the oxygen saturation levels of the
subject’s blood.
Procedure
1. The subject should sit quietly and breathe normally before the recording begins. Also, remind
the subject to sit erect and quietly during the recordings, and to breathe normally at the
beginning of the exercise.
2. In this exercise, the subject breathes normally until a regular breathing pattern is established.
Then, the subject breathes slowly and deeply, inhaling through the nose and exhaling through
the mouth for 1 minute. Finally, the subject returns to breathing normally.
Human Spirometry – O2Saturation-Ventilation - Part2 – Labs HS-7-10
Copyright iWorx Systems Inc. Note: Only for evaluation by prospective customers.
iWor
x Sam
ple La
b
3. Type Normal Breathing in the Mark box to the right of the Mark button.
4. Click Record. Press the Enter key on the keyboard.
5. Click the AutoScale buttons for all five channels. Record until the subject’s breathing is regular
and predictable.
6. Type Deep Abdominal Breathing in the Mark box. Press the Enter key on the keyboard as you
instruct the subject to start deep abdominal breathing for one minute.
7. Type Recovery from Deep AB in the Mark box. Press the Enter key on the key board as the
subject exhales and returns to breathing normally. Continue to record until the subject’s oxygen
saturation level is normal. Click Stop to halt the recording.
8. Click Save to save the file.
Data Analysis
1. Position the data that was recorded before, during, and after the subject performed deep
abdominal breathing in the Main window (Figure HS-7- L8).
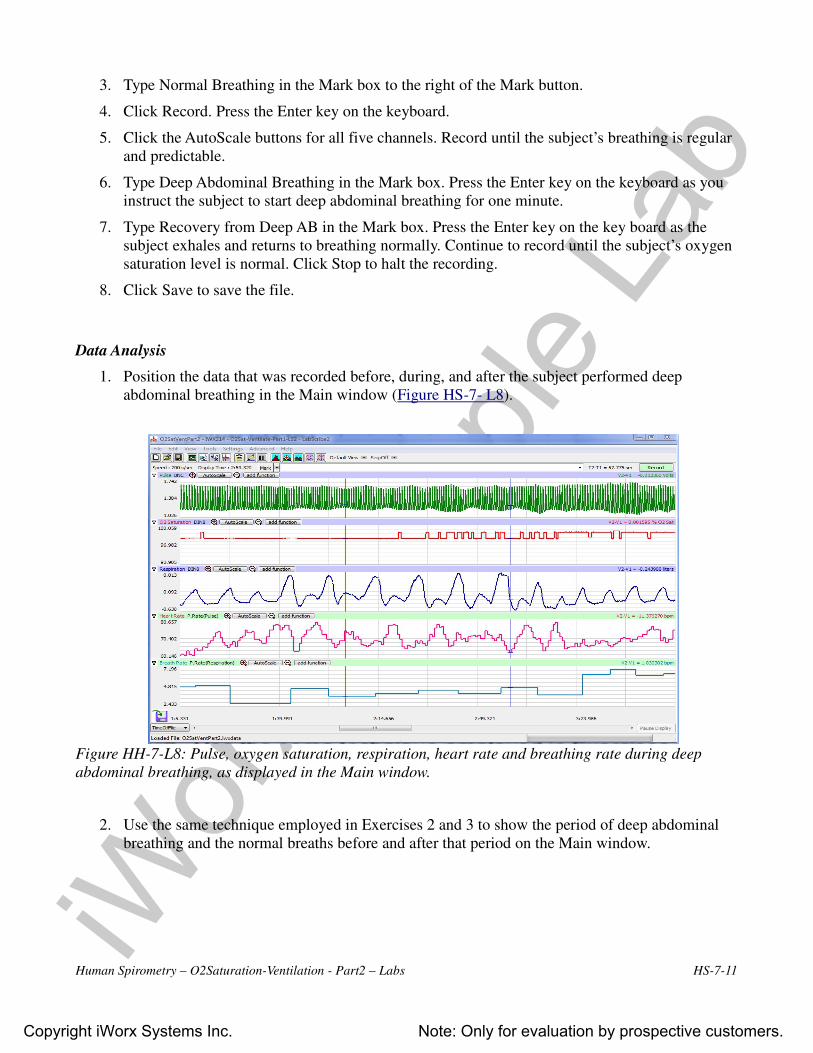
Figure HH-7-L8: Pulse, oxygen saturation, respiration, heart rate and breathing rate during deep
abdominal breathing, as displayed in the Main window.
2. Use the same technique employed in Exercises 2 and 3 to show the period of deep abdominal
breathing and the normal breaths before and after that period on the Main window.
Human Spirometry – O2Saturation-Ventilation - Part2 – Labs HS-7-11

Copyright iWorx Systems Inc. Note: Only for evaluation by prospective customers.
iWor
x Sam
ple La
b
Figure HH-7-L9: Pulse, oxygen saturation, respiration, heart rate, and breathing rate during deep
abdominal breathing, as displayed in the Analysis window. In this exercise, the breathing rate
decreased from 5.1 to 4.1 breaths per minute during deep abdominal breathing. at the same time, the
oxygen saturation level increased from a mean of 98.01% to a mean of 98.50% before the end of the
deep abdominal breathing segment.
3. Display the data in the Analysis window (Figure HS-7-L9) using the technique used in
Exercises 1, 2, and 3.
4. On the Respiration channel, place the cursors at the beginning and end of the deep abdominal
breathing segment. Measure the following levels and rates.
• Maximum Oxygen Saturation Level, which is the value for Max on the O2 Saturation
channel.
• Minimum Oxygen Saturation Level, which is the value for Min on the O2 Saturation
channel.
• Mean Oxygen Saturation Level, which is the value for Mean on the O2 Saturation
channel.
• Change (∆) in Oxygen Saturation Level, which is the value for Max-Min on the O2
Saturation channel.
• Maximum Heart Rate, which is the value for Max on the Heart Rate channel.
• Minimum Heart Rate, which is the value for Min on the Heart Rate channel.
• Mean Heart Rate, which is the value for Mean on the Heart Rate channel.
• Change (∆) in Heart Rate, which is the value for Max-Min on the Heart Rate channel.
• Mean Breath Rate, which is the value for Mean on the Breath Rate channel.
Human Spirometry – O2Saturation-Ventilation - Part2 – Labs HS-7-12
Copyright iWorx Systems Inc. Note: Only for evaluation by prospective customers.
iWor
x Sam
ple La
b
5. Record the values in the Journal using the one of the techniques described in Exercise 1, and on
Table HS-7-L1.
6. Move the first cursor from the beginning of the deep abdominal breathing period to the point in
the recovery period where the oxygen saturation level returned to normal.
7. Repeat Steps 4 and 5 for the data collected during the recovery period.
8. Measure the following parameters and record their values in the Journal:
• Response Time to deep abdominal Breathing. Place one cursor at the beginning of deep
abdominal breathing, and the second cursor at the first change in the oxygen saturation
level during deep abdominal breathing. The value for the T2-T1 function is this response
time. Record the values in the Journal.
• Response Time to Decrease in Oxygen Saturation Level. Place one cursor at the
beginning of deep abdominal breathing, and the second cursor at the lowest oxygen
saturation level. The value for the T2-T1 function is this response time. Record the
values in the Journal.
• Recovery Time to Normal Oxygen Saturation Level. Place one cursor at the end of deep
abdominal breathing, and the second cursor at the return of the oxygen saturation level
to normal. The value for the T2-T1 function is this response time. Record the values in
the Journal.
9. Click Save to save the file.
Questions
1. How does the oxygen saturation level at the end of deep abdominal breathing compare to the
oxygen saturation level during normal breathing?
2. How do the response time to deep abdominal breathing, response time to the lowest oxygen
saturation levels, and recovery time to normal oxygen saturation level compare?
3. How does the heart rate during normal breathing compare to the heart rate at the end of deep
abdominal breathing?
4. Ask the subject to describe how he or she felt while performing deep abdominal breathing?
5. How do the oxygen saturation levels during the four breathing techniques studied in this
experiment compare?
Human Spirometry – O2Saturation-Ventilation - Part2 – Labs HS-7-13

Copyright iWorx Systems Inc. Note: Only for evaluation by prospective customers.
iWor
x Sam
ple La
b
Table HS-7-L1: Oxygen Saturation Levels, Heart Rates, and Breathing Rates during Various
Breathing Techniques and Recovery Periods.
Breathing Pattern
% O2 Saturation Heart Rate (BPM)Breath Rate
(bpm)
Max Min Mean ∆ Max Min Mean ∆ Mean
Normal
Shallow Abdominal
Recovery - Shallow
Abdominal
Bellows Breathing
Recovery - Bellows
Breathing
Deep Abdominal
Recovery - Deep
Abdominal
Human Spirometry – O2Saturation-Ventilation - Part2 – Labs HS-7-14