experimental analysis of noise reduction properties
TRANSCRIPT
EXPERIMENTAL ANALYSIS OF NOISE REDUCTION
PROPERTIES OF SOUND ABSORBING FOAM
by
Scotty John Wertel
A Research Paper
Submitted in Partial Fulfillment of the Requirements for the
Master of Science Degree With a Major in
Risk Control
Approved: 3 Semester Credits
_______________________ Investigation Advisor
The Graduate College University of Wisconsin-Stout
May, 2000
i
The Graduate College University of Wisconsin – Stout Menomonie, Wisconsin 54751
Abstract
Wertel Scotty J. . (Writer) (Last Name) (First) (Initial)
Experimental Analysis of Noise Reduction Properties of Sound Absorbing Foam
(Title)
Risk Control Eugene Ruenger 03/01 66 .
(Graduate Major) (Research Advisor) (Month/Year) (No. of Pages)
American Psychological Association (APA) 4th Edition .
(Style of Manual Used)
ii
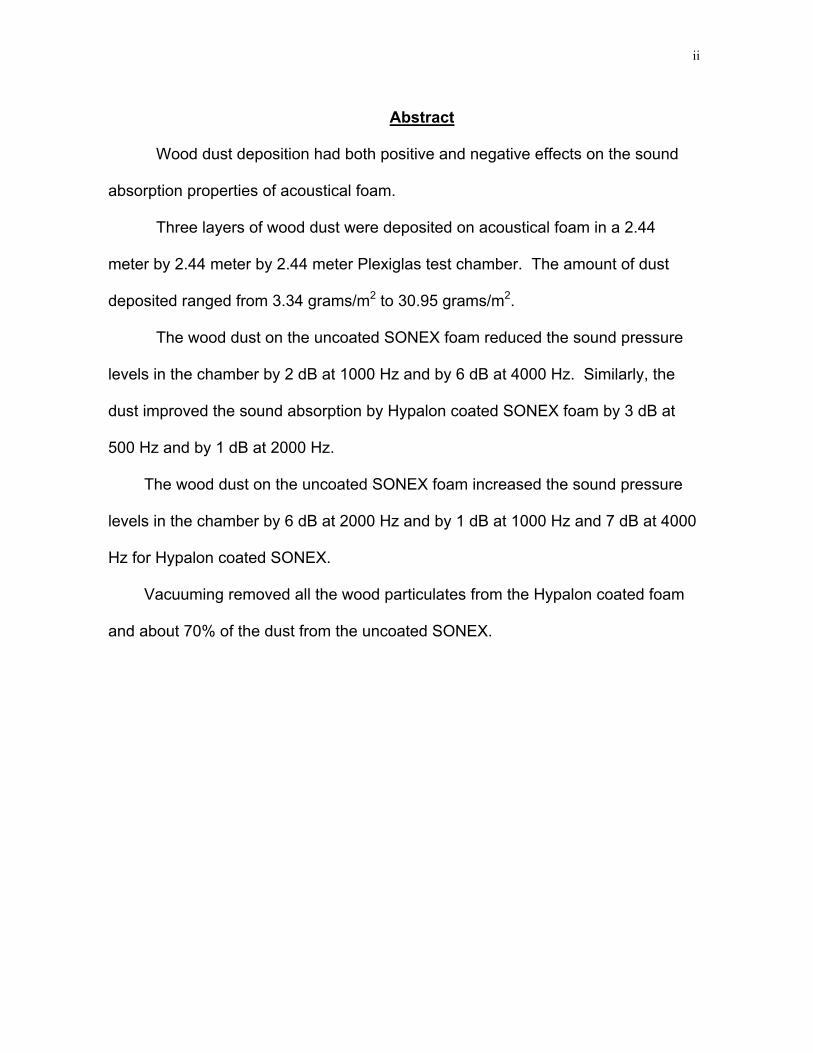
Abstract
Wood dust deposition had both positive and negative effects on the sound
absorption properties of acoustical foam.
Three layers of wood dust were deposited on acoustical foam in a 2.44
meter by 2.44 meter by 2.44 meter Plexiglas test chamber. The amount of dust
deposited ranged from 3.34 grams/m2 to 30.95 grams/m2.
The wood dust on the uncoated SONEX foam reduced the sound pressure
levels in the chamber by 2 dB at 1000 Hz and by 6 dB at 4000 Hz. Similarly, the
dust improved the sound absorption by Hypalon coated SONEX foam by 3 dB at
500 Hz and by 1 dB at 2000 Hz.
The wood dust on the uncoated SONEX foam increased the sound pressure
levels in the chamber by 6 dB at 2000 Hz and by 1 dB at 1000 Hz and 7 dB at 4000
Hz for Hypalon coated SONEX.
Vacuuming removed all the wood particulates from the Hypalon coated foam
and about 70% of the dust from the uncoated SONEX.
iii
Acknowledgements
The author would like to thank the following people for assisting in
completing this paper and this Master’s Degree in Risk Control:
I would like to express my appreciation to Brian Finder, Craig Jameson, John
Olson, Elbert Sorrell, and Eugene Ruenger for the excellent instruction, advice, and
assistance they have provided me while pursuing this degree.
Next, I would like to express thanks and gratitude to Eugene Ruenger for his
advisement on the completion of this research paper and the corresponding
research project for which his knowledge and advice were instrumental.
Additional thanks to my research partner, Jason Sie, for a successful
completion to our research endeavor. I would like to thank all of the anonymous
people at Company X for their assistance and cooperation in providing field
information for this paper.
I would like to say a special thanks to my parents, Carl and Nancy Wertel, for
their unconditional support and encouragement over my many years of college.
Finally, thanks with love to my wife, Christine, for her support and confidence in me
and for providing me with the encouragement needed to complete this field
problem.
iv
Table of Contents
Abstract ............................................................................................... i Acknowledgements...................................................................................... iii Table of Contents ........................................................................................ iv Chapter One: Statement of the Problem
1.1 Introduction ............................................................................................ 1 1.2 Problem Statement ................................................................................ 2 1.3 Purpose of the Study ............................................................................. 3 1.4 Research Objectives.............................................................................. 3 1.5 Background and Significance ................................................................ 3 1.6 Limitations.............................................................................................. 4 1.6.1 Type of particulates.................................................................. 4 1.6.2 Physical characteristics of wood particles ................................ 4 1.6.3 Size of particulates................................................................... 4 1.7 Definition of Terms................................................................................. 4
Chapter 2: Review of Literature
2.1 Health Effects of Noise Exposure .......................................................... 7 2.1.1 Hearing loss ............................................................................. 8 2.2 Noise in the Wood Products Industry.................................................... 8 2.2.1 Wood industry noise exposures ............................................... 9 2.3 Dust Particulate in the Wood Products Industry.................................... 11 2.4 Noise Control ........................................................................................ 12
2.4.1 Sound absorption .................................................................... 13 2.4.2 Absorption and barriers........................................................... 16 2.4.3 Reverberation.......................................................................... 16
2.5 Introduction into Foam Absorbers......................................................... 16 2.5.1 Benefits of acoustical foam ..................................................... 17 2.5.2 Cons for acoustical foam......................................................... 17 2.5.3 Types of absorbers ................................................................. 18 2.6 How Acoustical Foam Absorbers Work ................................................ 18 2.6.1 Noise reduction coefficient ...................................................... 18 2.6.2 Installation of acoustical foam ................................................. 19
2.7 Physical Properties of Absorbers.......................................................... 20 2.7.1 Density .................................................................................... 21 2.7.2 Flow resistivity......................................................................... 22 2.7.3 Wedges................................................................................... 22 2.7.4 Fiber arrangement...................................................................24 2.7.5 Current products ..................................................................... 24 2.8 Effect of Particulate Deposition on Foam Noise Absorption ................. 25 2.9 Summary of Literature .......................................................................... 26
v
Chapter 3: Methodology
3.1 Research Strategy ................................................................................ 27 3.2 Facility .............................................................................................. 28 3.2.1 Experimental Chamber ........................................................... 28 3.2.2 Acoustical Foam Panels.......................................................... 29 3.3 Apparatus ............................................................................................. 31 3.3.1 Sound Generation ................................................................... 31 3.3.2 Sound Pressure Level Measurement ...................................... 32 3.3.3.1 Sound level meter ..................................................... 33 3.3.3.2 Real-time analyzer .................................................... 33 3.3.3 Balance ................................................................................... 33 3.3.4 Wood Particulate..................................................................... 34 3.3.5 Hygrometer ............................................................................. 34 3.4 Test Process......................................................................................... 34 3.4.1 Baseline Measurement of Sound Pressure Level ................... 34 3.4.2 SONEX Testing....................................................................... 34 3.4.3 Wood Dust Deposition ............................................................ 35 3.4.4 Foam cleaning ........................................................................ 36 3.5 Data Analysis Methodologies................................................................ 37 3.5.1 Sound Absorption Coefficient Calculation ............................... 37 3.5.2 Noise Reduction Coefficient .................................................... 37
Chapter 4: Results and Discussion
4.1 Sound Pressure Levels......................................................................... 38 4.2 Sound Absorption by the Acoustical Foam ........................................... 38 4.3 Wood Dust Deposition and Cleaning .................................................... 39 4.4 Effect of Wood Particulate on the Sound Absorption of Acoustical Foam .............................................................................................. 40
4.5 Sound Absorption Coefficients.............................................................. 41 4.5.1 Plexiglas Sound Pressure Coefficients ................................... 42 4.5.2 Sound Absorption Coefficients for Treated Foam ................... 42
Chapter 5: Conclusions and Recommendations 5.1 Conclusion to Objective One ................................................................ 44 5.2 Conclusion to Objective Two ................................................................ 44
5.3 Positive Attributes of the Study Recommended for Future Investigation.............................................................................. 45
5.3.1 Chamber construction ............................................................. 45 5.3.2 Particulate dispersal................................................................ 45 5.3.3 Weighing system..................................................................... 46 5.3.4 Sound level recording ............................................................. 46 5.4 Recognized Errors in Study .................................................................. 46 5.4.1 Effects of humidity on sound absorption ................................. 46 5.4.2 Equality of wood particulate levels on both foams .................. 47 5.4.3 Validity from repeated trials..................................................... 47 5.4.4 Unavailability of Plexiglas sound absorption coefficient .......... 48
vi
5.5 Recommended Continued Work in Areas Not Addressed in Study ..... 48 5.5.1 Environmental conditions ........................................................ 48 5.5.2 Particulate Type and Size ....................................................... 48 5.5.3 Sound Intensity ....................................................................... 49 5.5.4 Decay Times ........................................................................... 49 Appendix A ..............................................................................................50 References ..............................................................................................57

1
Chapter 1: Statement of the Problem
1.1 Introduction
The Upper Midwestern United State has an abundance of wood and wood
products industries. The area is noted for paper manufacturing, sawmills, furniture
manufacturing, and raw building material companies. The processes used in these
industries can create sound levels that exceed 90 dBA (Garcia, Garcia, Baixauli,
Boix, & Marcos, 1997). The National Institute of Occupational Safety and Health
states in the National Occupational Research Agenda (2000):
Problems created by occupational hearing loss include the following: 1)
reduced quality of life because of social isolation and unrelenting tinnitus
(ringing in the ears), 2) impaired communication with family members, the
public, and coworkers, 3) diminished ability to monitor the work environment
(warning signals, equipment sounds, etc.), 4) loss of productivity and
increased accidents resulting from impaired communication and isolation,
and 5) expenses for worker’s compensation and hearing aids.
Under OSHA’s general industry standard, 29 CFR 1910.95, feasible
administrative and engineering controls must be implemented whenever employee
noise exposure equals or exceeds 90 dBA (8-hour time-weighted average (TWA)).
In addition, an effective hearing conservation program including noise exposure
monitoring, audiometric testing, audiogram evaluation, availability of personal
hearing protection, training and education, and record keeping must be
implemented whenever employee exposure equals or exceeds an 8-hour TWA
sound level of 85 dBA.
2
Engineering controls are the preferred method for noise reduction.
Engineering controls include sound barriers, which reduce the transmission of
sound, and sound absorbing materials, which decrease reverberant sound. Noise
can be reduced by suppressing audible kinetic energy in three ways: 1) containing
noise with barrier materials and enclosures; 2) canceling noise by introducing
sound energy which mirrors the offending sound, and 3) absorbing sound energy
with panels, baffles, and other acoustic foam products (NIOSH, 1979).
Acoustical foam is one of the most popular materials available for absorbing
noise. When used inside or around loud machinery, sound-absorbing acoustical
foam reduces the build-up of noise, which in turn protects employee hearing,
improves safety and enhances communication. Acoustical foam is commonly used
for enclosing noisy machinery as well as in utility and maintenance rooms
containing loud equipment where reflection of noise needs to be reduced (Industrial
Noise Control, 1987).
Since the sound absorbance characteristics of acoustical foam are
determined by its structure, changes in the surface of the foam may affect its sound
absorption characteristics (Yang and Bolton, 1996). The deposition of particulate
matter on the absorbing surface is a potential problem, however, the effects of
particulate deposition have not been determined by acoustical foam manufacturers,
Owens Corning or Illbruck Inc. (Murphy, personal interview, 20 February 2000 and
Carlson & Hutmacher, personal interview 19 February 2000).
1.2 Problem Statement
This study examined the effect of surface deposition of wood particulates on
the sound absorption properties of Hypalon coated and uncoated SONEX
melomine foam panels.
3
1.3 Purpose of the Study
This study examined the sound absorption properties of two sound
absorbing materials commonly used in the wood processing industry. Different
levels of wood particulate accumulation were tested to determine how particulate
buildup affects the sound absorption qualities.
This project provides the wood product manufacturers and acoustical foam
manufacturers with sound absorption performance information of soiled acoustical
foam and cleaned foam. This information may help wood products manufacturers
select acoustical foams best suited for their specific noise control problem.
Recommendations regarding the use of foam acoustical materials in wood
manufacturing processes were provided to participating companies.
1.4 Research Objectives The objectives of this study were to:
1) Measure the particulate deposition effects on the sound absorption
characteristics of uncoated and Hypalon coated melomine foam by
determining if αclean foam - αsoiled foam = 0, where α is the Noise Reduction
Coefficient (NRC).
2) Determine the effectiveness of cleaning methods for both Hypalon coated
and uncoated SONEX Willtec™ foam panels in terms of noise absorption
effects.
1.5 Background and Significance
There are few published studies that determine the sound absorption
characteristics of acoustical foam contaminated by wood dust. Leading acoustical
foam producers acknowledge this lack of research, and hope to gain valuable
4
insight into this potential problem (Murphy, personal interview, 20 February 2000
and Carlson & Hutmacher, personal interview 19 February 2000). The
manufacturers of acoustical foams are the primary source of clean foam research
and information. However, no studies of sound absorption characteristics of
acoustical foam in environments with airborne wood dust were in the literature.
1.6 Limitations The limitations to the research are as follows:
1.6.1 Type of particulates
Only wood dust was used in this study. The results may not be applicable to
other types of particulate material.
1.6.2 Physical characteristics of wood particles
Wood types, moisture content, and generation method may affect wood
particulate deposition and noise reduction coefficients of the acoustical foam.
Chapter 3 outlines the type of wood used during this preliminary investigation and
the physical characteristics of the wood particulate used during experimental
testing.
1.6.3 Size of particulates
The research focused on a limited range of wood particulate size. The
relationship between particulate size and sound absorption was not tested. Also,
the effect of particulate size on wood dust’s affinity for attachment to the acoustical
foam was not examined.
1.7 Definition of Terms
The following definition section will assist the reader with terminology used in
the areas of noise and acoustical foam research.
5
A-Weighted Sound Level – The ear does not respond equally to frequencies, but is less efficient at low and high frequencies than it is a medium or speech range frequencies. A-weighted sound level is used to obtain a single number representing the sound level of a noise contained within a wide range of frequencies which is representative of the ear’s response. In order to do this it is necessary to reduce, or weigh, the effects of the low and high frequencies with respect to the medium frequencies. The resultant sound level is said to be A-weighted, the units are decibel. A popular method of indicating the units is dBA. The A-weighted sound level is also called the noise level. Sound level meters have an A-weighted network for measuring A-weighted sound level. (Cheremininoff, 1996)
Action Level – An 8-hour time-weighted average of 85 decibels measured on the A-
scale, slow response, or equivalently, a dose of fifty percent. (OSHA: Definitions, 2000)
Criterion Sound Level – A sound level of 90 decibels. (OSHA: Definitions, 2000) Decibel (dB) – Unit of measurement of sound level. (OSHA: Definitions, 2000) Free Sound Field (Free Field) – An isotropic, homogeneous sound field free from
bounding surfaces. (Cheremininoff, 1996) Hertz (Hz) – Unit of measurement of frequency, numerically equal to cycles per
second. (OSHA: Definitions, 2000) Interstices - simply a little space between two things (Beranek & Ver, 1992) Noise Dose – The ratio, expressed as a percentage, of (1) the time integral, over a
stated time or event, of the 0.6 power of the measured SLOW exponential time-averaged, squared A-weighted sound pressure and (2) the product of the criterion during (8 hours) and the 0.6 power of the squared sound pressure corresponding to the criterion sound level (90 dB). (OSHA: Definitions, 2000)
Noise Reduction Coefficient (NRC) - The average of the absorption coefficients at
the most common frequencies (250, 500, 1000 and 2000 Hz). The NRC is used to compare the acoustical performance of various materials. (Illbruck: Industrial Noise Control Room Acoustics Anechoic Environments, 2000).
Sabin - A unit of sound absorption, which is equivalent to one square foot of a
perfectly absorptive surface. Baffles are frequently described as providing X number of sabins of absorption based on the size of the baffle tested, through the standard range of frequencies 125-4000 Hz. (Illbruck: Industrial Noise Control Room Acoustics Anechoic Environments, 2000).
Sound Level – Ten times the common logarithm of the ratio of the square of the
measured A-weighted sound pressure to the square of the standard reference pressure of 20 micropascals. Unit: decibels (dB). For use with
6
1910.95, SLOW time response, in accordance with ANSI S1.-1971 (OSHA: Definitions, 2000)
Sound Level Meter – An instrument for the measurement of sound level. (OSHA:
Definitions, 2000) Time-Weighted Average Sound Level – That sound level, which if constant over an
8-hour exposure, would result in the same noise dose if measured. (OSHA: Definitions, 2000)
7
Chapter 2: Review of Literature
Noise often can be traced to specific devices such as industrial machines,
pumps, blowers, loudspeakers and generators. Overall, noise is unwanted sound.
Noise is a byproduct of many industrial processes, which include noise from
conversation, tools, and machines located throughout a plant (Sataloff and Sataloff,
1993).
2.1 Health Effects of Noise Exposure
Under the Occupational Safety and Health Act (OSHA), every employer is
legally responsible for providing a workplace free of recognized hazards, such as
excessive noise. It has been estimated that 14 million U.S. workers are exposed to
hazardous noise (Gheremininoff, 1996). In the Code of Federal Regulations (CFR),
OSHA states their: “hearing conservation program is designed to protect workers
with significant occupational noise exposures from suffering material hearing
impairment even if they are subject to such noise exposures over their entire
working lifetimes” (OSHA Hearing Conservation, 1995).
Occupational exposure to noise levels in excess of the current OSHA
standards places hundreds of thousands of workers at risk of developing hearing
impairment, hypertension, and elevated blood pressure levels (NIOSH Survey,
1990). According to the Morbidity and Mortality Weekly Reports, “occupationally
induced hearing loss continues to be one of the leading occupational illnesses in
the United States” (MMWR, 1986, p. 185). In following, hearing loss is the most
studied effect of noise on health (Sataloff and Sataloff, 1993).
8
2.1.1 Hearing loss
Sound consists of pressure changes in a medium (usually air) caused by
vibration or turbulence. These pressure changes produce waves emanating away
from the turbulent or vibrating source (Crocker, 1998). Exposure to high levels of
these waves can result in hearing loss and may induce other health effects as well.
The severity of damage depends primarily on the intensity of noise and the duration
of exposure. Noise-induced hearing loss can be temporary or permanent.
Temporary hearing loss results from short-term exposures to high levels of noise,
with normal hearing returning after a period of rest from noise exposure. Generally,
prolonged exposure to high noise levels over a period of time gradually causes
permanent damage (OSHA Hearing Conservation, 1995).
2.2 Noise in the Wood Products Industry
The United States is the world’s leading consumer and producer of wood
products. While home to only five percent of the world’s population, the US
consumes more than 17 percent of the world’s wood (Bahouth, 1995).
Most woodworking machinery creates high noise levels requiring that
employers establish and maintain effective hearing conservation programs
(National Safety Council, 2000).
Garcia et al. (1997) investigated the hearing loss experienced by wood and
furniture workers, reporting that one in five examined workers suffered “advanced
acoustic trauma”. The analysis showed a relationship between noise exposure and
hearing capacity in homogeneous age groups, especially for frequencies of 4,000
to 6,000 Hz. Mean values of hearing losses ranged from 13 dB to 36 dB at
frequencies of 1,000 Hz and 6,000 Hz, respectively.

9
2.2.1 Wood industry noise exposures
Garcia et al. (1997) evaluated workers’ noise exposure at nine typical small
to medium size wood and furniture industries in Valencia, Spain. They reported
that 86% of the 150 workplaces had daily noise levels over 80 dBA-TWA and 23%
of them were over 90 dBA. The workstations with higher sound levels involved the
use of ordinary saws (4 cases), moulding machines (3 cases), multiple circular
saws (2 cases), polishing machines (2 cases), and drilling machines (2 cases). In
one sector evaluated, the presence of huge quantities of raw and manufactured
wood products produced an unintentional and significant sound absorption,
reducing reverberation time from the typical 2.3 seconds to 0.9 seconds decay time
(Garcia et al., 1997).
Although the study by Garcia et al. (1997) was based on a limited sample of
factories, the research shows some interesting results regarding occupational noise
in raw wood and furniture manufacturing. The study showed 1) very high noise
levels (frequently exceeding Spanish regulations), 2) evidences of health damage
effects (as manifested in losses of hearing capacity), and 3) multiple contradicting
attitudes
from employers and workers.
A cross-sectional noise survey was carried out in 200 Danish wood and
furniture factories. Overall TWA exposure to noise was 90.5 dBA, which exceeds
both Dutch and OSHA noise regulations (Vinzents and Laursen, 1993).
For woodworking in sawmills, both Garcia et al. (1997) and Vinzents &
Laursen (1993) showed noise levels had a tendency to increase with factory size.
In addition, the TWA noise levels at sawmills were higher compared with the means
for other factories. For non-sawmill industries, which include wood products
10
manufacturing the means were at a sound level of approximately 90 dBA (Vinzents
and Laursen, 1993). Investigators reported usage of noise reduction controls,
including noise shields or acoustic absorbers, in production areas varied from 31%
in small factories to 47% in large factories (Vinzents and Laursen, 1993).
In contrast to Garcia’s finding of several sources of noise, Miller, Montone,
and Oviatt (1980) concluded that any acoustical study of the wood products
industry would immediately reveal two major sources of noise, saws and planers.
Furthermore, they state that while defining effective noise problems is fairly simple,
finding engineering solutions is much more difficult (Miller, Montone, & Oviatt,
1980).
Noise levels during wood working was the only exposure in the Garcia et al.
(1997) study which was at the same level of or exceeding the Spanish OEL
(Occupational Exposure Limits) of 90 dBA, 8- hour TWA. Garcia et al (1997) found
that 90% of the employees were exposed to noise levels of 85 dBA or more and
thus were exposed to risk of hearing damage. Until approximately ten years ago,
the principles of noise reduction were not well established, both in working areas
and at the wood processes (Garcia et al, 1997). Vinzents and Laursen (1993) and
their fellow researchers feel that in many wood industries the seriousness of noise
as an occupational hazard has been underestimated.
One of the unique features of the noise associated with wood product plants
is its intermittent nature. While the OSHA regulation stipulates a limit of 90 dBA for
8 hours, higher sound levels are allowed if employee exposure is less than 8 hours.
For example, a saw operator may be exposed to sound levels of 95 dBA, but not
exceed the OSHA limits if the cumulative daily exposure is 4 hours or less. In most
cases, the noise produced by conventional saws and planers may be reduced
11
significantly using engineering controls and maintenance practices; however, it is
often not technically feasible to reduce sound levels to within the OSHA limits
(Miller, Montone, & Oviatt, 1980). Sound absorbing materials, such as
polyurethane foam, are one technically feasible engineering control that is often
used. The performance of these materials is affected by environmental conditions,
such as, dusty environments, humidity, and temperature (Illbruck brochure, 1998;
Acoustical Solutions, 2000).
2.3 Dust Particulate in the Wood Products Industry
Vinzents and Laursen’s (1993) cross sectional study of 200 Dutch wood and
furniture factories determined that the overall average exposure to wood dust was
0.90 mg/m3. The study determined that the concentration of wood dust was slightly
decreased at larger factories (>20 employees) compared to the smaller size
organizations. The exposure at furniture factories and other wood products
factories was significantly elevated, compared to sawmills and manufacturers of
doors and windows.
Vinzents and Laursen’s (1993) determined that the mean concentration of
total dust vs. concentration of respirable dust was 0.33 mg/m3 with a standard
deviation of 0.24 with a total of 148 measurements. No significant differences in
respirable dust were seen by type of industry or size of factory. Furthermore, no
significant differences were identified relative to work task, ventilation, or local
exhaust. The geometric mean (GM) for the concentration of inhalable dust was
1.11 mg/m3 and was elevated compared to the GM of total dust concentration,
which was 0.71mg/m3 for 40 simultaneous samples collected at the 32 large
factories.
12
In the Vinzents and Laursen (1993) study of factories producing doors and
windows, woodworking was carried out on rectangular pieces of wood at stationary
machines that did not sand the wood. The researchers indicate in this kind of wood
working, it is easy to establish effective ventilation in order to reduce employee
exposure to high particulate. The ease of establishing effective ventilation may be
the reason for the low estimate wood dust concentration of 0.63 mg/m3. A full-shift
of manual sanding was the work task resulting in the highest level of dust exposure,
which requires better dust control systems (Vinzents and Laursen, 1993).
2.4 Noise Control
In Preventing Occupational Hearing Loss: A Practical Guide, the National
Institute for Occupational Safety and Health (NIOSH, 1990) discusses several
strategies for reducing with workplace noise exposure. These strategies include; 1)
prevent or contain the escape of the hazardous workplace agent (in this case,
noise) at its source, and 2) control the exposure with barriers between the worker
and the hazard (Illbruck brochure: Industrial Noise Control, Room Acoustics,
Anechoic Environments, 1998).
There are a variety of control techniques documented in noise control
literature to reduce the overall worker exposure to noise. Such controls reduce the
amount of sound energy released by the noise source, divert the flow of sound
energy away from the receiver, or protect the receiver from the sound energy
reaching the worker. Noise control examples include proper maintenance of
equipment, revised operating procedures, equipment replacements, acoustical
shields and/or barriers, equipment redesign, enclosures, administrative controls,
and use of personal protective equipment (NIOSH 79-117, 1979).
13
Absorbers are designed to reduce the amount of reflected sound energy
(Beranek, 1992). When sound hits any surface, it takes three paths: 1)some goes
through the surface (noise transmission), 2) some dissipates within the surface
(causing vibration), and 3) some reflects back off the surface (noise reflection).
2.4.1 Sound absorption
In Everest’s Master Handbook of Acoustics (1981) it states, “The law of
conservation of energy states that energy can neither be created nor destroyed but
that it can be changed from one form to another.” Acoustical foam is one method of
changing sound energy from the form of vibratory energy of air particles to heat
energy through dissipation (Everest, 1997).
Each time sound waves meet the boundary surfaces of the room; some
energy is absorbed while the remainder is represented by the waves reflected from
the surface. These reflected waves eventually meet a boundary and again, some
energy is absorbed, some is re-reflected, and so on. In the lack of continuous
replacement of the original sound energy one would expect sound produced in a
room to die away slowly to an inaudibility signature, rather than to cease abruptly
when the supplying energy is turned off. The length of time this process will take
depends on two factors 1) how much absorption occurs when the waves meet the
boundaries and 2) how often they do so (Parkin & Humphreys, 1958). If the
boundary surfaces of a room are highly reflective the reverberation time is long.
When certain sound of energy is introduced because of the constant reflection of
sound, the loudness is expected to be greater than if the same sound were made in
a free field. Constant reflection of sound is typical around large manufacturing sites
where steel/aluminum construction serves as the boundaries and the noise
14
generating wood-working machines continually reintroduce sound enhancing
reverberation.
Two phenomena account for most of the energy losses at high sound
frequencies, which change the sound energy to thermal energy (Beranek & Ver,
1992). According to Beranek and Ver, (1992) sound pressures of air molecules (in
addition to their random thermal motion) oscillate in the interstices of a porous
material with the frequency of the excited sound wave. Porous sound absorbers
use the properties of interstices to alter the energy form of noise. The oscillations
result in frictional losses. Changes in flow direction, expansions, and contractions
of the flow through irregular pores result in losses of momentum in the direction of
wave propagation.
At low frequencies the conduction of sound waves is another source of
energy loss. Because of the excited sound, the air in the pores undergoes periodic
compression and decompression and an accompanying change of temperature.
Due to the length of time during each half-period of oscillation, the large surface-to-
volume ratio, and the relatively high heat conduction of the fibers, the efficient
exchange of heat means that the compressions are essentially isothermal. At high
frequencies the compression process is adiabatic (occurring without loss or gain of
heat). In the frequency range between isothermal and adiabatic compression, the
heat exchange process results in further loss of sound energy. In a fibrous material
this loss is especially high if the sound propagates parallel to the plane of the fibers
and may account for up to 40% if sound attenuation occurs (energy lost per meter
of propagation) (Beranek, 1992).
When sound energy is absorbed it is converted into a very small amount of
heat energy. As the pressure of the air momentarily increases or decreases at the
15
surface of a porous material, due to the arrival of sound waves, air flows out of the
pores. The friction produced between individual molecules of air moving within the
restricted space of the pores has the ability to change some of the sound energy
into heat. Alternatively, the vibration type absorbed will set the surface in motion by
alternating air pressure. The friction between the molecules of the vibrating
material creates heat (Parkin & Humphreys, 1958).
Everest (1997) describes the process of sound waves striking a wad of
cotton batting. The description illustrates the transfer of sound energy to
mechanical energy through the vibration of cotton fibers. The fiber amplitude is
never as great as the air particle amplitudes of the sound wave due to frictional
resistance. Some sound energy is changed to frictional heat as the cotton fibers
are set in motion. The sound continues to penetrate further into the interstices of
the cotton, losing more energy as increased numbers of fibers are vibrated
(Everest, 1997).
Absorptivity of a material varies with sound frequency. The noise reduction
coefficient for a given material may easily be eight or nine times greater at one part
of the frequency scale compared to another. The amount of effective absorption is
not only dependent on the absorption coefficient, but also the position of absorbent
material in the room and its relation to other surfaces. The complete picture of the
behavior of a decaying sound in a room comprises a complicated pattern of waves
traveling the room being reflected on various surfaces. Each reflection reduces the
intensity of the wave and alters it at one part of the frequency scale more than at
another. Combined with this reflective motion, there may be very long standing
waves set up between the various parallel surfaces, particularly if the room is small
(Parkin & Humphreys, 1958).
16
2.4.2 Absorption and barriers
Absorptive materials are most effective when used in conjunction with
barriers or barrier material. If barriers do not already exist in the form of walls,
machine guards, cabinets, ceilings, etc., they may need to be introduced into the
treated area. (Industrial Noise Control, Inc., Products and Systems for Workplace
Noise Control. 4th Edition Planning Guide and Catalog, 1987).
2.4.3 Reverberation
Overall noise levels and reverberation are the two most common problems
found in large interior spaces. When sound is introduced into a room, the
reverberant field level will increase until the sound energy introduction is just equal
to the sound energy absorption. If the sound source is abruptly shut off, the
reverberant field will decay at a rate determined by the rate of sound energy
absorption. The reverberant field is the single most important parameter describing
the acoustical properties of a room (Crocker, 1998). Reverberation, which is
caused by the reflection of sound waves from hard surfaces, can hamper
communications and contribute to higher noise levels. Sound absorbing foams
have been developed as an engineering control to reduce reverberation and overall
sound levels.
2.5 Introduction into Foam Absorbers
Sound absorbing foams first appeared in the mid 1970’s (Crocker, 1998).
Flexible polyurethane foams are widely used in automobiles, machinery, aircraft,
and various industrial applications. To reduce the affects of noise, foams are
finding application as sound absorbers in architectural and industrial applications,
including machine areas, HVAC systems, recording studios and test laboratories
(Illbruck brochure, 1998).
17
2.5.1 Benefits of acoustical foam
According to Cheremininoff (1996), some benefits of acoustical polyurethane
foam are:
• Its effectiveness to absorb noise in mid-to-high frequencies
• Can create cost effective enclosures around machinery
• Low susceptibility to material degradation (if faced and edges are
sealed)
• Non-toxic and vibration resistant
• Made from self-fire extinguishing material (generally suitable for
architectural purposes).
2.5.2 Cons for acoustical foam
Some of the negatives of acoustical polyurethane foam as, determined by
Cheremininoff (1996), are:
• Selection of foam type is dependent on the factors of exposure,
moisture, solvents, vibration, dirt, oil and grease, temperature,
corrosive materials, and erosive conditions.
• Can become damaged, torn, cut, and ripped by abrasion
• Do not meet regulatory restrictions for disinfecting/cleaning materials
in and contacting food and drug products
• Fire requirements – materials of construction
• Restrictions on shedding fibers
• Machine guarding restrictions
• Deteriorates at high temperature.
18
2.5.3 Types of absorbers
Porous sound-absorbing materials are available in the form of mates,
boards, and preformed elements. They are manufactured of glass, mineral or
organic fibers, wood chips, coco fibers, felted textile, or open cell foam (usually
polyurethane). These materials have open pores with typical dimensions less than
1 mm. These open pores are significantly smaller than the wavelength of sound.
Open pore foam can be treated as a poor homogeneous medium with uniform
structure or composition. The goal of acoustical foam characterization is the
prediction of the characteristic impedance and propagation constant (Beranek,
1992).
Noise absorbers are designed to reduce reflected noise and dissipate noise
energy. The open cell structure of acoustical foam dissipates noise energy to
control harsh reflected noise and reverberations in enclosed surroundings. Baffles,
which are typically hung from ceilings, are 2-sided acoustical foam panels with an
integral wire support frame (Netwell: Noise Control Solutions, 2000)
2.6 How Acoustical Foam Absorbers Work
Noise absorbers allow most of the incident noise to be transmitted, but also
dissipate some energy during the process. Very little noise is reflected from the
surface of the acoustical foam (Industrial Noise Control, 1987).
2.6.1 Noise reduction coefficient
The amount of noise dissipated or absorbed is a fraction of the total noise.
The amount absorbed is stated as absorption coefficients for each frequency. The
Noise Reduction Coefficient (NRC) is a simple average of the performance at four
frequency bands: 250, 500, 1000, and 2000 hertz and is a convenient way to
classify absorption performance (Industrial Noise Control, 1987).
19
Sound absorption coefficients of acoustical materials will range from 0.01 to
greater than 1.00. The higher number indicates a better absorber of sound. For
example, a material having a sound absorption coefficient of 0.85 will absorb 85%
of the incident sound energy striking its surface. A sound absorption coefficient
greater than 1.00 cannot occur in theory but can be measured for materials that are
highly sound absorptive. However, the sound absorption coefficient should always
be rounded to 1.00 when calculating sabins of absorption (Industrial Noise Control,
1987). The amount of noise reduction obtained in an area when sound absorption
material is added depends on several factors, these factors include the size and
geometry of the area, the sound absorbing properties of existing materials in the
area, the location of the noise source or sources, the amount of sound absorbing
material added in the area, and the placement of such material (Owens/Corning,
2000).
The sabin absorption coefficient of a material is measured using a
reverberation chamber, in which reverberation decay times are determined. This is
accomplished in one-third-octave bands, with and without the material under test.
The differences in measured decay times with the absorbent material in place
allows determination of the absorption due to the presence of the test material
using the total area of all room surfaces, including the sample when in place, and
the area of material (usually between 10 and 12 m2 exposed to the sound field)
(Crocker, 1998).
2.6.2 Installation of acoustical foam
At its most basic level, correction of room acoustics involves using sound-
absorbing materials on three non-parallel surfaces. This technique suppresses
unwanted reverberation by keeping sound waves from bouncing back and forth
20
between parallel surfaces. It also reduces the overall noise level by preventing
noise from building up (Everest 1997).
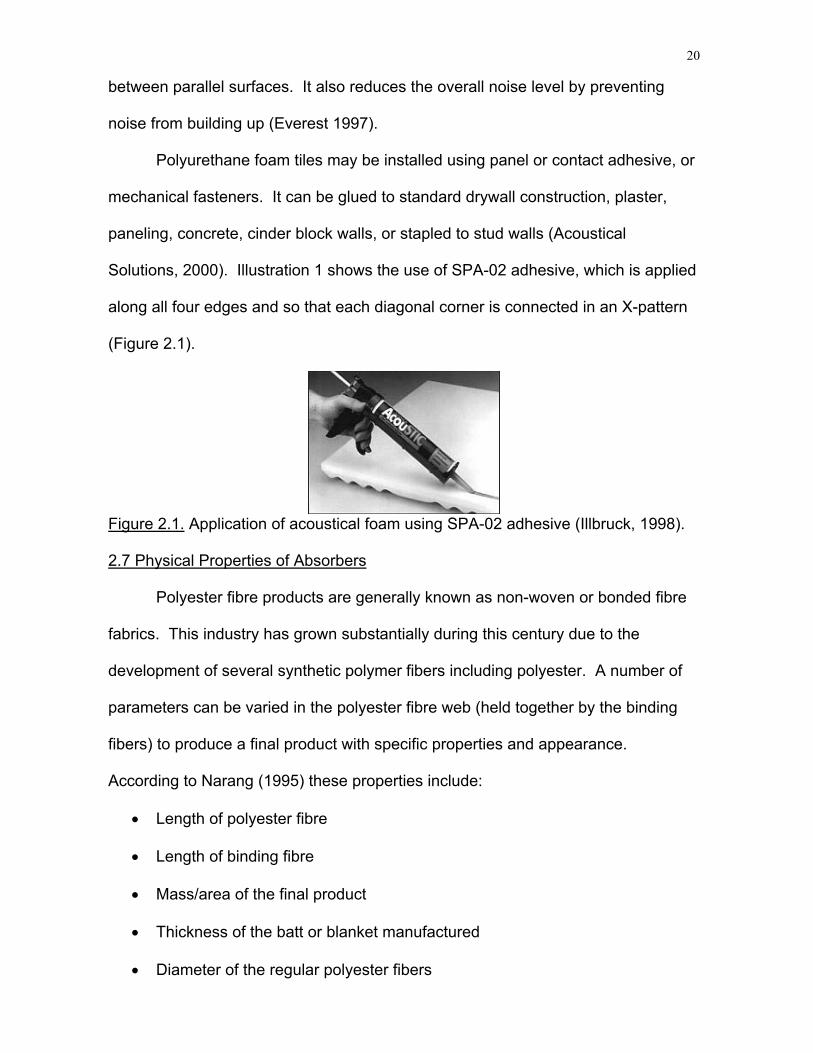
Polyurethane foam tiles may be installed using panel or contact adhesive, or
mechanical fasteners. It can be glued to standard drywall construction, plaster,
paneling, concrete, cinder block walls, or stapled to stud walls (Acoustical
Solutions, 2000). Illustration 1 shows the use of SPA-02 adhesive, which is applied
along all four edges and so that each diagonal corner is connected in an X-pattern
(Figure 2.1).
Figure 2.1. Application of acoustical foam using SPA-02 adhesive (Illbruck, 1998).
2.7 Physical Properties of Absorbers
Polyester fibre products are generally known as non-woven or bonded fibre
fabrics. This industry has grown substantially during this century due to the
development of several synthetic polymer fibers including polyester. A number of
parameters can be varied in the polyester fibre web (held together by the binding
fibers) to produce a final product with specific properties and appearance.
According to Narang (1995) these properties include:
• Length of polyester fibre
• Length of binding fibre
• Mass/area of the final product
• Thickness of the batt or blanket manufactured
• Diameter of the regular polyester fibers
21
• Type of fibers – hollow or solid
• Percentage of binding fibers in the total as a ratio
• Type of fibre crimp – spiral or saw tooth
• Web arrangement – parallel or randomized.
The two most important properties for acoustic applications are sound
insulation and sound absorption, which for fibrous material is a function of the
material flow resistance (Narang, 1995).
One of the most important differences between fiberglass and partially
reticulated foam is the large structure factor. The larger structure factor of partially
reticulated foam has two consequences. First, a large structure factor reduces the
phase speed of airborne wave propagation within the foam. This has the effect of
shifting layer resonance effects to correspondingly lower frequencies. In foam, this
effect is controlled primarily by the degree of reticulation, which may be increased
or decreased as desired without significantly affecting the treatment weight.
Second, viscous and inertial effects associated with a large structure factor cause
the motion of the solid phase of the foam (frame) and the interstitial air to be
coupled (Bonton & Green, 1993).
2.7.1 Density
Glass fiber and other materials come in densities ranging from flimsy thermal
insulation batts to semi rigid and rigid boards. According to Everest (1981), density
shows relatively little difference in absorption coefficients as the density is varied.
In very low densities, the fibers are widely spaced which affects the absorption of
the material. For extremely dense rigid boards the surface reflection is high and
sound penetration is decreased, therefore, absorption is low.

22
Fibrous, porous, low-density materials are often good sound absorbers.
Because absorbers generally exhibit less mechanical strength than barrier
materials, their selection requires some additional consideration. Facings are
applied to many sound absorbing materials to protect them from the physical
environment (Industrial Noise Control Inc, 1987). For example, glass fiber blanket
is a good absorber but lacks strength in lower densities. Adding a glass fabric
facing and fabricating the layers into a quilted blanket creates a strong material with
excellent absorption performance. Urethane foams are excellent absorbers and are
strong with or without facing.
2.7.2 Flow resistivity
Flow resistivity (specific flow resistance per unit thickness) is the most
important physical characteristic of a porous material. Since resistivity depends on
the sound wave velocity, it is customary to extrapolate measured resistivity versus
velocity to v=0.05 cm/s. Below this particle velocity the flow resistivity of most
fibrous materials does not depend any more on the velocity.
2.7.3 Wedges
According to SONEX manufacturer, Illbruck Inc., (2000) to enhance
dissipation, the optimum surface geometry for sonic deflection is the standard
“anechoic-wedge”. This is widely used in sound laboratories. The SONEX contour
is based on this anechoic-wedge principle, which presents a surface area 450%
greater than flat surfaces. (SONEX, “The Beautiful Way to Kill Noise” brochure).
One polyurethane foam, SONEX, is contoured to simulate the wedges used
in anechoic rooms. They are shaped in male and female molds and come in
meshed pairs (Everest 1997).
23
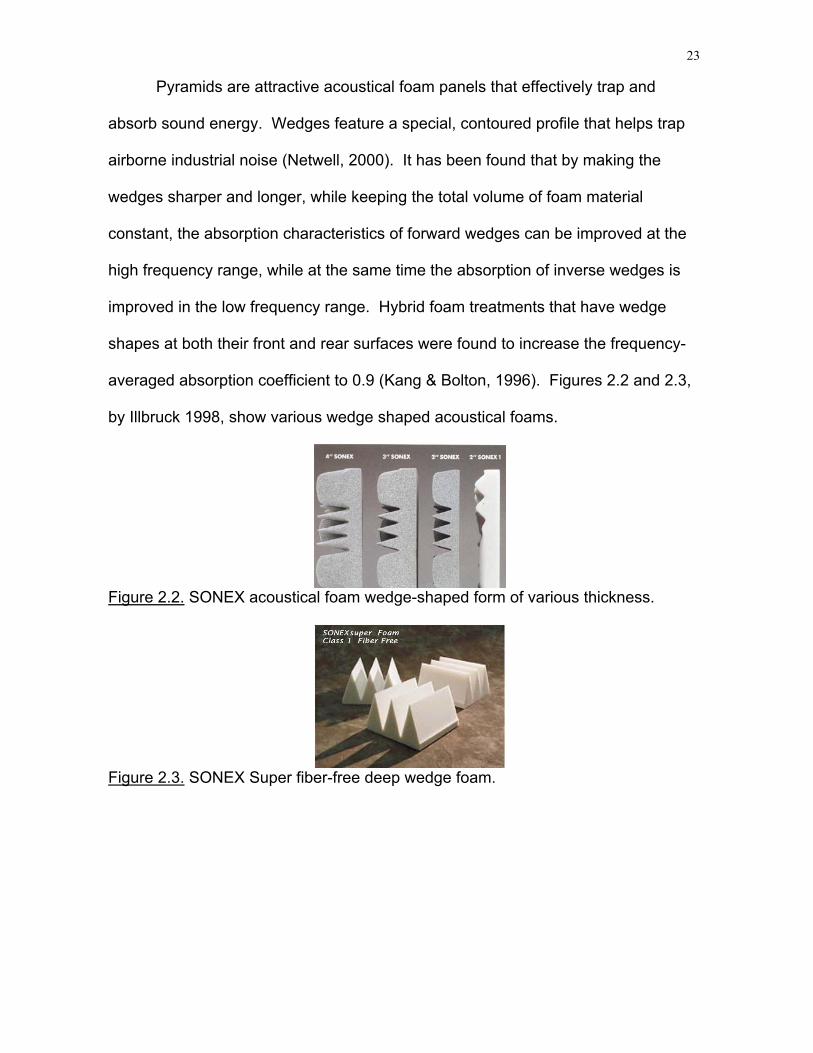
Pyramids are attractive acoustical foam panels that effectively trap and
absorb sound energy. Wedges feature a special, contoured profile that helps trap
airborne industrial noise (Netwell, 2000). It has been found that by making the
wedges sharper and longer, while keeping the total volume of foam material
constant, the absorption characteristics of forward wedges can be improved at the
high frequency range, while at the same time the absorption of inverse wedges is
improved in the low frequency range. Hybrid foam treatments that have wedge
shapes at both their front and rear surfaces were found to increase the frequency-
averaged absorption coefficient to 0.9 (Kang & Bolton, 1996). Figures 2.2 and 2.3,
by Illbruck 1998, show various wedge shaped acoustical foams.
Figure 2.2. SONEX acoustical foam wedge-shaped form of various thickness.
Figure 2.3. SONEX Super fiber-free deep wedge foam.
24
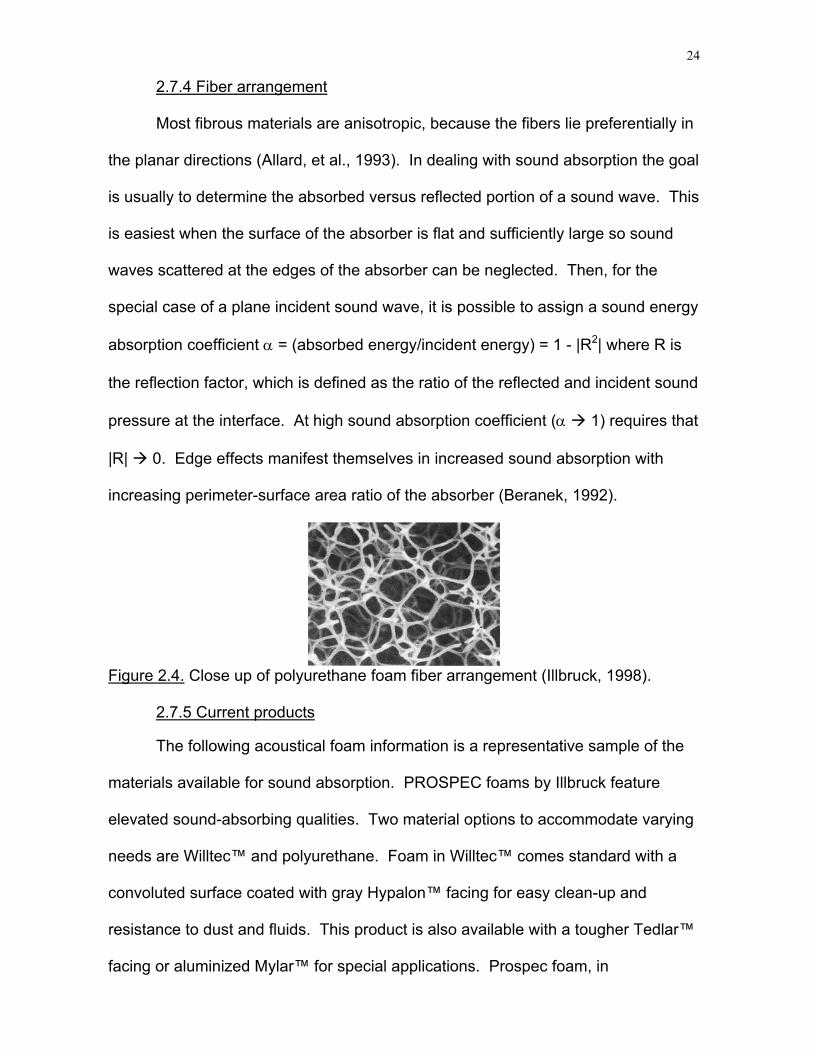
2.7.4 Fiber arrangement
Most fibrous materials are anisotropic, because the fibers lie preferentially in
the planar directions (Allard, et al., 1993). In dealing with sound absorption the goal
is usually to determine the absorbed versus reflected portion of a sound wave. This
is easiest when the surface of the absorber is flat and sufficiently large so sound
waves scattered at the edges of the absorber can be neglected. Then, for the
special case of a plane incident sound wave, it is possible to assign a sound energy
absorption coefficient α = (absorbed energy/incident energy) = 1 - |R2| where R is
the reflection factor, which is defined as the ratio of the reflected and incident sound
pressure at the interface. At high sound absorption coefficient (α 1) requires that
|R| 0. Edge effects manifest themselves in increased sound absorption with
increasing perimeter-surface area ratio of the absorber (Beranek, 1992).
Figure 2.4. Close up of polyurethane foam fiber arrangement (Illbruck, 1998).
2.7.5 Current products
The following acoustical foam information is a representative sample of the
materials available for sound absorption. PROSPEC foams by Illbruck feature
elevated sound-absorbing qualities. Two material options to accommodate varying
needs are Willtec™ and polyurethane. Foam in Willtec™ comes standard with a
convoluted surface coated with gray Hypalon™ facing for easy clean-up and
resistance to dust and fluids. This product is also available with a tougher Tedlar™
facing or aluminized Mylar™ for special applications. Prospec foam, in
25
polyurethane, is a more economical option that provides high sound absorption. It
comes standard with a Tuftane™ facing that resists water, oil and solvents.
Aluminized Mylar™ is also available to provide increased protection against fluids
or other special applications.
PROSPEC™ products contain and/or absorb sound at its source and are
ideal for insolating noisy equipment and minimizing sound transmission through
walls and ceilings. Materials by other manufacturers are comparable in their sound
absorbing qualities.
2.8 Effect of Particulate Deposition on Foam Noise Absorption
Owens-Corning research representative, Patricia Murphy (personal
interview, 20 February 2000) indicates the Owens-Corning company has not
performed any studies on soiled acoustical polyurethane foam sound absorption.
However, Owens-Corning did report that specialized acoustical tile protective layers
can be used to protect their absorptive materials from wood particulate
accumulation (Murphy, 2000).
According to Illbruck representative, Joerg Hatmacher (personal interview,
19 February 2000), Illbruck a manufacturer of SONEX™, has not done any tests on
the performance of soiled acoustical foam in either their United States or Germany
facilities. When Illbruck materials become soiled with wood dust particulate it is
common practice to encourage cleaning of the product or removal of current
product and subsequent replacement with environmentally resistant materials.
Illbruck makes a product line which includes a Hypalon™ coating which has been
found to protect against many environmental conditions (Hatmacher, 2000).
Hypalon coating repels oil, acid, or solvents and can be hosed or wiped clean.

26
2.9 Summary of Literature
Manufacturers of polyurethane acoustical foam have recognized the need for
acoustical foam to perform under variable physical environments. Protective
coatings have been developed to protect the physical structure of the foam, which
is responsible for sound absorption with minimal reflection. The wedge-shaped
face surfaces of these products have proven to enhance the sound absorbency of
foams, but create surfaces where particulates can deposit. Studies by Vinzents
and Laursen (1993) and Garcia et al. (1997) have shown that wood particulate
generation in wood products industries can be significant and possibly affect
absorption of acoustical foam. The studies by Garcia et al. confirm that noise within
wood products factories must be controlled using engineering controls such as
acoustical foam. The need for sound absorption, and therefore acoustical foam,
within an environment producing airborne particulate matter has created the need
for research on the effect of wood particulate deposition on acoustical foam
performance.

27
Chapter 3: Methodology
3.1 Research Strategy
The effect of wood particulates on the sound absorption properties of
SONEX uncoated and Hypalon™ coated acoustical foam were examined in a
controlled test chamber. The sound absorption properties of new, soiled, and
cleaned acoustical foam were measured using the acoustical foam manufacturers,
and foam users in the wood products industry, standard test methods (ASTM, 126).
At each stage of testing the acoustical foam was weighed to determine the amount
of wood particulate gain or loss.
Testing was performed for each of the two types of foam in the following
order:
A. Empty Plexiglas chamber 1. Sound level readings
B. Clean SONEX 1. Sound level readings 2. Foam column weighing
C. Particulate layer 1 SONEX 1. Wood particulate soiling 2. Chamber cleaning 3. Sound level readings 4. Foam column weighing
D. Particulate layer 2 SONEX 1. Wood particulate soiling 2. Chamber cleaning 3. Sound level readings 4. Foam column weighing
E. Particulate layer 3 SONEX 1. Wood particulate soiling 2. Chamber cleaning 3. Sound level readings 4. Foam column weighing
28
3.2 Facility
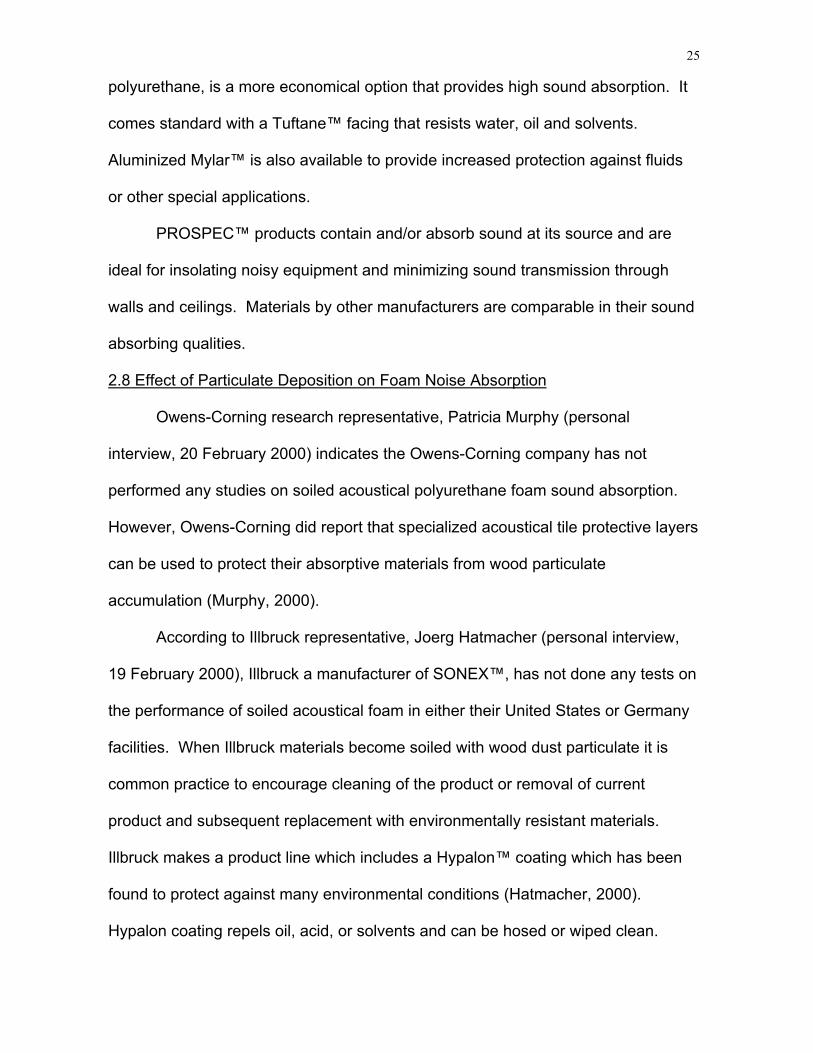
3.2.1 Experimental Chamber.
A cube chamber with side lengths of 2.44 meters was constructed of 0.635
centimeter-thick construction grade Plexiglas (Figure 3.1, 3.2 and 3.3). This
provided a total surface are of 35.7 m3. Two, 1.22 meters by 2.44 meters sheets
were used to create each of the four walls, ceiling and floor. One-half sheet of
Plexiglas served as the door on the front of the chamber measuring 1.22 meters by
1.22 meters. Clear silicone caulk was used to seal all of the joints between
Plexiglas panels to minimize wood particulate losses, control vibration of the
panels, and control air leaks. The panels were fastened every twelve inches along
the edges of the Plexiglas with screws to the wood framing.
29
Figure 3.1. Experimental chamber with positions of RTA, sound level meters, and particulate distribution equipment.
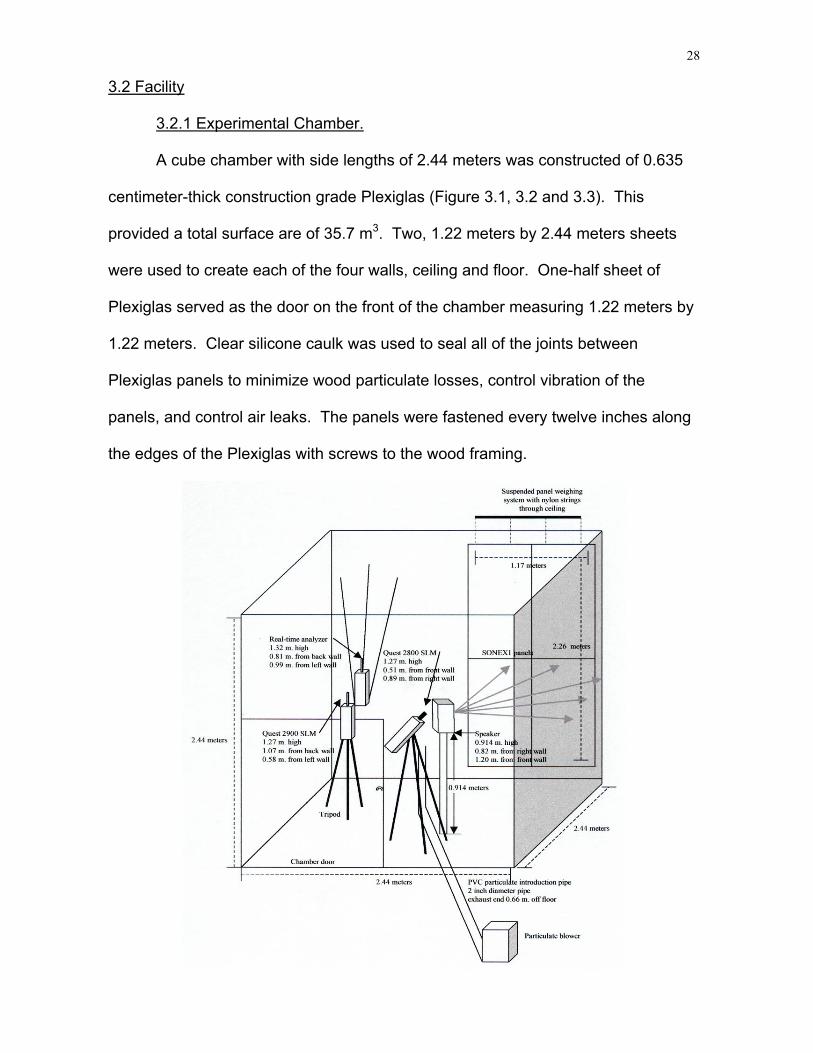
Figure 3.2. Chamber construction with Plexiglas sides, front access door, and particulate introduction pipe.
Figure 3.3. Corner of experimental chamber with fastening screws and silicone adhesion corner seal.
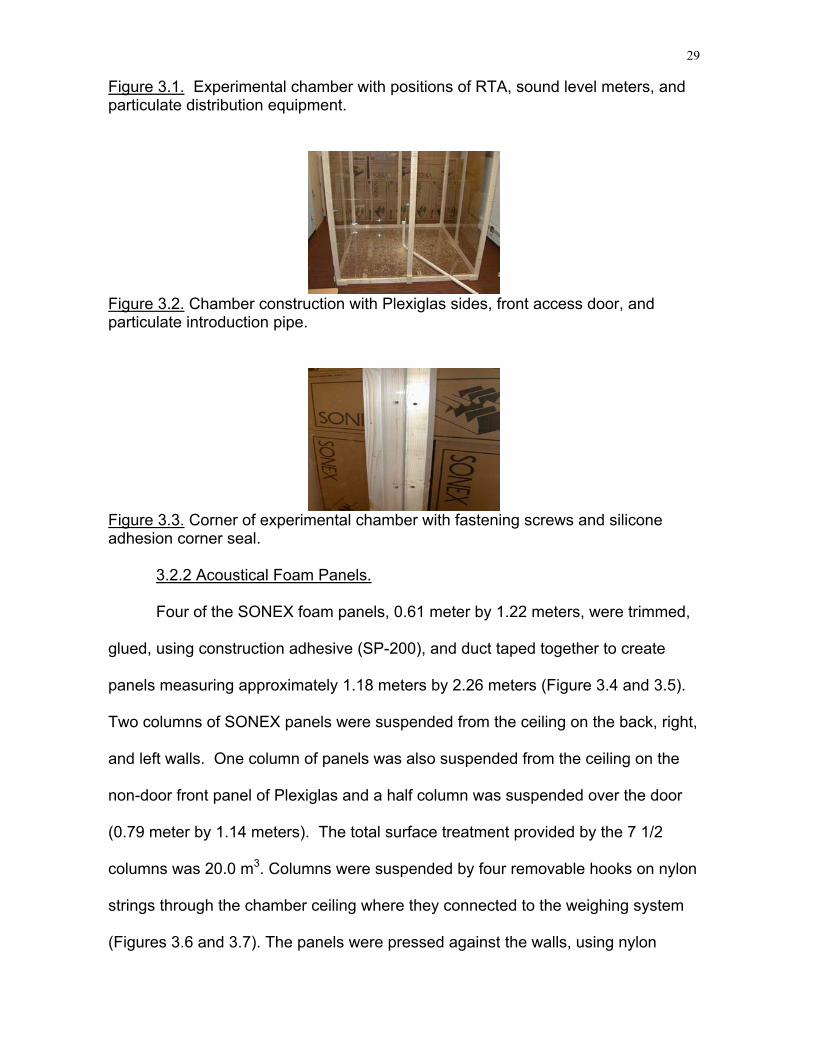
3.2.2 Acoustical Foam Panels.
Four of the SONEX foam panels, 0.61 meter by 1.22 meters, were trimmed,
glued, using construction adhesive (SP-200), and duct taped together to create
panels measuring approximately 1.18 meters by 2.26 meters (Figure 3.4 and 3.5).
Two columns of SONEX panels were suspended from the ceiling on the back, right,
and left walls. One column of panels was also suspended from the ceiling on the
non-door front panel of Plexiglas and a half column was suspended over the door
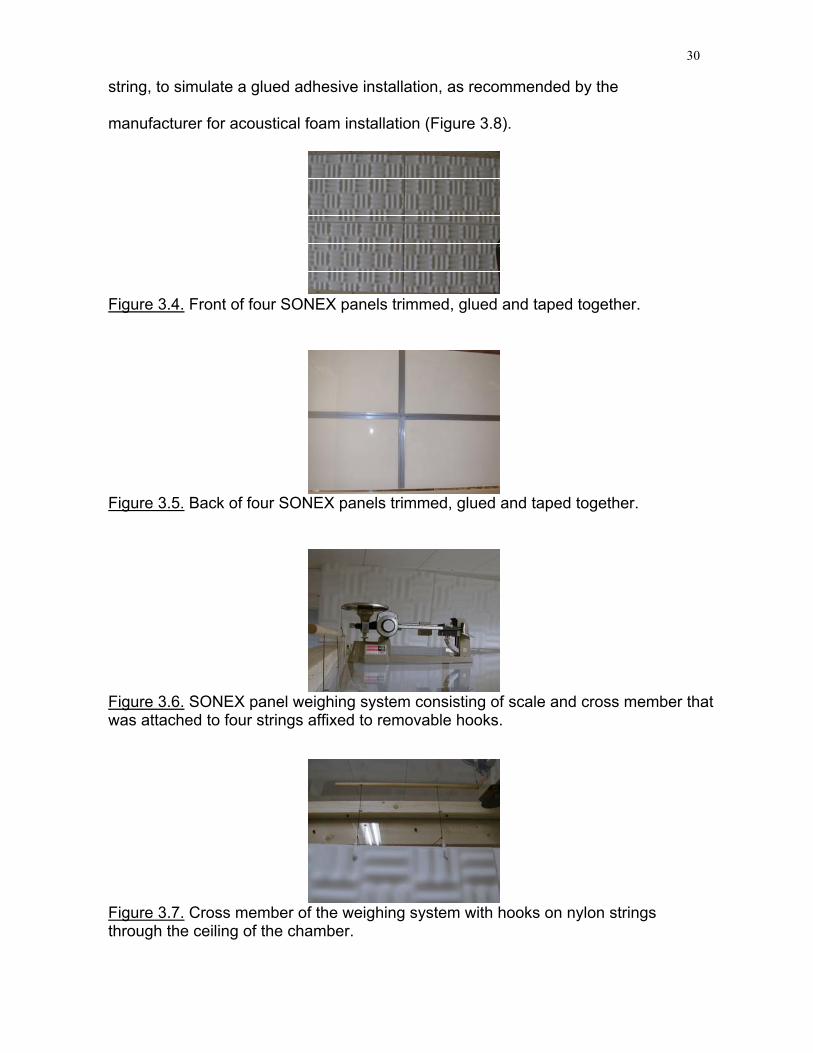
(0.79 meter by 1.14 meters). The total surface treatment provided by the 7 1/2
columns was 20.0 m3. Columns were suspended by four removable hooks on nylon
strings through the chamber ceiling where they connected to the weighing system
(Figures 3.6 and 3.7). The panels were pressed against the walls, using nylon
30
string, to simulate a glued adhesive installation, as recommended by the
manufacturer for acoustical foam installation (Figure 3.8).
Figure 3.4. Front of four SONEX panels trimmed, glued and taped together.
Figure 3.5. Back of four SONEX panels trimmed, glued and taped together.
Figure 3.6. SONEX panel weighing system consisting of scale and cross member that was attached to four strings affixed to removable hooks.
Figure 3.7. Cross member of the weighing system with hooks on nylon strings through the ceiling of the chamber.
31
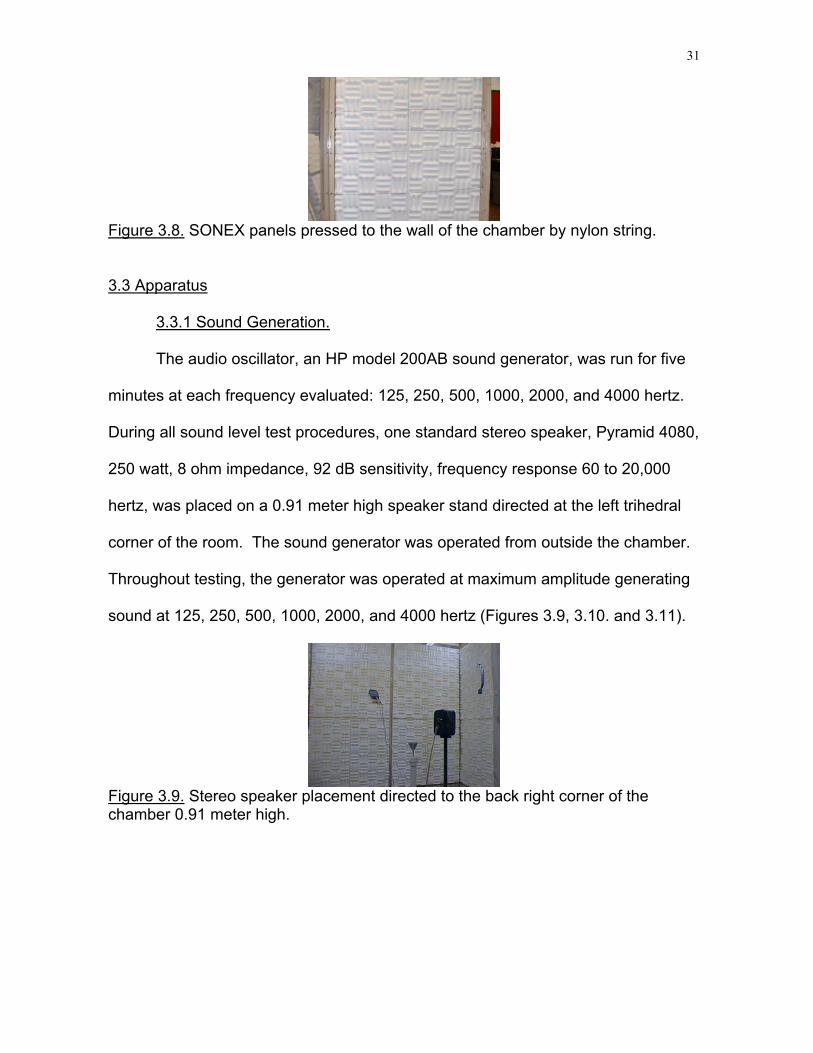
Figure 3.8. SONEX panels pressed to the wall of the chamber by nylon string.
3.3 Apparatus
3.3.1 Sound Generation.
The audio oscillator, an HP model 200AB sound generator, was run for five
minutes at each frequency evaluated: 125, 250, 500, 1000, 2000, and 4000 hertz.
During all sound level test procedures, one standard stereo speaker, Pyramid 4080,
250 watt, 8 ohm impedance, 92 dB sensitivity, frequency response 60 to 20,000
hertz, was placed on a 0.91 meter high speaker stand directed at the left trihedral
corner of the room. The sound generator was operated from outside the chamber.
Throughout testing, the generator was operated at maximum amplitude generating
sound at 125, 250, 500, 1000, 2000, and 4000 hertz (Figures 3.9, 3.10. and 3.11).
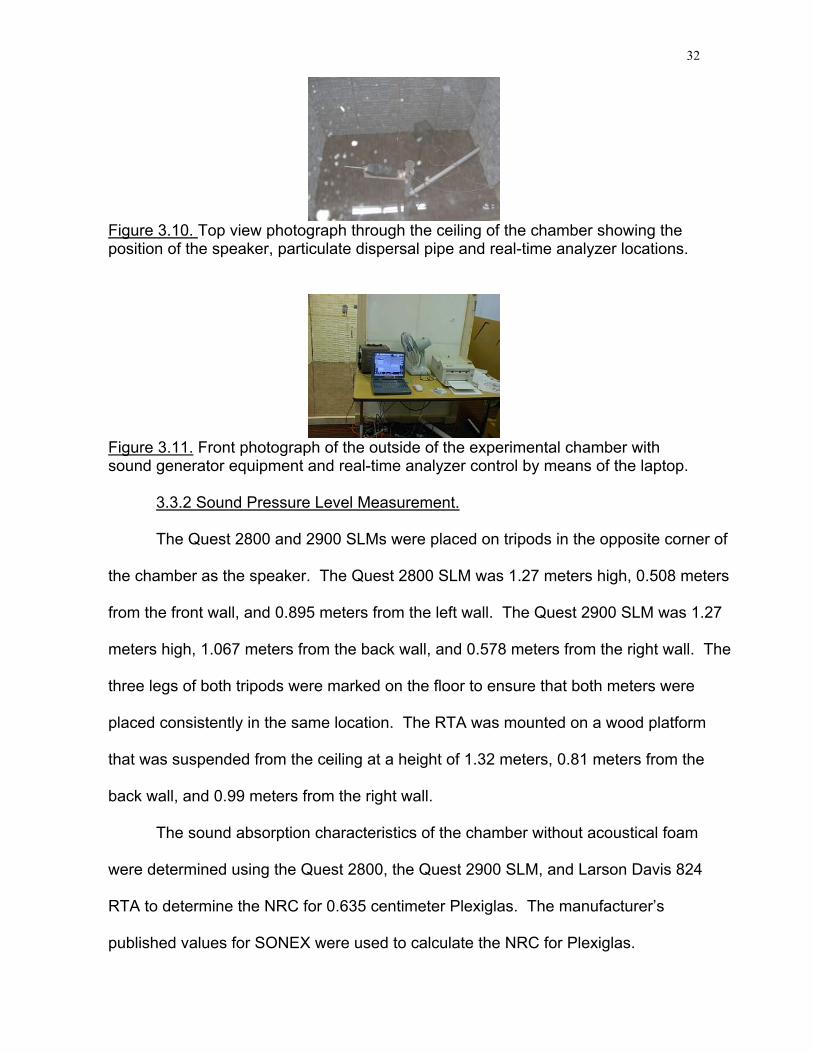
Figure 3.9. Stereo speaker placement directed to the back right corner of the chamber 0.91 meter high.
32
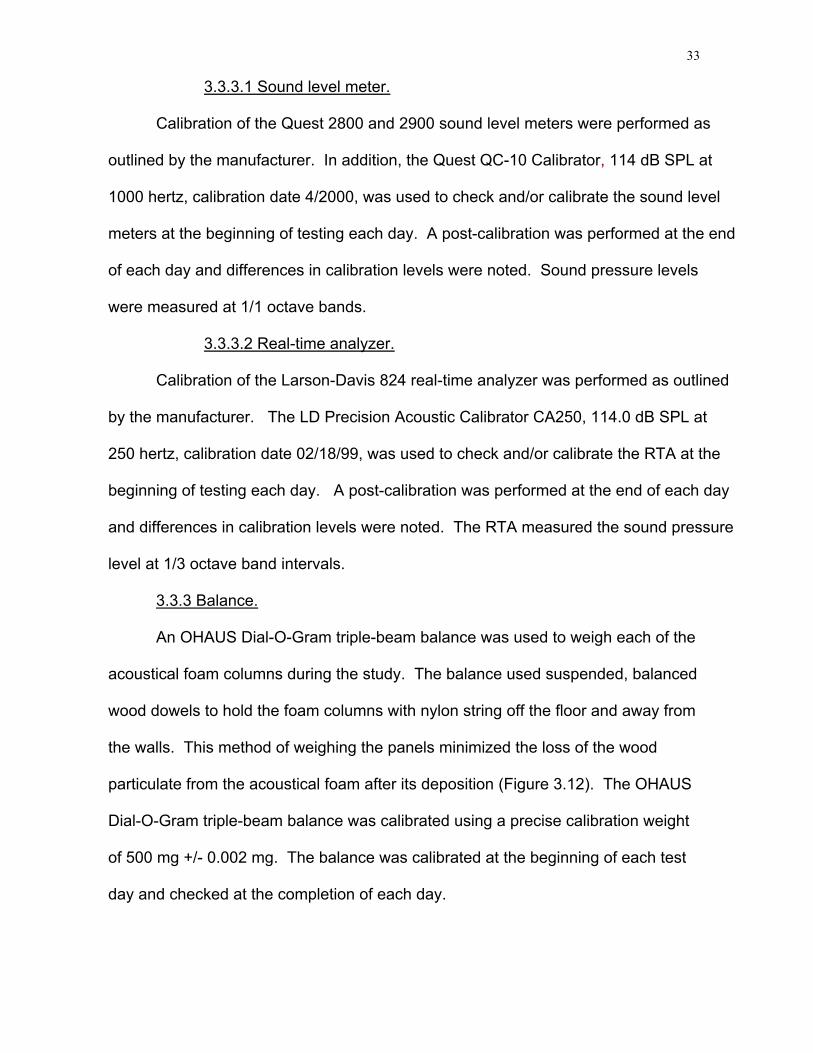
Figure 3.10. Top view photograph through the ceiling of the chamber showing the position of the speaker, particulate dispersal pipe and real-time analyzer locations.
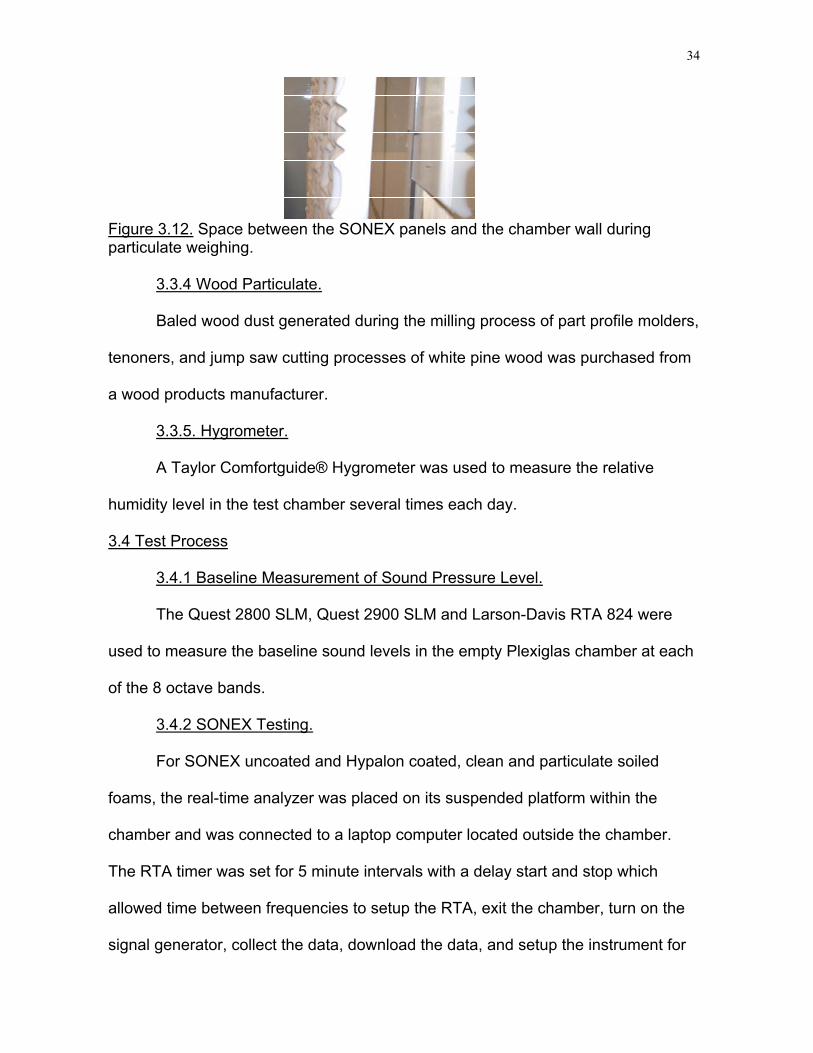
Figure 3.11. Front photograph of the outside of the experimental chamber with sound generator equipment and real-time analyzer control by means of the laptop.
3.3.2 Sound Pressure Level Measurement.
The Quest 2800 and 2900 SLMs were placed on tripods in the opposite corner of
the chamber as the speaker. The Quest 2800 SLM was 1.27 meters high, 0.508 meters
from the front wall, and 0.895 meters from the left wall. The Quest 2900 SLM was 1.27
meters high, 1.067 meters from the back wall, and 0.578 meters from the right wall. The
three legs of both tripods were marked on the floor to ensure that both meters were
placed consistently in the same location. The RTA was mounted on a wood platform
that was suspended from the ceiling at a height of 1.32 meters, 0.81 meters from the
back wall, and 0.99 meters from the right wall.
The sound absorption characteristics of the chamber without acoustical foam
were determined using the Quest 2800, the Quest 2900 SLM, and Larson Davis 824
RTA to determine the NRC for 0.635 centimeter Plexiglas. The manufacturer’s
published values for SONEX were used to calculate the NRC for Plexiglas.
33
3.3.3.1 Sound level meter.
Calibration of the Quest 2800 and 2900 sound level meters were performed as
outlined by the manufacturer. In addition, the Quest QC-10 Calibrator, 114 dB SPL at
1000 hertz, calibration date 4/2000, was used to check and/or calibrate the sound level
meters at the beginning of testing each day. A post-calibration was performed at the end
of each day and differences in calibration levels were noted. Sound pressure levels
were measured at 1/1 octave bands.
3.3.3.2 Real-time analyzer.
Calibration of the Larson-Davis 824 real-time analyzer was performed as outlined
by the manufacturer. The LD Precision Acoustic Calibrator CA250, 114.0 dB SPL at
250 hertz, calibration date 02/18/99, was used to check and/or calibrate the RTA at the
beginning of testing each day. A post-calibration was performed at the end of each day
and differences in calibration levels were noted. The RTA measured the sound pressure
level at 1/3 octave band intervals.
3.3.3 Balance.
An OHAUS Dial-O-Gram triple-beam balance was used to weigh each of the
acoustical foam columns during the study. The balance used suspended, balanced
wood dowels to hold the foam columns with nylon string off the floor and away from
the walls. This method of weighing the panels minimized the loss of the wood
particulate from the acoustical foam after its deposition (Figure 3.12). The OHAUS
Dial-O-Gram triple-beam balance was calibrated using a precise calibration weight
of 500 mg +/- 0.002 mg. The balance was calibrated at the beginning of each test
day and checked at the completion of each day.
34
Figure 3.12. Space between the SONEX panels and the chamber wall during particulate weighing.
3.3.4 Wood Particulate.
Baled wood dust generated during the milling process of part profile molders,
tenoners, and jump saw cutting processes of white pine wood was purchased from
a wood products manufacturer.
3.3.5. Hygrometer.
A Taylor Comfortguide® Hygrometer was used to measure the relative
humidity level in the test chamber several times each day.
3.4 Test Process
3.4.1 Baseline Measurement of Sound Pressure Level.
The Quest 2800 SLM, Quest 2900 SLM and Larson-Davis RTA 824 were
used to measure the baseline sound levels in the empty Plexiglas chamber at each
of the 8 octave bands.
3.4.2 SONEX Testing.
For SONEX uncoated and Hypalon coated, clean and particulate soiled
foams, the real-time analyzer was placed on its suspended platform within the
chamber and was connected to a laptop computer located outside the chamber.
The RTA timer was set for 5 minute intervals with a delay start and stop which
allowed time between frequencies to setup the RTA, exit the chamber, turn on the
signal generator, collect the data, download the data, and setup the instrument for
35
the next frequency. The Hewlett Packard Audio Oscillator, model 200AB, operated
from outside the chamber at 125, 250, 500, 1000, 2000, and 4000 hertz while the
RTA collected sound level data.
Initial sound absorbance tests were performed in the clean chamber on the
SONEX uncoated and Hypalon coated acoustical foam. After each set of
measurements the strings holding the acoustical foam against the walls of the
chamber were released allowing the columns to hang freely. Each foam panel was
weighed individually on the triple-beam balance system. While one researcher
weighed the columns from atop the chamber, the other ensured that the panels
hung freely for precise measurements. A set of sound pressure level
measurements were taken after the introduction of each particulate layer and after
cleaning the acoustical foam.
3.4.3 Wood Dust Deposition.
Three levels of wood particulate deposition were examined on two types of
acoustical foam, SONEX uncoated and Hypalon coated. The wood dust was
dispensed in the chamber using a vertical blast of air generated by a Paramount
PB150 single-speed leaf blower through 2” diameter PVC pipe. The air stream was
directed upward in the center of the floor using a 900 elbow in the PVC 0.66 meters
off the chamber floor with a funnel secured to the top to facilitate the dispersal of
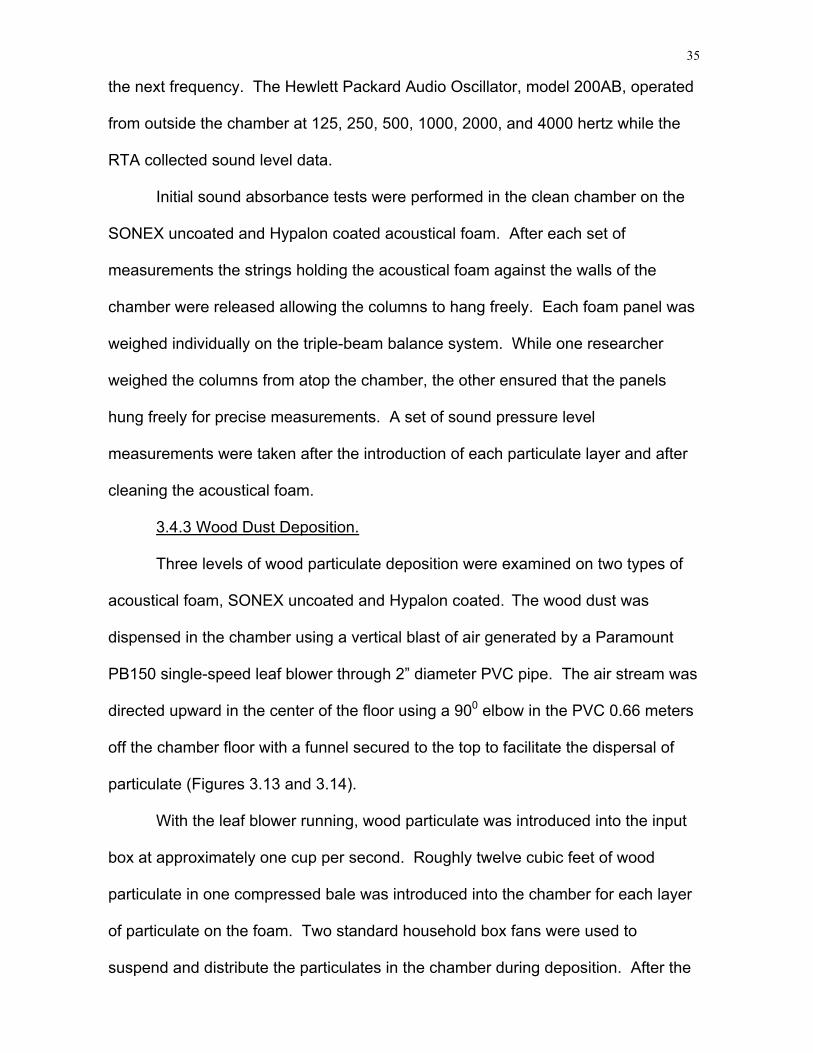
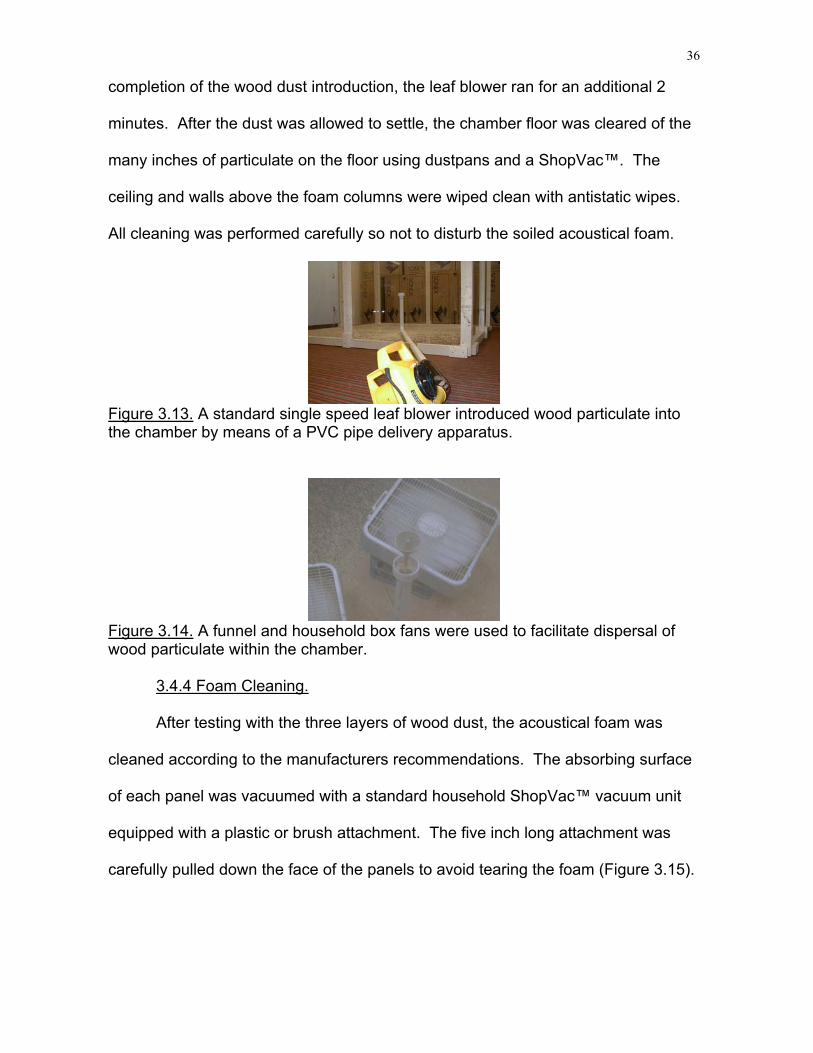
particulate (Figures 3.13 and 3.14).
With the leaf blower running, wood particulate was introduced into the input
box at approximately one cup per second. Roughly twelve cubic feet of wood
particulate in one compressed bale was introduced into the chamber for each layer
of particulate on the foam. Two standard household box fans were used to
suspend and distribute the particulates in the chamber during deposition. After the
36
completion of the wood dust introduction, the leaf blower ran for an additional 2
minutes. After the dust was allowed to settle, the chamber floor was cleared of the
many inches of particulate on the floor using dustpans and a ShopVac™. The
ceiling and walls above the foam columns were wiped clean with antistatic wipes.
All cleaning was performed carefully so not to disturb the soiled acoustical foam.
Figure 3.13. A standard single speed leaf blower introduced wood particulate into the chamber by means of a PVC pipe delivery apparatus.
Figure 3.14. A funnel and household box fans were used to facilitate dispersal of wood particulate within the chamber.
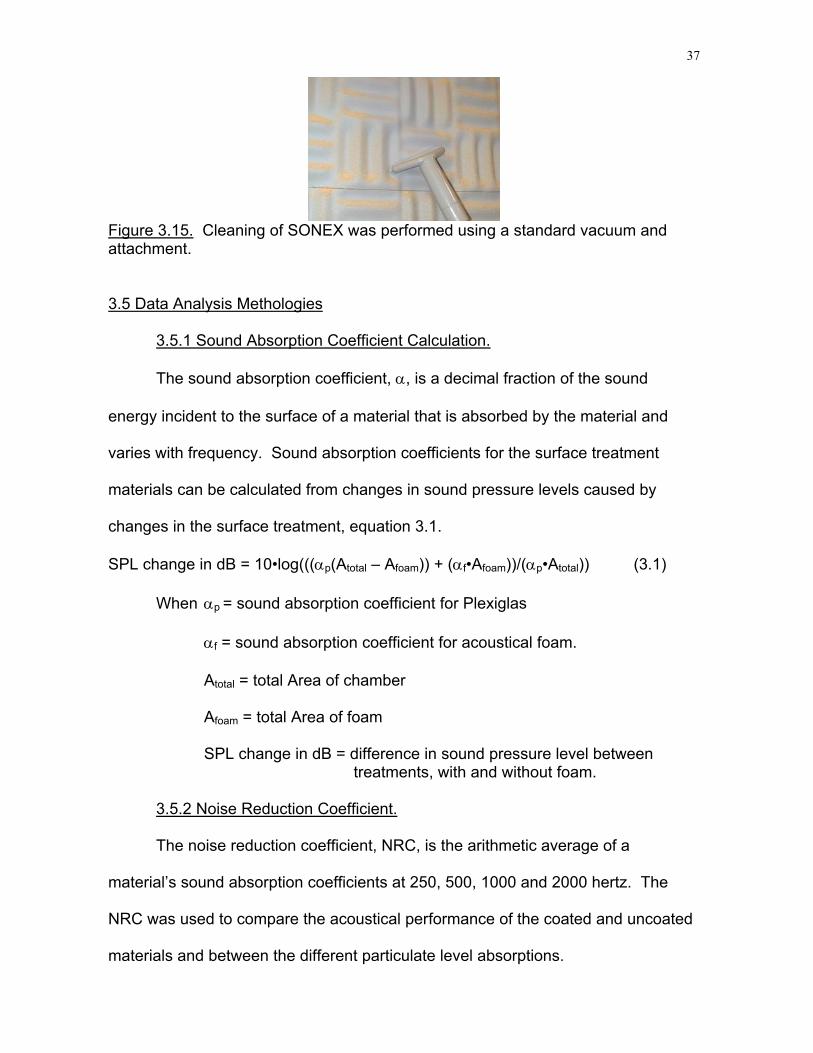
3.4.4 Foam Cleaning.
After testing with the three layers of wood dust, the acoustical foam was
cleaned according to the manufacturers recommendations. The absorbing surface
of each panel was vacuumed with a standard household ShopVac™ vacuum unit
equipped with a plastic or brush attachment. The five inch long attachment was
carefully pulled down the face of the panels to avoid tearing the foam (Figure 3.15).
37
Figure 3.15. Cleaning of SONEX was performed using a standard vacuum and attachment.
3.5 Data Analysis Methologies
3.5.1 Sound Absorption Coefficient Calculation.
The sound absorption coefficient, α, is a decimal fraction of the sound
energy incident to the surface of a material that is absorbed by the material and
varies with frequency. Sound absorption coefficients for the surface treatment
materials can be calculated from changes in sound pressure levels caused by
changes in the surface treatment, equation 3.1.
SPL change in dB = 10•log(((αp(Atotal – Afoam)) + (αf•Afoam))/(αp•Atotal)) (3.1)
When αp = sound absorption coefficient for Plexiglas
αf = sound absorption coefficient for acoustical foam.
Atotal = total Area of chamber
Afoam = total Area of foam
SPL change in dB = difference in sound pressure level between treatments, with and without foam.
3.5.2 Noise Reduction Coefficient.
The noise reduction coefficient, NRC, is the arithmetic average of a
material’s sound absorption coefficients at 250, 500, 1000 and 2000 hertz. The
NRC was used to compare the acoustical performance of the coated and uncoated
materials and between the different particulate level absorptions.
38
Chapter 4: Results and Discussion
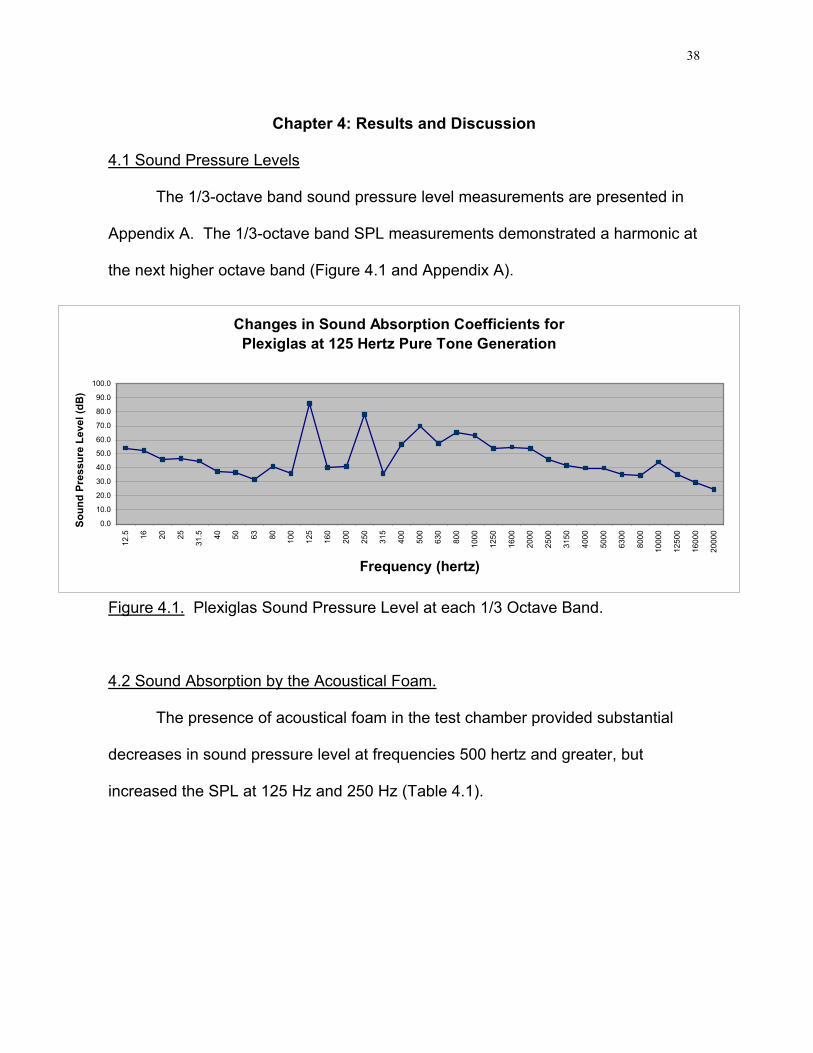
4.1 Sound Pressure Levels
The 1/3-octave band sound pressure level measurements are presented in
Appendix A. The 1/3-octave band SPL measurements demonstrated a harmonic at
the next higher octave band (Figure 4.1 and Appendix A).
Changes in Sound Absorption Coefficients for Plexiglas at 125 Hertz Pure Tone Generation
0.0
10.0
20.0
30.0
40.0
50.0
60.0
70.0
80.0
90.0
100.0
12.5 16 20 25
31.5 40 50 63 80 100
125
160
200
250
315
400
500
630
800
1000
1250
1600
2000
2500
3150
4000
5000
6300
8000
1000
0
1250
0
1600
0
2000
0
Frequency (hertz)
Soun
d Pr
essu
re L
evel
(dB
)
Figure 4.1. Plexiglas Sound Pressure Level at each 1/3 Octave Band.
4.2 Sound Absorption by the Acoustical Foam.
The presence of acoustical foam in the test chamber provided substantial
decreases in sound pressure level at frequencies 500 hertz and greater, but
increased the SPL at 125 Hz and 250 Hz (Table 4.1).
39
Table 4.1. Sound Pressure Levels in the Test Chamber (dB).
Frequency (hertz) 125 250 500 1000 2000 4000 Plexiglas1 84.9 80.1 92.4 95.1 93.5 94.2 Uncoated SONEX (clean) 88.4 91.2 70.9 71.4 65.8 76.9 Uncoated SONEX (layer 1) 88.6 91.4 71.3 68.5 70.2 71.3 Uncoated SONEX (layer 2) 88.5 91.3 71.1 70.0 71.4 74.5 Uncoated SONEX (layer 3) 86.3 90.1 71.9 69.3 73.7 69.0 Uncoated SONEX (cleaned) 85.2 89.6 72.0 72.2 70.9 75.1 Hypalon coated SONEX (clean) 86.5 89.3 64.9 71.6 69.1 66.6 Hypalon coated SONEX (layer 1) 86.5 89.2 62.1 73.2 69.1 69.6 Hypalon coated SONEX (layer 2) 86.8 88.9 62.5 70.0 68.5 75.1 Hypalon coated SONEX (layer 3) 87.0 89.5 60.9 75.7 65.7 59.8 Hypalon coated SONEX (cleaned) 87.1 89.1 64.3 71.9 69.9 71.9 1. Average of 3 trials.
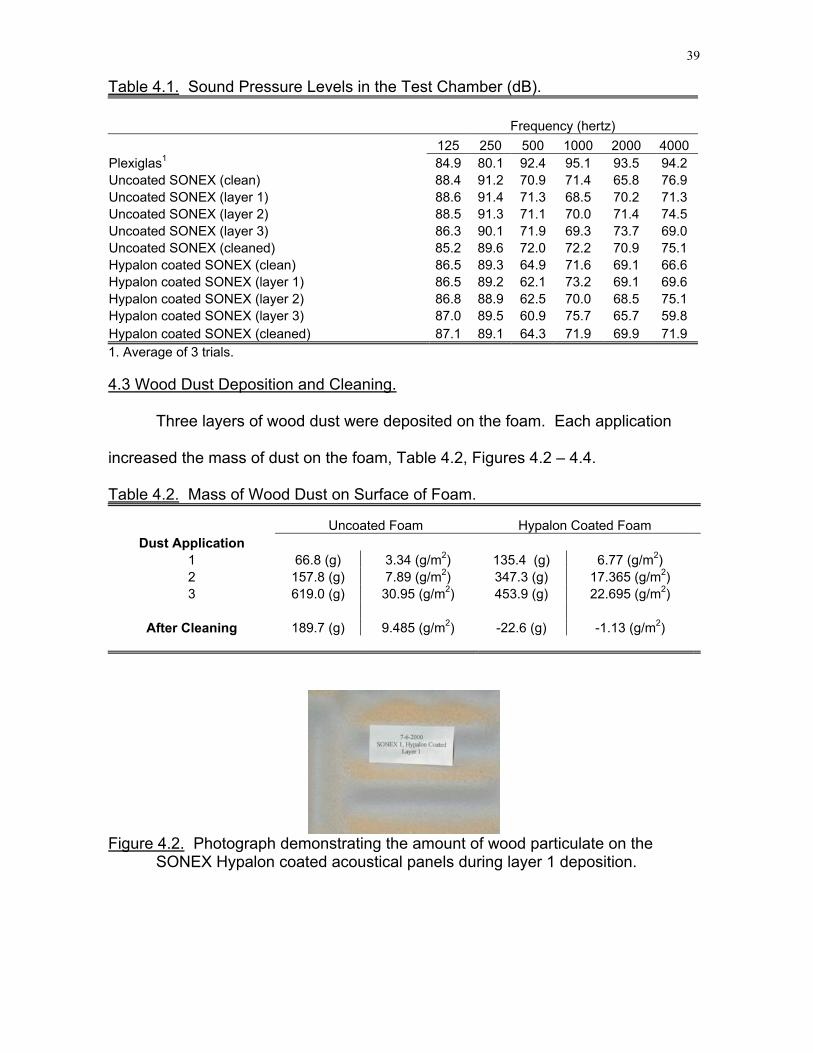
4.3 Wood Dust Deposition and Cleaning.
Three layers of wood dust were deposited on the foam. Each application
increased the mass of dust on the foam, Table 4.2, Figures 4.2 – 4.4.
Table 4.2. Mass of Wood Dust on Surface of Foam.
Uncoated Foam Hypalon Coated Foam Dust Application
1 66.8 (g) 3.34 (g/m2) 135.4 (g) 6.77 (g/m2) 2 157.8 (g) 7.89 (g/m2) 347.3 (g) 17.365 (g/m2) 3 619.0 (g) 30.95 (g/m2) 453.9 (g) 22.695 (g/m2)
After Cleaning 189.7 (g) 9.485 (g/m2) -22.6 (g) -1.13 (g/m2)
Figure 4.2. Photograph demonstrating the amount of wood particulate on the
SONEX Hypalon coated acoustical panels during layer 1 deposition.
40
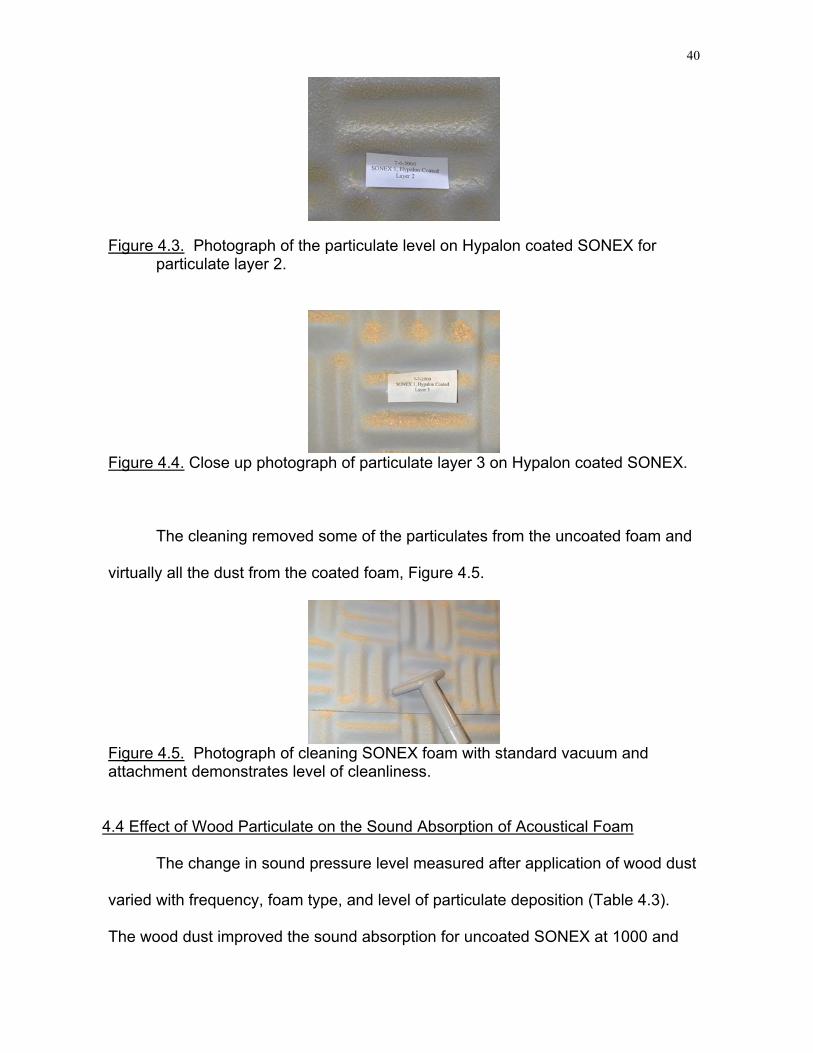
Figure 4.3. Photograph of the particulate level on Hypalon coated SONEX for particulate layer 2.
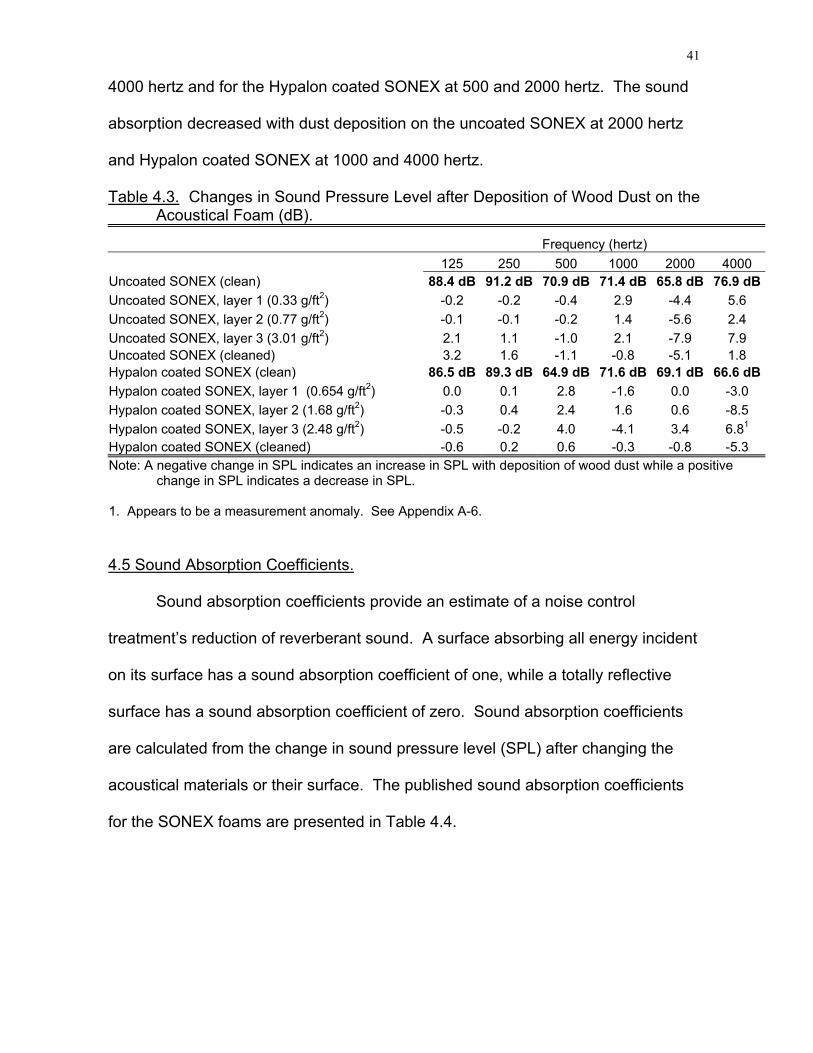
Figure 4.4. Close up photograph of particulate layer 3 on Hypalon coated SONEX.
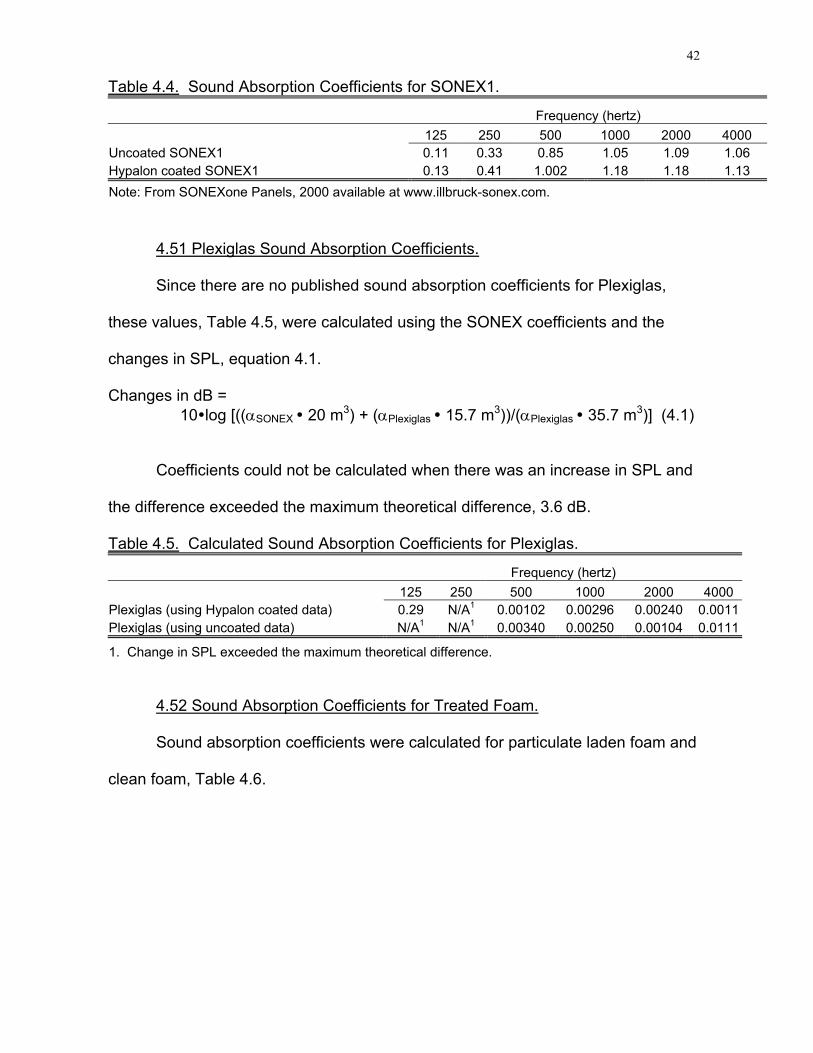
The cleaning removed some of the particulates from the uncoated foam and
virtually all the dust from the coated foam, Figure 4.5.
Figure 4.5. Photograph of cleaning SONEX foam with standard vacuum and attachment demonstrates level of cleanliness.
4.4 Effect of Wood Particulate on the Sound Absorption of Acoustical Foam
The change in sound pressure level measured after application of wood dust
varied with frequency, foam type, and level of particulate deposition (Table 4.3).
The wood dust improved the sound absorption for uncoated SONEX at 1000 and
41
4000 hertz and for the Hypalon coated SONEX at 500 and 2000 hertz. The sound
absorption decreased with dust deposition on the uncoated SONEX at 2000 hertz
and Hypalon coated SONEX at 1000 and 4000 hertz.
Table 4.3. Changes in Sound Pressure Level after Deposition of Wood Dust on the Acoustical Foam (dB).
Frequency (hertz) 125 250 500 1000 2000 4000 Uncoated SONEX (clean) 88.4 dB 91.2 dB 70.9 dB 71.4 dB 65.8 dB 76.9 dBUncoated SONEX, layer 1 (0.33 g/ft2) -0.2 -0.2 -0.4 2.9 -4.4 5.6 Uncoated SONEX, layer 2 (0.77 g/ft2) -0.1 -0.1 -0.2 1.4 -5.6 2.4 Uncoated SONEX, layer 3 (3.01 g/ft2) 2.1 1.1 -1.0 2.1 -7.9 7.9 Uncoated SONEX (cleaned) 3.2 1.6 -1.1 -0.8 -5.1 1.8 Hypalon coated SONEX (clean) 86.5 dB 89.3 dB 64.9 dB 71.6 dB 69.1 dB 66.6 dBHypalon coated SONEX, layer 1 (0.654 g/ft2) 0.0 0.1 2.8 -1.6 0.0 -3.0 Hypalon coated SONEX, layer 2 (1.68 g/ft2) -0.3 0.4 2.4 1.6 0.6 -8.5 Hypalon coated SONEX, layer 3 (2.48 g/ft2) -0.5 -0.2 4.0 -4.1 3.4 6.81
Hypalon coated SONEX (cleaned) -0.6 0.2 0.6 -0.3 -0.8 -5.3 Note: A negative change in SPL indicates an increase in SPL with deposition of wood dust while a positive
change in SPL indicates a decrease in SPL. 1. Appears to be a measurement anomaly. See Appendix A-6.
4.5 Sound Absorption Coefficients.
Sound absorption coefficients provide an estimate of a noise control
treatment’s reduction of reverberant sound. A surface absorbing all energy incident
on its surface has a sound absorption coefficient of one, while a totally reflective
surface has a sound absorption coefficient of zero. Sound absorption coefficients
are calculated from the change in sound pressure level (SPL) after changing the
acoustical materials or their surface. The published sound absorption coefficients
for the SONEX foams are presented in Table 4.4.
42
Table 4.4. Sound Absorption Coefficients for SONEX1.
Frequency (hertz) 125 250 500 1000 2000 4000 Uncoated SONEX1 0.11 0.33 0.85 1.05 1.09 1.06 Hypalon coated SONEX1 0.13 0.41 1.002 1.18 1.18 1.13 Note: From SONEXone Panels, 2000 available at www.illbruck-sonex.com.
4.51 Plexiglas Sound Absorption Coefficients.
Since there are no published sound absorption coefficients for Plexiglas,
these values, Table 4.5, were calculated using the SONEX coefficients and the
changes in SPL, equation 4.1.
Changes in dB = 10 log [((αSONEX 20 m3) + (αPlexiglas 15.7 m3))/(αPlexiglas 35.7 m3)] (4.1)
Coefficients could not be calculated when there was an increase in SPL and
the difference exceeded the maximum theoretical difference, 3.6 dB.
Table 4.5. Calculated Sound Absorption Coefficients for Plexiglas.
Frequency (hertz) 125 250 500 1000 2000 4000 Plexiglas (using Hypalon coated data) 0.29 N/A1 0.00102 0.00296 0.00240 0.0011Plexiglas (using uncoated data) N/A1 N/A1 0.00340 0.00250 0.00104 0.0111
1. Change in SPL exceeded the maximum theoretical difference.
4.52 Sound Absorption Coefficients for Treated Foam.
Sound absorption coefficients were calculated for particulate laden foam and
clean foam, Table 4.6.
43
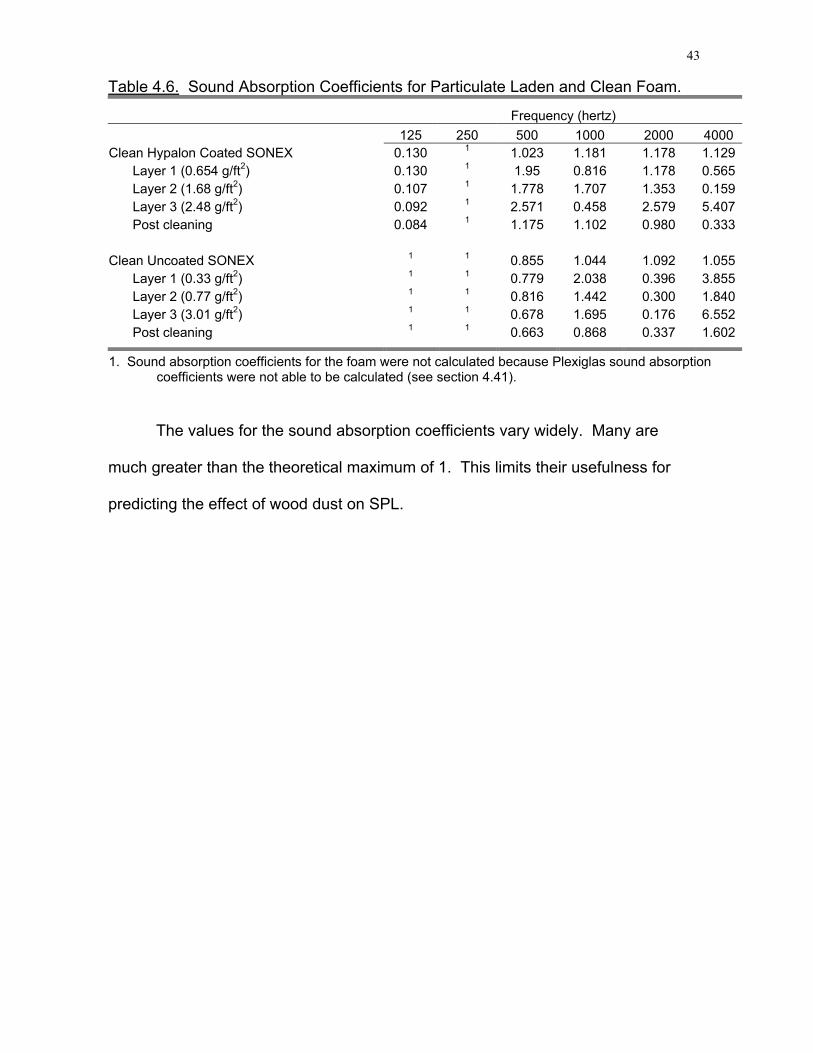
Table 4.6. Sound Absorption Coefficients for Particulate Laden and Clean Foam.
Frequency (hertz) 125 250 500 1000 2000 4000 Clean Hypalon Coated SONEX 0.130 1 1.023 1.181 1.178 1.129
Layer 1 (0.654 g/ft2) 0.130 1 1.95 0.816 1.178 0.565Layer 2 (1.68 g/ft2) 0.107 1 1.778 1.707 1.353 0.159Layer 3 (2.48 g/ft2) 0.092 1 2.571 0.458 2.579 5.407Post cleaning 0.084 1 1.175 1.102 0.980 0.333
Clean Uncoated SONEX 1 1 0.855 1.044 1.092 1.055
Layer 1 (0.33 g/ft2) 1 1 0.779 2.038 0.396 3.855Layer 2 (0.77 g/ft2) 1 1 0.816 1.442 0.300 1.840Layer 3 (3.01 g/ft2) 1 1 0.678 1.695 0.176 6.552Post cleaning 1 1 0.663 0.868 0.337 1.602
1. Sound absorption coefficients for the foam were not calculated because Plexiglas sound absorption coefficients were not able to be calculated (see section 4.41).
The values for the sound absorption coefficients vary widely. Many are
much greater than the theoretical maximum of 1. This limits their usefulness for
predicting the effect of wood dust on SPL.
44
Chapter 5: Conclusions and Recommendations
5.1 Conclusion to Objective One
Objective one for the experimental study was to measure the particulate
deposition affects on the sound absorption characteristics of uncoated and Hypalon
coated melomine foam by determining if αclean foam - αsoiled foam = 0, where α is the
Noise Reduction Coefficient (NRC).
The variations in the calculated sound absorption coefficients prevent this
evaluation. In general, however, the sound absorption by the two types of SONEX
foam were affected by the presence of wood particulate. A decrease in sound
absorption was observed with an increase in particulate deposition for uncoated
SONEX at 2000 Hz and Hypalon coated SONEX at 1000 Hz and 4000 Hz. Wood
dust deposition appeared to increase the sound absorption for uncoated SONEX at
1000 and 4000 Hz and for Hypalon Coated SONEX at 500 and 2000 Hz.
5.2 Conclusion to Objective Two
Objective two for the experimental study was to determine the effectiveness of
cleaning methods for both Hypalon coated and uncoated SONEX Willtec™ foam
panels in terms of noise absorption effects.
The cleaning methods recommended by the manufacturer of SONEX are
effective for removing the wood dust. Vacuuming removed substantial quantities of
wood dust.
The sound absorption coefficients after cleaning were nearly equal to the
clean foam for the Hypalon coated foam. The uncoated SONEX experienced larger
differences in coefficients and had residual particulate mass equal to two
applications. This was due to difficulties in removing particulates from the pore
45
spaces. The Hypalon coating effectively blocked the particles from entering sound
absorbing pore spaces and made the foam easier to clean.
5.3 Positive Attributes of the Study Recommended for Future Investigation
The experimental study had many affective attributes that are recommended
in future studies in this area. The recommendations include the areas of chamber
construction, particulate dispersal, weighing systems and recording sound levels.
5.3.1 Chamber construction
The 0.25-inch Plexiglas construction was beneficial during the study. The
clear chamber allowed a clear line of vision into the chamber to observe particulate
dispersal, column movement from air turbulence, chamber cleanliness before and
after cleaning, and allow photographing opportunities. While observing the
particulate dispersal, the flow-rate and direction of particulate projection could be
adjusted to accommodate physical conditions within the chamber without
continuously interrupting the procedures to check the conditions. The ability to see
behind the foam columns, which were pressed against the chamber walls, allowed
any particulate forced behind the panels to be accounted for during the weighing
process without moving the panels. One drawback to 0.635 cm thick Plexiglas is
the unavailability of published sound absorption coefficients.
5.3.2 Particulate dispersal
The modified leaf-blower particulate dispersal system described in chapter
three was an affective means of introducing the particulate into the chamber in a
manner representative of industry occurrences. The system allowed small
particulate matter to remain airborne for longer periods and settle on the acoustical
foam and allowed larger particles to settle to the bottom of the chamber. Additional
vertically positioned box fans were used to assist the dispersal system in directing
46
smaller particulate matter back toward the acoustical foam until the desired
particulate levels were achieved.
5.3.3 Weighing system
The triple-beam balance weighing system performed beyond the
expectations anticipated in the study. The free-hanging acoustical foam columns
were weighed to the nearest 1/100th of a gram with ease and accuracy. The triple-
beam balance was easy to use, calibrate, and presented a moveable device for
measurement. The “fish-hook” hangers used to hold the foam columns from the
wooden dowel crossbar made foam changing timely, were lightweight, and added
adjustability to balance the acoustical columns.
5.3.4 Sound level recording
The real-time analyzer used to record sound levels allowed for timely and
accurate measurements. The ability to analyze the needed frequencies during the
same time frame added accuracy to sound level recording and decreased the
likelihood of sound level generation variation. The computer interface allowed for
data transfer and equipment setup without disturbing the particulate in the chamber.
5.4 Recognized Errors in Study
5.4.1 Effects of humidity on sound absorption
During the study, the humidity within the room was not controlled with either
dehumidifiers or humidifiers. Each day of testing, the humidity was measured with
a humidistat and recorded. It is unknown what, if any, effect the humidity within the
room and within the foam had on its sound absorption coefficient. The humidity did
have affects on the sum of the foam column weights, which affected the perceived
amount of wood particulate on the foam. For this reason, the sound absorption
47
coefficients were not used within a ratio to the amount of wood particulate on the
foam.
5.4.2 Equality of wood particulate levels on both foams
During the introduction of wood dust into the chamber for application on the
two types of foam, the particulate was added to each level by visual equality, not
measured weight equality. For example, layer one particulate on the uncoated
foam was 66.8 grams, which was visually comparable to 135.4 grams on the
Hypalon coated foam. The goal during particulate deposition was to obtain three
distinct levels of particulate significantly different from the previous layer, but
visually comparable between foam types.
5.4.3 Validity from repeated trials
Each of the two foams was measured with the real-time analyzer for a five-
minute interval for each layer of wood particulate. During the study, a repeated
sound analysis was not performed which would be used to validate the first. This
resulted in the inability to make valid conclusions as to the performance of
acoustical foam under wood particulate soiled conditions. With three
measurements to determine the sound absorption coefficient of Plexiglas, two types
of foam, three layers of particulate, a pre-soiled measurement, and a post-clean
sound analysis, the tasks of sound analysis, acoustical foam weighing and chamber
cleaning became cumbersome. Continued research should focus on study
repeatability and a narrowed scope of evaluation. The study sampled over a
significant amount of time to collect sound levels for specific layers on the day of
testing. Because, temperature and humidity levels were not controlled,
questionability of the results arose when measurements were taken on days when
48
the weather conditions had significant differences. Repeated trials would help to
clarify some of the concerns regarding the effects of environmental conditions.
5.4.4. Unavailability of Plexiglas Sound Absorption Coefficient
Because published values for the sound absorption coefficient of 6.38 mm
thick Plexiglas could not be found, the coefficients used for Plexiglas in the
calculation of soiled acoustical foam sound absorption coefficients were based on
manufacturer published values for foam to calculate those of Plexiglas. This
oversight and the lack of replicate sampling precluded calculating sound reduction
coefficients which could be applied to other situations.
5.5 Recommended Continued Work in Areas Not Addressed in Study
5.5.1 Environmental conditions
As mentioned in the “Recognized Errors in the Study” section, continued
studies should control the environmental conditions during the study of acoustical
foam. A simple humidifier/dehumidifier would accommodate this factor.
One area for continued work is to determine the effects of temperature and
humidity on the performance of acoustical foam. The American Conference for
Governmental Industrial Hygienists has created a noise reduction coefficient for air
at 50% relative humidity only.
5.5.2 Particulate Type and Size
Wood particulate from one manufacturing process within a wood-processing
manufacturer was used during the study. The particulate varied in size from fine
dust to course wood shavings. During the application of wood particulate on the
sound-absorbing surface of the foam, the fine dust particles settled more
predominately on the foam while the course particles either settled out before
49
reaching the foam or bounced off the foam. The settling out of large particles is
consistent with conditions found within wood manufacturing settings.
Continued studies should focus on a specific size of wood particulate.
Studies should also pre-determine wood differences, wood moisture content, and
additional types of dust.
5.5.3 Sound Intensity
The voltage of the signal applied to the speaker was not evaluated in this
study. It should be consistent and recorded.
5.5.4 Decay Times
Sound absorption coefficients can be measured using reverberation decay
times. Future studies should consider using standard methods, ASTM C423-66
(Standard Method of Test for Sound Absorption of Acoustical Materials in
Reverberation Room) and ISO R354 (Measurement of Absorption Coefficients in a
Reverberation Room).
50
Appendix A: 1/3-Octave Band Sound Pressure Levels Measured in the Test Chamber
Table A-1: Sound Pressure Levels During 125 Hz Pure Tone Generation............ 51 Table A-2: Sound Pressure Levels During 250 Hz Pure Tone Generation............ 52 Table A-3: Sound Pressure Levels During 500 Hz Pure Tone Generation............ 53 Table A-4: Sound Pressure Levels During 1000 Hz Pure Tone Generation.......... 54 Table A-5: Sound Pressure Levels During 2000 Hz Pure Tone Generation.......... 55 Table A-6: Sound Pressure Levels During 4000 Hz Pure Tone Generation.......... 56
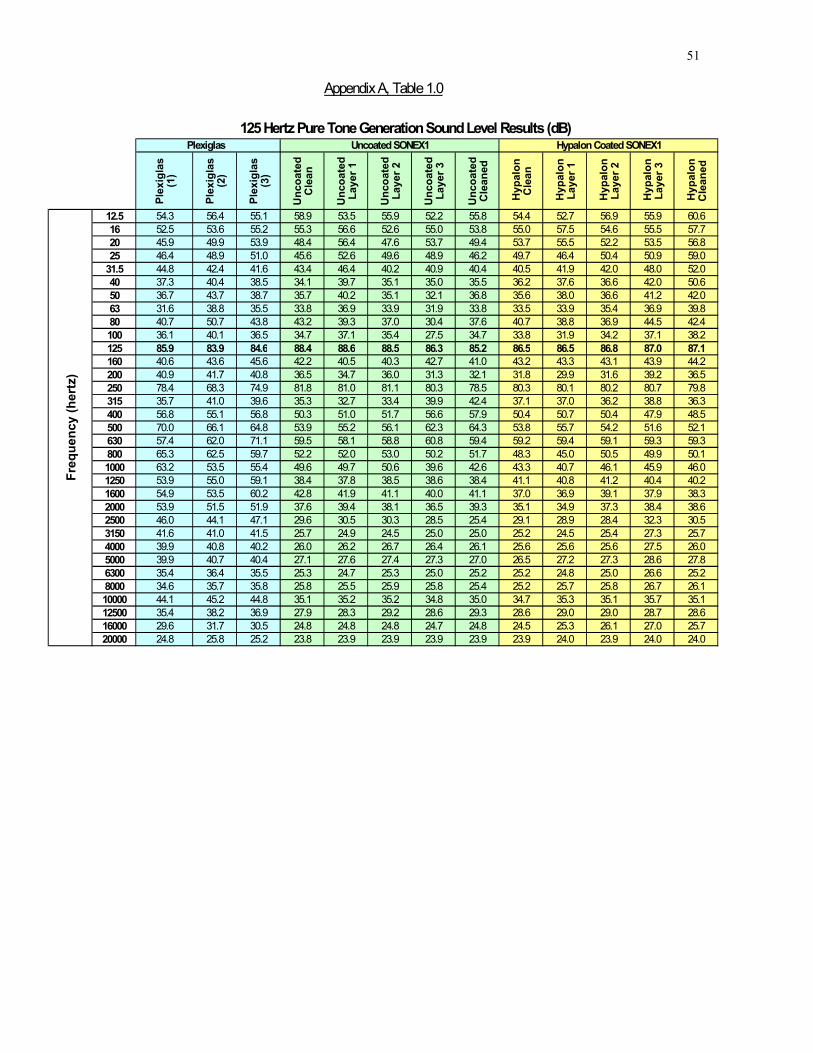
51
Plex
igla
s (1
)
Plex
igla
s (2
)
Plex
igla
s (3
)
Unc
oate
d C
lean
Unc
oate
d La
yer 1
Unc
oate
d La
yer 2
Unc
oate
d La
yer 3
Unc
oate
d C
lean
ed
Hyp
alon
C
lean
Hyp
alon
La
yer 1
Hyp
alon
La
yer 2
Hyp
alon
La
yer 3
Hyp
alon
C
lean
ed
12.5 54.3 56.4 55.1 58.9 53.5 55.9 52.2 55.8 54.4 52.7 56.9 55.9 60.616 52.5 53.6 55.2 55.3 56.6 52.6 55.0 53.8 55.0 57.5 54.6 55.5 57.720 45.9 49.9 53.9 48.4 56.4 47.6 53.7 49.4 53.7 55.5 52.2 53.5 56.825 46.4 48.9 51.0 45.6 52.6 49.6 48.9 46.2 49.7 46.4 50.4 50.9 59.0
31.5 44.8 42.4 41.6 43.4 46.4 40.2 40.9 40.4 40.5 41.9 42.0 48.0 52.040 37.3 40.4 38.5 34.1 39.7 35.1 35.0 35.5 36.2 37.6 36.6 42.0 50.650 36.7 43.7 38.7 35.7 40.2 35.1 32.1 36.8 35.6 38.0 36.6 41.2 42.063 31.6 38.8 35.5 33.8 36.9 33.9 31.9 33.8 33.5 33.9 35.4 36.9 39.880 40.7 50.7 43.8 43.2 39.3 37.0 30.4 37.6 40.7 38.8 36.9 44.5 42.4100 36.1 40.1 36.5 34.7 37.1 35.4 27.5 34.7 33.8 31.9 34.2 37.1 38.2125 85.9 83.9 84.6 88.4 88.6 88.5 86.3 85.2 86.5 86.5 86.8 87.0 87.1160 40.6 43.6 45.6 42.2 40.5 40.3 42.7 41.0 43.2 43.3 43.1 43.9 44.2200 40.9 41.7 40.8 36.5 34.7 36.0 31.3 32.1 31.8 29.9 31.6 39.2 36.5250 78.4 68.3 74.9 81.8 81.0 81.1 80.3 78.5 80.3 80.1 80.2 80.7 79.8315 35.7 41.0 39.6 35.3 32.7 33.4 39.9 42.4 37.1 37.0 36.2 38.8 36.3400 56.8 55.1 56.8 50.3 51.0 51.7 56.6 57.9 50.4 50.7 50.4 47.9 48.5500 70.0 66.1 64.8 53.9 55.2 56.1 62.3 64.3 53.8 55.7 54.2 51.6 52.1630 57.4 62.0 71.1 59.5 58.1 58.8 60.8 59.4 59.2 59.4 59.1 59.3 59.3800 65.3 62.5 59.7 52.2 52.0 53.0 50.2 51.7 48.3 45.0 50.5 49.9 50.11000 63.2 53.5 55.4 49.6 49.7 50.6 39.6 42.6 43.3 40.7 46.1 45.9 46.01250 53.9 55.0 59.1 38.4 37.8 38.5 38.6 38.4 41.1 40.8 41.2 40.4 40.21600 54.9 53.5 60.2 42.8 41.9 41.1 40.0 41.1 37.0 36.9 39.1 37.9 38.32000 53.9 51.5 51.9 37.6 39.4 38.1 36.5 39.3 35.1 34.9 37.3 38.4 38.62500 46.0 44.1 47.1 29.6 30.5 30.3 28.5 25.4 29.1 28.9 28.4 32.3 30.53150 41.6 41.0 41.5 25.7 24.9 24.5 25.0 25.0 25.2 24.5 25.4 27.3 25.74000 39.9 40.8 40.2 26.0 26.2 26.7 26.4 26.1 25.6 25.6 25.6 27.5 26.05000 39.9 40.7 40.4 27.1 27.6 27.4 27.3 27.0 26.5 27.2 27.3 28.6 27.86300 35.4 36.4 35.5 25.3 24.7 25.3 25.0 25.2 25.2 24.8 25.0 26.6 25.28000 34.6 35.7 35.8 25.8 25.5 25.9 25.8 25.4 25.2 25.7 25.8 26.7 26.110000 44.1 45.2 44.8 35.1 35.2 35.2 34.8 35.0 34.7 35.3 35.1 35.7 35.112500 35.4 38.2 36.9 27.9 28.3 29.2 28.6 29.3 28.6 29.0 29.0 28.7 28.616000 29.6 31.7 30.5 24.8 24.8 24.8 24.7 24.8 24.5 25.3 26.1 27.0 25.720000 24.8 25.8 25.2 23.8 23.9 23.9 23.9 23.9 23.9 24.0 23.9 24.0 24.0
Appendix A, Table 1.0Fr
eque
ncy
(her
tz)
Uncoated SONEX1 Hypalon Coated SONEX1125 Hertz Pure Tone Generation Sound Level Results (dB)
Plexiglas

52
Plex
igla
s (1
)
Plex
igla
s (2
)
Plex
igla
s (3
)
Unc
oate
d C
lean
Unc
oate
d La
yer 1
Unc
oate
d La
yer 2
Unc
oate
d La
yer 3
Unc
oate
d C
lean
ed
Hyp
alon
C
lean
Hyp
alon
La
yer 1
Hyp
alon
La
yer 2
Hyp
alon
La
yer 3
Hyp
alon
C
lean
ed
12.5 55.1 56.0 55.3 59.4 53.9 55.9 52.4 56.2 55.9 52.8 55.4 51.0 61.516 52.4 53.5 55.1 55.7 55.3 52.8 54.9 54.1 55.1 57.6 52.2 51.3 58.520 46.3 49.0 53.5 49.3 55.9 47.5 53.6 50.9 53.8 55.9 49.8 50.6 57.725 46.5 46.3 50.5 47.5 55.2 49.5 49.1 47.7 49.9 46.8 49.8 49.2 60.4
31.5 44.8 40.4 42.5 44.9 46.0 41.0 41.4 40.8 40.7 42.0 42.8 42.9 63.340 38.6 36.1 38.5 36.2 39.5 36.1 34.1 37.1 35.6 37.4 37.0 37.5 55.650 41.6 37.6 36.9 39.6 38.6 45.1 31.2 36.5 35.7 37.7 36.6 36.6 46.163 34.7 34.0 35.9 34.6 37.0 34.5 31.8 34.6 34.4 40.9 35.9 33.1 41.980 40.9 35.8 40.4 39.0 37.5 34.3 32.1 36.5 41.5 38.3 42.8 37.0 48.5100 33.8 32.5 32.8 32.0 31.1 31.3 27.3 29.9 30.3 32.5 32.1 31.2 41.8125 37.0 35.8 36.8 38.4 38.9 39.4 37.9 37.1 37.5 41.3 37.4 37.0 40.1160 38.9 36.9 40.1 35.1 34.7 38.2 30.1 32.5 31.3 34.1 33.3 29.7 38.8200 39.4 34.8 37.3 32.4 31.4 38.9 35.2 36.2 33.8 40.3 33.3 31.8 36.1250 81.9 78.9 78.8 91.2 91.4 91.3 90.1 89.6 89.3 89.2 88.9 89.5 89.1315 40.3 36.0 40.0 46.9 47.3 47.5 45.0 44.5 44.2 44.3 44.3 44.6 44.1400 37.0 35.1 39.3 28.6 29.0 34.8 29.8 28.1 23.1 28.7 28.5 25.5 27.0500 82.7 77.2 77.8 73.4 73.6 73.3 74.7 75.7 69.4 70.1 70.6 69.5 70.2630 50.2 52.2 50.4 36.9 37.0 37.6 40.7 40.6 38.7 38.4 37.9 38.3 38.7800 70.2 69.7 66.6 54.7 55.4 54.9 57.3 57.3 56.0 55.8 56.0 55.9 55.81000 63.6 72.2 63.9 51.6 51.9 51.6 52.4 53.1 49.8 51.0 51.8 50.8 52.51250 73.6 72.4 70.3 56.8 59.1 58.7 55.4 48.1 53.6 50.8 49.4 50.0 49.81600 56.7 59.1 67.0 36.5 33.1 33.3 37.2 42.5 40.5 40.2 44.3 40.6 43.22000 66.4 59.2 62.1 39.8 39.3 39.9 39.5 39.5 33.6 33.9 36.3 31.7 35.72500 52.9 54.5 57.2 32.1 32.5 31.8 31.4 30.3 35.0 33.1 28.7 35.2 33.93150 54.5 53.6 53.7 34.9 37.0 36.5 30.7 27.4 31.9 33.1 32.1 31.6 31.94000 47.4 44.5 47.3 27.7 28.5 27.5 28.0 27.0 25.7 26.4 28.2 27.1 27.85000 43.9 47.0 46.3 22.7 22.7 23.7 28.5 27.9 23.9 24.8 26.2 24.9 26.76300 37.1 36.3 35.2 22.0 22.8 23.2 22.6 23.5 21.9 21.5 23.6 23.4 23.78000 29.4 27.8 29.0 20.5 20.7 20.8 20.8 21.0 20.8 20.8 20.7 20.9 21.210000 26.7 25.2 27.3 21.6 21.6 21.5 21.5 21.9 21.9 21.6 21.3 21.9 21.412500 22.5 22.6 23.2 21.3 21.5 21.5 21.3 21.3 21.7 21.3 21.3 21.3 21.316000 24.4 24.2 24.8 23.5 23.5 23.4 23.7 24.0 23.2 23.9 25.3 25.9 24.620000 23.7 23.7 23.8 23.8 23.9 23.9 23.9 23.8 23.9 23.9 23.8 23.9 23.9
Appendix A, Table 2.0Fr
eque
ncy
(her
tz)
Uncoated SONEX1 Hypalon Coated SONEX1250 Hertz Pure Tone Generation Sound Level Results (dB)
Plexiglas

53
Plex
igla
s (1
)
Plex
igla
s (2
)
Plex
igla
s (3
)
Unc
oate
d C
lean
Unc
oate
d La
yer 1
Unc
oate
d La
yer 2
Unc
oate
d La
yer 3
Unc
oate
d C
lean
ed
Hyp
alon
C
lean
Hyp
alon
La
yer 1
Hyp
alon
La
yer 2
Hyp
alon
La
yer 3
Hyp
alon
C
lean
ed
12.5 56.0 56.4 55.2 59.1 57.3 55.9 53.8 55.6 55.8 53.0 56.0 65.0 59.616 52.9 53.6 55.3 55.4 54.0 52.6 55.6 53.6 55.1 57.8 52.6 65.3 56.220 46.4 49.0 53.4 48.6 48.3 47.2 53.9 49.6 53.9 55.8 50.5 64.0 53.525 46.3 46.2 50.3 46.2 49.4 49.6 49.2 45.9 49.8 46.8 49.9 63.0 53.7
31.5 44.6 40.7 40.9 44.1 40.7 40.3 41.6 39.9 40.8 41.2 41.4 55.0 43.940 37.5 37.1 36.8 36.8 36.6 35.5 39.0 34.8 36.5 37.8 37.5 50.1 41.250 36.9 37.3 37.1 42.5 39.7 35.7 34.7 33.5 37.5 39.8 39.9 54.7 37.863 32.0 33.5 34.2 34.6 35.6 34.8 32.5 34.5 35.9 36.8 35.0 48.0 38.080 41.8 38.0 41.8 41.1 37.1 36.4 32.2 33.5 47.3 39.9 40.0 49.5 38.9100 34.0 31.8 30.3 33.2 31.8 28.9 26.3 30.4 34.6 36.0 31.1 44.4 30.9125 34.0 32.0 33.6 35.0 34.4 34.0 33.6 31.2 35.4 35.7 33.3 35.5 34.5160 43.1 37.3 36.5 36.9 34.3 38.1 32.4 35.1 37.9 39.0 33.0 35.5 31.9200 46.7 35.3 32.5 40.3 34.0 32.6 32.0 33.9 33.2 34.5 29.2 35.2 26.0250 44.6 37.4 33.0 36.1 31.0 34.5 31.0 33.4 29.7 32.9 31.5 31.5 27.2315 44.7 33.1 30.3 31.6 26.6 32.4 26.7 30.6 26.9 29.2 27.3 27.8 24.7400 42.7 41.8 39.1 32.8 28.3 31.6 29.6 28.1 26.8 28.5 27.7 26.8 26.1500 94.4 90.9 91.1 70.9 71.3 71.1 71.9 72.0 64.9 62.1 62.5 60.9 64.3630 54.4 43.3 40.9 32.6 31.2 34.1 31.0 32.8 27.6 29.8 28.2 26.9 27.3800 41.4 37.3 35.1 25.1 22.8 26.8 24.1 24.2 21.3 25.1 21.7 21.8 23.01000 87.0 91.3 90.5 60.9 57.3 58.2 68.1 68.8 63.5 59.5 59.8 62.4 58.61250 46.9 36.6 38.7 23.0 23.2 23.5 22.5 20.8 19.5 21.6 20.2 20.9 21.11600 75.3 69.7 68.5 51.1 51.7 53.2 62.4 61.0 56.2 56.5 56.7 57.2 55.22000 70.2 83.0 74.6 52.8 52.4 52.9 56.2 51.1 50.5 50.9 52.7 45.3 51.12500 70.1 73.7 72.9 49.2 49.7 50.4 42.0 38.8 46.1 47.5 47.2 32.8 41.43150 58.7 65.0 55.6 42.8 37.7 42.0 48.6 46.0 47.4 46.9 48.0 47.9 47.54000 58.2 64.9 59.5 43.9 38.8 43.1 47.4 46.1 46.5 46.1 47.7 47.9 47.45000 53.3 52.6 57.6 36.2 39.1 38.5 42.5 32.8 39.2 41.5 40.3 31.9 37.96300 49.1 47.7 45.7 32.2 31.8 31.7 31.3 30.4 29.9 30.4 33.6 32.5 34.88000 39.8 38.7 35.8 24.2 27.2 25.6 22.1 23.5 24.3 24.5 25.2 26.6 26.910000 41.7 41.1 39.0 23.8 24.6 23.6 23.4 22.0 21.8 23.5 23.5 23.9 23.312500 30.0 34.1 32.1 21.2 21.5 21.4 21.2 21.4 22.5 22.2 21.7 21.5 22.116000 26.0 26.2 25.6 23.4 23.6 23.4 23.5 24.3 23.1 23.9 25.0 26.4 24.420000 23.8 24.6 23.9 23.6 23.7 23.7 23.7 23.7 23.7 23.7 23.7 23.8
Appendix A, Table 3.0Fr
eque
ncy
(her
tz)
Uncoated SONEX1 Hypalon Coated SONEX1500 Hertz Pure Tone Generation Sound Level Results (dB)
Plexiglas
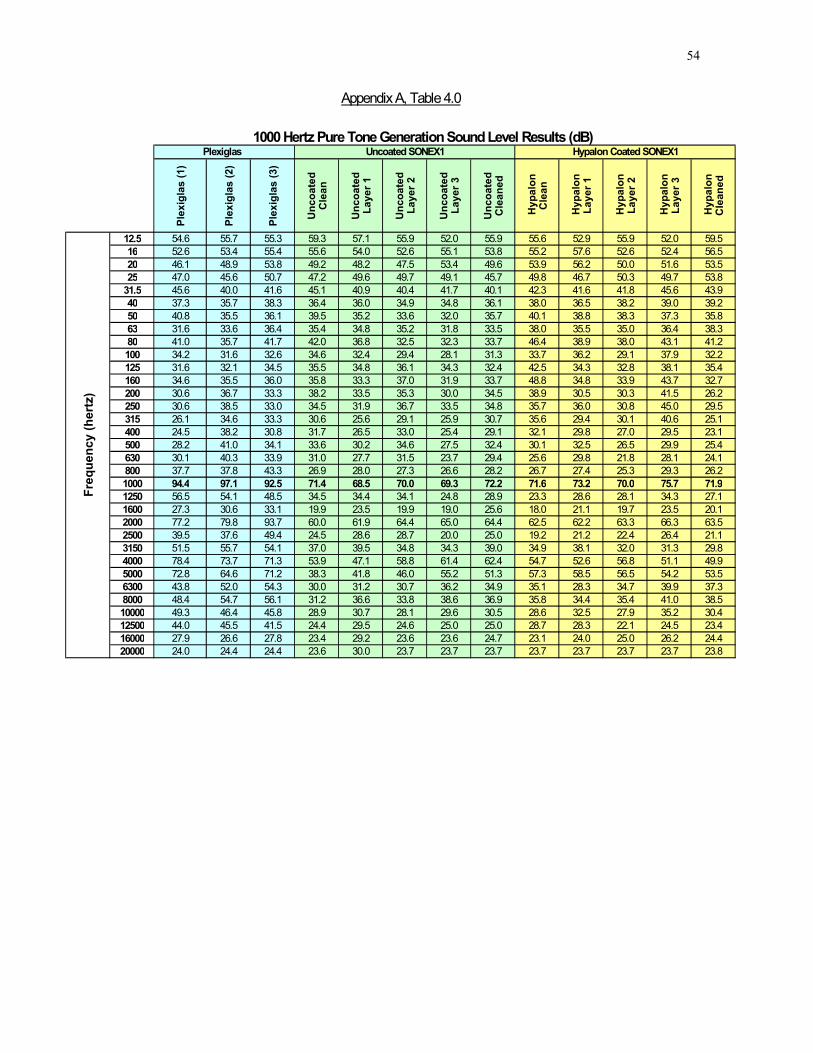
54
Plex
igla
s (1
)
Plex
igla
s (2
)
Plex
igla
s (3
)
Unc
oate
d C
lean
Unc
oate
d La
yer 1
Unc
oate
d La
yer 2
Unc
oate
d La
yer 3
Unc
oate
d C
lean
ed
Hyp
alon
C
lean
Hyp
alon
La
yer 1
Hyp
alon
La
yer 2
Hyp
alon
La
yer 3
Hyp
alon
C
lean
ed
12.5 54.6 55.7 55.3 59.3 57.1 55.9 52.0 55.9 55.6 52.9 55.9 52.0 59.516 52.6 53.4 55.4 55.6 54.0 52.6 55.1 53.8 55.2 57.6 52.6 52.4 56.520 46.1 48.9 53.8 49.2 48.2 47.5 53.4 49.6 53.9 56.2 50.0 51.6 53.525 47.0 45.6 50.7 47.2 49.6 49.7 49.1 45.7 49.8 46.7 50.3 49.7 53.8
31.5 45.6 40.0 41.6 45.1 40.9 40.4 41.7 40.1 42.3 41.6 41.8 45.6 43.940 37.3 35.7 38.3 36.4 36.0 34.9 34.8 36.1 38.0 36.5 38.2 39.0 39.250 40.8 35.5 36.1 39.5 35.2 33.6 32.0 35.7 40.1 38.8 38.3 37.3 35.863 31.6 33.6 36.4 35.4 34.8 35.2 31.8 33.5 38.0 35.5 35.0 36.4 38.380 41.0 35.7 41.7 42.0 36.8 32.5 32.3 33.7 46.4 38.9 38.0 43.1 41.2100 34.2 31.6 32.6 34.6 32.4 29.4 28.1 31.3 33.7 36.2 29.1 37.9 32.2125 31.6 32.1 34.5 35.5 34.8 36.1 34.3 32.4 42.5 34.3 32.8 38.1 35.4160 34.6 35.5 36.0 35.8 33.3 37.0 31.9 33.7 48.8 34.8 33.9 43.7 32.7200 30.6 36.7 33.3 38.2 33.5 35.3 30.0 34.5 38.9 30.5 30.3 41.5 26.2250 30.6 38.5 33.0 34.5 31.9 36.7 33.5 34.8 35.7 36.0 30.8 45.0 29.5315 26.1 34.6 33.3 30.6 25.6 29.1 25.9 30.7 35.6 29.4 30.1 40.6 25.1400 24.5 38.2 30.8 31.7 26.5 33.0 25.4 29.1 32.1 29.8 27.0 29.5 23.1500 28.2 41.0 34.1 33.6 30.2 34.6 27.5 32.4 30.1 32.5 26.5 29.9 25.4630 30.1 40.3 33.9 31.0 27.7 31.5 23.7 29.4 25.6 29.8 21.8 28.1 24.1800 37.7 37.8 43.3 26.9 28.0 27.3 26.6 28.2 26.7 27.4 25.3 29.3 26.21000 94.4 97.1 92.5 71.4 68.5 70.0 69.3 72.2 71.6 73.2 70.0 75.7 71.91250 56.5 54.1 48.5 34.5 34.4 34.1 24.8 28.9 23.3 28.6 28.1 34.3 27.11600 27.3 30.6 33.1 19.9 23.5 19.9 19.0 25.6 18.0 21.1 19.7 23.5 20.12000 77.2 79.8 93.7 60.0 61.9 64.4 65.0 64.4 62.5 62.2 63.3 66.3 63.52500 39.5 37.6 49.4 24.5 28.6 28.7 20.0 25.0 19.2 21.2 22.4 26.4 21.13150 51.5 55.7 54.1 37.0 39.5 34.8 34.3 39.0 34.9 38.1 32.0 31.3 29.84000 78.4 73.7 71.3 53.9 47.1 58.8 61.4 62.4 54.7 52.6 56.8 51.1 49.95000 72.8 64.6 71.2 38.3 41.8 46.0 55.2 51.3 57.3 58.5 56.5 54.2 53.56300 43.8 52.0 54.3 30.0 31.2 30.7 36.2 34.9 35.1 28.3 34.7 39.9 37.38000 48.4 54.7 56.1 31.2 36.6 33.8 38.6 36.9 35.8 34.4 35.4 41.0 38.510000 49.3 46.4 45.8 28.9 30.7 28.1 29.6 30.5 28.6 32.5 27.9 35.2 30.412500 44.0 45.5 41.5 24.4 29.5 24.6 25.0 25.0 28.7 28.3 22.1 24.5 23.416000 27.9 26.6 27.8 23.4 29.2 23.6 23.6 24.7 23.1 24.0 25.0 26.2 24.420000 24.0 24.4 24.4 23.6 30.0 23.7 23.7 23.7 23.7 23.7 23.7 23.7 23.8
Appendix A, Table 4.0Fr
eque
ncy
(her
tz)
Uncoated SONEX1 Hypalon Coated SONEX11000 Hertz Pure Tone Generation Sound Level Results (dB)
Plexiglas
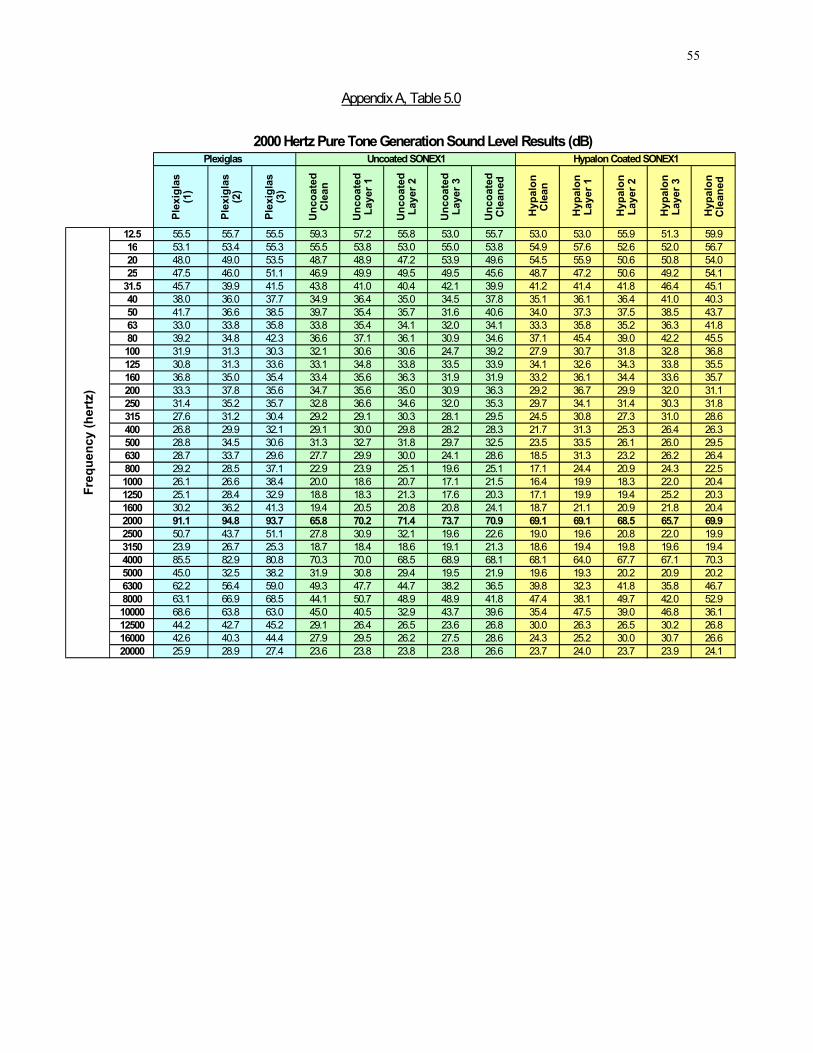
55
Plex
igla
s (1
)
Plex
igla
s (2
)
Plex
igla
s (3
)
Unc
oate
d C
lean
Unc
oate
d La
yer 1
Unc
oate
d La
yer 2
Unc
oate
d La
yer 3
Unc
oate
d C
lean
ed
Hyp
alon
C
lean
Hyp
alon
La
yer 1
Hyp
alon
La
yer 2
Hyp
alon
La
yer 3
Hyp
alon
C
lean
ed
12.5 55.5 55.7 55.5 59.3 57.2 55.8 53.0 55.7 53.0 53.0 55.9 51.3 59.916 53.1 53.4 55.3 55.5 53.8 53.0 55.0 53.8 54.9 57.6 52.6 52.0 56.720 48.0 49.0 53.5 48.7 48.9 47.2 53.9 49.6 54.5 55.9 50.6 50.8 54.025 47.5 46.0 51.1 46.9 49.9 49.5 49.5 45.6 48.7 47.2 50.6 49.2 54.1
31.5 45.7 39.9 41.5 43.8 41.0 40.4 42.1 39.9 41.2 41.4 41.8 46.4 45.140 38.0 36.0 37.7 34.9 36.4 35.0 34.5 37.8 35.1 36.1 36.4 41.0 40.350 41.7 36.6 38.5 39.7 35.4 35.7 31.6 40.6 34.0 37.3 37.5 38.5 43.763 33.0 33.8 35.8 33.8 35.4 34.1 32.0 34.1 33.3 35.8 35.2 36.3 41.880 39.2 34.8 42.3 36.6 37.1 36.1 30.9 34.6 37.1 45.4 39.0 42.2 45.5100 31.9 31.3 30.3 32.1 30.6 30.6 24.7 39.2 27.9 30.7 31.8 32.8 36.8125 30.8 31.3 33.6 33.1 34.8 33.8 33.5 33.9 34.1 32.6 34.3 33.8 35.5160 36.8 35.0 35.4 33.4 35.6 36.3 31.9 31.9 33.2 36.1 34.4 33.6 35.7200 33.3 37.8 35.6 34.7 35.6 35.0 30.9 36.3 29.2 36.7 29.9 32.0 31.1250 31.4 35.2 35.7 32.8 36.6 34.6 32.0 35.3 29.7 34.1 31.4 30.3 31.8315 27.6 31.2 30.4 29.2 29.1 30.3 28.1 29.5 24.5 30.8 27.3 31.0 28.6400 26.8 29.9 32.1 29.1 30.0 29.8 28.2 28.3 21.7 31.3 25.3 26.4 26.3500 28.8 34.5 30.6 31.3 32.7 31.8 29.7 32.5 23.5 33.5 26.1 26.0 29.5630 28.7 33.7 29.6 27.7 29.9 30.0 24.1 28.6 18.5 31.3 23.2 26.2 26.4800 29.2 28.5 37.1 22.9 23.9 25.1 19.6 25.1 17.1 24.4 20.9 24.3 22.51000 26.1 26.6 38.4 20.0 18.6 20.7 17.1 21.5 16.4 19.9 18.3 22.0 20.41250 25.1 28.4 32.9 18.8 18.3 21.3 17.6 20.3 17.1 19.9 19.4 25.2 20.31600 30.2 36.2 41.3 19.4 20.5 20.8 20.8 24.1 18.7 21.1 20.9 21.8 20.42000 91.1 94.8 93.7 65.8 70.2 71.4 73.7 70.9 69.1 69.1 68.5 65.7 69.92500 50.7 43.7 51.1 27.8 30.9 32.1 19.6 22.6 19.0 19.6 20.8 22.0 19.93150 23.9 26.7 25.3 18.7 18.4 18.6 19.1 21.3 18.6 19.4 19.8 19.6 19.44000 85.5 82.9 80.8 70.3 70.0 68.5 68.9 68.1 68.1 64.0 67.7 67.1 70.35000 45.0 32.5 38.2 31.9 30.8 29.4 19.5 21.9 19.6 19.3 20.2 20.9 20.26300 62.2 56.4 59.0 49.3 47.7 44.7 38.2 36.5 39.8 32.3 41.8 35.8 46.78000 63.1 66.9 68.5 44.1 50.7 48.9 48.9 41.8 47.4 38.1 49.7 42.0 52.910000 68.6 63.8 63.0 45.0 40.5 32.9 43.7 39.6 35.4 47.5 39.0 46.8 36.112500 44.2 42.7 45.2 29.1 26.4 26.5 23.6 26.8 30.0 26.3 26.5 30.2 26.816000 42.6 40.3 44.4 27.9 29.5 26.2 27.5 28.6 24.3 25.2 30.0 30.7 26.620000 25.9 28.9 27.4 23.6 23.8 23.8 23.8 26.6 23.7 24.0 23.7 23.9 24.1
Appendix A, Table 5.0Fr
eque
ncy
(her
tz)
Uncoated SONEX1 Hypalon Coated SONEX12000 Hertz Pure Tone Generation Sound Level Results (dB)
Plexiglas
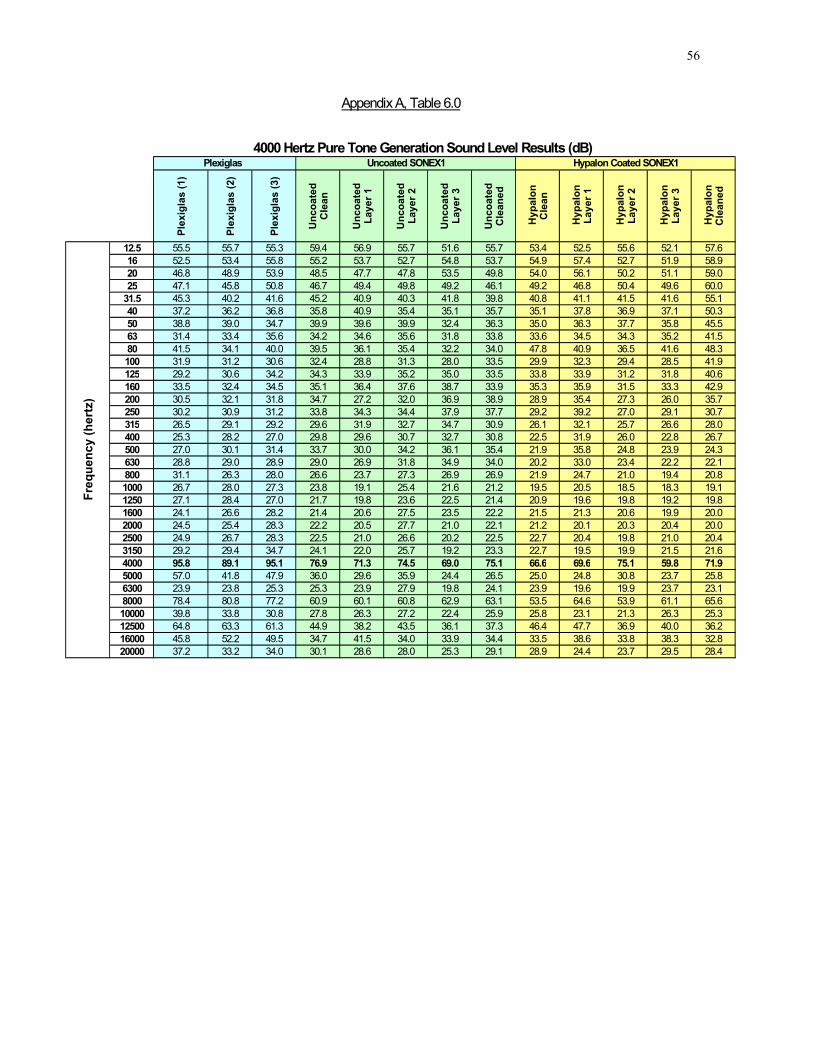
56
Plex
igla
s (1
)
Plex
igla
s (2
)
Plex
igla
s (3
)
Unc
oate
d C
lean
Unc
oate
d La
yer 1
Unc
oate
d La
yer 2
Unc
oate
d La
yer 3
Unc
oate
d C
lean
ed
Hyp
alon
C
lean
Hyp
alon
La
yer 1
Hyp
alon
La
yer 2
Hyp
alon
La
yer 3
Hyp
alon
C
lean
ed
12.5 55.5 55.7 55.3 59.4 56.9 55.7 51.6 55.7 53.4 52.5 55.6 52.1 57.616 52.5 53.4 55.8 55.2 53.7 52.7 54.8 53.7 54.9 57.4 52.7 51.9 58.920 46.8 48.9 53.9 48.5 47.7 47.8 53.5 49.8 54.0 56.1 50.2 51.1 59.025 47.1 45.8 50.8 46.7 49.4 49.8 49.2 46.1 49.2 46.8 50.4 49.6 60.0
31.5 45.3 40.2 41.6 45.2 40.9 40.3 41.8 39.8 40.8 41.1 41.5 41.6 55.140 37.2 36.2 36.8 35.8 40.9 35.4 35.1 35.7 35.1 37.8 36.9 37.1 50.350 38.8 39.0 34.7 39.9 39.6 39.9 32.4 36.3 35.0 36.3 37.7 35.8 45.563 31.4 33.4 35.6 34.2 34.6 35.6 31.8 33.8 33.6 34.5 34.3 35.2 41.580 41.5 34.1 40.0 39.5 36.1 35.4 32.2 34.0 47.8 40.9 36.5 41.6 48.3100 31.9 31.2 30.6 32.4 28.8 31.3 28.0 33.5 29.9 32.3 29.4 28.5 41.9125 29.2 30.6 34.2 34.3 33.9 35.2 35.0 33.5 33.8 33.9 31.2 31.8 40.6160 33.5 32.4 34.5 35.1 36.4 37.6 38.7 33.9 35.3 35.9 31.5 33.3 42.9200 30.5 32.1 31.8 34.7 27.2 32.0 36.9 38.9 28.9 35.4 27.3 26.0 35.7250 30.2 30.9 31.2 33.8 34.3 34.4 37.9 37.7 29.2 39.2 27.0 29.1 30.7315 26.5 29.1 29.2 29.6 31.9 32.7 34.7 30.9 26.1 32.1 25.7 26.6 28.0400 25.3 28.2 27.0 29.8 29.6 30.7 32.7 30.8 22.5 31.9 26.0 22.8 26.7500 27.0 30.1 31.4 33.7 30.0 34.2 36.1 35.4 21.9 35.8 24.8 23.9 24.3630 28.8 29.0 28.9 29.0 26.9 31.8 34.9 34.0 20.2 33.0 23.4 22.2 22.1800 31.1 26.3 28.0 26.6 23.7 27.3 26.9 26.9 21.9 24.7 21.0 19.4 20.81000 26.7 28.0 27.3 23.8 19.1 25.4 21.6 21.2 19.5 20.5 18.5 18.3 19.11250 27.1 28.4 27.0 21.7 19.8 23.6 22.5 21.4 20.9 19.6 19.8 19.2 19.81600 24.1 26.6 28.2 21.4 20.6 27.5 23.5 22.2 21.5 21.3 20.6 19.9 20.02000 24.5 25.4 28.3 22.2 20.5 27.7 21.0 22.1 21.2 20.1 20.3 20.4 20.02500 24.9 26.7 28.3 22.5 21.0 26.6 20.2 22.5 22.7 20.4 19.8 21.0 20.43150 29.2 29.4 34.7 24.1 22.0 25.7 19.2 23.3 22.7 19.5 19.9 21.5 21.64000 95.8 89.1 95.1 76.9 71.3 74.5 69.0 75.1 66.6 69.6 75.1 59.8 71.95000 57.0 41.8 47.9 36.0 29.6 35.9 24.4 26.5 25.0 24.8 30.8 23.7 25.86300 23.9 23.8 25.3 25.3 23.9 27.9 19.8 24.1 23.9 19.6 19.9 23.7 23.18000 78.4 80.8 77.2 60.9 60.1 60.8 62.9 63.1 53.5 64.6 53.9 61.1 65.610000 39.8 33.8 30.8 27.8 26.3 27.2 22.4 25.9 25.8 23.1 21.3 26.3 25.312500 64.8 63.3 61.3 44.9 38.2 43.5 36.1 37.3 46.4 47.7 36.9 40.0 36.216000 45.8 52.2 49.5 34.7 41.5 34.0 33.9 34.4 33.5 38.6 33.8 38.3 32.820000 37.2 33.2 34.0 30.1 28.6 28.0 25.3 29.1 28.9 24.4 23.7 29.5 28.4
Appendix A, Table 6.0Fr
eque
ncy
(her
tz)
Uncoated SONEX1 Hypalon Coated SONEX14000 Hertz Pure Tone Generation Sound Level Results (dB)
Plexiglas
57
References
Acoustical Solutions. (2000). SONEX Acoustical Foams. {On-line}. Available
http://135.145.193.91/Desc-sonex.htm. Allard, J.F., Herzog, P., Lafarge, D., & Tamura, M. (1993). Recent Topics
Concerning the Acoustics of Fibrous and Porous Materials. Applied Acoustics, 39, 3-21.
Bahouth, P. (1995). A Call to Cut US Wood Use. Earth Island Journal, 10, 5.
Beranek, L. L. & Ver, I. L. (1992). Noise and Vibration Control Engineering. New York: Wiley-Interscience Publications.
Berglund, B. and Linvall, T. (1995). Community noise. Archives of the Center of
Sensory Research, Stockholm, Stockholm University and Karolinska Institute. Bolton, J.S. & Green, E.R. (1993). Normal Incidence of Sound Transmission
through Double-Panel Systems Lined with Relatively Stiff, Partially Reticulated Polyurethane Foam. Applied Acoustics, 39, 23-51.
Carlson, M.B. Illbruck Inc. (personal communication, January 25, 2000). Cheremininoff, N. P. (1996). Noise Control in Industry: A Practical Guide.
Westwood, New Jersey: Noyes Publications. Crocker, M. J. (1998). Handbook of Acoustics. New York: Wiley-Interscience
Publications. Everest, F. A. (1981). Master Handbook of Acoustics. Blue Ridge Summit,
Pennsylvania: Tab Books Inc. Garcia, A., Garcia, A. M., Baixauli, F., Boix, P., & Marcos, A. (1997) Occupational
Noise in Spanish Furniture and Wood Industries. Occupational Hygiene, 4, 47-54.
Henry, M., Lemarinier, P., Bonardet, J., Gedeon, A., & Allard, J.F. (January 1,
1995). Evaluation of the characteristic dimensions of porous sound-absorbing materials. Journal of Applied Physics, 77, 17-20.
Hutmacher, J. Illlbruck Inc. (personal communication, February 19, 2000). Illbruck, Inc. (1998). Industrial Noise Control, Room Acoustics, Anechoic
Environments. [Brochure]. Illbruck. (2000). SONEXone Panels. {On-line}. Available
http://www.acousticfoam.com/sonexonespecs.html.
58
Industrial Noise Control, Inc. (1987). Products and Systems for Workplace Noise Control. 4th Edition Planning Guide and Catalog.
Miller, R. K., Montone, W. V., & Oviatt, M. D. (1980). Noise Control Solutions for
the Wood Products Industry. Atlanta, Georgia: Fairmont Press, Inc. MMWR (March 28, 1986). Leading Work-Related Diseases and Injuries-United
States. Morbidity and Mortality Weekly Reports. Vol. 35. No. 12: 185-188. Murphy, P. Owens Corning. (personal communication, February 20, 2000). Narang, P.P. (February 21, 1995). Material Parameter Selection in Polyester Fibre
Insulation for Sound Transmission and Absorption. Applied Acoustics, 45, 335-358.
National Occupational Research Agenda. (January 19, 2000). Hearing Loss. {On-
line}. Available: http://www.cdc.gov/niosh/nrhear.html. National Safety Council. (2000). Accident Prevention Manual for Business &
Industry, page 561. Netwell. (2000). Noise Control Solutions. [Brochure]. NIOSH (1979). Industrial Noise Control Manual, Revised Edition. (Publication No.
79-117). NIOSH (July 1990). National Occupational Exposure Survey. Unpublished
Provincial Data. OSHA. (1979). 29 CFR 1910.95. OSHA. 29 CFR 1910.95 App I. Definitions. {On-Line}. Available http://osha-
slc.gov/OshStd_data/1910_0095_APP_I.html OSHA. (1995). Hearing Conservation: OSHA 3074. {On-line}. Available
http://www.osha-slc.gov/Publications/osha3074.html Owens-Corning. (2000). Noise Control Manual, Guidelines for Problem-Solving in
Industrial/Commercial Acoustical Environment, 6th Edition. Parkin, P. H. & Humphreys, H. R. (1958). Acoustics Noise and Buildings. New
York: Frederick A. Praeger. Sataloff, R. T. and Sataloff, J. (1993). Occupational Hearing Loss, (Marcel Dekker,
Inc., New York). SONEX. (2000). The Beautiful Way to Kill Noise. [Brochure]. Illbruck, Inc.
59
Vinzents, P., & Laursen, B. (1993). A National Cross-Sectional Study of the Working Environment in the Danish Wood and Furniture Industry-Air Pollution and Noise. Annals of Occupational Hygiene, 37, 25-34.
Yang, Y.J. & Bolton, J.S. (July 1996). Optimal Design of Acoustical Foam
Treatments. Journal of Vibration and Acoustics, 118, 498-504.