experimental analysis of thread movement in bolted connections … · · 2013-08-30ill! • ,...
TRANSCRIPT

m
ill! • , Experimental Analysis of Thread Movementin Bolted Connections Due to Vibrations
Research Project NAS 8-39131
Final Report
( N A S A-C R-/_,_5"7g EXPERIMENTALANALYSIS OF THREAD MOVEMENT IN
80LTED CONNECTIONS DUE TO
VIBRATIONS Final Report (Auburn
Univ.) 176 p
i' ? .....
: .; :: ' :2)
N95-14904
Unclas
G3/37 0030418
Prepared for
George C. Marshall Space Flight Center
MSFC, Alabama 35812
August 1994
i ¸
https://ntrs.nasa.gov/search.jsp?R=19950008490 2018-06-03T11:35:01+00:00Z

L _ iii _I _ I _i_! _ i

7
i /
Experimental Analysis of Thread Movement
in Bolted Connections Due to Vibrations
Research Project NAS8-39131
Final Report, August 1994
Written by
Dr. G. Ed Ramey
Robert C. Jenkins
Prepared by
AUBURN UNIVERSITY
Civil Engineering DepartmentHarbert Engineering Center
Auburn University, Alabama 36849-5337
Principal Investigator
Dr. G. Ed Ramey
4 i •• •
Prepared for
George C. Marshall Space Fright CenterMSFC Alabama 35812
MSFC Project ManagerFrank Thomas
Bolt Loosening Program
Special Projects Division

I

• •• ii•, •
_i •
ABSTRACT
This is the final report of research project NAS8-39131 #22 sponsored by NASA's George
C. Marshall Space Flight Center (MSFC) and carried out by the Civil Engineering
Department of Auburn University (Auburn, Alabama) and personnel ofMSFC. The
objective of this study was to identify the main design parameters contributing to the
loosening of bolts due to vibration and to identify their relative importance and degree of
contribution to bolt loosening. Vibration testing was conducted on a shaketable with a
controlled-random input in the dynamic testing laboratory of the Structural Test Division
of MSFC Test specimens which contained one test bolt were vibrated for a fixed amount
of time and a percentage of pre-load loss was measured. Each specimen tested
implemented some combination of eleven design parameters as dictated by the design of
experiment methodology employed. The eleven design parameters were: bolt size
(diameter), lubrication on bolt, hole tolerance, initial pre-load, nut locking device, grip
length, thread pitch, lubrication between mating materials, class of fit, joint configuration,
and mass of configuration. These parameters were chosen for this experiment because
they are believed to be the design parameters having the greatest impact on bolt loosening.
Two values of each design parameter were used and each combination of parameters
tested was subjected to two different directions of vibration and two different g-levels of
vibration. One replication was made for each test to gain some indication of experimental
error and repeatability and to give some degree of statistical credibility to the data,
resulting in a total of 96 tests being performed. The results of the investigation indicated
that nut locking devices, joint configuration, fastener size, and mass of configuration were
significant in bolt loosening due to vibration. The results of this test can be utilized to
further research the complex problem of bolt loosening due to vibration.

MSFCPERSPECTIVE
• ": . .
PROJECT DESCRIPTION
Space Shuttle Payloads managed or developed at NASA's Marshall Space Flight Center
0VlSFC) are required to adhere to MSFC-STD-561, Threaded Fasteners, Securing of
Safety Critical Flight Hardware Structure Used on Shuttle Payloads and Experiments.
The requirements of MSFC-STD-561 are to lockwire or cotter pin safety critical flight
hardware components or conduct vibration or acoustic tests to demonstrate that locking is
not required. If lockwire or cotter pins are not used and testing is not performed then a
waiver must be obtained from the responsible organization. However, applications arise
where lockwiring or cotter pinning are not possible and resources and manpower are not
available to conduct vibration tests. An analytical and experimental investigation was
conducted to determine a method for predicting loosening in bolted joints so Space
Shuttle payloads can use alternate locking devices without being subjected to vibration or
acoustic testing.
PROJECT OBJECTIVES
Safety critical flight hardware, designed or managed by MSFC, requires positive locking
devices such as cotter pins or lockwire or a vibration test to verify positive locking is not
required. The objective of this research was to identify the main factors that cause bolt
loosening due to vibrations, and then to experimentally test these factors in a vibration
environment to access their relative importance to bolt loosening.
)
_ i,/ I
PROJECT RESULTS
Analysis of the data from the program test matrix indicates that a locking device, the joint
configuration, fastener size, and mass of the configuration are important factors in
preventing fasteners from loosening for the parameters investigated in this study. This
task was performed based on the fundamental concepts for the design of experiments and
on an effective and efficient orthogonal array or fractional factorial methodology. One
objective of the design of experiments approach is to have a good method of measuring
the output characteristic. The output sought for this experiment was the amount of
5_5_

-, __iii_-
preload, or tension, lost in the bolt after being vibrated. The measurement methods used -
breakaway torque and change in bolt length measured with hand held micrometers - are
suspect in obtaining accurate tension indication.
PROJECT OBSERVATION
The objective of this study was to investigate the effect of vibration on the loosening of
fasteners. To achieve this goal, loosening must occur. However, only one test
configuration loosened. Possible explanations for this was that the bolts were over-
torqued and a relatively high coefficient of fiietion lubrication was used. The design of
experiments and orthogonal array methodology used is sound and should be considered
for the further loosening investigations.
MSFC APPLICATIONS
The information and experience gained from this experiment can be utilized in further
fastener loosening investigations.
RECOMMENDATIONS
Means other than lockwiring or cotter pinning fasteners to prevent loosening remains an
objective. Future endeavors to obtain an understanding of the loosening phenomena
include the development of a test fixture that will cause loosening and a better method of
detecting the preload in the bolt.
Frank Thomas, Project Manager
Special Projects Division
Marshall Space Flight Center, NASA
iii

ACKNOWLEDGMENTS
m
The support of this work by the National Aeronautics and Space Administration
under contract NAS8-39131 #22 is gratefully acknowledged.
The help and support of the following people in the execution of this project is
acknowledged and very much appreciated:
Mr. Frank Thomas,
Mr. Richard Dotson,
Mr. Gerald Waggoner,
(Retired)
Mr. Phillip Harrison,
Mr. Steve Brewster,
Mr. Rodney Phillips,
Mr. Steve Rodgers
Mr. James Foreman,
Project Manager
Special Projects Division
Marshall Space Flight Center, NASA
Chief of Structural Design Division
Marshall Space Flight Center, NASA
Chief of Structural Test Division
Marshall Space Flight Center, NASA
Vibroacoustics and Data Analysis Branch
Marshall Space Flight Center, NASA
Chief of Dynamics Test Branch
Marshall Space Flight Center, NASA
Vibration Test Engineer
Dynamics Test Branch
Marshall Space Flight Center, NASA
Vibration Test Engineer
Dynamics Test Branch
Marshall Space Flight Center, NASA
Consultant on Component Vibration Testing
Assistant Professor
Alabama A&M University
iv

_ ' 'i_ _.
Ms. Diane Byrne,
Mr. Jim Quinlan
Consultant on Taguchi Methods
Director, ITEQ, Livonia, MI
Consultant on Taguchi Methods and Data Analysis
ITEQ, Livonia, MI
"V

CONTENTS
il i
Section
1 INTRODUCTION
General Statement of the Problem
Objectives
Scope
2 BACKGROUND AND LITERATURE REVIEW
Background
Literature Review
3 THEORETICAL CONSIDERATIONS
General
Threaded Fastener Nomenclature and Behavior
Mechanics of Threaded Fastener Forces and Torques
Effects of Vibratory Loadings on Bolt Loosening
Primary Parameters Affecting Bolt Loosening
4 DESIGN OF EXPERIMENT AND EXPERIMENTAL
TESTING PROGRAM
General
Experimental Test Parameters and Values
Taguchi Methods
Test Matrix
Test Set-up
Test Specimens
Test Equipment and Instrumentation
Testing Program
Pr,,_liminary Testing
Execution of Test Matrix
v±
1
1
1
2
3
3
3
13
13
13
16
35
42
45
45
45
46
47
48
51
54
54
55
55

°• • •
Static On-Torque and Off-Torque Testing
Confirmation Testing
Additional Testing
EXPERIMENTAL RESULTS AND DATA ANALYSIS
General
Test Matrix Data
Test Matrix Data Analysis
General Analysis of Data
ANOVA Analysis of Data
Analysis Based on Adjusted Torque Data
Analysis Based on Adjusted Length/Load Data
Static On-Torque vs. Off-Torque Data
Confirmation Testing Data
Additional Testing Data
CONCLUSIONS AND RECOMMENDATIONS
Conclusions Based on Theory
Conclusions Based on Experimental Data
Recommendations
Recommendations for Future Research
Phase II Work
Phase HI Work
Phase IV Work
REFERENCES
APPENDICES
APPENDIX A - Test Set-ups
APPENDIX B - Fabrication and Procurement
Drawings and Listings for Test
Specimens, Bolts, and, Nuts
APPENDIX C - Execution of Test Matrix Data
APPENDIX D - Static On-Torque vs. Off-TorqueData
APPENDIX E - Confirmation Test data
APPENDIX F - Additional Test Data
vii
57
58
60
65
65
65
71
71
76
77
77
82
86
88
92
92
96
100
101
102
102
103
104
107
108
121
128
153
157
160

/ ,
LIST OF FIGURES
/
:_ili!
4
?
2.1
2.2
2.3
2.4
3.1
3.2
3.3
3.4
3.5
3.6
3.7
3.8
3.9
3.10
3.11
3.12
3.13
3.14
3.15
3.16
3.17
3.18
3.19
Simplified Bolt/Nut Interaction
Bolt Tension and Nut Dilation
Loading Component to Cause Loosening
Inertial Loading (Shear Due to Bending)
Nomenclature of Bolt Threads
Contact Points in a Bolted Connections
Modeling of Square-Threaded Bolt
Square-Threaded Screw Jack
Modeling of Square-Threaded Screw as Block on Inclined Plane
V-Threaded Screw Jack
Variation in C R and C L with Bolt Thread Angle (_) and Coefficient
of Friction (g).
Approximate Forces on a V-Threaded Bolt at Impending Slipping
Thread Friction Force
Forces and Torque to Overcome Bolt Head Friction
Comparative Plot of CL values vs. M for Various Thread Prediction
Equations
Forces and Torque to Overcome Bolt Head Friction
Structural Steel Bolt
Modeling and Estimating Bolt Axial Fundamental Natural Frequency
Axial Stiffness of Connected Plates
Axial Impact loading Propagation
Transverse Bolt Loading Through Assemblage Bending
Bolt Rocking Motion
Cantilever Beam of Two Flat Bars Bolted Together
viii
6
6
7
7
14
14
18
18
19
2O
23
23
25
28
3O
31
31
36
36
37
39
39
4O

,!
"2
3.20
3.21
3.22
4.1
4.2
4.2
4.3
4.4
4.5
4.6
5.1
5.2
5.3
5.4
5.5
5.6
5.7
5.8
5.9
5.10
5.11
6.1
6.2
Modeling of BoltfNut as Inclined Plane and Transverse Sliding
Ratcheting Action of a Side Sliding Thread
Transverse Shock Loading
Test Matrix
Photographs of Typical Test Set-ups
(cont.) Photographs of Typical Test Set-ups
Typical One Piece Cantilever
Typical Two Piece Cantilever
Ultrasonic Measurement of Bolt Length
Input Dimensions for BoltMike
Typical Input Signature Plot
Typical Response Plot From Accelerometer
Response Parameter vs. Design Parameters for Transverse/g2
Level Loading
Response Parameter vs. Design Parameters for E and J for Adjusted
Torque Data
Response Parameter vs. Design Parameters for A, E, J, and L
for Adjusted Torque Data
Plot of A Torque Vibration vs. A Torque Static
Plot of M r / M L Vibration Tests vs. M r / M L Static Tests
Comparison of p-Values for Vibration Direction
Comparison of p-Values for Bolt Preload
Comparison of p-Values for Lubricated Parts
Comparison of p-Values for Fastener Size
Cr and C L vs. la for Zero Friction Under Nut/Bolt Head
C r and C L vs. la for Bolt Threads and Under Nut/Bolt Head
40
41
41
48
49
5O
53
53
61
61
68
68
75
79
81
84
85
90
90
91
91
94
95
iX

i/
7
/
<
Table
3.1
4.1
4.2
4.3
4.4
4.5
4.6
5.1
5.2
5.3
5.4
5.5
5.6
5.7
5.8
5.9
5.10
5.11
5.12
5.13
6.1
LIST OF TABLES
Comparative Equations and Values of CL for Different Thread Types
and Simplifying Assumptions
Test Parameters and Values
Test Set-ups
Confirmation Test 1 Set-up
Confirmation Test 2 Set-up
Test 1-4 Set-ups for Additional Testing
Test 5-8 Set-ups for Additional Testing
Summary of Raw Torque Data
Summary of Adjusted Torque Data
p-Values Based on Adjusted Torque Data
p-Values Based on Raw Lenght/Load Data
p-Values Based on Adjusted Lenght/Load Data
Test Matrix Response Parameters (p) for Design Load Parameters
ANOVA Table for Adjusted Torque p-Value Data
Pooled ANOVA Table for Adjusted Torque p-Value Data
ANOVA Table for Adjusted Length/Load p-Value Data
Pooled ANOVA Table for Adjusted Length/Load p-Value Data
Bolt Torque Reductions and Torque Tightening/Torque Loosening
Ratios for Vibration Testing and Static Testing
Prediction and Confirmation Mean p-Values
p-Values for Additional Testing
Percent Increase in Design Cross-Section Area for Fine Threads
29
46
56
59
59
63
64
66
66
70
70
70
74
78
79
80
81
83
88
89
93
i
X

_!_i,i_i,:_/_
)il i _::
• !) f,
• ,ii_ _
_ i, _
I. INTRODUCTION
1.1 General Statement of the Problem
The threaded fastener, or bolt, is one of the most common connecting devices.
Used in a wide range of applications, one would expect that the knowledge of how a bolt
performs under certain loading conditions would be well known. While the behavior of
bolts under static tensile and shear forces is fairly well understood, their behavior under
dynamic loads, such as vibration, is not. Many theories have been developed in an attempt
to describe the way that a bolt and nut interact under vibratory loads. While these theories
have proven helpful in understanding the bolt/nut interaction, none have proven adequate
in predicting bolt loosening. In order to predict bolt loosening, it is important to first
identify the parameters that contribute to bolt loosening so they can be quantified. The
desire to identify the primary parameters that contribute to bolt loosening was the impetus
for this study.
1.2 Objectives
The work presented in this report is directed toward a long range goal of
prediction of bolt loosening. Once the main parameters that contribute to bolt loosening
are identified, they can be quantified and, if successful, an empirical equation can be
developed to predict bolt loosening. The major emphasis of the work presented herein

?
2
was the identification of the main parameters contributing to bolt loosening and to identify
their relative importance and degree of contribution to bolt loosening.
1.3
The entire range of all parameters contributing to bolt loosening could not be
explored in this experiment. Through literature review, discussions and meetings with
select personnel of the Marshall Space Flight Center (MSFC), and engineering judgment
the main parameters deemed suspect in bolt loosening were identified. These parameters
were investigated in an experimental testing program employing a Taguehi Method design
of experiment. The program was executed by the author and testing personnel of the
Structural Testing Laboratory at MSFC.
The experimental work was limited to a preliminary testing phase to finalize
vibratory loading modes and levels and testing procedures. The final experimental
program/matrix consisted of testing 11 bolt design parameters in combinations dictated by
the design of experiment methodology employed. This resulted in 48 different tests. One
replication was made for each test to give some measure of repeatability and experimental
error. This resulted in a total of 96 tests conducted.
The study includes a general background and literature review of the problems of
bolt loosening. Theoretical considerations for bolt/nut interaction and vibrational loads on
fasteners are presented in Chapter III. A discussion of design of experiment techniques
and Taguchi methods, the derivation of the test matrix, and a description of the
experiment are presented in Chapter IV. In Chapter V, data analysis and a presentation of
the results of the experiment are presented. Conclusions and recommendations are
presented in Chapter VI.

!ii!_
i_
II. BACKGROUND AND LITERATURE REVIEW
2.1 Background
A bolted joint must maintain a minimum clamping force in order to resist
loosening. The resulting frictional forces between the surfaces of the bolt, nut, and mating
materials must be greater than any tangential surface forces that might act to oppose them.
In order to do this, a complex set of design parameters involving the characteristics of the
bolt, nut, and mating materials must be arranged such that the resistance to loosening is
optimized.
At the present time, what is known about how a bolt and nut interact under
vibrational load is based on theoretical models and some experimental data. The following
literature review is directed toward what is currently known about bolt loosening as well
as the mechanics of threaded fasteners.
2.2 Literature Review
Junker (18) indicates that aside from fatigue failure, self-loosening is the primary
contributor to failure of bolted joints that are dynamically loaded. This loosening is the
result of relative movement between the threads of the bolt and nut after the force of
friction between these two surfaces has been overcome. In order to understand this
concept, the threads of the bolt are viewed as an inclined plane and the bolt is viewed as a
mass resting on the inclined plane, as shown in Fig. 2.1. The mass will remain at rest as

i i
•r
4
long as the force Q is greater than zero. If the inclined plane is vibrated, the mass will
move as soon as the inertial force of the mass exceeds the frictional forces acting against
the mass. While this is a simplified explanation of how the bolt and nut interact, it is
sufficient in explaining the concept of self-loosening Junker indicates that transverse
vibration (vibration transverse to the axis of the bolt) is the most severe loading condition
to induce bolt self-loosening For axially loaded bolts, the primary contributor to self-
loosening is the contraction of the bolt due to tensile forces while at the same time the
dilation of the nut walls, as shown in Fig. 2.2. Junker mentions the following parameters
as pertinent to bolt loosening: length of bolt, vibration endurance (point at which loss of
pre-load is zero), hardness of mating materials, thread tolerance, thread pitch, and bolt
reuse.
Goodier, et al. (12) indicates that the loosening of the threaded fastener/nut
combination is the product of simple fluctuations of tension. When the load is increased,
the threads of the bolt move radially inward and the threads of the nut move radially
outward. The pull of the bolt acting in the direction of the threads causes the bolt to
rotate. This theory/model of how loosening occurs during dynamic loading of threaded
fasteners is helpful in understanding why some parameters, such as bolt diameter and
thread pitch, contribute to loosening more than other parameters.
Finkelston (9) reiterates that the transverse direction is the most severe loading
direction to cause bolt loosening. Some methods which he mentioned that would increase
resistance to loosening are:
1) Increase friction in the joint by increasing the pre-load or the number of bolts in
the joint.
2) Design mating materials with minimal or no clearance.
3) Use fasteners that will retard loosening.

5
Finkelstonfoundseveralimportant variables affecting a fasteners ability to retain pre-load
while under vibratory loads. These are listed below in his order of increasing importance:
1) Amplitude and frequency of dynamic motion: Amplitude and frequency of
forces applied to a joint greatly effect the dynamic motion of the joint, which in turn
causes relative motion within the joint.
2) Thread Pitch: The internal loosening torque in a bolted joint is directly
proportional to the helix angle of the threads on the bolt• The larger the helix angle
(coarse-pitch thread) the less vibration resistance is provided due to the larger internal
torque that is generated. Internal torque is increased by a large helix angle because the
thread angle is steeper. This causes the component of the force that would cause
loosening, shown in Fig. 2.3, to be increased. Results from testing show that a
fine-pitched locknut endures twice the cycles of vibration than does a corresponding
coarse-pitched locknut, provided all other conditions are the same.
3) Initial pre-load: Vibration resistance is achieved by increasing the pre-load,
thereby increasing the friction between mating materials.
4) Bearing surface conditions: Hardness and roughness of the mating materials as
well as the thread surfaces and contact surfaces of the bolt can all influence the loosening
of bolted joints. To minimize preload loss, the hardness of the mating materials and the
bearing area of the fastener can be optimized. Some degree of embedding can take place
statically and can be worsened by vibration which can cause plastic flow of the joint
surface• This embedding causes loss of preload and is usually experienced within the first
ten cycles of vibratory loading.
Crispell (8) indicates that the diameter of the fastener and method of manufacturing are
important factors in fatigue strength of threaded fasteners. Fatigue endurance diminishes
with increasing diameter and this is believed to be attributable to the method in which the

L-
6
QI L" ten {-tP _} ÷ i. • tan
.j'
s
Figure 2.1 Simplified Bolt/Nut Interaction (18).
UNLOADED BOLT
)EFORMED
BOLT
NUT
TENSION
*APP..ED TOROUE RESULTS
IN AX,AL BOLT LOAD
TOROUE*
& r ---------4_
LOADED BOLT
EXTENDED
BOLT "1grlp
NUT J
Figure 2.2 Bolt Tension and Nut Dilation.
C1
bi
J
Impulse
b
A
A R is component
rotation.
I'0 CCIU se
Figure 2.3 Loading Component to Cause Loosening (2).
> ,
.... -..... t'_¸__t_ _ _ . " _s.'L_,':j.-C'2..
\\\-...\\\\-,.\\\-.,\\\-,.\\\\\\\\\\\\\\\\\\\\\\\\\\\\\\\\\\\\\\_\\\\\\__]//////////////////////////////////////////////////////ll///,n
!
Figure 2.4 Inertial Loading (Shear Due to Bending) (19).

-i
8
threads of the fastener are formed. Natural deformities in the material used can promote
deformation by slip between the bolt and nut. Stress concentrations that reduce fatigue
life are a result of these deformities. With a large diameter bolt, there is more surface area
that could possibly have these stress concentration points. Residual compressive stresses
are induced from rolling the threads in the manufacturing process. These stresses enhance
fatigue resistance. However, if the bolt is heat treated, these stresses are relieved and any
advantage in fatigue resistance that is gained by rolling the threads would be lost.
Therefore, the most fatigue resistant fastener can be achieved by rolling the threads after
heat treatment. Closer tolerances can also be achieved from rolling the threads.
Baubles, et al. (2) demonstrated that the nut has a preferred direction of rotation
when it is subjected to vibration. Usually, this preferred direction of rotation is to loosen
because this is the path of least resistance. Resonant frequencies may be excited by
external forces which cause vibrations that could promote loosening. The frequency of
the vibrating force is noted as an insignificant factor in bolt loosening. However,
frequency does affect time of loosening which indicates that bolt loosening occurs as a
result of induced oscillation of the parts in the joint at their natural frequencies. Also,
amplitude of the vibration is indicated as an insignificant factor in bolt loosening. Baubles
found that an increase in bolt length yielded an increase in vibration life. Other factors that
were found to be important to bolt loosening when a non self-locking nut was used were
bolt prestress and seating torque. Retaining torque can be held constant by the use of a
castellated nut and cotter pin. A variety of locknuts can also be used to maintain a
retaining torque in the event of prestress loss. Self locking nuts are categorized as nylon
insert, aircraft quality all-metal, and commercial all-metal. Testing shows that the aircraft

i !i i¸
i
,i ¸ L' _ _
9
quality nuts were more resilient in resisting loosening than were the commercial nuts.
Threshold torque, which is the minimum torque required to loosen the nut, was low for
the nylon insert nut compared to the other two nut types.
Saur, et al. (23) found that the loosening effect of vibratory loading is large
initially, but diminishes rapidly as the number of load cycles increases. Saur also notes that
the condition of contact surfaces is an important parameter in bolt loosening. Previously
used nuts were shown to be beneficial in reducing loosening. When the contact surfaces
were cleaned and smoothed, the rate of loosening changed more abruptly than when the
surfaces were not treated. No loosening was experienced aider 4000 cycles. Saur
recommends the use of previously used mating surfaces to reduce loosening. Also
recommended is cleaning and smoothing the mating surfaces prior to use as well as the use
of bolts that have smoother and more regular surfaces due to the method of
manufacturing. These methods allow more surface contact between mating surfaces and
thus increases the coefficient of friction. Saur indicated that the alignment of the hole in
which the bolt is inserted, is of little importance. Saur found that for a given load case, the
amount of loosening decreased with an increase of preload. This indicates the importance
of keeping the dynamic-static load ratio small. Saur also notes that if a small amount of
loosening occurs in a bolted connection, this loosening could be compounded by load
relaxation, i.e., the dynamic-static load ratio would increase further promoting loosening.
Negligible amounts of load relaxation occurs for dynamic-static load ratios of 0.8 and
below•
Brenner (3) indicates that the most severe vibration condition is experienced when
the system goes into resonance. He recommends avoidance of resonant vibrations.
Haviland (13) indicates that the torque applied in order to tighten a bolt causes the
distance between the bottom of the bolt head and the top of the nut to decrease. This will

,ii • _
10
continue until torsional equilibrium is reached between the torsional resistances caused by
frictional forces under the bolt head and on the bolt threads. Both of these are functions
of the bolt tension. One structure that Haviland tested was a simple cantilever composed
of two steel blades bolted together. The structure was subjected to a 10-g load at 20 to
400 Hz which caused first mode bending and loosening within 100 to 200 cycles (5 to 10
seconds). Haviland recommends using liquid threadlock to fill the voids between threads
to prevent thread movement, thus preventing loosening.
Chapman, et el. (5) found that the clamping force in a bolt (preload) is
proportional to the wrenching torque applied to the head of the bolt. This relationship is
highly dependent on the friction between the bolt and mating parts. Chapman also notes
that when the wrenching torque is removed, the "windup" in the shank of the bolt will
cause the head to twist back minutely until the friction under the bolt head is in equilibrium
with the shank torque. This will cause an approximate 20 to 30 percent loss of shank
torque, thus causing a reduction in preload. Chapman shows that a bolt that has been
tightened to its yield point can carry higher work loads prior to the joint opening, thus
increasing the fatigue strength of the joint because fatigue failure occurs mainly when the
joint opens.
Holmes (16) indicates that when a nut is torqued, a portion of the energy required
to tighten the assembly is stored as potential energy. The friction between the thread
flanks prevent the nut from unscrewing and returning to a position of rest. Once
movement occurs in the threads, the friction force between them becomes increasingly
harder to maintain. To prevent loosening, Holmes recommends fine threaded bolts;
especially when transverse forces are expected. An improved stress distribution along the
length of the thread engagement is also favorable to prevent loosening.

11
Clark(6) foundthat thebreakawaytorquewasagoodmeasureof the self-locking
characteristicsof theboltedjoint aswell asthework doneto removethebolt.
Kerley(19)usedacantileverconfigurationsimilarto Haviland(13) to analyzeand
testthe looseningof threadedfastenersunderdynamicloading. Thisconfiguration
introducedshearloadingson thebolt dueto bendinginducedby thebeaminertialforcesas
indicatedinFig. 2.4. Heexploredseveralparametersthatarebelievedto influencebolt
loosening.Vibrationdirection,lubricationon thethreads,type of threadlockingdevice
used,embeddingof thenut or bolt headinto thematingmaterials,loaddistributionon
threads,loadinghistoryof thebolt andnut, sizeof thebolt andnut, andgeometryof the
threadsareparameterswhichwereexplored. Someof theprimaryresultsfrom Kerley's
testingasreportedin Ref(19)andasreportedin telephoneconversationswith Kerleyare
asfollows:
.
.
.
.
.
Resonant sine and random vibration loadings were used and resonant sine loadings
caused the bolts to loosen more rapidly.
All bolts tested were 1/4" diameter and high quality steel (120ksi <_Oy < 160ksi).
At preload levels of 1Apy < Pp < Py, bolt loosening was rather insensitive to the
bolt preload.
All bolts/threads/nuts were lubricated as were the washers and other mating
surfaces (0.08 < tt s < 0.15). Under these conditions standard nuts loosened in a
reasonable period of vibration loading, whereas no loosening of locknuts occurred.
When a bolt begins to loosen in a resonant sine loading test, it can be easily
detected by monitoring the vibrator power input requirement.
When bolt loosening begins, it loosens completely in a short period of time, i.e.,
the loosening occurs quickly.

t
.: _ i_
12
Additionally, Kerley indicated that researchers in Japan have done some vibration testing
and found that if the thread angle 2 0(see Fig. 3.1) is lowered to around 50 - 55 degrees,
then regular nuts will not loosen.
This chapter has reported on the literature pertaining to what is known about how
threaded fasteners behave under vibratory loadings. Whereas a significant amount of
work has been done on this topic, and has led to valuable contributions; there are still
many questions about the loosening of bolts due to vibrations which remain unanswered.

III. THEORETICAL CONSIDERATIONS
3.1 General
The previous chapter presented a brief review of the state-of-the-art regarding the
loosening of bolts. In this chapter, a more detailed explanation of the mechanics of
threaded fasteners is provided, along with a discussion of the effects of vibrational
loadings on threaded fasteners. Lastly, the primary design and loading parameters
affecting bolt loosening are listed and briefly discussed from a theoretical perspective.
3.2 Threaded Fastener Nomenclature and Behavior
The nomenclature of bolt threads is illustrated in Fig. 3.1. In order to understand
how a threaded fastener will behave in a given situation, it is important to understand the
mechanics of the fastener. Each element of the bolt and nut will be analyzed in order to
better understand how they interact when under different loading cases.
The clamping force in a bolted joint is a summation of tensile forces within the bolt
and friction forces generated between all parts in contact within that particular joint.
These contact points, illustrated in Fig. 3.2, are between the head of the bolt and mating
material, the threads of the bolt and nut, and the nut and mating materials. When the bolt
is tightened, the distance between the bolt and nut decreases. When the tightening torque
meets resistance from the clamped mating materials, a friction force is created. As further
13

L
• i
'i
_i _ _
14
Major diameter d
Mean diameter dm
Minor diameter dr
it! 4 oc oferCrest Thread angle, 20
Figure 3.1
(_) BOLT/WASHER
DIA * THICKNESS
WASHER
Nomenclature of Bolt Threads (24).
SURFACE
L SURFACE
_MATERIAL/
MATERIAL
SURFACE
Q BOLT/MATERIAL
DIA * THICKNESS
(_ BOLT/WASHER
DIA * THICKNESS
Figure 3.2
ERIAL SURFACE
BOLT/MATERIAL
DIA * THICKNESS
THREADS
Contact Points in a Bolted Connection.

.i
i:
.i•?
15
tightening occurs, the bolt begins to elongate and the nut begins to dilate (in the case of
rigid mating materials), as shown in Fig. 2.2, creating a tensile force within the bolt that
will in turn increase the friction forces between interfacing surfaces. The bolt can continue
to be tightened until an equilibrium is reached between the tightening torque and the
summation of resisting forces (clamping force). At this point, the connection will not
loosen until a force (loosening force) is applied in the opposite direction from tightening to
overcome the clamping force (13). A detailed discussion of bolt loosening forces and
torques is given in the next section.
Bolt preload is commonly measured as axial tensile stress in the bolt that develops
as a result of tightening. The tensile stresses can be considered to be uniformly
distributed over the cross-section of the bolt (5). Bolt elongation, or strain, can be used as
a measure of stress within the bolt. For example, a steel bolt will elongate 0.001 in. per
inch of length for a 30,000 psi stress (14). Usually, a bolt is tightened to some percentage
of its yield strength. Another stress within the bolt generated from tightening is a torsional
stress. The distribution of this stress goes from zero at the bolt's center to it's maximum
value at it's outer surface. As a bolt is tightened, both axial and torsional stresses develop.
When the tightening torque is removed, the torsional stress in the shank of the bolt will
cause the head of the bolt to twist back minutely until the friction under the bolt head is in
equilibrium with the shank torque. This will cause a loss of shank torque and thus a
reduction in preload (5).
The main area of concern in bolt loosening is the interface between the surfaces of
the bolt and nut, or thread engagement. As the bolt is tightened stresses also develop
along the length of the thread engagement. One important note is that each thread that is
engaged does not carry the same load. Generally, the threads closer to the head of the
bolt carry more of the load than do the threads toward the end. Also effecting this

z J
ii:i
16
relationship is the depth of penetration of the threads within one another. The greater the
penetration among threads, the more load they can carry and the more friction that can be
generated between them. This depth of penetration is a function of bolt/nut class of fit.
Class of fit refers to the looseness or tightness between mating threads. There are three
classes of fit for Unified inch screws; 1, 2, or 3 with 1 being the loosest fit and 3 being the
tightest. Also the class of fit is designated with an A or B for external or internal threads
respectively. So, a 3A would designate a class 3 bolt and 3B would designate a class 3
nut (17).
3.3 Mechanics of Threaded Fastener Forces and Torques
Threaded fasteners typically have V-shaped threads as shown in Figs. 3.1 and 3.2.
However, to discuss and graphically illustrate the mechanics of their behavior, it is
convenient to look at a simpler case, the square-threaded bolt or screw. The discussion
below is a somewhat modified version of that presented in Ref (20).
A square-threaded screw can be viewed as a bar of rectangular cross-section
wrapped around a cylinder in a helical fashion, as shown in Fig. 3.3. The helix angle ct is
called the thread lead angle, the distance p between the threads is known as the pitch, and
the mean radius of the threads is denoted by r. These three parameters are related by
Ptano_ -- --
2nr
or
p = 2nr.tana
as evident by the one unwound thread indicated in Fig. 3.3.
(3.1)

• i •
17
Figure 3.4 depicts a screw being used as a jack. Assuming that the torque M is
large enough, it will cause the screw to advance and thereby elevate the weight W. This
case can be simplified if we recall that in Coulomb's friction theory, the friction force is
independent of the contact area. Hence, we can assume the contact area to be very small,
as illustrated in Fig. 3.4. Note that the entire weight W is carried by the contact area and
that the horizontal force Q = --M--Mmodels the applied torque M. Note that this case isr
identical to the one shown in Fig. 3.5, namely, a block of weight W being pushed up an
incline of angle o_by the horizontal force Q.
The smallest torque required to start the weight W moving upward can be
obtained from the FBD in Fig. 3.5(b). Note that at impending sliding the angle between R
and the normal n to the contact surface is _b= _bs, and that the direction of _bs relative to
the normal n indicates that the impending motion is directed up the incline. For
equilibrium of the block,
M[ZF_. = 0]---> + --- Rsin(_b s + a)=0 (3.2)
r
[ZF.,. =011" + Rcos(¢s +a)-W=O (3.3)
Solving Eqns. 3.2 and 3.3, the smallest torque that will cause the weight W to move
upward is
(M)_ = M_ = Wr tan(_b s + a) (3.4)
If the direction of M is reversed and assuming impending motion down the incline, the
FBD in Fig. 3.5(c) must be used. In this case, the equilibrium of the block,
M[EF x = 0] --->+ Rsin(_, - a)-p = 0 (3.5)
r
[ZF_ - 0] 1" + R cos(_s - a)- W = 0 (3.6)
18
Figure 3.3 Modeling of Square-Threaded Bolt (20).
W
r
r
r /---Jackr _. _ /Collar
:....... ::_ _'--.._=: i:i:i _"-:.:
I :::::: N::: ,, _.-.-__ _i_
w/2 C M
'::_ _!i Thread of
::::::::::::::::::::::_ii_,ckCoUa,:: :.:: ::_/:::_ .'.:, --
_ii:!X_..contact
al'_a
- i5_ _,
Figure 3.4 Square-Threaded Screw Jack (20).

19
W
Q = M/r
i.
Y
L_x
(a) Modeling as Block on lnclined Plane.
M/r
W
F'
n
M/r
W
n
(b) Impending Motion Up the Plane (lifting W).
F ---, It
n
MIr
W
¢=
/1
(c) Impending motion Down the Plane (lowering W).
Figure 3.5 Modeling of Square-Threaded Screw as
Block on Inclined Plane (20).
MIr
20
Solving these equations as before, the smallest torque required to move the weight W
downward is
( M),_ = M, = Wr tan(q_ s - a) (3.7)
Note that if _bs > a, the torque M in Eqn. 3.7 is positive, which means that the weight W
remains at rest if M is removed. In this case, the screw is said to be self locking. On the
other hand, if _bs < a, the torque M in Eqn. 3.7 is negative, indicating that the weight W
would come down by itself in the absence of M. If _bs = a, the screw is on the verge of
unwinding.
Assume that the square-threaded screw jack in Fig. 3.4 is replaced by a V-thread
as indicated in Fig. 3.6 (the helix angle of the thread is exaggerated for clarity). The force
R acting on a representative small section of the thread is shown in Fig. 3.6 with its
relevant projections. The vector R I is the projection of R in the plane of the figure
containing the axis of the screw.
• 'Lr
]/V
t
Figure 3.6 V-Threaded Screw Jack (20).

(24) as
21
Themomentonthe screwrequiredto raisetheloadW in this case is given in Ref
M_ = Wrtana+g_/1 +tan 20cosZ a ]
1 - ptan a_l + tan 2 -0cos2 a2
(3.8)
r
Lwhere a = tan -1
2nr
_b= tan -I fl
The M required to lower the load W is
- tan a + p J1 + tan 20cos2 aWr l --_---_-' -_ 2m z =
° os o2
(3.9)
It should be noted that for the case where 0= 0, i.e., a square thread, Eqns. (3.8) and
(3.9) reduce to Eqns. (3.10) and (3.11) respectively.
Mn = Wrtana+p
1-/ztana(3.10)
M, = Wr p- tan a1 +/.t tan a
(3.11)

ik
22
Equations (3.4), (3.7), (3.8), (3.9), (3.10), and (3.11) can be written as
MR = WrC.
M, = WrC ,
(3.12)
(3.13)
?,
where C R and C r are the terms other than Wr in each equation.
The equations for lowering the weight W, i.e., Eqns. (3.9), (3.11), and (3.13) are the
appropriate equations to use in the case of bolt loosening. It should be noted that the
torques needed to overcome thread friction as well as to lit_ the weight W (or to develop
the bolt preload Pp) are included in the equations for M R and M L above. For example, in
the absence of friction, taking _b= 0 in these equations will yield the torque needed to lift
the weight W. Of course, in the absence of friction, this torque would have to remain in
place to prevent the weight from lowering due to the screw unwinding.
Plots depicting the variation in CR and C L in Eqns. (3.10) and (3.11) with
coefficient of friction (/_) and thread angle (a) are shown in Fig. 3.7. This figure indicates
that the coefficient C ( CR and C L), and thus the torque required to overcome thread
friction and to lift or lower the weight is almost independent of a. Also, the figure
indicates that C varies approximately linearly with _t. Note that a/_ of approximately
0.025 - 0.040 is required to prevent a screw/nut from unwinding by itself. Also note that
the C values for the coarser thread, i.e., 10 threads per inch are slightly larger than those
for the finer thread in raising the weight, but are smaller for lowering the weight. This is
as would be expected. Note also, that C R _ C L _/_ is a rather good approximation of C.
An alternate approximation equation for bolt torque to overcome thread fiiction is
presented below. In deriving this equation, it is assumed that motion at the bolt/nut thread
interface is impending in both the radial and circumferential directions as indicated in Fig.
3.8. Hence,

23
CR, CLON 3/4"¢ BOLT
ON 3/4"0 BOLT
M R = W.r.C R
M L = W.r.C L
Figure 3 7 Variation in (?R and C L with Bolt Thread
Angle (or) and Coefficient of Friction (I.t).
i _ o (STANDARD
Pp (BOLT PRELOAD)
i,
Figure 3.8 Approximate Forces on a V-Threaded Bolt
at Impending Slipping.

24
)
[x< =o]q'+N +I'_-F_,_.,_,,-P =0
0 0N cos- + p_N sin - - P = 0
2 2
0N(cos +/a_. sin _-) = P
PN = P (3.14)
0 0cos- + p_ •sin -
2 2
0 0-- + Ps sinc°s2 2
(3.15)
Hence, the torque, M, required to overcome thread friction is approximately
cos- + Ps sin2
(3.16)
It should be noted that the M required to develop the preload Pp is not included in
Eqn. (3.16). For convenience of comparison with the earlier equations, the torque
required to develop preload (see Eqn. (3.21)) should be added (or subtracted for
loosening) to Eqn. (3.16). This results in
:i
i
-<
25
F,Us
M_ = Pr| 0 0
Lcos- + Its sin -2 2
_-tan a (3.17)
ML -- Pr 0 y'_ -tana
I cos_ + `us sin O
(3.18)
Ganguly (11) presented Fig. 3.9 and Eqns. (3.19) and (3.20) for torque to
overcome thread friction. Referring to Fig. 3.9, the normal force component
perpendicular to the thread flanks is Pc. Hence, the circumferential friction force is
, ",(
(a)
(b)
Fc,_c_ --`UsP_=`us--
e,
= PB • --Pae = BOLT AXIAL LOAD
a 2m"
iScrew/ [
Bolt
Axis [
I
pp r,Ps _ /Pc'co_°
P " Pc
0C0S--
2
(3.19)
c_ = Thread lead angle
Pp = Axial load
P_ = Normal force component of
axial load perpendicular to
thread helix
0 = Thread angle
Pc = Normal force component of axial load
perpendicular to thread flanks
Figure 3.9 Thread Friction Force (11).

26
r
Therc,,(_re, the torque to overcome thread friction is approximately
(3.20)
Again, for convenience of comparisons, the torque required to develop the preload should
be added to the M of Eqn (3.20)• This yields,
(3.21)
(3.22)
Recall in Chapter II it was reported that researchers in Japan found experimentally
that when the bevel angle of the threads was decreased from ._8= 30 ° to approximately2
0 25 °, then the bolts did not loosen under vibratory loadings. In light of Eqns. (3 16)2
and (3.20) this does not make sense theoretically, as both of these equations yield smaller
values of C, and thus smaller torque to overcome thread friction when O is decreased.
In addition to the bolt/screw torque required to overcome thread friction, a torque
is required to raise a load W or to develop a preload Pp in the absence of friction. As
illustrated in Fig. 3.10, this torque (Mp) is given below in Eqn. (3.23).
Mp = (P tan a)r

27
M = Prtana (3.23)
or,
5: "
M = P p (3.24)P P2ztr
Of course, in the absence of friction, the torque in Eqns. (3.23) and (3.24) must be
maintained or the bolt/screw will unwind itself.
A comparison of the torques required to overcome thread friction and to develop
the preload for various thread types and simplifying assumptions are shown in Table 3.1.
Each of the equations has been placed in the form,
ML =CLpp r (3.25)
and the expressions for C L along with values for various values of p. are presented in
Table 3.1 and are plotted in Fig. 3.11.
Figure 3.11 indicates that all of the equations for C L require a/_ of approximately
0.025 to prevent the screw or nut from unwinding by itself. This is as would be expected.
Note that all of the equations for C L are linear in _t with the exception of the one labeled
C. Also note that
is not a bad approximation for C L .
C L -_ t,t (3.26)

28
h/p/r
2/t'r
P = a2_r
Mp/r
Figure 3.10 Forces and Torque Needed to Develop Preload, Pp.

29
Table 3.1 Comparative Equations and Values of C L
for Different Thread Types and Simplifying Assumptions
• i:il
Eqn No. CL Eqnst Label in Values of C Lat
Fig. 3.11 la=0 p=0.1 p=0.2 p=0.4 la=0.5
-tana+/.tA1 [ + tan 2 --0cos2 a
3.9 _/ 2 A -0.027 0.089 0.203 0.430 0.542
1 +/ttan a_l + tan 2 0c°s22 a
3.11 p-tana B -0.027 0.073 0.173 0.370 0.467
1 +ptan tz
3.18 P tana C -0.027 0.082 0.180 0.348 0.4210 0
cos- +/,t sin -2 2
3.22 P -tana D -0.027 0.088 0.204 0.435 0.5500
COS--2
-'rMz = C_. Ppr (Mr. =Moment required to lower a weight).
:_Values shown are for 0= 60 ° and a = 1.52 ° (16 threads per inch on a 3,4"_ bolt).

3O
CL
M L = CL.P.r
4).I
Figure 3.11 Comparative Plot of C L Values vs. M for
Various Thread Prediction Equations.
Also, an additional bolt/screw torque (M n) is required to overcome friction forces
developed under the bolt head or nut. These forces and resulting torque are as illustrated
in Fig. 3.12.

31
:_;,= #,,p
(3.27)
M,, _/'r#. (3.28)
f Y
f
/AT _
SLIPPAGE
r o
PRIOR TO
SUPPING
Figure 3.12 Forces and Torque to Overcome Bolt Head Friction.
• ._']
[
7
,'i ¸¸ "
For structural steel bolts as specified in Ref. (1), the ratios H/D and D/Da_ are shown in
Table 3.2. The variables H, D, and D M are shown in Fig. 3.13.
Table 3.2 Dimensional Ratios for Structural Steel Bolts
D (in) H (in) H / D D M (in) D / D M
0.25 0.4375 1.75 0.220 1.14
0.50 0.75 1.50 0.453 1.10
0.75 1.125 1.50 0.689 1.09
1.00 1.50 1.50 0.924 1.08
H
D
Figure 3.13 Structural Steel Bolt.
DM

32
Based on Table 3.2, a H/D ratio of l.5 and a D/D_ 1 ratio of 1.10 are reasonable values
to use to estimate the moment required to overcome friction forces under the bolt
head/nut to loosen the bolt. These yield
/
r° = 1.51; (ro and r, are defined in Fig. 3.12)
r = 1.10r,,
where r_ is the mean radius of the bolt threads and is the r used in the equations
summarized in Table 3.1. Hence, from Fig. 3.12
1.10r M+ 1.5(1.10r,,) = 1.375r M (3.29)2
to allow for the facts that (1) ram in Fig. 3.12 is actually somewhat larger than (ro + r, )/2,
and (2) there will be a clearance between the bolt edge and bolt hole, the value above
should be increased by approximately 5%. This yields
t'._ _ 1.45r M (3.30)
In turn, using Eqn. 3.28, this yields a moment required to overcome friction under the bolt
head/nut of
M,, _ 1.45/2,,Pr_, = 1.45fl,,Pr (3.31)
where 1.45/2, = C = C L = C R
Recall from Eqn. 3.24 that C L used in determining the moment required to overcome bolt
thread friction was approximately equal to/2. Hence,

33
M = C, Pr _ pPfl"
If PH = P then
(3.32)
M,, = 1.45M (3.33)
and is the dominant frictional moment to be overcome to loosen a bolt.
M_o_ = M+M,, = (C_ + 1.45p,,)Pr
MT_ _ (p + 1.45pH)Pr
Obviously,
(3.34)
(3.35)
Recalling that
p =¢rr 2fff. (3.36)
where f = fraction of o- employed.
one can see the primary parameters affecting bolt loosening under static loading based on
the mechanics of threaded fasteners are
M7 c _ (p + 1.45p,_ )(nrZfo',. )r (3.37)
/_) [ '
or,
M_ ''c _ f,(r 3 ,%.,f,l.t,kt,,) (3.38)
where M L varies in a linear manner with all parameters except for the bolt radius (or
diameter), where it varies as the cube. Obviously, if a locknut of some type is used, M L
will be increased in direct proportion to the moment required to overcome the locking

device component of the locknut.
bolt loosening and,
34
Thus, the locknut device would be a major parameter in
M_ _c = f2 (r3 , o-. ,f ,/_,_',,, locknut device) (3.39)
Additionally, looseness of the bolt/nut thread fit, i.e., the class of fit (CF), as well
as bolt/bolt hole fit, i.e., the hole tolerance (HT), will affect bolt rocking, pinching, and
micro impact loadings. These in turn will affect bolt loosening under vibrational loads.
Theoretical considerations indicate that thread angle a (see Fig. 3.7) is not an
important parameter to static bolt loosening. However, it is related and similar to the class
of fit, with fine threads corresponding to small clearances between the threads. Because
vibrational loadings have the potential to bend bolts in the region of the threads and thus
cause bolt rocking and pinching and inter thread movements, it is anticipated that fine
threaded fasteners will perform in a superior manner under vibrational loadings.
Additionally, fine threaded fasteners have root of thread areas approximately 15-25
percent larger than their course threaded counterparts. This allows 15-25 percent larger
preloads and this would be quite significant in mitigating bolt loosening.
Lastly, the character, magnitude, and duration of vibrational loadings, along with
the geometrical setting of the bolt sustaining these loadings should have major impacts on
bolt loosening. Thus,
M'_ "_°" = f3 ( r3 , o-,f,kt,¢t,,, locknut device, CF, HT, or,
vibrational load parameters, bolt setting/mode loading)
(3.40)
1

35
3.4 Effects of Vibratory Loadings on Bolt Loosening
The primary effects of vibrational loadings on bolt loosening are probably the
following:
• Possibly having the loading frequency coincide with a natural axial vibration frequency
of the bolt.
• Possibly having the loading frequency coincide with a natural frequency of the
structural assembly that the bolt is connecting.
• Possibly causing minute transverse thread sliding due (a) to load eccentricities and thus
bolt rocking action, (b) bending in the connected parts, or (c) transverse impact
loadings.
Each of these primary effects is discussed below.
1. Vibration at bolt natural frequency. A bolt's fundamental axis natural frequency can be
estimated as indicated in Fig. 3.14. If the lower plate in that figure is positively
connected to the nut, and the bolt is loose, i.e., without preload, then the mass of the
plate should be lumped on the end of the bolt model in Fig. 3.14. This would cause
the natural frequency to decrease drastically. However, if the connection is a typical
one where the plates connected are not attached to the bolt, but the bolt is under a
preload, then it would only be appropriate to lump the mass of the plate on the end of
the bolt if in turn the axial stiffness (k) of the model in Fig. 3.14 is increased to the
value indicated in Fig. 3.15. This would be the ease since when the spring force cycles
to "tension," the plate interfaces remain in contact and reduce the level of
precompression, i.e., they act as a monolith. As indicated in Fig. 3.14, bolt axial
?
, i .¸

:L
i
36
frequencies are very large, and it would be very rare that vibrational loadings on a
bolted system would contain frequencies this high.
Axial impact loadings result in the propagation of a compression wave at very high
velocity. Depending on the boundary conditions this wave could be reflected back and
forth at frequencies of the same order as those of the bolt's natural frequencies. This is
illustrated by the example in Fig. 3.16. Vibrations such as these could cause minute
thread interface slippage or movements with each passage of the wave. This in turn
would promote bolt loosening.
T1
ItNN
_////////////////_
K
IM
Figure 3.14 Modeling and Estimating Bolt Axial
Fundamental Natural Frequency.
<-
Figure 3.15
><
Axial Stiffness of Connected Plates.

' 37
i,
: ;L
\\\
///
Figure 3.16 Axial Impact Loading Propagation.
. Vibration at natural frequency of connected assembly. Vibrational loadings which
coincide with a natural frequency on the bolted assembly cause resonant vibration of
the assembly. These in turn result in large amplitude displacements and g-forces. It is
expected that the build-up to large displacements and the ensuing bolt twisting or
rocking action (discussed in the next section) in particular, create an environment
which is conducive to bolt loosening. The direction or mode of vibration of the
assemblage in conjunction with the bolt geometrical arrangement will dictate the type
of loading actions on the bolts, i.e., axial, shear, twisting, bending/prying/rocking, as
illustrated in Figs. 3.17 - 3.19. Obviously the type of loading will have a great impact
on bolt loosening. The literature indicates that vibrations which induce forces
transverse to the axis of the bolt are the most severe for inducing bolt loosening.
Vibrations causing forces parallel to the axis of the bolt are not likely to induce
loosening unless they induce bolt prying action and/or bolt rocking.

, . J
'i
:L
i
7
_i!i!
[-
.
38
Transverse sliding. Haviland (13) presents an excellent discussion of the loosening
tendency of bolted joints due to transverse sliding. The discussion and illustrations
presented below are a shortened and modified version of that presented by Haviland.
All bolts and nuts are made with a clearance between them to assure easy
assembly. This means that the bolt/nut can be moved sideways. Recall that the helical
thread is an inclined plane with the nut sitting on it, held against sliding by friction.
The effects of a sideways movement on an inclined plane can be illustrated by placing a
small pad on the side of a slippery book as indicated in Fig. 3.20. Now, tip the book
upwards until the pad almost slides and try to slide the pad sideways with your finger.
The pad slides downhill every time it is pushed sideways. It is not necessary to push
the pad downhill due to the fact that it's weight moves the pad in that direction. This
is what happens to a loaded thread made to slide sideways.
Additionally, a side-sliding thread has a ratcheting action. Consider a cross section
through the centerline of a bolt and nut as illustrated in Fig. 3.21. As the nut is moved
into the page, the fight side is moving uphill and the left downhill. Obviously, The
uphill side will move with greater difficulty and acts as an anchor around which the nut
rotates on the left side. If pulled from the page, the left side becomes the anchor and
the right side rotates downhill. The net effect is small unwinding motions each time
the nut is cycled sideways.
Shear or side sliding is a common phenomena for bolted assemblies. It can be
caused by bending of the assembly as illustrated in Figs. 3.17 - 3.19, by differential
thermal expansions of the assembly, by shock or impact loadings such as indicated in
Fig. 3.22, and by numerous other manners. It should be noted that the higher the
clamping force, the less likely there is to be side movement; but if side down
movement occurs, the bolt preload force will unwind the threads.
L

39
• • (:i
r:
i ¸ ,
• • ? .
i f
Figure 3.17 Transverse Bolt Loading Through Assemblage Bending (13).
Bolt motion
Thread
. _ _o_ 1Figure 3.18 Bolt Rocking Motion (13).

• • / j'
4O
_, i¸ :_
Figure 3.19 Cantilever Beam of Two Flat Bars Bolted Together (19).
Force
a) Modeling of Nut on IncliningPlane of Bolt.
\
b) Simulation of Transverse Sliding.
Figure 3.20 Modeling of Bolt/Nut as Inclined Plane and Transverse Sliding (13).

i i _ m
? q,i?r
, ) ,
i¸•.¸ i•,
41
_is;i_e _ _si_
dow ill
Figure 3.21 Ratcheting Action of a Side Sliding Thread (13).
L
,' _ i ¸ ]
k :ii '_
Figure 3.22 Transverse Shock Loading (13).

i__- ._
A
42
3.5 Primary_ Parameters Affecting Bolt Loosening
There are probably 80-100 parameters that have some impact on bolt loosening.
The entire range of all these parameters could not be explored in this experiment.
Through literature review, theoretical considerations, discussions and meetings with select
personnel of MSFC, and engineering judgment the parameters that were felt to be
dominant were identified• These parameters were investigated in this study in order to
identify their degree of contribution to bolt loosening. Each parameter tested in this
experiment is listed below along with a brief explanation for its selection.
1. Bolt size (diameter): Fatigue resistance decreases with increasing diameter (8).
Vibration resistance may exhibit the same relationship. Theoretical considerations (see
Eqns. (3.39) and (3.40)) indicate bolt loosening moments vary with the cube of the bolt
radius.
2. Lubrication on bolt: Lubrication on the bolt threads causes the coefficient of
friction between bolt and nut threads in contact to be reduced, thus causing the bolt's
resistance to loosening to be decreased•
3. Hole tolerance: The tighter the tolerance on the hole in a bolted connection,
the less likely loosening is to occur within that connection.
4. Initial pre-load: An increase in preload causes an increase in vibration
resistance (9).
5. Locking device: A nut which has a locking device is less likely to loosen than a
nut that does not have a locking device.
6. Grip length: The longer a bolt's grip length, the more likely the bolt will
experience bending deformations, thus reducing the bolt's capability to maintain its

43
preload.Thereareconflictingreportsin the literatureon theeffectof thisparameter.For
longer bolts, it appears that bending and possibly fatigue occurs rather than loosening.
7. Thread pitch: The steeper the angle of the bolt threads, the less likely the bolt
will be able to maintain friction between contacting threads of the bolt and nut, thus the
less likely the bolt will be able to resist vibration (18). Also, fine threads allow larger
preload and this should mitigate bolt loosening.
8. Lubrication between mating materials: Lubrication between the mating
materials causes the coefficient of friction between contacting surfaces to be reduced, thus
causing the joint's resistance to loosening to be reduced.
9. Class of fit: There is always some clearance between the threads of the nut and
bolt to assure easy assembly (13). Class of fit dictates how much clearance is between
threads. The less clearance between threads, the greater the resistance to loosening the
connection will have.
10. Joint configuration: Two different test configurations were used in order to
employ as many different joint assemblies as possible.
11. Mass of configuration: As the mass that a bolt must clamp down increases,
the inertia forces that the bolt must resist under dynamic loading increases as well, thus
increasing the probability that the bolt will loosen.
In addition to the design parameters listed above, there will be several noise
parameters (see Section 4.2) implemented in the experiment• Each noise parameter is
listed along with an explanation for its selection.
1. Vibration direction: Both the axial and transverse (in relation to the axis of the
: bolt) directions of vibration were used in order to explore the effect of vibration direction
..... ;_ on loosening.
?

44
2. Magnitude/Level of vibration amplitude: Two different g-levels were used in
order to explore the effect of amplitude on loosening. As previously indicated, frequency
of vibration affects bolt loosening, and both resonant and random vibrations were explored
during preliminary testing. Because the preliminary testing indicated greater bolt
loosening with random vibrations, and because these vibrations were considered to be
more representative of actual flight conditions, this parameter was held constant, i.e., at
random vibrations for all tests. Dur_,v_._onof vibrations also affect bolt loosening. Because
of the short duration during flight in which significant vibration levels are experienced, this
parameter was held constant at 2 minutes for all tests. This is approximately 3 or 4 times
actual vibration durations experienced during flights.
As previously noted, these parameters do not cover every possible parameter that
could contribute to bolt loosening. However, the parameters chosen for this experiment
are those that are believed to contribute the most to bolt loo,,_.-:_:'_,i_lg.
.Ol_O|N_t. PAGE P3esF_ _D,L_'rv,

IV. DESIGN OF EXPERIMENT AND
EXPERIMENTAL TESTING PROGRAM
4. l General
In this chapter, a description of the experimental design techniques used in the
project is provided. Also provided is a discussion of the test parameters, a discussion of
Taguchi methods, a presentation of the test matrix, a description of the equipment, test
specimens, and testing program, and a discussion of additional testing conducted.
4.2 Experimental Test Parameters and Values
The design and loading/noise parameters listed in Section 3.5 were selected for
experimental testing in this investigation. To keep the testing program within reasonable
time and financial limitations, only two values of each test parameter were utilized. For
each parameter, the 2 values selected should ideally be the upper and lower limits of
values that could be expected in practice. However, because of availability of products or
cost limitations, some parameter values used were not the limiting values. Design and
load/noise parameters and values used in the experimental testing are summarized in Table
4.1. It should be noted that some of the experimental testing parameters and values were
not finalized until after preliminary testing was performed. The vibration amplitude was
the only final parameter that was varied in the testing program, which fell into this
category. However, vibration signature, i.e., resonant or random vibration was finalized
45

46
afterpreliminarytestingandit wasdecidedto performall testingunderrandomvibration
loadings.Thevibrationdurationof 2 minuteswasalsofinalizedafterpreliminarytesting.
i,
. i
Table 4.1 Test Parameters and Values
Test Load/Noise
Parameters Parameters
Parameter Values
# 1(lower values) #2(upper values)
Bolt Size
Lubrication on Threads
Hole Tolerance
Bolt Preload
Locking Device
Grip Length 1
Thread Pitch *
Lubrication on Mating Parts
Class of Fit
Joint Configuration
Mass of Configuration
1/4" _b 3/4" d_
None Tri-Flow
Oversized Fit Tight Fit
40% Py 80% Py
Plain Nut Self-Locking Nut
1/2", 1" 1", 2"
20,10 28,16
None Tri-Flow
2 3
Eccentric Concentric
Mass of Specimen Mass of Specimen+ Additional Mass
Vibration Direction
Vibration Amplitude
Axial Transverse
27 grms 40 grms
1-1/2" - 1" for 1/4"dpbolts and 1" - 2" for 3/4"qbbolts.
:1:20 - 28 for 1/4"_ bolts and 10 - 16 for 3/4"d_bolts.
• 5 _ i_ i_
.,, •,_i • _-
_ _i. _
4.3 Ta_qachi Methods
When conducting experiments, it is imperative that the procedures used to carry
out the experiment and the results obtained from the experiment can be reproduced. Also,
it is important to conduct a cost efficient experiment• Dr. Genichi Taguchi has developed
a set of techniques that implement statistics and engineering knowledge to meet these
criteria. The principle contribution of Taguchi methods to this investigation is the concept

iii_i
? •
47
of the orthogonal array. In an orthogonal array, the relationship of the factors under
investigation is such that for each level of any one factor, all levels of the other factors
occur an equal number of times. This allows the effects of one particular factor under
investigation to be separable from the effects of the other factors. The orthogonal array
also allows the experiment to render a maximum amount of data with a minimum amount
of testing. All combinations of all factors are not required to be tested, making the
experiment cost efficient.
According to Taguchi, there are two different types of parameters that can be
explored; design parameters and noise parameters. Design parameters are those
parameters which the designer has control over. Noise parameters are those parameters
that the designer has no control over (22).
4.4 Test Matrix
r
In this experiment, there were eleven design parameters to be tested as well as two
noise parameters (see Section 3.5 and/or Table 4.1). Using Taguchi's orthogonal arrays
(25) an L_2 array was determined as the most beneficial array to use for the experiment.
The L12 is a specially designed array that is used to determine only the main effects of the
parameters. No interactions between the parameters are explored. This allows the
experimental data to reveal which parameters contribute to loosening and the relative
extent of their contributions. Where feasible, each design parameter and noise parameter
had an extreme high and low level as indicated earlier. This was done in order to bound
any loosening that might occur within these extreme levels. Each combination of design
parameters, as dictated by the L!2 array, was tested using both levels of both load/noise

4
%
48
1 1/4" None OF 0.4 PN 0.5 20 None 2 A X
2 1/4" None OF 0.4 PN 1.0 28 Td-Flow 3 B Y
3 1/4" None TF 0.8 SL 0.5 20 None 3 B Y
4 1/4" Td-Flow OF 0.4 SL 0.5 28 Td-Flow 2 A Y
5 1/4" Td-Flow TF 0.8 SL 1.0 20 Td-Flow 2 B X
6 114" Td-Flow TF 0.8 PN 1.0 28 None 3 A X
7 3/4" None TF 0.8 PN 1.0 16 Tri-Flow 2 B X
8 3/4" None TF 0.8 SL 2.0 16 None 2 A Y
9 3/4" None OF 0.4 SL 2.0 10 Tri-Flow 3 A X
10 3/4" Td-Flow TF 0.8 PN 1.0 10 Td-FIow 3 A Y
11 3/4" Tri-Flow OF 0.4 PN 2.0 10 None 2 B Y
12 3/4" Tn-Flow OF 0.4 SL 1.0 16 None 3 B X
A OF = Ovelsize Fit C
TF= Tight Fit
B pN= Plain Nut D X= Small Mass
SL= Self Locking Nut Y= Large Mass
Raqdom Vibration
Axial Direction Trans D_rection
g g g g_j ,_l,j ..J
6, & & 6,
,../ I --J I
A= Eccentric Joint Configuration
B= Concentric Joint Configuration
Figure 4.1 Test Matrix.
parameters. Also, each test was repeated to give the data statistical credence and to gain
some measure of repeatability and experimental error. The test matrix employed is shown
in Fig. 4.1.
4.5 Test Set-up
Small aluminum test specimens were mounted on a generic 22" mounting cube.
This cube in turn was mounted on one of the shake tables in the Structural Testing
Laboratory at MSFC. The two directions of vibration used in testing are shown in Fig.
4.2. To achieve vibration in the axial direction of the bolt, the test
specimen was mounted on the top of the 22" cube and the shaketable applied vibration in
the vertical direction. To achieve transverse vibration, the test specimen was mounted to

49
(a) 2-Piece Cantilever Vibrated in Axial Direction
(b) 2-Piece Cantilever Vibrated in Transverse Direction
Figure 4.2 Photographs of Typical Test Set-ups _.
1please note that both 1/4" and 3/4" bolts were used in testing, but only the 1/4" bolts are shown in Fig.
4.2•

r
i!i_?
50
: ':'"'"•":::"*?!!!!!:!:::::!ii!!!!!!i:i!iiii:ii......
_::.::2?::,iX
(c) l-Piece Cantilever Vibrated in Axial Direction
(d) l-Piece Cantilever Vibrated in Transverse Direction
Figure 4.2 (cont.) Photographs of Typical Test Set-ups.

_ _i ¸¸
? . ,
• i
,?
51
the side of the 22" cube while the shaketable vibrated in the same vertical direction.
Photographs of typical test set-ups are shown in Fig. 4.2.
It should be noted that it was originally planned to use load cell washers to
measure initial bolt load and bolt load after vibration testing. However, preliminary testing
resulted in malfunctioning of the load cell washer after vibration and this set-up and means
of monitoring loss ofpreload had to be aborted. In its place, it was decided to measure
the test bolt length prior to preloading, after preloading but before vibration testing, and
after testing as a means of monitoring bolt preload and loss of preload. Precision
micrometers were used in making these measurements and this method was employed in
executing the test matrix of Fig. 4.1. As an alternate or backup in determining bolt loads
and loosening, nut on-torque and off-torque were measured in the test set-ups. These
data were used to estimate bolt load and thus loss of preload or extent of bolt loosening.
A test set-up sheet for each of the 12 set-ups is provided in Appendix A. These
sheets show the test specimen and joint configuration for each set-up and the values of the
test parameters for the set-up.
4.6 Test Specimens
The test specimens used in this experiment were one piece and two piece
cantilevers, as shown in Fig. 4.3 and 4.4. The dimensions of the cantilever specimens
were different based on the diameter of the bolt to be tested by the specimen. This was
done in order to keep the load on the 1/4"d_ bolt proportional to the load on the 3/4"d_ bolt
based on the ratio of the two bolt areas, i.e.,

52
fl •
Ratio of bolt areas:
Ratio of bolt loads:1�4"load % cryA, 1
3�4"load % _yAt 9
The smaller specimens (PS series) were used with the 1/4"00 bolts and the larger
specimens (PL series) were used with the 3/4"¢ test bolts. Likewise, different sets of
lumped masses were used with different bolt sizes. Test set-ups 1-6 employed the 1/4"¢
bolts and the smaller test specimens. Set-ups 7-12 employed the 3/4"_ bolts and larger
specimens.
The two piece cantilever configuration is designed to introduce axial load and a
prying action on the bolt when vibrated in the bolt's axial direction and shear and torsion is
induced when vibrated in the bolt's transverse direction. The one piece cantilever
configuration introduces axial load in the bolt when vibrated in the axial direction, and
shear when vibrated in the transverse direction. Additional masses were used to achieve
the desired mass of configuration and grip length desired when necessary.
All test specimens are made of6061-T6 aluminum and all additional masses were
made of A36 steel. They were fabricated by the machine shop at MSFC. Design/
fabrication drawings were provided by the authors and a copy of these is provided in
Appendix B. Also included in that appendix is a listing of the bolts and nuts used in the
testing. All were commercial grade fasteners.

/:i 53
Steel Plate (8" x 8") Pins
i...J ...._
Cube
Test Fastener
PS1, PL1
Accelerometer
(Not to scale)
Figure 4.3 Typical One Piece Cantilever.
Steel Plate (8" x 8") Pins
i_ '! 1
_ L--
Cube
Test Fastener Aecelerometers
i i I PS3, PL3PS2, PL2 U
(Not to scale)
Figure 4.4 Typical Two Piece Cantilever.
L

. i!
::;
/
4.7
54
Test Equipment and Instrumentation
The following is a description of the equipment used to carry out the testing as
prescribed by the test matrix.
1. MT Ling Model B-335MS vibration machine
2. 382 Hewlett Packard computer
3. 35650 analog-to-DC and DC-to-analog converter and input modulus
4. LMS CADA-X version 2.8 software
5. UD amplifier 660
6. Endevco control accelerometer model 2213-E
7. Endevco response accelerometer model 2226
8. Endevco charge amplifier model 2735
9. Sony recorder PC116
10. Consolidated Services torque wrench model 2503DF (for 3/4" _bbolts)
11. Consolidated Services torque wrench model 6002DI (for 1/4" _bbolts)
12. Links Micrometer Models 90-2646 (1" - 2"), 90-0150 (2" - 3"),
90-0490 (3" - 4"), 90-0120 (4"- 5")
13. StressTel Version 1.3 BoltMike
4.8 Testing Program
The testing program consisted of conducting the following testing in the sequence
indicated.
Preliminary Testing
Execution of Test Matrix (Fig. 4.1)
Static On-Torque and Off-Torque Testing
Confirmation Testing

f:
55
• Additional Testing
Each of these are described in the subsections below.
4.8.1 Preliminary_ Testing
Preliminary testing consisted of several experiments that were intended to indicate
the proper vibrational loads to use in the actual testing as well as to finalize values for
several test parameters. Tests were run on 1/4"_b bolts. This was done because it was felt
that the 1/4" # bolt would loosen more readily.
Several different one piece and two piece cantilevers, with and without masses
attached, were subjected to sinusoidal and random vibrations in order to determine the
optimum vibrational load for bolt loosening. The only loosening that occurred during this
testing was due to random vibration. Originally, a g-level of 60 grms was to be used for
Level 2 in actual testing, but this proved to be too severe and fatigue problems in the test
specimen arose. For this reason a g-level of 40 grms was chosen for Level 2.
As previously noted, time of duration for each test was based on the actual time a
piece of hardware would experience vibration in flight with some factor of safety. Thus,
time of duration for each test was set at 2 minutes. In preliminary testing, this time
duration did not present fatigue problems for the test specimen, and thus was deemed
acceptable.
4.8.2 Execution of Test Matrix
The test matrix shown in Fig. 4.1 required 12 different test set-ups, and for each
set-up 8 different tests were performed (2 vibration directions, 2 vibration g-levels, and 1
replication test of each set of parameters). Each of the 12 different test set-ups is listed in

• i
56
detail in Appendix A, and the 8 tests performed on each set-up are identified as tests a
through h in Table 4.2.
Table 4.2 Test Set-ups
tTest Vibration Direction g-level
n a Axial 1
nb Axial 1
n c Axial 2
n d Axial 2
n e Transverse 1
n f Transverse 1
n g Transverse 2
n h Transverse 2
tn indicates set-up 1-12.
The following test procedure was used in each of the 96 tests conducted in
executing the program test matrix.
,
2.
.
4.
.
Secure a new bolt and nut for the test.
Clean test specimen, bolt, and nut with an alcohol solution to insure that no
grit was present between mating parts.
The test configuration was assembled as prescribed by the test matrix.
For Configuration 1, one accelerometer was mounted at the test bolt, as
shown in Fig. 4.4. For Configuration 2, two accelerometers were mounted
at the test bolt and at the end of cantilever respectively, as shown in Fig.
4.3.
The untorqued bolt length was measured and recorded.

.
.
.
.
10.
57
The torque required to produce the desired bolt load was applied,
measured, and recorded.
A sine sweep (10 - 1000 Hz 0.25 gpk, 2 oct/min) was performed in order to
determine the configuration's first mode of natural frequency.
The test configuration was vibrated for 20 seconds using Level-1 in order
to burnish the pieces to insure that any settlement between mating materials
will not contribute to any preload loss.
The configuration was subjected to the load parameters as prescribed by
the test matrix.
The change in bolt length and the torque required to loosen the nut were
measured and recorded.
4.8.3 Static On-Torque and Off-Torque Testing
t'
, .., ,i_ •
On-torque is the torque required to achieve a desired bolt preload (tightening).
Off-torque is the torque required to achieve first slippage between the bolt and nut
(loosening). In the testing performed, on-torque was measured before vibration and off-
torque was measured after vibration in order to measure any loosening that took place
during vibration. These on-torque vs. off-torque values can be compared to values taken
for bolts that have experienced no vibration. The difference in the two averages can be
attributable to loosening. Static on-torque and off-torque tests were performed in order to
make these comparisons.
Each set-up as prescribed in the test matrix was used in order to measure on-
torque and off-torque on the bolt with no vibration. In each test, a bolt was torqued to the
on-torque value used in the vibration testing and then immediately untorqued. The on-
torque and off-torque values were recorded. This process was repeated twice more on a

i!_il
58
particular bolt for a total of three on-torque and off-torque measurements per bolt. Three
bolts were used for each set-up. It should be noted that the bolts and nuts used in this
testing were the same ones used in the vibration testing, i.e., they were all "once used"
bolts/nuts.
4.8.4 Confirmation Testing
/
.: ,i • •
The data from executing the program test matrix was analyzed in the manner
described in Chapter V. Results of this comprehensive analysis revealed many things
including whether each of the 11 design parameter's high and low values had a favorable
or unfavorable effect on bolt loosening. Based on these results, two confirmation tests
were derived. The first test grouped all parameter levels that would be unfavorable to bolt
loosening, as shown in Table 4.3. The set-up was vibrated in the axial and transverse
direction and at the low and high g-level in each direction, resulting in 4 runs for the test 1
set-up. The second test grouped all parameter levels that would be favorable to bolt
loosening, as shown in Table 4.4. This set-up was also vibrated in the axial and transverse
direction and at the low and high g-level in each direction, resulting in 4 runs for the test 2
set-up. It should be noted that no repetitions were run in this phase of testing and that all
bolts used were also used in previous testing. The procedure that was used to carry out
the confirmation testing was the same as described in Subsection 4.8.2 with one exception.
At the end &the vibration testing for each run, the static on-torque and off-torque testing
was conducted while the specimen was still mounted on the shaketable.
¢ .

• :i • ?_
59
Table 4.3 Confirmation Test 1 Set-up
Parameter Value
Diameter
Lubrication on threads
Hole tolerance
Locking device
Grip length
Pitch
Lubrication on mating mtls.
Class of fit
Joint configuration
Mass of configuration
3/4"
Tri-Flow
Tight
Nylon insert
2"
16 threads/in.
Tri-Flow
3
Concentric
Mass of specimen+M4
(small mass)
Table 4.4 Confirmation Test 2 Set-up
Parameter Value
Diameter
Lubrication on threads
Hole tolerance
Locking device
Grip length
Pitch
Lubrication on mating mtls.
Class of fit
Joint configuration
Mass of configuration
1/4"
None
Oversize
None
1 "
20 threads/in.
None
2
Eccentric
Mass of specimen+M1
(large mass)

4.8.5 Additional Testing
6O
Based on the data obtained from carrying out the testing prescribed by the test
matrix, it was determined that additional testing must be performed. The following factors
contributed to the need for more testing:
1. A more accurate method for measuring bolt load was needed. Simply
measuring the change in bolt length with a micrometer was difficult to measure on an
accurate and consistent basis• Off-torque was inconsistent as well.
2. The lubrication used (Tri-flow) was not effective in providing adequate
lubrication between the two plates of the test configuration. As a result, once slippage
started between the two plates, microwelding occurred which prohibited any further
slippage. Without slippage possible, the loosening characteristics of the bolt being tested
could not be evaluated.
3. An error was made in estimating bolt load. Originally, 40% and 80% of the
yield strength of the bolt was to be used as the initial bolt loads. The ultimate strength
was erroneously used in calculating bolt loads, and as a result, the bolts tested were
severely overloaded•
4. The vibrational loadings imposed on the test specimens did not result in
significant bolt loosening.
In order to measure the load on the bolt more accurately, an ultrasonic measuring
device was used (BoltMike). The BoltMike sends an ultrasonic wave through the bolt by
placing a transducer on the head of the bolt as shown in Fig. 4.5. The time of travel of the
sound wave is measured and based on the material properties of the bolt, the bolt length
can be obtained. Also, by inputting the cross-sectional area and effective length of the bolt
(shown in Fig. 4.6), the BoltMike was able to determine any load on the bolt based on
change in length.

L'
61
To minimize microwelding between the two plates of the test configuration, a
mixture of molybdenum disulfide and axle grease (moly-lube) was used. Moly-lube is
more viscous and cohesive than Tri-flow and thus can provide better lubrication,
i
BOLT MIKETRANSDUCER
EMITSULTRASONIC
WAVE
:::::::..:
iii!i!?ii!i
SOUND WAVE _
TRAVELSTHROUGH
BOLT
yI
/3
"".- ECHO RETURNSTO TRANSDUCER
BASED ON TIME OFTRAVELOFSOUND WAVE AND MATERIALPROPERTIES, BOLT LEINIGTHIS
MEASURED.
Figure 4.5 Ultrasonic Measurement of Bolt Length.
O_rPLENGTH
EFFECTIVECROSS-SAREA (MEA.SUP.ED ,_=INBETWEEN BOLT
_)
TOTAL BOLTLENGTH
Figure 4.6 Input Dimensions for BoltMike.
/.
62
especially at higher clamping forces. Also, the contact surfaces of the plates were planed
and sanded as flat and smooth as possible to help reduce microwelding. A yield strength
of 30 ksi was used for all bolts to calculate bolt preload.
In addition to adjusting the values of some of the design parameters, the vibration
loading conditions were made more severe. The duration of the vibrational loadings were
doubled (from 2 minutes to 4 minutes) in the additional testing.
The only parameters that were varied in the additional testing were bolt diameter,
lubrication, and bolt preload. All other parameters were held constant resulting in 8
different test set-ups for a complete factorial testing (all combinations of the 3 parameters
and 2 levels). The values for all parameters can be seen in Tables 4.5 and 4.6. It should
be noted that lubrication in these tests indicates lubrication on both the threads and mating
materials. Each set-up was vibrated in the axial and transverse direction for 4 :minutes at
the high g-level resulting in a total of 16 tests. The following steps were followed for each
test.
1. Clean test specimen, bolt, and nut with an alcohol solution to insure that no
grit was present between mating parts.
2. The test configuration was assembled as prescribed Table 4.5 or 4.6.
3. Accelerometers were mounted at the test bolt and at the end of the
cantilever as shown in Fig. 4.4.
4. The untorqued bolt length was measured with the BoltMike and recorded.
5. Torque was applied to the bolt. While monitoring the bolt load with the
BoltMike, the desired preload was applied.
6. A sine sweep (10 - 1000 Hz 0.25 gpk, 2 oct/min) was performed in order to
determine the configuration's first mode of natural frequency.

,
.
63
The test configuration was vibrated for 20 seconds using Level-1 in order
to burnish the pieces to insure that any settlement between mating materials
will not contribute to any preload loss.
The configuration was subjected to Level-2 for 4 minutes or until loosening
occurred.
The final bolt load was measured with the BoltMike and recorded.
The torque required to loosen the nut was measured and recorded.
Table 4.5 Test 1-4 Set-ups for Additional Testing
Constant Values Variable Values
Parameter Value Parameter Values
Diameter 1/4"
Hole tolerance Oversize
Locking device None
Grip length 1.5" Preload:
Pitch 20 threads/in.
Class of fit 2
Joint configuration Eccentric
g-level Level 2 (4 mins)
Mass of config. Mass of specimen + M1
Lubrication: All parts
None
40% P y
80% P y
/i

15_ ••
64
Table 4.6 Test 5-8 Set-ups for Additional Testing
Constant Values Variable Values
Parameter Value Parameter Values
Diameter 3/4"
Hole tolerance Oversize
Locking device None
Grip length 2.5" Preload:
Pitch 10 threads/in.
Class of fit 2
Joint configuration Eccentric
g-level Level 2 (4 mins)
Mass of config. Mass of specimen + M7
Lubrication: All parts
None
40% P y
80% PY
• i: ¸_ •

V. EXPERIMENTAL RESULTS AND DATA ANALYSIS
5.1 General
A total of 228 tests were performed in this study: 96 vibration tests in the
execution of the test matrix, 108 static on-torque vs. off-torque tests, 8 vibration tests in
confirmation testing, and 16 vibration tests in additional testing. The experimental data
obtained from each of these tests series are presented in the sections below along with the
associated data analysis.
5.2 Test Matrix Data
Raw data resulting from execution of the program test matrix (see Fig. 4.1) are
shown in Appendix C. A summary of the raw torque data is given in Table 5.1.
Due to the fact that bolt on-torque and off-torque differ by a value of
2. P.r.tana (5.1)
an adjustment was necessary to get the two torques on a common basis to assess the
effects of vibration on bolt loosening. Rather than use these theoretical values, static on-
torque and off-torque tests were conducted to determine the adjustment value for each set
of conditions• The results of these tests are presented in the next section. The dynamic
testing on-torque values were adjusted down to provide an adjusted off-torque before
65

66
Table 5, 1 Summary of Raw Torque Data.
kl kl
91 92 91 92a b c d e f _ h
0 0 0 0 0 0 0 0 0 0 0 0 0 0 0 01 85 40 85 55 85 75 95 85 85 50 85 50 85 70 85 0
2 95 80 95 80 95 75 95 70 90 65 90 70 90 65 95 65
3 150 100 150 100 140 110 140 110 140 90 150 100 150 110 150 80
4 90 50 110 80 100 80 100 70 100 80 100 55 100 ?? 100 90
5 140 100 145 110 145 110 155 120 150 110 160 115 160 115 160 130
6 150 ?? 130 80 145 95 150 105 150 120 130 80 130 95 145 1007 180 160 180 140 180 125 180 145 180 155 180 155 180 160 180 160
8 180 150 180 145 180 140 180 155 180 140 180 145 180 135 180 150
9 135 110 135 120 135 110 140 ?? 130 120 135 ?? 140 130 140 105
10 180 140 180 150 180 125 180 105 180 145 180 140 180 140 180 14511 125 85 125 80 125 90 125 90 125 85 125 190 125 90 125 90
12 110 125 115 100 115 95 115 100 115 105 115 100 115 100 115 100
Notes: 1. K I = longitudinal vibration, K2 = axial vibration, g I = low g-level vibration, g2 = high g-
level vibration, a and b are replications of each other as are c and d, e and f, and g and h.2. The four ?? entries above are for tests where torque-off was not recorded. For these tests, we
know that complete bolt loosening did not occur. Torque-offvalues for the replica test were
used for these missing data.3. Test lh lost all of its initial torque due to vibration.
4. Test 12a indicated an increase in torque due to vibration.
5. In test 4e the outer segment of the test specimen rotated approximately 10° early in the test
and then microwelded to the inner segment of the specimen.
Table 5.2 Summary of Adjusted Torque Data.
kl kl
_1 92 _1 _2a b c d e f g h
o o o o o o o o o o o o o1 63 40 63 55 63 75 63 85 63 50 63 50 63 70 63 0
2 75 80 75 80 75 75 75 70 70 65 70 70 70 65 75 65
3 97 100 97 100 87 110 87 110 87 90 97 100 97 110 97 80
4 72 50 92 80 82 80 82 70 82 80 82 55 82 90 82 905 89 100 94 110 94 110 104 120 99 110 109 115 109 115 109 130
6 93 80 93 80 108 95 113 105 113 120 93 80 93 95 108 100
7 153 160 153 140 153 125 153 145 153 155 153 155 153 160 153 160
8 144 150 144 145 144 140 144 155 144 140 144 145 144 135 144 1509 102 110 102 120 102 110 102 110 97 120 97 120 107 130 107 105
10 140 140 140 150 140 125 140 105 140 145 140 140 140 140 140 145
11 92 85 92 80 92 90 92 90 92 85 92 90 92 90 92 90
12 92 125 97 100 97 95 97 100 97 105 97 100 97 100 97 100

67
vibration testing. These values were then used to determine changes in loosening torque
due to vibrations, i.e.,
Adj. Torque = (Dynamic On-Torque)-[(Static On-Torque)-(Static Off-Torque)] (5.2)
ATorque Loosening = (Adj. Torque) - (Off-Torque After Vibration) (5.3)
The adjusted torque data are shown in Table 5.2.
Also recorded in each test was an input signature plot and a response plot for each
accelerometer used. An example of these plots can be seen in Figs. 5.1 and 5.2
respectively.
The loosening of a test bolt can be measured by ATorque Loosening asdescribed
in Eqn. (5.3) or by a change in bolt load as a result of vibration. Since torque was
measured in fl.lb or in.lb and bolt load was evaluated in lb., the two values are not readily
comparable and thus a non dimensional value is needed. A p-value was used for this
reason. In the case of torque being used for the measure of bolt loosening, the p-value
used was
Torque,,,,t,,, _ - Torque,.eaa,,a t
P torque = Torque ,,,,_,,1(5.4)
where Torque,m,,,, _ is the adjusted torque as described in Eqn. (5.2) and Torquer, aa,,al is the
dynamic off-torque value. The p-values based on the adjusted torques in Table 5.2 are
shown in Table 5.3. These are the test results used in all analysis which are based on
torque data.

I C). 00(J
68
Log Rmp
g2/Hz
I0.00_
/_/_-,__J'.,_ms f /./.,--..._v.',_:'.,-:,..-'_;.
//
20.0_0 _z 2 27.._a
Figure 5.1 Typical Input Signature Plot.
I . 0000k
Log Rmp
92¢Hz
I .0(]O_
I
A
L i i , K J [ =
_. 0[_3 Hz
;!
/ rJ -Z',u
, i i i i I
Figure 5.2 Typical Response Plot From Aecelerometer.
OF POOR"_QUALITY

69
In the case of bolt length/load being used as the measure of bolt loosening, the test
response parameter or p-value used was
Load_._at - Loadresia._l
Plo_d -- Load,.i_l(5.5)
where Load,._ is the bolt load due to initial torquing and Loadr_d._ I is the bolt load after
vibration. It should be noted that the change in bolt length was measured during testing in
order to compute bolt loads. Change in bolt length and bolt load are related by the
following equation:
p_ AAE (5.6)L
where P is load on the bolt, A is change in bolt length, A is cross sectional area, and E is
Young's modulus of elasticity.
The higher the p-value, the more bolt loosening there is, thus a p-value of 1 would
indicate total loosening and a p-value of 0 would indicate no loosening at all. The p-
values based on the adjusted torque data and the raw bolt length/load data are shown in
Tables 5.3 and 5.4 respectively. It can be noted in Table 5.4 that the raw bolt length/load
data yielded 8 unrealistic values (negative values or values greater than 1.0). The negative
values were adjusted to 0.000 and the values greater than one were adjusted to 1.000.
The resulting Table is shown in Table 5.5.
i:
• : ii

7O
/
=o.
O91
23
4567
8910
1112
",-,i
,d,'O')
123
4567
8910
1112
=,
o_123
45
6789
1011
12
Table 5.3
kl
_11a b
0.370 0.130-0.070 -0.070
-0.030 -0.0300.310 0.130-0.120 -0,170
0.140 0.140-0.050 0.080-0.040 -0.010-0.080 -0.180
0.000 -0.0700.080 0.130-0.360 -0.030
Table 5.4
p-Values Based on Adjusted Torque Data.
92C
k2
e
_2
9-0.110 1.000-0.190 -0.350 0.210 0.210
0.000 •0.070 0.070 0.000 0.070 0,130
-0.260 -0.260 -0.030 -0.030 -0.130 O.1800.020 0.150 0.020 0.330 -0.100 -0.100-0,170 -0.150 -0.110 -0.060 -0.060 -0.190
0.120 0.070 -0.060 0.140 -0.020 0.0700,180 0.050 -0.010 -0.010 -0.050 -0,050
0.030 -0.080 0.030 -0.010 0.060 -0.040-0.080 -0.080 -0.240 -0.240 -0.210 0.0200.110 0,250 -0.040 0.000 0.000 -0.0400.020 0,020 0.080 0.020 0.020
-0.0800.020 -0.030-0.030
p-Values Based on Raw Length/Load Data•
-0.030
kl k2
91a b
0,550 0.540
0.080 0.5900.350 0.3900.670 0.600
0,060 0.0400.000 0.3500.190 0.2800.280 1.530
0.000 0.000
0.190 0.360
0.620 0.260
0.000 0.000
Table 5.5
92c e
92
91,0000.370 0,460 0.710 0.440 1.000
0.670 0.000 0.710 1.040 0.040 0.4800.140 0,150 0.600 0.110 0.590 0.2000.000 0.630 0.000 0.430 0,560 0.670
0.000 0.0200,110 0.070 0.070 0.0600.850 0.570 0,350 0.000 0.000 0,3200.290 0.000 0.040 0.750 -2.200 -2.200-0.320 0.000 0.000 0.460 -0.480 1.000
0.090 0.060 0.040 0.690 0,000 0,0500,000 0.330 0.530 1.340 0.000 2.3100.260 0.520 0.070 0.000 0.250 0.150
0.000 0.000 0.000 0.000 0.060 0.030
p-Values Based on Adjusted Length/Load Data.
91a
kl k2
92c
91e
0.440
92
91.000 1.0000.550 0.540 0.370 0.460 0.710
0.080 0.590 0.670 0.000 0.710 1.000 0.040 0.480
0.350 0.390 0.140 0.150 0.600 0.110 0.590 0.2000.670 0.600 0.000 0.630 0.000 0.430 0.560 0.670
0.060 0.040 0.110 0.070 0.070 0.060 0.000 0.0200.000 0.350 0.850 0.570 0.350 0.000 0.000 0.320
0.280 0.290 0.000 0.040 0.750 0.000 0.0000.460
0.1900.280 1.000 0.000 0.000 0.0000.000 0.000 0.090 0.060 0.040
0.0000.0000.690
1.0000.050
0.190 0.360 0.000 0.330 0.530 1.000 0.000 1.0000.620 0.260 0.260 0.520 0.070 0.000 0.250 0.150
0.000 0.000 0.000 0,000 0.000 0.000 0.060 0,030

71
It should be noted that in executing the program test matrix, the 2-piece aluminum test
specimens exhibited a considerable amount of microwelding In one test (Test 4e), the
outer cantilever segment rotated approximately 10 ° relative to the inner segment early in
the testing and then stopped rotating. At the end of the test the two segments could only
be separated by using a great amount of force due to microwelding. This difficulty in
separation was quite common with the 2-piece specimens, particularly under the larger
preloads regardless of lubrication. In the eases of large preload and lubricated interface,
pressures were large and the lubrication probably allowed some initial movement at the
interface but was not viscous enough to provide adequate lubrication thus microwelding
occurred. When this occurred, the joint acted as a welded connection and actions to cause
bolt loosening were greatly reduced. This occurrence probably added considerable
"noise" to the data and caused problems in correlating the data with theoretical best
performance predictions.
5.3 Test Matrix Data Analysis
The test data presented in the previous section was analyzed using the p-values
shown in Tables 5.3 and 5.5 as the bolt loosening response parameters. A general analysis
looking at average p-values and the variation in p-values with the design parameter values
was performed first. This was followed by an ANOVA (Analysis of Variance) analysis.
The results of these analyses are presented below.
iii_•
5.3.1 General Analysis of Data
Static torque testing data was combined with the data from executing the program
test matrix to evaluate the normalized Ptorq_,e response parameter in the manner indicated
by Eqn. (5.4). This parameter was taken as the measure of bolt loosening in the adjusted

E
(
72
data shown in Table 5.3. In turn, this data was averaged for each design parameter and
for each loading parameter and the results are shown in Table 5.6. For example, the value
of 0.062 shown in Table 5.6 for A1 and Transverse/g2 Load is the average of 12 results,
i.e., 12 tests where the A parameter was at its value orAl and the load parameters were
transverse/g2. The 12 consisted of 6 different tests with 1 replication of each test. The
total average p-value of 0.025 shown for A1 in the next to last column is the average of 48
tests where the A parameter was at its A1 value. Thus, each entry in the 4 average
response parameter value columns are the average of 12 tests, and each row and column
of this 20 x 4 array (mid portion of the table) was averaged as indicated in the table. The
last two columns of the table show values which are boxed-in to indicate parameter levels
for each parameter which are best at mitigating bolt loosening due to vibrations. Recall,
from the definition of p, the larger its value, the greater the bolt loosening. Also, as
indicated earlier, one would expect p to fall in the range of 0 < p < 1, where p = 0
indicates no loosening and p = 1 indicates complete loosening. It is theoretically possible
to have negative values of p (indicates bolt tightening due to vibrations), however this is
quite improbable. Table 5.6 indicates an average p-value of 0.003 for all tests. This
represents an approximate average loosening of 0.3% per test and indicates very little
loosening due to vibration.
The average p-values for the high and low levels for each design parameter are
shown plotted in Fig. 5.3 for the transverse/g2 loading (column 4 in Table 5.6). This
column was chosen because transverse loading at the high g-level should be the loading
most likely to produce bolt loosening. The average p-value of 0.017 for this set of
conditions is shown superimposed (dotted lines) on the plots of Fig. 5.3. This value
represents an approximate average loosening of 1.7% per test.

•, iii ¸• _.
.... i
,,!
.
.
.
.
73
A study of Table 5.6 and Fig. 5.3 indicates the following;
The low p-values and their fluctuation around zero, with negative values being common
and almost as large as positive values, seems to indicate that very little bolt loosening
occurred in the testing program.
The numerous negative p-values indicate that parameter variability, noise, and
experimental error were probably the main source of A torque and not actual bolt
loosening due to vibrations.
The best (boxed) parameter levels for the total average p-value in the next to last column
compare favorably with the best parameter level one would expect from theory shown
boxed in the last column. These two columns showed disagreement in the H parameter
(mating part lubrication) and G parameter (thread pitch). A possible explanation of this
disagreement is that the lubricated and course thread smaller contact surfaces resulted in
larger bolt preloads for these cases (since they were torqued to the same value for each
parameter level). This in turn caused larger T_oo,,nvalues and thus better bolt vibration
performances, i.e., better nonloosening performances. Also, the occurrence of
microwelding in the 2-piece cantilever specimens mentioned earlier was probably a major
factor in the disagreement between theory and the test data.
A comparison of the first column best parameter levels with those from theory indicates
good agreement except for the B, H, and L parameters. The B and H parameters both
relate to lubricated surfaces (threads and other mating parts), and the cause of this
discrepancy may be as discussed in (3) above. The improved performance in the
presence of the additional mass may be due to the additional mass reducing the natural
frequencies of the test specimens, and these reduced frequencies having a greater
mitigating effect on bolt loosening than the detrimental effect caused by the increase
mass/inertia of the test specimens.

•i ! i¸• . . _ :_ • / •• ." •_ • • _. • ....... • •i L!!i i i •L
Table 5.6 Test Matrix Response Parameters (p)
for Design Load Parameters
PARAMETERDESCRIPTION
LET'I'ERDESIGNATION
PARAMETERLEVEL
AVERAGE RESPONSE PARAMETER (p) VALUES
TRANSV. &
g2 LOAD
AXIAL &
g2 LOAD
TOTAL
AVG. pVALUES
BEST PARAMETER
LEVEL BASED
ON THEORY
FASTENER SIZE AI 1/4"¢ 0,062 -0.079 0.025A2 3/4"¢ °0.028 -0.034 _
THREAD LUB BI NONE 0.073 -0.081 _ [XIB2 TRIFLOW -0.039 0.036 0.008
HOLE TOLERANCE CD1 OVERSIZE & 0.4 PU 0.057 -0.036 0.020& PRELOAD CD2 TIGHT & 0.8 PU -0.023 -0.010 _ [[_
E1 PLAIN NUT 0.087 0.029 0.059LOCKING DEVICE E2 SL NUT -0.053 -0.074 1"_
F1 0.94"/1.62" 0.005 -0.026 0.026GRIP STRENGTH F2 1.57"/2.62" -0.011 -0.019 _
G1 COURSE 20/10 0.042 -0.092PITCH G2 FINE 28/16 -0.008 0.050 0.023
MATING PART LUB H1 NONE 0.083 -0.074 0.022 [XIH2 TRIFLOW -0.009 0.029
II CLASS 2 0.034 -0.008 0.029CLASS OF FIT 12 CLASS 3 0.001 0.006 _
Jl 2 PC CANTILEVER 0.044 -0.003 0.035yr. CONFIGURATION J2 I PC CANTILEVER -0.010 -0.043 _
MASS OF LI TEST SPECIMEN 0.029 -0.051 _ [XICONFIGURATION L2 TEST SP + MASS 0.006 0.006 0.019
AVG VALUES: 0.0030.017
AVG VALUES: Ig2 VS gl:
-0.003
t
TRANSV. & AXIAL &
gl LOAD gl LOAD
0.058 0.061-0.044 -0.044
-0.004 0.0020.018 0.015
0.029 0.030-0.016 -0.014
0.052 0.068-0.020 -0.051
0.005 0.038-0.032 -0.021
-0.017 0.0030.033 0.014
0.038 0.041-0.024 -0.024
0.059 0.070-0.045 -0.054
0.029 0.070-0.016 -0.054
-0.024 0.011
0.037 -0.028
0.008 0.008
I 0.008I
g2 LOADING IS BETTER
VS -0.023 + 0.0082
0.017 + 0.008
TRANSVERSE VS AXIAL: 0.013 VS -0.008 (AXIAL LOADING IS BETrER)
r,._

• i "¸_¸ • . H
0.083
0.042
0
-0.042
-0.083
I'
At A2 B I \ B 2 CD! 2 Fl 2 _ 2 2 II 12 Jl L 1 L2
\
HOL_ _UL _O GRIPe MATING _ OF
DEVI(_ LE_ PART LUB
Figure 5.3 Response Parameter vs. Design Parameters
for Transverse/g2 Level Loading.

f,:
.
.
.
.
76
Comparing average p-values for Transverse vs. Axial loadings at the bottom of
the table indicates that axial loadings are better at mitigating bolt loosening.
Comparing average p-values for gl vs. g2 loading levels at the bottom of the table
indicates that the g2 loading (the higher load level) is better at mitigating bolt
loosening. This could possibly make sense because of the microwelding occurring
when testing many 2-piece cantilever specimens. The more intense g-level loading
(g2) would cause greater microwelding and this would inhibit relative movement
and thus inhibit bolt loosening. The fact that half the specimens tested were of the
2-piece construction could bias the results to indicate the g2 loading is better at
mitigating bolt loosening. However, this is an abnormality of this particular set-up
and should not be valid in most situations.
The larger variation in p-values and their low values indicates that additional
preliminary testing is needed to attain test specimens, loading signatures,
intensities, and durations which all achieve significant bolt loosening. This is
needed in order that threshold loosening values of major parameters can be
determined.
The inconsistencies and disagreements with theory, e.g., those cited in (3), (4), and
(6) above indicate that additional preliminary testing is needed to better understand
the vibrational loading - bolt/joint behavior and thus later predict and prevent bolt
loosening.
?
5.3.2 ANOVA Analysis of Data
A comprehensive ANOVA (Analysis of Variance) analysis, which considers each
dof in the experiment, was performed on the test matrix data by the project subcontractor
ITEQ. The results of their analysis are presented below.

i ii,
77
5.3.2.1 Analysis Based on Adjusted Torque Data
An ANOVA on the adjusted torque data shown in Table 5.3 was performed and
the resulting ANOVA table is shown in Table 5.7. This table shows the decomposition of
every possible source of variation in the test matrix. In this table, large p-values indicate
parameters (or 2 parameter or 3 parameter interactions) that have a significant effect on
bolt loosening. These values and parameters are marked with an asterisk (** or *) in the
last column of Table 5.7. The first column of the table indicates the parameters and
parameter interactions, and the letter designations shown are the same as those defined in
Table 5.6 and Fig. 5.3. Table 5.8 shows the final ANOVA table once all the insignificant
sources of variation are pooled into the error estimate. Figure 5.4 shows how the p-values
vary with the two insignificant parameters identified in Table 5.8.
5.3.2.2 Analysis Based on Adjusted Length/Load Data
The complete ANOVA table showing the decomposition of every possible source
of variation using the adjusted bolt length/load p-value data of Table 5.5 is shown in Table
5.9. These data indicate that the E and J parameters are significant to bolt loosening, and
indicate that the A and L parameters are also significant as is the IxKxG interaction. The
final ANOVA table once all of the insignificant factors of variation are pooled into the
error estimate is shown in Table 5.10. Plots of these significant parameters are shown in
Fig. 5.5.
<

f . •
78
Table 5.7 Anova Table for Adjusted Torque p-Value Data.
SourceAB
CDE
FGH
IJ,L
T1K
g
Kx_AxKBxK
CDxKExKFxKGxKHxK
IxKJxK
LxK
Axg
BxgCDxg
ExgFxg
GxgHxgIxgJxg
Lx8AxKxgBxKxg
CDxKxgExKxgFxKxg
GxKxgHxKxgIxKxg
JxKxg
LxKx8
df S
F(0.05,1,51) = 4.03"
F(0.01,1,51)= 7.18"*V F
1 0.0499 0.0499 2.39 p1 0.0025 0.0025 0.12 p
1 0.0297 0.0297 1.42 p1 0.3026 0.3026 14.48 **
1 0.0508 0.0508 2.43 p1 0.0380 0.0380 1.82 p
1 0.0356 0.0356 1.70 p1 0.0765 0.0765 3.66 p1 0.1033 0.1033 4.94 *1 0.0263 0.0263 1.26 p
1 0.0007 0.0007 0.03 p11 0.7159
e 51 1.0656 0.0209 0.61
T 95 2.6747 0.73
0.0086 0.0086 0.41 p
0.0025 0.0025 0.12 p0.0102 0.0102 0.49 p0.0595 0.0595 2.85 p0.0720 0.0720 3.44 p
0.0174 0.0174 0.83 p0.0001 0.0001 0.00 p0.0099 0.0099 0.47 p
0.0356 0.0356 1.70 p0.0800 0.0800 3.83 p0.0031 0.0031 0.15 p
0.0062 0.0062 0.30 p0.0050 • 0.0050 0.24 p0.0799 0.0799 3.82 p0.0012 0.0012 0.06 p
0.0019 0.0019 0.09 p0.0019 0.0019 0.09 p0.0111 0.0111 0.53 p0.0015 0.0015 0.07 p
0.0148 0.0148 0.71 p0.0776 0.0776 3.71 p0.0083 0.0083 0.40 p
0.0062 0.0062 0.30 p0.0636 0.0636 0.40 p0.0835 0.0835 0.30 p
0.0163 0.0163 3.04p0.0065 0.0065 4.00 p0.0028 0.0028 0.78 p
0.0824 0.0824 0.31 p0.0845 0.0845 0.13 p0.0111 0.0111 3.94 p0.0128 0.0128 4.04 *p
0.0152 0.0152 0.53 p
PP

Table 5 8
79
Pooled ANOVA Table for Adjusted Torque p-Value Data
Source df S V F S' p(%)
E 1 0.3206 0.3206 12.40"* 0.2782 10.40
J 1 0.1033 0.1033 4.23* 0.0789 2.90
e(pool) 93 2.2688 0.2440 2.3176 86.60
T 95 2.6747 2.6747 99.90
• /
-i
0.080
0.060
0.040
0.020
0.000
-0.020
-0.040
-0.060
-0.080
Adjusted Torque Values
Experimental Average = 0.002.
E1 E2 ~
Factors & Levels
J1 J2
Figure 5.4 Response Parameter vs. Design Parameters
E and J for Adjusted Torque Data.

'/ ,4
.... • , i_
L
?
8O
Table 5.9 ANOVA Table for Adjusted Length/Load p-Value Data.
SourceA
BCD
EF
GH
T1
K
g
Kx_AxKBxK
CDxK
ExKFxKGxKHxK
IxKJxKLxK
AxgBxg
CDxgExgFxg
GxgHxgIxg
Jxg
Lx9AxKxgBxKxg
CDxKxgExKxgFxKxg
GxKxgHxKxgIxKxg
JxKxg
LxKx_le
df S
F(0.05,1,51)= 4.03*
F(0.01,1,51)= 7.18"*V F
1 0.4746 0.4746 6.46 **1 0.1953 0.1953 2.66 p1 0.0527 0.0527 0.72 p1 0.6484 0.6484 8.82 **
1 0.1642 0.1642 2.23 p1 0.0031 0.0031 0.04 p
1 0.0250 0.0250 0.34 p1 0.0656 0.0656 0.89 p1 0.6419 0.6419 8.73 **1 0.5750 0.5750 7.82 **
1 0.0493 0.0493 0.67 p11 2.8951
0.0656 0.0656 0.89 p0.0635 0.0635 0.86 p
0.0148 0.0148 0.20 p0.0008 0.0008 0.01 p0.1971 0.1971 2.68 p
0.0010 0.0010 0.01 p0.0028 0.0028 0.04 p0.1625 0.1625 2.21 p
0.0823 0.0823 1.12 p0.1034 0.1034 1.41 p0.0788 0.0788 1.07 p0.0500 0.0500 0.68 p
0.0107 0.0107 0.15 p0.0858 0.0858 1.17 p
0.1626. 0.1626 2.21 p0.0143 0.0143 0.19 p0.0015 0.0015 0.02 p0.0000 0.0000 0.00 p
0.0059 0.0059 0.08 p0.1795 0.1795 2.44 p0.0095 0.0095 0.13 p0.0421 0.0421 0.57 p
0.0847 0.0847 1.15 p0.0000 0.0000 0.00 p
0.0022 0.0022 0.03 p
0.0086 0.0086 0.12 p0.2137 0.2137 2.91 p0.1141 0.1141 1.55 p
0.0008 0.0008 0.01 p0.2174 0.2174 2.96 p0.4830 0.4830 6.57*0.0981 0.0981 1.33 p
0.1880 0.1880 2.56 p51 3.7488 3.7488
95 9.3890

_:_i?,: i• '_!iii!__ ,_,'
_' i_ ,i I
i_i ,
v
81
Table 5.10 Pooled ANOVA Table for Adjusted Length/Load p-Value Data
Source df S V F S' p(%)
A
E
J
L
IxKxg
e(pool)
m_
1 0.4746 0.4746 6.50* 0.4016 4.28
1 0.6484 0.6484 8.88** 0.5754 6.13
1 0.6419 0.6419 8.79** 0.5689 6.06
1 0.5750 0.5750 7.88** 0.5020 5.35
1 0.4830 0.4830 6.62* 0.4100 4.37
90 6.5661 0.0730 6.9311 73.82
95 9.3890 9.3890 100.01
' i, _'
0.450
0.400
0.350r_
0.300
0.250
0.200
0.150
Adjusted Length/Load Values
IExperimental Average = 0.296
I I I I
A1 A2 ~ E1 E2 - Jl J2 ~ L1 L2
Factors & Levels
Figure 5.5 Response Parameter vs. Design Parameters
A, E, J, and L for Adjusted Length/Load Data.

82
5.4 Static On-Torque vs. Off-Torque Data
The data collected for these tests was the result of each set-up prescribed by the
test matrix (Fig. 4.1) being used to measure on-torque vs. off-torque on the bolt with no
vibration. Each bolt was torqued to the on-torque value used in vibration testing and then
immediately untorqued. Both torque values were recorded. This process was repeated
twice more on a particular bolt for a total of three on-torque and off-torque measurements
per bolt. Three bolts were used for each set-up. The data for this testing can be seen in
Appendix D.
It should be noted that this data was intended solely for the use of modifying the
on-torque and off-torque data as described in Section 5.2. The static on-torques and off-
torques (Appendix D) and the dynamic on-torques and off-torques (Appendix C) are very
similar as evident in Table 5.11 and in Figs. 5.6 and 5.7. These figures seem to indicate
that there was little, if any, bolt loosening in the vibration testing.
il ,

_!ili i__;
L •
83
Table 5.11 Bolt Torque Reductions and Torque Tightening/
Torque Loosening Ratios for Vibration Testing and Static Testing
VIBRATION TEST RESULTS STATIC TEST RESULTSTEST
SET-UP AVG A TORQUE* AVG MT,/ML AVG A TORQUE* AVG MT/ML
1
2
3
4
5
6
7
8
9
10
11
12
25.7"#
21.9"#
46.3"#
27.9"#
37.5"#
43.6"#
30.0"#
35.0"#
20.0"#
43.8"#
37.5"#
15.0"#
1.51
1.31
1.48
1.43
1.34
1.47
1.21
1.24
1.18
1.34
1.43
1.12
22.2"#
19,4"#
52.8"#
17.8"#
51.1"#
36.7"#
27.2"#
36.1"#
32.8"#
39.4"#
33.3"#
17.8"#
1.35
1.26
1.54
1.22
1.52
1.32
1.18
1.25
1.32
1.28
1.36
1.18
* A TORQUE = TORQUE TO TIGHTEN - TORQUE TO LOOSEN
* A TORQUE = MT - ML

84
• • / L
6O
5O
5•3
A TORQUE-STATIC
TEST
4O
30
2O
9
12 • 2• 04
• 10
•6
•11
10TESTS 1-6 USE 1/4"¢ BOLT
TESTS 7-12 USE 3/4"0 BOLT
0 I I I I I
0 10 20 30 40 50
A,r,c_p_Tm xnn -r'_'r{ IN-LB FOR I/4"BOLT.... "_"_ - ....... _"FI'-I..B FOR 3/4" BOLT )
Figure 5.6 Plot of A Torque Vibration vs. A Torque Static.

85
STATICTEST
MT[ML
9
5
12• 07
8 O2
• lO
TESTS 1-6 USE 1/4"¢ BOLT
TESTS 7-12 USE 3/4"¢ BOLT
1 I I1 1.1 1.2 1.3 1.4 1.5
VIB. TEST MT/M L
iii_i
Figure 5.7 Plot of M r / M L Vibration Tests vs. M r / M L Static Tests.

86
5.5 Confirmation Testing Data
Based on statistical averaging of p-values from executing the program test matrix
and engineering judgment two tests were designed to confirm the results of executing the
program test matrix. Confirmation Test# 1 consisted of parameter levels that would be
unfavorable to bolt loosening and Confirmation Test #2 consisted of parameter levels that
would be favorable to bolt loosening. A detailed listing for all parameter and input levels
can be seen in Tables 4.3 and 4.4. The data for confirmation testing is shown in
Appendix E.
A predicted mean p-value (_tp) was calculated for each confirmation test. If the
mean p-value calculated from testing falls within the range of _p then the parameter
levels selected for each test can be assumed to be correct with some degree of confidence.
The following calculations were made using p-values based on adjusted torque data.
95% Confidence interval for the estimate:
(5.7)
Where:
/
,/
1 dfesttmat e (5.8)
t7 e df tota I
Therefore:
09,,0 (5.9)

I i_'¸
i ' ,_. I
•i • •
87
Prediction at A_BICDIEIF_GIHlllJ1 L2 :
_p =E+J 1 - T
Where:
E_ & J_ are average values of the E and J parameters at level 1
T is the experimental average
Therefore:
_tF = 0.059 + 0.035 - 0.002 = 0.092 _+0.277
(5.1o)
(5.11)
Confirmation at AIB_CDIEIFIG1HII1JIL2
(0.21 + 0.00 + 0.07 + 0.07)= O. 088 (5.12)
• Z, ,
i•i:•
' i
Please note that Pco,i falls within the 95% confidence interval of the prediction.
In a similar manner, the prediction and confirmation mean p-values were calculated
for AEB2CDzE2F2G2H2IzJ2L _ using p-values based on adjusted torque data. In addition,
prediction and confirmation mean p-values were calculated for both confirmation tests
using p-values based on bolt load data. These values can be seen in Table 5.12.
Please note that all confirmation mean p-values fall within the 95% confidence
interval except the A_BaCD IE 1F_G_H 111J_L 2 experiment based on bolt load.

i- i
.C
88
Table 5.12 Prediction and Confirmation Mean p-Values.
AIB_CD1E1FIG1HII_.JIL2 A2B2CD2E2F2G2H2IzJzL1
Based on adjusted torque:
f_p = 0.092 + 0.277
I-_co,:-= 0.088
Based on bolt load:
_t r = 0.610+0.433
,Uco,f = 0.150
ft_, = -0.086 + 0.277
Pco,f = 0.073
_tp = -0.014 + 0.433
,U_o,,f = 0.403
5.6 Additional Testing Data
/
,_' '_'i!'_ • i:
" i ,i '_
The additional tests were run in an attempt to address the problems that were
encountered in executing the program test matrix. These problems are explained in detail
in Section 4.9. Also, based on the lack &loosening that was encountered in executing the
program test matrix, additional tests were run in an attempt to get more bolts to actually
loosen so that the design parameters could be evaluated. The data for the additional tests
can be seen in Appendix F. It should be noted that Test 8a could not be run because the
test specimen fatigued prior to this test.
The p-values based on bolt load for the additional testing along with the average p-
values for the axial, transverse, 40% p_., and 80% Py tests can be seen in Table 5.13. In
this table, any negative p-values resulting from the raw data were replaced by zeroes.

7
Notes:
89
Table 5 13 p-Values for Additional Testing•
40% Py1 3
0.000 1.0001.000 1.000
80% Py 40% Py2 4 5 7
0.000 0.126 0.115 0.0001.000 1.000 1.000 0.000
80% Py6 8
0.318 ***0.299 0.000
Average p-Values:
Axial 0.223 Lub. 0.467Trans 0.662 Non Lub. 0.286
40% Py 0.514 1/4" Bolt 0.64180% Py 0.392 3/4" Bolt 0.248
1. a = axial direction of vibration, b = transverse direction of vibration.
2. Tests 1, 2, 5, and 6 were lubricated tests and tests 3, 4, 7, and 8 were non lubricated tests.
3. Tests 1, 2, 3, and 4 were 1/4" bolts and tests 5, 6, 7, and 8 were 3/4" bolts.
Figures 5.8, 5.9, 5.10, and 5.11 are plots of the average p-values for vibration
direction, bolt preload, lubricated parts, and fastener size respectively. Figure 5.8
indicates that the transverse direction of vibration had a significant impact on bolt
loosening compared to the axial direction. Figure 5.9 indicates that using a bolt preload of
40% p,. produced more loosening than when a bolt preload of 80% Py was used,
however, the difference was relatively small. It is anticipated that once the bolt preload
drops to lower values, bolt loosening will readily occur. More testing to better quantify
the effect of bolt preload (over a wide range of values) on bolt loosening. Figure 5.10
indicates that lubricated joints loosened more than non lubricated joints as a whole, but
further inspection reveals that the small bolts that were unlubricated showed greater
loosening than the lubricated and for the larger bolts the opposite was true. Additional
testing with this parameter is needed to better determine the effects of lubrication on bolt
loosening. Figure 5.11 indicates that 1/4" (_ bolts loosened more than the 3/4" _bbolts.

?:.i:
T
; i_ :i_,
' i ¸-
"!
. i ¸,
L . ..
90
Comparing the performances of the 1/4" d_ and 3/4" dpbolts, indicates that severity of
vibration loadings have a major impact on bolt loosening. The smaller bolt was under a
more severe vibration loading relative to its size and in 5 of the 8 tests the 1/4" @bolt
completely !oosened due to vibration, whereas only 1 of 7 of the 3/4" @ bolts completely
loosened during testing.
Vibration Direction
0.800 T
• 0.600 t'_ 0.400 i
o. oo0.000
J
Axial Trans
Figure 5.8 Comparison of p-Values for Vibration Direction.
>,o,.
0.600.g-__.__i
0.400
0.200:
0.000 '40%
PY
Bolt Preload
80%
Py
Figure 5.9 Comparison of p-Values for Bolt Preload.

"i 'i/i _,
__ • i_
91
Lubrication
0.500 _ ....• 0.400 != 0.300'
0.2001_. 0.100
0.000 'Lub. Non
Lub.
Figure 5.10 Comparison of p-Values for Lubricated Parts.
Fastener Size
0.800 1-_ 0.600"_ 0.400 i
0.200 _
0.0001/4"
Bolt
3/4"Bolt
ii
Figure 5.11 Comparison of p-Values for Fastener Size.

• k

)
]>
VI. CONCLUSIONS AND RECOMMENDATIONS
6.1 Conclusions Based on Theory_
Theoretical considerations and the literature teach us that for static conditions, the
torque required to loosen a bolt is approximated by
Tloo,,, = P. r . C L + Tza, (6.1)
where P is bolt preload = f( r 2 , o-y, % of O-y ), r is bolt radius, CL = f(flthreads,/3matingparts,
thread pitch angle), and Tz_, is the torque for the locknut. Thus, to maximize T_oo,e,,,one
would want to maximize P, r, CL, and T_. To maximize these, one should maximize
the bolt diameter, yield strength, and percent of yield strength that the bolt is preloaded to,
and maximize all coefficients of friction as well.
Plots of C r (coefficient associated with Tt_hte,,) and C L versus/z are shown in Figs.
6.1 and 6.2 for the bolts employed in this study. These figures provide graphical
illustrations of the relative magnitudes and importance of C r vs. Cz,, thread vs. mating
parts coefficient of friction, and use of coarse thread vs. fine thread bolts. The following
observations can be made from these figures.
1. The difference between C r and C L is significant with the coarse thread bolts
showing the greatest difference. However, at large/.t values (/z > 0.4) the
difference between C r and C L is less than 10%.
92

'i
/ ._'. v
• i_ i'i _
.
3.
4.
93
Both (?r and C L , and thus T,,_h,_,, and 71oosen , are quite sensitive to/_ and increase at
a rapid rate with p.
Both coefficients of friction (/_thre_d_and /lmatmgpart s) are very important and
contribute greatly to Cr and Cr and thus T,ighte, and T_oo_,,. Note that C L _/_ in
Fig. 6.1 and C L -_ 2.5p in Fig. 612.
Thread pitch makes very little difference in the values of C r and C L except in
cases where g is very small, i.e., 0 _</_ <_0.05. However, it should be noted that
for the bolts in this study, the design cross-sectional areas (A) and percent
increases in A for fine threads (relative to coarse threads) are as shown in Table
6.1. Allowable bolt preloads will vary directly with A and thus 21% and 16%
larger preloads may be applied to 1/4" and 3/4" q_bolts respectively. These in turn
should increase the Tioo,wn by the same percentages. Thus, fine threaded bolts
should significantly mitigate bolt loosening due to vibrations.
Table 6.1 Percent Increase in Design Cross-Section
Area for Fine Threads.
Bolt Size Course Thread A(in 2) "Fine Thread
1/4" 0.0269 0.0326
3/4" 0.3020 0.3513
%Increase in A
for Fine Threads
21%
16%
Whereas Eqn. (6.1) and the above observations are based on static conditions, it is
reasonable to assume that the design parameters which yield large values of T_oo,,,_,,a_c will
also yield large values of T_oo,_,_._,a,,,c.

: !
f
94
_ ./
C1', CL.
0.1
[I/4"# FINE 11W..)
!/4"e COURSE TIiR.)
I I I0 0.1 0.2 0.3 0.4 0.5 0.6
St (BOLT'THREADS)
Figure 6.1 C r and C L vs. l.t for Zero Friction Under Nut/Bolt Head.

95
/
er.cLC,r(
(I/4-m COURSE TH]L)
FIG. 6.1
0.1 0.2 03 0.4 0.5 0.6 0.7
IJ-(BOLT THREADS & UNDER NUT/BOLT HEAD)
Figure 6.2 C r and C L vs. la for Bolt Threads and Under Nut/Bolt Head.

6.2
96
Conclusions Based on Experimental Data
Conclusions drawn from analysis of the experimental data from execution of the
program test matrix (96 tests), the static on-torque and off-torque testing, the
confirmation testing, and the additional factorial test matrix are presented below.
1. The average value of Ptorq,,e for all tests in the test matrix was 0.003.
Recognizing that 0 < p < 1, this represents an average bolt loosening of 0.3%.
Hence, very little loosening occurred in the vibration testing program.
2. The numerous negative values of Pto,,q,,eindicate that parameter variability,
noise, and experimental error were probably the main sources of A torque, and
not bolt loosening due to vibrations.
3. Microwelding in the 2-piece test specimens mitigate relative movement of the
test specimen pieces at the joint and thus mitigated bolt loosening.
4. The test data indicated that transverse loadings on the test bolts were more
adverse to bolt loosening due to vibrations than axial loadings.
5. The test data indicated that the locknut.("prevailing torque device") was
superior to the plain nut at mitigating bolt loosening. This is as one would
expect.
6. The static torque testing results and vibration testing torque results are quite
consistent and remarkably close to being the same in magnitude. This again
indicated very little loss of torque or bolt loosening due to vibrations.
7. The ANOVA analysis of the adjusted torque data indicated only two
parameters (E & J) were significant. Regarding factor E, the locking device, a
self-locking device produced better retention of torque than did a plain nut.
Regarding factor J, the joint configuration, the 1-piece test specimen/concentric
loading configuration retained more torque than did the 2-piece test

f:
L
n
" b
•i
• Z
97
specimen/eccentric loading configuration. These results statistically conformed
to the predicted results in the confirmation testing. However, the actual
difference between level 1 and level 2 from the confirmation runs was fairly
small.
8. The ANOVA analysis of the bolt length/load data indicated four parameters (A,
E, J, & L) and one three factor interaction (IxKxg) were significant. The 3/4"
bolt (parameter A) retained a greater percentage of bolt load than did the 1/4"
bolt. The self-locking nut (parameter E) retained a greater percentage of bolt
load than did the plain nut. The 1-piece/concentric load joint configuration
(parameter J) retained a greater percentage of bolt load than did the 2-
piece/eccentric load configuration. The mass configuration of test specimen
only (parameter L) retained a greater percentage of bolt load than did the mass
configuration of test specimen plus additional mass. In regards to the IxKxg
interaction, a class 2 fit (parameter I) seemed slightly more stable against noise
than did a class 3 fit. Class 2 and 3 fits did behave differently against vibration,
though both were sensitive to it. These results, however, did not confirm
against prediction in one of the two confirmation tests, so conclusions based on
the class of fit results should not be trusted.
9. As indicated in (7) and (8) above, only two sources of variation were significant
at 95% confidence when compared to the variation between supposed identical
samples when using the adjusted torque data and 5 sources of variation were
significant when using the adjusted length/load data. Considering that there are
44 sources of variation, and that the factors in the experiment were selected for
their impact on fastener loosening, this is a very small number of" significant
sources of variation. There are several reasons this might occur:

i_? • _'_ '_
10.
11.
98
• The response measured (torque-on vs. torque-off or bolt load initial
vs. bolt load final) might not be affected by the parameters
contained within the experiment.
• The values of the parameters selected were too high (or low) to
reflect the sensitivity of bolt loosening to the parameters.
• The variation between supposedly identical samples is very large.
The first reason stated above is not felt to be valid (however, more sensitive
measuring instrumentation should be used in future testing). The second and
third reason are felt to be primary causes of the very low bolt loosening activity
and the detection of what loosening that did occur in executing the test matrix.
These shortcomings must be addressed in future testing.
Much higher than normal bolt preloads, lighter than normal lubrication, and
significant degrees of microwelding (in 2-piece test specimens) all contributed
to reduce bolt loosening activity in executing the test matrix. An example of
the effect of microwelding was visually observed in Test 4e when early in the
vibration testing the outer cantilever rotated approximately 10 ° and then
stopped. At the end of the test the two pieces were microwelded together and
had to be separated by force.
The additional testing results indicate that (a) transverse loadings are much
more detrimental to bolt loosening than axial loads; (b) severity of vibration
loadings have a major impact on bolt loosening; (c) larger bolts in a given
vibration environment are more resistant to loosening than smaller bolts; and
(d) more testing is needed to determine the effects of bolt lubrication and bolt
preload on bolt loosening.

99
12. Measuringnut on-torqueandoff-torquebeforeanda_Rervibrationsexhibited
considerablevariabilityandbolt lengthmeasurementsvia micrometerwerenot
sufficientlyaccurate.However,hadconsiderablebolt looseningoccurredin the
testing,it wouldhavebeendetectedwith themeasurementsystememployed.
Theliteratureindicatesthat oncerelativejoint micro-movementbegins,bolt
1:5
i"
i:
13.
loosening begins and considerable to complete bolt loosening occurs in very
short order. This simply did not happen in executing the test matrix with the
exception of one test, Test lh.
The experimental testing conducted answered many questions regarding bolt
loosening, the design parameters and load parameters affecting loosening, and
appropriate testing instrumentation, specimens and procedures to analyze the
bolt loosening problem. However, it let_ many questions unanswered, and
/
14.
overall reflected a need for additional testing.
Additional small scale preliminary testing using standard off-the-shelf bolts and
nuts should be conducted to more fully identify the parameters having
significant impact on bolt loosening due to vibrations. The parameters
observed should include both design and vibration loading parameters.
Additionally, this preliminary testing should seek alternative test configurations
and specimens, and a robust and sensitive bolt load monitoring/measuring
device.
• +i_!_
15. Future testing should probably use steel specimens to minimize specimen
microwelding problems. This would reduce experimental "noise" and allow
better assessment of the effects of the design and load parameters under
investigation. Additionally, it should provide quantitative results which are
conservative in predicting bolt loosening on aluminum specimens.

• i
•:ii i /i!j i
100
6.3 Recommendations
Theoretical considerations and the literature indicate the following actions to make
bolted joints more resistant to vibration loosening.
1. Maintain large friction forces
• Use a large initial bolt preload and stress bolts to a high percent of yield
stress.
• Take reasonable measures to reduce bolt relaxation and thus reduction in
preload.
• Have large coefficients of friction - do not lubricate threads and mating
surfaces.
• Use large diameter bolts.
2. Use "prevailing torque" fasteners (locknuts)
• Consider using multiple locking devices, e.g., liquid threadlock and a
locknut.
• Consider using liquid threadlock as both an initial lubricant during bolt
tightening and then having it serve as a locking device later in its life when
vibrational loads are applied.
3. Use fine threaded bolts. The primary advantage of fine threaded bolts are their
increased area and thus increased allowable preload. Thus, take advantage of this
and preload the bolts to high levels (say 80 percent of yield stress).
4. Avoid transverse loadings on bolted joints where possible. These are the loadings
that contribute most strongly to bolt loosening during vibration.
5. If the joint to be fastened requires long bolts, do not hesitate to use long bolts as
they have greater elastic strain energy stored when preloaded and will require more

: "_ _i_!I i!i
.il_ _ -
.
7.
8.
,
10.
101
cycles of vibration to loosen in a successive delta loosening manner. Additionally,
longer bolts tend to bend (thus they may fatigue) rather than loosen.
Consider using toothed shear washers to prevent slippage and thus bolt loosening.
Avoid impact loadings and resonant loadings where possible.
Introduce some form of vibration damping into the structural system and into the
bolt/nut system. Nuts with nylon inserts are good for this.
Treat bolt design for loosening due to vibrations in a somewhat similar manner to
design for fatigue loadings. That is, in fatigue design we used reduced allowable
stresses and thus larger member sizes and number of bolts. Hence, in vibration
loosening environments, used larger bolts and more of them than static or
nonvibratory loads conditions would dictate.
Use a "belt and suspenders" design philosophy. That is, use as many of the above
actions as practically feasible in design situations where bolt loosening due to
vibrations may be a problem.
6.4 Recommendations for Future Research
Advancement of knowledge and development of user friendly design aids and
procedures which make use of the advancements is in general a rather slow process. The
case of bolt loosening under vibratory loads follows this general pattern.
Phase I work on this topic is reported in this publication, and has been successful
in identifying the main parameters which affect bolt loosening under vibratory loadings. It
was also successful in establishing effective and efficient design of experiment procedures
and compatible data analysis methodologies and procedures. The Phase I work has also
been successful in developing a good research team as a resource base on which to

102
continue the evolutionary advancement and development work needed on the topic of bolt
loosening due to vibrational loads.
Future research work needed and recommended on this topic, and the sequence of
that work are briefly outlined below. It is estimated that each of the additional phases
recommended will need to be 1-year research efforts.
6.4.1 Phase II Work
6.4.2
Develop simple bolt loosening test set-ups at Auburn University to
allow evaluation of the relative importance of primary design and
loading parameters on bolt loosening. The test set-ups planned are:
- Static Torque-Tension Set-up (will utilize ultrasonic transducer
to determine bolt tensions)
- Modified Kerley Vibration Set-up
- Bolt Vibration Testing Under Operational Loads Set-up
Utilize test set-ups above to experimentally evaluate the effects of
the primary design parameters on bolt loosening under vibrational
loads.
Refine and finalize listing of design and loading parameters to carry
forward to Phase III.
Develop Phase HI Test Plan
Phase III Work
Refine and finalize test specimens, test procedures, and parameters
to monitor/measure in Phase HI testing.

_:i!¸ .
6,4.3
103
Fabricate Phase III test specimens and procedure, test bolts, locking
devices, and test/response parameter monitoring equipment.
Execute Test Plan using MSFC shaketable and testing personnel. It
is anticipated that an L_8 orthogonal array test matrix will be
conducted.
Conduct any required retesting and confirmation tests.
Conduct demonstrational experiments as appropriate.
Conduct testing on simple test set-ups developed in Phase II to
correlate results from those set-ups with those from the shaketable.
It is anticipated that the Phase II test set-ups will produce accurate
results which are compatible with those from the shaketable. If so,
the Phase II set-up can be used more efficiently and effectively in
further demonstrational and expansion of scope/applicability
testing.
Phase IV Work
Conduction of "missing gap" testing and expansion of scope testing
as necessary to fill in unknowns and to expand the limits of
applicability of the test results as appropriate.
Conduct testing of additional bolt locking devices as appropriate.
Develop "User Friendly" design aids and procedures as appropriate
to assist MSFC engineers in assessing the vibrational loosening
adequacy of bolted connections.

REFERENCES
.
.
American Institute of Steel Construction. Manual of Steel Construction, 8th
Edition. MSC. 1980. pp.4.136- 4.141.
Baubles, R.C., G.J. McCormick, C.C. Faroni. "Loosening of Fasteners by
Vibration". Elastic Stop Nut Corporation of America. Union, NJ. December,
1966.
, Brenner, Harry S.. "Fastener Evaluation". Machine Design. June 15, 1967. pp
28.
.
.
.
Byrne, Diane, Jim Quinlan. "Robust Function for Attaining High Reliability at
Low Cost". ITEQ publication 93RM-156. Livonia, MI.
Chapman, Ian, John Newman, Paul Wallace. "The Tightening of Bolts to Yield
and Their Performance Under Load". Journal of Vibration, Acoustics, Stress,and
Reliability in Design. April 1986, Vol. 108. pp 213-221.
Clark, S.K.. "Static and Dynamic Testing of Self-locking Bolts". SAE Paper
824E presented March 1964 at SAE Automobile Week.
. Clark, Samuel K., Jerald J. Cook. "Vibratory Loosening of Bolts". SAE paper
No. 660432• 1966.
. Crispell, Corey. "New Data on Fastener Fatigue". Machine Design. April 22,
1982.
104

?
.
10.
11.
12.
13.
14.
15.
105
Finkelston, Robert J.. "How Much Shake Can Bolted Joints Take?"• Machine
Design_. October 5, 1972. pp 122-125•
Finkelston, R.J.. "Total Sytems Approach to Mechanically Fastened Joints". SME
Technical Paper AD76-652.
Ganguly, J.. "Fastener - Torque Model & Enhanced Reliability Under Cyclic
Load". Proceedings of Annual Reliability and Maintainability Symposium. IEEE.
1992. pp. 196-201.
Goodier, J.N, R.J. Sweeney. "Loosening by Vibration of Threaded Fastenings".
Mechanical Engineering. December 1945. pp 798-802•
Haviland, Girard S. "Designing With Threaded Fasteners". Mechanical
Engineering. October 1983. pp 17-31.
Haviland, Girard, S.. "Machinery Adhesives for Locking, Retaining, and Sealing".
Marcel Dekker, Inc.. 270 Madison Avenue. New York, NY. 1986. pp 190-219.
Hicks, Charles R.. Fundamental Concepts.in the Design of Experiments, 3 rd
Edition. Saunders College Publishing. Fort Worth, TX. 1982.
16.
17.
18.
Holmes, Horace. "A Spiral Lock for Threaded Fasteners". Mechanical
Engineering. May 1988. pp 36-39.
Industrial Fasteners Institute. Fastener Standards, 6th Edition. Industrial
Fasteners Institute. Cleveland, OH. 1988.
Junker, Gerhard H.. "New Criteria for Self-Loosening of Fasteners Under
Vibration". SAE paperNo. 690055. 1969.

i ¸
?
)•
, • i:i _ [
19.
20.
21.
22.
106
Kerley, James J.. "An Application of Retroduction to Analyzing and Testing the
Backing Off of Nuts and Bolts During Dynamic Loading". NASA Technical
Memorandum 4001. June 1987.
Meriam, J.L. and L.G. Kraige. Engineering Mechanics Volume I Statics, 3 rd
Edition. John Wileyand Sons. New York. June, 1992. pp. 370-379.
Montgomery, Douglas C.. Design and Analysis of Experiments, 3 rd Edition. John
Wiley and Sons. New York. 1986.
Peace, Glen Stuart. Taguchi Methods, a Hands-on Approach. Addison-Wesley
Publishing Company, Inc.. Reading, Massachusetts. 1993.
23. Sauer, J.A., D.C. Lemmon, E.K Lynn. "Bolts How to Prevent Their Loosening".
Machine Design. August 1950. pp 133-139.
24. Shigley, Joseph Edward. Mechanical Engineering Design, 2 nd Edition.
McGraw-Hill Book Company. New York, NY. 1972. pp 292-311.
25. Taguchi, G., S. Konishi. Taguchi Methods, Orthogonal Arrays and Linear Graphs,
Tools for Quality. Engineering. American Supplier Institute, Inc.. Dearborn, MI.
1987.
51

APPENDICES
107

_ii_i__ _
APPENDIX A
TEST SET-UPS
108

109
Steel Plate (8" x 8")Pins
] t
Setup 1
Test Fastener
NI
PS1I PS2
Cube
(Not to scale)
/
Test Set-up #1Fixture ID PS1 & PS2
Bolt ID 1/4-20 UNC-2A
Nut ID 1/4-20 UNC-2B
End Mass ID None
Mass Bolt ID None
Mass Nut ID None
Spacer ID NoneFastener Size 1/4" diam.
Lubrication (threads)Hole Tolerance
Pre-load
Nut Locking DeviceGrip Length
Pitch (thds/in)
Lubricant (mating materials)Class of Fit
Joint Conficjuration
Mass of Configuration
None
Oversize
40% yieldNone
0.5"
20
None
Eccentric
MPS2
r:

110
Steel Plate (8" x 8")
',, Pins\,
\ zz-Jf
Setup 2
Test Fastener
PS3
Cube
(Not to scale)
Test Set-up #2
Fixture ID PS3
Bolt ID 1/4-28 UNF-3A
Nut ID 1/4-28 UNF-3B
End Mass ID M1
Mass Bolt ID !None
Mass Nut ID None
Spacer ID ,None
Fastener Size 1/4" diam.
Lubrication (threads)
Hole Tolerance
Pre-load
Nut Lockin_i Device
Grip Length
Pitch (thds/in)
iLubdcant (mating materials)
Class of Fit
Joint Conficjuration
Mass of Configuration
None
Oversize
40% yield
None
1.ON
28
Td-Flow
3
Concentric
M1

lll
Steel Plate
\I
(8" x 8")Pins
t_/_
i
Setup 3
Test Fastener
PS3 LJ
Cube
(Not to scale)
M2
Test Set-up #3Fixture ID
Bolt ID
Nut ID
End Mass ID
Mass Bolt ID
Mass Nut ID
Spacer IDFastener Size
Lubdcation (threads)Hole Tolerance
Pre-load
Nut Lockin_l Device
Grip Len_h
Pitch (thds/in)
iLubdcant (mating materials)Class of Fit
Joint Conr_lurationMass of Configuration
PS3
1/4-20 UNC-3A
1/4-20 UNC-3B
M2
None
None
None
1/4" diam.
None
Tight
80% yield
Nylon Insert0.5 N
20
None
_3
Concentric
M2

112
Steel Plate
\/
II!
Setup 4
(8" x 8")Pins
J_ Test Fastener
t it I
Cube
PS1
(Not to scale)
PS2
Test Set-up #4
!Fixture ID
Bolt ID
PS1 & PS2
1/4-28 UNF-2A
Nut ID 1/4-28 UNF-2B
End Mass ID M1
Mass Bolt ID 3/4-16 UNF-2A
Mass Nut ID 3/4-16 UNF-2B
Spacer ID NoneFastener Size 1/4" diam.
Lubrication (threads)Hole Tolerance
Pre-load
Nut Lockin_l Device
Gdp Len_h
Pitch (thds/in_)
Lubricant (matin_l materials)Class of Fit
Joint Confi_lurationMass of Configuration
Tri-Flow
iOversize
40% yield
Nylon Insert0.5"
28
Tri-Flow
Eccentdc
MPS2 + M1

113
Steel Plate (8" x 8")Pins
i t
Setup 5
Test Fastener
Cube
PS3
(Not to scale)
,F__ M3
L_M 3
Test Set-up #5Fixture ID
Bolt ID
:_S3
114-20 UNC-2A
Nut ID 1/4-20 UNC-2B
End Mass ID M3
Mass Bolt ID
Mass Nut ID
None
None
spacer ID NoneFastener Size 1/4" diam.
Tri-FlowLubrication {threads)Hole Tolerance
Pre-load
Nut Locking Device
Gdp Length
Pitch 0hds/in)
Lubricant (mating matedals)Class of Fit
Joint Configuration
Mass of Configuration
Tight
80% yield
iNylon Insert1.0"
20
Td-Flow
2
Concentric

b
, ,
Steel Plate (8" x
'\
\
\\I
I
114
8")
Pins
jz +-JjI
Setup
Test
PS1
i
Cube
6
Fastener
(Not to scale)
PS2
i'
'i
+,
Test Set-up #6Fixture ID
Bolt ID
Nut ID
End Mass ID
Mass Bolt ID
Mass Nut ID
Spacer ID
Fastener Size
Lubrication (threads)Hole Tolerance
Pre-load
Nut LockinQ Device
Grip Lencjth
Pitch (thds/in)
_Lubdcant (mating materials)Class of Fit
Joint Configuration
Mass of Configuration
PS1 &PS2
1/4-28 UNF-3A
114-28 UNF-3B
None
None
None
$1 (0.5" Total)1/4" diam.
Td-Flow
Tight
80% yieldNone
1.0"
28
None
3
Eccentric
MPS2

• .i) :
Steel Plate
\\,
I
115
(8" x 8")Pins
Setup 7
Test Fastener
PL3
Cube
(Not to scale)
_, M 4
M4
i,
i"
Test Set-up #7
:Fixture ID
Bolt ID
Nut ID
End Mass ID
Mass Bolt ID
Mass Nut ID
Spacer ID
Fastener Size
Lubrication (threads)
Hole Tolerance
Pre-toad
Nut LockinQ Device
Grip Len_h
Pitch (thds/in)
Lubricant (mating materials)
Class of Fit
Joint ConfiQuration
Mass of Configuration
PL3
3/4-16 UNF-2A
3/4-16 UNF-2B
M4
None
None
None
3/4" diam.
None
TiQht
80% yield
None
1.0"
16
Tri-Flow
2
Concentric
M4

'i
H
Steel Plate
\\
116
(8" x 8")Pins
I
I
!Ii
Cube
Setup 8
Test Fastener
r-a_M 5' i
PL1PL2
(Not to scale)
Test Set-up #8Fixture ID
Bolt ID
Nut ID
End Mass ID
Mass Bolt ID
Mass Nut ID
Spacer IDFastener Size
Lubrication (threads),Hole Tolerance
iPre-load
Nut Lockin_l Device
Gdp Len_h
Pitch (thds/in)
Lubricant (mating materials)Class of Fit
Joint Confi_luration
Mass of Configuration
PL1 & PL2
13/4-16 UNF-2A
314-16 UNF-2B
M5
3/4-16 UNF-2A
3/4-16 UNF-2B
$2 (1.0" Total)3/4" diam.
None
Ti_lht
80% yield
Nylon Insert.0 l°
16
None
2
Concentric
MPL2 + M5

117
ii¢,
Steel Plate
Setup 9
(8" x 8")Pins
]
Test Fastener
I
PL1
(Not to scale)
PL2
Cube
• ? •
Test Set-up #9
Fixture ID PL1 & PL2
Bolt ID 3/4-10 UNC-3A
Nut ID 3/4-10 UNC-3B
End Mass ID None
Mass Bolt ID None
Mass Nut ID None
Spacer ID
Fastener Size
Lubrication (threads)
Hole Tolerance
Pre-load
Nut Lockin_l Device
Grip Len_h
Pitch (thds/in)
Lubricant (mating materials)
Class of Fit
Joint Confic_luration
Mass of Configuration
$2 (1.0" Total)
3/4" diam.
None
Oversize
40% yield
Nylon Insert
2.0"
10
Tri-Flow
3
Eccentric
MPL2

118
ii .... '
if: ,
Steel Plate (8" x 8")Pins
Setup 10
Test Fastener
V]i
Cube
PL1 II
(Not to scale)
PL2
M6
M6
, ii:_:_' •
i•i:i
Test Set-up #10Fixture ID PL1 & PL2
Bolt ID 3/4-10 UNC-3A
Nut ID 3/4-10 UNC-3B
End Mass ID M6
Mass Bolt ID 3/4-16 UNF-2A
Mass Nut ID 3/4-16 UNF-2B
Spacer ID None!Fastener Size 3/4" diam.
Lubrication (threads)Hole Tolerance
Pre-load
Nut Locking Device
Grip Len_Ith
Pitch (ithds/in)
Lubricant (matin9 materials)Class of Fit
Joint Confi_luration
Mass of Configuration
Tri-Flow
Tight
80% yieldNone
1 o0_
10
Td-Flow
3
Eccentric
MPL2 + M6

119
i ¸
Steel Plate
\(8"
I
x 8")Pins
I_'" j/-'/
Setup 11
Test FastenerM7
PL3
Cube(Not to scale)
Test Set-up #11Fixture ID
Bolt ID
Nut ID
End Mass ID
Mass Bolt ID
Mass Nut ID
PL3
3/4-10 UNC-2A
Lubrication (threads)
3/4-10 UNC-2B
M7
None
None
Spacer ID NoneIFastener Size 3/4" diam.
Tri-Flow
Hole Tolerance
Pre-load
Nut Locking Device
Grip Length
Pitch (thds/in)
Lubricant (mating materials)Class of Fit
Joint Configuration
Mass of Configuration
Oversize
40% yieldNone
2.0"
10
None
Concentric
M7
v

Steel
120
Plate (8" x 8")Pins
Setup 12
Test Fastener
PL3
Cube
(Not to scale)
Test Set-up #12
Fixture ID !PL3
Bolt ID !3/4-16 UNF-3Ai
Nut ID 314-16 UNF-3B
End Mass ID M8
Mass Bolt ID
Mass Nut ID
Spacer ID
Fastener Size
Lubrication (threads)
Hole Tolerance
Pre-load
Nut Lockin_l Device
Grip Len_h
Pitch (thds/in)
,Lubricant (mating materials)
iClass of Fit
Joint Configuration
Mass of Configuration
None
None
None
3/4" diam.
Td-Flow
Oversize
40% yield
Nylon Insert
1.0"
16
None
3
Concentric
M8

_ i __,i_,'_';
APPENDIX B
FABRICATION PROCUREMENT DRAWINGS
AND
LISTINGS FOR TEST SPECIMENS, BOLTS, AND NUTS
121

_ • " i i •¸ " "
. _ • _ • _ • i! I_ _ _ _' . • • _ •
TOtE_CES _
MA'rlERI_. O
At eO_l. T8
lS_ o
TO_ER, ANCE SXX .i0030
MAIERL_LAL eOel.Te
TOtE I_NGE 5Xx. l0 03O
k4ATE RIN.
AL eoet 16
0 _ _I HCX£S
J
PL1 ($ REQO)
7S0"
PL2 (5 RIEOOI
.... -T---,_'[ Io O
1
O._S" _::=,
ta._
PS_ (5 RE{_)I
XX. x0030
o2s'_, ,. jes.
ps3 (s RE (30)
AUBURN UNIVERSITYDEPARTMENT OF CIVIL ENGINEERING
MSFC BOLT LOOSENING PROJECT
DESIGNED BY: RCJ DATE: 11-30-93
DRAWN BY: R.S. REVISED:12-20-93SHEET NO. 1 OF 2
r,o
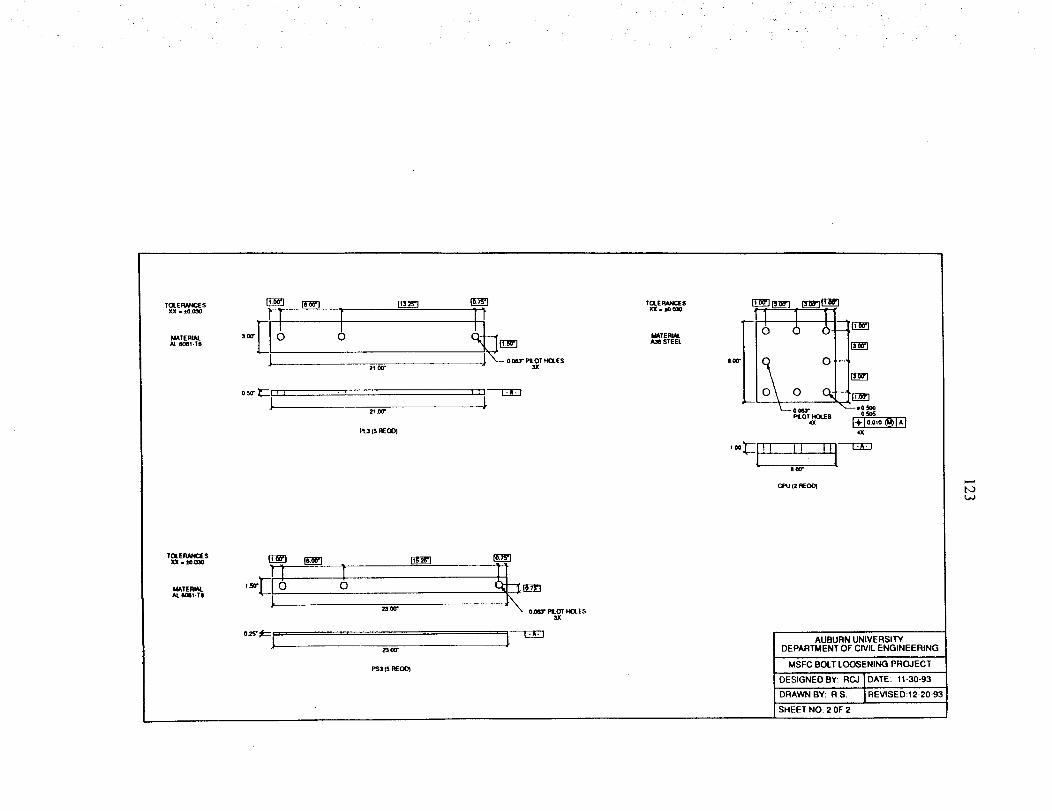
TOLERANOESXX. iO 0_0
MATERIALAI_ e(_l -T6
TOLEP,M4CE SXX. :1_.0_0
MATERIALAL 8(_1 -T6
r_q
2t 00"
_]
0
2300"
8E_]
_- o_'_'1o83• PILOT HOLES
3)(
TOI.E_S
MATERIALA36 STEEL
PILOT HOLES 0 _S
,x,IX
l lcPu(z _
AUBURN UNIVERSITY
DEPARTMENT OF CIVIL ENGINEERING
MSFC BOLT LOOSENING PROJECT
DESIGNED BY: RCJ 1 DATE: 11-30-93
DRAWN BY: R.S. I R---_E_93
SHEET NO. 2 OF 2

TOLERANCESXX= _0 030
MATERIALSTEEL
TO_JERANCESXX - _030
MATERIALSTEEL
0 75" 822 ± 010
Ul il REQO)
_ _0822 2.010
025"
7S*
150"
M2 (I RECO)
TOLERANCESXX. tO 0:)0
MATERIALSTEEL
TOLERANCESXX. _OO30
MATERIAL
A36 STEEL
I
1
1
2 65"
5.30*
175" 07SO*DIA 20.006"
l3_"
M3 (t REOO)
AUBURN UNIVERSITY
DEPARTMENT OF CIVIL ENGINEERtNG
MSFC BOLT LOOSENING PROJECT
DESIGNED BY: RCJ / DATE 11-3093
DRAWN BY: R S I REVISED 1-18-94
SHEET NO 30F 5
FJ

/
TOLERANCESXX . t0030
MATERIALA36 STEEL
TOLERANCESXX _ iO 030
MATERIALA36 STEEL
075" -- 0 750" DIA :t 000_"
150"
M5,(1 REOD)
I IB" /--- 0750" DIA. t 0 005"
l....................12 36"
L- ........ -J236"
M6 (1 HEQD)
TOLERANCESXX - _O030
MATERIALA36 STEEL
f
J
1 75"
350"
35O"
M7 [I REQD)
AUBURN UNIVERSITY
DEPARTMENT OF CIVIL ENGINEERING
MSFC BOLT LOOSENING PROJECT
DESIGNI:DBY RCJI DATE 1130 93i
DHAWN BY R S | RI-VISE() 1-18 94I
Sill.| IN() 40F5
=,-.=
FO

TOLERANCESXX-tO030
MATERIALA,36STEEL
TOLERANCESXX.t0030MATERIAL
A36 STEEL
f tsar_ /---- 0250" DIA tOOCS"
360"
02_0"
IX
SECTION (_
Me (I REOD)
I_ S 0250" DIA. J:0.005"
Mg(t REQD)
I ®
TOLERANCESXX = _0030
MATERIALA36STEEL
1.1S" /'-- o 2_r_* OtA i 0 005 *
l l
o-,,-,,,,,-,E_li_ I--_23O"
MtO(I REQO)
AUBURN UNIVERSITY
DEPARTMENTOFCIVILENGINEERING
MSFC BOLT LOOSENING PROJECT
DESIGNED BY: RCJ DATE: 11-30.93
DRAWN BY: R.S REVISED: 1-18-94
SHEET NO. 5 OF 5
I',,.)
O_

127
L ¸
114m No
1
D¢_npllon
114" B_II-CII_ 2 •
2 tldl" II_l.C'lum ! •
Mimq Phu= Nut
1.4" I_III.CIMI _ &
Cou_ Tllr¢_l
M.w,_l ._llM.adUNl Nul
Fi_ TIm_md
Mauq .$tlf.l._Juq Nut
$ I/4 ° tlol,-C'lm_ 2 •
_q Self-Lock_ I Nul
6 i/4" _l_l-C_u_ 3 •
• _mql .$¢U'-L_q Nut
Mm_ll Phu= Nul
7 3/4" ilolI-E_um 2 •
l_qUll Plms N_
IS )14" _I-C_: _ &
Fise Tk_
!_m,ml _lf-I._ Nm
9 _14" BolI-Cl_ .I •
l_,l_uq Sel_-Lor._=q Nu_
10 }14" Bol_-C_u_ 3
• C_ Tllread
pIm_ Nut
11 314" lloU_ 2 &
_u_NI pIm= Nut
12 }t4" _-Chl_ 3 &
M_usll ._.It'-L4_Q= I Nut
M_,_II ylms Nul
13 3/4" Bo_-O_ 2 &
"nlmld
.T,_ f J.,_¢K,,_ Nu_
14 3t4" _olI-C_ 2 &
15 1/'2" Pm ,_
x 4" I.._1
IIO_T,NI_'J" RJE_ BI.F._N'YS
S_¢_: i flcillOll
I/_.0 t JNC.2A
114-20 UNC- _1_
3_,92-3
114"21 UI'_I.P- 3 A
NA_ I]S I C'/_32
I ¢4-2g UI41 F- 3B
93_6- I0
314"20 (INRC-}A
NA5 1)$2C'4-24
114-20 IJNC.3U
145 I _(_J1"4C
1141-211 U E'F-2 A
MS ]5]011-310
114-_.Jl UNF,2D
MS 519_-6
114-20 UNC-2^
MS I_.01-I I
114-20 UNC-2B
_1992-2
t 14-_.JI UNII_-) A
114-21 UNF-3B
M._ ! 1044-C4
I/4-_.J_ U_IJ P-]B
MS 93_- 10
31&16 UNF-2A
MS 35301-490
31&16 I.J'_I_F -911
Iv_ 3_692-6_
314-16 UNI=-_.A
3530_.,494
314-16 UNF-2B
MS ._ 193,2-6_
314-10 UNRC-3A
NA._ 13_2C- t3-_6
31'I_IO-UNC-3B
M_ l _--.I- I?.C
314-10 UN_C-}A
N/_ 13_2-12-44
]ff¢. |0 U'_C-30
MS |£_.i- |2C(')
31_,- I 0 UNC-2^
3/4-10 UNC-_.B
3_-59
314-16 UN'RF-3 A
NA._ 13_1C-12-4al
31_-16 UI_F-3B
M5 210.6bC" | _.
314-16 UNF-3B
I_ 935_- 1"7
J14-16 UNT-2^
35301-493
314-16 UNF-3B
3/4-16 _NF-2 A
I_ 35301-_1
314_16 UN3F-2_
171790
LIIIII
Ur, Jer Head _,i)
I.%
I 3U
2.0
3.0
2.'75
2.'_
3.75
2.'/5
3O
2.25
4.0
Qumu,l_
20_
T_m_ No
12
B2
O_E_NAL, PAGE !_,OF POOR

APPENDIX C
EXECUTION OF TEST MATRIX DATA
128

L
129
Test #1 a
Length before testing
Length after torquin_l
Length after sine-sweep
Length after burnishing
Length after level-1
1.5116
1.5147
(in)
Length chn9.
0.0031
1.5147 0.0031
1.5130
1.5130
0.0014
0.0014
Length Chng. 0.0014
Stress Chng. 0
Test #1b
Length before testing 1.5111
1.51 35Length after torquing
Length after bumishin 9
Length after level-1
(in)
Length chng.
0.0024
1.5125 0.0014
1.5122 0.0011
Length Chng. 0.0011
Stress Chng. -17.4
(in*lb)
On-torque 85
Off-torque 40
ITorq. Chng. I 45 I
(in*Ib)
On-torque 85
Off-torque 55
ITorqC.ngI 30 I
(in)
Test #1 c Length chng.
Length before testing 1.51 751.5202 0.0027Length after torquin 9
Length afterbumishing
Length after level-2
1,5193 0.0018
1.5193 0.0018
Length Chn_. 0.0018
Stress Chng. 0
(in*lb)
On-torque 85
Off-torque 75
ITorq. Chng. I 10 I
,•: , ,<
x
Test #1 d
Length before testing
Length after torquing
1.5138
(in)
Length chng.
1.5151 0.0013
Length after burnishing 1.5148 0.0010
Length after level-2 1.5145 0.0007
Length Chng. 0.0007
Stress Chng. -17.4
(in*lb)
On-torque 95
Off-torque 85
ITorq.Chnq. I 10 I

• i , )
k •
£i
130
(in)
Test #1e Length chng.
1.5111
1.5128 0.0017Length before testing
Len_;]th after torquing
Length after sine-sweep
Length after burnishing
Length after level-1
1.5128 0.0017
1.5128
1.5116
0.0017
0°0005
Length Chng. 0.0005
Stress Chng. -69.6
(in)
Test#1f Length chng,
1.5098
1.5114 0.0016
Length before testing
Length after torquing
Length after burnishing 1.5112 0.0014
Length afterlevel-1 1.5107 0.0009
Length Chng.
S_ess Chng.
0.0009
-29
(in)
Len_;Ithchng.Test #1 g
Length before testing
Length after torquing
Length after burnishing
Length after level-2
1.5161
1.5178 0.0017
1.5175 0.0014
1.5161 0.0000
Length Chng. 0.0000
Stress Chng. -81,2
Test #1 h
Length before testing
]Length after torquing
Length after bumishing
Length afterlevel-2
(in)
Length chng.
1.5163
1.5175 0.0012
1.5175 0.0012
1.5163 0.0000
Length Chng. 0.0000
Stress Chng. -69.6
(in*lb)
On-torque 85
Off-torque 50
ITorq.Chng. I 35 I
(in*lb)
On-torque 85
Off-torque 50
]T orq. Chng. [ 35 ]
(in*lb)
On-torque 85
Off-torque 70
ITorq.Chn .I 15 I
(in*lb)
On-torque 85
Off-torque 0
ITorq. Chng. I 85*
* Total loss of preload
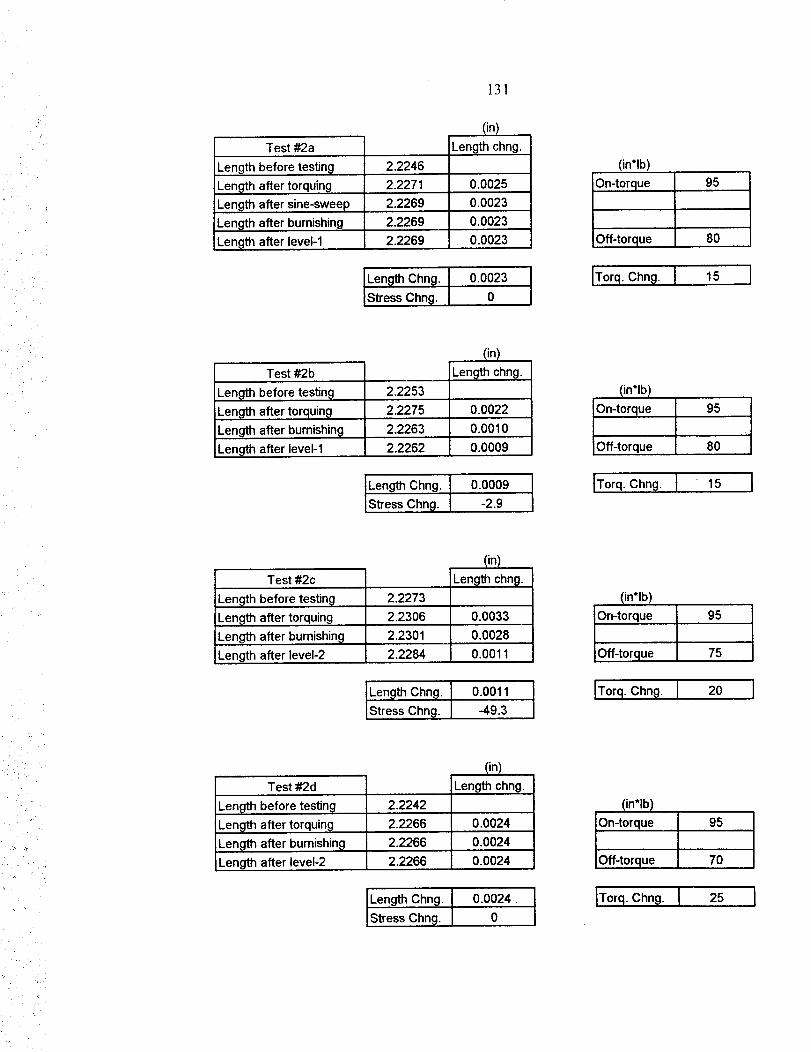
131
i•, :
Test #2a
Length before testing
Len_lth after torquing
Length after sine-sweep
Length after burnishing
Length after level-1
2.2246
2.2271
2.2269
(in}
Length chng.
0.0025
0.0023
2.2269 0.0023
2.2269 0.0023
Length Chn_. 0.0023
S_essChng. 0
Test #2b
Length before testing
Length after torquing
Length after burnishin_t
Length after level-1
2.2253
2.2275
2.2263
2.2262
(in)
Length chng.
0.0022
0.0010
0.0009
Length Chng. 0.0009
S_ess Chng. -2.9
(in*lb)
On-torque 95
Off-torque 80
ITorq.Chng. I 15 I
(in*lb)
On-torque 95
Off-torque 80
IT°rq-Chng • I 15 I
•!
Test #2c
Length before testing 2.2273
(in)
Length chng.
Length after torquing 2.2306 0.0033
Length after burnishing 2.2301 0.0028
Length after level-2 2.2284 0.0011
Length Chng. 0.0011
S_ess Chng. -49.3
Test #2d
Length before testing
Length after torquing
Length after burnishing
Length after level-2
2.2242
(in)
Lengthchng.
2.2266 0.0024
2.2266 0.0024
2.2266 0.0024
Length Chng. 0.0024•
S_ess Chng. 0
(in*lb)
Omtorque 95
Off-torque 75
ITorq.Chng. I 20 I
(in*lb)
On-torque 95
Off-torque 70
ITorq. Chng. I 25 I

•i
132
Test #2e
Length before testing
Length after torquing
Length after sine-sweep
Length after burnishing
Length after level-1
2.2236
(in)
Length chng.
2.2260
2.2260 0.0024
2.2260 0.0024
0.0024
2.2243 0.0007
Len_;IthChng. 0.0007
S_ess Chng. -49.3
(in)
Test#2f Length chng.
Length beforetesting 2.2261
2.2287 0.0026Lengt_ after torquing
Len_ after burnishing 2.2283 0.0022
Length afterlevel-1 2.2260 -0.0001
Length Chng. -0.0001
S_ess Chng. -66.7
(in*lb)
On-torque 90
Off-torque 65
ITorq.Chng. I 25 I
(in*lb)
On-torque 90
Off-torque 70
ITorq.Chng. I 20 I
Test #2g
Length before testing 2.2225
Length after torquing 2.2250
Length after burnishing 2.2249
Length after level-2 2.2249
(in)
Length chng.
0.0025
0.0024
0.0024
Length Chn9. 0.0024
S_ess Chng. 0
Test #2h
Length before testing
Length after torquing
Length after bumishing
2.2200
(in)
Length chng.
2.2227 0.0027
2.2227 0.0027
Length afterlevel-2 2.2214 0.0014
Length Chng. 0.0014
S_ess Chng. -37.7
(in*lb)
On-torque 90
Off-torque 65
ITorq.Chn_. I 25 I
(in*lb)
On-torque 95
Off-torque 65
ITorq.Chng. I 30 I

• • '7"
.%
133
Test #3a
Length before testing
Len_ after torquing
Length after sine-sweep
Length after burnishing
Length after level-1
(in)
Length chng.
1.2340
1.2317
1.2340 0.0023
1.2340 0.0023
0.0023
1.2332 0.0015
Len_]thChn_. 0.0015
Stress Chng. -46.4
I
i Test #3b
Length before testing
Len_Ith after torquing
1.2321
1.2344
Length after burnishing 1.2342
Length after level-1 1.2335
(in)
Length chng.
0.0023
0.0021
0.0014
Length Chng. 0.0014
Stress Chng. -40.6
(in*lb)
On-torque 150
Off-torque 1O0
ITorq. Chng. [ 50 I
(in*lb)
On-torque 150
Off-torque 1O0
[T orq. Chng. [ 50 [
• i _ "Test #3c
Length before testing 1.2400
(in)
Length chng.
Length after torquing 1.2435 0.0035
Length after burnishing 1.2430 0.0030
Length after level-2 1.2430 0.0030
Len_h Chng. 0.0030
Stress Chng. 0
(in*lb)
On-torque 140
Off-torque 110
I'rorq.Chn_. I 30 I
Y , , :
Test #3d
Length before testing
Length after torquing
Length after burnishing
Length after level-2
1.2343
(in)
Length chng.
1.2369 0.0026
1.2368 0.0025
1.2365 0.0022
Length Chng.
Stress Chng.
O.OO22
-17.4
(in*lb)
On-torque
Off-torque
140
110
[Torq. Chng. ] 30 I

: "i =_
2
Test #3e
Len_]th before testing
Length after torquing
Length after sine-sweep
Length after burnishing
Length after level-1
134
(in)
Length chng.
1.2365
1.2390 0.0025
1.2390 0.0025
1.2389 0.0024
1.2375 0.0010
Length Chng. 0.0010
S_ess Chng. -81.2
(in)
Length chng.
0.0028
Test #3f
Length before testing
Length after torquing]
Length after burnishing
Length after level-1
1.2335
1.2363
1.2363
1.2360
0.0028
0.0025
Length Chng. 0.0025
S_essChng. -17.4
Test #3g
Length before testing
Length after torquing
Length after burnishing
Length after level-2
1.2356
(in)
Len_thchng.
1.2385 0.0029
1.2384 0.0028
1.2368 0.0012
Len_;tthChn9. 0.0012
S_ess Chng. -92.8
(in*lb)
On-torque 140
Oft-torque 90
ITorq.Chng. I 50 I
(in*lb)
On-torque 150
Oft-torque 100
[Torq.Chng. I " 50 I
(in*lb)
On-torque 150
!Off-torque 110
ITorq. Chng. [ 40 ]
Test#3h
Length before testing
Length after torquing
Length after burnishing
(in)
Length chng.
1.2374
1.2413 0.0039
1.2410 0.0036
Length after level-2 1.2405 0.0031
Leng_Chng. 0.0031
S_essChng. -29
(in*lb)
On-torque
Oft-torque
150
80
ITorq. Chng. I 70 I

,. ,L
135
Length before testing
Len_;_thafter torquing
Length after sine-sweep
Length after burnishing
Length after level-1
(in)
Test #4a Length chng.
1.4070
1.4085 0.0015
1.4085 0.0015
1.4085 0.0015
1.4075 0.0005
Length Chn_. 0.0005
Skess Chng. -58
i Test #4b
Length before testing
Length after torquing
Length after burnishing
Length after level-1
1.4215
(in)
Length chng.
1.4230 0.0015
1.4230 0.0015
1.4221 0.0006
Length Chng. 0.0006
S_ess Chng. -52.2
(in*lb)
On-torque 90
Off-torque 50
[Torq. Chng. J 40 J
(in*lb)
On-torque 110
Off-torque 80
JTorq. Chng. I 30 J
(in)
Test #4c _Length chng.
Length before testing 1.42111.4230 0.0019
1.4230 0.0019
Length after torquing
Length after burnishing
Length after level-2 1.4230 0.0019
Len_hChn 9.
S_ess Chng.
0.0019
(in*lb)
On-torque
Off-torque
100
80
[Torq. Chng. J 20 J
(in)
Test#4d Length chng.
Length beforetesting 1.4017
1.4025 0.0008Length after torquing
Length after burnishing 1.4025 0.0008
1.4020 0.0003Length after level-2
Length Chng. 0.0003
S_ess Chng. -29
(in*lb)
On-torque
Off-torque
100
7O
JTorq.Chng. I 30 I

' iII , _ ,
!_ •i_: • :
136
(in)
Test#4e Length chng,
Length before testing
Length after torquing
Length after sine-sweep
1,4244
1.4260
1.4260
1.4265
1.4260Length after burnishing
Length after level-1
0.0016
0.0016
0.0021
0.0016
Len_hChng. 0.0016
S_ess Chng. -29
(in)
Test #4f Length chng.
Length before testing 1.4248
1.4262 0.0014Length after torquing
Length after burnishing 1.4262
Length after level-1 1.4256
0.0014
0.0008
Length Chng. 0.0008
S_ess Chng. -34.8
(in*lb)
On-torque 100
Off-torque 80
[Torq. Chn9. ] 20*
* Outer segment of
specimen rotated
Approx. 10 degrees
and then microwelded.
(in*lb)
On-torque 100
Off-torque 55
]Torq, Chng. ] 45 ]
H,
• , =: (
Test #4g
Length before testing
Length after torquing
Length after bumishing
Length after level-2
(in)
Length chng.
1.4252
1.4270 0.0018
1.4270 0.0018
1.4260 0,0008
Length Chng. 0.0008
S_ess Chng. -58
Test #4h
Length before testing
Length after torquing
Length after burnishing
Length afterlevel-2
1,4295
(in)
Length chng.
1.4310 0.0015
1.4310 0.0015
1.4300 0.0005
Length Chng. 0.0005
S_ess Chng. -58
(in*lb)
On-torque 100
Off-torque
[Torq. Chng. ] ....
* Failed to record. Nut
did not loosen
completely.
(in*lb)
On-torque
Off-torque
100
9O
]Torq. Chng. [ 10 I

%.
137
Test #5a
Length before testing
Length after torquing
Len_'_n after sine-sweep
Length after burnishing
Length after level-1
2.1619
(in)
Leng_ chng.
2.1653
2.1655 0.0036
2.1655 0.0036
2.1653 0.0034
0.0034
Len_;tthChng. 0.0034
S#ess Chng. 0
Test#5b
Length before testing
Length after torquin_
iLength after burnishing
ILength after level-1
2.1595
2.1643
(in)
Length chng.
0.0048
2.1642 0.0047
2.1641 0.0046
Length Chng. 0.0046
Stress Chng. -2.9
Test #5c
Length before testing
Length after torquing
2.1537
(in)
Length chng.
2.1582 0.0045
Length after burnishing 2.1582 0.0045
Length after level-2 2.1577 0.0040
Length Chn9.
S#ess Chng.
0.0040
-14.5
Test#5d
Length before testing
Length after torquing
Length after burnishing
(in)
Length chn_.
2.1563
2.1592 0.0029
2.1590 0.0027
Length after level-2 2.1590 0.0027
Length Chng. 0.0027
S_ess Chng. 0
(in'lb)
On-torque 140
100Off-torque
[Torq. Chng. I 40 I
(in*lb)
On-torque 145
Off-torque 110
[T orq. Chng. I 35 I
(in*lb)
On-torque 140
Off-torque 110
[Torq. Chn_]. I 30 I
(in*lb)
On-torque 155
Off-torque 120
ITorq.Chng. I 35 I

138
Test #5e
Length before testing
Len_th after torquing
Length after sine-sweep
Length after burnishing
Length after level-1
2.1999
2.2045
2.2045
2.2042
(in)
Length chng.
0.0046
0.0046
0.0043
2.2042 0.0043
Length Chng. 0.0043
Stress Chng. 0
Test #5f
Length before testing
Len_t_ after torquing
Length after burnishing
Length after level-1
{in)
Length chng.
2.1527
2.1562 0.0035
2.1560 0.0033
2.1560 0.0033
Length Chng. 0.0033
Stress Chng. 0
(in*lb)
On-torque 150
Off-torque 110
ITorq.Chng. I 40 I
(in'lb)
On-torque 160
Off-torque 115
ITorq.Chng. I 45 I
••d ¸ • •.
Test#5g
Length before testing 2.1544
Length after level-2
(in)
jLength chng.
Length after torquing 2.1590 0.0046
Length after burnishing 2.1590 0.0046
2.1590 0.0046
0.0046
Test#5h
(in)
Length chng.
Length before testing 2.1583
Length after torquing 2.1631 0.0048
Length after burnishing 2.1630 0.0047
Length after level-2 2.1630 0.0047
Length Chng. 0.0047
Stress Chng. 0
(in*lb)
On-torque 160
Off-torque 115
ITorq. Chng. I 45 I
(in*lb)
On-torque
Off-torque
ITorq.Chng. I
160
130
30 I

<
J
/
Test #6a
Length before testing
Length after torquing
Length after sine-sweep
Len_h after burnishing
Length after level-1
2.2297
139
(in)
Length chng.
2.2358 0.0061
2.2358 0.0061
2.2358 0.0061
2.2358 0.0061
Length Chng.
Stress Chng.
0.0061
0
(in)
Length chng.Test #6b
Length before testing
Length after torquing
Length after bumishing
Length after level-1
2.2264
2.2318 0.0054
2.2306 0.0042
2.2299 0.0035
Length Chng. 0.0035
Stress Chng. -20.3
Test #6c
Length before testing
Length after torquing
2.2307
(in)
Length chng.
2.2360 0.0053
Length afterburnishing 2.2360 0.0053
Length afterlevel-2 2.2315 0.0008
Length Chng. 0.0008
Stress Chng. -130.5
(in*lb)
On-torque 150
Off-torque ....
[Torq.Chng. [ ....
* Failed to record.
Nut did not loosen
completely.
(in*lb)
On-torque 130
Off-torque 80
ITorq.Chng. I 50 ]
(in*lb)
On-torque 145
Off-torque 95
ITorq.Chng. I 50 I
i'i
Test #6d
Length before testing
Length after torquing
Length after burnishing
Length after level-2
(in)
Length chng.
2.2270
2.2248
2.2299 0.0051
2.2273 0.0025
0.0022
Length Chng.
Stress Chng.
0.0022
-8.7
(in*lb)
On-torque
Off-torque
150
105
ITorq. Chng. I 45 I

: i_!i_!
,,. : i}
140
(in)
Test #6e Length chng.
Length before testing 2.23852.2436 0.0051
2.2435 0.0050
2.2435 0.0050
Length after torquin 9
Len_;_d_after sine-sweep
Length after burnishin 9
Length after level-1 2.2418 0.0033
Length Chn 9. 0.0033
Skess Chn 9. -49.3
Test #6f
Length before testing
Length after torquin9
Length after burnishing
Length after level-1
2.2338
(in)
Length chng.
2.2376 0.0038
2.2376 0.0038
2.2376 0.0038
Length Chng. 0.0038
Stress Chng. 0
(in*lb)
On-torque 150
Off-torque 120
ITorq.Chng. I 30 I
(in*lb)
On-torque
Off-torque
130
80
ITorq.Chng. I 50 I
Test #69
Length before testing
Length after torquing
Length after bumishing
2.2240
2.2290
(in)
iLength chng.
0.0050
2.2290 0.0050
Len_h afterlevel-2 2.2290 0.0050
Length Chng.
S_ess Chng.
0.0050
Test #6h
Length before testin 9
Length after torquing
Length after burnishing
(in)
Length chng.
2.2240
2.2284 0.0044
0.00432.2283
Length afterlevel-2 2.2270 0.0030
Length Chng. 0.0030
S_ess Chng. -37.7
(in*lb)
On-torque 130
95Off-torque
ITorq.Chng. I 35 I
(in*lb)
On-torque
!Off-torque
145
100
ITorq.Chng. I 45 I

" 141
(in)
Test#7a Leng_ chng.
3.1668
3.1695 0.0027Length before testing
Length after torquin_l
Length after sine-sweep
Length after burnishing
Length after level-1
3.1695 0.0027
3.1695 0.0027
3.1690 0.0022
Length Chng. 0.0022
S_essChn9. -14.5
Test#7b
Length before testing
Lender1 after torquing
Length after burnishing
Length after level-1
3,1710
(in)
Length chng.
3.1746 0.0036
3.1746 0.0036
3.1736 0.0026
Length Chng.
S_ess Chng.
0.0026
-29
(in)
Length chng.
(ft*lb)
On-torque 180
Off-torque 160
[Torq. Chng. I 20 I
(ft*lb)
On-torque 180
Off-torque 140
ITorq. Chng. J 40 I
Test#7c
Length beforetesting 3.1706
3.1730 0.0024Length after torquing
Length after burnishing 3.1730 0.0024
Length afferlevel-2 3.1723 0.0017
Len_l_Chng. 0.0017
S_ess Chng. -20.3
(ft*lb)
On-torque 180
Off-torque 125
ITorq.Chng. I 55 I
Test #7d
Len_'h before testing
Length after torquing
Length after burnishing
Length after level-2
3.1760
(in)
Length chng.
3.1758 -0.0002
3.1758 -0.0002
3.1758 -0.0002
Length Chng.
S_ess Chng.
-0.0002
0
(ft'lb)
On-torque 180
Off-torque 145
ITorq. Chng. I 35 I

" 142
! •
Cin)
Test #7e Length chng.
Length before testing 3.17143.1737 0.0023Length after torquing
Length after sine-sweep 3.1736
3.1736
0.0022
Length after burnishing
Length after level-1
0.0022
3.1736 0.0022
Length Chng. 0.0022
Stress Chn 9. 0
(in)
Test #7f Length chng.
3.1725
3.1737 0.0012Length before testing
Length after torquing
Length after bumishing 3.1728 0.0O03
Length after level-1 3.1728 0.0003
Length Chng. 0.0003
StTess Chng. 0
(ft*lb)
iOn-torque 180
Off-torque 155
ITorq. Chng. I 25 I
(ft*lb)
On-torque 180
Off-torque 155
ITorq. Chng. I 25 I
Test #7g
(in)
Length chng.
Length before testing 3.1720
Length after torquing 3.1718 -0.0002
Length after bumishing 3.1718 -0.0002
Length after level-2 3.1715 -0.0005
Length Chng. -0.0005
S_ess Chng. -8.7
(ff*lb)
On-torque
Off-torque
180
160
ITorq.Chng. I 20 I
(in)
Length before testing
Length after torquing
Length after burnishing
Test#7h Length chng.
3.1725
3.1720 -0.0005
3.1744
3.1741Length after level-2
0.0019
0.0016
Length Chng. 0.0016
S_ess Chng. -8.7
(ft*lb)
On-torque 180
Off-torque 160
IT orq. Chng. I 20 I

;r •
143
(in)
Len_h before testing
Length after torquing
Length after sine-sweep
Test #8a Length chng,
4.1482
4.1507 0.0025
4.1507 0.0025
4.1506 0.0024
4.1500Len_h after burnishing]
Length after level-1 0.0018
Length Chn_].
Stress Chng.
0.0018
-8.7
(in)
Length chng.Test #8b
Length before testing
Len_th after torquin_l
Length after burnishing
Length after level-1
4.1560
4.1545 -0.0015
4.1553 -0.0007
4.1568 0.0008
Length Chng. 0.0008
21.75Stress Chn_l.
(ft*lb)
On-torque 180
Off-torque 150
IT orq. Chng. I 30 I
(ft*Ib)On-torque 180
Off-torque 145
ITorq. Chng. I 35 I
Test #8c
Length before testing
Length after torquing
Length after burnishing
Length after level-2
(in)
Length chng.
4.1510
4.1538 0.0028
4,1531 0.0021
4.1547 0.0037
Length Chng. 0.0037
Stress Chng 23,2
180
Off-torque 140
ITorq.Chn_. I 40 I
Test #8d
Length before testing
Length after torquing
Length after burnishing
Length after level-2
(in)
Length chng.
4.1500
4.1480
4.1500 0.0020
0.0020
4.1500 0.0020
Length Chng. 0.0020
Stress Chng. 0
(ft'lb)On-torque
Off-torque
180
155
ITorq.Chng. I 25 I

144
Test #8e
Length before testin_
Length after torquin9
Length after sine-sweep
Length after burnishing
Length after level-1
4.1406
(in)
Length chng.
4.1420 0.0014
4.1420 0.0014
4.1420 0.0014
4.1420 0.0014
0.0014
0
(in)
Length chng.
(ft*Ib)
On-torque
Off-torque
180
140
[email protected] 40 I
Test #8f
Length before testing
Length after torquing
Length after burnishing
Length after level-1
4.1275
4.1288
4.1282
4.1282
0.0013
0.0007
0,0007
Length Chng. 0.0007
0Stress Chng.
(ft'lb)
On-torque
Off-torque
180
145
ITorq.Chng. I 35 I
Test#8g
(in)
Length chng.
Length after level-2 4.1547
Length before testing 4.1510
Length after torquing 4.1535 0.0025
Length after bumishing 4.1570 0.0060
0.0037
Length Chng.
Stress Chng.
0.0037
-33.35
(in)
Test #Sh Length chn_.
Length before testing 4.15304.1545 0.0015Length after torquing
Length after bumishing
Length afterlevel-2
4.1540
4.1530
0.0010
0.0000
Length Chng. 0.0000
Stress Chng. -14.5
(ft*lb)
On-torque 180
Off-torque 135
ITorq.ChnB. I 45 I
Off-torque
180
150
ITorq.Chng. I 30 [

145
/
Test #9a
Length before testing
Len!_tl after torquin9
Len_;lthafter sine-sweep
Length after bumishin 9
Length after level-1
4.2055
4.2095
4.2095
4.2095
(in)
Length chng.,
0.0040
0.0040
0.0040
4.2095 0.0040
Len_lthChng. 0.0040
S_ess Chng. 0
Test#9b
iLength before testing
Len_h after torquin 9
Length after burnishing
4.2005
4.2050
(in)
Length chng.
0.0045
4.2050 0.0045
Length afterlevel-1 4.2050 0.0045
Length Chng. 0.0045
S_ess Chng. 0
Test #9c
Length before testing]
Length after torquing
Len_h after burnishing
Length after level-2
4.2111
4.2157
4.2157
4.2152
(in)
Length chng.
0.0046
0.0046
0.0041
Len_:hChng.
S_essChng.
0.0041
-14.5
(ft*lb)
On-torque 135
Off-torque 110
ITorq. Chng. I 25 I
(ft*lb)
On-torque 135
Off-torque 120
ITorq. Chng. I 15
(ft*lb)
On-torque 135
Off-torque 110
ITorq.Chng. I 25 I
Test #9d
Length before testing
Length after torquing
Length after burnishing
Lengl_ after level-2
4.2106
(in)
Length chng.
4.2153 0.0047
4.2153 0.0047
4.2150 0.0044
0.0044Length Chng.
S_ess Chng. -8.7
(ft*lb)
On-torque 140
Off-torque
ITorq. Chng. I
* Failed to record.
Nut did not loosen
completely.

146
Test #9e
Length before testing
Length after torquin_l
Length after sine-sweep
Length after burnishing
Length after level-1
4.2045
4.2100
(in)
Length chng.
0.0055
4.2098 0.0053
4.2098 0.0053
4.2098 0.0053
Length Chn 8. 0.0053
S_ess Chng. 0
(ft*Ib)
On-torque 130
Off-torque 120
ITorq.Chng. I 10 I
i _ _ ._
(in)
Test#9f Length chng.
4.1955
4.2020 0.0065Length before testing
Length after torquing
Length after burnishin@
Length after level-1
4.1975 0.0020
4.1975 0.0020
Length Chng. 0.0020
S_ess Chng. 0
Test#9g
Length before testing 4.2064
Len_h after torquing 4.2115
Len_[h after bumishing 4.2115
Length after level-2 4.2115
(in)
ILength chng I0.0051
0.0051
0.0051
Length Chng.
S_ess Chng.
0.0051
0
Test #9h
Length before testing 4.2128
Len_d_ after torquing 4.2165
Length after burnishing
(in)
Length chng.
0.0037
4.2163 0.0035
Length after level-2 4.2163 0.0035
Length Chng. 0.0035
IS_ess Chng. 0
(ft'lb)
On-torque 130
!Off-torque
ITorq. Chng. I
* Failed to record.
Nut did not loosen
completely.
(ft*lb)
On-torque 140
130Off-torque
ITorq.Chn_l. I 10 I
(ft*lb)On-torque
Off-torque
140
105
ITorq.Chng. I 35 I

"r
_, i_:_:
147
Len_ before testing
Length after torquing
Len_th after sine-sweep
Length after burnishing
Length after level-1
(in)
Test#10a Length chng.
3,4745
3.4850 0.0105
3,4850 0.0105
3.4850 0.0105
3.4830 0.0085
Len_hChng.
Stress Chng.
0.0085
-58
(in)
Length before testing
Length after torquing
Len_;_h after burnishingLength after level-1
Test#10b Length chng.
3.4760
3.4870 0.0110
3.4870
3.4830
0.0110
0.0070
Length Chng.
Stress Chng.
0.0070
-116
(in)
Len_hchng.
(ft*lb)
i On-torque 180
Off-torque 140
ITorq.Chng. I <, 40 I
(ft*Ib)
On-torque
Off-torque
180
150
ITorq.Chng. l 30 l
Test #10c
Length before testing
Length after torquing
Length after burnishing
3.4825
3.4855 0.0030
3.4855 0.0030
Length afterlevel-2 3.4855 0.0030
Length Chng.
S_ess Chng.
0.0030
(ft*lb)
On-torque 180
125Off-torque
ITorq.Chng. I 55 I
i_ _ .
Test #10d
Length before testing
Len(_th after torquing
Length after burnishing
Length after level-2
(in)
Length chng.
3.4800
3.4860 0.0060
3.4860 0.0060
3.4840 0.0040
Length Chng.
Stress Chng.
0.0040
-58
(ft*lb)
On-torque
Off-torque
180
105
ITorq.Chng. I 75 I

J
!
148
Test #10e
Length before testing
Len_;_thafter torquin9
Len_ after sine-sweep
Length after burnishing
Length after level-1
(in)
Length chng.
3.4800
3.4765
3.4840 0.0075
3.4840 0.0075
3.4800 0.0035
0.0035
Length Chng.
Stress Chn9.
0.0035
0
(in)
Length chng.
(ft*lb)
On-torque 180
Off-torque 145
ITorq• Chng" I 35 ]
i: _ _i_
i _i/i. iii
Test #1 Of
!Length before testing
Len_It_ after torquing
Length after burnishing
Length after level-1
3.4830
3.5070
3.4785
3.4750
0.0240
-0.0045
-0.0080
Length Chng. -0.0080
Stress Chng. -101.5
Test#10g
Len_h before testin 9
Length after torquing
3.4805
(in)Length chng.
3.4850 0.0045
Length after burnishing
Length after level-2
3.4850 0.0045
3.4850 0.0045
Length Chng. 0.0045
Stress Chng. 0
Test #1 Oh
Length before testing
Length after torquing
Length after burnishing
Length after level-2
3.4845
(in)
Length chng.
3.4800 -0.0045
3.4820 -0.0025
3.4945 0.0100
Lengt_Chng. 0.0100
Stress Chng. 362.5
(ft*lb)
On-torque 180
Off-torque 140
ITorq. Chng. I 40 I
(ft*lb)
:On-torque
Off-torque
180
140
ITorq.Chng. I 40 I
(ft*lb)On-torque 180
Off-torque 145
ITorq. Chng. I 35 I

?
q
i!_. ,
Test #11 a
Length before testing
Len_]th after torquin(_!
Len_]th after sine-sweep
Len_]th after burnishing
ILength after level-1
4.1709
149
(in)
Length chng.
4.1722 0.0013
4.1722 0.0013
4.1722 0.0013
4.1714 0.0005
Length Chng. 0.0005
S_essChng. -11.6
I Test#11b
iLength beforetesting
Length after torquing]
Length after burnishing
Length after level-1
4.1675
4.1709
4.1708
4.1700
(in)
Length chng.
0.0034
0.0033
0.0025
Length Chng. 0.0025
S_essChn 9. -11.6
(in)
Test#11c Length chng.
4.1738
4.1769 0.0031
iLength before testing
Length after torquin9
Length after burnishing 4.1761 0.0023
iLengthafterlevel-2 4.1761 0.0023
Length Chn_.
S_ess Chng.
0.0023
(in)
Test#11d Length chng.
Len_chbefore testing 4.17064.1766 0.0060Length after torquing
Length after burnishing
Length after levet-2
4.1744 0.0038
4.1735 0.0029
Length Chng. 0.0029
StTess Chng. -13.05
(ft*Ib)
On-torque
Off-torque
125
85
nmorqChng. I 40 I
(ft*Ib)
On-torque 125
Off-torque 80
ITorq. Chng. I 45 I
(ft*lb)
On-torque 125
Off-torque 90
ITorq.Chng. I 35 I
(ft*lb)
On-torque
Off-torque
125
9O
[Torq. Chng. I 35 I

i ¸ ,
L
)i_i :
H
150
Test#11e
Length before testing
Length after torquing
Length after sine-sweep
Length after burnishing
Length after level-1
4.1540
4.1570
(in)
Length chng.
0.0030
4.1570 0.0030
4.1570 0.0030
4.1568 0.0028
Length Chng. 0.0028
Skess Chng. -2.9
(in)
Test#11f Length chng.
4.1521
4.1569 0.0048
Length before testing
Length after torquing
Length after burnishing
Length after level-1
4.1569
4.1569
0.0048
0.0048
Length Chng.
S_ess Chn 9.
0.0048
0
(in)
iLengthchng.Test#11g
Length before testing 4.1705
Length after torquing
Length after burnishing
Length after level-2
4.1737 0.0032
4.1737 0.0032
4.1729 0.0024
Length Chng. 0.0024
S_ess Chng. -11.6
Test#11h
Length before testing
Length after torquing
Length after burnishing
Length after level-2
4.1686
4.1713
(in)
Length chng.
0.0027
4,1710 0.0024
4.1709 0.0023
Length Chng.
S_ess Chng.
0.0023
-1.45
(mlb)On-torque 125
Off-torque 85
[Torq.Chng. J 40 l
(ft'lb)On-torque 125
Off-torque 90
ITorq.Chng. I 35 I
(ft*lb)On-torque 125
Off-torque 90
ITorq.Chng. I 35 I
(ft*lb)
On-torque
Off-torque
125
90
ITorq.Chng. I 35 I

151
Test#12a
Length before testing
Len_h after torquing
Len_h after sine-sweep
Length after burnishing
Length after level-1
3.4225
3.4259
3.4259
3.4259
3.4259
(in)
Length chng.
0.0034
0.0034
0.0034
0.0034
Length Chng.
S_ess Chng.
0.0034
0
(ff'lb)
iOn-torque 110
Off-torque 125
ITorq. Chng. I -15 I
(in)
Test#12b Length chng.
Length beforetesting 3.4375
3.4405 0.0030Length after torquing
Length after burnishing
Length after level-1
3.4405
3.4405
0.0030
0.0030
Length Chng.
S_ess Chng.
0.0030
0
(in)
Length chng.
0.0048
0.0048
Test#12c
Length beforetesting 3.42203.4268Length after torquing
Length after burnishing
Length after level-2
3.4268
3.4268 0.0048
Len_hChng.
S_ess Chng.
0.0048
0
(ft*lb)
On-torque 115
Off-torque 100
ITorq. Chng. I 15 I
(ft*lb)
On-torque 115
Off-torque 95
Imorq.Chng. I 20 I
Test#12d
Length before testing
Length after torquing
Length after burnishing
Length after level-2
(in)
Length chng.
3.4500
3.4463
3,4500 0.0037
3.4500 0.0037
0.0037
Length Chng. 0.0037
IStress Chng. 0
(ff*Ib)
On4orque
Off-torque
115
100
IT°rq" Chng • I 15 I

152
Test #12e
Length before testing
Len_h after torquing
Length after sine-sweep
Len_n after burnishing
iLength after level-1
3.4366
(in)
Leng_ chng.
3.4405 0.0039
3.4405 0.0039
3.4405 0.0039
3.4405 0.0039
Len_hChng. 0.0039
Stress Chng. 0
Test #12f
Length before testing
Length after torquing
Length after bumishing
Length after level-1
(in)
Lengthchng.
3.4297
3.4333 0.0036
3.4333 0.0036
3.4333 0.0036
Length Chng. 0.0036
0Stress Chng.
Test#12g
Length before testing
Length after torquing
Length after burnishing
;Length after level-2
3.4294
(in)
Length chng.
3.4325 0.0031
3.4323 0.0029
3.4323 0.0029
Len(_l:hChng.
Stress Chng.
0.0029
(ft*Ib)
On-torque 115
Off-torque 105
ITorq. Chng. I 10 I
(ft*lb)
On-torque 115
Off-torque 100
ITorq.Chng. I 15 I
(ft*Ib)
On-torque 115
100Off-torque
IT°rq.Chng• I 15 I
Test #12h
Length before testing 3.4326
(in)
Length chng.
Length after torquing 3.4359 0.0033
Length after burnishing 3.4359 0.0033
Length after level-2 3.4358 0.0032
Length Chng. 0.0032
Stress Chng. -2.9
(ft*Ib)
iOn-torque 115
Off-torque 100
IT°rq. Chng • I 15 I
H
_ii_i_ .
• _ _i_ _ •
APPENDIX D
STATIC ON-TORQUE VS. OFF-TORQUE DATA
153

,i_,_,: •
_ i.i_ ¸ ,
154
Test #1 bolt
Bolt 1
Rep. # On-Torque1 852 853 85
Avg. =
Off-Torque60556058
Bolt 2
On-Torque858585
Off-Torque6O657O65
Bolt 3
On-Torque858585
Off-Torque65656565
Test #2 bolt
Bolt 1
!Rep. # On-Torque1 952 953 95
I
Avg.=
Off-Torque70758O75
Bolt 2
On-Torque959595
Off-Torque75708075
Bolt 3
On-Torque959595
Off-Torque8O757577
Avg.
Off-Torque626265
Avg.Off-Torque
757378
Test #3 bolt
Bolt 1
Rep. # On-Torque1 1502 1503 150
I
AvcI.=
Test #4 bolt
Bolt 1
Rep. # On-Torque1 1002 1003 100
Avg.=
Test #5 bolt
Bolt 1
Rep. # On-Torque1 1502 1503 150
|
Avg. =
Off-Torque10095
105100
Bolt 2
On-Torque150150150
Off-Torque90959593
Bolt 3
On-Torque150150150
Off-Torque1009510098
Avg.
Off-Torque9795
100
Off-Torque8O758O78
Bolt 2
On-Torque100100100
Off-Torque8O808O8O
Bolt 3
On-Torque100100100
Off-Torque85909088
Avg.Off-Torque
828283
Off-Torque959510598
Bolt 2
On-Torque150150150
Off-Torque1009510098
Bolt 3
On-Torque150150150
Off-Torque11010095102
Avg.
Off-Torque10297100

i_ I _
155
Test #6 bolt
Bolt 1
Rep. # On-Torque1 1502 1503 150
Avg. =
Off-Torque130125105120
Bolt 2
On-Torque150150150
Off-Torque105110110108
Bolt 3
On-Torque150150150
Off-Torque110110115112
Avg.Off-Torque
115115110
Test #7 bolt
Bolt 1
Rep. # On-Torque1 1802 1803 180
Avg.= I
Off-Torque155155165158
Bolt 2
On-Torque180180180
Off-Torque145150150148
Bolt 3On-Torque
180180180
Off-Torque150150155152
Avg.Off-Torque
150152157
Test #8 bolt
Bolt 1
Rep. # On-Torque1 1802 1803 180
Avg.=
Off-Torque130145160145
Bolt 2
On-Torque180180180
Off-Torque130135145137
Bolt 3
On-Torque180180180
Off-Torque145160145150
Avg.Off-Torque
135147150
Test #9 bolt
Bolt 1
Rep. # On-Torque1 1352 1353 135
Avg .=
iOft-Torque10095105100
Bolt 2
On-Torque135135135
Off-Torque110105115110
Bolt 3
On-Torque135-135135
Off-Torque951009597
Avg.Off-Torque
102100105
Test #10 bolt
Bolt 1
Rep. # On-Torque1 1802 1803 180
Avg.=,
Off-Torque130130140133
Bolt 2
!On-Torque180180180
Off-Torque145140140142
Bolt 3On-Torque
180180180
;Off-Torque150145145147
Avg.I Oft-Torque
142138142

i, ¸ • !
156
Test #11 bolt
Rep. #123
Bolt 1
On-Torque125125125
Avg.=
Off-Torque100909595
Bolt 2
On-Torque125125125
Off-Torque100908592
Bolt 3
On-Torque125125125
Off-Torque85909088
Avg.Off-Torque
959090
Test #12 bolt
Bolt 1
Rep. # On-Torque1 1152 1153 115
Avg.= !
Off-Torque909510597
Bolt 2
On-Torque115115115
Off-Torque100959597
Bolt 3
On-Torque115115115
Off-Torque10095
10098
Avg.Off-Torque
9795100
Notes: 1. All torque values shown for Test #1 - #6 are in in*lb.2. All torque values shown for Test #7 - #12 are in ft*lb.

APPENDIX E
CONFIRMATION TEST DATA
157
I •

158
Confirmation Test #1
CTest#l a
Length before testing
Length after torquing
Length after burnishing
Length after level-1
(in)
Length chng.
3.4369
3.4381 0.0012
3.4380 0.0011
3.4388 0.0019
Length Chng. 0.0019
Stress Chn9. -40.6
(in)
CTes_lb ILeng_ chng.
3.4379
3.4415 0.0036Length before testing
Length after torquing
Length after burnishing
Lengt_ after level-1
3.4413 0.0034
3.4385 0.0006
Length Chng. 0.0006
Stress Chng. 142.1
(ft*lb)
On-torque 180
Off-torque 135
Torq. Chng. 45
;tatic Testing:
180 I 150Diff 30
Off-torque
Torq. Chng.
;tatic Testing:
I 180 Diff I
180
155
25
155
25
CTest#1 c
Length before testing 3.4235
Lengt_ after torquing 3.4323
Length after burnishing 3.4294
Length after level-1 3.4291
(in)
Lengt_chng.
0.0088
0.0059
0.0056
Length Chng. 0.0056
Stress Chng. 15.225
CTesfftl d
Length before testing
Length after torquing
Length after burnishing
Length after level-1
(in)
Length chn9.
3.4230
3.4274 0.0044
3.4274 0.0044
3.4230 0.0000
Len_thChng. 0.0000
S_ess Chng. 223.3
(ft'lb/
On-torque 180
Off-torque 135
Torq. Chng.
Static Testing:
l 180 DiffI
45
155
25
180Ift*lb/
On-torque
Off-torque
Torq. Chng.
Ratic Testing:
180 fitDi
135
45
140
4O

2
159
Confirmation Test #2
CTest#2a
Length before testing
Len_h after torquing
Length after burnishing
(in)
Length chng.
1.5108
1.5153 0.0045
1.5153 0.0045
Length after level-1 1.5135 0.0027
Length Chng. 0.0027
S_essChng. 52.2
CTest#2b
1.5134
1.5164Length before testing
Len_l_ after torquing
Length after bumishing
Length after level-1
(in)
Length chng.
0.0030
1.5164 0.0030
1.5158 0.0024
Len_h Chng.
Stress Chng.
0.0024
17.4
(in)
Length chng.
(in*lb)
On-torque 90
Off-torque 55
Torq. Chng. 35
Static Testing:
I 9o tDiff 20
(in*lb)
On-torque
Off-torque
Torq. Chng.
Static Testing:
[ .90 DiJffl
9O
70
20
7O
2O
CTest#2c
Length before testing 1.5158
Length after torquing 1.5208 0.0050
Length after burnishing 1.5208 0.0050
Length after level-1 1.5208 0.0050
Length Chng.
Stress Chng.
0.0050
0
(in*lb)
On-torque
Off-torque
Torq. Chng.
Static Testing:
I ,o Diffl
90
7O
2O
75
15
902
CTest#2d
Length before testing
Len_ after torquing
Length after burnishing
Length after level-1
1.5185
(in)
Length chng.
1.5216
1.5216 0.0031
1.5216 0.0031
0.0031
Length Chng. 0.0031
Stress Chng. 0
(in*lb)
On-torque
Off-torque
Torq. Chng.
Static Testing:
I 90 Diffl
7O
20
75
15

APPENDIX F
ADDITIONAL TEST DATA
160

161
i •
:! ....
!
Additional Test #1
ATest #1a
Load after torquing
Load after level-2
(psi)
11,300
12,200
Stress chng.
900
ATest #1 b
ILoad after torquing
Load after level-2
(psi)
11,300
Stress chng.
-11,300
(in*lb)
On-torque 30
Off-torque 15
ITorq. Chng. I 15 t
(in*lb)
On-torque 30
Off-torque 0
ITorq. Chng. I 30 I
Add_onalTest#2
: 'ii
ATest #2a
Load after torquing
Load after level-2
(psi) Stress chng.
22,200
25,900 3,700
(in*lb)
On-torque 75
Off-torque 30
ITorq. Chng. I 45 I
! •
,_...
5•
ATest #2b
Load after torquing]
Load after level-2
(psi) Stress chng.
26,700
0 -26,700
(in*lb)
iOn-torque 60
Off-torque 0
ITorq. Chng. I 60 I

162
,:" ,! "%
Additional Test #3
ATest #3a (psi)
Load after torquing 12,000
Load after level-2
Stress chn 9.
0 -12,000
(in*lb)
On-torque 30
Off-torque 0
IT orq. Chng. I 30 I
ATest #3b
Load after torquing
Load after level-2
(psi)
12,400
Stress chng.
-12,400
(in*lb)
On-torque 30
Off-torque 0
ITorq. Chng. I 30 I
: " i¢
Additional Test #4
ATest #4a (psi)
Load after torquing 25,300
Stress chn_.
Load afterlevel-2 22,100 -3,200
ATest #4b (psi)
Load after torquin_ 22,500
Load afterlevel-2 0
Stress chng.
-22,500
(in*lb)
On-torque 50
Off-torque 35
Imorq.Chng. I 15 I
(in*lb)
On-torque 70
Off-torque 0
[Torq. Chng. I 70 ]

:iiii::_ /:
/
7'
163
Additional Test #5
ATest #5a
Load after torquing]Load after level-2
(psi) Stress chn9.
11,300
10,000 -1,300
ATest #5b
Load after torquing
Load after level-2
(psi)
12,200
0
Stress chng.
-12,200
(ft*Ib)
On-torque 35
Off-torque 30
[T orq. Chng. ] 5 I
(ft*Ib)
On-torque 8
Off-torque 0
[T orq. Chng. [ 8 [
Additional Test #6
ATest #6a
iLoad after torquing
[Load after level-2
(psi) Stress chng.
24,500
16,700 -7,800
(ft*Ib)
On-torque 100
Off-torque 60
]Torq. Chng. [ 40 I
ATest #6b
Load after torquin_l
Load after level-2
(psi) Stress chng.
25,400
17,800 -7,600
(ft*tb/On-torque 70
Off-torque 50
ITorq. Chng. ] 20 I

AdditionalTest #7
ATest #7a
_oad after torquing
Load after level-2 14,000
Ipsi) Stress chng.
12,300
164
1,700
(ft*lb)On-torque 40
Off-torque 30
[Torq. Chng. ] 10 ]
L
ATest #Tb
Load after torquing
Load after level-2
(psi) Stress chng.
11,700
13,000 1,300
(ft*lb)
On-torque 50
Off-torque 45
Torq. Chng. [ 5
Addi_onalTest#8
ATest #8a
Load aftertorquin9
Load afterlevel-2
(psi) Stress chng. (ft*lb)
On-torque ***
Off-torque ***
ITorqC.ngI "'" I
ATest #8b
Load after torquing
Load after level-2 30,000
(psi) Stress chng.
24,500
5,500
(ft*lb)
On-torque 75
Off-torque 75
[T orq. Chng. [ 0 ]

_ _ i_ i_¸I¸ ii. • _