experimental and calculated study of …m2d/proceedings_m2d2017/data/papers/697… · shearing...
TRANSCRIPT
Proceedings of the 7th International Conference on Mechanics and Materials in Design,
Albufeira/Portugal 11-15 June 2017. Editors J.F. Silva Gomes and S.A. Meguid.
Publ. INEGI/FEUP (2017)
-1535-
PAPER REF: 6974
EXPERIMENTAL AND CALCULATED STUDY OF DYNAMIC
CHARACTERISTICS OF WATER-SATURATED SAND
Anatoly Bragov(*)
, Vladimir Balandin, Vasily Kotov
Research Institute of Mechanical, Lobachevsky State University, Nizhny Novgorod, Russia (*)
Email: [email protected]
ABSTRACT
The study of physical and mechanical properties of soils under dynamic loading is carried out
for a long time. This paper presents the results of reversed ballistic experiments with targets
of dry and water saturated sand and the results of calculations. The flat end of measuring rod
was used as a projectile. From the calculations, it follows that there is almost complete water
saturation of compacted sand its shear properties are reduced, however, they are essential and
need to be considered when assessing the penetration resistance of solids into the water
saturated sand.
Keywords: dry and water saturated sand, reversed ballistic experiment, shear properties,
penetration resistance
INTRODUCTION
Physical-mechanical characteristics of sandy soils under dynamic loading have been studied
long enough (Omidvar, 2012). The developed plane-wave experiment methodologies make it
possible to determine the shock adiabat of dry and wet sand in the loading range of up to
several GPa (Dianov,1977; Bragov,1993; Arlery, 2010), whereas shear properties are
determined experimentally, using the modified Kolsky methodology, for substantially lower
pressures (Bragov,1996; Bragov,2004; Martin, 2009; Balandin, 2015a).
It is known that compaction of sand results in the changes of its strength properties, leading,
for example, to substantially changing penetration depths of strikers. The inverse experiment
methodology (Balandin, 2015a; Bragov,2006) makes it possible to determine both shock
adiabats of dry sand with increased density, based on maximum values of the resistance force
and quasi-stationary resistance forces (Balandin, 2016). It was shown earlier that shearing
characteristics of soils correlate with the values of the resistance force at the quasi-stationary
stage of penetration (Kotov, 2013; Bazhenov,2008; Bazhenov,2009).
The present paper presents the data of the laboratory studies of dynamic compressibility and
shearing resistance of a sandy soil based on the experimental-computational analysis of the
resistance force values at the quasi-stationary stage of the penetration of a cylindrical
measuring rod striker with a flat end in the framework of the inverse experiment
methodology. It is shown that shearing properties of a practically fully water-saturated sand
degrade bur remain substantial enough to be taken into account. The obtained results will be
useful in analyzing applied problems of penetration of solids into soil media.
Symposium-10: Dynamic Failure and Crashworthiness
-1536-
CHARACTERISTIC FEATURES OF DYNAMICALLY TESTING WATER-
SATURATED SOILS IN THE INVERSE EXPERIMENT
Methodology of the Inverse Experiment
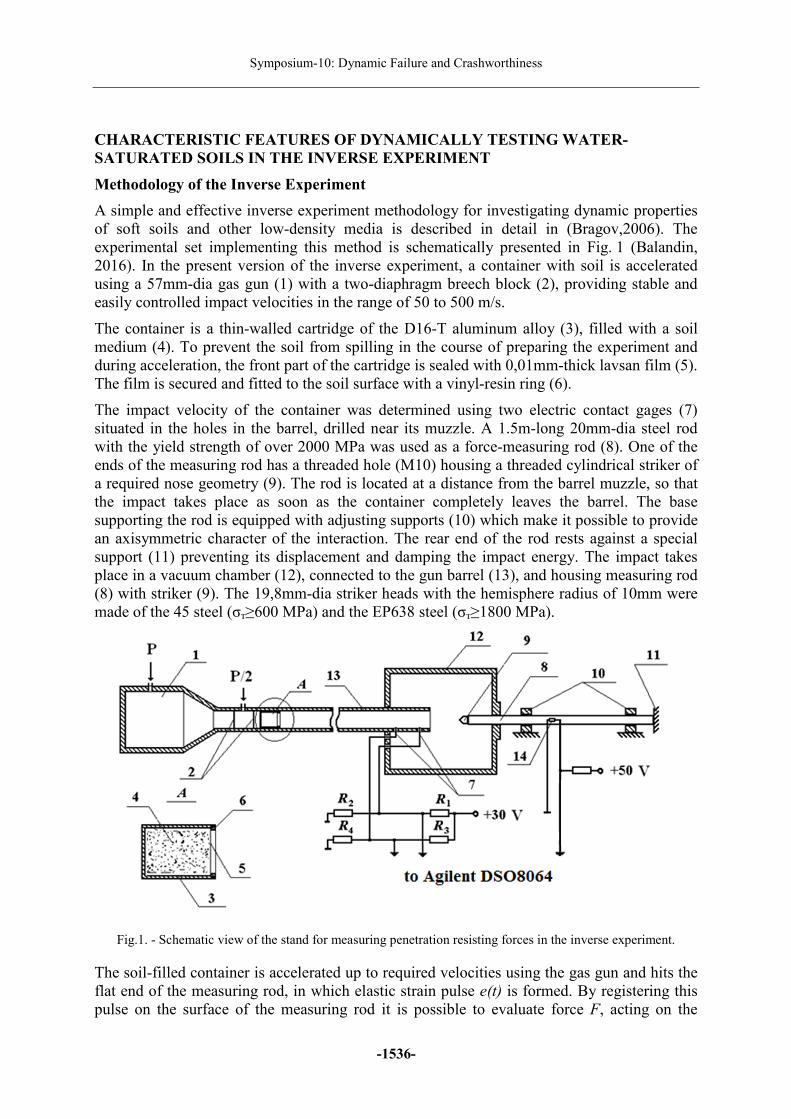
A simple and effective inverse experiment methodology for investigating dynamic properties
of soft soils and other low-density media is described in detail in (Bragov,2006). The
experimental set implementing this method is schematically presented in Fig. 1 (Balandin,
2016). In the present version of the inverse experiment, a container with soil is accelerated
using a 57mm-dia gas gun (1) with a two-diaphragm breech block (2), providing stable and
easily controlled impact velocities in the range of 50 to 500 m/s.
The container is a thin-walled cartridge of the D16-Т aluminum alloy (3), filled with a soil
medium (4). To prevent the soil from spilling in the course of preparing the experiment and
during acceleration, the front part of the cartridge is sealed with 0,01mm-thick lavsan film (5).
The film is secured and fitted to the soil surface with a vinyl-resin ring (6).
The impact velocity of the container was determined using two electric contact gages (7)
situated in the holes in the barrel, drilled near its muzzle. A 1.5m-long 20mm-dia steel rod
with the yield strength of over 2000 MPa was used as a force-measuring rod (8). One of the
ends of the measuring rod has a threaded hole (М10) housing a threaded cylindrical striker of
a required nose geometry (9). The rod is located at a distance from the barrel muzzle, so that
the impact takes place as soon as the container completely leaves the barrel. The base
supporting the rod is equipped with adjusting supports (10) which make it possible to provide
an axisymmetric character of the interaction. The rear end of the rod rests against a special
support (11) preventing its displacement and damping the impact energy. The impact takes
place in a vacuum chamber (12), connected to the gun barrel (13), and housing measuring rod
(8) with striker (9). The 19,8mm-dia striker heads with the hemisphere radius of 10mm were
made of the 45 steel (σт≥600 МPa) and the EP638 steel (σт≥1800 МPa).
Fig.1. - Schematic view of the stand for measuring penetration resisting forces in the inverse experiment.
The soil-filled container is accelerated up to required velocities using the gas gun and hits the
flat end of the measuring rod, in which elastic strain pulse е(t) is formed. By registering this
pulse on the surface of the measuring rod it is possible to evaluate force F, acting on the

Proceedings of the 7th International Conference on Mechanics and Materials in Design
-1537-
striker interacting with the medium, using a known relation F(t)= Ее(t)S0, where Е is elastic
modulus of the rod, S0 is cross-section area. Using Hugoniot relations along the rod-soil
interface, shock wave velocity D is found as a function of mass velocityu :
( ) ( )00uSFuD ρ= , ( )000 ScFVu ρ−= , (1)
where 0c is propagation velocity of the longitudinal wave along the rod, andρ is material
density of the rod.
Dynamic compressibility of a soil, as well as of a number of other compressible materials, is
characterized by a shock adiabat, which can be represented in the form of a linear relation:
buAD += (2)
Constant A is close to the propagation velocity of a plane compression wave along the soil at
low pressures, and b characterizes limiting compressibility of the soil.
It is known that the plane wave propagation velocity in a soil increases with the level of
water-saturation, and so does the unloading wave velocity. This results in a smaller duration
of the compression pulse in the measuring rod as compared with a wet soil (Kotov,2016). So,
in the case of water-saturated soils, determining the force acting on the striker, using strain
pulse values on the surface of the measuring rod, becomes problematic due to the distortion of
the pulse form because of the dispersion in the process of its propagation along the measuring
rod, which was noted earlier by H. Kolsky, R. Davis and other authors (Gorham, 1983;
Follansbee, 1983; Tyas, 2014).
Experimental Conditions
The experiments were conducted with a sandy mixture of a natural composition, from which
particles of bigger that 1mm and smaller than 0.1mm were removed. The launched containers
were filled with dry sand, which was then slightly compacted. The containers were weighted
to determine the density of the dry sand and then were filled with a certain amount of water
up to the full saturation. Then the containers were weighted again to determine the density of
the water-saturated sand and its humidity relative to its initial density. Average density of the
initial dry sand and of the water-saturated natural mixture were 1750 3/ mkG and 2090 3/ mkG , respectively. The sand consists mainly of quarts particles with the of 2650 3/ mkG ,
thus, porosity of the sand is 0.34. When these cavities are completely filled with water,
density of the wet sand must increase by 340 3/ mkG , and the density of the water-saturated
sand must be equal to 2090 3/ mkG , which was practically the case in the preparation of the
experiments.
The 0.0205 m -dia steel measuring rod was 1.5 m -long; the density of the rod material was
ρ = 8050 3/ mkG , Young modulus was E =186 GPa , yield strength was 2 GPa , wave
propagation velocity along the rod was ρEc =0 = 4807 sm / .
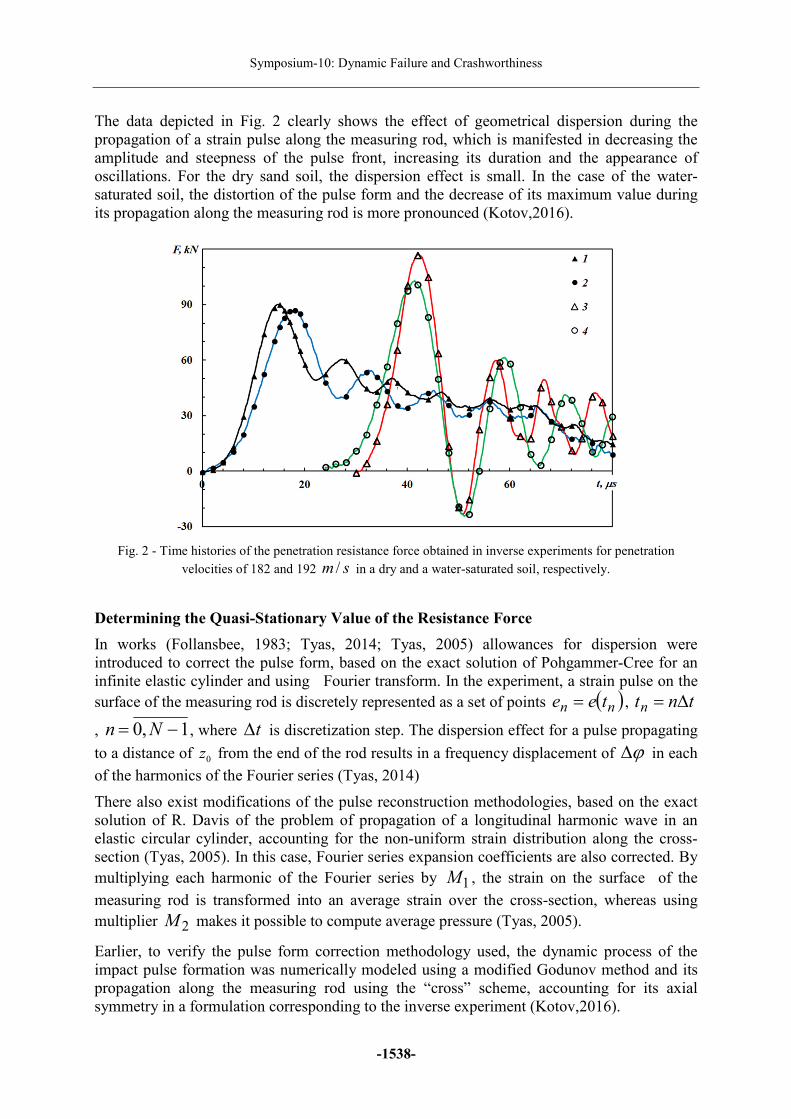
Fig.2 shows time histories of resistance to penetration of a flat-nosed striker into a dry (curves
1, 2) and a water-saturated (curves 3, 4) sandy soil at impact velocities of 182 and 192 sm / ,
respectively, as observed in inverse experiments. The experimental data correspond to the
readings of the strain gages cemented to the surface of the measuring rod at a distance of 0.46
m and 0.96 m from the impacted end. The time histories are displaced along the time axis to
be clearly discerned.
Symposium-10: Dynamic Failure and Crashworthiness
-1538-
The data depicted in Fig. 2 clearly shows the effect of geometrical dispersion during the
propagation of a strain pulse along the measuring rod, which is manifested in decreasing the
amplitude and steepness of the pulse front, increasing its duration and the appearance of
oscillations. For the dry sand soil, the dispersion effect is small. In the case of the water-
saturated soil, the distortion of the pulse form and the decrease of its maximum value during
its propagation along the measuring rod is more pronounced (Kotov,2016).
Fig. 2 - Time histories of the penetration resistance force obtained in inverse experiments for penetration
velocities of 182 and 192 sm / in a dry and a water-saturated soil, respectively.
Determining the Quasi-Stationary Value of the Resistance Force
In works (Follansbee, 1983; Tyas, 2014; Tyas, 2005) allowances for dispersion were
introduced to correct the pulse form, based on the exact solution of Pohgammer-Cree for an
infinite elastic cylinder and using Fourier transform. In the experiment, a strain pulse on the
surface of the measuring rod is discretely represented as a set of points ( )nn tee = , tntn ∆=
, 1,0 −= Nn , where t∆ is discretization step. The dispersion effect for a pulse propagating
to a distance of 0z from the end of the rod results in a frequency displacement of ϕ∆ in each
of the harmonics of the Fourier series (Tyas, 2014)
There also exist modifications of the pulse reconstruction methodologies, based on the exact
solution of R. Davis of the problem of propagation of a longitudinal harmonic wave in an
elastic circular cylinder, accounting for the non-uniform strain distribution along the cross-
section (Tyas, 2005). In this case, Fourier series expansion coefficients are also corrected. By
multiplying each harmonic of the Fourier series by 1M , the strain on the surface of the
measuring rod is transformed into an average strain over the cross-section, whereas using
multiplier 2M makes it possible to compute average pressure (Tyas, 2005).
Earlier, to verify the pulse form correction methodology used, the dynamic process of the
impact pulse formation was numerically modeled using a modified Godunov method and its
propagation along the measuring rod using the “cross” scheme, accounting for its axial
symmetry in a formulation corresponding to the inverse experiment (Kotov,2016).

Proceedings of the 7th International Conference on Mechanics and Materials in Design
-1539-
Consider one of the results of an inverse experiment, in which a container with water-
saturated soil impacts the flat end of the measuring rod at a velocity of 0V =320 sm / . The
pressures on the contact surfaces of the rod and the soil at the moment of impact are equal,
which, taking into consideration (1), (2), makes it possible to obtain an equation for
determining mass velocity u , corresponding to impact velocity 0V : ( ) ( )ubuAuVc +=− 00 ρρ ,
where c is distribution velocity of a longitudinal wave in a half-space ( c = 5600 sm / );
thus, the values of velocity u =283 sm / and maximum stress 1.4 GPa are found. The
corresponding maximum value of the force acting upon the front end of the rod is 450 kN .
Fig. 3 - Force pulses corresponding to the strain on the surface of the measuring rod, as obtained in an inverse
experiment (curves 1 and 2) and computationally (curve 3).
Fig. 3 depicts resistance forces to penetration of a striker into a water-saturated soil at a
velocity of 320 sm / . Curve 1 corresponds to force ( ) 0StEeF = , where strain pulse ( )te is
registered on the surface of the measuring bar at a distance of 0.96 m from its end; curve 2
represents experimental data with the account of dispersion and of the non-uniform strain
distribution over the cross-section of the rod according to formulas (2); curve 3 shows the
results of computations. For a more vivid presentation, the pulses are displaced along the time
axis to the origin of the coordinates.
Proximity of the numerical and experimental results at the quasi-stationary stage of
penetration and substantial difference in the maximum values are noted.
Fig. 4 presents the amplitude-frequency characteristic of strain pulse ( ( )πω 2=f )
propagating along the rod. Curves 1 and 2 correspond to the experimental and computational
results for a pulse at a distance of 0.96 m from the bar end, curve 3 represents the specter of
the computed pulse at the bar end (curve 3 in Fig. 3). It is to be noted that for the frequency of
over kf =140 kHz the amplitude of the pulse propagating along the rod drops to zero,
whereas the initial pulse amplitude at the bar end is non-zero.

Symposium-10: Dynamic Failure and Crashworthiness
-1540-
Fig. 4 - Amplitude-frequency characteristics of the pulses in the measuring rod
The above frequency, as was earlier noted in (Kotov,2016; Gorham, 1983; Follansbee, 1983;
Tyas, 2014; Tyas, 2005; Balandin Vl.Vl, 2016), is critical for a rod of the given radius. Thus,
the employed pulse form correction procedure does not make it possible to determine the
maximum of such a short pulse, however, the resistance force value at the quasi-stationary
stage of penetration, settling after an abrupt drop, is determined fairly accurately.
NUMERICALLY MODELING PROCESSES OF IMPACT AND PENETRATION
INTO WATER-SATURATED SOIL
Approximation of the Shock Adiabat of the Soil
The representation of the shock adiabat (2) in the form of linear relation ( )uD using Hugoniot
relations Du0ρσ = , Du=θ can be transformed into ( ) ( )22
0 1 θθρθσ bA −= , ρρθ 01−= ,
where ( )θσ is stress as a function of volumetric strain, 0ρ and ρ are initial and current soil
density.
To conduct strength analyses of a soil mixture in a wide parameter range, the following
equation of state of a model of a multi-component medium can be used as a fairly accurate
approximation of the shock adiabat:
∑=
−
+=
3
1
1
0 1i
n
i
i
i
B
σα
ρρ
, i
iii
n
cB
2
00ρ= , 3,2,1=i (3)
where 321 ,, ααα are volume concentrations of free porosity (pinched air and/or other gases),
liquid (water) and quartz; 0iρ and
0ic , 3,2,1=i are densities and propagation velocities of the
longitudinal waves in the corresponding components, ,ρ σ are density and mixture pressure,
0ρ are initial values, 3032021010 ραραραρ ++=
, 1321 =++ ααα
the known values of the constants from equation (3), pertaining to the shock adiabat
parameters of water and quartz, are listed in the following table:

Proceedings of the 7th International Conference on Mechanics and Materials in Design
-1541-
Table 1 - Shock adiabat parameters of water and quartz
i 0iρ , 3/ mkG iB , MPa in 0ic , sm /
2 1000 304.5 7.15 1475
3 2650 9118.7 4 3710
Values 10ρ, 1B , 1n , corresponding to the compressibility of initial free porosity, are not
related with the compressibility of the gas component and are experimentally determined for
each soil in particular.
Earlier, results were obtained (Balandin, 2015a) in plane-wave experiments with sand
specimens with the particle sizes of 0.2-0.315 mm in the velocity range of 100 - 500 sm / ,
where shear properties of sandy soil are considerable. The density of dry sand was 1600± 50
3/ mkG , the density of water-saturated sand was 1900 ± 503/ mkG .
The parameters of state equation (3) for the dry and wet soils were as follows: the value of
free space density was taken to be equal to the density of air 10ρ=1.300 3/ mkG , whereas
parameters 1B and 1n were chosen using the least square method as those which provide the
best agreement with the experimental results for the dry soil. Humidity of the soil was
determined using the following formula: %100303
3030 ⋅−
=ραραρ
w .
In (Balandin, 2016), maximum resistance force as a function of impact velocity ( )0VF were
obtained for the interaction of a sandy soil of average density 0ρ =1725 3/ mkG and
w=0.1%, with a cylindrical rod with a flat front end; in the same work, shock adiabat
constants (1) A=455 sm / , b=2.25 were determined (Balandin, 2016).
For the parameter values of a three-component mixture of 1α =0.3486, 2α =0.001, 3α =
0.6504, initial density 0ρ =1725 3/ mkG and soil humidity w=0.1%, the value of the constants
of equation (3), corresponding to the porous component, were determined as: 1B =103 MPa
and 1n =1.4. For a soil with humidity w=18% and initial density 0ρ =2035 3/ mkG , the values
of the parameters of equation (3) were found as: 1α =0.0396, 2α =0.31, 3α = 0.6504.
Shock adiabat constants (1) were obtained based on three-component equation (3) for mass
velocity u changing in the range of 50 to 350 sm / and for soils of various humidity values,
as summarized in the following table 2:
Table 2 - Shock adiabat constants ( )uD of the water-containing soil
№ w, % 0ρ ,
3/ mkG A , sm / b
1 0.1 1725 455 2.25
2 10 1895 645 3.2
3 18 2035 1290 3.6
4 20 2075 1700 3.5

Symposium-10: Dynamic Failure and Crashworthiness
-1542-
Numerical modeling methodology
The computations were done using the “Dinamika-2” software complex (Abuzyarov, 2000;
Bazhenov, 2002), implementing Grigoryan’s mathematical model of the dynamics of
elastoplastic soil media. The main relations of the model are written in a cylindrical
coordinate system as a set of differential equations expressing laws of conservation of mass,
pulse, and maximal density reached in the process of actively loading the soil, as well as
equations of plastic flow with Mizes plasticity condition
ruuudtd rzzrr /)()(/ ,, ρρρ −=++ ,
rdtdu rrzrzrrrr /)(/ ,, θθσσσσρ −=−− ,
rdtdu rzzzzrrzz /)(/ ,, σσσρ =−− ,
)/()(// ** dtdHdtHddtd ρρρρρ −= ,
),,(,2 zrjiGessD ijijijJ ==+ λ ,
2
32
Tij
ijss σ≤ ,
where t is time, ρ and *ρ are initial, current and maximal density reached in the loading
process, iu , ijσ , ijs , ije are components of the velocity vector, of Cauchy stress tensor and
of deviators of stress tensors and strain rates, p is pressure, H is Heaviside function, JD is
Yauman derivative, d /dt is complete time derivative, G is shear modulus, σT is yield
strength, with the summation over the repeated indices. Parameter λ = 0 for elastic
deformation, but λ > 0, if the plasticity condition is realized.
The system is closed with finite relations (Bazhenov, 2003), determining dynamic
compressibility p =f1(ρ,ρ*)H(ρ* -ρ)H(ρ0-ρ) and shear resistance of the soil medium σT =
f2(p), where ρ0 is initial density.
The striker is assumed non-deformable, moving as a rigid body normally to the free surface of
the soil at a constant velocity (the formulation is close to that implemented in the inverse
experiment). The value of resistance force to the penetration of the striker F at each time step
of the analysis is calculated by integrating the stresses at the wetted surface of the striker. F=
[ ]∫∫ +S
n dSτn τσσ , where nσ and τσ are normal and tangential stresses, n and ττττ are unit
vectors of the internal normal and a tangent in the body surface element.
Changing of the contact surface in time is accounted for using the contact algorithm of
“impenetrability” along the normal with “the sliding along the tangent with dry friction”
ssss qquu ′′−=′′′=′ ,&& , ( )
.,
,
>⋅
≤=′=
ξξ
ξ
qkqqsignqk
qkqqqq
ss
ss
ss
where αu& , αq are components of the vectors of displacement velocity and of contact
pressure in a local coordinate basis (α = ξ,s ), s is direction of the tangent, ξ are normals; k
is sliding friction coefficient; signs ′ and ′′ indicate the corresponding values on the opposite

Proceedings of the 7th International Conference on Mechanics and Materials in Design
-1543-
sides of the contact. The equation set of the dynamics of the soil medium is completed with
initial and boundary conditions.
RESULTS
Resistance to shear can be described by a fractionally rational dependence of the yielding of
the soil on pressure ( ) ( ) ( )Ykpkppfp +≡= 12σ , where k is internal friction coefficient, Y
is maximal yield strength; the cohesion value can be neglected for this kind of soil. The
relation between pressure and volumetric strain (density), required for the analysis is assumed
in the form of ( ) ( ) ( )22
01 1 θθρθθ bafp −≡= , where 3/21 kAa += (Balandin, 2015a).
To determine parameters of the dependence of yield strength on the pressure of a water-
saturated soil, an experimental-computational method (12). Based on the results of a series of
computations, the following parameter values of the state equation of water-saturated sand
were obtained: A =1300 sm / , b =3.6, k =0.5, Y =50 MPa . For dry sand, the following
values were earlier obtained: A =455 sm / , b =2.25, k =1.2 and Y =300 MPa ( Balandin,
2016).
In what follows, the results of numerically analyzing the penetration of a flat-nosed
cylindrical striker into a water-saturated sandy soil in an elastoplastic formulation are given.
Surface friction was not accounted for in the numerical computations, as there is practically
no displacement of soil particles along the flat end of the striker-rod, whereas the flow of the
soil over the cylindrical part adjacent to the end of the striker is of a cavitation character.
The above results are compared with the computational results in a hydrodynamic
formulation, where a soil is described using a model of a nonlinear compressible liquid with
the same shock adiabat but in the complete absence of shear resistance ( k = Y = 0, а = A ).
Fig. 5 shows the values of resistance force at a quasi-stationary penetration stage as a function
of mass velocityu . The dark and the light boxes represent the data of the inverse
experiments; the solid and dotted lines correspond to the results of numerical analysis of the
penetration of the striker into dry and water-saturated sands (lines 1 and 3 in Table 2).
The penetration of a striker with a hemispherical nose into a water-saturated sandy soil at a
constant velocity was also numerically analyzed. Grigoryan’s model of soil media was used in
the computations, with the parameters determined from inverse experiments with a flat end.
The computations were done using Coulomb friction model with a friction coefficient of 0.2.
Fig. 6 presents time histories of the force of resistance to penetration of a striker at a velocity
of 0V =282 sm / . The light boxes correspond to the results of the inverse experiment, the
dotted and the dashed lines depict the computational results, accounting for the shear
properties and in a hydrodynamic formulation, respectively.
Also compared were experimental and numerically computed maximum values of the force of
resistance to penetration of a striker with a hemispherical nose into water-saturated sand as a
function of impact velocity. In Fig. 6 the dots represent the experimental data (Balandin,
2015b), whereas the dashed and dotted lines correspond to the results of numerical
computations, accounting for the shear properties of the soil and in a hydrodynamic
formulation (similar to the designations in Figs.5, 6).

Symposium-10: Dynamic Failure and Crashworthiness
-1544-
Fig. 5 - Values of the penetration resistance force at a quasi-stationary stage of the penetration of a flat-nosed
striker into the water-saturated sandy soil (experimental and computational)
Fig. 6 - The dependence of the resistance force to penetration of a striker with a hemispherical nose into the
water-saturated sandy soil at a velocity of 282 sm / (experimental and computational)
Fig. 7 - Maximum force of resistance to penetration of a hemisphere into water-saturated sand as a function of
the impact velocity (the dots represent the experiment, the lines show the computed values)
Proceedings of the 7th International Conference on Mechanics and Materials in Design
-1545-
CONCLUSION
It is evident in Figs. 4-6 that both maximum and quasi-stationary values of the forces of
resistance to penetration of strikers with a flat and a hemispherical front end into a soil,
obtained experimentally, are close to the computed values with the account of the shear
properties in the framework of the model of a compressible elastoplastic medium. The
computational results in the hydrodynamic formulation considerably differ from the
experimental ones. It was shown earlier (13) that the maximal and the quasi-stationary value
of the force resistance to penetration of a hemispherical striker are mainly determined by the
values of the internal and surface friction coefficients, whereas the effect of the shock adiabat
on the force characteristics of the penetration process is considerably less pronounced.
Thus, when compacted sand is almost fully water-saturated, its shear properties degrade, but
remain considerable enough to be taken into account. The obtained results will be useful in
analyzing loads acting on the front parts of solid deformable bodies penetrating into water-
containing soils.
ACKNOWLEDGMENTS
The work was done with financial support from RFFI (Grants №№16-08-00825, 15-08-7977,
16-01-0524).
REFERENCES
Abuzyarov M.Kh, Bazhenov V.G., Kotov V.L., Kochetkov A.V., Krylov S.V., Fel'Dgun V.R.
A Godunov-type method in dynamics of elastoplastic media. Computational Mathematics and
Mathematical Physics, 2000, 40(6), p. 900-913.
Arlery M., Gardou M., Fleureau J.M., Mariotti C. Dynamic behaviour of dry and water-
saturated sand under planar shock conditions. International Journal of Impact Engineering,
2010, 37, p. 1-10,
Balandin V.V., Balandin Vl.Vl., Bragov A.M., Krylov S.V., Tsvetkova E.V. Experimental
and theoretical study of penetration of spherical solids into wet sand. Journal of Applied
Mechanics and Technical Physics, 2015, 56(6), p. 972-976.
Balandin V.V., Bragov A.M., Igumnov L.A., Konstantinov A.Yu., Kotov V.L., Lomunov
A.K.: Dynamic Deformation of Soft Soil Media: Experimental Studies and Mathematical
Modeling. Mechanics of Solids, 2015,50(3), p. 286-293.
Balandin Vl.V., Balandin Vl.Vl., Bragov A.M., Kotov V.L.: Experimental Study of the
Dynamics of Penetration of a Solid Body into a Soil Medium. Technical Physics, 2016, 61(6),
p. 860-868.
Balandin Vl.Vl., Kotov V.L. Studying the propagation of a stress pulse in an elastic
cylindrical bar, Problems of Strength and Plasticity, 2016, 78 (4), p. 388-395, (in Russian)
Bazhenov V.G., Bragov A.M., Kotov V.L., Kochetkov A.V. An Investigation of the Impact
and Penetration of Solids of Revolution into Soft Earth. J. Appl. Math. Mech., 2003, 67(4), p.
611-620.
Bazhenov V.G., Bragov A.M., Kotov V.L.: Experimental-Theoretical Study of the
Penetration of Rigid Projectiles and Identification of Soil Properties. J. Appl. Mech. Tech.
Phys., 2009, 50(6), p. 1011-1019.
Symposium-10: Dynamic Failure and Crashworthiness
-1546-
Bazhenov V.G., Kotov V. L. Method for Identifying Elastoplastic Properties of Ground
Media by Penetration of Impactors. Mech. Solids., 2008, 43(4), p. 678-686.
Bazhenov V.G., Kotov V.L. Modification of Godunov’s numerical scheme for solving
problems of pulsed loading of soft soils. Journal of Applied Mechanics and Technical
Physics, 2002, 43(4), p. 603-611.
Bragov A.M., Balandin V. V., Lomunov AK., Filippov A.R.: Determining the Impact
Compressibility of Soft Soils from Reversed Test Results. Tech. Phys. Lett., 2006, 32(6), p.
487-488.
Bragov A.M., Grushevskii G.M. Influence of the Moisture Content and Granulometric
Composition on the Shock Compressibility of Sand. Tech. Phys. Lett., 1993, 19, p. 385-386.
Bragov A.M., Grushevsky G.M., Lomunov A.K. Use of the Kolsky Method for Confined
Tests of Soft Soils. Exper. Mech., 1996, 36(3), p. 237-242.
Bragov A.M., Kotov V.L., Lomunov A.K., Sergeichev I.V. Measurement of the dynamic
characteristics of soft soils using the kolsky method. Journal of Applied Mechanics and
Technical Physics, 2004, 45(4), p. 580-585.
Dianov M. D., Zlatin N. A., Mochalov S. M., et al. Shock Compressibility of Dry and Water-
Saturated Sand. Sov. Tech. Phys. Lett., 1977, 2, p. 207-208.
Follansbee P.S., Frantz C. Wave propagation in the split Hopkinson pressure bar. Journal of
Engineering Materials and Technology, 1983, 105(1), p. 61-66.
Gorham D. A numerical method for the correction of dispersion in pressure bar signals.
Journal of Physics E: Scientific Instruments, 1983, 16, p. 477-479.
Kotov V.L., Balandin Vl.V., Balandin Vl.Vl.: Investigation of applicability of reversed
experiment techniques to determine the dynamic characteristics of saturated soils. PNRPU
Mechanics Bulletin, 2016, (3), p. 97-107
Kotov V.L., Balandin Vl.V., Bragov A.M., Balandin Vl.Vl. Quasi-steady motion of a solid in
a loose soil with developed cavitation. Doklady physics, 2013, 58(7), p. 309-313.Martin B. E.,
Chen W., Song B., Akers S.A. Moisture effects on the high strain-rate behavior of sand.
Mechanics of Materials, 2009, 41, p. 786-798.
Omidvar M., Iskander M., Bless S.: Stress-Strain Behavior of Sand at High Strain Rates. Int.
J. Impact Engng., 2012, 49, p. 192-213.
Tyas A, Ozdemir Z.: On backward dispersion correction of Hopkinson pressure bar signals.
Philosophical Transactions of the Royal Society A: Mathematical, Physical and Engineering
Sciences, 2014, 37(2), p. 1-11.
Tyas A, Pope D.J. Full correction of first-mode Pochammer-Chree dispersion effects in
experimental pressure bar signals. Measurement Science & Technology, 2005,16(3), p. 642-
652.