experimental and numerical investigations into · pdf fileexperimental and numerical...
TRANSCRIPT
UNCLASSIFIED
Experimental and Numerical Investigations into Polymeric Coatings for Blast Protection
K. Ackland and N. St John
Maritime Platforms Division Defence Science and Technology Organisation
DSTO-TR-2591
ABSTRACT
Experimental and numerical investigations were conducted to assess the effectiveness of polymeric coatings to enhance the blast protection of steel structures. During the experiments test plates were allowed to deform under close-in blast loading and the final deformations of coated and uncoated plates were compared. The coatings were found to reduce the deformation of the plates when applied to the surface facing away from the blast and generally a good agreement was achieved between the numerical and experimental results.
RELEASE LIMITATION
Approved for public release
UNCLASSIFIED
UNCLASSIFIED
Published by Maritime Platforms Division DSTO Defence Science and Technology Organisation 506 Lorimer St Fishermans Bend, Victoria 3207 Australia Telephone: (03) 9626 7000 Fax: (03) 9626 7999 © Commonwealth of Australia 2011 AR-015-076 September 2011 APPROVED FOR PUBLIC RELEASE
UNCLASSIFIED
UNCLASSIFIED
UNCLASSIFIED
Experimental and Numerical Investigations into Polymeric Coatings for Blast Protection
Executive Summary Various government and commercial organisations around the world are investigating the application of polymeric coatings to enhance the blast protection of vehicles and structures. These materials show potential to enhance blast protection while being cost effective and time efficient to apply. Many of these products may be relatively easily applied to existing vehicles and structures making them well suited to battlefield protection upgrades. An initial series of experimental tests was performed to investigate the effect of applying polyurea coatings made by Defence Science and Technology Organisation (DSTO) to the back face of D36 and X80 steel plates under blast loading. It was found that the plates coated with polyurea deformed less than uncoated plates when subjected to the same blast loading. Furthermore, thicker coatings resulted in less deformation compared to thinner coatings. A second series of experimental tests was conducted to assess three commercially available products that are currently on the market in Australia. Two of the coatings were polyurea/polyurethane blends and the third was a polyurea. All three coatings have previously been successfully tested for blast mitigation of concrete block structures. The coatings were applied to 4 mm mild steel plates, and an uncoated 5 mm higher strength (690 MPa) steel plate which had a similar areal density to the polyurea coated plates was also tested. Testing of the 690 MPa steel plate resulted in a similar level of deformation to the mild steel plates with coatings on the back face. Although both solutions showed similar blast deformations, the advantage of the polymer coating is that it can be applied as an appliqué to an existing structure; however high strength steel may be preferable for use during design stages. Mild steel plates with coatings on the front face were also tested and resulted in greater deformations than the 690 MPa steel plate and the mild steel plates with coatings on the back face. Numerical simulations were conducted using AUTODYN and validated using the experimental results. Good agreement was found for the plates which used D36 steel, with modelling results for maximum permanent deformation within 10% of experimental results. The correlation between models and experiment was not as close for X80 steel plates compared to the D36 steel plates, suggesting that the X80 material model may need to be refined.

UNCLASSIFIED
UNCLASSIFIED
This page is intentionally blank
UNCLASSIFIED
UNCLASSIFIED
Authors
Kathryn Ackland Maritime Platforms Division Kate Ackland joined DSTO in 2006 after completing a Bachelor of Science and a Bachelor of Engineering (with Honours) at Monash University, specialising in Mechanical Engineering and Mathematics. Since then she has been working in the Armour Mechanics and Vehicle Survivability group in Maritime Platforms Division, with her main areas of work being blast effects and blast modelling. She commenced her PhD research in 2007 concerning the blast mitigation properties of Explosive Resistant Coatings.
____________________ ________________________________________________
Nigel St John Maritime Platforms Division Nigel St John obtained a PhD in Polymer Chemistry from the University of Queensland in 1994. He joined DSTO in 1997 after several years working on defence related projects in the field of composite materials. He currently leads research on polymer and composite materials for maritime and land platforms in the Maritime Platforms Division.
____________________ ________________________________________________

UNCLASSIFIED
UNCLASSIFIED
This page is intentionally blank
UNCLASSIFIED
Contents
1. INTRODUCTION............................................................................................................... 1
2. EXPERIMENTAL SETUP .................................................................................................. 3 2.1 DSTO plates with ERC coating.............................................................................. 4 2.2 Commercially coated plates .................................................................................... 6
3. RESULTS .............................................................................................................................. 9 3.1 ERC coated plates by DSTO ................................................................................... 9 3.2 Commercially coated plates .................................................................................. 11
3.2.1 Bare plates................................................................................................. 13 3.2.2 Coating Type A........................................................................................ 14 3.2.3 Coating Type B......................................................................................... 14 3.2.4 Coating Type C ........................................................................................ 15
4. NUMERICAL MODELLING.......................................................................................... 16 4.1 Response of steel plates to blast loading............................................................ 16 4.2 Response of polyurea coated plates to blast loading ....................................... 20 4.3 Comparison of numerical modelling and experimental results .................... 21
5. DISCUSSION .................................................................................................................... 22 5.1 ERC coated plates by DSTO ................................................................................. 22 5.2 Commercially coated plates .................................................................................. 23
5.2.1 Comparison of front face and back face coatings ............................... 23 5.2.2 Dynamic displacement measurements................................................. 24 5.2.3 Damage to coatings during transport................................................... 24 5.2.4 Effectiveness of 690 MPa steel ............................................................... 24
5.3 Recommendations for future work ..................................................................... 25
6. SUMMARY AND CONCLUSIONS.............................................................................. 25
7. ACKNOWLEDGEMENTS .............................................................................................. 26
8. REFERENCES .................................................................................................................... 26
APPENDIX A: PRESSURE TRANSDUCER RESULTS ................................................... 28
UNCLASSIFIED

UNCLASSIFIED
UNCLASSIFIED
This page is intentionally blank
UNCLASSIFIED DSTO-TR-2591
1. Introduction
The threat of terrorism in recent years has prompted research into the use of lightweight materials to enhance the blast resistance of vehicles and structures. Various government and commercial organisations around the world are investigating the application of polymeric coatings as they show potential to enhance blast resistance and are cost effective and time efficient to apply. The relative ease of application of such coatings to existing vehicles and structures makes them well suited to battlefield protection upgrades. Since 1995, the Air Force Research Laboratory (AFRL) in the US has been conducting extensive research into developing lightweight expedient methods of strengthening structures against blast loading [1]. Initially, a range of stiff composite materials was investigated however these were deemed a poor choice for widespread use, because of factors including cost and difficulty of efficiently applying such reinforcements to existing structures. In 1999 AFRL began experimenting with a commercially available spray-on truck bed liner [2] and found that the elastomeric polymer coating overcame many of the issues associated with stiff composite materials, while reducing blast damage behind non-reinforced concrete masonry walls. Subsequent research led to a total of twenty-one off-the-shelf prospective polymers being evaluated to determine the most suitable for further testing. A pure polyurea was selected as the material of choice for further testing based on factors such as strength, flammability and cost. Full scale tests [3] later confirmed that polyurea coatings can be effective in reducing the vulnerability of structures subjected to blast loading. After the terrorist attack on the USS Cole, Figure 1, the benefit demonstrated by the AFRL testing was pursued further by the US Department of Defense. Again, the performance of elastomeric coatings was found superior to other alternatives. At this time, such coatings were given the generic descriptor as Explosion Resistant Coatings (ERC). In 2005 the US launched an Advanced Concept Technology Demonstrator (ACTD) Program, Joint Enhanced Explosion Resistant Coating Exploitation (JEERCE) focused on protection against explosives and/or penetrating ordnance.
UNCLASSIFIED 1
UNCLASSIFIED DSTO-TR-2591
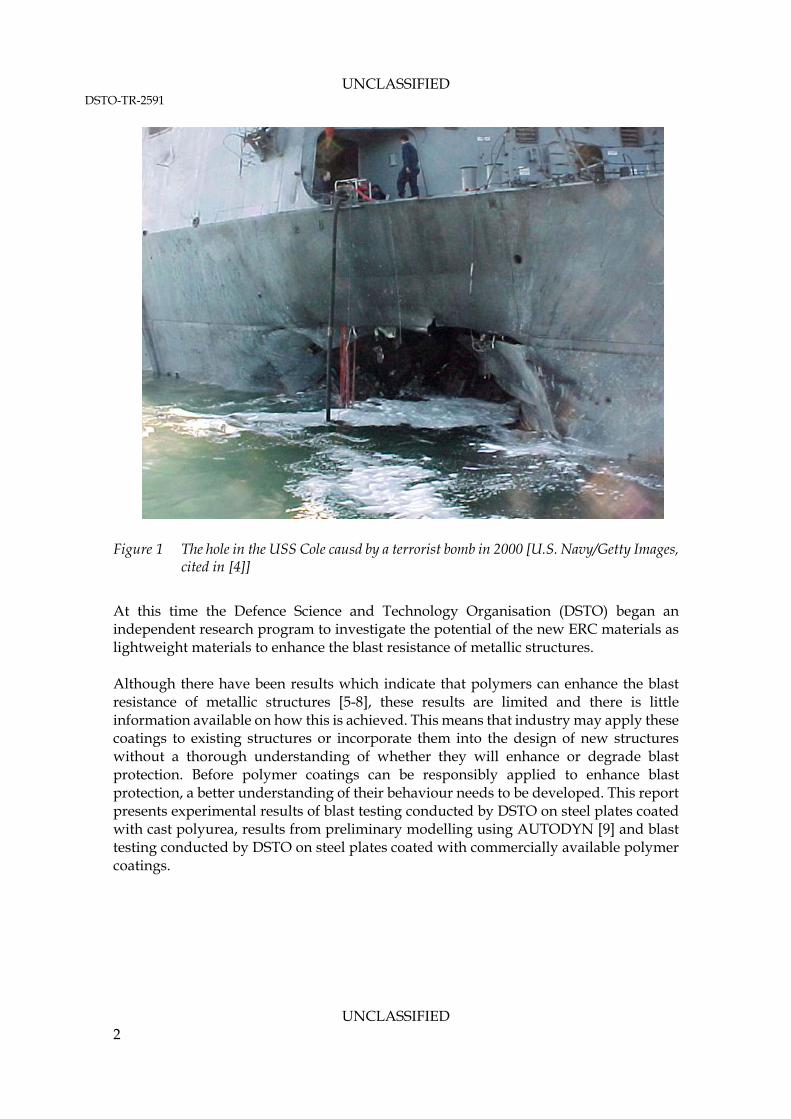
Figure 1 The hole in the USS Cole causd by a terrorist bomb in 2000 [U.S. Navy/Getty Images, cited in [4]]
At this time the Defence Science and Technology Organisation (DSTO) began an independent research program to investigate the potential of the new ERC materials as lightweight materials to enhance the blast resistance of metallic structures. Although there have been results which indicate that polymers can enhance the blast resistance of metallic structures [5-8], these results are limited and there is little information available on how this is achieved. This means that industry may apply these coatings to existing structures or incorporate them into the design of new structures without a thorough understanding of whether they will enhance or degrade blast protection. Before polymer coatings can be responsibly applied to enhance blast protection, a better understanding of their behaviour needs to be developed. This report presents experimental results of blast testing conducted by DSTO on steel plates coated with cast polyurea, results from preliminary modelling using AUTODYN [9] and blast testing conducted by DSTO on steel plates coated with commercially available polymer coatings.
UNCLASSIFIED 2
UNCLASSIFIED DSTO-TR-2591
2. Experimental setup
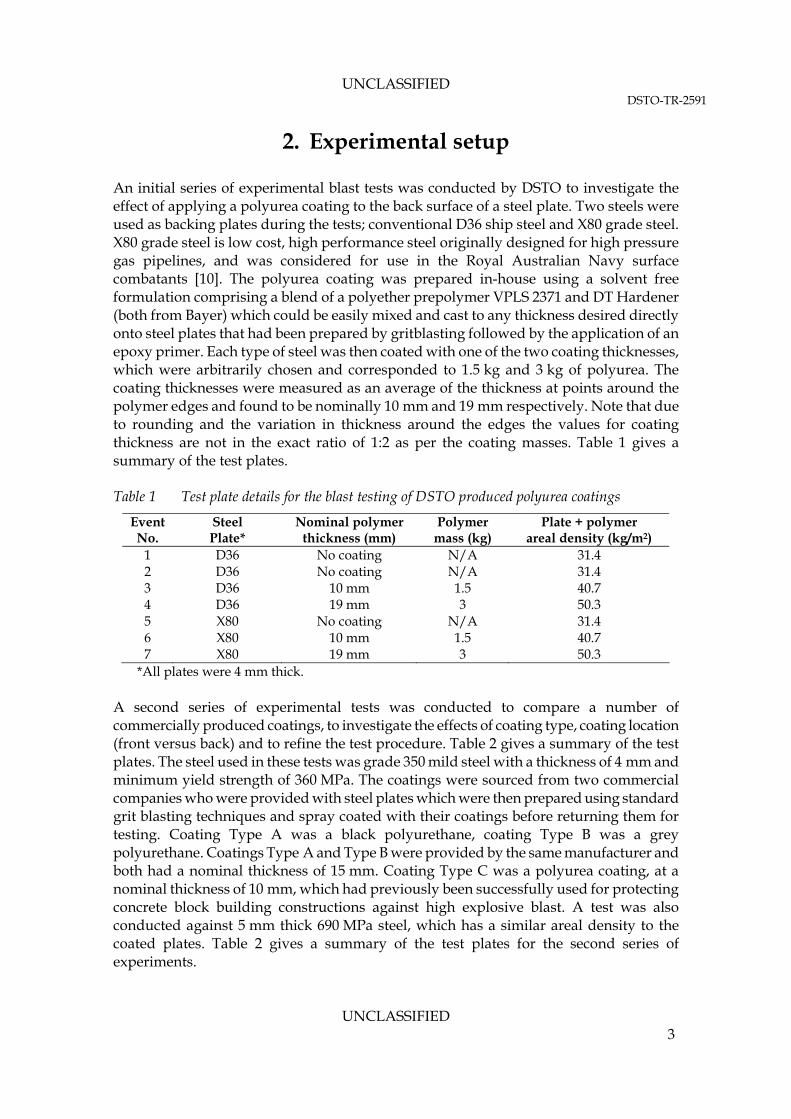
An initial series of experimental blast tests was conducted by DSTO to investigate the effect of applying a polyurea coating to the back surface of a steel plate. Two steels were used as backing plates during the tests; conventional D36 ship steel and X80 grade steel. X80 grade steel is low cost, high performance steel originally designed for high pressure gas pipelines, and was considered for use in the Royal Australian Navy surface combatants [10]. The polyurea coating was prepared in-house using a solvent free formulation comprising a blend of a polyether prepolymer VPLS 2371 and DT Hardener (both from Bayer) which could be easily mixed and cast to any thickness desired directly onto steel plates that had been prepared by gritblasting followed by the application of an epoxy primer. Each type of steel was then coated with one of the two coating thicknesses, which were arbitrarily chosen and corresponded to 1.5 kg and 3 kg of polyurea. The coating thicknesses were measured as an average of the thickness at points around the polymer edges and found to be nominally 10 mm and 19 mm respectively. Note that due to rounding and the variation in thickness around the edges the values for coating thickness are not in the exact ratio of 1:2 as per the coating masses. Table 1 gives a summary of the test plates. Table 1 Test plate details for the blast testing of DSTO produced polyurea coatings
Event No.
Steel Plate*
Nominal polymer thickness (mm)
Polymer mass (kg)
Plate + polymer areal density (kg/m2)
1 D36 No coating N/A 31.4 2 D36 No coating N/A 31.4 3 D36 10 mm 1.5 40.7 4 D36 19 mm 3 50.3 5 X80 No coating N/A 31.4 6 X80 10 mm 1.5 40.7 7 X80 19 mm 3 50.3
*All plates were 4 mm thick. A second series of experimental tests was conducted to compare a number of commercially produced coatings, to investigate the effects of coating type, coating location (front versus back) and to refine the test procedure. Table 2 gives a summary of the test plates. The steel used in these tests was grade 350 mild steel with a thickness of 4 mm and minimum yield strength of 360 MPa. The coatings were sourced from two commercial companies who were provided with steel plates which were then prepared using standard grit blasting techniques and spray coated with their coatings before returning them for testing. Coating Type A was a black polyurethane, coating Type B was a grey polyurethane. Coatings Type A and Type B were provided by the same manufacturer and both had a nominal thickness of 15 mm. Coating Type C was a polyurea coating, at a nominal thickness of 10 mm, which had previously been successfully used for protecting concrete block building constructions against high explosive blast. A test was also conducted against 5 mm thick 690 MPa steel, which has a similar areal density to the coated plates. Table 2 gives a summary of the test plates for the second series of experiments.
UNCLASSIFIED 3
UNCLASSIFIED DSTO-TR-2591
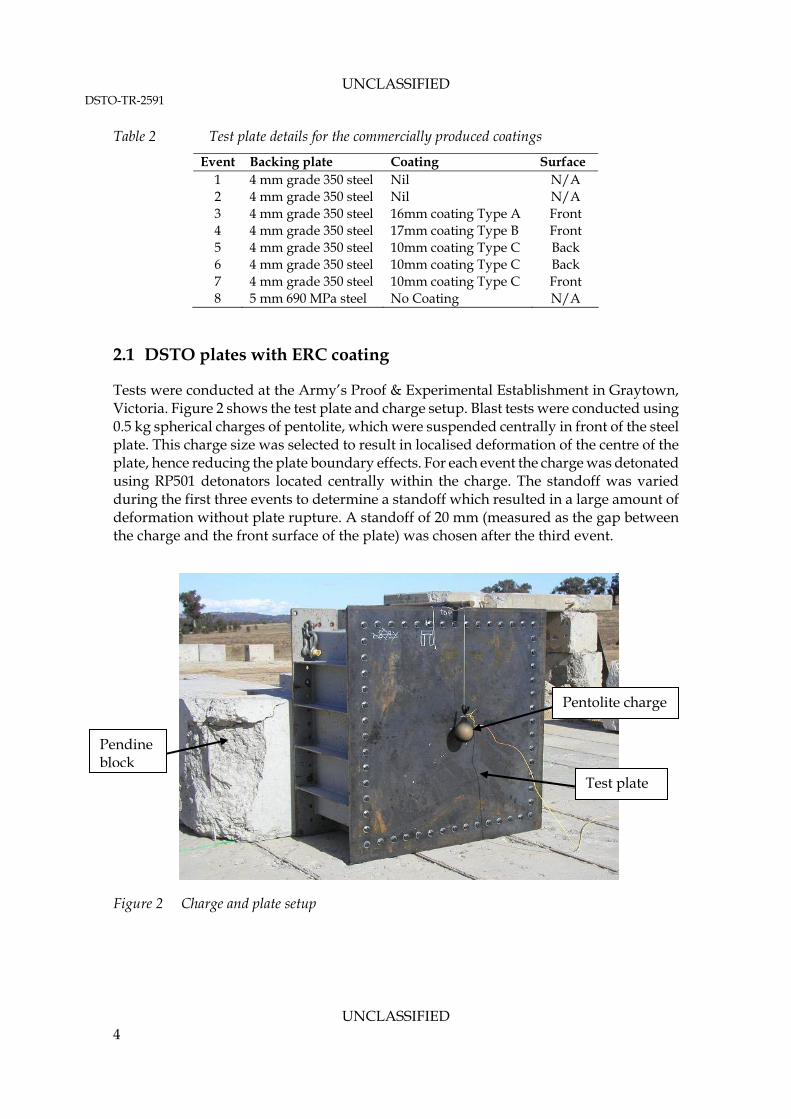
Table 2 Test plate details for the commercially produced coatings
Event Backing plate Coating Surface 1 4 mm grade 350 steel Nil N/A 2 4 mm grade 350 steel Nil N/A 3 4 mm grade 350 steel 16mm coating Type A Front 4 4 mm grade 350 steel 17mm coating Type B Front 5 4 mm grade 350 steel 10mm coating Type C Back 6 4 mm grade 350 steel 10mm coating Type C Back 7 4 mm grade 350 steel 10mm coating Type C Front 8 5 mm 690 MPa steel No Coating N/A
2.1 DSTO plates with ERC coating
Tests were conducted at the Army’s Proof & Experimental Establishment in Graytown, Victoria. Figure 2 shows the test plate and charge setup. Blast tests were conducted using 0.5 kg spherical charges of pentolite, which were suspended centrally in front of the steel plate. This charge size was selected to result in localised deformation of the centre of the plate, hence reducing the plate boundary effects. For each event the charge was detonated using RP501 detonators located centrally within the charge. The standoff was varied during the first three events to determine a standoff which resulted in a large amount of deformation without plate rupture. A standoff of 20 mm (measured as the gap between the charge and the front surface of the plate) was chosen after the third event.
Pentolite charge
Pendine block
Test plate
Figure 2 Charge and plate setup
UNCLASSIFIED 4
UNCLASSIFIED DSTO-TR-2591
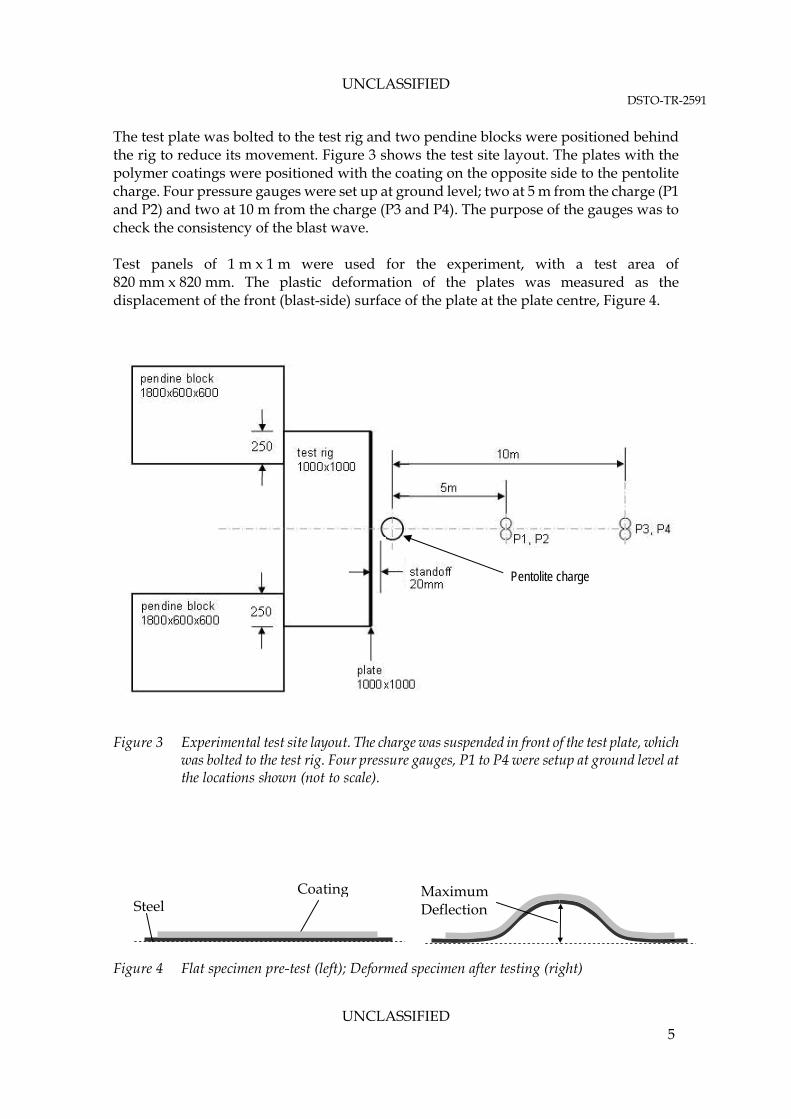
The test plate was bolted to the test rig and two pendine blocks were positioned behind the rig to reduce its movement. Figure 3 shows the test site layout. The plates with the polymer coatings were positioned with the coating on the opposite side to the pentolite charge. Four pressure gauges were set up at ground level; two at 5 m from the charge (P1 and P2) and two at 10 m from the charge (P3 and P4). The purpose of the gauges was to check the consistency of the blast wave. Test panels of 1 m x 1 m were used for the experiment, with a test area of 820 mm x 820 mm. The plastic deformation of the plates was measured as the displacement of the front (blast-side) surface of the plate at the plate centre, Figure 4.
UNCLASSIFIED
Figure 3 Experimental test site layout. The charge was suspended in front of the test plate, which
was bolted to the test rig. Four pressure gauges, P1 to P4 were setup at ground level at the locations shown (not to scale).
Maximum Deflection
Coating Steel
Pentolite charge
Figure 4 Flat specimen pre-test (left); Deformed specimen after testing (right)
5
UNCLASSIFIED DSTO-TR-2591
Bare plates of D36 and X80 steel, both 4 mm thick, were tested as a baseline for comparison with polyurea coated plates. Mechanical properties of the steel plates are shown in Table 3. D36 plates were used initially to determine a standoff distance which provided a large amount of deformation without plate rupture. Table 1 shows details of the test plates used during the experiment. The polyurea coating was applied over an area of 770 x 770 mm so that it would sit within the test rig during the test. Table 3 Mechanical properties of steels used during blast testing [11, 12]
Steel Yield Strength (minimum, MPa)
UTS (MPa)
D36 355 490-620 X80 550 620
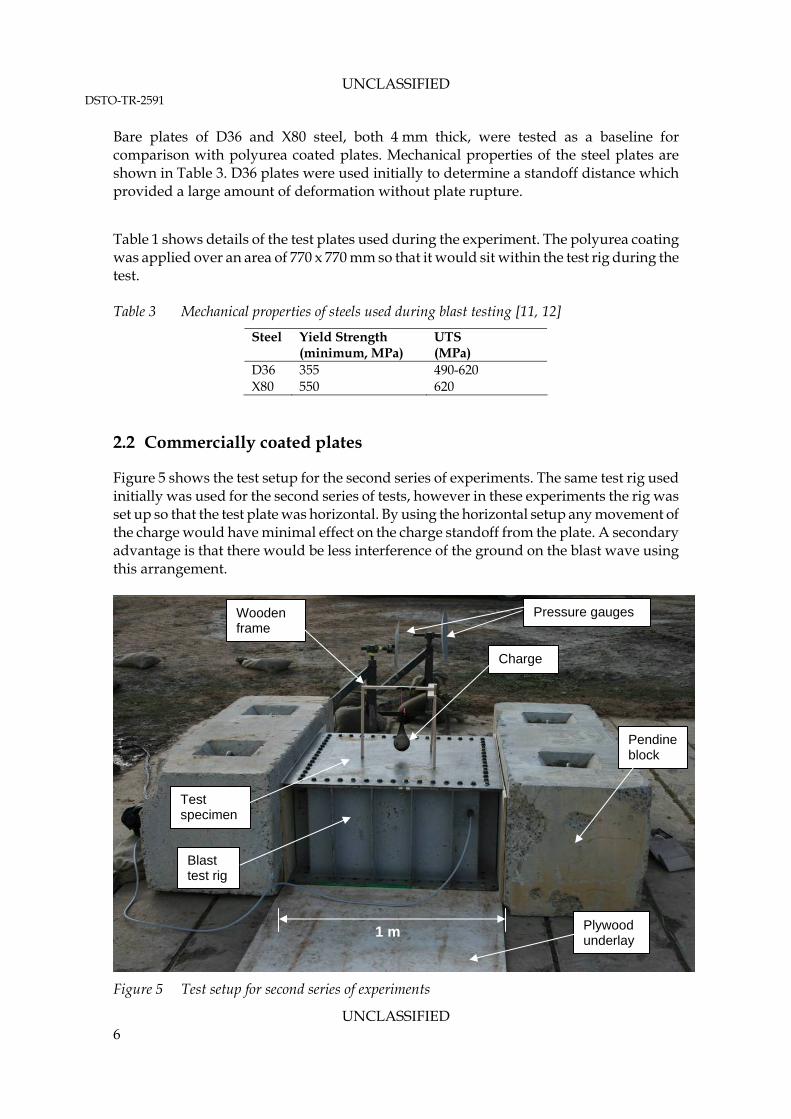
2.2 Commercially coated plates
Figure 5 shows the test setup for the second series of experiments. The same test rig used initially was used for the second series of tests, however in these experiments the rig was set up so that the test plate was horizontal. By using the horizontal setup any movement of the charge would have minimal effect on the charge standoff from the plate. A secondary advantage is that there would be less interference of the ground on the blast wave using this arrangement.
Pressure gauges
Charge
Pendine block
Plywood underlay
Blast test rig
Test specimen
Wooden frame
1 m
Figure 5 Test setup for second series of experiments
UNCLASSIFIED 6
UNCLASSIFIED DSTO-TR-2591
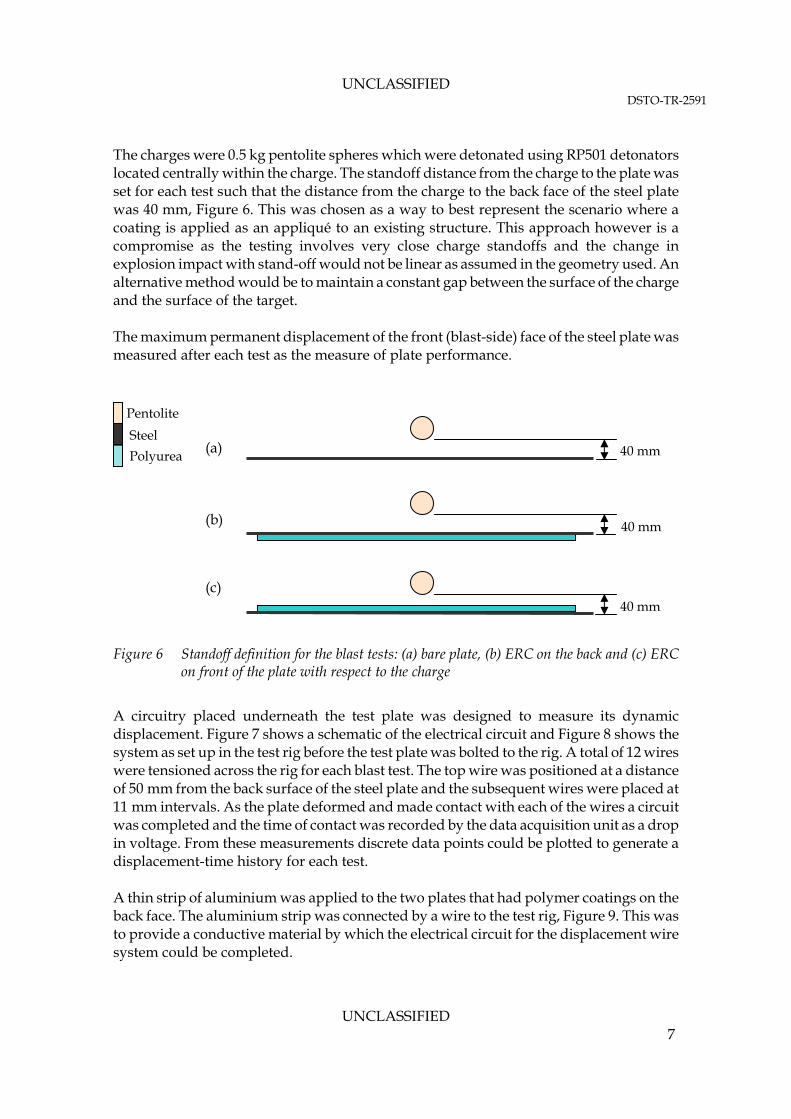
The charges were 0.5 kg pentolite spheres which were detonated using RP501 detonators located centrally within the charge. The standoff distance from the charge to the plate was set for each test such that the distance from the charge to the back face of the steel plate was 40 mm, Figure 6. This was chosen as a way to best represent the scenario where a coating is applied as an appliqué to an existing structure. This approach however is a compromise as the testing involves very close charge standoffs and the change in explosion impact with stand-off would not be linear as assumed in the geometry used. An alternative method would be to maintain a constant gap between the surface of the charge and the surface of the target. The maximum permanent displacement of the front (blast-side) face of the steel plate was measured after each test as the measure of plate performance.
40 mm
Pentolite
40 mm
40 mm
Steel
Polyurea
(b)
(c)
(a)
Figure 6 Standoff definition for the blast tests: (a) bare plate, (b) ERC on the back and (c) ERC
on front of the plate with respect to the charge
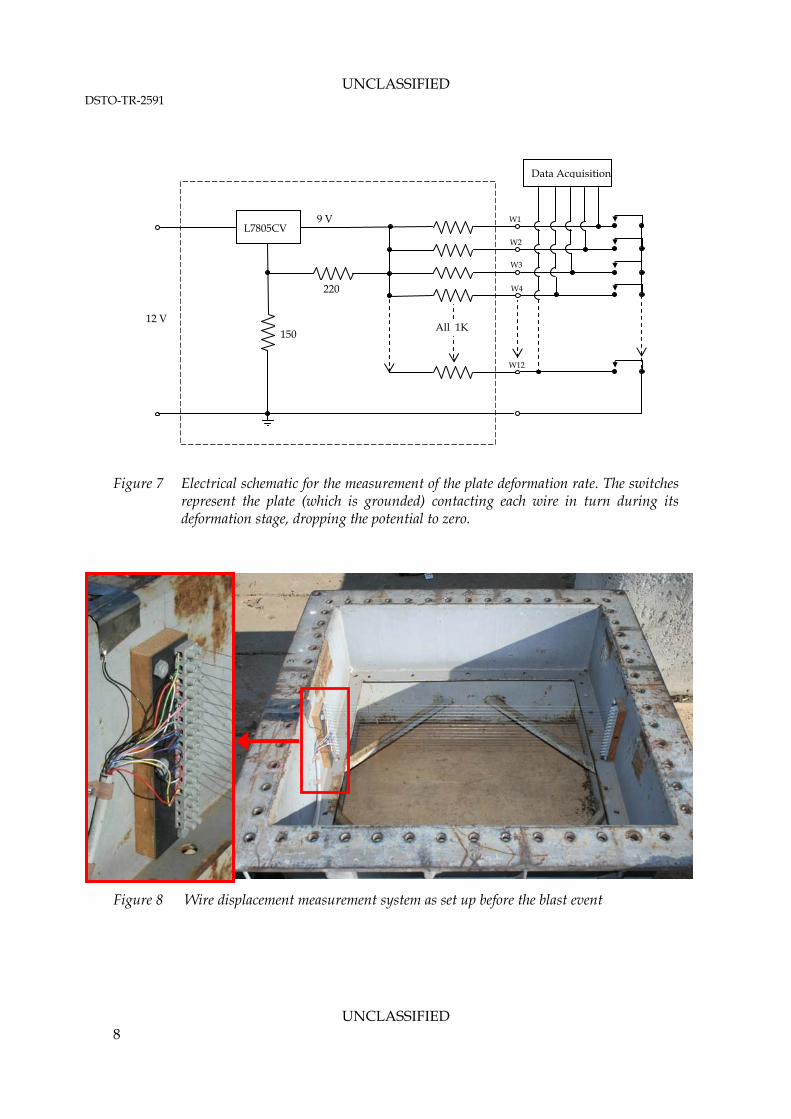
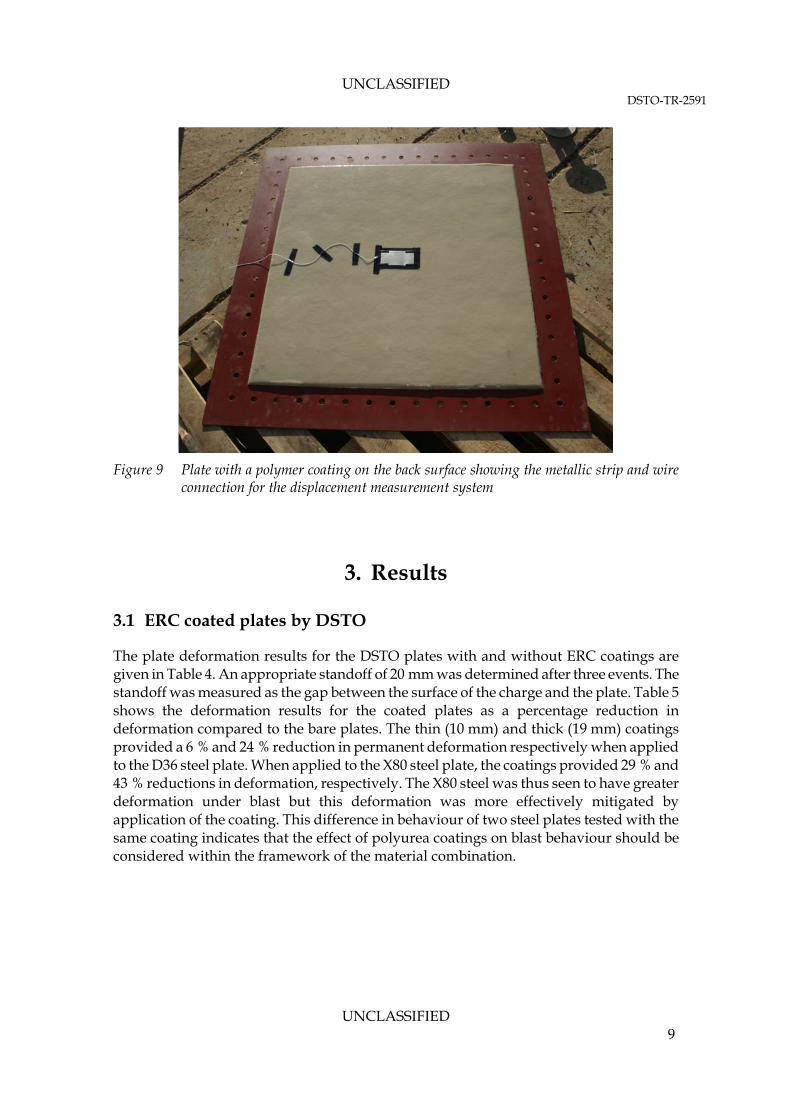
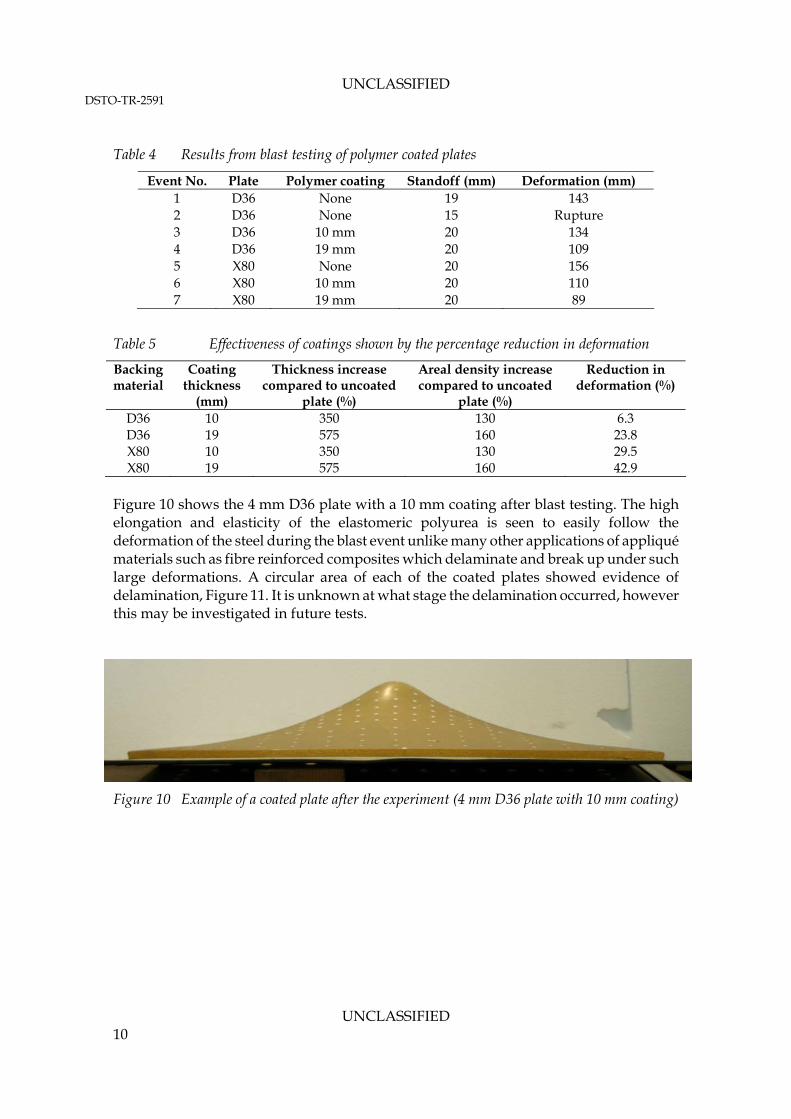
A circuitry placed underneath the test plate was designed to measure its dynamic displacement. Figure 7 shows a schematic of the electrical circuit and Figure 8 shows the system as set up in the test rig before the test plate was bolted to the rig. A total of 12 wires were tensioned across the rig for each blast test. The top wire was positioned at a distance of 50 mm from the back surface of the steel plate and the subsequent wires were placed at 11 mm intervals. As the plate deformed and made contact with each of the wires a circuit was completed and the time of contact was recorded by the data acquisition unit as a drop in voltage. From these measurements discrete data points could be plotted to generate a displacement-time history for each test. A thin strip of aluminium was applied to the two plates that had polymer coatings on the back face. The aluminium strip was connected by a wire to the test rig, Figure 9. This was to provide a conductive material by which the electrical circuit for the displacement wire system could be completed.
UNCLASSIFIED 7
UNCLASSIFIED DSTO-TR-2591
UNCLASSIFIED
12 V
Figure 7 Electrical schematic for the measurement of the plate deformation rate. The switches
represent the plate (which is grounded) contacting each wire in turn during its deformation stage, dropping the potential to zero.
Figure 8 Wire displacement measurement system as set up before the blast event
L7805CV
220
150 All 1K
W1
W2
W3
W4
W12
Data Acquisition
9 V
8
UNCLASSIFIED DSTO-TR-2591
Figure 9 Plate with a polymer coating on the back surface showing the metallic strip and wire
connection for the displacement measurement system
3. Results
3.1 ERC coated plates by DSTO
The plate deformation results for the DSTO plates with and without ERC coatings are given in Table 4. An appropriate standoff of 20 mm was determined after three events. The standoff was measured as the gap between the surface of the charge and the plate. Table 5 shows the deformation results for the coated plates as a percentage reduction in deformation compared to the bare plates. The thin (10 mm) and thick (19 mm) coatings provided a 6 % and 24 % reduction in permanent deformation respectively when applied to the D36 steel plate. When applied to the X80 steel plate, the coatings provided 29 % and 43 % reductions in deformation, respectively. The X80 steel was thus seen to have greater deformation under blast but this deformation was more effectively mitigated by application of the coating. This difference in behaviour of two steel plates tested with the same coating indicates that the effect of polyurea coatings on blast behaviour should be considered within the framework of the material combination.
UNCLASSIFIED 9
UNCLASSIFIED DSTO-TR-2591
Table 4 Results from blast testing of polymer coated plates
Event No. Plate Polymer coating Standoff (mm) Deformation (mm) 1 D36 None 19 143 2 D36 None 15 Rupture 3 D36 10 mm 20 134 4 D36 19 mm 20 109 5 X80 None 20 156 6 X80 10 mm 20 110 7 X80 19 mm 20 89
Table 5 Effectiveness of coatings shown by the percentage reduction in deformation
Backing material
Coating thickness
(mm)
Thickness increase compared to uncoated
plate (%)
Areal density increase compared to uncoated
plate (%)
Reduction in deformation (%)
D36 10 350 130 6.3 D36 19 575 160 23.8 X80 10 350 130 29.5 X80 19 575 160 42.9
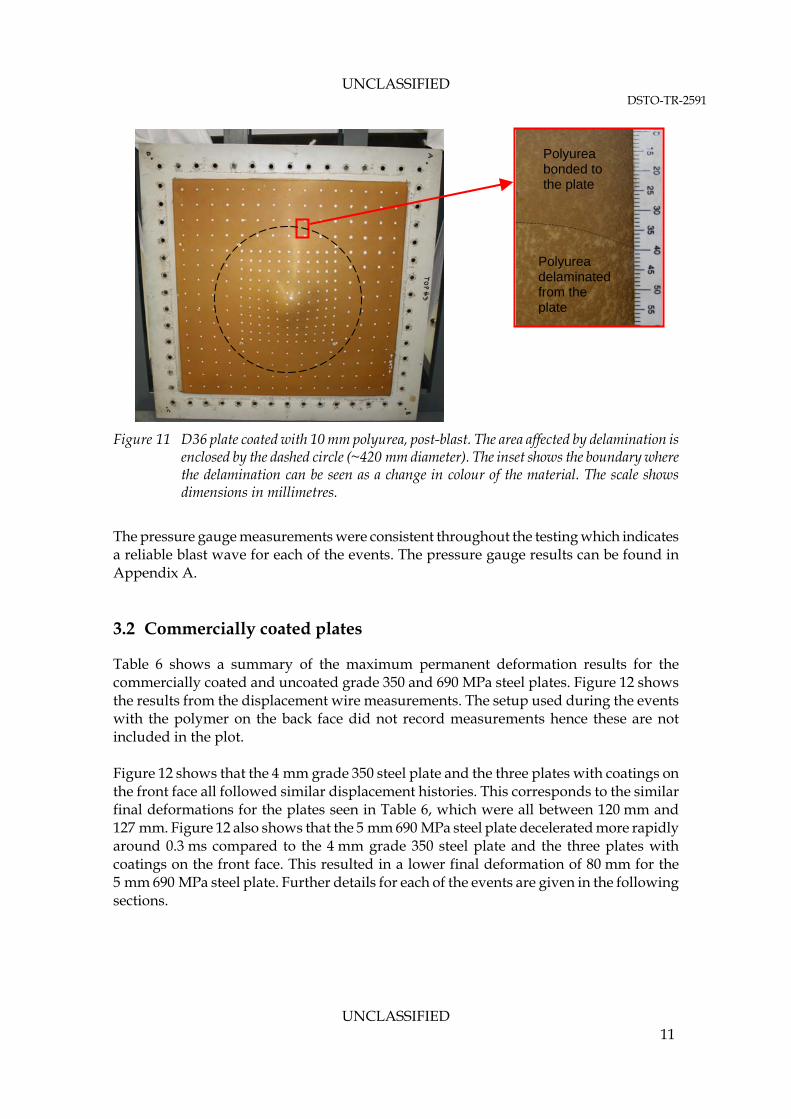
Figure 10 shows the 4 mm D36 plate with a 10 mm coating after blast testing. The high elongation and elasticity of the elastomeric polyurea is seen to easily follow the deformation of the steel during the blast event unlike many other applications of appliqué materials such as fibre reinforced composites which delaminate and break up under such large deformations. A circular area of each of the coated plates showed evidence of delamination, Figure 11. It is unknown at what stage the delamination occurred, however this may be investigated in future tests.
Figure 10 Example of a coated plate after the experiment (4 mm D36 plate with 10 mm coating)
UNCLASSIFIED 10
UNCLASSIFIED DSTO-TR-2591
Polyurea delaminated from the plate
Polyurea bonded to the plate
Figure 11 D36 plate coated with 10 mm polyurea, post-blast. The area affected by delamination is enclosed by the dashed circle (~420 mm diameter). The inset shows the boundary where the delamination can be seen as a change in colour of the material. The scale shows dimensions in millimetres.
The pressure gauge measurements were consistent throughout the testing which indicates a reliable blast wave for each of the events. The pressure gauge results can be found in Appendix A. 3.2 Commercially coated plates
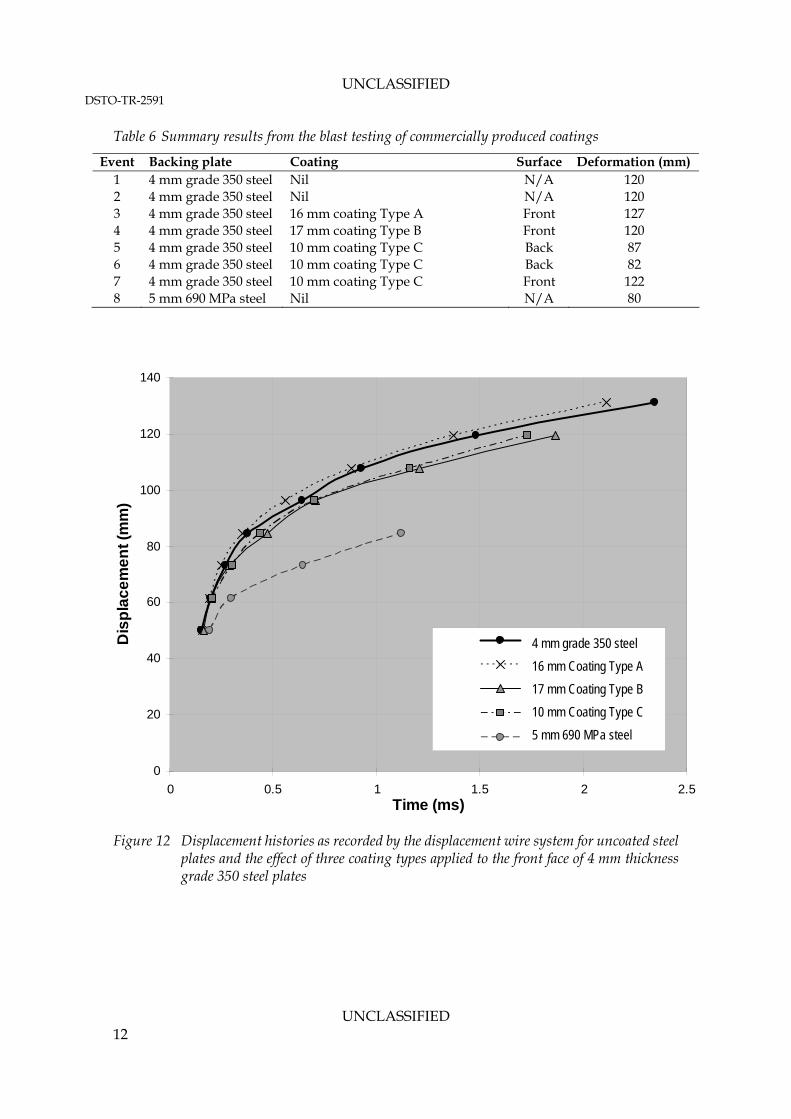
Table 6 shows a summary of the maximum permanent deformation results for the commercially coated and uncoated grade 350 and 690 MPa steel plates. Figure 12 shows the results from the displacement wire measurements. The setup used during the events with the polymer on the back face did not record measurements hence these are not included in the plot. Figure 12 shows that the 4 mm grade 350 steel plate and the three plates with coatings on the front face all followed similar displacement histories. This corresponds to the similar final deformations for the plates seen in Table 6, which were all between 120 mm and 127 mm. Figure 12 also shows that the 5 mm 690 MPa steel plate decelerated more rapidly around 0.3 ms compared to the 4 mm grade 350 steel plate and the three plates with coatings on the front face. This resulted in a lower final deformation of 80 mm for the 5 mm 690 MPa steel plate. Further details for each of the events are given in the following sections.
UNCLASSIFIED 11
UNCLASSIFIED DSTO-TR-2591
Table 6 Summary results from the blast testing of commercially produced coatings
Event Backing plate Coating Surface Deformation (mm) 1 4 mm grade 350 steel Nil N/A 120 2 4 mm grade 350 steel Nil N/A 120 3 4 mm grade 350 steel 16 mm coating Type A Front 127 4 4 mm grade 350 steel 17 mm coating Type B Front 120 5 4 mm grade 350 steel 10 mm coating Type C Back 87 6 4 mm grade 350 steel 10 mm coating Type C Back 82 7 4 mm grade 350 steel 10 mm coating Type C Front 122 8 5 mm 690 MPa steel Nil N/A 80
0
20
40
60
80
100
120
140
0 0.5 1 1.5 2 2Time (ms)
Dis
pla
ce
me
nt
(mm
)
.5
Bare plate
UNCLASSIFIED
Coating Type A
Coating Type B
Coating Type C
BIS80 plate
4 mm grade 350 steel
16 mm Coating Type A
17 mm Coating Type B
10 mm Coating Type C
5 mm 690 MPa steel
Figure 12 Displacement histories as recorded by the displacement wire system for uncoated steel
plates and the effect of three coating types applied to the front face of 4 mm thickness grade 350 steel plates
12
UNCLASSIFIED DSTO-TR-2591
3.2.1 Bare plates
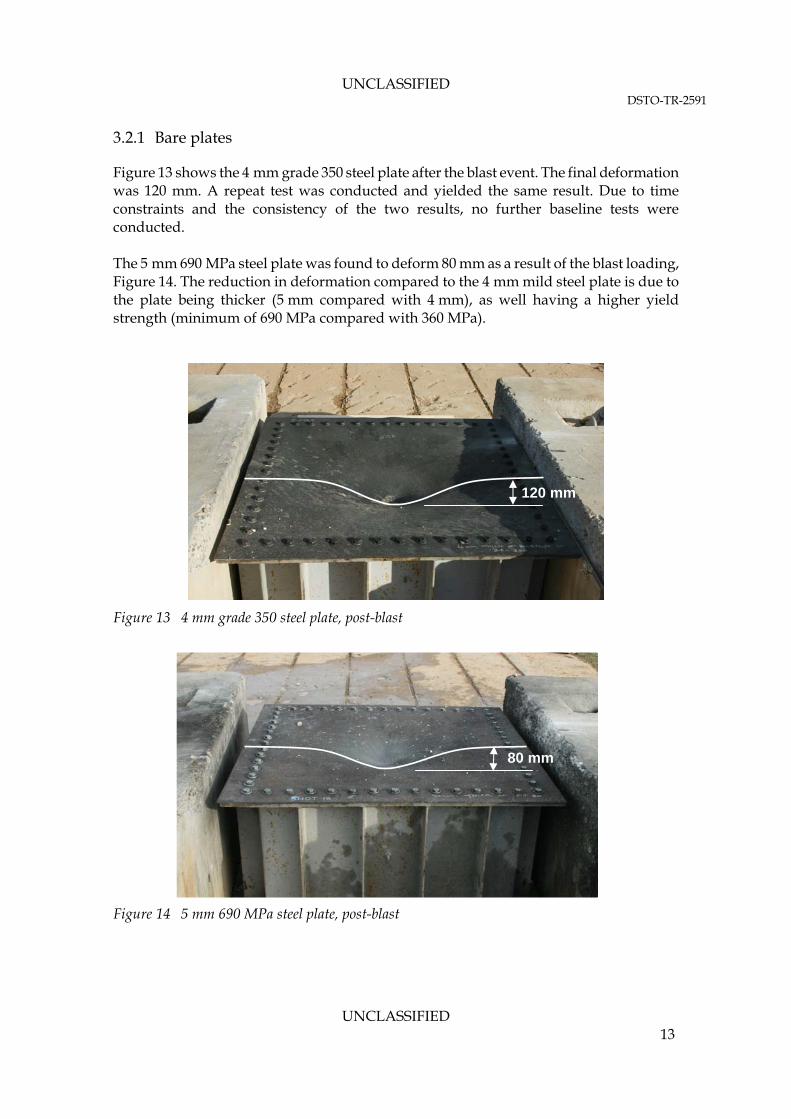
Figure 13 shows the 4 mm grade 350 steel plate after the blast event. The final deformation was 120 mm. A repeat test was conducted and yielded the same result. Due to time constraints and the consistency of the two results, no further baseline tests were conducted. The 5 mm 690 MPa steel plate was found to deform 80 mm as a result of the blast loading, Figure 14. The reduction in deformation compared to the 4 mm mild steel plate is due to the plate being thicker (5 mm compared with 4 mm), as well having a higher yield strength (minimum of 690 MPa compared with 360 MPa).
Figure 13 4 mm grade 350 steel plate, post-blast
80 mm
120 mm
Figure 14 5 mm 690 MPa steel plate, post-blast
UNCLASSIFIED 13
UNCLASSIFIED DSTO-TR-2591
3.2.2 Coating Type A
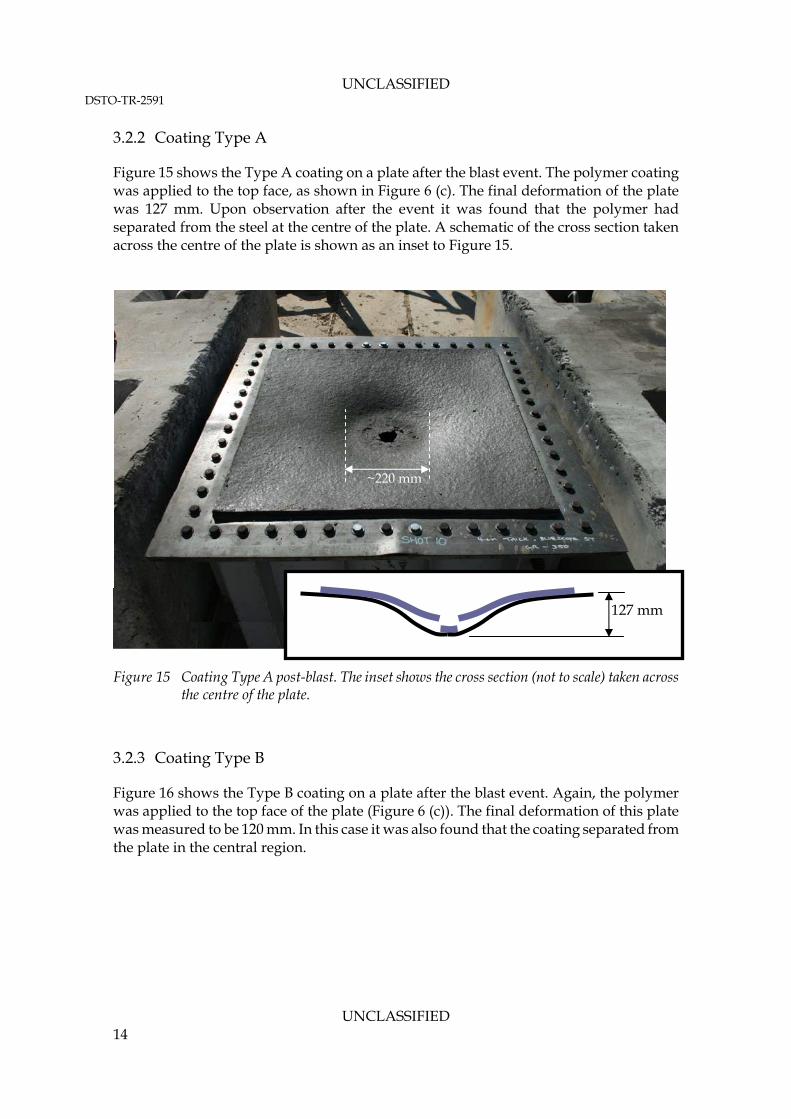
Figure 15 shows the Type A coating on a plate after the blast event. The polymer coating was applied to the top face, as shown in Figure 6 (c). The final deformation of the plate was 127 mm. Upon observation after the event it was found that the polymer had separated from the steel at the centre of the plate. A schematic of the cross section taken across the centre of the plate is shown as an inset to Figure 15.
127 mm
~220 mm
Figure 15 Coating Type A post-blast. The inset shows the cross section (not to scale) taken across the centre of the plate.
3.2.3 Coating Type B
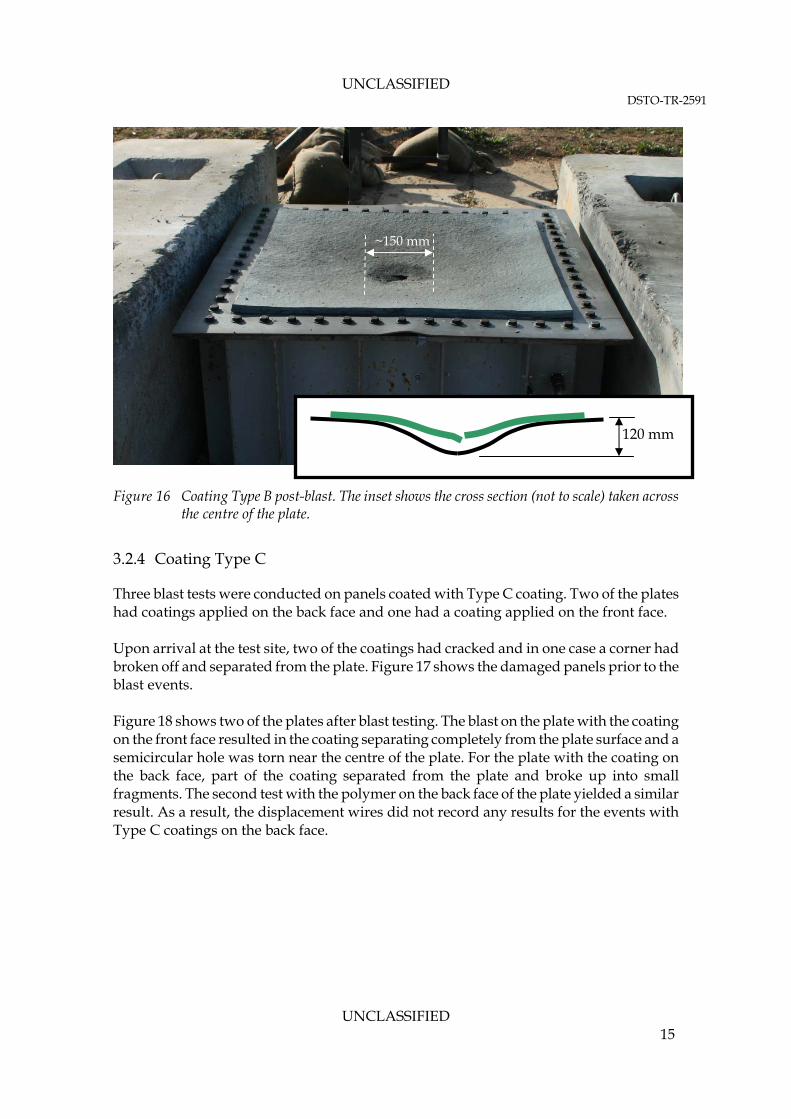
Figure 16 shows the Type B coating on a plate after the blast event. Again, the polymer was applied to the top face of the plate (Figure 6 (c)). The final deformation of this plate was measured to be 120 mm. In this case it was also found that the coating separated from the plate in the central region.
UNCLASSIFIED 14
UNCLASSIFIED DSTO-TR-2591
120 mm
~150 mm
Figure 16 Coating Type B post-blast. The inset shows the cross section (not to scale) taken across the centre of the plate.
3.2.4 Coating Type C
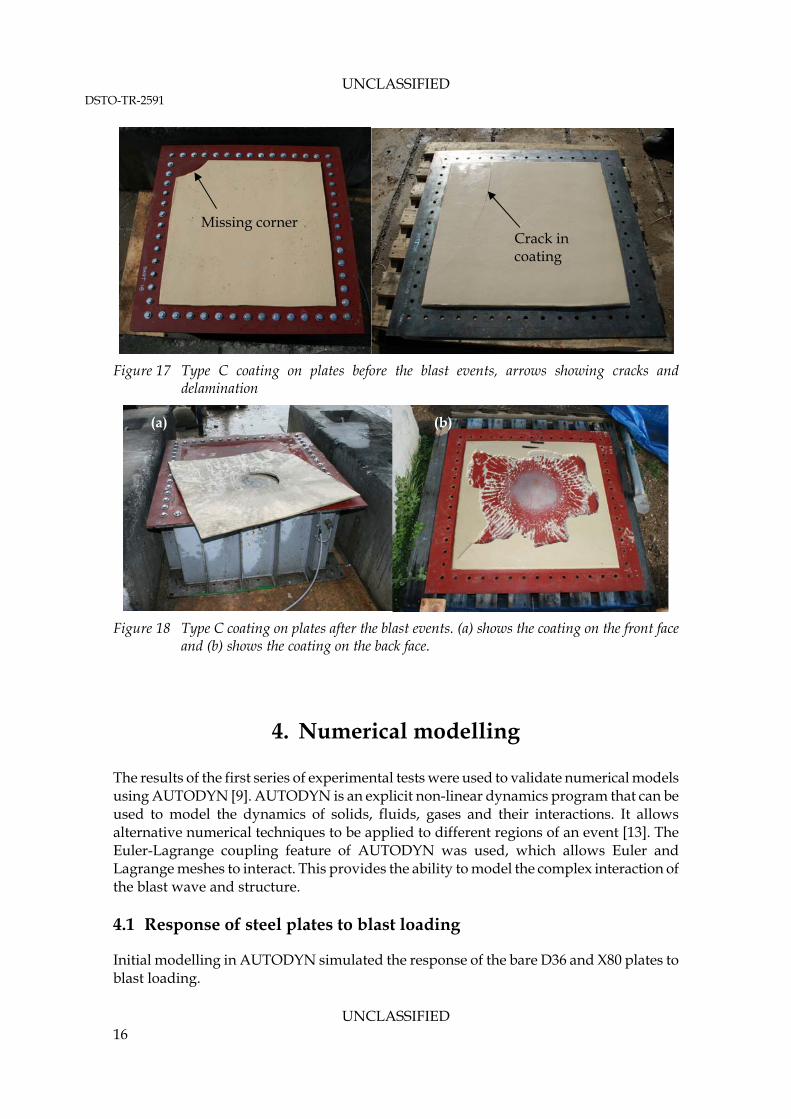
Three blast tests were conducted on panels coated with Type C coating. Two of the plates had coatings applied on the back face and one had a coating applied on the front face. Upon arrival at the test site, two of the coatings had cracked and in one case a corner had broken off and separated from the plate. Figure 17 shows the damaged panels prior to the blast events. Figure 18 shows two of the plates after blast testing. The blast on the plate with the coating on the front face resulted in the coating separating completely from the plate surface and a semicircular hole was torn near the centre of the plate. For the plate with the coating on the back face, part of the coating separated from the plate and broke up into small fragments. The second test with the polymer on the back face of the plate yielded a similar result. As a result, the displacement wires did not record any results for the events with Type C coatings on the back face.
UNCLASSIFIED 15
UNCLASSIFIED DSTO-TR-2591
UNCLASSIFIED
Missing corner Crack in coating
Figure 17 Type C coating on plates before the blast events, arrows showing cracks and delamination
(a) (b)
Figure 18 Type C coating on plates after the blast events. (a) shows the coating on the front face and (b) shows the coating on the back face.
4. Numerical modelling
The results of the first series of experimental tests were used to validate numerical models using AUTODYN [9]. AUTODYN is an explicit non-linear dynamics program that can be used to model the dynamics of solids, fluids, gases and their interactions. It allows alternative numerical techniques to be applied to different regions of an event [13]. The Euler-Lagrange coupling feature of AUTODYN was used, which allows Euler and Lagrange meshes to interact. This provides the ability to model the complex interaction of the blast wave and structure. 4.1 Response of steel plates to blast loading
Initial modelling in AUTODYN simulated the response of the bare D36 and X80 plates to blast loading.
16
UNCLASSIFIED DSTO-TR-2591
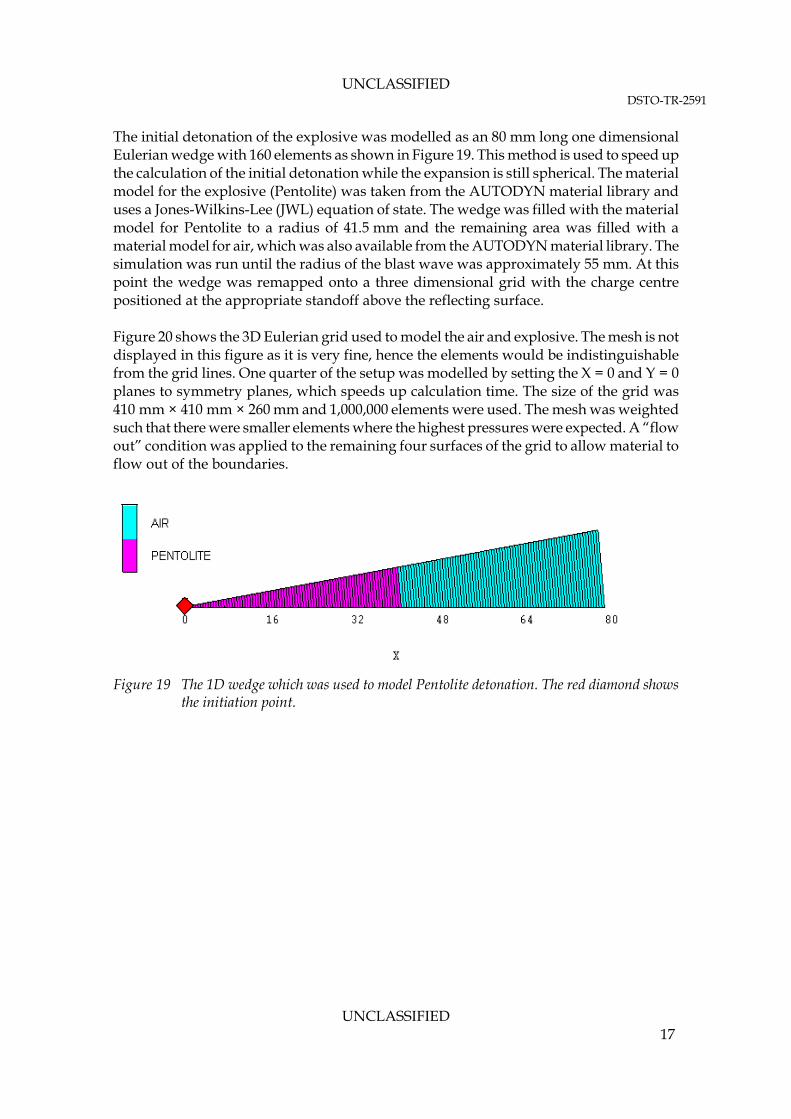
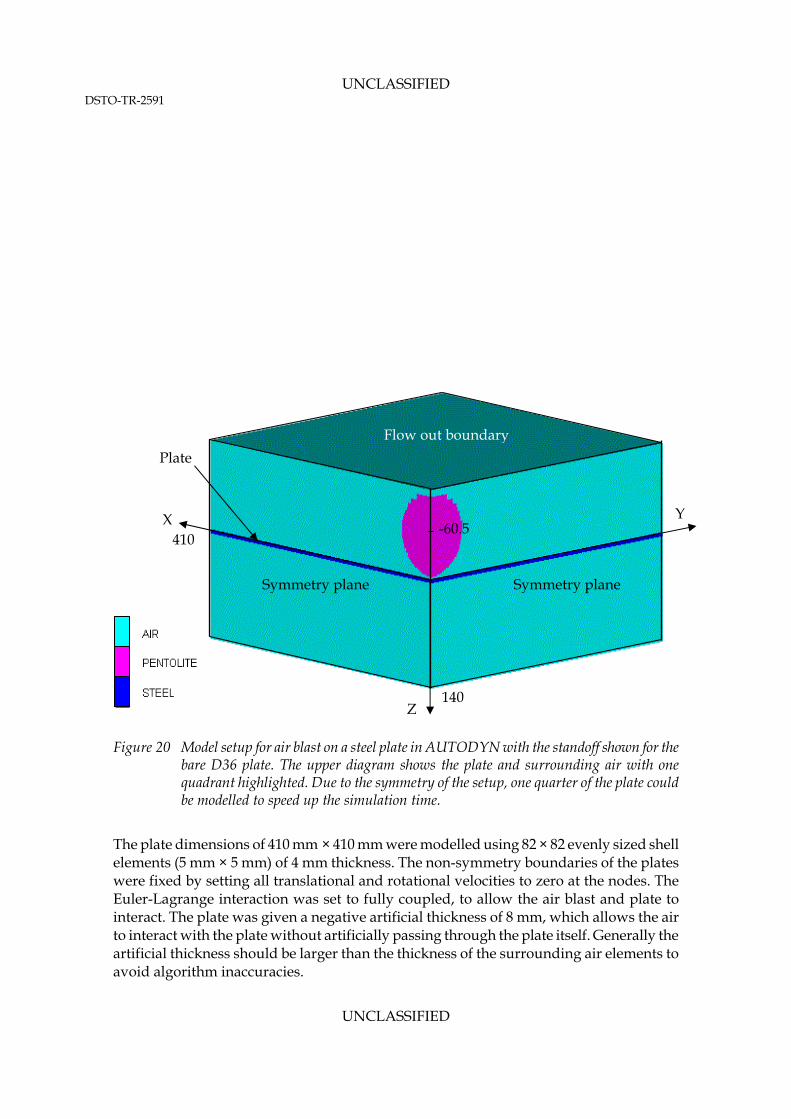
The initial detonation of the explosive was modelled as an 80 mm long one dimensional Eulerian wedge with 160 elements as shown in Figure 19. This method is used to speed up the calculation of the initial detonation while the expansion is still spherical. The material model for the explosive (Pentolite) was taken from the AUTODYN material library and uses a Jones-Wilkins-Lee (JWL) equation of state. The wedge was filled with the material model for Pentolite to a radius of 41.5 mm and the remaining area was filled with a material model for air, which was also available from the AUTODYN material library. The simulation was run until the radius of the blast wave was approximately 55 mm. At this point the wedge was remapped onto a three dimensional grid with the charge centre positioned at the appropriate standoff above the reflecting surface. Figure 20 shows the 3D Eulerian grid used to model the air and explosive. The mesh is not displayed in this figure as it is very fine, hence the elements would be indistinguishable from the grid lines. One quarter of the setup was modelled by setting the X = 0 and Y = 0 planes to symmetry planes, which speeds up calculation time. The size of the grid was 410 mm × 410 mm × 260 mm and 1,000,000 elements were used. The mesh was weighted such that there were smaller elements where the highest pressures were expected. A “flow out” condition was applied to the remaining four surfaces of the grid to allow material to flow out of the boundaries.
Figure 19 The 1D wedge which was used to model Pentolite detonation. The red diamond shows
the initiation point.
UNCLASSIFIED 17
UNCLASSIFIED DSTO-TR-2591
X Y
UNCLASSIFIED
Figure 20 Model setup for air blast on a steel plate in AUTODYN with the standoff shown for the bare D36 plate. The upper diagram shows the plate and surrounding air with one quadrant highlighted. Due to the symmetry of the setup, one quarter of the plate could be modelled to speed up the simulation time.
The plate dimensions of 410 mm × 410 mm were modelled using 82 × 82 evenly sized shell elements (5 mm × 5 mm) of 4 mm thickness. The non-symmetry boundaries of the plates were fixed by setting all translational and rotational velocities to zero at the nodes. The Euler-Lagrange interaction was set to fully coupled, to allow the air blast and plate to interact. The plate was given a negative artificial thickness of 8 mm, which allows the air to interact with the plate without artificially passing through the plate itself. Generally the artificial thickness should be larger than the thickness of the surrounding air elements to avoid algorithm inaccuracies.
-60.5
410
Z 140
Symmetry plane Symmetry plane
Flow out boundary
Plate
One quarter of the plate was modelled due to its symmetry
410
18
UNCLASSIFIED DSTO-TR-2591
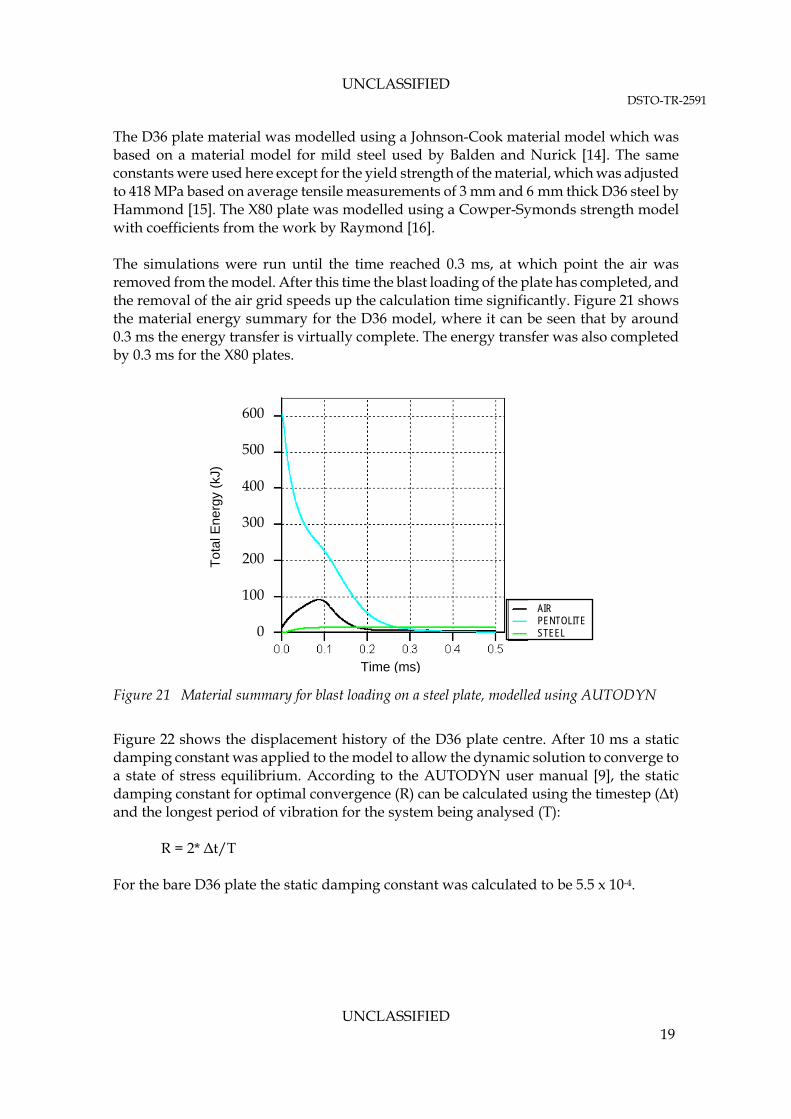
The D36 plate material was modelled using a Johnson-Cook material model which was based on a material model for mild steel used by Balden and Nurick [14]. The same constants were used here except for the yield strength of the material, which was adjusted to 418 MPa based on average tensile measurements of 3 mm and 6 mm thick D36 steel by Hammond [15]. The X80 plate was modelled using a Cowper-Symonds strength model with coefficients from the work by Raymond [16]. The simulations were run until the time reached 0.3 ms, at which point the air was removed from the model. After this time the blast loading of the plate has completed, and the removal of the air grid speeds up the calculation time significantly. Figure 21 shows the material energy summary for the D36 model, where it can be seen that by around 0.3 ms the energy transfer is virtually complete. The energy transfer was also completed by 0.3 ms for the X80 plates.
AIR PENTOLITE STEEL
400
300
200
100
0
Tot
al E
nerg
y (k
J)
Time (ms)
500
600
Figure 21 Material summary for blast loading on a steel plate, modelled using AUTODYN
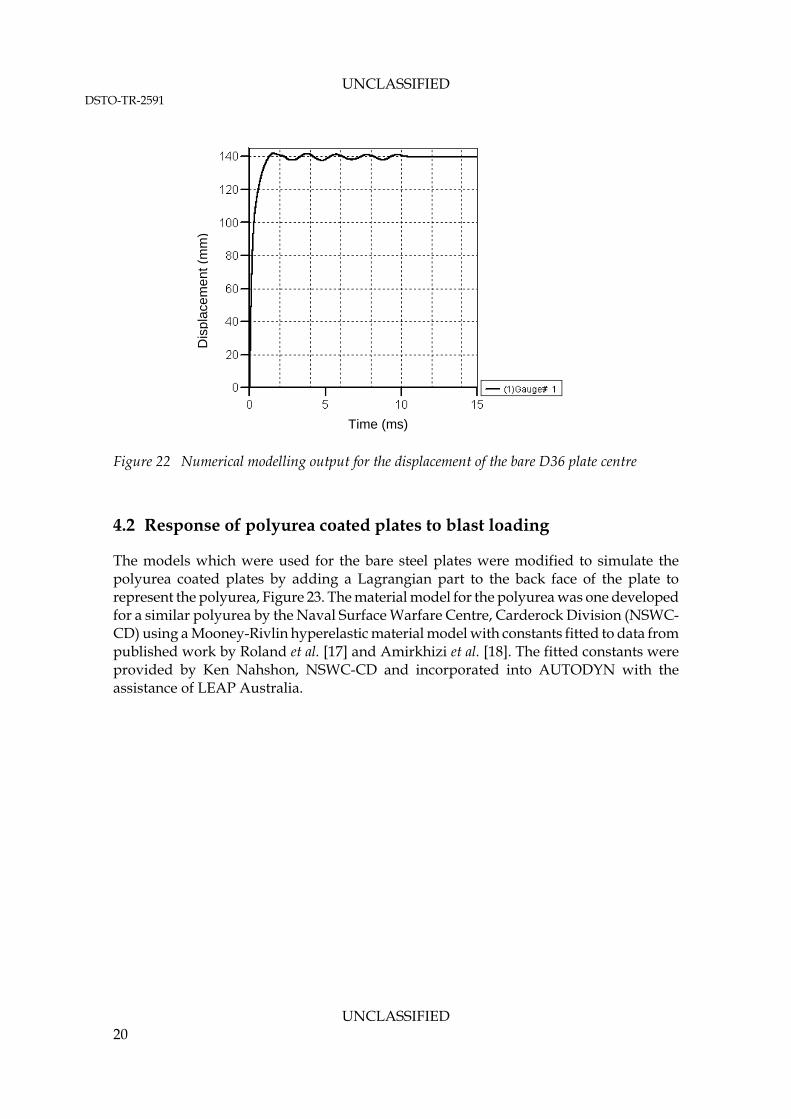
Figure 22 shows the displacement history of the D36 plate centre. After 10 ms a static damping constant was applied to the model to allow the dynamic solution to converge to a state of stress equilibrium. According to the AUTODYN user manual [9], the static damping constant for optimal convergence (R) can be calculated using the timestep (Δt) and the longest period of vibration for the system being analysed (T): R = 2* Δt/T For the bare D36 plate the static damping constant was calculated to be 5.5 x 10⁻⁴.
UNCLASSIFIED 19
UNCLASSIFIED DSTO-TR-2591
Dis
plac
emen
t (m
m)
Time (ms)
Figure 22 Numerical modelling output for the displacement of the bare D36 plate centre
4.2 Response of polyurea coated plates to blast loading
The models which were used for the bare steel plates were modified to simulate the polyurea coated plates by adding a Lagrangian part to the back face of the plate to represent the polyurea, Figure 23. The material model for the polyurea was one developed for a similar polyurea by the Naval Surface Warfare Centre, Carderock Division (NSWC-CD) using a Mooney-Rivlin hyperelastic material model with constants fitted to data from published work by Roland et al. [17] and Amirkhizi et al. [18]. The fitted constants were provided by Ken Nahshon, NSWC-CD and incorporated into AUTODYN with the assistance of LEAP Australia.
UNCLASSIFIED 20
UNCLASSIFIED DSTO-TR-2591
Flow out boundary
PENTOLITE
AIR
POLYUREA
STEEL 140
‐61.5
Symmetry plane Symmetry plane
Z
Y 410
X 410
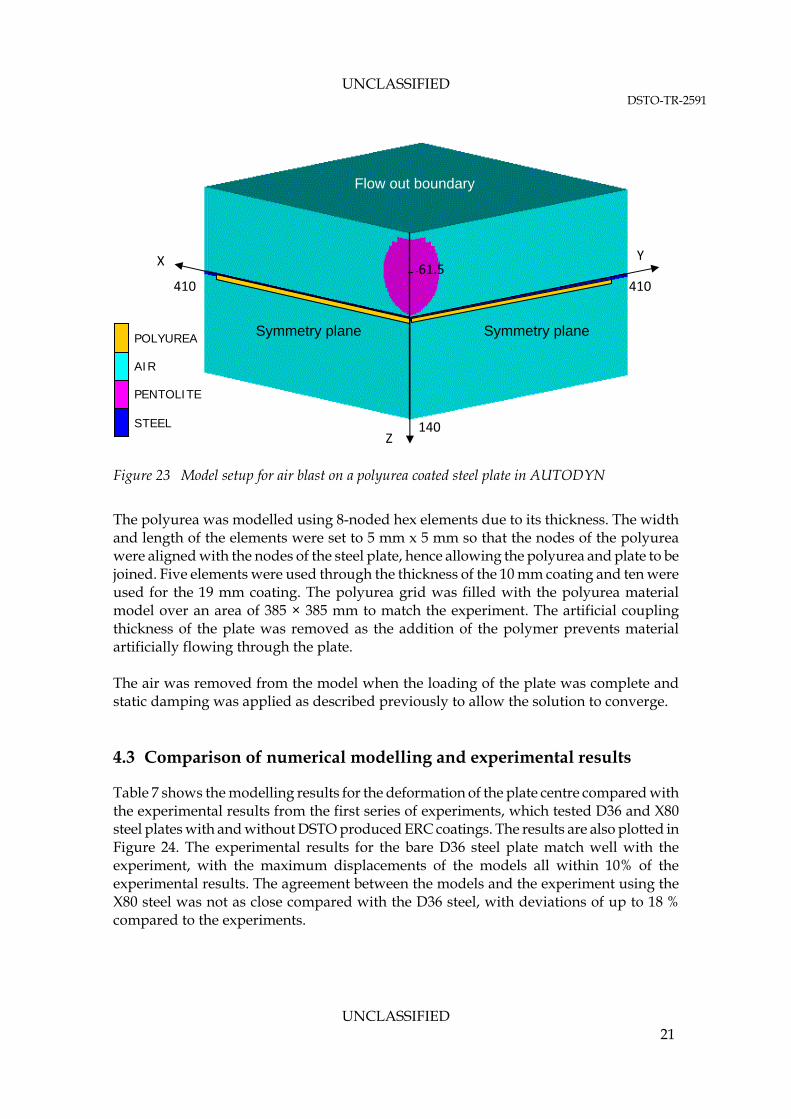
Figure 23 Model setup for air blast on a polyurea coated steel plate in AUTODYN
The polyurea was modelled using 8-noded hex elements due to its thickness. The width and length of the elements were set to 5 mm x 5 mm so that the nodes of the polyurea were aligned with the nodes of the steel plate, hence allowing the polyurea and plate to be joined. Five elements were used through the thickness of the 10 mm coating and ten were used for the 19 mm coating. The polyurea grid was filled with the polyurea material model over an area of 385 × 385 mm to match the experiment. The artificial coupling thickness of the plate was removed as the addition of the polymer prevents material artificially flowing through the plate. The air was removed from the model when the loading of the plate was complete and static damping was applied as described previously to allow the solution to converge. 4.3 Comparison of numerical modelling and experimental results
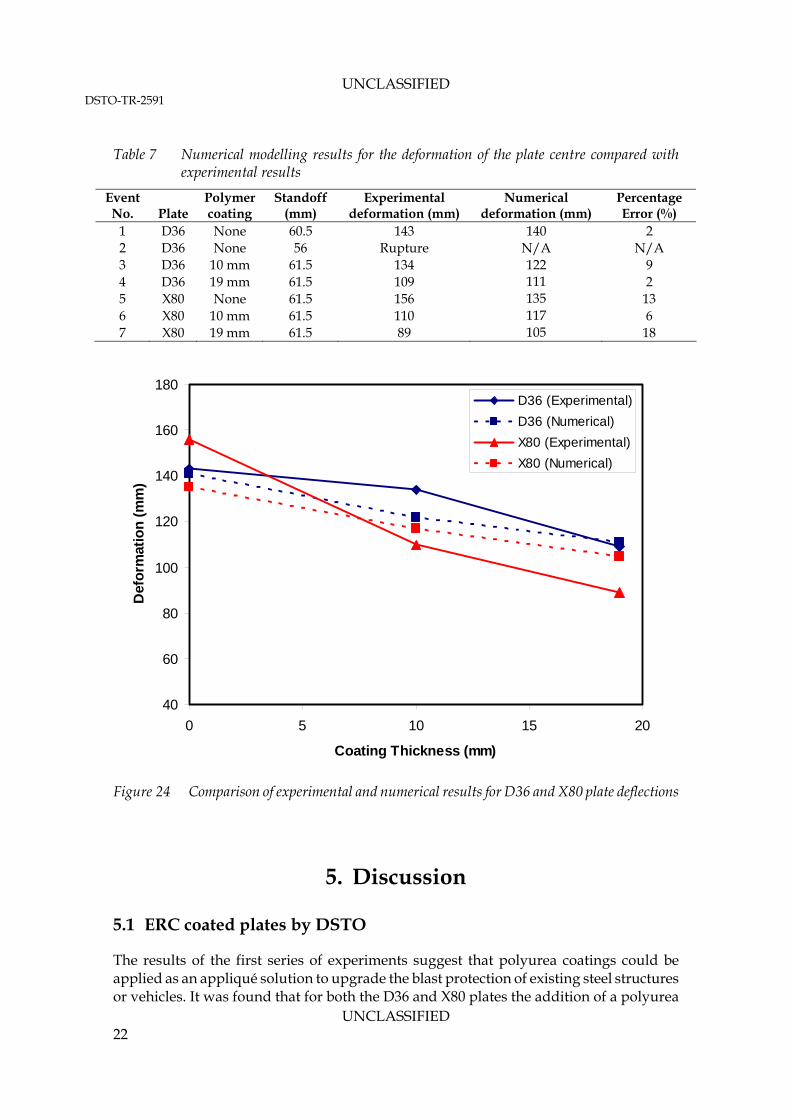
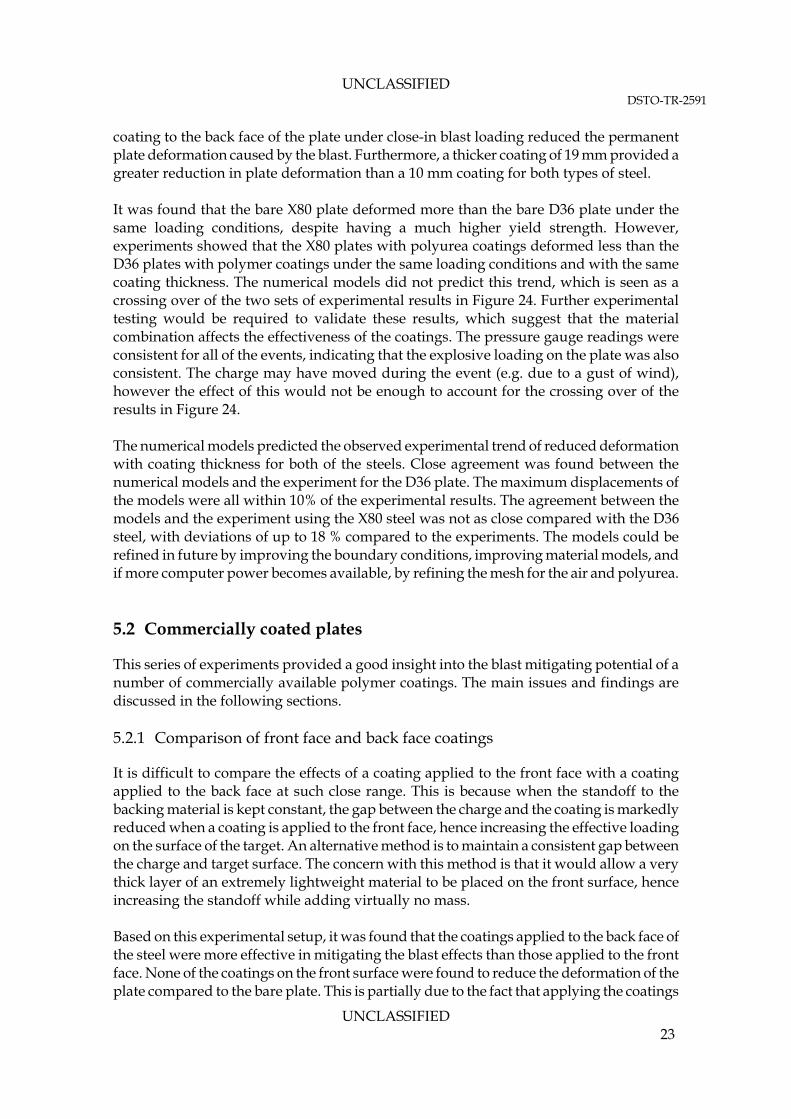
Table 7 shows the modelling results for the deformation of the plate centre compared with the experimental results from the first series of experiments, which tested D36 and X80 steel plates with and without DSTO produced ERC coatings. The results are also plotted in Figure 24. The experimental results for the bare D36 steel plate match well with the experiment, with the maximum displacements of the models all within 10% of the experimental results. The agreement between the models and the experiment using the X80 steel was not as close compared with the D36 steel, with deviations of up to 18 % compared to the experiments.
UNCLASSIFIED 21
UNCLASSIFIED DSTO-TR-2591
Table 7 Numerical modelling results for the deformation of the plate centre compared with
experimental results
Event No. Plate
Polymer coating
Standoff (mm)
Experimental deformation (mm)
Numerical deformation (mm)
Percentage Error (%)
1 D36 None 60.5 143 140 2 2 D36 None 56 Rupture N/A N/A 3 D36 10 mm 61.5 134 122 9 4 D36 19 mm 61.5 109 111 2 5 X80 None 61.5 156 135 13 6 X80 10 mm 61.5 110 117 6 7 X80 19 mm 61.5 89 105 18
40
60
80
100
120
140
160
180
0 5 10 15 20
Coating Thickness (mm)
Def
orm
atio
n (
mm
)
D36 (Experimental)
D36 (Numerical)
X80 (Experimental)
X80 (Numerical)
Figure 24 Comparison of experimental and numerical results for D36 and X80 plate deflections
5. Discussion
5.1 ERC coated plates by DSTO
UNCLASSIFIED
The results of the first series of experiments suggest that polyurea coatings could be applied as an appliqué solution to upgrade the blast protection of existing steel structures or vehicles. It was found that for both the D36 and X80 plates the addition of a polyurea
22
UNCLASSIFIED DSTO-TR-2591
coating to the back face of the plate under close-in blast loading reduced the permanent plate deformation caused by the blast. Furthermore, a thicker coating of 19 mm provided a greater reduction in plate deformation than a 10 mm coating for both types of steel. It was found that the bare X80 plate deformed more than the bare D36 plate under the same loading conditions, despite having a much higher yield strength. However, experiments showed that the X80 plates with polyurea coatings deformed less than the D36 plates with polymer coatings under the same loading conditions and with the same coating thickness. The numerical models did not predict this trend, which is seen as a crossing over of the two sets of experimental results in Figure 24. Further experimental testing would be required to validate these results, which suggest that the material combination affects the effectiveness of the coatings. The pressure gauge readings were consistent for all of the events, indicating that the explosive loading on the plate was also consistent. The charge may have moved during the event (e.g. due to a gust of wind), however the effect of this would not be enough to account for the crossing over of the results in Figure 24. The numerical models predicted the observed experimental trend of reduced deformation with coating thickness for both of the steels. Close agreement was found between the numerical models and the experiment for the D36 plate. The maximum displacements of the models were all within 10% of the experimental results. The agreement between the models and the experiment using the X80 steel was not as close compared with the D36 steel, with deviations of up to 18 % compared to the experiments. The models could be refined in future by improving the boundary conditions, improving material models, and if more computer power becomes available, by refining the mesh for the air and polyurea. 5.2 Commercially coated plates
This series of experiments provided a good insight into the blast mitigating potential of a number of commercially available polymer coatings. The main issues and findings are discussed in the following sections. 5.2.1 Comparison of front face and back face coatings
It is difficult to compare the effects of a coating applied to the front face with a coating applied to the back face at such close range. This is because when the standoff to the backing material is kept constant, the gap between the charge and the coating is markedly reduced when a coating is applied to the front face, hence increasing the effective loading on the surface of the target. An alternative method is to maintain a consistent gap between the charge and target surface. The concern with this method is that it would allow a very thick layer of an extremely lightweight material to be placed on the front surface, hence increasing the standoff while adding virtually no mass. Based on this experimental setup, it was found that the coatings applied to the back face of the steel were more effective in mitigating the blast effects than those applied to the front face. None of the coatings on the front surface were found to reduce the deformation of the plate compared to the bare plate. This is partially due to the fact that applying the coatings
UNCLASSIFIED 23
UNCLASSIFIED DSTO-TR-2591
to the front face caused the gap between the charge and the target surface to be reduced, as discussed previously. At larger distances, where this effect is negligible, a different result may be found. 5.2.2 Dynamic displacement measurements
The dynamic displacement for each of the events was measured using a wire system in which a data point was recorded as the plate centre made contact with each of the wires. The results are shown in Section 4.2, Figure 12. It should be noted that the setup used when the coating was applied to the back face did not record any results (because the coatings on the back face shattered during the event) hence only the dynamic displacement of the bare plates and plates with coatings on the front face are discussed here. The results of the displacement wire system produced a similarly shaped curve for each of the recordings. Each plate made contact with the first wire (50 mm from the plate surface) at around 0.2 ms after the detonation of the charge. However, the 690 MPa steel reached the next wire (61 mm from the plate surface) at a noticeably later time than the other plates. This result shows that the 690 MPa steel plate decelerated at a greater rate than the rest of the plates. This deceleration corresponds with the lower amount of permanent deformation of the 690 MPa steel plate compared to the grade 350 mild steel plates and the grade 350 steel plates with the coatings on the front face. Due to the lower deformation of the 690 MPa steel plate it contacted fewer wires and hence fewer data points were recorded. 5.2.3 Damage to coatings during transport
One of the coatings was found to have cracked and broken away from the steel backing during transport from the coating manufacturer to the test site. If such a coating were applied to a vehicle or maritime vessel, it may break and fall off during normal use. Despite the damage to this coating, it was found to reduce the plate deformation in this series of experiments by nearly 30% when applied to the back face which was similar to a result obtained for earlier testing of X80 steel with another polyurea. However further transport may damage the coating further and hence such a coating would need to have improved bonding before being suitable for operational use. 5.2.4 Effectiveness of 690 MPa steel
Blast testing of the 690 MPa bare steel plate resulted in similar deformation to the grade 350 steel plates with a polymer coating on the back face. The 690 MPa steel plate deformed 80 mm and the two grade 350 MPa steels with coating on the back deformed 82 mm and 87 mm. The thickness of the 690 MPa steel was 5 mm, whereas the grade 350 steel plates were 4 mm with 10 mm polyurea coatings. This leads to a similar areal density for the two configurations. Hence on a mass for mass basis, both solutions provide a similar level of close-in blast protection. The advantage of the polymer coating is that it can be applied as an appliqué to an existing structure, however a bare steel may be preferable during the design stages.
UNCLASSIFIED 24
UNCLASSIFIED DSTO-TR-2591
5.3 Recommendations for future work
A number of areas for further work may be considered in order to better understand the effect of polymer coatings on the deformation of steel plates under blast loading. Various polymer formulations were tested during these experiments; however it is recommended that a comprehensive study into polymer properties that contribute to enhanced blast protection should be conducted. This type of study could be conducted through modelling as well as experiments. During these experimental tests, failure of the polymer and steel were not considered. An investigation into whether the polymer coatings can prevent fracture of the steel, and the properties and optimum coating thickness to prevent plate fracture, may provide useful data.
6. Summary and conclusions
ERCs were found to enhance the blast resistance of steel plates when applied as an appliqué to the back face (the side opposite to the blast). Two thicknesses of polyurea coatings made in-house at DSTO, as well as a commercially available coating (Coating Type C), were applied to the back surfaces of steel plates and found to reduce the deformation of the plates under close-in blast loading compared to bare steel plates. Furthermore, the DSTO coating events showed that a thicker coating on the back face provided superior blast protection compared to a thinner coating on the back face. Three commercially available coatings (Coatings Type A, B and C) which were applied to the front surface of steel plates did not appear to enhance the blast protection of the system compared to bare steel plates. However, this result may have been different if the charge standoff was defined differently (see Figure 6). Uncoated 5 mm high strength 690 MPa steel plate resulted in similar deformation to the mild steel plates with coatings on the back face. Both configurations have a similar areal density. The polymer coating has the advantage that it can be applied as an appliqué to an existing structure; however high strength steel may be preferable for use during design stages. Numerical simulations of D36 and X80 steel plates, with and without DSTO produced polyurea coatings on the back face, showed good agreement with experiments for the plates which used D36 steel. These models resulted in maximum permanent deformations within 10% of experimental results. The correlation between the models and experiment was not as good for plates which used X80 steel, with up to 18% deviation from the experimental results. However, in both cases the modelling showed a reduction in deformation with coating thickness, which was consistent with the experimental results.
UNCLASSIFIED 25
UNCLASSIFIED DSTO-TR-2591
Suggested future work includes an investigation into whether the polymer coatings can prevent fracture of a steel backing, and the properties and optimum coating thickness to prevent excessive plate deformation and fracture.
7. Acknowledgements
The authors acknowledge the assistance provided by the coating manufacturers in coating and transporting test plates. The authors would like to thank the following DSTO staff for their contribution to the experimental work: Steve Pattie, Frank Griffo, Torie Pit, Darren Wiese, Frank Marian, Chris Townsend, Mike Buckland, Steve Cimpoeru, Chris Anderson, Jeff Heath, Stefan Danek, and Lindsay Wake. Thanks also to the staff at P&EE Graytown for their kind assistance in the conduction of experimental trials. Thanks as well to Roshdy Barsoum from the Office of Naval Research and Philip Dudt and Ken Nashon from the Naval Surface Warfare Centre, Carderock Division for their assistance with the polyurea material model. Also thanks to Luke Mosse from Leap Australia for his help with AUTODYN.
8. References
1. Davidson, J. S., et al. (2004) Explosive testing of polymer retrofit masonry walls. Journal of Performance of Constructed Facilities 18 (2), pp 100-106
2. Knox, K. J., et al. (2000) Polymer materials for structural retrofit. Force Protection Branch, Air Expeditionary Forces Technology Division, Air Force Research Laboratory, Tyndall AFB, Fla
3. Davidson, J. S., et al. (2005) Failure mechanisms of polymer-reinforced concrete masonry walls subjected to blast. Journal of Structural Engineering 131 (8), pp 1194-1205
4. Whitlock, C. (2008) Probe of USS Cole bombing unravels. In: Washington Post May 4 5. Amini, M. R., Isaacs, J. B. and Nemat-Nasser, S. (2006) 2006 SEM Annual Conference and
Exposition on Experimental Applied Mechanics, St. Louis, MO:June 4-7 6. Matthews, W. (2004) Services test spray-on vehicle armor. In: Army Times 3 May,
Vancouver, USA 7. Amini, M. R., Amirkhizi, A. V. and Nemat-Nasser, S. (2010) Numerical modeling of
response of monolithic and bilayer plates to impulsive loads. International Journal of Impact Engineering 37, pp 90-102
UNCLASSIFIED 26
UNCLASSIFIED DSTO-TR-2591
8. Amini, M. R., Isaacs, J. and Nemat-Nasser, S. (2010) Experimental investigation of response of monolithic and bilayer plates to impulsive loads. International Journal of Impact Engineering 37, pp 82-89
9. ANSYS AUTODYN x64 Beta (2008) Version 11.0.00 (build h). Century Dynamics Inc: CA, USA
10. Cannon, S., et al. (1999) Future technologies for the next naval surface combatant. Journal of the Australian Naval Institute 25 (2), pp 27-34
11. Phillips, R., et al. (2004) X80 grade steel for new generation RAN warships. In: Proceedings of the PACIFIC 2004 International Maritime Conference, Sydney: February
12. MIL-S-22698C (1988) Military Specification: Steel plate, shapes and bars, weldable ordinary strength and higher strength: structural
13. Cowler, M. S., et al. (2005) International Symposium of Structures under Impulsive Loading, Nagoya, Japan
14. Balden, V. H. and Nurick, G. N. (2005) Numerical simulation of the post-failure motion of steel plates subjected to blast loading. International Journal of Impact Engineering 32, pp 14-34
15. Hammond, L. (2000) The structural response of submerged air-backed plates to underwater explosions. Melbourne, Monash University
16. Raymond, I. K. (2001) Tools for the formulation of optimised X-80 steel blast tolerant transverse bulkheads. [Masters Thesis] Sydney, University of New South Wales
17. Roland, C. M., et al. (2007) High strain rate mechanical behavior of polyurea. Polymer 48, pp 574-578
18. Amirkhizi, A. V., et al. (2006) An experimentally-based viscoelastic constitutive model for polyurea, including pressure and temperature effects. Philosophical Magazine 86 (36), pp 5847-5866
UNCLASSIFIED 27
UNCLASSIFIED DSTO-TR-2591
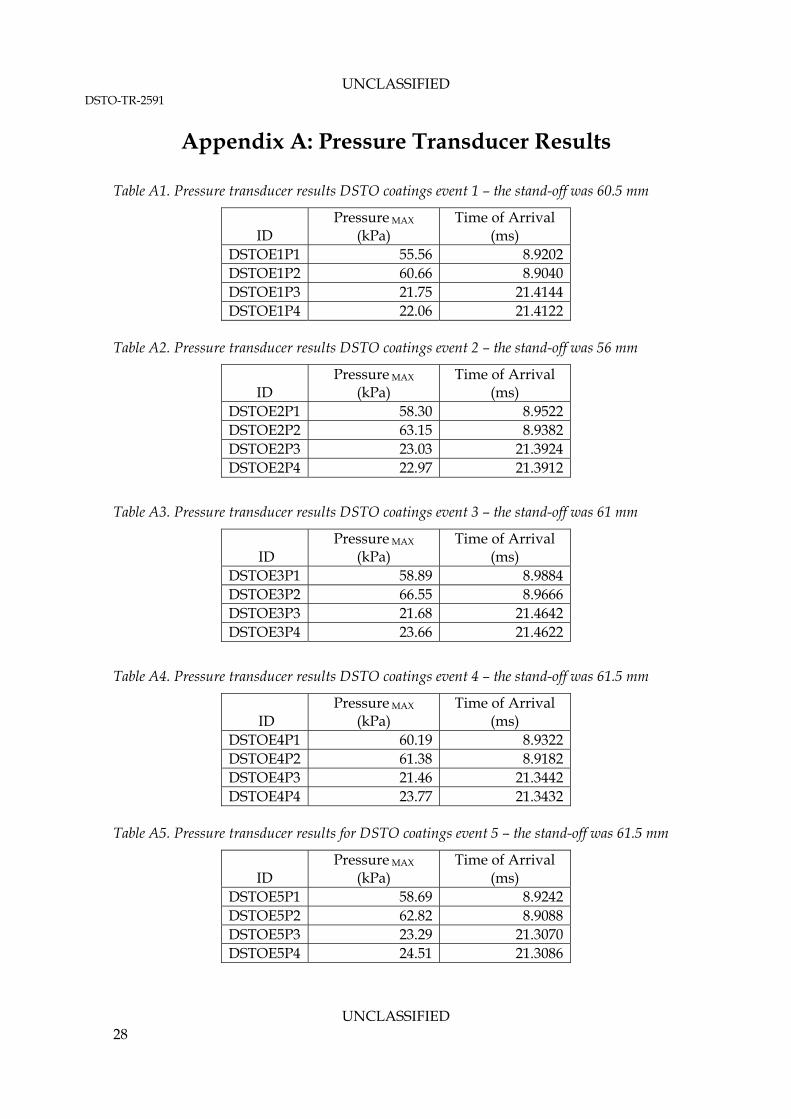
Appendix A: Pressure Transducer Results Table A1. Pressure transducer results DSTO coatings event 1 – the stand-off was 60.5 mm
ID Pressure MAX
(kPa) Time of Arrival
(ms) DSTOE1P1 55.56 8.9202 DSTOE1P2 60.66 8.9040 DSTOE1P3 21.75 21.4144 DSTOE1P4 22.06 21.4122
Table A2. Pressure transducer results DSTO coatings event 2 – the stand-off was 56 mm
ID Pressure MAX
(kPa) Time of Arrival
(ms) DSTOE2P1 58.30 8.9522 DSTOE2P2 63.15 8.9382 DSTOE2P3 23.03 21.3924 DSTOE2P4 22.97 21.3912
Table A3. Pressure transducer results DSTO coatings event 3 – the stand-off was 61 mm
ID Pressure MAX
(kPa) Time of Arrival
(ms) DSTOE3P1 58.89 8.9884 DSTOE3P2 66.55 8.9666 DSTOE3P3 21.68 21.4642 DSTOE3P4 23.66 21.4622
Table A4. Pressure transducer results DSTO coatings event 4 – the stand-off was 61.5 mm
ID Pressure MAX
(kPa) Time of Arrival
(ms) DSTOE4P1 60.19 8.9322 DSTOE4P2 61.38 8.9182 DSTOE4P3 21.46 21.3442 DSTOE4P4 23.77 21.3432
Table A5. Pressure transducer results for DSTO coatings event 5 – the stand-off was 61.5 mm
ID Pressure MAX
(kPa) Time of Arrival
(ms) DSTOE5P1 58.69 8.9242 DSTOE5P2 62.82 8.9088 DSTOE5P3 23.29 21.3070 DSTOE5P4 24.51 21.3086
UNCLASSIFIED 28
UNCLASSIFIED DSTO-TR-2591
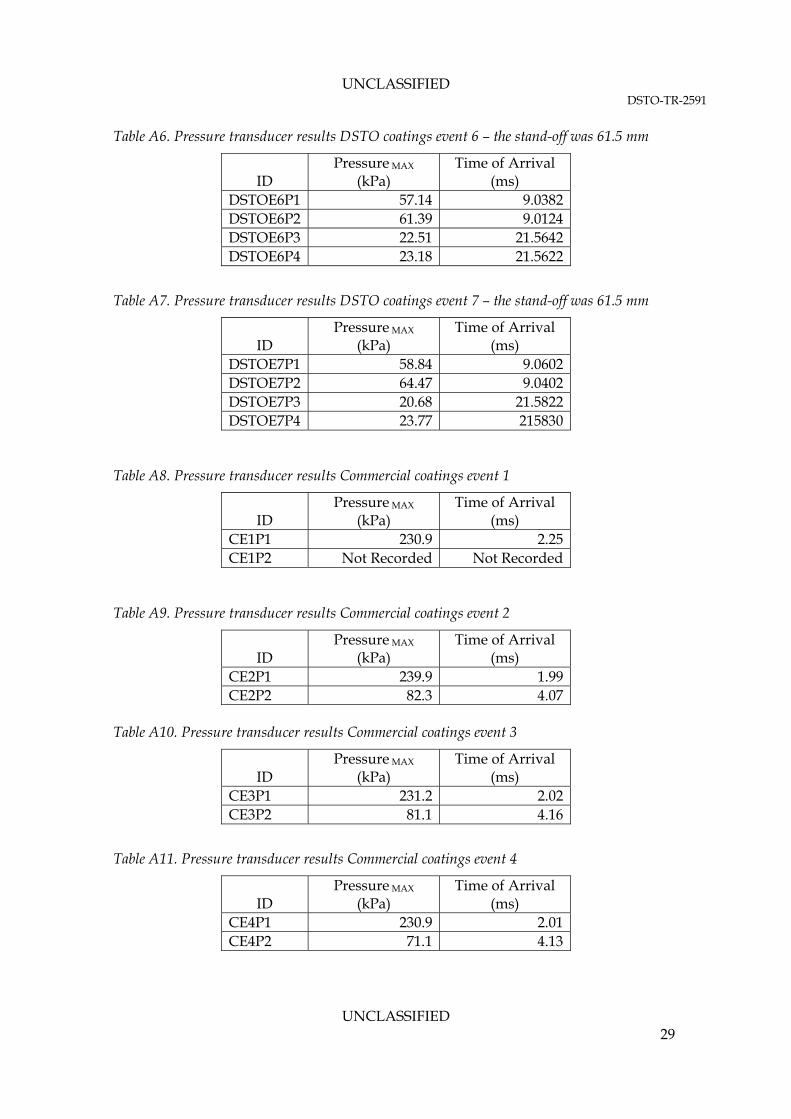
Table A6. Pressure transducer results DSTO coatings event 6 – the stand-off was 61.5 mm
ID Pressure MAX
(kPa) Time of Arrival
(ms) DSTOE6P1 57.14 9.0382 DSTOE6P2 61.39 9.0124 DSTOE6P3 22.51 21.5642 DSTOE6P4 23.18 21.5622
Table A7. Pressure transducer results DSTO coatings event 7 – the stand-off was 61.5 mm
ID Pressure MAX
(kPa) Time of Arrival
(ms) DSTOE7P1 58.84 9.0602 DSTOE7P2 64.47 9.0402 DSTOE7P3 20.68 21.5822 DSTOE7P4 23.77 215830
Table A8. Pressure transducer results Commercial coatings event 1
ID Pressure MAX
(kPa) Time of Arrival
(ms) CE1P1 230.9 2.25 CE1P2 Not Recorded Not Recorded
Table A9. Pressure transducer results Commercial coatings event 2
ID Pressure MAX
(kPa) Time of Arrival
(ms) CE2P1 239.9 1.99 CE2P2 82.3 4.07
Table A10. Pressure transducer results Commercial coatings event 3
ID Pressure MAX
(kPa) Time of Arrival
(ms) CE3P1 231.2 2.02 CE3P2 81.1 4.16
Table A11. Pressure transducer results Commercial coatings event 4
ID Pressure MAX
(kPa) Time of Arrival
(ms) CE4P1 230.9 2.01 CE4P2 71.1 4.13
UNCLASSIFIED 29
UNCLASSIFIED DSTO-TR-2591
UNCLASSIFIED 30
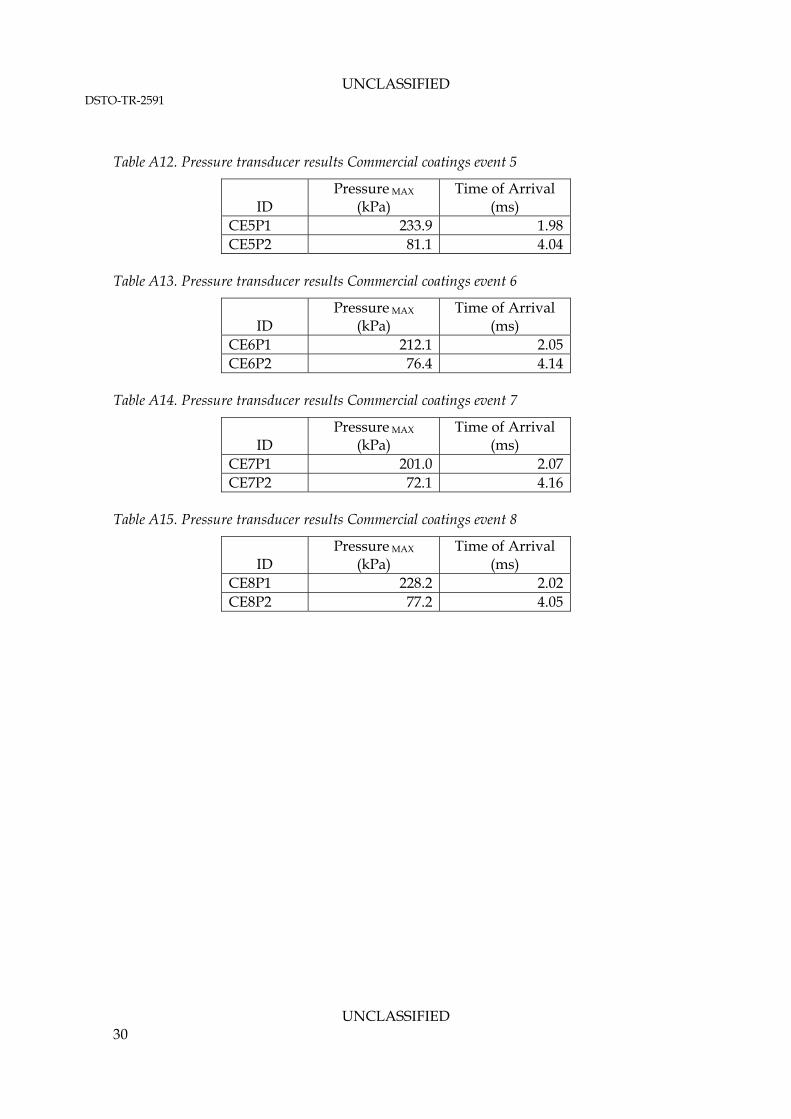
Table A12. Pressure transducer results Commercial coatings event 5
ID Pressure MAX
(kPa) Time of Arrival
(ms) CE5P1 233.9 1.98 CE5P2 81.1 4.04
Table A13. Pressure transducer results Commercial coatings event 6
ID Pressure MAX
(kPa) Time of Arrival
(ms) CE6P1 212.1 2.05 CE6P2 76.4 4.14
Table A14. Pressure transducer results Commercial coatings event 7
ID Pressure MAX
(kPa) Time of Arrival
(ms) CE7P1 201.0 2.07 CE7P2 72.1 4.16
Table A15. Pressure transducer results Commercial coatings event 8
ID Pressure MAX
(kPa) Time of Arrival
(ms) CE8P1 228.2 2.02 CE8P2 77.2 4.05
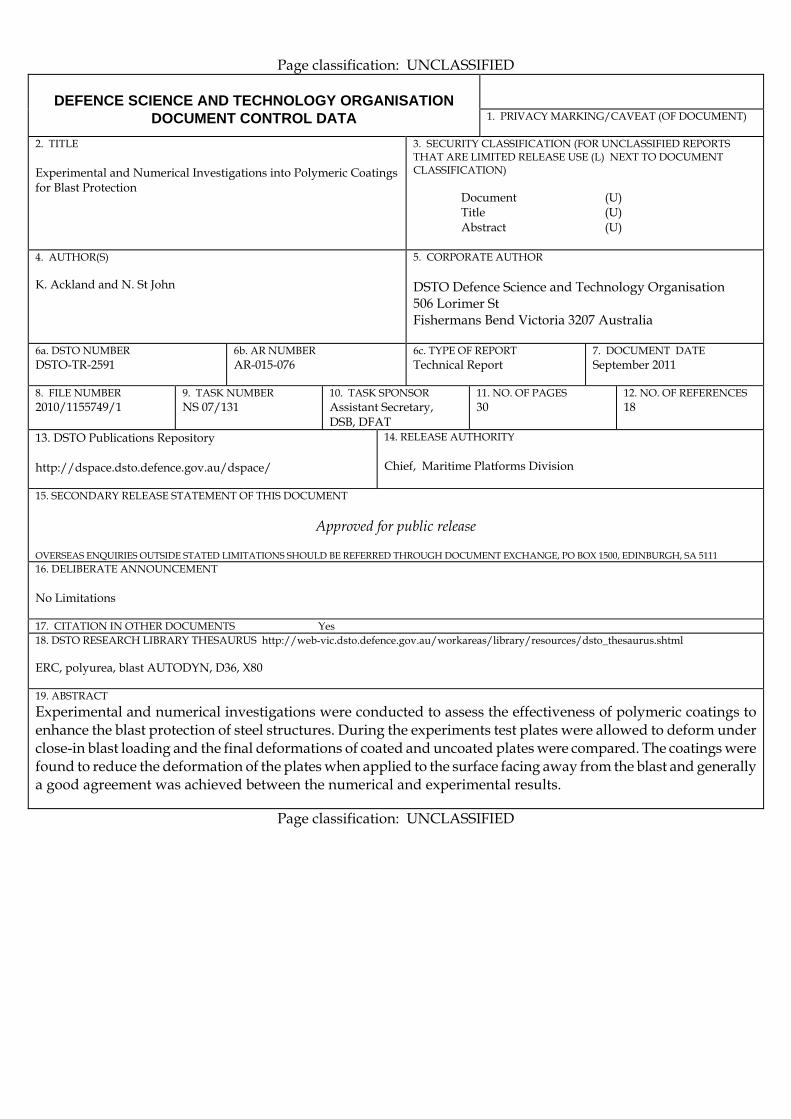
Page classification: UNCLASSIFIED
DEFENCE SCIENCE AND TECHNOLOGY ORGANISATION
DOCUMENT CONTROL DATA 1. PRIVACY MARKING/CAVEAT (OF DOCUMENT)
2. TITLE Experimental and Numerical Investigations into Polymeric Coatings for Blast Protection
3. SECURITY CLASSIFICATION (FOR UNCLASSIFIED REPORTS THAT ARE LIMITED RELEASE USE (L) NEXT TO DOCUMENT CLASSIFICATION) Document (U) Title (U) Abstract (U)
4. AUTHOR(S) K. Ackland and N. St John
5. CORPORATE AUTHOR DSTO Defence Science and Technology Organisation 506 Lorimer St Fishermans Bend Victoria 3207 Australia
6a. DSTO NUMBER DSTO-TR-2591
6b. AR NUMBER AR-015-076
6c. TYPE OF REPORT Technical Report
7. DOCUMENT DATE September 2011
8. FILE NUMBER 2010/1155749/1
9. TASK NUMBER NS 07/131
10. TASK SPONSOR Assistant Secretary, DSB, DFAT
11. NO. OF PAGES 30
12. NO. OF REFERENCES 18
13. DSTO Publications Repository http://dspace.dsto.defence.gov.au/dspace/
14. RELEASE AUTHORITY Chief, Maritime Platforms Division
15. SECONDARY RELEASE STATEMENT OF THIS DOCUMENT
Approved for public release OVERSEAS ENQUIRIES OUTSIDE STATED LIMITATIONS SHOULD BE REFERRED THROUGH DOCUMENT EXCHANGE, PO BOX 1500, EDINBURGH, SA 5111 16. DELIBERATE ANNOUNCEMENT No Limitations 17. CITATION IN OTHER DOCUMENTS Yes 18. DSTO RESEARCH LIBRARY THESAURUS http://web-vic.dsto.defence.gov.au/workareas/library/resources/dsto_thesaurus.shtml ERC, polyurea, blast AUTODYN, D36, X80 19. ABSTRACT
Experimental and numerical investigations were conducted to assess the effectiveness of polymeric coatings to enhance the blast protection of steel structures. During the experiments test plates were allowed to deform under close-in blast loading and the final deformations of coated and uncoated plates were compared. The coatings were found to reduce the deformation of the plates when applied to the surface facing away from the blast and generally a good agreement was achieved between the numerical and experimental results.
Page classification: UNCLASSIFIED