experimental evidence for the co-evolution of hominin tool
TRANSCRIPT

1
2
3
Experimental Evidence for the Co-Evolution of Hominin Tool-Making4
Teaching and Language5
6
T.J.H. Morgana,b, N. T. Uominic*, L.E. Rendella, L. Chouinard-Thulya,d, S. E. Streeta,e, H.7
M. Lewisa,f, C. P. Crossa,e, C. Evansa, R. Kearneya, I. De la Torreg, A. Whitene, K.N.8
Lalanda*9
10
a Centre for Social Learning and Cognitive Evolution, School of Biology, University of St11Andrews, Fife, KY16 9AJ, U.K.12b Department of Psychology, University of California, Berkeley, 94720, United States13c Department of Archaeology, Classics & Egyptology, University of Liverpool, L69 3BX,14U.K.15c Department of Linguistics and Department of Primatology, Max-Planck Institute for16Evolutionary Anthropology, Leipzig17d Department of Biology, McGill University, H3A 1B1, Canada18e Centre for Social Learning and Cognitive Evolution, School of Psychology &19Neuroscience, University of St Andrews, Fife, KY16, 9JP, U.K.20f Department of Anthropology, University College London, WC1E 6BT, U.K.21g Institute of Archaeology, University College London, WC1H 0PY, U.K.22
23
* Correspondence:24
K. N. Laland: [email protected], 01334 46356825N. T. Uomini: [email protected], 01517 94578726
27
Keywords: tool-use || human evolution || social transmission || language evolution28

Abstract29
Hominin reliance on Oldowan stone tools – which appear from 2.5mya and are30
believed to have been socially transmitted – has been hypothesised to have led to the31
evolution of teaching and language. Here we present an experiment investigating the32
efficacy of transmission of Oldowan tool-making skills along chains of adult human33
participants (N=184) using 5 different transmission mechanisms. Across six34
measures, transmission improves with teaching, and particularly with language, but35
not with imitation or emulation. Our results support the hypothesis that hominin36
reliance on stone tool-making generated selection for teaching and language and37
imply that (i) low-fidelity social transmission, such as imitation/emulation, may have38
contributed to the ~700,000 year stasis of the Oldowan technocomplex, and (ii)39
teaching or proto-language may have been pre-requisites for the appearance of40
Acheulean technology. This work supports a gradual evolution of language, with41
simple symbolic communication preceding behavioural modernity by hundreds of42
thousands of years.43

From 2.5 million years ago, early hominins were skilled stone knappers, capable of44
producing more than 70 sharp flakes from a single cobble core by striking it with a45
hammerstone (termed the Oldowan technocomplex1–3; Figure 1a, Supplementary Note46
1). Existing remains show systematic flake detachment, maintenance of flaking angles47
and repair of damaged cores4. This complexity, along with present-day tool-making48
experiments5, implies that Oldowan technology was learned and required considerable49
practice1,6. Furthermore, the technology’s continual existence and wide geographic50
spread, along with hints of regional traditions3,7 indicate that it was socially transmitted,51
although the underlying psychological mechanisms remain poorly understood8.52
Whether Oldowan stone tool making has implications for the evolution of human53
language and teaching (defined as active information donation9) is debated10,11. Positions54
range from the view that Oldowan tool making indicates a major development in hominin55
cognition8, such as teaching or language12, to the hypothesis that chimpanzee-like56
emulation or imitation (reproducing the object manipulations or motor patterns of others,57
respectively) is sufficient to transmit knapping technology13. Accordingly, accounts of the58
evolution of language range from a gradual emergence beginning 2mya14,15, to a59
relatively sudden appearance 50-100kya16. However, a difficulty with positing complex60
Oldowan communication, is the apparent stasis in Oldowan technology for more than61
700,000 years until Acheulean tools appear ~1.7mya17,18. The absence of clear cultural62
change during this window seems inconsistent with the presence of language, and63
remains an outstanding mystery more generally19.64
Across disciplines, researchers are increasingly turning to gene-culture co-65
evolutionary accounts to explain the evolution of human cognitive abilities, including66

teaching and language10,13,20–31. Central to such hypotheses is the idea that cultural traits67
can both shape, and be shaped by, genetic evolution, and a number of examples of gene-68
culture co-evolution are now known from human evolution26–30. Hominin stone tool69
manufacture is a particularly interesting candidate case as the appearance of such70
technology 2.5mya - at the dawn of Homo - and its continued deployment for millions of71
years, means it could have played a protracted role in human evolution. Furthermore, due72
to the challenging ecological niche that early hominins occupied20,32 and the difficulty of73
acquiring tool-making skills6, fitness benefits were likely associated with the ability to74
make and deploy effective cutting tools32 as well as the ability to rapidly transmit the75
skills33, and so a co-evolutionary relationship between tool making and cognition,76
specifically teaching and language, would seem plausible. Accordingly, Oldowan stone77
tool production could have generated selection for more complex forms of social78
transmission that enhanced the fidelity of information transmission. This could have79
resulted in a form of social transmission sufficient to transmit Acheulean technology80
reliably, and which would then generate selection for further increases in the complexity81
of social transmission, and so on. If this hypothesis is correct, changes in hominin82
cognition, including those underlying the appearance of Acheulean technology, could83
have depended upon selection generated by a reliance on Oldowan technology. In support84
of this hypothesis, archaeological remains show that changes to hominin morphology,85
including increased overall brain size, follow the advent of Oldowan tool making3. Other86
recent work has linked the cultural evolution of technologies to the capacity for high-87
fidelity social transmission9,33–35. However, hitherto such studies have either been88
theoretical or limited to somewhat artificial and abstract tasks. Accordingly, whether89

hominin lithic technology and social transmission genuinely represents a case of gene-90
culture co-evolution is currently unclear.91
Experiments with contemporary humans have provided insights into the cognitive92
and motor processes supporting lithic technology23,24, and could also establish which93
mechanisms support its transmission. However, research on the social transmission of94
tool making is very limited. For instance, a review of Acheulean tool-making found that95
reduction strategies were highly consistent across individuals36. The authors suggest “true96
imitation” (i.e. reproducing the motor pattern of another individual through observational97
learning) is the minimal form of social transmission that could produce such98
consistency36. Furthermore, an unpublished experimental study found that “demonstrative99
gestures” were sufficient for the co-operative procurement and initial reduction of100
bedrock slabs37. Only two studies have directly investigated the ability of contemporary101
adult humans to make tools following different means of social transmission, both102
comparing the efficacy of speech with symbolic gestural communication. One103
investigated the acquisition of Levallois technology38 (a complex technology prevalent104
from 300-30kya) and reported no differences between the conditions. However, the105
measure of performance was a binary (yes/no) assessment by the experimenter, leaving106
the possibility that more subtle differences existed but were undetected. The second107
investigated bifacial knapping39 (a technique associated with Acheulean technology).108
Whilst the tools produced in both conditions showed similar shape, symmetry and109
quality, the two groups used different techniques, with verbally taught participants more110
accurately replicating the technique of the instructor (even though they lacked the skill to111
enact it effectively)39. As verbal and gestural communication are both symbolic forms of112

communication, further differences may yet emerge if a wider range of social113
transmission mechanisms, including imitation, emulation, and subtle forms of pedagogy,114
are considered. This is particularly relevant to the manufacture of Oldowan technology,115
where the debate over the underlying transmission mechanisms is at its fiercest.116
Here we present a large-scale experimental study testing the capability of five117
social learning mechanisms to transmit Oldowan stone knapping techniques across118
multiple transmission events. By establishing the relative rates of transmission resulting119
from different means of communication, we aimed to provide insights into which forms120
of communication might have been selected for as a result of reliance on tool use. The121
mechanisms investigated are summarised as (i) reverse engineering, (ii)122
imitation/emulation, (iii) basic teaching, (iv) gestural teaching and (v) verbal teaching123
(Figure 1b-f). In total, 184 participants took part, producing over 6000 pieces of flint,124
each of which was weighed, measured and assessed for quality using a novel metric that125
we developed and verified. We find that, across six measures, performance increases with126
teaching and, particularly, language. However, there is little evidence that127
imitation/emulation enhances transmission. Our findings support a gene-culture co-128
evolutionary account human evolution in which reliance on Oldowan tools would have129
generated selection favouring teaching and, ultimately, language. We suggest that130
Oldowan cultural evolution was limited, in part, by low-fidelity social transmission131
mechanisms. The appearance of Acheulean tools indicates the evolution of higher-fidelity132
social transmission, with teaching and/or some basic form of symbolic communication as133
plausible candidates. Accordingly, this work supports an early origin for language.134
135

Results136
Performance across conditions. Across numerous measures of individual performance137
we consistently found that teaching and language, but not imitation or emulation,138
enhanced the acquisition of stone knapping skills relative to reverse engineering (see139
Table 1). For instance, total flake quality only showed clear improvement with gestural140
or verbal teaching (Figure 2a), with language nearly doubling performance relative to141
reverse engineering, and also improving performance relative to imitation/emulation and142
basic teaching. The number of viable flakes produced shows a similar pattern (Figure143
2b), with substantial increases relative to reverse engineering requiring gestural or verbal144
teaching. Moreover, unlike all forms of teaching, imitation/emulation did not increase the145
proportion of flakes that were viable (Figure 2c). Neither was there evidence for an146
increase in the rate of manufacture of viable flakes with imitation/emulation; only verbal147
teaching was clearly associated with an increase (Figure 2d). Similarly, only verbal148
teaching led to a clear increase (>30%) in the volume of core reduced (Figure 2e).149
Finally, whilst there was no evidence that imitation/emulation increased the probability of150
a viable flake per hit, gestural teaching doubled and verbal teaching quadrupled this151
probability (Figure 2f). Across the six measures there is strong evidence that verbal152
teaching increases performance relative to gestural teaching. Thus, teaching, but153
particularly verbal teaching, greatly facilitated the rapid transmission of flaking, whilst154
there is little evidence that imitation/emulation did so.155
156
Performance along chains. In all conditions, as expected, performance decreased along157
chains relative to the trained experimenter as information was lost. However, with158

teaching, transmission was sufficiently improved that performance declined steadily159
along chains, whereas without teaching, the drop in performance along chains was so160
severe that performance immediately fell to floor levels (i.e., the minimal level of161
performance we observed, likely representing participants’ intuitive understanding of162
stone knapping). For instance, with verbal teaching, the probability that each hit produced163
a viable flake (Figure 2g), the number of viable flakes produced, and the proportion of164
flakes that were viable (Figure 2h) all decreased steadily along chains, approaching the165
baseline performance observed with reverse engineering and imitation/emulation (see166
Table 2). Analyses of the utterances by participants in the verbal teaching condition167
showed that both the total number of utterances spoken and the proportion of teaching-168
related utterances that were correct also decreased along the chain (Figure 2i). The rate169
of decline varied with topic, with knowledge of both the exterior platform angle and170
force-carrying ridges rapidly lost, but information concerning the platform edge being171
preserved for longer and with greater accuracy.172
173
For a full listing of all model estimates see Supplementary Tables 1-6.174
175
Discussion176
The central finding of this work is that the social transmission of Oldowan technology is177
enhanced by teaching, and in particular, by language. This is in line with a gene-culture178
co-evolutionary account of human evolution and supports the hypothesis that Oldowan179
stone tool manufacture generated selection favouring increasingly complex teaching and180

language13,24,40. Although the learning period in this experiment (at five mintues long) is181
clearly unrealistically short compared to the length of time that Oldowan hominins likely182
had available to learn, particularly given available data showing that precise control of183
conchoidal fracture can take decades to acquire41 and anthropological data showing that184
knapping skills are acquired across an apprenticeship lasting several years42, a short185
learning period is sufficient to examine the relative rates of transmission, which is the186
focus of this work. As such, we cannot rule out the possibility that with a longer learning187
period, performance across conditions would have converged. However, given that188
knapping skills are known to take years to develop fully6,41, we suspect that increasing189
the time spent learning would initially only increase the differences in performance190
across conditions, with any convergence only occurring after extensive learning. Given191
their magnitude, the observed differences in performance between conditions would192
likely translate into significant fitness differences in the shorter term. Key to our findings’193
support of a gene-culture co-evolutionary account of human technology and cognition is194
the continuous improvement in the rate of transmission observed with increasingly195
complex forms of communication. For example, if verbal teaching provided transmission196
benefits, but simpler forms of teaching did not, then the co-evolutionary process would197
not be able to account for the evolution of these simpler forms of teaching. Likewise, if198
the transmission of tool technology benefitted from simple teaching, but gained no199
further benefit from verbal teaching, then the co-evolutionary process would stop with200
simpler forms of teaching and could not explain the evolution of verbal teaching.201
Accordingly, our data imply that Oldowan tool-making would have created a202
continuous selective gradient leading from observational learning to much more complex203

verbal teaching. This process need not have taken place entirely within the Oldowan, but204
was probably already underway during the Oldowan and likely continued well after, as205
Oldowan tools continued to be made for hundreds of thousands of years beyond the206
Oldowan time period. Furthermore, assuming that the transmission of more complex207
technologies also benefits from more complex means of communication, later208
technologies would have reinforced the gene-culture co-evolutionary dynamic. Such a209
process could have lasted for millions of years (and may be ongoing29), with more210
complex communication allowing the stable and rapid transmission of increasingly211
complex technologies, which in turn generate selection for even more complex212
communication and cognition, and so forth. Whilst this places little necessary constraint213
on when teaching and language may have evolved, our central contribution is to provide214
evidence that Oldowan tools, produced by hominins since at least 2.5my, were involved215
in this dynamic.216
A second significant finding of this work is that the rate of transmission of217
Oldowan tool making is, at best, minimally enhanced by the addition of218
imitation/emulation relative to reverse engineering. That the low level of performance219
with imitation/emulation and reverse engineering is stable along chains (and that220
performance with teaching and language collapses to this level) suggests a baseline level221
of performance reliant on little transmitted knowledge, and which could well be achieved222
through intuition and individual trial-and-error learning. We suggest that the rapid decline223
of performance with teaching and language to this baseline merely reflects the short224
learning time employed in this study. Previous transmission chain studies have225
established that periods of individual practice can bolster the stability of socially226

transmitted knowledge43. This suggests that with more time to learn, with bouts of227
teaching and language integrated with periods of individual practice, the benefits of228
teaching and language would likely have been preserved for longer. Likewise, a benefit229
of observational learning relative to reverse engineering may well appear over a longer230
learning period. However, our data suggest that any such benefit is likely to be less than231
the benefit that would be derived through teaching across a similar timespan due to the232
improved rate of transmission with teaching. Accordingly, while we do not suggest that233
imitation is insufficient to transmit the technology per se, our findings supports other234
recent work in implying that observation alone is an inefficient means to acquire stone235
tool making skills23,44,45.236
Limited information concerning tool manufacture can, no doubt, be rapidly237
acquired through imitation or emulation, for instance, the basics of core, hammerstone or238
flake selection36, the requirement to strike the core with the hammerstone, and some idea239
of the force required. However, it seems plausible that the rapid striking action associated240
with tool manufacture hinders the transmission of the more subtle information crucial to241
knapping, such as details of the point of percussion or the platform edge and angle,242
through observation alone. It is here that teaching (e.g. slowing down the striking action,243
pointing to appropriate targets, demonstrating core rotation, manual shaping of pupil's244
grasp) and verbal instruction likely provide immediate benefits to the pupil. Indeed,245
transcripts from the verbal teaching condition show that abstract knapping concepts, such246
as the platform angle, were transmitted between individuals in the verbal teaching247
condition (see Supplementary Figure 3). It may well be the capacity for arbitrary labels248
such as “platform angle” that facilitates transmission with verbal teaching; such labels249

break the task into constituent parts, can be used to identify the important elements and250
provide a clear framework with which pupils can go on to teach others. Language not251
only allows transmission of the skill itself, but also the ability to transmit the skill to252
others effectively.253
Thirdly, our findings have implications for one of the most enduring puzzles of254
human evolution; the apparent stasis of the Oldowan technocomplex, which lasted255
700,000 years8,11,19,45. Our experiment suggests that Oldowan technological change could256
have been restricted by low-fidelity forms of social transmission that prevented the257
spread of innovations. This suggestion is supported by the slow spread of Oldowan258
technology across Africa which indicates that this technology was difficult for Oldowan259
hominins to transmit3. Furthermore, the acquisition of Oldowan knapping skills is not260
trivial even for modern humans, as shown by our finding that the benefits of teaching and261
language were rapidly lost in transmission. Whilst we cannot conclusively identify what262
form Oldowan transmission might have taken, our data indicate imitation or emulation as263
likely candidates. In naturalistic contexts, the relatively poor transmission that we264
observed with imitation and emulation could well be too slow and imprecise for265
innovations to be transmitted reliably, leaving the technology unable to increase in266
complexity until more effective communication had evolved.267
The suggestion that low-fidelity social transmission is a limiting factor on268
technological development might contribute to an understanding of why human culture is269
so complex compared to the behavioural traditions of non-human animals46,47. Whilst270
human social transmission has allowed the cumulative elaboration of a vast number of271
technologies and behaviours, non-human animal social transmission has not. It seems272

possible that this is because non-human animal social transmission, which appears to be273
largely limited to forms of observational learning less sophisticated than those of274
humans43, lacks the fidelity required to transmit more complex innovations, thus275
constraining cumulative cultural evolution34,35,48. Even the modest knapping ability of276
extensively trained bonobos49,50 may rely on their prior training in symbolic277
communication51. Whilst it is plausible that a similar co-evolutionary process has278
operated to a lesser degree in some other species, such as other apes52, it remains an open279
question as to why their tool use did not generate selection for the higher-fidelity social280
transmission (teaching, language) observed in humans. One possibility is that the281
technologies of other apes are either sufficiently simple that they can be acquired through282
more basic mechanisms or so hard to acquire that they can only rarely be transmitted283
successfully, removing the benefit to teaching9. Task difficulty might also explain a284
previous experimental finding that simple transmission mechanisms were sufficient for285
cumulative cultural evolution in the context of human paper-plane design53; this task may286
be sufficiently simple that teaching is of little benefit. Alternatively, ape reliance on tool287
use could be insufficient for the benefits of tool-use to outweigh the costs of complex288
social transmission, thus preventing teaching from increasing fitness9. Any of these289
constraints would undermine selection for higher-fidelity social transmission, hindering290
the co-evolutionary process.291
Given that our findings support a co-evolution of Oldowan tool use and complex292
communication, it might seem puzzling that the Oldowan stasis should last so long. If293
the selective advantage was present, why did more complex communication not evolve294
for 700,000 years? A likely explanation is that more complex communication may well295

have evolved during the Oldowan, but that this alone was insufficient for the evolution of296
stone tool technology. The appearance of Acheulean tools may have additionally been297
contingent on the evolution of other aspects of cognition, such as technical298
comprehension or the hierarchical planning of actions54–56, as well as demographic and299
socio-ecological factors57,58. Accordingly, the extraordinary length of the Oldowan stasis300
could indicate that a large number of limiting factors needed to be overcome before301
innovations could appear and spread.302
Given this, our findings imply that the appearance of Acheulean tools 1.7mya17,18303
reflects, in part, the evolution of mechanisms of transmission that facilitated the more304
effective transmission of Oldowan tools, but also enabled the reliable transmission of the305
sub-goals and techniques required to make the distinctive and regularly-shaped306
Acheulean tools59. We cannot specify the form of this transmission with precision.307
However, given the observation that chimpanzees are capable of some form of308
observational learning, yet cannot produce stone tools approaching the quality of the309
earliest known Oldowan examples13, combined with the complexity of Acheulean310
technology36, we suggest that teaching in the form of facilitated observation (similar to311
our basic teaching condition) is the minimal plausible form of social transmission for312
Acheulean hominins and that rudimentary forms of language are a possibility. However,313
whilst our findings suggest that Oldowan hominins would have benefitted from modern314
language, the suggestion that modern language evolved during the Oldowan seems315
unlikely given how slowly technology evolved thereafter. This leaves open the possibility316
that the transmission of Acheulean technology was reliant on a form of (gestural or317
verbal) proto-language12,60,61. This need not imply that Acheulean hominins were capable318

of manipulating a large number of symbols or generating complex grammars. Our319
findings imply that simple forms of positive or negative reinforcement, or directing the320
attention of a learner to specific points (as was common in the gestural teaching321
condition), are considerably more successful in transmitting stone knapping than322
observation alone. This is supported by existing theoretical work that suggests positive323
and negative feedback greatly enhances the rate of transmission33. Whether or not simple324
symbolic communication was present during the Acheulean, we anticipate that the gene-325
culture co-evolutionary dynamic between tools and communication was, and that it326
would continue beyond the Acheulean, generating selection favouring the use of symbols327
for increasingly subtle and abstract concepts, and contributing to the eventual evolution328
of modern language capabilities.329
In sum, our data support the hypothesis that a gene-culture co-evolutionary330
dynamic between tool use and social transmission was on-going in human evolution,331
starting at least 2.5mya and potentially continuing to the present. The simplicity and332
stasis of Oldowan technology is indicative of a limited form of social transmission, such333
as observational learning, that only allowed the transmission of the broadest concepts of334
stone knapping technology. Whatever its nature, this was sufficient to support limited335
transmission amongst individuals with prolonged contact, but insufficient to propagate336
innovations more rapidly than they were lost, and would have contributed to the stasis in337
the Oldowan technocomplex. However, hominin reliance on stone technology would338
have generated selection for increasingly complex communication that allowed the more339
effective spread of stone-tools. Under this continued selection, teaching, symbolic340
communication and eventually verbal language may have been favoured, allowing the341

ready transmission of abstract flaking concepts, such as the role of the exterior platform342
angle in choosing where to strike38, which our findings show are effectively transmitted343
by language. Given the increased complexity of the later Acheulean and Mousterian lithic344
technologies, with their reliance on "long sequences of hierarchically organised345
actions"36,38 and other abstract concepts, our results imply that hominins possessed a346
capacity for teaching - and potentially simple proto-language - as early as 1.7mya.347
348
Methods349
Participants and materials. 184 participants took part in the study. This sample size was350
chosen based on effect sizes observed in previous transmission chain studies. Participants351
were students at the University of St Andrews recruited through the University’s352
experimental sign-up system. Across the experiment we used 2 tonnes of Brandon flint353
from Norfolk, UK, broken up into cores of roughly 1kg. We also used 100 granite354
hammerstones collected from the coastline near Stonehaven, Scotland.355
356
Experimental design. Adult human participants (N=184) first learned, were tested on357
their ability, and then helped others to learn, to knap stone flakes using a granite358
hammerstone and flint core, across five cumulatively complex transmission conditions359
(see Figure 1 b-f): (1) Reverse Engineering; pupils were provided with a core and360
hammerstone for practice, but saw only the flakes manufactured by their tutor and not361
their tutor themselves; (2) Imitation/Emulation; in addition to having their own core and362
hammerstone, pupils also observed their tutor making flakes, but could not interact with363
them; (3) Basic Teaching; in addition to demonstrating tool production, tutors could also364

manually shape the pupil’s grasp of their hammerstone or core, slow their own actions,365
and reorient themselves to allow the pupil a clear view (this condition replicates teaching366
reported in non-human primates62); (4) Gestural teaching; tutors and pupils could also367
interact using any gestures, but no vocalisations; and (5) Verbal Teaching; tutors and368
pupils were also permitted to speak. Participants were assigned to conditions at random369
and blinding was not possible. The test given to participants to assess their ability was to370
make as many good-quality flakes as possible from a single core. This reflected pressures371
on hominin knappers to make the most of the limited availability of high quality372
knapping materials.373
Participants were arranged into transmission chains63 in which information was374
passed along chains of participants, with each participant learning from the previous375
participant and acting as tutor to the next participant. For each condition we carried out376
four short chains (≤5 participants) and two long chains (≤10 participants) per condition 377
(see Figure 1g). Experimenters trained in stone knapping (TM, NU) acted as tutor to the378
first participant.379
To ensure participant motivation, we paid participants between £10 and £20, with380
the value dependent upon their performance when tested. In the teaching conditions381
(conditions 3-5) participants’ payment was also dependent upon how well their pupils382
went on to perform, thus tutors were motivated to teach effectively. In the383
imitation/emulation condition (condition 2) participants’ payment was also dependent384
upon how well they performed when demonstrating, this was to motivate demonstrators385
to focus on their own performance and not to teach the pupil.386
387

Procedure. Upon arrival, participants were briefed on the experimental procedure and388
their consent was required to proceed (ethical approval was given by St Andrews389
UTREC, code: BL6376). Before they learnt to knap, and to ensure that participants390
understood what Oldowan tools were used for, participants were given an information391
sheet, flint flakes of varying quality, chamois leather and wooden sticks. They were then392
given 5 minutes to use these items to gain an understanding of what made a good-quality393
sharp cutting flake. The information sheet gave only very brief information on the history394
and uses of Oldowan stone tools, and not any information as to how to make them395
beyond striking a flint core with a hammerstone.396
The learning/teaching period lasted for five minutes, after which participants were397
interrupted. After the learning phase, the pupil then advanced to the test phase.398
Participants were instructed to take as long as they needed for the test phase, however, if399
they had not stopped within 18 minutes the experimenter encouraged them to finish and400
after 20 minutes the experimenter instructed them to stop (only 12.5% of participants401
used the full 20 minutes). After the test phase (if applicable) participants went on to teach402
the next pupil. Once the procedure was complete, participants were debriefed and paid403
before leaving.404
405
Data. All flint used by participants was bagged throughout the experiment. In total,406
participants produced 6214 pieces of flint greater than 2cm across. All of these pieces407
were weighed, measured, and assessed for viability (i.e., whether they had possible use as408
a cutting tool) and quality (using a novel metric, which we developed, that took into409
account flake mass, cutting edge length and diameter; see Supplementary Methods for410

details). Any pieces less than 2cm across were not coded, as 2cm was considered to be411
the minimum size for a flake to possibly have utility as a butchery tool64. We also412
weighed participants’ cores both before and after knapping. Participants’ behaviour413
during the experiment was recorded using video cameras and we subsequently measured414
the length of time participants spent knapping and the number of times participants struck415
their core with their hammerstone. We also transcribed everything participants said whilst416
in the verbal teaching condition and split it into utterances (N=1481) for analysis. In417
particular all utterances were coded as either “correct” or “incorrect” which was418
determined relative to established knapping practices. The robustness of flake viability419
ratings as well as video coding, were tested by triple and double coding, respectively, a420
subset of the data. In both cases the level of agreement between coders was very high421
(see Supplementary Methods for details of the double/triple coding procedure).422
423
Analyses. We analysed the data using Bayesian GLMMs fitted using MCMC methods in424
OpenBUGS65,66. We modelled six different measures of individual performance: 1) the425
number of viable flakes produced, 2) the total quality of flakes produced, 3) the426
proportion of flakes that were viable, 4) the rate at which viable flakes were produced, 5)427
the probability of a viable flake per hit and 6) the proportion of their core successfully428
reduced. These measures were modelled as a function of condition, position along the429
chain, interactions between condition and position, initial core mass and random repeat-430
level effects.431
432
For a full description of the experimental procedure and all analyses see Supplementary433

Methods. For a comparison of the model results with the raw data see Supplementary434
Figures 1 and 2.435
436
437
References438
439
1. Roche, H. et al. Early hominid stone tool production and technical skill 2.34 Myr440ago in West Turkana, Kenya. Nature 399, 57–60 (1999).441
2. Semaw, S., Renne, P., Harris, J. W. K. & Feibel, C. S. 2.5-million-year-old stone442tools from Gona, Ethiopia. Nature 385, 333–336 (1997).443
3. Schick, K. & Toth, N. in Oldowan Case Stud. into earliest stone age (Toth, N. &444Schick, K.) (Gosport: Stone Age Institute, 2006).445
4. Delagnes, A. & Roche, H. Late Pliocene hominid knapping skills: the case of446Lokalalei 2C, West Turkana, Kenya. J. Hum. Evol. 48, 435–72 (2005).447
5. Toth, N. Behavioral inferences from early stone artifact assemblages: an448experimental model. J. Hum. Evol. 16, 763–787 (1987).449
6. Callahan, E. The basics of biface knapping in the eastern fluted point tradition: A450manual for flintknappers and lithic analysts. (Eastern States Archaeological451Federation, 1979).452
7. Braun, D. R., Plummer, T., Ditchfield, P. W., Bishop, L. C. & Ferraro, J. V. in453Interdiscip. Approaches to Oldowan (Hovers, E. & Braun, D. R.) 99–110454(Springer, 2009).455
8. Hovers, E. Invention, reinvention, and innovation: The makings of Oldowan lithic456technology. Orig. Hum. Innov. Creat. 16, 51–68 (2012).457
9. Fogarty, L., Strimling, P. & Laland, K. N. The evolution of teaching. Evolution.45865, 2760–2770 (2011).459
10. Gibson, K. & Ingold, T. Tools, language and cognition in human evolution.460(Cambridge University Press, 1993).461

11. Ambrose, S. H. Paleolithic Technology and Human Evolution. Science (80-. ).462291, 1748–1753 (2001).463
12. Bickerton, D. Adam’s Tongue. (Hill and Wang, 2009).464
13. Wynn, T., Hernandez-Aguilar, A., Marchant, L. F. & McGrew, W. C. “An ape’s465view of the Oldowan” revisited. Evol. Anthropol. 20, 181–97 (2011).466
14. Belfer-Cohen, A. & Goren-Inbar, N. Cognition and communication in the467Levantine Lower Palaeolithic. World Archaeol. 26, 144–157 (1994).468
15. D’Errico, F. et al. Archaeological Evidence for the Emergence of Language,469Symbolism, and Music — An Alternative Multidisciplinary Perspective. J. World470Prehistory 17, 1–70 (2003).471
16. Mellars, P. Why did modern human populations disperse from Africa ca. 60,000472years ago? A new model. Proc. Natl. Acad. Sci. 103, 9381–9386 (2006).473
17. Beyene, Y. et al. The characteristics and chronology of the earliest Acheulean at474Konso, Ethiopia. Proc. Natl. Acad. Sci. 110, 1584–1591 (2013).475
18. Lepre, C. J. et al. An earlier origin for the Acheulian. Nature 477, 82–5 (2011).476
19. De la Torre, I. The origins of stone tool technology in Africa: a historical477perspective. Philos. Trans. R. Soc. Lond. B. Biol. Sci. 366, 1028–37 (2011).478
20. Blumenschine, R. J. Early hominid scavenging opportunities: implications of479carcass availability in the Serengeti and Ngorongoro ecosystems. (B. A. R., 1986).480
21. Enquist, M., Ghirlanda, S., Jarrick, A. & Wachtmeister, C.-A. Why does human481culture increase exponentially? Theor. Popul. Biol. 74, 46–55 (2008).482
22. Sterelny, K. Language, gesture, skill: the co-evolutionary foundations of language.483Philos. Trans. R. Soc. B 367, 2141–2151 (2012).484
23. Stout, D., Toth, N., Schick, K., Stout, J. & Hutchins, G. Stone tool-making and485brain activation: position emission tomography (PET) studies. J. Archaeol. Sci. 27,4861215–1223 (2000).487
24. Uomini, N. T. & Meyer, G. F. Shared brain lateralization patterns in language and488Acheulean stone tool production: a functional transcranial Doppler ultrasound489study. PLoS One 8, e72693 (2013).490
25. Boyd, R., Richerson, P. J. & Henrich, J. The cultural niche: why social learning is491essential for human adaptation. Proc. Natl. Acad. Sci. 108 Suppl, 10918–25492(2011).493

26. Tishkoff, S. A. et al. Convergent adaptation of human lactase persistence in Africa494and Europe. Nat. Genet. 39, 31–40 (2007).495
27. Durham, W. H. Coevolution: Genes, Culture and Human Diversity. (Stanford496University Press, 1991).497
28. Hünemeier, T. et al. Evolutionary responses to a constructed niche: ancient498Mesoamericans as a model of gene-culture coevolution. PLoS One 7, e38862499(2012).500
29. Laland, K. N., Odling-Smee, J. & Myles, S. How culture shaped the human501genome: bringing genetics and the human sciences together. Nat. Rev. Genet. 11,502137–148 (2010).503
30. Richerson, P. J., Boyd, R. & Henrich, J. Gene-culture coevolution in the age of504genomics. Proc. Natl. Acad. Sci. U. S. A. 107 Suppl, 8985–92 (2010).505
31. Feldman, M. W. & Laland, K. N. Gene-culture coevolutionary theory. Trends506Ecol. Evol. 5347, 453–457 (1996).507
32. Potts, R. Hominin evolution in settings of strong environmental variability. Quat.508Sci. Rev. 73, 1–13 (2013).509
33. Castro, L. & Toro, M. a. The evolution of culture: from primate social learning to510human culture. Proc. Natl. Acad. Sci. U. S. A. 101, 10235–40 (2004).511
34. Dean, L. G., Kendal, R. L., Schapiro, S. J., Thierry, B. & Laland, K. N.512Identification of the social and cognitive processes underlying human cumulative513culture. Science 335, 1114–8 (2012).514
35. Lewis, H. M. & Laland, K. N. Transmission fidelity is the key to the build-up of515cumulative culture. Philos. Trans. R. Soc. Lond. B. Biol. Sci. 367, 2171–80 (2012).516
36. Shipton, C. B. K., Petraglia, M. & Paddayya, K. Stone tool experiments and517reduction methods at the Acheulean site of Isampur Quarry, India. Antiquity 83,518769–785 (2009).519
37. Petraglia, M., Shipton, C. B. K. & Paddayya, K. in Hominid Individ. Context520Archaeol. Investig. Low. Middle Palaeolithic landscapes, locales artefacts.521(Gamble, C. & Porr, M.) (Routledge, 2005).522
38. Ohnuma, K., Aoki, K. & Akazawa, T. Transmission of Tool-making through523Verbal and Non-verbal Communication--Preliminary Experiments in Levallois524Flake Production. Anthropol. Sci. 105, 159–168 (1997).525

39. Putt, S. S., Woods, A. D. & Franciscus, R. G. The Role of Verbal Interaction526During Experimental Bifacial Stone Tool Manufacture. Lithic Technol. 39, 96–112527(2014).528
40. Stout, D. in Stone tools Evol. Hum. Cogn. (Nowell, A. & Davidson, I.) 159–184529(University Press of Colorado, 2010).530
41. Nonaka, T., Bril, B. & Rein, R. How do stone knappers predict and control the531outcome of flaking? Implications for understanding early stone tool technology. J.532Hum. Evol. 59, 155–167 (2010).533
42. Stout, D. Skill and Cognition in Stone Tool Production: An Ethnographic Case534Study from Irian Jaya. Curr. Anthropol. 43, 693–723 (2002).535
43. Hoppitt, W. J. E. & Laland, K. N. Social Learning: An introduction to536mechanisms, methods, and models. 320 (Princeton University Press, 2013).537
44. Uomini, N. T. The prehistory of handedness: archaeological data and comparative538ethology. J. Hum. Evol. 57, 411–9 (2009).539
45. Stout, D., Semaw, S., Rogers, M. J. & Cauche, D. Technological variation in the540earliest Oldowan from Gona, Afar, Ethiopia. J. Hum. Evol. 58, 474–491 (2010).541
46. Laland, K. N. & Galef Jr, B. G. The Question of Animal Culture. 320 (2009).542
47. Whiten, A. The scope of culture in chimpanzees, humans and ancestral apes.543Philos. Trans. R. Soc. Lond. B. Biol. Sci. 366, 997–1007 (2011).544
48. Tomasello, M. in Chimpanzee Cult. (Wrangham, R. W., McGrew, W. C., de Waal,545F. B. M. & Heltne, P. G.) (Harvard University Press, 1994).546
49. Roffman, I., Savage-Rumbaugh, S., Rubert-Pugh, E., Ronen, A. & Nevo, E. Stone547tool production and utilization by bonobo-chimpanzees (Pan paniscus). Proc. Natl.548Acad. Sci. 1–4 (2012). doi:10.1073/pnas.1212855109/-549/DCSupplemental.www.pnas.org/cgi/doi/10.1073/pnas.1212855109550
50. Toth, N. & Schick, K. The Oldowan: the tool making of early hominins and551chimpanzees compared. Annu. Rev. Anthropol. (2009).552
51. Savage-Rumbaugh, S., Fields, W. M. & Spircu, T. The emergence of knapping and553vocal expression embedded in a Pan/Homo culture. Biol. Philos. 19, 541–575554(2004).555
52. Whiten, A. & van Schaik, C. P. The evolution of animal “cultures” and social556intelligence. Philos. Trans. R. Soc. B 362, 603–20 (2007).557

53. Caldwell, C. a. & Millen, A. E. Social Learning Mechanisms and Cumulative558Cultural Evolution: Is Imitation Necessary? Psychol. Sci. 20, 1478–1483 (2009).559
54. Stout, D. Stone toolmaking and the evolution of human culture and cognition.560Philos. Trans. R. Soc. B 366, 1050–9 (2011).561
55. Pelegrin, J. in Use Tools by Hum. Non-human Primates (Berthelet, A. &562Chavaillon, J.) (Oxford University Press, 1993). doi:10.1093/acprof563
56. Dennett, D. Darwin’s Dangerous Idea. (Simon & Schuster, 1995).564
57. Powell, A., Shennan, S. J. & Thomas, M. G. Late Pleistocene demography and the565appearance of modern human behavior. Science 324, 1298–301 (2009).566
58. Potts, R. Environmental hypotheses of hominin evolution. Am. J. Phys. Anthropol.56727, 93–136 (1998).568
59. Gowlett, J. in Axe Age Acheulian Tool-making from Quarr. to Discard (Goren-569Inbar, N. & Sharon, G.) (Equinox, 2006).570
60. Donald, M. Origins of the Modern Mind: Three Stages in the Evolution of Culture571and Cognition. (Harvard University Press, 1991).572
61. Corballis, M. C. The Lopsided Ape: Evolution of the Generative Mind. (Oxford573University Press, 1993).574
62. Boesch, C. Teaching among wild chimpanzees. Anim. Behav. 41, 530–532 (1991).575
63. Mesoudi, A. & Whiten, A. The multiple roles of cultural transmission experiments576in understanding human cultural evolution. Philos. Trans. R. Soc. Lond. B. Biol.577Sci. 363, 3489–501 (2008).578
64. Key, A. J. M. & Lycett, S. J. Are bigger flakes always better? An experimental579assessment of flake size variation on cutting efficiency and loading. J. Archaeol.580Sci. 41, 140–146 (2014).581
65. Lunn, D. & Spiegelhalter, D. The BUGS project: Evolution, critique and future582directions. Stat. Med. 28, 3049–3067 (2009).583
66. Ntzoufras, I. Bayesian Modeling Using WinBUGS. (Wiley, 2009).584
585
586
Acknowledgements587

Research supported in part by an ERC Advanced Grant to KNL (EVOCULTURE, Ref:588
232823) and grants to NTU from the British Academy (Centenary Project "Lucy to589
Language: the Archaeology of the Social Brain") and The Leverhulme Trust (ECF 0298).590
We are grateful to Gillian Brown, Richard Byrne, Jane Rees and Stephen Shennan for591
helpful comments on earlier drafts. We would like to thank John and Val Lord for592
supplying us with flint.593
Authors’ contributions594
TM, NU, LR and KL designed the experiment; TM, NU, LR, LT, SS, HL, CC and CE595
executed the experiment; TM, NU, IdlT and RK coded the data; TM carried out the596
analyses; all authors contributed to the preparation of the manuscript.597
Conflict of financial interests598
All authors declare that they have no conflicts of interest concerning the publication of599
this work.600
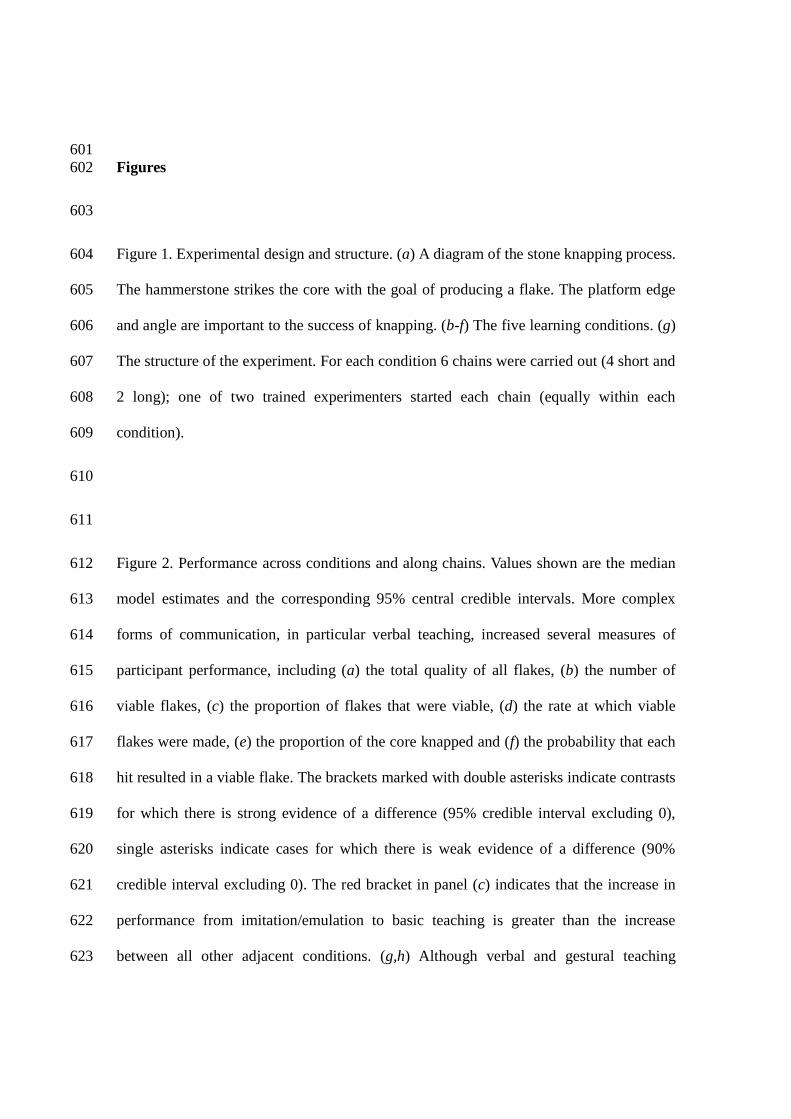
601Figures602
603
Figure 1. Experimental design and structure. (a) A diagram of the stone knapping process.604
The hammerstone strikes the core with the goal of producing a flake. The platform edge605
and angle are important to the success of knapping. (b-f) The five learning conditions. (g)606
The structure of the experiment. For each condition 6 chains were carried out (4 short and607
2 long); one of two trained experimenters started each chain (equally within each608
condition).609
610
611
Figure 2. Performance across conditions and along chains. Values shown are the median612
model estimates and the corresponding 95% central credible intervals. More complex613
forms of communication, in particular verbal teaching, increased several measures of614
participant performance, including (a) the total quality of all flakes, (b) the number of615
viable flakes, (c) the proportion of flakes that were viable, (d) the rate at which viable616
flakes were made, (e) the proportion of the core knapped and (f) the probability that each617
hit resulted in a viable flake. The brackets marked with double asterisks indicate contrasts618
for which there is strong evidence of a difference (95% credible interval excluding 0),619
single asterisks indicate cases for which there is weak evidence of a difference (90%620
credible interval excluding 0). The red bracket in panel (c) indicates that the increase in621
performance from imitation/emulation to basic teaching is greater than the increase622
between all other adjacent conditions. (g,h) Although verbal and gestural teaching623

increased the probability of a viable flake per hit and the proportion of flakes that were624
viable, performance in these conditions decreased along chains such that across625
conditions performance was similar by position 5. With reverse engineering, performance626
did not decline along chains, suggesting it was already at floor levels. Position 1627
corresponds to the first participant, not the trained experimenter. (i) With verbal teaching,628
both the total number of utterances (left hand bars) and the probability a teaching629
utterance was correct (right hand bars) decreased along chains. Key: reverse engineering-630
blue (n=37), imitation/emulation-green (n=34), basic teaching-yellow (n=38), gestural631
teaching-orange (n=37), verbal teaching-red (n=38).632
633

Tables634
Table 1. Effects of different transmission mechanisms on performance.635
Variable Condition
RE IE BT GT VT
Total quality 13.0,[9.2, 17.9]
15.7,[11.1, 21.4]
15.4,[11.1, 20.7]
19.8,[14.6, 26.7]
23.6,[17.0, 31.9]
Number ofviable flakes
15.76,[12.1,0.47]
18.31,[14.07,23.56]
19.56,[15.08,25.37]
21.73,[16.77,28.32]
25.22,[19.42,33.02]
Proportion offlakes that areviable
0.55,[0.48,0.62]
0.58,[0.52,0.64]
0.72,[0.66,0.77]
0.72,[0.67,0.77]
0.73,[0.68,0.78]
Viable flakesper minute
1.96,[1.33,2.87]
1.98,[1.35,2.85]
2.55,[1.78,3.69]
2.95,[2.03,4.36]
3.37,[2.26,5.19]
Proportion ofcore knapped
0.44,[0.35,0.54]
0.46,[0.37, 0.56]
0.53,[0.43, 0.63]
0.51,[0.43,0.62]
0.59,[0.48, 0.71]
Probability ofa viable flakeper hit
0.03,[0.02,0.05]
0.04,[0.03,0.06]
0.06,[0.04,0.08]
0.07,[0.05,0.10]
0.10,[0.07,0.16]
636Estimated values for parameters at the first position in the chain for different conditions.637
Quoted values are median model estimates and their 95% central credible intervals. RE =638
Reverse Engineering, IE = Imitation/Emulation, BT = Basic Teaching, GT = Gestural639
Teaching, VT = Verbal Teaching.640
641

Table 2. Effects of position along chains on performance.642
643Variable Condition Gradient/rate of change Extent of change
Number of viable flakes VT -0.07, [-0.10, -0.04] -
Proportion of flakes thatare viable
BT -0.06, [-0.10, -0.01] -
GT -0.11, [-0.15, -0.06] -
VT -0.08, [-0.13, -0.03] -Probability of a viableflake per hit
IE -0.08, [-0.12, -0.05] -
BT -0.04, [-0.08, 0.00] -
GT -0.12, [-0.16, -0.08] -
VT -0.33, [-0.38, -0.28] -
Total Utterances VT 1.2, [0.63, 14.0] -42.2, [-29.3, -58.9]
Proportion of teachingutterances correct VT 1.4, [0.56, 45.8] -4.0, [-1.4, -6.9]
Platform angle teachingaccuracy VT 3.99, [0.0, 128.1] -0.75, [3.21, -1.91]
Ridge teaching accuracy VT 0.42, [0.1766, 1.10] -3.69, [-1.95, -6.75]
Platform edge teachingaccuracy VT 0.00, [0.0, 0.09] 1.18, [4.78, -4.12]
Force required teachingaccuracy VT 0.00, [0.0, 0.03] 0.53, [4.73, -3.489]
644Quoted values are median model estimates and their 95% central credible intervals.645
Where only the gradient is given, a negative change corresponds to a decrease along646
chains; where both rate and extent are given, the rate is a scalar quantity and a negative647
extent corresponds to a decrease along chains. Values in italics represent cases where the648
95% credible interval did not exclude 0, but the 90% interval did (i.e., weak, but not649
strong evidence). RE = Reverse Engineering, IE = Imitation/Emulation, BT = Basic650
Teaching, GT = Gestural Teaching, VT = Verbal Teaching.651
652


1
Supple m e nta ryFig ure s1
2
Supplementary Figure 1: A comparison of the raw data and model estimates. This figure shows3
the raw data (blue dots), raw data average +/- one standard deviation (black interval) and median4
model estimate with 95% central credible interval of the raw data average (red interval) for the5

2
total number of viable flakes produced by participants across the five conditions. As can be seen6
the model is very accurate at estimating the raw data average and does so with a high degree of7
certainty as the model intervals are much narrower than the standard deviation interval. This can8
give us high confidence in the ability of the model to fit the data.9
10
11

3
12
Supplementary Figure 2: A comparison of the raw data and model estimates. This figure shows13
the raw data (blue dots), raw data average +/- one standard deviation (black interval) and median14
model estimate with 95% central credible interval of the raw data average (red interval) for the15
probability that each time a participant struck the flint core with their hammerstone a viable flake16
would be produced. In this case the model predictions are consistently below the raw data17

4
average, although well within the standard deviation interval. This is because the data has a high18
positive skew (there are several raw data points well above the upper limit of the figure) and so19
the raw data average has been increased. That the model estimate is lower shows that the model20
is better able to deal with skewed data than the raw data average. Indeed, observation of the blue21
raw data points indicates that the model estimate sits much closer to the densest area of the raw22
data points than the raw data average does. Furthermore the size of the model estimate interval is23
much less than the standard deviation interval indicating the greater precision afforded by the24
model. Again, this plot can give us great confidence that the model was able to fit the data well.25
26
27

5
28
Supplementary Figure 3: The transmission of concepts along chains in the verbal teaching29
condition. This figure shows the proportion of teaching utterances than covered particular topics30
contingent on position along the chain in the verbal teaching condition. It illustrates how some31
concepts were more successfully transmitted along chains than others. Knowledge of the32
platform edge and force required were transmitted effectively, with no evidence of a decrease,33
whilst the extent to which teachers talked about the platform angle decreased and utterances34
concerning a ridge to carry force had virtually disappeared by position 5. The values shown are35
median model estimates.36
6
37
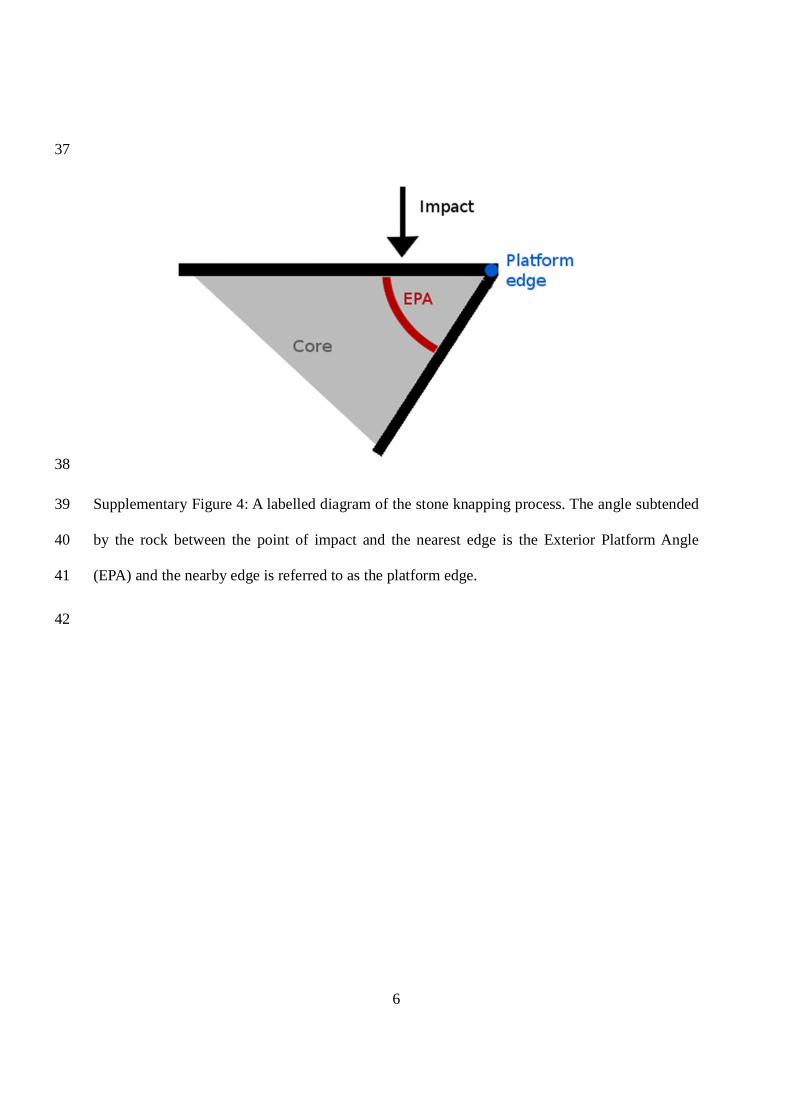
38
Supplementary Figure 4: A labelled diagram of the stone knapping process. The angle subtended39
by the rock between the point of impact and the nearest edge is the Exterior Platform Angle40
(EPA) and the nearby edge is referred to as the platform edge.41
42

7
Supple m e nta ryTa b le s43
44
Supplementary Table 1: Estimated values for parameters at the first position in the chain for45
different conditions.46
Variable Condition
RE IE BT GT VT
Number
of flakes
All 28.0,
[21.9,36.0]
31.7,
[24.9,40.5]
27.9,
[21.8,35.3]
30.1,
[23.5,38.4]
34.3,
[26.9,43.8]
Viable 15.8, [12.1,
0.5]
18.3,
[14.1, 3.6]
19.6,
[15.1, 5.4]
21.7, [16.8,
8.3]
25.2,
[19.4,33.0]
Non-
viable
12.0,
[9.1, 15.9]
13.1,
[10.0,17.1]
8.1,
[6.1, 10.9]
8.6,
[6.5, 11.3]
9.6,
[7.2, 12.7]
Selected 12.5,
[9.4, 16.4]
13.3,
[10.1,17.4]
16.3,
[12.5,21.1]
14.8,
[11.3,19.4]
23.0,
[17.5,30.4]
Non-
selected
14.7,
[11.3,19.3]
17.6,
[13.6,23.0]
11.3,
[8.6, 14.7]
14.6,
[11.3,19.0]
13.1,
[10.1,17.1]
Proportion
of flakes
Viable 0.55,
[0.48,0.62]
0.58,
[0.52,0.64]
0.72,
[0.66,0.77]
0.72,
[0.67,0.77]
0.73,
[0.68,0.78]
selected 0.46,
[0.39,0.53]
0.45,
[0.38,0.51]
0.62,
[0.55,0.68]
0.48,
[0.42,0.55]
0.61,
[0.54,0.67]
Total cutting edge
(cm)
52.6,
[37.3,72.3.]
61.3,
[43.5,84.0]
62.3,
[46.2,83.2]
81.2,
[59.7,109.5]
98.1,
[72.0,133.3]

8
Total flake mass (g) 40.6,
[28.2,55.8]
45.1,
[31.1,62.2]
57.1,
[41.2,76.3]
59.7,
[42.8,80.9]
59.3,
[42.3,79.9]
Total quality 13.0,
[9.2, 17.9]
15.7,
[11.1,21.4]
15.4,
[11.1,20.7]
19.8,
[14.6, 26.7]
23.6,
[17.0, 31.9]
Proportion of core
remaining
0.56,
[0.46,0.65]
0.54,
[0.44,0.63]
0.47,
[0.37,0.57]
0.49,
[0.38,0.57]
0.41,
[0.29,0.52]
Hits per minute
knapping
43.2,
[32.7,57.5]
39.7,
[30.1,52.5]
34.5,
[26.1,45.2]
34.3,
[26.0,45.5]
28.8,
[20.9,39.3]
Flakes per
minute
All 3.28,
[2.31,4.62]
3.13,
[2.21,4.36]
3.56,
[2.56,5.00]
4.04,
[2.87,5.77]
4.52,
[3.15,6.69]
viable 1.96,
[1.33,2.87]
1.98,
[1.35,2.85]
2.55,
[1.78,3.69]
2.95,
[2.03,4.36]
3.37,
[2.26,5.19]
Probability of a
viable flake per hit
0.03,
[0.02,0.05]
0.04,
[0.03,0.06]
0.06,
[0.04,0.08]
0.07,
[0.05,0.10]
0.10,
[0.07,0.16]
47
Quoted values are medians and 95% central credible intervals.48
49

9
Supplementary Table 2: Estimated values for effects of position along the chain on different50
variables and for different conditions.51
52
Variable Condition
Reverse
Engineering
Imitation/
Emulation
Basic
Teaching
Gestural
Teaching
Verbal
Teaching
Num
ber
of
flakes
All 0.05,
[0.03, 0.08]
-0.02,
[-0.05, 0.01]
0.03,
[0.00, 0.05]
0.03,
[0.00, 0.06]
-0.04,
[-0.06,-0.01]
Viable 0.07,
[0.03, 0.10]
0.00,
[-0.03, 0.04]
0.00,
[-0.03,0.03]
-0.01,
[-0.04, 0.02]
-0.07,
[-0.10, -0.04]
Non-
viable
0.04,
[-0.00, 0.08]
-0.05,
[-0.09,-0.01]
0.07,
[0.03,0.11]
0.09,
[0.05, 0.14]
0.02,
[-0.02,0.06]
Selected 0.05,
[0.01,0.09]
0.02,
[-0.02,0.06]
-0.03,
[-0.06,0.01]
-0.01,
[-0.05,0.03]
-0.11,
[-0.14,-0.07]
Non-
selected
0.06,
[0.02,0.10]
-0.05,
[-0.08,-0.01]
0.08,
[0.04,0.11]
0.07,
[0.03,0.11]
0.02,
[-0.01,0.05]
Pro
portio
nof
flakes
Viable 0.03,
[-0.01,0.08]
0.03,
[-0.01,0.08]
-0.06,
[-0.10,-0.01]
-0.11,
[-0.45,-.06]
-0.08,
[-0.13,-0.03]
Selected 0.02,
[-0.03,0.06]
0.02,
[-0.02,0.07]
-0.12,
[-0.16,-0.07]
-0.03,
[-0.08,0.02]
-0.15,
[-0.19,-0.10]
Total cutting
edge (cm)
0.06,
[-0.01,0.14]
-0.02,
[-0.11,0.07]
0.02,
[-0.05,0.08]
-0.04,
[-0.12,0.04]
-0.06,
[-0.13,0.01]
Total flake mass 0.01, 0.01, -0.01, 0.00, -0.01,

10
(g) [-0.08,0.08] [-0.08,0.09] [-0.08,0.05] [-0.08,0.08] [-0.08,0.06]
Total quality 0.06,
[-0.02,0.14]
-0.02,
[-0.12,0.06]
0.01,
[-0.05,0.07]
-0.04,
[-0.12,0.04]
-0.07,
[-0.14,0.01]
Proportion of
core remaining
-0.02,
[-0.13,0.08]
-0.06,
[-0.16,0.04]
0.00,
[-0.09,0.09]
-0.09,
[-0.20,0.01]
-0.04,
[-0.16,0.08]
Hits per minute
knapping
0.06,
[-0.01,0.13]
0.06,
[-0.01,0.13]
0.01,
[-0.05,0.07]
0.05,
[-0.02,0.12]
0.15,
[0.06,0.24]
Flak
esper
minu
te
All 0.02,
[-0.07,0.11]
0.03,
[-0.05,0.12]
-0.00,
[-0.08,0.08]
0.00,
[-0.09,0.09]
-0.09,
[-0.21,0.02]
viable 0.02,
[-0.08,0.12]
0.02,
[-0.07,0.12]
-0.02,
[-0.11,0.07]
-0.03,
[-0.13,0.07]
-0.12,
[-0.25,0.00]
Probability of a
viable flake per
hit
0.01,
[-0.02,0.05]
-0.08,
[-0.12,-0.05]
-0.04,
[-0.08,0.00]
-0.12,
[-0.16,-.08]
-0.33,
[-0.38,-0.28]
53
Quoted values are medians and 95% central credible intervals. If the 95% central credible54
interval excludes 0 this is considered strong evidence for an effect. Values in italics correspond to55
cases where the 95% central credible interval includes 0, but the 90% central credible interval56
excludes 0, thus it can be considered weak or moderate evidence for an effect.57
58

11
Supplementary Table 3: Estimated values for effects of core mass on different variables.59
60
Variable Effect of core mass
Number of flakes All 0.13, [0.09, 0.17]
Viable 0.13, [0.08, 0.17]
Non-viable 0.11, [0.04, 0.17]
Selected -0.03, [-0.08, 0.02]
Non-selected 0.26, [0.21, 0.31]
Total cutting edge (cm) 0.04, [-0.06, 0.15]
Total flake mass (g) 0.09, [-0.00, 0.18]
Total quality 0.05, [-0.05, 0.16]
Proportion of core remaining -1.82, [-3.42, -0.60]
61
Quoted values are medians and 95% central credible intervals. If the 95% central credible62
interval excludes 0 this is considered strong evidence for an effect. Values in italics correspond to63
cases where the 95% central credible interval includes 0, but the 90% central credible interval64
excludes 0, thus it can be considered weak or moderate evidence for an effect.65
66

12
Supplementary Table 4: Estimated values for rate and extent of change for variables along67
chains, and, where appropriate, accuracy of topics.68
69
Variable/Category/Topic Rate of change along
chains
Extent of change
along chains
Accuracy
Total Utterances 1.2, [0.63, 14.0] -42.2, [-29.3, -58.9] -
Proportion of teaching
utterances correct1.4, [0.56, 45.8] -4.0, [-1.4, -6.9]
-
Said by the teacher 0.00, [0.0, 0.00] -0.76, [-3.57, 5.19] -
Teaching 0.00, [0.0, 0.01] -0.28, [-5.76, 3.87] -
Feedback 0.00, [0.0, 0.06] -0.28, [-3.90, 3.25] -
Confirmation of
understanding13.3, [1.89, 163.5] -0.88, [-1.77, -0.09]
-
Watch this 0.00, [0.0, 0.30] 2.35, [-2.99, 6.47] -
This/that 0.40, [0.00, 91.57] -0.56, [-3.35, 3.56] -
Requesting Information 10.9, [0.86, 149.5] 0.96, [-0.04, 2.23] -
Conveying uncertainty 7.18, [1.63, 159.0] 3.88, [1.95, 6.69] -
Abstract 0.00, [0.0, 0.00] -0.52, [-4.40, 3.15] -
Correct 4.03, [1.38, 6.90] -4.03, [-6.90, -1.38] -
Incorrect 2.36, [0.83, 98.85] 4.00, [-1.33, 7.39] -
Knapping 0.11, [0.00, 111.0] -0.74, [-4.07, 2.08] -
Knapping site 0.09, [0.02, 7.82] -2.31, [-5.65, -0.54] 0.55, [0.34, 0.76]
Platform edge 0.00, [0.0, 0.09] 1.18, [-4.13, 4.78] 0.93, [0.79, 0.98]

13
Platform angle 3.99, [0.0, 128.1] -0.75, [-1.91, 3.21] 0.72, [0.36, 0.93]
Ridge 0.42, [0.18, 1.10] -3.69, [-6.75, -1.95] 1.0, [0.96, 1.0]
force 0.00, [0.0, 0.03] 0.53, [-3.49, 4.37] 0.38, [0.20, 0.60]
How to hit 0.00, [0.0, 0.0] 1.01, [-4.01, 5.52] 0.80, [0.57, 0.93]
Hot to hold 0.00, [0.0, 0.00] 0.68, [-3.93, 4.68] 0.83, [0.52, 0.97]
Hammerstones 0.00, [0.0, 1.51] 1.72, -1.81, 6.25] 0.73, [0.47, 0.90]
Cortex 0.00, [0.0, 0.65] 1.79, [-2.16, 6.72] 0.94, [0.77, 0.99]
Choosing flakes 9.97, [0.00, 161.8] 0.82, [-1.73, 3.73] -
Size of flakes 0.00, [0.0, 0.00] 2.01, [-1.94, 6.15] 0.68, [0.39, 0.89]
Cutting edge of flakes 0.00, [0.0, 0.09] 1.09, [-2.64, 6.09] 0.91, [0.80, 0.97]
70
Quoted values are medians and 95% central credible intervals. A negative value for the extent of71
change corresponds to a decrease along the chain. To aid interpretation of the rate parameter; a72
value greater than 2 is very rapid change such that ~90% of any change is achieved in the first73
step. A value below 0.5 corresponds to a more gentle change with ~90% of the change occurring74
over the first 5 steps, and lower values correspond to even gentler change. Values between these75
correspond to intermediate rates of change.76
77
78

14
Supplementary Table 5: Contrasts between conditions for different variables.79
80
Variable First condition Second condition Contrast
Number of viable
flakes
VT RE 9.4, [2.1, 18.1]
IE 6.9, [-0.8, 18.1]
GT RE 6.0, [-0.7, 13.5]
Proportion of
flakes that are
viable
VT RE 0.18, [0.12, 0.25]
IE 0.15, [0.09, 0.21]
GT RE 0.17, [0.11, 0.24]
IE 0.14, [0.08, 0.20]
BT RE 0.17, [0.11, 0.23]
IE 0.14, [0.08, 0.20]
BT IE VT GT 0.57, [0.20, 0.95]
GT BT 0.60, [0.13, 1.08]
IE RE 0.49, [0.05, 0.94]
Number of non-
viable flakes
GT RE -3.4, [-7.7, 0.5]
IE -4.5, [-9.1, -1.0]
BT RE -3.8, [-8.3, 0.1]
IE -4.9, [-9.6, -0.8]
Number of selected
flakes
VT GT 8.1, [1.2, 16.3]
BT 6.7, [-0.5, 14.8]
IE 9.6, [2.7, 17.6]
RE 10.5, [3.6, 18.5]

15
Proportion of
flakes that were
selected
VT GT 0.12, [0.06, 0.18]
IE 0.16, [0.10, 0.22]
RE 0.15, [0.08, 0.22]
BT GT 0.13, [0.07, 0.20]
IE 0.17, [0.11, 0.23]
RE 0.16, [0.09, 0.22]
Number of non-
selected flakes
BT IE-6.3, [-12.6, -1.0]
Total quality VT BT 8.2, [-0.1, 17.4]
IE 7.9, [-1.1, 17.5]
RE 10.6, [2.2, 20.0]
GT RE 6.7, [-0.4, 14.7]
Total cutting edge VT BT 36.0, [2.7, 72.9]
IE 36.6, [2.9, 76.4]
RE 45.7, [12.0, 85.4]
GT RE 28.4, [-0.3, 61.3]
Total mass RE VT -18.6, [-41.6, 2.0]
GT -18.9, [-40.8, 0.29]
BT -16.2, [-36.1, 1.9]
Proportion of core
remaining
VT RE -0.15, [-0.31, -0.00]
IE -0.13, [-0.29, 0.01]
Hits per minute
knapping
VT RE-14.3, [-30.8, -0.11]

16
Viable flakes per
minute knapping
VT RE 1.39, [0.03, 3.35]
IE 1.37, [0.03, 3.34]
Probability of a
viable flake with
each hit
VT BT 0.05, [0.00, 0.10]
IE 0.06, [0.02, 0.12]
RE 0.07, [0.03, 0.12]
GT IE 0.02, [-0.00, 0.06]
RE 0.03, [0.01, 0.07]
BT RE 0.03, [0.00, 0.05]
Topic Accuracy Ridge Knapping site 0.44, [0.22, 0.66]
Platform edge 0.07, [0.01, 0.20]
Platform angle 0.28, [0.06, 0.63]
How to hit 0.20, [0.06, 0.42]
How to hold 0.16, [0.03, 0.47]
Hammerstones 0.27, [0.09, 0.52]
Cortex 0.06, [-0.00, 0.23]
Flake size 0.31, [0.11, 0.60]
Cutting edge 0.08, [0.02, 0.19]
Force 0.61, [0.39, 0.79]
Cortex Knapping site 0.37, [0.09, 0.62]
Force 0.54, [0.28, 0.74]
Platform edge Knapping site 0.37, [0.07, 0.62]
Flake size 0.24, [0.00, 0.53]
Force 0.53, [0.30, 0.73]

17
Hammerstones 0.19, [-0.01, 0.40]
Cutting edge Knapping site 0.35, [0.12, 0.58]
Hammerstones 0.18, [-0.01, 0.44]
Flake size 0.23, [-0.02, 0.54]
Force 0.52, [0.29, 0.72]
Force How to hit -0.41, [-0.66, -0.08]
How to hold -0.43, [-0.68, -0.08]
Hammerstones -0.33, [-0.60, -0.02]
Flake size -0.29, [-0.56, 0.04]
81
Quoted values are medians and 95% central credible intervals. Numbers given in italics82
correspond to cases where the 95% central credible interval included 0, but the 90% central83
credible interval did not. i.e., cases where strong evidence was not reached, but there is still some84
evidence for such a difference. Key: RE = reverse engineering, IE = imitation/emulation, BT =85
basic teaching, GT = gestural teaching, VT = verbal teaching.86
87
88

18
Supplementary Figure 6: Differences in performance between gestural and verbal teaching.89
90
Variable Model Estimate
Probability that average performance with verbal teaching> with gestural teaching
0.9, [0.57, 1.00]
Probability of strong evidencethat performance > than with
reverse engineering,imitation/emulation or basic
teaching
verbal teaching 0.6, [0.38, 0.8]
gestural teaching 0.19, [0.06, 0.41]
difference betweenverbal and gestural
teaching
0.41, [0.12, 0.65]
91
Quoted values are medians and 95% central credible intervals. I no case do we find strong92
evidence that performance according to a particular measure was greater with verbal teaching93
than with gestural teaching. Nonetheless, there is strong evidence that across multiple measure,94
performance was better with verbal teaching than with gestural teaching.95
19
Supple m e nta ryM e thod s96
97
Ge ne ra lM e thod s98
Across two weeks 184 participants learnt and taught others to make flint flakes using a granite99
hammerstone and flint core. We used a transmission chain design in which the first participant in100
a chain was taught by a skilled experimenter and subsequent participants were taught by the101
previous participant. Participants gained asocial information through access to the materials102
themselves. The social information was from a demonstrator or teacher and varied across five103
learning conditions detailed below. For each of the learning conditions we ran four short chains104
(≤5 participants long) and two long chains (≤10 participants long), totalling 30 chains across all 105
conditions. Each participant was involved for ~90 minutes and was paid between £10 and £20106
depending on their performance.107
108
Appa ra tus& Se t-up109
We used 2 tonnes of Brandon flint from a chalk quarry (Norfolk, UK), broken up into cores of110
roughly 1kg in weight. We collected around 100 granite hammerstones, of a range of shapes and111
sizes from the coastline near Stonehaven, Scotland.112
113
The knapping room contained a 4x4m square knapping area, the floor of which was covered in114
cardboard or black plastic sheeting, divided into two 2x4m sections by a 1m tall clear perspex115
screen. In each section was a chair on which participants could sit and a large piece of Hessian116
that participants could use to protect their clothing whilst knapping. When only one participant117

20
was present they were free to use either section, but when a teacher and learner were both present118
they each used one section. Participants were free to enter each other's sections during the119
pupil/tutor phases, but were only allowed to knap in their own section. The screen ensured that120
flakes from each participant did not enter the other participant's section. Thus, it was clear who121
had produced any flakes found in each section. The screen also prevented flakes produced hitting122
another participant. Immediately to the side of the knapping area was a large pile of123
hammerstones from which participants were free to choose. For safety, all participants were124
required to wear a pair of safety glasses and latex coated cotton gloves. We additionally provided125
breathing masks for participants in case they found the dust produced to be irritating. Two126
experimenters were present, at all times, sitting at a desk outside of the knapping area. A small127
number of flint cores were stored behind the desk and the experimenters chose cores from this128
supply at random for each participant.129
130
Proce d ure131
Upon arrival, participants were briefed on the experimental procedure and given the opportunity132
to ask any questions. Participants then began the introductory phase of the experiment.133
Participants were provided with some pre-knapped flint flakes, some chamois leather and some134
sticks. They were given an information sheet containing superficial information on the135
emergence of such technology in the archaeological record, the tasks that flakes were used for,136
and that flakes were produced by striking pieces off a larger stone. They were then given 5137
minutes to use the flakes to cut the leather and to sharpen the sticks. They were encouraged to try138
a range of flakes to achieve an understanding of what properties made a useful (henceforth139
“viable”) flake. The introductory phase took part in a different room to the other phases of the140

21
experiment.141
142
After this, the pupil phase began. Participants were given five minutes to practice making their143
own flint flakes. Additionally participants were provided with social information, the form of144
which varied depending on the learning condition, as detailed further below.145
146
Next, participants entered the test phase. They were instructed to make as many high quality147
flakes from the core as they could. They were not told of a time-limit, although the experimenter148
called it to an end if the participant took over 20 minutes.149
150
If applicable, the participants next continued to the tutor phase where they provided social151
information to the next participant in the chain, just as they had experienced in their pupil phase.152
After this, participants were debriefed and were paid according to their performance.153
154
In all phases of the experiment that involved knapping, participants were provided with a flint155
core and could choose a hammerstone. At the end of the phase we asked participants to separate156
out their flint into three categories; what remained of the core, viable flakes, and non-viable157
flakes. Flakes the participant selected as viable will henceforth be referred to as “selected”,158
whilst those they did not selected as viable will be referred to as “non-selected”.159
160
Cond itions161
The experiment involved 5 different learning conditions that dictated the form of the social162
information by placing limits on the ways in which learner and teacher could interact. The163

22
conditions were as follows:164
165
1. Reverse Engineering - The learner had access only to the flakes produced by their166
teacher and no access to the teacher themselves. In this condition there was no teaching167
as the tutor was not present. Thus once participants had completed the test phase they168
proceeded immediately to debriefing. The flakes available to the pupil were those169
produced by the previous participant in the previous participant's test phase that the170
previous participant had categorized as viable.171
2. Imitation/Emulation - The pupil was able to watch a tutor making flakes, but no forms172
of direct interaction were permitted. As the tutor produced flakes they categorized them173
as viable or non-viable and the flakes were available for the pupil to examine.174
3. Basic Teaching – Communication between the pupil and tutor was permitted but was175
limited to some simple forms of non-symbolic teaching. The permitted interactions were176
manual shaping (where the tutor could adjust how the pupil was holding the core and177
hammerstone), slowing of actions, and reorientation to allow the pupil a clear view.178
These forms of teaching were chosen as they are the forms of teaching for which there is179
some evidence in non-human animals.180
4. Gestural Teaching - Communication between the tutor and pupil was permitted but was181
limited to gestural (i.e., non-verbal) communication. This included, but was not limited182
to, mutual touching of tools, pointing, miming and nodding.183
5. Verbal teaching – All forms of communication between the tutor and pupil were184
permitted, including use of language.185
186

23
In all teaching conditions the tutor was provided with their own flint core and hammerstone and187
could make their own flakes. Once flakes had been made the pupil was allowed to examine them.188
189
Pa ym e nt190
Participants were informed in advance of the payment scheme for the experiment, which varied191
by condition. In all conditions, we paid participants according to the number of viable flakes they192
were able to produce, divided by the initial mass of their core, during their test phase. We193
included any flakes that we considered viable, regardless of whether the participant had194
categorized them as such, as otherwise participants would have been motivated to categorise195
everything they produced as viable to increase their payment. We chose this payment scheme as196
it reflects pressures on early hominin tool makers to produce as many flakes as possible from a197
limited supply of knapping material.198
199
In teaching conditions, tutors were also evaluated on their pupil’s subsequent test phase200
performance; this was to ensure tutors were motivated to teach effectively. With201
imitation/emulation, participants were evaluated on their own test and tutor phase performance;202
this was to motivate them to focus on their own performance during the tutor phase, instead of203
teaching the pupil.204
205
Re cord e d Va ria b le s206
We used digital video cameras to record the entirety of the experiment (although video recording207
failed for one of the long chains in the VT condition). Additionally, we recorded the initial208

24
weight of all the flint cores given to participants. Finally, at the end of each phase and for each209
participant we separately bagged (i) what remained of the core, (ii) any selected flakes and (iii)210
any non-selected flakes.211
212
Cod ing213
Fla ke s214
All flakes greater than 2cm in diameter were coded, totalling 6214 flakes. This lower limit of215
2cm was considered to be the minimum for a useful butchery tool2. Any flakes that had an edge216
deemed sharp enough to be of use were coded as viable, otherwise they were coded as non-217
viable. Prior to the full coding, a subset of 317 flakes were triple coded by TM, NU and IT. All of218
this subset were coded first as viable or non-viable, and if viable they were then rated on a 10-219
point scale of quality that took into account the efficiency with which the raw material had been220
used. A latent variable analysis of flake viability was carried out to estimate the accuracy of the221
viability coding decisions of each of the coders. The viability of each flake was modelled as a222
latent variable with a Bernoulli error structure. Additionally the viability ratings of each coder223
were modelled with a Bernoulli error structure and a logit link function. The linear predictors for224
coders’ ratings took separate values for each coder and for each value of the latent variable225
(viable or non-viable). The only constraint placed upon the model was that all coders performed226
above chance, such that they had a >50% chance of identifying a flake correctly. The model then227
used the coders' decisions to estimate the viability of each flake and in turn the accuracy of each228
coder. All three coders were estimated to have similarly high levels of accuracy (estimated229
probabilities of accurate identification; TM = 0.81 [0.75, 0.87], NU = 0.89 [0.83, 0.94], IT =230

25
0.82, [0.74, 0.88]). The imperfect viability coding likely reflects the inherent difficulty in the231
coding decisions, as many flint fragments were of debatable value. The remaining flakes were232
coded by TM. In addition to viability we also recorded flake cutting edge length, flake diameter233
and flake mass.234
235
Fla ke qua lity236
Based upon the 10-point quality ratings by the triple coders, a metric for flake quality was237
developed such that all flakes could be assigned a numerical quality rating that could be subject238
to analysis. Following Braun & Harris1, the metric began with:239
240
quality = flake cutting edge/flake mass(1/3) (1)241
242
This scores flakes according to how much cutting edge they had, but the cube root function243
prevents larger flakes from being penalised by their large size (when scaled up by length, a flakes244
mass will increase by the scaling factor cubed). However, this formula does not take into account245
size, which is clearly of relevance to flake quality, as excessively small flakes will be unusable246
and excessively large flakes will be wasteful of raw material. To include flake diameter the247
metric was extended to248
249
quality = (flake cutting edge/flake mass(1/3))*f(flake diameter), (2)250
251
where f(flake diameter) was an unknown function, with the constraint that f(x) ≥0. To estimate 252

26
the shape of f(x) the quality ratings of the three triple coders were modelled with a binomial error253
structure (where n was 10 as the ratings were on a 10 point scale). The probability of a success254
was transformed into the positive continuous variable “quality”, which was modelled with the255
above formula. The unknown diameter function was modelled as categorical such that it could256
take independent values for diameters at intervals of one centimetre. Visual inspection of the257
estimated values of this function at each centimetre interval strongly suggested a cumulative258
exponential function was appropriate and so the model was re-run with the function of flake259
diameter as a cumulative exponential distribution such that260
261
quality = (flake cutting edge/flake mass^(1/3))*(1-exp(-lambda*(flake diameter – offset))), (3)262
263
where lambda is a positive continuous variable that sets the gradient of the cumulative264
exponential function and offset is the minimum possible diameter of a flake to have any quality265
whatsoever. Offset was given a uniform prior ranging between 0 and 2 as flakes cannot be less266
than 0cm across and it was already decided that flakes over 2 could have some quality. The267
model estimates of these two parameters were: lambda = 0.31 [0.28, 0.35]; offset = 1.81, [1.69,268
1.90]. The posterior distribution for offset sat comfortably within the interval specified by the269
prior, suggesting that it was an appropriate prior distribution. Given this, the final flake quality270
metric is:271
272
quality = (flake cutting edge/flake mass(1/3))*(1-exp(-0.31*(flake diameter – 1.81))) (4)273
274
This function rewarded flakes for a high cutting edge length and penalised flakes for being275

27
excessively small. Around a size of 2cm flakes were very heavily penalised; however, the effect276
of flake diameter flattens above 6cm such that further increases in size do not greatly increase277
quality. It is of note that the diameter function does not penalise flakes for being excessively278
large. This is presumably because most flakes produced by participants were small and so very279
few flakes were large enough to receive any penalisation.280
281
Vid e os282
The participants’ behaviour, as video recorded at all points in the learning, testing and teaching283
phases, was coded into one of the following categories:284
1. Knapping - when the participant directs their attention toward their own core and285
hammerstone with the aim of making flakes for their own ends e.g., knapping, looking,286
turning in hands.287
2. Observing - when the participant directs their attention to their tutor or their tutor’s flakes288
3. Teaching - when the participant directs their attention to their pupil or knaps for the289
benefit of their pupil290
4. Choosing - when the participant directs their attention to flakes they have produced as if291
considering the quality or nature of them. If the participant proceeds to try to knap the292
flake this no longer counts as choosing and instead counts as knapping.293
5. Other - any behaviours that do not fit into the above categories.294
295
Additionally, the time of every strike of the core with the hammerstone was recorded. As a test of296
coding accuracy, ten participants were randomly chosen (2 from each condition, 10% of all297
participants) and their videos were coded by TM and RK. We modelled the absolute magnitude298

28
of the disagreement between total time spent knapping and total number of hits for each of the299
coders as these were the variables used in further analyses. In the case of time spent knapping we300
used a gamma error structure and the expected difference is 20.4s, [14.0, 31.2]. As a proportion301
of the average time for which participants were present this is 0.04, [0.03, 0.07] which is a very302
low proportion of disagreement. In the case of total hits we used a poisson error structure and the303
expected disagreement is 7.7 hits [6.7, 8.8], as a proportion of the average number of times each304
participant hit the core with their hammerstone this is 0.04, [0.04, 0.05]. Given this high level of305
agreement RK went on to code all the remaining videos.306
307
La ng ua g e308
Whilst coding the videos as described above, RK also transcribed everything that was said by309
participants. This was then coded by TM as follows. Initially, each transcript was split into310
utterances, defined as a single stretch of verbal communication by a single participant. Thus an311
utterance ends with a pause or when the other participant says something. Each utterance was312
scored according to the following categories which are not mutually exclusive in that a single313
utterance could (in theory) score positively for every category:314
315
1. Said by the tutor – was the utterance said by the teaching participant.316
2. Teaching – did the utterance transmit knapping relevant information to the other317
participant (note, this could be from the learner to the demonstrator) e.g. “You want to318
rest the flint core on your left leg” which transfers knowledge of how to hold the core.319
3. Feedback - was the utterance giving feedback on performance, in terms of encouraging320
good behaviour or vice-versa. Note, feedback is a type of teaching. e.g. “So that's the sort321

29
of thing you want to, that's brilliant”322
4. Confirmation of understanding - was the purpose of the utterance to confirm that the323
speaker had understood something. Note, most instances of the word “yes” were coded in324
this category and not as a “yes/no”. e.g. “Ok, of course”, but not “So you're always trying325
to hit above a ridge then?” which would be coded as a question326
5. Watch this - was the utterance directing attention to the speaker it order to demonstrate327
something. e.g. “just...” followed by the speaker knapping328
6. This/that - did the utterance use words such as this or that to indicate objects or locations.329
e.g. “That one's no good, is it?”330
7. Requesting Information - was the utterance a request for knapping relevant information.331
e.g. “So you're always trying to hit above a ridge then?” which requests information on332
where to hit333
8. Conveying uncertainty - did the utterance include an expression of uncertainty. e.g.334
“Maybe that bit's kind of hanging over and there's kind of an under-hang, try that”, note335
use of maybe, kind of and try that.336
9. Abstract - did the utterance use abstract descriptions that gave general information not337
specific to a single case. e.g. “Find an edge, do you have an edge with black stuff on the338
other side as well?” which describes the general procedure for identifying an edge339
without cortex, as opposed to “Emm this is probably going to be your hit” where a340
participant simply points out a specific point with no generalisable information.341
10. Correct – was information in the utterance factually correct.342
11. Incorrect – was information in the utterance factually incorrect.343
344

30
In addition to the above categories the topic of the utterances (as opposed to their345
nature/purpose) was also categorized according to the following topics:346
1. knapping (a broad category)347
2. knapping site348
3. platform edge349
4. platform angle350
5. ridge351
6. force352
7. how to hit353
8. how to hold354
9. hammerstones355
10. cortex356
11. choosing flakes (a broad category)357
12. size of flakes358
13. cutting edge of flakes359
14. safety whilst knapping360
361
As with the previous categories, the topics are not mutually exclusive. Additionally topics 1 and362
10 (knapping and choosing flakes) are very broad with the other topics falling as sub-topics363
within these. For example, the topic “platform edge” is a sub-topic within “knapping” as by364
talking about the platform edge you are also talking about knapping.365

31
366
Ana lyse s367
We analysed the number of total flakes, viable flakes, non-viable flakes, selected flakes and368
non-selected flakes that each participant produced with a poisson error structure. We also369
analysed the proportion of flakes that are viable and the proportion of flakes that are370
selected using a binomial error structure. The total number of flakes produced was used as the371
number of trials and the number of viable or selected flakes was the number of successes. The372
proportion of flakes that were non-viable and not selected was not analysed as they are the373
inverse of the proportion of flakes that are viable and selected respectively. Using a gamma error374
structure we also analysed the sum of the cutting edge length, the sum of the mass and the375
sum of the quality of all flakes produced by participants. All of these models used a logarithmic376
link function, except for the binomial models that used a logit link function, and the linear377
predictor contained categorical effects of condition that interacted with a linear effect of position378
along the chain and a linear effect of core mass. Individual level effects were not included as379
each individual only contributed a single data point to each analysis.380
381
Using a hurdle model we analysed the proportion (by mass) of the participant's core382
remaining after knapping. First the model analysed whether a participant had any of their core383
remaining at all with a bernoulli error structure and logit link function, then in the cases where384
there was some core left it analysed the proportion left with a beta error structure and logit link385
function. These two elements could then be combined to produce an estimate of the expected386
core remaining. In both parts of the model the linear predictor contained categorical effects of387

32
condition that interacted with a linear effect of position along the chain. Individual level effects388
were not included as each individual contributed only a single data point to each analysis.389
390
We modelled the number of hits per minute spent knapping and the number of flakes391
produced per minute (both all flakes and viable flakes) with a lognormal model, and the392
probability each hit produces a viable flake with a binomial model and logit link function. In393
these cases the linear predictor contained categorical effects of condition that interacted with a394
linear effect of position. There were no effects of core mass as it was deemed implausible that395
this could have an effect on the variables investigated.396
397
The total number of utterances said was analysed with a poisson error structure. The model398
incorporated chain length with a function that set a baseline number of utterances, an initial399
deviation to this number that set the initial value and then a rate parameter that set the rate at400
which the value approached the baseline from the initial value. The shape of the function was401
that of a cumulative exponential function. The model included a random effect of repeat for the402
initial value and did not need to include condition as only VT allowed language. We also403
analysed the probability a given utterance satisfied each of the above categories or covered404
each of the above topics with bernoulli error structures and logit link functions. The linear405
predictor used the same function as the model for the total number of utterances. We also406
investigated whether different topics were transmitted with greater accuracy by modelling407
whether an utterance was scored as correct or incorrect with a bernoulli error structure and408
logit link function. The linear predictor contained categorical effects of all the topics (other than409
knapping and choosing flakes as the sub-topics were included instead).410

33
411
As a test of robustness, the analyses of the numbers of flakes produced412
(all/viable/nonviable/selected/nonselected) and the probability that each hit produces a viable413
flake, were repeated with a subset of the dataset such that only flakes > 5cm in diameter were414
included. This did not qualitatively change results and so below we present the results of the415
analyses where the minimal limit on size was 2cm.416
417
As the relationship between gestural teaching and verbal teaching was of particular interest we418
carried out two further analyses comparing the two. Firstly we modelled the probability that the419
median aggregate performance estimates was greater with verbal teaching than with gestural420
teaching with a Bernoulli error structure (no link function was needed). The data consisted of 6421
measures of aggregate performance: the total quality of all flakes, the number of viable flakes,422
the proportion of flakes that are viable, the number of viable flakes produced per minute spent423
knapping, the proportion of core reduced and the probability of a viable flake per hit. Secondly424
we modelled the probability that the main analyses found strong evidence of a difference425
between verbal teaching or gestural teaching and the three other conditions (reverse engineering,426
imitation/emulation and basic teaching). The analyses used the six aggregate measures of427
performance and used a binomial error structure, where strong evidence of a difference counted428
as a success and the number of trials was 18 (6 measures of performance x 3 comparison429
conditions = 18 trials).430
431

34
Supple m e nta ryNote 1432
433
A Glossary of Knapping Terms434
435
Successful knapping - the production of sharp flakes by striking a core with a hammerstone - is a436
somewhat complex procedure. Here we outline some key elements in order to explain some of437
the terms used throughout the main paper.438
439
Platform edge440
To reliably produce flakes the hammerstone should strike the core on a flat surface near an edge.441
This distance from the point of percussion to the edge is very important and has a large impact442
on the size of flakes produced. Generally, a distance to the edge of about 1cm is appropriate. See443
Supplementary Figure 1 for a helpful diagram.444
445
Platform angle446
The surface struck with the hammerstone needs to be slightly overhanging. The angle between447
the struck surface and the surface below (with its vertex at the nearest point where the two448
surfaces meet) is the exterior platform angle (EPA). For successful knapping this must be below449
90 degrees, ideally around 70 degrees. See Supplementary Figure 1 for a helpful diagram.450
451
Ridge452

35
Ideally, the surface below the platform edge should have a ridge in the rock to direct the force.453
This helps control the size and shape of flakes produced.454
455
Force456
There is an appropriate amount of force with which to strike the core with the hammerstone. Too457
little and a flake will not be produced, but the core may be damaged. Too much and the core458
could crack into many pieces.459
460
Cortex461
Flint grows underground within chalk. When flint nodules are dug-up they have an outer layer of462
chalky cortex. This is not suitable for knapping and so needs to be removed for successful463
knapping.464
465
466

36
Supple m e nta ryRe fe re nc e s467
468
1. Braun, D. R., & Harris, J. W. K. (2003). Technological developments in the Oldowan of469
Koobi Fora: Innovative techniques of artifact analysis. Oldowan: Rather More than470
Smashing Stones, 117–144.471
2. Key, A. J. M., & Lycett, S. J. (2014). Are bigger flakes always better? An experimental472
assessment of flake size variation on cutting efficiency and loading. Journal of473
Archaeological Science, 41, 140–146.474
475