explaining the user experience of recommender systemsan integrated view on the user experience of...
TRANSCRIPT

User Model User-Adap Inter (2012) 22:441–504DOI 10.1007/s11257-011-9118-4
ORIGINAL PAPER
Explaining the user experience of recommender systems
Bart P. Knijnenburg · Martijn C. Willemsen ·Zeno Gantner · Hakan Soncu · Chris Newell
Received: 30 November 2010 / Accepted in revised form: 30 August 2011 /Published online: 10 March 2012© The Author(s) 2012. This article is published with open access at Springerlink.com
Abstract Research on recommender systems typically focuses on the accuracy ofprediction algorithms. Because accuracy only partially constitutes the user experienceof a recommender system, this paper proposes a framework that takes a user-centricapproach to recommender system evaluation. The framework links objective systemaspects to objective user behavior through a series of perceptual and evaluative con-structs (called subjective system aspects and experience, respectively). Furthermore,it incorporates the influence of personal and situational characteristics on the userexperience. This paper reviews how current literature maps to the framework andidentifies several gaps in existing work. Consequently, the framework is validated
B. P. Knijnenburg (B)Department of Informatics, Donald Bren School of Information and Computer Sciences,University of California, Irvine, CA 92697, USAe-mail: [email protected]
B. P. Knijnenburg · M. C. WillemsenHuman-Technology Interaction Group, School of Innovation Sciences, Eindhoven Universityof Technology (TU/e), P.O. Box 513, 5600 MB, Eindhoven, The Netherlandse-mail: [email protected]
Z. GantnerInformation Systems and Machine Learning Lab (ISMLL), University of Hildesheim,Marienburger Platz 22, 31141 Hildesheim, Germanye-mail: [email protected]
H. SoncuEuropean Microsoft Innovation Center GmbH, Ritterstrasse 23, 52072 Aachen, Germanye-mail: [email protected]
C. NewellBBC Research & Development, Centre House, 56 Wood Lane, London, W12 7SB, UKe-mail: [email protected]
123

442 B. P. Knijnenburg et al.
with four field trials and two controlled experiments and analyzed using StructuralEquation Modeling. The results of these studies show that subjective system aspectsand experience variables are invaluable in explaining why and how the user experi-ence of recommender systems comes about. In all studies we observe that perceptionsof recommendation quality and/or variety are important mediators in predicting theeffects of objective system aspects on the three components of user experience: pro-cess (e.g. perceived effort, difficulty), system (e.g. perceived system effectiveness) andoutcome (e.g. choice satisfaction). Furthermore, we find that these subjective aspectshave strong and sometimes interesting behavioral correlates (e.g. reduced browsingindicates higher system effectiveness). They also show several tradeoffs between sys-tem aspects and personal and situational characteristics (e.g. the amount of preferencefeedback users provide is a tradeoff between perceived system usefulness and privacyconcerns). These results, as well as the validated framework itself, provide a platformfor future research on the user-centric evaluation of recommender systems.
Keywords Recommender systems · Decision support systems · User experience ·User-centric evaluation · Decision-making · Human-computer interaction ·User testing · Preference elicitation · Privacy
1 Introduction
Recommender systems are designed to help the user make better choices from largecontent catalogs, containing items as distinct as books, movies, laptops, cameras,jokes, and insurance policies (Xiao and Benbasat 2007; Resnick and Varian 1997).Before the advent of recommender systems, such content-based systems would offerusers the entire catalog (possibly with a generic search/filter feature). Recommendersystems, on the other hand, offer each user a personalized subset of items, tailoredto the user’s preferences. The system derives these user preferences from implicit orexplicit feedback (Pommeranz et al. 2012). Implicit feedback recommenders analyzeclicking/purchasing behavior (e.g. amazon.com, see also Hauser et al. 2009). Explicitfeedback recommenders let users rate items, (e.g. youtube.com, see also McNee et al.2002; Cena et al. 2010; Gena et al. 2011), critique items (see also Chen and Pu 2012;Viappiani et al. 2006), assign weights to item attributes (see also Häubl et al. 2004), orindicate their specific needs (e.g. HP.com ‘help me choose’, see also Felix et al. 2001).Finally, the system calculates recommendations by comparing the user’s preferencesto the features of the catalog items (content-based recommender systems), or to otherusers’ preferences (collaborative filtering recommenders).
A typical interaction proceeds as follows: First, the user’s preferences are elicited.Based on the collected preference data, the system tries to predict how much the userwould appreciate each of the available items in the catalog. Finally, the system presentsthe user those items that have the highest predicted value to the user. In some recom-mender systems this terminates the interaction, in other systems the users continue toindicate their preferences and receive recommendations continually.
An essential aspect of any recommender system is the algorithm that provides per-sonalized recommendations based on the user’s preferences (Burke 2002). The more
123

Experience of recommender systems 443
accurate the predictions of this algorithm, the more accurately the system can pre-dict the best recommendations for the user. Not surprisingly, a significant part of theresearch on recommender systems concerns creating and evaluating better predictionalgorithms (McNee et al. 2006a; Cosley et al. 2003; Ziegler et al. 2005). An excellentoverview of available algorithms can be found in Burke (2002) and in Adomavicius andTuzhilin (2005); more recent approaches were presented in Koren et al. (2009), Koren(2010) and Hu et al. (2008). Herlocker et al. (2004) provide a thorough discussion ofavailable evaluation metrics.
The premise of this algorithm research is that better algorithms lead to perceiv-ably better recommendations, which in turn lead to better user experience in termsof choice satisfaction and perceived system effectiveness. However, several research-ers have argued that there are other factors that influence the user experience (users’subjective evaluation of their interaction with the system), and that these factors havenot received the amount of attention they deserve (McNee et al. 2006a,b; Cosleyet al. 2003; Murray and Häubl 2008, 2009; Ozok et al. 2010; Pu et al. 2012; Kon-stan and Riedl 2012). System aspects other than accuracy can influence satisfactionand other evaluative measures (e.g. diversification; Ziegler et al. 2005; Willem-sen et al. 2011). Furthermore, situational or personal aspects (e.g. product exper-tise; Kamis and Davern 2004; Knijnenburg and Willemsen 2009, 2010; Knijnenburget al. 2011; and privacy concerns; Teltzrow and Kobsa 2004; Komiak and Benbasat2006) can also influence how people interact with and evaluate the system. Unfor-tunately, even studies that consider aspects other than accuracy look at a limitedset of variables that influence each other (e.g., how satisfaction changes due to adiversification, or how choices become more accurate with the inclusion of a rec-ommender engine) without integrating these variables into a model of overall userexperience.
An integrated view on the user experience of recommender systems can beobtained by means of user-centric development (McNee et al. 2006b) and evaluation(Pu and Chen 2010; Pu et al. 2012). The current paper therefore extends and testsour user-centric evaluation framework for recommender systems proposed in Kni-jnenburg et al. (2010a). To understand and improve the user experience of recom-mender systems, it is necessary to conduct empirical evaluations that consider theentire process of how the user experience comes about. Therefore, our frameworkdescribes how objective aspects of the system (e.g. the algorithms used) are sub-jectively perceived by the user (e.g. if they perceive differences in recommendationquality for these different algorithms), and how these perceptions, together with per-sonal and situational characteristics, result in specific user experience and interac-tion with the system (e.g. whether a higher perceived recommendation quality leadsto a more positive evaluation of the system, a higher satisfaction with the chosenitems, and a change in user behavior). Such a framework will provide a deeper under-standing of how objective system aspects influence the user experience and behaviorthrough perceived system aspects. It thereby allows for a better understanding of whyand how certain aspects of the system result in a better user experience and othersdo not, which helps further user-centric research and development of recommendersystems.
123

444 B. P. Knijnenburg et al.
2 Components of the framework
The main goal of our framework is to provide a set of structurally related concepts thatcan be used in empirical studies to describe and measure the user experience of recom-mender systems. User experience is an ill-defined concept, and lacks well-developedassessment methods and metrics (McNamara and Kirakowski 2006; Law et al. 2009).In our framework, we distinguish between objective system aspects, (e.g. algorithms,user interface features), subjective system aspects (users’ perceptions of these objec-tive system aspects), and user experience (users’ evaluations of their interaction withthe system) and interaction (users’ behaviors). We also consider the context of theinteraction in terms of personal and situational characteristics. Before we describethe framework itself, we will discuss several theories that served as a basis for ourframework.
2.1 Existing theories
2.1.1 Normative and attitudinal models
At the core of many psychological models of human behavior is the Theory of Rea-soned Action (TRA) by Fishbein and Ajzen (1975). This theory claims that attitudinaland normative factors influence behavioral intention, which in turn predicts actualbehavior. Davis et al. (1989, see also Davis 1989) adopted the attitudinal part of thistheory in their Technology Acceptance Model (TAM). In the TAM, the attitude towardsusing a technology is explained by the perceived usefulness and perceived ease of useof the system. Venkatesh et al. (2003) created a similar theory called the Unified The-ory of Acceptance and Use of Technology (UTAUT), based on the normative part ofTRA, showing how personal and situational characteristics can influence behavioralintention. In the UTAUT, attitudinal concepts are entirely replaced by more experi-ence-related evaluative concepts (performance expectancy, effort expectancy, socialinfluence, and facilitating conditions).
With respect to our framework, these theories make a distinction between behav-iors (and behavioral intentions) and the attitudes that cause these behaviors. Theseattitudes are in turn caused by experiential factors like perceived usefulness and easeof use (TAM), and by personal and situational characteristics (UTAUT).
2.1.2 User experience models
Hassenzahl (2008) defines user experience (UX) as “a momentary, primarily evalua-tive feeling (good-bad) while interacting with a product or service. Good UX is theconsequence of fulfilling the human needs for autonomy, competence, stimulation(self-oriented) through interacting with the product or service (i.e. hedonic quality).”Hassenzahl’s (2005) model of user experience describes how certain objective aspectsof the system (e.g. its interaction and presentation style) are perceived in terms ofpragmatic attributes (i.e. does the system deliver high quality results in an effortless
123

Experience of recommender systems 445
way?) and hedonic attributes (i.e. does it stimulate, is it desirable?). These perceptionsin turn cause an experiential evaluation in terms of appeal, pleasure and satisfaction.
With respect to our framework, Hassenzahl’s model links objective system aspectsto evaluative experiential factors through subjective perceptions. The distinctionbetween perception and evaluation is subtle but important: Perception denotes whethercertain objective system aspects register with the user at all, while evaluation denoteswhether the perceived aspect has any personal relevance to the user. This may forinstance give us an insight in why users may perceive a change in recommendationquality but at the same time do not show a change in experience or behavior.
Furthermore, whereas the TRA-related theories are restricted to pragmatic attri-butes, Hassenzahl also stresses the importance of hedonic attributes. Experimentalevidence shows that hedonic attributes like pleasure and ‘flow’ (a feeling of automaticand highly focused interaction; Csikszentmihalyi 1975) indeed also determine the userexperience (Koufaris 2003; Hsu and Lu 2004; Yu et al. 2005).
2.1.3 User experience models for recommender systems
Hayes et al. (2002) propose a framework for testing the user satisfaction of recom-mender algorithms in operational systems. Their approach is restricted to behavioralmeasures of satisfaction, and their focus is primarily on the algorithm. Furthermore,Hayes et al.’s work has limits because they advocate a setup in which several algo-rithms are tested at the same time for the same user, an approach which provides asignificant departure from the normal user experience of a recommender system whichgenerally employs only one algorithm at a time.
Zins and Bauernfeind (2005) constructed a model of the user experience of recom-mender systems based on a survey conducted among users of two travel recommendersand a system for finding digital cameras. Their model shows how personal charac-teristics influence trust, flow, and browsing behavior, and how these in turn influencesystem satisfaction. A clear limitation of their model is that it does not explain howobjective system aspects may influence the user experience.
McNee et al. (2006b) created an analytic model of Human-Recommender Inter-action (HRI) for the development of recommender systems. The goals and tasks ofthe users are analyzed and used to determine the appropriate recommender systemdialogue and ‘personality’. McNee et al.’s model clearly serves a different purposethan our framework (development as opposed to evaluation). They do however sug-gest linking subjective HRI metrics to traditional objective performance metrics ofalgorithm accuracy, and stress the importance of the context (e.g. users’ goals andtasks) in which recommendations are made.
Xiao and Benbasat (2007) presented an extensive literature review of the marketing-oriented research on recommender systems. Their overview, too, provides insight intothe mechanisms underlying the user experience of recommender systems, albeit frommany different studies (each focusing just on one part of the entire experience). Theirresulting framework shows how certain characteristics of recommender systems causechanges in users’ evaluation and decision-making behaviors, and in their adoption ofthe recommender system. It also includes personal and in situational characteristicsthat moderate these effects. The framework we present below bears a lot of similarity
123

446 B. P. Knijnenburg et al.
to Xiao and Benbasat’s (2007) framework, but goes beyond it by including subjectivesystem aspects. Moreover, while their framework is constructed mainly for the pur-pose of summarizing existing research, we pose our framework as a starting-point forthe evaluation of recommender systems.
Pu and Chen (2010, see also Pu et al. 2012) provide an extensive questionnaire to testseveral specific experience concepts of recommender systems. Their research modelalso explicitly considers perceived system qualities as antecedents of user beliefs, atti-tudes and behavioral intentions, and in that way it is similar to our framework. Ourframework, however, takes a more abstract approach by providing a description of thestructural relationships between the general, higher level concepts that play a role inuser experience, without strictly specifying operational, lower level constructs and thequestions that measure them.1 To answer specific research questions, researchers needto define and operationalize a set of specific, lower level constructs, and Pu and Chen’squestionnaires can be used as a starting point for this operationalization; another optionis to use the pragmatic procedure for recommender system evaluation that is based onour framework (Knijnenburg et al. 2011a). However, since user experience is highlycontingent upon the purpose of the system under evaluation, the specific concepts andspecific questionnaire items to measure these concepts may differ from study to study.Moreover, Pu and Chen’s model does not include context (personal and situationalcharacteristics), and it does not suggest how objective system aspects influence thevarious constructs in their framework, making it more difficult to select concepts fromtheir framework for a particular user study.
Ozok et al. (2010) provide a wide range of design guidelines based on a question-naire of recommender system usability. Their results describe the effects of specificsystem aspects on the usability of recommender systems. However, they employ adescriptive approach, which relies on the users’ stated opinions about recommendersystems in general instead of experimental manipulations of a specific system.
2.2 The main structure of the framework explained
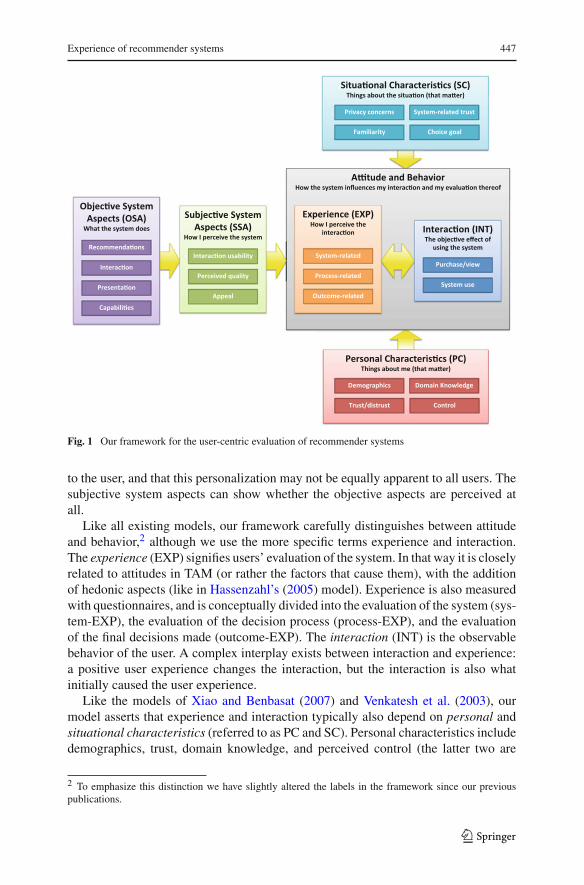
Figure 1 shows our framework. Like Hassenzahl (2005) and Xiao and Benbasat (2007),we take objective system aspects (OSA) as a starting point for the evaluation. Theobjective system aspects consist of the algorithms used by the system, the visualand interaction design of the system, the way it presents the recommendations, andadditional features such as social networking. Like Hassenzahl (2005), we link theseobjective system aspects to subjective system aspects (SSA), which represent users’perception of the objective system aspects. Also like in Hassenzahl (2005) model,these subjective system aspects include both pragmatic characteristics (usability andquality) and hedonic characteristics (appeal). The subjective system aspects, mea-sured with questionnaires, are expected to mediate the influence of the objective sys-tem aspects on the user experience. The main reason for including subjective systemaspects as mediators is that recommender systems provide a personalized experience
1 In this respect, our framework resembles Fishbein and Ajzen (1975) TRA, which also instructs researchersto elicit a different set of personal and normative beliefs to measure per experiment.
123
Experience of recommender systems 447
Fig. 1 Our framework for the user-centric evaluation of recommender systems
to the user, and that this personalization may not be equally apparent to all users. Thesubjective system aspects can show whether the objective aspects are perceived atall.
Like all existing models, our framework carefully distinguishes between attitudeand behavior,2 although we use the more specific terms experience and interaction.The experience (EXP) signifies users’ evaluation of the system. In that way it is closelyrelated to attitudes in TAM (or rather the factors that cause them), with the additionof hedonic aspects (like in Hassenzahl’s (2005) model). Experience is also measuredwith questionnaires, and is conceptually divided into the evaluation of the system (sys-tem-EXP), the evaluation of the decision process (process-EXP), and the evaluationof the final decisions made (outcome-EXP). The interaction (INT) is the observablebehavior of the user. A complex interplay exists between interaction and experience:a positive user experience changes the interaction, but the interaction is also whatinitially caused the user experience.
Like the models of Xiao and Benbasat (2007) and Venkatesh et al. (2003), ourmodel asserts that experience and interaction typically also depend on personal andsituational characteristics (referred to as PC and SC). Personal characteristics includedemographics, trust, domain knowledge, and perceived control (the latter two are
2 To emphasize this distinction we have slightly altered the labels in the framework since our previouspublications.
123

448 B. P. Knijnenburg et al.
prominent in TRA). Situational characteristics are dependent on the context of theinteraction; at different points in time, users may have different choice goals, trust andprivacy concerns, and familiarity with the system (McNee et al. 2006b).
3 Expected benefits of our framework
Our framework explicitly links the objective interaction (INT) to objective systemaspects (OSA) through a series of subjective constructs (SSA and EXP). The frame-work can be used as a guideline for controlled user experience tests. Specifically, bymanipulating a certain system aspect (OSA) in a controlled experiment (keeping allother aspects the same), one can identify the effect of this aspect on the users’ per-ceptions (SSA), experience (EXP) and behaviors (INT). By careful manipulation ofspecific objective system aspects, researchers can uncover generic truths about recom-mender systems. These can then inform the design and development of future versionsof the studied aspects.
Moreover, the framework allows one to conduct empirical evaluations in a moreintegrative fashion than most existing recommender systems research: It allowsresearchers to consider the interplay between multiple objective system aspects (e.g.algorithm versus interface), as well as to investigate the trade-offs between severalaspects of user experience (e.g. satisfaction versus choice difficulty).
The framework provides insight into the relationships between the general con-cepts that play a role in the user experience of recommender systems. By tailoring theoperationalization of these general concepts to the specific system under evaluation,the framework can be applied to a range of different types of consumer-facing rec-ommender systems, including e-commerce recommenders (recommending products),media recommenders (recommending, for example videos, music or news articles)and social network recommenders (recommending users to befriend or follow). Toexemplify this point, in the remainder of this section we use our framework to mapa wide array of existing research. Most of this existing research (as well as our ownempirical work) specifically considers what in the realm of e-commerce recommend-ers has been called “experience products”, for which the quality is hard to determinebefore purchase, as opposed to “search products”, which have attributes that can beconsidered before the decision is made (Nelson 1970). Because it is hard to determinethe quality of experience items before the actual decision is made, decision-makingprocesses for such items typically rely more heavily on recommendations and otherexternal sources of information (Bhatnagar and Ghose 2004; Stolze and Nart 2004;Huang et al. 2009; Ochi et al. 2010).
To conclude this section, we indicate specific gaps in current knowledge, and pro-vide an overview of the research opportunities that these gaps present. In the subsequentsection, we present the results of several empirical evaluations that use parts of theframework for their main hypotheses. After presenting the results of these evaluationsone by one, the findings will be integrated under the generic concepts of the frame-work. This will allow us to validate the framework, and to take a first step towardsbridging the uncovered gaps. To effectively integrate our findings, we limited ourempirical evaluations to media recommenders.
123

Experience of recommender systems 449
3.1 The objects of user experience evaluation
User experience as defined in our framework (EXP) is not a one-dimensional concept;it may entail various aspects (broadly ranging from pragmatic to hedonic concepts) andseveral different objects of evaluation. Especially for recommender systems, knowingthe object of evaluation is critical in understanding the dynamics of the user expe-rience (Pathak et al. 2010; Tintarev and Masthoff 2012): When we say that the userexperience of recommender system X is better than that of system Y, are we evaluatingthe system, the process of using the system to get to a decision, or the chosen itemitself? This distinction is important, as different system aspects may influence differentobjects of user experience; a visually attractive interface may improve the evaluationof the system (system-EXP), a good preference elicitation method may make decisionseasier (process-EXP), and an accurate algorithm may increase the quality of the finaldecision (outcome-EXP).
Furthermore, the evaluations of the different experience objects may influence eachother. For instance, a positive evaluation of the chosen item(s) may “rub off” on theevaluation of the system. To capture the multi-faceted nature of user-experience, ourframework therefore considers each of these objects: the system, the process, and theoutcome.
In current research, however, this is rarely done; researchers in different domains usedifferent objects of evaluation. Particularly, marketing and decision-making research-ers mainly look at the outcome-EXP variables such as the quality of the choice, theusers’ confidence in making the right choice, and the satisfaction with the chosen item(Hostler et al. 2005; Pedersen 2000; Vijayasarathy and Jones 2001; Krishnan et al.2008; Bechwati and Xia 2003). They rarely take the system or the choice process asfocal points of evaluation.
Human–computer interaction (HCI) researchers have traditionally been more com-prehensive in the coverage of all objects of user experience of their research. However,this field has a tendency towards formative evaluations such as Think Aloud testingand Heuristic Evaluation (Van Velsen et al. 2008). The results of such evaluationsare limited in generalizability, and therefore not the focus of this paper. The availablesummative evaluations in the HCI field primarily report on system-EXP variables suchas system quality and user loyalty (also operationalized as the intention to return), onprocess-EXP variables such as cognitive effort and competence in using the system,and on outcome-EXP variables such as decision satisfaction (Pu and Chen 2007; Chenand Pu 2009; Pu et al. 2008; Bharati and Chaudhury 2004; Ochi et al. 2010; Hu andPu 2009, 2011; Jones et al. 2009; Felfernig et al. 2007).
According to our framework (Fig. 1), these user experience effects do not standalone, but are instead part of a larger chain of effects. Specifically, in the followingsections we will argue that the user experience (EXP) is caused by objective systemaspects (OSA, via SSA) and personal or situational characteristics (PC or SC). More-over, the experience variables themselves may be structurally related to one another:Bharati and Chaudhury (2004), for instance, showed that the perceived quality of thesystem (system-EXP) positively influences the decision satisfaction (outcome-EXP).Although Bharati and Chaudhury investigate the objective system aspects in their study
123

450 B. P. Knijnenburg et al.
(by manipulating the recommender system under evaluation), they do not include theobjective system aspects in the analyzed chain of effects.
3.2 From accuracy to user experience
A large part of existing recommender systems research is focused on creating betterprediction algorithms, thereby implicitly assuming that better algorithms will leadto a better user experience. Explicitly testing this assumption would require empir-ical evaluations with real users on real systems. Several researchers in marketingand decision-making conducted such user-centric evaluations of their recommendersystems. For instance, they looked at the reduction in choice effort through a rec-ommender system (Häubl et al. 2004; Pedersen 2000; Vijayasarathy and Jones 2001;Diehl et al. 2003; Häubl and Trifts 2000; Hostler et al. 2005). However, they usuallycompare a recommender system against a system without recommendation features(or a recommender system against no system at all), rather than looking at the oftensubtle differences between algorithms. The results of such unbalanced comparisons,in which the “personalized” condition clearly has an advantage over the non-person-alized condition, are usually unsurprising (see Van Velsen et al. 2008). However, Chin(2001) argues that this advantage is not always apparent and that a comparison witha non-personalized system may very well be justified. Some researchers compare arecommender system against human recommenders (Krishnan et al. 2008; Stolze andNart 2004), but these studies provide little insight into the effect of algorithm accuracyon the user experience; for that, several algorithms should be pitted against each other.
Surprisingly few studies compare algorithms in live experiments with real users.Researchers who do compare the user experience effects of several algorithms find sur-prising results. In a comparison of six recommender algorithms, McNee et al. (2002)found that although the “Item-Item CF” algorithm provided the best predictions, usersrated it the least helpful. Torres et al. (2004) found that although the “CBF-separatedCF” approach had the lowest predictive accuracy among five algorithms, this approachresulted in the highest user satisfaction. In other words, the presumed link betweenalgorithm accuracy (an OSA) and user experience (EXP) is all but evident. Our frame-work allows researchers of recommender systems to take a step beyond algorithmicaccuracy (OSA) towards its effects on user experience (EXP).
3.3 Subjective system aspects as mediators
The presented framework indicates that the apparent missing link between algorithmaccuracy and user experience can be found in mediation through perception. The linkbetween algorithm accuracy (an OSA) and user experience (EXP) is often weak (Chin2001), and can then only be established by including the mediation through the users’perception of the algorithm accuracy (an SSA). In other words, the framework hypoth-esizes that users can perceive algorithm accuracy, and that this perception influencesthe experience (OSA → SSA → EXP).
In light of these hypotheses, existing research has established that users are, inseveral instances, able to observe objective differences in recommendation quality (in
123

Experience of recommender systems 451
terms of the framework: OSA → SSA; for examples, see Ziegler et al. 2005; Cosleyet al. 2003). It is however not clear how these (typically subtle) differences in per-ceived recommendation quality affect the user experience (SSA → EXP), becausefew researchers have tested the effect of their algorithms on the users’ perception,behavior and experience.
This gap in existing research (i.e. not measuring the SSA as a mediator betweenOSA and EXP) makes it hard to explain why in some experiments better algorithmsdo not lead to a better experience. One possible reason might be that users were notable to notice the quality differences (the OSA does not affect the SSA), e.g., thequality differences between two algorithms may have been too small to notice, andthus would not influence the user experience. Another possible explanation (which isnot mutually exclusive) might be that users may have observed the quality differences,but may just not have been influenced by these differences in their experience (no linkbetween SSA and EXP), e.g., they may actually like to see good recommendationsaccompanied with some bad ones, as it makes their final decision easier to justify.Finally, an effect of accuracy on experience may exist, but just be overshadowed byindividual differences of perception (this is not unlikely for recommender systems, astheir effect is not equally pronounced for each user). In such case one should measurewhether the user actually noticed the quality difference or not (SSA is needed as amediator between OSA and EXP).
The inclusion of SSAs may thus increase the robustness of the effects of the OSAson EXP. Moreover, SSAs provide a more thorough understanding of how and whycertain features of a recommender system affect the user experience. This does notonly hold for algorithm accuracy, but for any manipulated objective system aspects.Chen and Pu (2009) have created a chain of effects from objective algorithm accuracy(OSA) to user-perceived algorithm accuracy (SSA), from objective user effort (OSA)to user-perceived effort (SSA), and from the perceived accuracy and effort (SSA) tointention to purchase and intention to return (INT). They find significant differencesbetween their two tested interfaces for each of these constructs. This path analysis isan important step towards an integrated analysis of recommender system experience,but in our approach we extend it in two directions: First of all, we include the manip-ulations that cause the objective differences in the model. In the Chen and Pu studythey cause significant differences in each construct individually, but an inclusion ofthe manipulation as a dummy variable into the path model would allow for a mediationanalysis of the experimental effects. Secondly, we add constructs explicitly asking theusers about their experience (EXP).
3.4 Triangulation of (logged) behavioral data
Although user experience (EXP) is mainly a subjective phenomenon, its effects willlikely be reflected in the users’ observable behavior (INT). This idea is a fundamentalproperty of all theories based on Fishbein and Ajzen’s (1975) Theory of ReasonedAction, although we do not take the direction of the effect to be merely one-way.Whereas attitude causes behavior in TRA, our focus on experience (which is a muchmore interactive concept than attitude) also considers the inverse effect. For example:
123

452 B. P. Knijnenburg et al.
users who are more satisfied may increase their usage of the system (EXP → INT),while at the same time increased usage may cause an increase in satisfaction (INT →EXP).
Researchers in the field of algorithm accuracy predominantly use behavioral datafor their evaluations: they use logged clicks (either item selections or ratings) to trainand test their algorithms (Konstan and Riedl 2012). Researchers in marketing and deci-sion-making also analyze behavioral data, but focus more on decision time, switchingbehavior after the choice, or total consumption volume (Häubl et al. 2004; Pedersen2000; Vijayasarathy and Jones 2001; Stolze and Nart 2004; Hostler et al. 2005; Ho andTam 2005; Tam and Ho 2005; Pathak et al. 2010). A common problem with behav-ioral data, however, is that they are not always good indicators of users’ subjectiveexperience. For instance, Pu and Chen (2006) found that the actual time users spentlooking at items in their system did not correlate with users’ subjective perceptions,And Spiekermann et al. (2001) found that stated willingness to provide feedback didnot correlate with actual feedback behavior.
Another problem with behavioral data is that their interpretation is often trouble-some (Van Velsen et al. 2008). For instance, if users stay on a video clip recommen-dation site for a longer time, does this mean that the efficiency of the system is low(it takes longer for users to find what they want), or that the users enjoy the site more(to the point that they stay longer to watch more clips)? To solve this dilemma, VanVelsen et al. (2008) suggests to “triangulate” the objective behavioral data (INT) withthe subjective experience data (EXP) gathered through other methods (e.g. question-naires).
From a commercial perspective, influencing the users’ objective behavior may seemto be the primary objective of recommender systems research, such as getting the userto buy more products (in e-commerce recommenders) or watch more advertisements(in media recommenders). However, experience concepts reflect and influence users’attitudes towards a system, and research shows that positive attitudes are related toincreased adoption rates (Fishbein and Ajzen 1975; Davis et al. 1989; Venkatesh et al.2003). To get an indication of the longer-term effects of the system, behavioral datashould thus be complemented with subjective experience measurements. In our frame-work, behavioral data is therefore correlated (triangulated) with subjectively measuredexperience concepts.
3.5 Personal and situational characteristics in context
The user experience cannot be entirely attributed to the recommender system itself, itmay also depend on characteristics of the user (Personal Characteristics, or PC) andthe situation in which the user is using the system (Situational Characteristics, or SC)(Chin 2001). These factors are typically beyond the influence of the recommendersystem, but do influence the user experience.
Domain knowledge (or ‘expertise’) is an important PC variable in this respect:Kamis and Davern (2004) show that users with a higher level of domain knowledgeperceive recommender systems as less useful and harder to use than novices. In amusic recommender experiment, Hu and Pu (2010) show that expert users perceive
123
Experience of recommender systems 453
recommendations as less accurate, and the system as less helpful. They also state thatthey would use the system less. Overall, users with a moderate level of expertise ratethe system as most effective.
Users’ trust in the system may also influence their experience, and vice versa.Komiak and Benbasat (2006) show that good recommendations can increase trust inboth the competence and the integrity of a recommender system, and that a higherlevel of trust eventually leads to an increased intention to adopt the system. Wang andBenbasat (2007) show that trust in recommender systems is furthermore caused bydisposition (the user’s initial level of trust), calculation (the user’s estimation of thecosts and benefits for the system to be trustworthy), interaction (the user’s expectationsabout the system, control over the system, and validation of the system results) andknowledge (an inference based on what the user knows about the system). This makestrust both a PC (depending on the user’s personality) and an SC variable (dependingon the user, the system and the situation).
Very few studies have investigated which personal and situational characteristicsexactly motivate and inhibit users to provide preference feedback to the system (seePommeranz et al. 2012, for a notable exception). This is an important issue, as manyrecommender systems rely on explicit feedback (e.g. users’ ratings) to give goodrecommendations. Privacy concerns may reduce users’ tendency to disclose personalinformation (Teltzrow and Kobsa 2004; Chellappa and Sin 2005; Berendt and Teltzrow2005; Ackerman et al. 1999). On the other hand, if it positively influences their userexperience (i.e. in terms of better recommendations), users may be more willing toprovide feedback (Spiekermann et al. 2001; Brodie et al. 2004; Kobsa and Teltzrow2005).
The main shortcoming of existing research on personal and situational charac-teristics is that these characteristics are often investigated in isolation (again, seePommeranz et al. 2012, for a notable exception). This makes it hard to evaluate theimpact of these characteristics on the user experience relative to other possible factorsthat influence the user experience (e.g. is a certain PC → EXP more substantive thana certain SSA → EXP?), and to prove the effectiveness of possible remedies for neg-ative influences (e.g. can a certain positive SSA → EXP offset a certain negative PC→ EXP?).
In our framework personal and situational characteristics influence the user experi-ence, but we explicitly describe such effects in addition to the effects of manipulatedsystem aspects. This allows for judgments of relative importance, which are investi-gated thoroughly in our empirical evaluations.
3.6 Integration of user interface research
Both industry practitioners and academic researchers have argued that the interfaceof a recommender system may have far larger effects on users’ experience with therecommender than the recommender’s algorithmic performance (McNee et al. 2006a;Baudisch and Terveen 1999; Murray and Häubl 2008; Xiao and Benbasat 2007; Ziegleret al. 2005; Ozok et al. 2010). Below we provide a brief overview of user interfaceaspects (OSAs) influencing the user experience (EXP) of recommender systems.
123

454 B. P. Knijnenburg et al.
3.6.1 Preference elicitation method
The preference elicitation method is the way in which the recommender system dis-covers what the user likes and dislikes. In content-based recommender systems, usersmay indicate their preference by assigning weights to attributes (Häubl et al. 2004;Kramer 2007), prioritizing user needs (Felix et al. 2001; Stolze and Nart 2004; Huand Pu 2009) or critiquing examples (Pu and Chen 2006; Pu et al. 2008; Chen and Pu2012; Viappiani et al. 2006, 2008). The research on these different preference elicita-tion methods shows that they have a substantive impact on the user experience (Chenand Pu 2012). Moreover, the optimal preference elicitation method may depend onuser characteristics such as domain knowledge (Knijnenburg and Willemsen 2009,2010; Knijnenburg et al. 2011).
In collaborative filtering recommender systems, the two most common preferenceelicitation methods are explicit and implicit elicitation. In explicit elicitation, users ratethe items with, for example, one to five stars (see Gena et al. 2011, and Pommeranz et al.2012, for a user-centric exploration of various alternative explicit elicitation methods).In implicit elicitation, preferences are derived from an analysis of the browsing andselection behavior of users. Research shows that a combination of explicit and implicitelicitation results in a higher recommendation accuracy (Koren et al. 2009), but noresearch has investigated differences in user experience and behavior between explicitand implicit elicitation.3 Our framework provides the opportunity to investigate theeffects of preference elicitation beyond accuracy.
3.6.2 Size and composition of recommendation sets
Most recommender systems provide an ordered list of recommendations. Whereas asubstantial amount of research considers the individual qualities of these recommen-dations, little research has considered the composition of the list (Hu and Pu 2011;Chen and Pu 2012; Ziegler et al. 2005; Cooke et al. 2002). The composition mayplay an important role in the user experience of a recommender system, because itinfluences the users’ decision-making process through context effects (Simonson andTversky 1992; Tam and Ho 2005).
It is also unclear how many recommendations the system should provide. Inconventional choice situations, too few items may restrict the users’ freedom ofchoice, whereas too many items may lead to choice overload (a process-EXP var-iable, Schwartz 2004; Iyengar and Lepper 2000; Scheibehenne et al. 2010). In thecontext of recommender systems, where all recommended items are highly relevant,this choice overload effect may be even more prominent. When embedded in a userinterface, a longer list of recommendations may enjoy the added benefit of attractingmore attention (Tam and Ho 2005).
3 Algorithms are often designed to handle a specific type of data (e.g. binary, five star rating) and are there-fore restricted to a specific preference elicitation method. In practice, they are therefore often treated as oneand the same thing. However, to get a more nuanced understanding of the specific effects of algorithms andpreference elicitation methods, we make an explicit distinction between these two system aspects.
123

Experience of recommender systems 455
The order in which recommendations are presented also seems to have an effecton the users’ experience and interaction. The consequences of such serial position-ing effects are however unclear: Lynch and Ariely (2000) find that sorting by qualityreduces price sensitivity in an e-commerce recommender; Diehl et al. (2003), how-ever, find that it increases price sensitivity. Tam and Ho (2005) find that making onerecommendation stand out increases user attraction, elaboration, and choice likelihoodof that recommendation.
Hu and Pu (2011, see also Chen and Pu 2012) show that putting a logical structureon the list of recommendations (specifically, categorizing the recommendations toreflect different trade-offs) leads to a higher perceived categorical diversity of the rec-ommendations, a higher satisfaction and decision confidence, and a higher intentionto reuse the system and purchase items with it.
Ziegler et al. (2005) found that, up to a certain point, sacrificing (actual and per-ceived) individual recommendation quality in favor of recommendation set diversitycan lead to a more positive subjective evaluation of the recommendation set (SSA;see also Bradley and Smyth 2001). This finding should be compared with other fac-tors influencing the user experience to verify the robustness and extent of this effect.For instance, Willemsen et al. (2011) find that diversification may reduce the choicedifficulty (SSA), which further improves the user experience (EXP). Our frameworkprovides a starting point for investigating the impact of the size and composition ofrecommendation sets on the user experience.
Finally, one can also think about when to provide recommendations. Ho and Tam(2005) find that users are most susceptible to be persuaded by recommendations inthe earlier stages of the decision process.
3.6.3 Explanations
Another part of the presentation of recommendations is the possibility to explain whycertain items are recommended. Herlocker et al. (2000) found that users like expla-nations in collaborative filtering recommender systems. Studying knowledge-basedrecommenders, Felfernig et al. (2007) and Cramer et al. (2008a,b) show that expla-nations increase the users’ perception of the system’s competence (system-EXP) andtheir trust in the quality of the recommendations (SSA). Tintarev and Masthoff (2012)show that users tend to like personalized explanations (i.e. explanations that highlightfacts related to their preferences), but that these may actually be less effective thangeneric explanations.
3.7 Research opportunities
It is important to realize that our framework is not merely a classification of theimportant aspects of the user experience of recommender systems. Nor is it a prede-fined metric for standardized “performance” tests. Instead, it is a generic guidelinefor in-depth empirical research on the user experience of recommender systems; itconceptually defines a generic chain of effects that helps researchers to explain whyand how the user experience of recommender systems comes about. This explanation
123

456 B. P. Knijnenburg et al.
is the main value of the user-centric evaluation of recommender systems (McNee et al.2006b).
The remainder of this paper will describe the empirical evaluations of our ownrecommender systems: a number of studies that together comprise a preliminary vali-dation of parts of the evaluation framework. In these studies we have tried to repeatedlytest a limited set of core variables of our framework. Additionally, the reviewed liter-ature reveals some gaps in existing research in terms of how well it covers the hypoth-esized relations in our framework. These gaps can be translated into requirements forour studies; by covering them, our studies provide a more thorough validation of ourframework. Specifically, each empirical study will broadly adhere to a subset of thefollowing requirements:
3.7.1 Requirements regarding objective system aspects (manipulations)
1. Algorithm: Despite the predominant research interest in algorithms, there is anapparent paucity of knowledge on how algorithm accuracy influences user expe-rience. The main manipulation in most of our studies is the algorithm used forproviding recommendations.
2. Recommendation set composition: Another important manipulation is the compo-sition of the set of recommendations presented to the user, as this aspect remainslargely untreated in existing research.
3. Preference input data: Algorithm and interface meet at the point of preferenceelicitation. In content-based recommenders this topic has been researched exten-sively. In collaborative-filtering recommenders, however, the topic remains largelyuntreated, especially when it comes to explicit versus implicit preference elicita-tion. Several of our empirical evaluations therefore manipulate the type of input(explicit or implicit) used for recommendation.
3.7.2 Requirements regarding subjective system aspects
4. Perceived aspects as mediators: Subjective system aspects such as perceived rec-ommendation quality, accuracy and diversity are measured in our studies, as weexpect that these perceptions mediate the effect of the objective system aspects onthe user experience concepts.
3.7.3 Requirements regarding experience and interaction
5. User experience evaluation: System effectiveness (system-EXP), choice satisfac-tion (outcome-EXP) and usage effort and choice difficulty (process-EXP) willmeasure the three objects of user experience evaluation where possible. Relationsbetween these EXP variables will be reported.
6. Providing feedback: Many recommender systems elicit the users’ preferences byanalyzing their preference feedback. We therefore extensively analyze the positiveand negative antecedents of the users’ intention to provide feedback, as well astheir actual feedback behavior.
123

Experience of recommender systems 457
7. Behavioral data: To link the attitudinal part of user experience to the users’observable behavior, logging data will be triangulated with subjective concepts.
3.7.4 Requirements regarding personal and situational characteristics
8. PC and SC: Important and under-researched personal and situational characteris-tics such as domain knowledge and privacy concerns are included where possibleand useful.
4 Empirical evaluations: validation of the framework
4.1 Background
The framework proposed in this paper was originally developed as an analysis toolfor the MyMedia project (Meesters et al. 2008), which is part of the European Com-mission 7th Framework Programme. The main goal of MyMedia was to improve thestate-of-the-art of multi-media recommender systems. A recommender system devel-opment framework, the MyMedia Software Framework (Marrow et al. 2009),4 wascreated and deployed in real-world applications at four industrial partners. Each part-ner conducted a field trial with their system, with several aims in mind: technicalfeasibility, business opportunities, and user experience research. In the current paperwe discuss the results of four field trials (FT1-FT4), two conducted using the MyMediaversion of ClipClub player, developed by the European Microsoft Innovation Center(EMIC), and two conducted using a web-based TV catch-up service, developed by theBritish Broadcasting Corporation (BBC). Each trial was designed and evaluated onthe basis of the proposed evaluation framework. We amended these trials by conduct-ing two experiments (EX1 and EX2) with a comparatively more controlled but alsomore artificial quality. The tight control over the users’ interaction with the system inthese experiments allowed us to consider in more detail the decision-making processesunderlying the user experience. The six studies are described in Table 1, and will bediscussed in more detail below.
The main goal of the studies is two-fold: To generate new knowledge that fills thegaps in current research, and to validate the proposed evaluation framework. To assistthis latter goal, we repeatedly include the recommendation algorithm (an OSA), theperceived recommendation quality (an SSA), and the system’s effectiveness (EXP) ascore components of our analysis. Furthermore, for each study we discuss the extentto which its results fit the framework.
We realize that the exclusive focus on collaborative filtering recommender sys-tems, all based on the same MyMedia development framework, and all with mediacontent, limits the scope of this validation. Despite this, we believe that the evaluationframework itself has sufficiently generic qualities to apply to recommender systems
4 The recommender algorithms used in the studies described here are available in the MyMedia SoftwareFramework, which is available for non-commercial research purposes, http://mymediaproject.codeplex.com, as well as in the open source package MyMediaLite, http://ismll.de/mymedialite.
123

458 B. P. Knijnenburg et al.
Table 1 Properties of the studies that were conducted based on the evaluation framework
FT1 Emic pre-trialSystem Adjusted Microsoft ClipClubContent Continuously updated database of clips targeted at teenagersParticipants 43 EMIC colleagues and partnersManipulations Algorithms:
• Random recommendations• Vector Space Model (VSM) algorithm based on explicit feedback
Main questions Does a system that provides personalized recommendations provide abetter user experience than a system that provides randomrecommendations?
What factors influence the users’ intention to provide feedback?FT2 EMIC trialSystem Adjusted Microsoft ClipclubContent Continuously updated database of clips targeted at teenagersParticipants 108 externally recruited “young” participants (targeted mean age of 25)Manipulations Algorithms:
• General most popular items• Bayesian Personalized Ranking Matrix Factorization (BPR-MF)
algorithm based on implicit feedback• VSM algorithm based on explicit feedback
Scenario:• Users receive no specific information• Users are told that their ratings are collected and that this data is used
to provide better recommendations• Users are told that their behavior is monitored and that this data is usedto provide better recommendations
Main questions What is the difference in subjective recommendation quality between thedifferent algorithms?
Does a system that provides personalized recommendations lead to a betteruser experience than a system that recommends the “generally mostpopular” items?
What is the difference between the implicit recommender and the explicitrecommender in terms of user experience?
What factors influence the users’ intention to provide feedback?FT3 BBC pre-trialSystem BBC MyMedia playerContent BBC television programming (up to one week old)Participants 59 externally recruited British participants, reflecting a balanced
representation of the UK television audienceManipulations For the rating trial, algorithms:
• General most popular items• BPR-MF algorithm based on implicit feedback• MF algorithm based on explicit feedback
For the rating trial, time:• Day 1 … Day 9
For the experience trial, time:• Week 1• Week 2
Main questions What is the difference in recommendation list quality between the different algorithms?How does the quality of the recommendation lists generated by the
different algorithms evolve over time?How does the user experience of the system evolve over time?
123

Experience of recommender systems 459
Table 1 continued
FT 4 BBC trialSystem BBC MyMedia playerContent BBC television programming (up to one week old)Participants 58 externally recruited British participants, reflecting a balanced
representation of the UK television audienceManipulations Algorithms:
• General most popular items• BPR-MF algorithm based on implicit feedback• MF algorithm based on explicit feedback
Main questions What is the difference in subjective recommendation quality between thedifferent algorithms?
Does a system that provides personalized recommendations lead to a betteruser experience than a system that recommends the “generally mostpopular” items?
What is the difference between the implicit recommender and the explicitrecommender in terms of user experience?
EX1 Choice overload experimentSystem Adjusted BBC MyMedia playerContent Movies (MovieLens 1M dataset)Participants 174 participants invited from a panel with students or recently graduated
students from several Dutch universitiesManipulations Recommendation set quality and size:
• Top-5 (5 best recommendations)• Top-20 (20 best recommendations)• Lin-20 (5 best recommendations, recommendation ranked 99, 199, … 1499)
Main questions How do the objective quality and size of the recommendation set influencethe subjective recommendation set quality and diversity?
How do the objective quality and size of the recommendation set influencechoice difficulty and choice satisfaction?
EX2 Diversification experimentSystem Adjusted BBC MyMedia playerContent Movies (MovieLens 1M dataset)Participants 137 Amazon Turk workersManipulations Algorithms:
• General most popular items• MF algorithm based on explicit feedback• K-Nearest Neighbor (kNN) algorithm based on explicit feedback
Recommendation set diversification:• No diversification• Some diversification• Lots of diversification
Main questions What is the difference in subjective recommendation quality between thedifferent algorithms?
Does a system that provides personalized recommendations lead to a betteruser experience than a system that recommends the “generally mostpopular” items?
What is the difference between the kNN recommender and the MFrecommender in terms of user experience?
Do users notice our manipulation of the variety of the recommendations?Do users like (objective or subjective) variety in their recommendation
sets? If so, does the effect overshadow the effect of algorithm accuracy?
123

460 B. P. Knijnenburg et al.
in general. The framework is based on a broad range of existing research, and doesnot assume specific operationalizations of the measured concepts. Furthermore, themanipulations and main questions in the conducted studies are rather generic, andhence the range of validity of our conclusions can be broadened from multi-mediarecommender systems to recommender systems in general.
4.2 Empirical validation techniques
User experience research can be conducted both qualitatively and quantitatively(Preece et al. 2002; Kaplan and Duchon 1988). Qualitative research is more explor-atory, but is usually less generalizable, and cannot be statistically validated. Quanti-tative analysis allows for statistical validation, but one has to have clear hypothesesabout theoretical constructs and their relations before conducting the study. In manycases it is advisable to apply these techniques in tandem, but for the purpose of thispaper we will restrict our analysis to quantitative results (hypotheses for our studiesare conveniently provided by the framework). In order to prevent confirmation bias inour validation of the framework, we extensively use data analysis methods like explor-atory factor analysis (EFA) and structural equation modeling (SEM), which allow for amore exploratory analysis of quantitative data. Below we discuss the general procedureof our research; Appendix A provides a more in-depth description. We recommendresearchers who want to use our framework to either follow a similar procedure, or toopt for our pragmatic version described elsewhere (Knijnenburg et al. 2011a).
4.2.1 Measurement
Experience, SSAs, PCs and SCs can be measured using questionnaires. To assure amore robust measurement of all concepts, we typically use a minimum of seven state-ments (both positively and negatively phrased) that can be answered on a balanced5- or 7-point scale (from “completely disagree” to “completely agree”) for each unidi-mensional concept. Exploratory factor analyses can be conducted to test the robustnessof the concepts, and to exclude any questions that do not contribute to the measurementof the intended concepts.
4.2.2 Manipulation
Objective system aspects (OSA) can be manipulated, i.e., several versions of theaspect (conditions) can be created, and assigned randomly to each participant. Bykeeping everything else constant between conditions, one can single out the effect ofthis manipulated aspect on the user experience (EXP). In our research, one conditionalways serves as a baseline against which all other conditions are compared.5 Further-more, by manipulating several system aspects independently, one can compare therelative impact of these aspects on the user experience (e.g. “Does the effect of theuser interface overshadow the impact of different algorithms?”).
5 Similar to the use of dummy variables in standard linear regression.
123

Experience of recommender systems 461
4.2.3 Structure
The incorporation of user perceptions (SSA) increases the robustness and explana-tory power of the evaluations, and different objects of user experience (system-EXP,process-EXP, outcome-EXP) can be treated in parallel to gain further insight in theworkings of user experience. Logged behavioral data can be triangulated with the userexperience concepts to link the subjective experience (EXP) to objective user behavior(INT). This creates a causal chain of effects from manipulated OSAs, via subjectivelymeasured SSAs and EXPs, to objectively measured INTs. Structural equation model-ing (SEM; Muthen 1984) can be used to conduct a mediation analysis on these effects.From a statistical perspective, SEM concurrently tests the robustness of the measuredconstructs and the relationships between them.
4.2.4 Graphical presentation of SEMs
We graphically present our structural equation models as diagrams containing theconstructs (boxes) and the relationships between them (arrows). Rectangular boxesare latent constructs based on the questionnaire items. For the sake of clarity, we donot include the questionnaire items themselves in the diagrams. Elliptical boxes arebehavioral metrics, extracted from the systems’ data logs. One-headed arrows rep-resent regression coefficients (which have a causal direction); double-headed arrowsrepresent correlation coefficients.
The color of the boxes matches the colors in the framework (Fig. 1); each colorsignifies a specific type of construct (purple: OSA, green: SSA, orange: EXP, blue:INT, red: PC, light blue: SC). The numbers on the arrows represent the regressioncoefficients (i.e. the strength of the structural relations, also represented by the thick-ness of the arrows), their standard deviation (between parentheses) and the statisticalsignificance. Non-significant relations are not included in the graphs.
4.3 FT1 EMIC pre-trial
The EMIC pre-trial was conducted to confirm two basic premises for the success ofrecommender systems in general: the premise that the user experience of a recom-mender is influenced by the recommendations, and the premise that users will provideadequate preference feedback to train the recommender system.
4.3.1 Setup
The trial was conducted with 43 EMIC colleagues and partners who participated inthe trial on a voluntary basis (28 male, average age of 31, SD = 9.45). A detailedtreatment of this study can be found in Knijnenburg et al. (2010b). We therefore onlybriefly discuss the results here.
Participants all used a slightly modified version of the MSN Clipclub system (seeFig. 2); the special section with recommendations was highlighted, the social network-ing features were disabled (as to not interfere with the study), an explanation of the
123

462 B. P. Knijnenburg et al.
Fig. 2 The modified ClipClub prototype
rating facilities was included, and participants were probed to provide at least one rat-ing every five minutes (although this rating request could be denied). Participants wererandomly assigned to one of two conditions: 25 participants received random clips asrecommendations, and the remaining 18 participants received recommendations pro-vided by a content-based Vector Space Modeling engine (i.e. we manipulated the OSA“personalized vs. random recommendations”). Participants were told that providingratings would change the recommendations.6
After half an hour of interaction with the system, several questionnaires7 weretaken to measure the participants’ perceived recommendation quality (SSA), choicesatisfaction (outcome-EXP), perceived system effectiveness (system-EXP), intentionto provide feedback (INT), general trust in technology (PC), and system-specific pri-vacy concerns (SC). The questions were factor-analyzed to produce metrics for theseconcepts, and factor scores were included together with the manipulation in a regres-sion path model (Fig. 3). Additionally, factor scores were correlated with behavioralmetrics obtained from click-stream logs.
6 Which is true for both conditions, but in the random condition these new recommendations would justbe another batch of random items.7 A complete overview of the questionnaires used in the studies can be found in Appendix B.
123

Experience of recommender systems 463
perceived recommendation
qualitySSA
perceived system
effectivenessEXP
personalizedrecommendations
OSA
number of clips watchedfrom beginning
to end totalviewing time
number ofclips clicked
number ofcanceled
rating probes
+
++
+
+
+
.696 (.276)p < .05
.515 (.135)p < .001
.572 (.125)p < .001
.346 (.125)p < .01
.296 (.123)p < .05
-.255 (.113)p < .05
-.268 (.156)p < .1
15.17 vs 10.15p < .05
r = -.341p < .05
r = -.405p < .01
r = -.364p < .05
legendObjective System Aspects (OSA)personalized
Subjective System Aspects (SSA)quality
Experience (EXP)effectiveness, satisfaction
Personal Characteristics (PC) trust
Situational Characteristics (SC)privacy concerns
Interaction (INT)feedback, all ellipses
trustin technology
PC
choice
satisfactionEXP
c
privacy concernsSC
intention to provide
feedbackINT
Fig. 3 The path model constructed for FT1 - EMIC pre-trial. Please refer to Sect. 4.2.4 “Graphical presen-tation of SEMs” for interpretation of this figure. Note that the rectangle “personalized recommendations”represents the difference between personalized and random recommendations, random being the baselinemodel
4.3.2 Results
The results show that personalized recommendations (as compared to random recom-mendations) have a higher perceived quality (OSA → SSA), which leads to a higherchoice satisfaction (SSA → outcome-EXP) and system effectiveness (SSA → sys-tem-EXP). Behavioral data corroborates these hypotheses. Users of the system withpersonalized recommendations watch a larger number of clips from beginning to end(OSA → INT). Moreover, users who click fewer clips and have a lower total viewingtime rate the system as more effective (EXP ↔ INT), which indicates that a highersystem effectiveness is related to reduced browsing activity (see discussion below).
The intention to provide feedback increases with choice satisfaction and systemeffectiveness (EXP → INT) but decreases when users have a higher system-specificprivacy concern (SC → INT), which in turn increases when they have a lower trust intechnology (PC → SC).8 In terms of behavior, the number of canceled rating probes(popping up after five minutes without rating) is significantly lower in the personal-ized condition than in the random condition (OSA → INT), and is also negativelycorrelated with intention to provide feedback (INT ↔ INT).
8 An effect of a personal characteristic on a situational characteristic is not explicitly predicted by ourframework, but in this case makes perfect sense.
123

464 B. P. Knijnenburg et al.
4.3.3 Discussion of results
The results show that a system with a recommender algorithm that provides personal-ized recommendations has a better user experience (in terms of both choice satisfactionand system effectiveness) than a system that provides random recommendations. Thisis not necessarily a surprising result; such a comparison between random and person-alized recommendations is a bit unbalanced (Van Velsen et al. 2008).
More interestingly, however, the path model indicates that this effect is indeed med-iated by perceived recommendation quality (requirement 4 in Sect. 3.7). Furthermore,there is no residual correlation between choice satisfaction and system effectiveness,and a mediated variant provides a weaker model than the one described. In otherwords, in this study there was no structural relation between these experience vari-ables (requirement 5).
Users seem to base their intention to provide feedback on a trade-off between havinga better user experience and maintaining their privacy (requirement 6 and 8). How-ever, the intention to provide feedback was not correlated with the total number ofratings, indicating that the relation between intention and behavior can be very weak (awell-known psychological phenomenon called the ‘intention-behavior gap’; Sheeran2002).
User behavior is correlated with the experience variables (requirement 7), but attimes also directly with the manipulation of our study. Against our intuition, userswho rate the system as more effective have a lower total viewing time and a lowernumber of watched clips. However, the results also show that at the same time, thenumber of clips watched from beginning to end is higher in the personalized condi-tion than in the non-personalized condition. The lower total viewing time and numberof clicked clips thus reflects a reduction in browsing, not consumption. This makessense, because recommendations are supposed to be an alternative to browsing in thissystem. The outcomes clearly demonstrate the value of triangulating the behavioralmeasures with subjective measures. Showing how behavioral measures are relatedto experience variables allows researchers to assign meaning to these measurements,which at times may even counter the researchers’ intuition. Moreover, it grounds oursubjective theory in observable behavior.
4.4 FT2 EMIC trial
The EMIC extended trial was conducted to reproduce and extend the effects of thepre-trial. Taking a step beyond the unbalanced comparison in the pre-trail betweenpersonalized and random recommendations, the extended trial looked at differencesbetween the non-personalized “generally most popular” items (GMP condition), theVSM algorithm using explicit feedback as input (the same VSM condition as used inthe pre-trial) and the Bayesian Personalized Ranking Matrix Factorization algorithm(BPR-MF; Rendle et al. 2009), a state-of-the-art algorithm using all clicks to predictrecommendations (‘implicit feedback’; MF-I condition). Furthermore, we specifi-cally controlled what the users were told about the systems’ use of their feedback:nothing (none condition); that their rating behavior was being used to provide better
123

Experience of recommender systems 465
recommendations (rating behavior condition); or that all their behavior was being usedto provide better recommendations (all behavior condition). We hypothesized that thismanipulation would influence users’ privacy concerns.
4.4.1 Setup
An external company recruited German participants from a young demographic (tar-geted mean age of 25). Participants were instructed to use the system as many timesas they liked over the 20-day duration of the study, and they were asked to fill out a47-item user experience questionnaire after each session (which would comprise atleast 20 minutes of interaction). The external company paid the participants for theircooperation. Participants were randomly assigned to a scenario (i.e. the OSA “sce-nario” [no story/rating behavior/all behavior] is a between subjects manipulation),and after each questionnaire they would switch algorithms (i.e. the OSA “algorithm”[GMP/VSM/MF-I] is a within subjects manipulation). Participants were informed ofthis switch, but were not told which algorithm they would be using. Users used thesame system as in FT1 (see Fig. 2), but in contrast to the first field trial, there were noexplicit rating requests in this trial, and there was also no specific section with recom-mendations; instead, all categories that the user could navigate to (e.g. sport, gossip,cars, news) showed a personalized subset of the items in that category. The behaviorof each participant was logged, allowing for an extensive analysis of the click-streamof each user.
The trial yielded 430 questionnaires from 108 participants. After excluding allquestionnaires with fewer than 12 clicks (indicating insignificant usage), 258 ques-tionnaires (60%) remained from 95 remaining participants (88%). These participantshad an average age of 27.8(SD = 4.70). 49 of them were male.
The questions in the questionnaires were first submitted to an exploratory factoranalysis (EFA) to determine whether their covariances naturally reproduced the pre-dicted constructs. This resulted in 7 factors:
• Perceived recommendation quality (6 items, e.g. “I liked the items shown by thesystem”, factor R2 = .009)9
• Effort of using the system (3 items, e.g. “The system is convenient”, factor R2 =.184)
• Perceived system effectiveness and fun (10 items, e.g. “I have fun when I’m usingthe system”, factor R2 = .694)10
• Choice satisfaction (5 items, e.g. “I like the items I’ve chosen”, factor R2 = .715)• General trust in technology (4 items, e.g. “Technology never works”, no incoming
arrows)
9 R2 values are taken from the final SEM and not from the EFA. The R2 for perceived recommendationquality was low because it was predicted by the algorithm condition only. We typically report the best fittingitem as an example for the scale, full questionnaires can be found in Appendix B.10 Fun was intended to be a separate construct, but the exploratory factor analysis could not distinguish thisconstruct from perceived system effectiveness. In other words, in answering our questionnaires participantsdid not seem to conceptually distinguish these two constructs.
123

466 B. P. Knijnenburg et al.
• System-specific privacy concerns (3 items, e.g. “The system invades my privacy”,factor R2 = .333)
• Intention to provide feedback (4 items, e.g. “I like to give feedback on the itemsI’m watching”, factor R2 = .264).
12 items were deleted due to low communalities and/or unwanted cross-loadings. Theitems were then analyzed using a confirmatory structural equation modeling (SEM)approach with repeated ordinal dependent variables and a weighted least squares esti-mator, in which the subjective constructs were structurally related to each other, to theconditions (algorithm and scenario), and to several behavioral measures extracted fromthe usage logs. The final model had a reasonable model fit (χ2(41) = 85.442, p <
.001, CFI = .977, TLI = .984, rMSEA = .065).11 Figure 4 displays the effects foundwith this model.
4.4.2 Results
The model shows that the recommendations from the Matrix Factorization algorithm(MF-I) have a higher perceived quality than the non-personalized “generally mostpopular” (GMP) items (OSA → SSA). Higher perceived recommendation quality inturn leads to lower effort (SSA → process-EXP), a higher perceived effectiveness andfun (SSA → system-EXP), and a higher choice satisfaction (SSA → outcome-EXP).The effect of the algorithm on choice satisfaction is however only partially mediated;there is also a direct positive effect of the MF-I algorithm on choice satisfaction (OSA→ EXP). The vector space modeling algorithm (VSM) does not even affect perceivedquality at all; it only has a direct effect on choice satisfaction (increasing it marginally;p < .10). Lower effort leads to more perceived effectiveness and fun (process-EXP→ system-EXP; this is in line with Pommeranz et al. 2012), which in turn leads tomore satisfactory choices (system-EXP → outcome-EXP).
The effort required to use the system influences the intention to provide feedback:the less effort users have to invest, the more they are willing to provide feedback (pro-cess-EXP → INT). Privacy concerns also increase when the system takes more effortto use (process-EXP → SC).12 Figure 5 displays the tendency of marginal effectsof the different algorithms on recommendation quality, system effectiveness & fun,and choice satisfaction. The graphs show the standardized difference between thealgorithms (MF-I and VSM) and the baseline condition (GMP).
Figure 4 shows a direct effect of trust in technology on users’ intention to providefeedback (PC → INT). Trust in technology also reduces privacy concerns (PC → SC).Telling users that their rating behavior is used to improve recommendations increasestheir privacy concerns (OSA → SC).13 Notably, telling users that all their behavior isbeing used to improve recommendations does not have this effect.
11 Agreed-upon model fit requirements are described in more detail in Appendix A.12 Our framework does not predict an effect of experience on situational characteristics. However, weunderstand that privacy concerns may be higher when users have to put more effort into using the system,because this usually means that they also have to provide more information to the system.13 Our framework does not predict an effect from an objective system aspect on a situational characteristicto exist. However, this particular OSA was specifically designed to change this particular SC.
123

Experience of recommender systems 467
legend
trustin technology
PC
choice
satisfactionEXP
system-speci c
privacy concernsSC
intention to provide
feedbackINT
telling users that
their rating behavioris used to improve recommendations
OSA
+
matrix factorization (MF-I)using implict feedback
(vs. the generally most popular items; GMP)OSA
+
+
+
+
−
−
−
+−
+
+
number of clips clicked
−
percentage of clips watched from beginning
to end
+
number of searchesperformed
−
number of clips watched at full screen
+
number ofratingsprovided
number of timesthe participant used the
system beforeSC
+
−
−
browsingin the
menu-items−
log10 of total viewing time
+
−
+
telling users that
all their behavioris used to improve recommendations
OSA
-.510 (.114)p < .001
.200 (.087)p < .05
.464 (.064)p < .001
.847 (.086)p < .001
-.809 (.153)p < .001
.886 (.113)p < .001
-.474 (.097)p < .001
.458 (.101)p < .001
-.333 (.113)p < .001
p < .001.228 (.120)p = .057 +
.611 (.329)p = .063
1.328 (.788)p = .092
-1.123 (.507)p < .05
.982 (.286)p < .001
-.265 (.103)p < .01
.678 (.315)p < .05
-7.70 (2.70)p < .005
-.161 (.065)p < .05
.035 (.017)p < .05
-.116 (.049)p < .05
1.6 (.8)p < .05 -1.571 (.664)
p < .05
Objective System Aspects (OSA)MF-I, VSM, all behavior, rating behavior
Subjective System Aspects (SSA)quality
Experience (EXP)effort, effectiveness & fun, satisfaction
Personal Characteristics (PC) trust
Situational Characteristics (SC)privacy concerns, number of times
Interaction (INT)feedback, all ellipses
Vector Space Model (VSM)using explicit feedback
(vs the generally most popular items; GMP)OSA
effortto use the system
EXP
perceived recommendation
qualitySSA
perceived system
effectiveness & funEXP
.446 (.133) .267 (.154)p = .084
Fig. 4 The path model constructed for FT2 - EMIC trial. Please refer to Sect. 4.2.4 “Graphical presentationof SEMs” for interpretation of this figure. Note that the “algorithm” manipulation is represented by the tworectangles “Matrix Factorization (MF-I)” and “Vector Space Model (VSM)”, which are tested against thenon-personalized baseline “generally most popular (GMP)”. Likewise, the “scenario” manipulation is rep-resented by the two rectangles “all behavior” and “rating behavior”, which are tested against the baseline“no story”
In terms of behavioral measures, we find that, like in the pre-trial (FT1), a highchoice satisfaction decreases the number of clips clicked (EXP → INT). Users whoperceive the recommendations to be of a higher quality also perform fewer searches(SSA → INT), and users browse less between different categories when the MF-Ialgorithm is used (OSA → INT). Users who are more satisfied with their choiceswatch more clips from beginning to end (EXP → INT). Interestingly, fewer usersdo so when the VSM algorithm is used (OSA → INT). Users who perceive the rec-ommendations to be of a higher quality also watch more clips at full screen (SSA→ INT). Furthermore, intention to provide feedback increases the number of ratingsprovided by the user, something we did not find in FT1. Finally, in later sessions thenumber of clips clicked and the viewing time increase (SC → INT). Participants alsoprovide fewer ratings in later sessions (SC → INT; this is in line with Harper et al.2005).
123

468 B. P. Knijnenburg et al.
Fig. 5 Tendency of marginal (direct and indirect) effects of the “algorithm” condition on perceived recom-mendation quality, system effectiveness and fun, and choice satisfaction. Error bars indicate ±1 standarderror compared to the value of GMP, which is fixed to zero. Scales of the vertical axes are in sample standarddeviations. The Matrix Factorization algorithm (MF) provides higher perceived recommendation qualityand a higher choice satisfaction than the non-personalized “most popular” algorithm (GMP); the VectorSpace Modeling algorithm (VSM) does not provide a significantly better experience
4.4.3 Discussion of the results
In general terms, this study confirms the structural relations found in FT1, but there are anumber of important differences and additional insights. Specifically, the study allowsus to compare two different algorithms with a non-personalized baseline (requirement1, see Sect. 3.7). The results indicate that the BPR-MF recommendations of the MF-Icondition are most successful; these have a marginally higher perceived quality andlead to a higher choice satisfaction (see Fig. 5). The VSM recommendations onlylead to a marginally higher choice satisfaction. A possible reason for these differencesis that the BPR-MF algorithm used implicit feedback, which can be gathered morequickly than the explicit feedback used by the VSM algorithm (requirement 3).
The inclusion of the construct “effort of using the system” changes part of our pathmodel compared to FT1: Whereas in FT1 choice satisfaction and perceived systemeffectiveness increased users’ intention to provide feedback, we now observe that itis actually the effort of using the system that causes this effect (requirement 6). Thisdifference between FT1 and FT2 indicates the importance of measuring all aspects ofthe user experience (requirement 5) as this allows us to better understand the natureof the difference.
The trial confirms that privacy and trust are important factors influencing the inten-tion to provide feedback (requirement 6), although the effects are now structurallydifferent. Like in FT1, trust in technology reduces privacy concerns, but it now alsodirectly increases the intention to provide feedback (instead of a mediated effect viaprivacy concerns). Due to the increased power of the study, FT2 enables us to measurethe link between feedback intention and behavior.
We also observe that telling users that their rating behavior is used (compared totelling them nothing, or that all their behavior is used) increases their privacy concerns.This is surprising, because using all behavior (including rating behavior) is by defini-tion more intrusive than using only rating behavior. The wording in the two conditionsis almost the same: “In order to increase recommendation quality, we are going touse [your ratings data]/[all your activities]”. One possible reason for the heightened
123

Experience of recommender systems 469
privacy concerns in the “rating behavior” scenario is that users in this scenario haveactive control over the amount of information they provide to the system. They arethus encouraged (or forced) to make an explicit trade-off between the potential use-fulness of providing information and the effect this may have on their level of privacy.In the “all behavior” condition, there is nothing the users can do to prevent the systemfrom analyzing their behavior, and it is also difficult to anticipate the privacy effectsof exhibited and forborne behavior. Users may therefore be less sensitized with regardto privacy concerns, or even forget that the system is continuously analyzing theirbehavior.
By triangulating our behavioral data with the subjective constructs (requirement8), we are also able to revalidate the finding from FT1 that a good experience means:“less browsing, but more time enjoying the content”. Finally, the extended period ofuse allows us to look at the effect of familiarity with the system. Specifically, usersare exploring the system to a further extent in later sessions, which may indicate lessreliance on the recommendations.
4.5 FT3 BBC pre-trial
The BBC pre-trial used a special-purpose recommender system to present users withrecent programming of the BBC (see Fig. 6) and strove to compare three differ-ent algorithms side by side. As FT2 revealed that usage over time changes (i.e., weobserved less reliance on the recommendations over time), the pre-trial was conductedto investigate how recommendation quality would evolve over time.
4.5.1 Setup
An external market research company recruited 59 British participants to participatein both FT3 and FT4. The participants were selected to reflect a balanced mix of ages(one third between 18 and 35, one third between 36 and 50, and one third between 51and 66). Within each age group, the selection included equal numbers of males andfemales. The selected sample also consisted of equal numbers of participants fromfive regions across the UK. Finally, half of the participants were occasional users ofthe existing TV/radio catch-up service, the other half were frequent users. Partici-pants were paid a small fee for each daily task, and a bonus for each completed userexperience questionnaire. Over a period of two weeks (not counting weekends) par-ticipants performed two daily tasks. Specifically, the participants were asked everyday to rate a list of recommendations presented by three different algorithms (ratingtask), and to use the system freely (free use task). The participants had an average ageof 41.5 (SD = 12.6). 27 of them were male.
The algorithms used in the rating task were the non-personalized ‘generally mostpopular’ items (the GMP condition), and two personalized Matrix Factorization algo-rithms. One is described in Rendle and Schmidt-Thieme (2008) and relies on userratings to provide recommendations (‘explicit feedback’; the MF-E condition). Theother, BPR-MF (Rendle et al. 2009), relies on all clicks in the interface (‘implicitfeedback’; the MF-I condition). Every day, each participant rated three lists (one from
123

470 B. P. Knijnenburg et al.
Fig. 6 The BBC MyMedia recommender prototype
each of the algorithms) of five recommended programs. The order in which the listswere presented changed every day.
The system in the ‘free use’ task employed the MF-E algorithm for all participantsthroughout the entire two-week period. After both weeks, participants filled out aquestionnaire asking about their user experience with the ‘free use’ system.
4.5.2 Results of the rating task
In the rating task users were asked to rate five recommended programs separately,as well as the recommendation list as a whole. As can be seen in Fig. 7 below, theaverage ratings decreased over time (contrast F(1, 15) = 12.7, p < .005, r = .68).Either participants gradually became more critical about the recommendations (a psy-chological phenomenon called habituation), or they were actually confronted withrecommendations of a lower quality (e.g. because items previously recommendedwere not included in the recommendations to prevent repetitiveness).
After an initial training period, at days four to seven (May 20–25), we observesignificantly higher ratings of the MF-E recommendation lists (MMF−E = 3.52 vs.MGMP = 2.80, contrast F(1, 29) = 45.4, p < .001, r = .78) as well as the MF-I rec-ommendation lists (MMF−I = 3.33 vs. MGMP = 2.80, contrast F(1, 29) = 19.1, p <
.001, r = .63). In the second week (May 24–27), the ratings for the lists provided byMF-E and MF-I started to drop significantly (interaction of MF-E vs. GMP with lineardecreasing time: F(1, 32) = 6.90, p < .05, r = .42; interaction of MF-I vs. GMPwith linear decreasing time: F(1, 32) = 10.9, p < .005, r = .50), going down to the
123

Experience of recommender systems 471
Fig. 7 The means of the listratings, over time, of therecommendation lists for thegenerally most popular items(GMP) and the MatrixFactorization algorithmrecommendations based onexplicit (MF-E) and implicit(MF-I) feedback. Theerror bars present ±1 StandardError
level of GMP. In other words, the quality of the MF-I and MF-E recommendationsimproves over time, but later falls back to the level of the non-personalized GMPrecommendations.
4.5.3 Results of the free use task
To analyze the free use task, we compared the outcomes of the user experience ques-tionnaires collected at the two different time points (i.e. the SC “time” [end of week1/end of week 2], can be seen as a within subjects manipulation). All 59 users partookin this part of the study, but 8 users only completed the first week’s questionnaire,resulting in 110 data points. The results of the experience questionnaire (17 ques-tions) were first submitted to an exploratory factor analysis (EFA) to see if theircovariances naturally reproduced the predicted constructs. This resulted in three fac-tors:
• Perceived recommendation variety (2 questions, “The recommendations containeda lot of variety” and “All the recommended programmes were similar to each other”,factor R2 = .052)
• Perceived recommendation quality (7 questions, e.g. “The recommended itemswere relevant” and “I liked the recommendations provided by the system”, factorR2 = .148)
• Perceived system effectiveness (6 questions, e.g. “I would recommend the MyMe-dia recommender to others” and “The MyMedia recommender is useful”, factorR2 = .548).
Two questions were deleted due to low communalities. The items were then ana-lyzed using a confirmatory SEM approach with repeated ordinal dependent variablesand an unweighted least squares estimator, in which the subjective constructs werestructurally related to each other and to the dichotomous independent variable ‘time’(week 1 vs. week 2). The final model had a good model fit (χ2(22) = 27.258, p =.20, CFI = .982, TLI = .984, rMSEA = .047). Figure 8 displays the effects foundwith this model.
The model shows that a higher perceived variety of the recommendations causesusers to perceive the recommendations as having a higher quality, and that higher
123

472 B. P. Knijnenburg et al.
-.468 (.233)p<.05
.406 (.123)p<.001
.389 (.196)p<.05
perceived recommendation
qualitySSA
perceived system
effectivenessEXP
week 2vs week 1
SC
.879 (.158)p<.001
+
+ +
legendSubjective System Aspects (SSA)variety, quality
Experience (EXP)effectiveness
Situational Characteristics (SC)week 2
+.305 (.154)
p<.05
perceived recommendation
varietySSA
Fig. 8 The path model constructed for FT3 - BBC pre-trial. Please refer to Sect. 4.2.4 “Graphical presen-tation of SEMs” for interpretation of this figure
quality recommendations in turn cause an increased perceived system effectiveness(SSA → SSA → EXP). There is also a direct effect of perceived variety on perceivedsystem effectiveness (SSA → EXP); the perceived quality does not fully mediate theeffect of variety on effectiveness.
Additionally, in this study the variety of the recommendations turned out to besignificantly lower in the second week (SC → SSA), which in turn led to a lowerperceived quality of the recommendations in the second week. This is in line withthe drop in recommendation list ratings as found in the rating task (see Fig. 7).The lower perceived recommendation quality, in turn, decreased the perceived effec-tiveness of the system. However, time also had a positive direct effect on perceivedsystem effectiveness (SC → EXP), which cancelled out the negative indirect effect(the mean system effectiveness did not differ significantly between week 1 andweek 2).
4.5.4 Discussion of the results
The drop in perceived recommendation quality in the second week was consistentbetween the rating and free use task. The SEM model explains that this happenedbecause the set of recommended programs was less varied in the second week. Argu-ably, perceived variety drops because TV programs repeat after the first week, atwhich point they resurface among the recommendations. Interestingly, due to a directpositive effect of time on perceived system effectiveness, these effects in the end did notreduce the user experience. An ad hoc explanation of this effect could be that althoughusers may have felt that recommending new episodes of previously recommendedshows is not a sign of high quality recommendations, they may at the same time haveappreciated the reminder to watch the new episode. The study thus clearly shows themerit of measuring subjective concepts in addition to user ratings in understandingthe underlying causes of rating differences.
123

Experience of recommender systems 473
4.6 FT4 BBC trial
The BBC trial was primarily conducted to test the effect of explicit versus implicitpreference elicitation methods on the user experience of the system.
4.6.1 Setup
The trial used the same system as the ‘free use’ system in the pre-trial, but now thealgorithm that provided the recommendations in this system was changed every threedays between GMP, MF-I and MF-E until each algorithm was used once by each user(see Sect. 4.5.1 for more details on these conditions). In each condition users weregiven the same background on the system, specifically, no information was given onthe way recommendations were computed or on what type of information they werebased. Participants were randomly assigned to one of three groups, for which the orderof the algorithms was manipulated in a Latin square design, so that each algorithmwas being used by one third of the users at any time. 58 users (the same as thosein the pre-trial) completed this study, resulting in 174 data points. The user experi-ence questionnaire was similar to the pre-trial, but two questions were added to gaina more robust measurement of recommendation variety (now measured by 4 items).The exploratory factor analysis resulted in the same three factors (see Sect. 4.5.3).The behavior of each participant was logged, allowing for an extensive analysis of theclick-stream of each user.
The questionnaire items were then analyzed using a confirmatory structural equa-tion modeling (SEM) approach with repeated ordinal dependent variables and aweighted least squares estimator, in which the subjective constructs were structurallyrelated to each other, to the conditions (algorithm/preference input method), and to sixbehavioral measures extracted from the usage logs. The final model (Fig. 9) had a rea-sonably good fit (χ2(29) = 49.672, p = .0098, CFI = .976, TLI = .982, rMSEA =.065).
4.6.2 Results
As in FT3 (see Fig. 8), we observe that a higher perceived recommendation varietyleads to a higher perceived recommendation quality, which in turn leads to a higherperceived system effectiveness (SSA → SSA → system-EXP). Interestingly, the twovariants of the matrix factorization algorithm affect different SSAs: compared to GMP,MF-E recommendations (which are based on explicit feedback) have a significantlyhigher perceived variety, while MF-I recommendations (which are based on implicitfeedback) have a significantly higher perceived quality (OSA → SSA). Despite theirdifferent trajectories, the net effect of these algorithms is that their increased per-ceived quality positively affects the user experience (in terms of perceived systemeffectiveness) compared to the GMP condition (see also Fig. 10).
In terms of behavioral measures, perceived variety is correlated with the numberof items clicked in the player (as opposed to the catalog; INT → SSA). Recommen-dation quality is correlated with the rating users give to clicked items, and the number
123

474 B. P. Knijnenburg et al.
Number of items clicked in the
player
Rating of clicked items
Number of items rated higher than
the predicted rating
Number of items rated
1.250 (.183)p < .001
.310 (.148)p < .05
.356 (.175)p < .05
1.352 (.222)p < .001
.856 (.132)p < .001
20.094 (7.600)p < .01
.314 (.111)p < .01
1.865 (.729)p < .05
++
+ + +
+ +
+
+
participant's
agePC
legendObjective System Aspects (OSA)MF-I, MF-E
Subjective System Aspects (SSA)variety, quality
Experience (EXP)effectiveness
Personal Characteristics (PC) age
Interaction (INT)all ellipses
perceived system
effectivenessEXP
.846 (.127)p < .001
Matrix Factorization recommender with
explicit feedback (MF-E)(versus generally most popular; GMP)
OSA
Matrix Factorization recommender with
implicit feedback (MF-I)(versus most popular; GMP)
OSA
perceived recommendation
varietySSA
perceived recommendation
qualitySSA
Fig. 9 The path model constructed for FT4 - BBC trial. Please refer to Sect. 4.2.4 “Graphical presentationof SEMs” for interpretation of this figure. Note that the “preference elicitation method” manipulation isrepresented by the two rectangles “explicit feedback (MF-E)” and “implicit feedback (MF-I)”, which aretested against the non-personalized baseline “generally most popular (GMP)”
Fig. 10 Tendency of marginal (direct and indirect) effects of the “preference elicitation method” condi-tion on perceived recommendation variety, perceived recommendation quality, and system effectiveness.Error bars indicate ±1 Standard Error. The value of GMP is fixed to zero; scales are in sample standarddeviations
of items that are rated higher than the predicted rating (SSA → INT).14 Finally, theperceived system effectiveness is correlated with the total number of items that partici-pants rate (EXP ↔ INT). We furthermore note that older participants rate significantlymore items (PC → INT).
14 SSA → INT is not predicted, but these behaviors are a direct expression of the SSA.
123

Experience of recommender systems 475
4.6.3 Discussion of the results
This study confirms the basic structural relations between manipulation, subjective sys-tem aspects, and experience as also found in FT3 (OSA → SSA → EXP; requirement4, see Sect. 3.7). In this case, the OSA is the preference elicitation method (requirement3). Two variants of the matrix factorization algorithm using different types of input(MF-E and MF-I) are tested against a non-personalized baseline (GMP). The fact thatboth MF-E and MF-I resulted in a better user experience than GMP is not very surpris-ing, but interestingly the model shows that the cause for this effect is different for eachalgorithm. MF-E (which makes recommendations based on explicit feedback) seemsto result in a higher variety in recommendations than GMP, which in turn leads to ahigher recommendation quality and a higher perceived effectiveness (OSA → SSA→ SSA → EXP); MF-I (which makes recommendations based on implicit feedback)on the other hand seems to have a direct influence on recommendation quality, whichalso leads to a higher perceived effectiveness (OSA → SSA → EXP).
The lack of an increased diversity for MF-I recommendations could be caused by a“pigeonholing effect”: when the MF-I algorithm uses clicks to predict implicit prefer-ences, and gives recommendations based on these preferences, most subsequent clickswill be in line with these predicted preferences, and the algorithm will increasinglyhome in on a very specific set of recommendations. In MF-E, negative explicit feed-back (low ratings) can prevent such pigeonholing. Like Jones et al. (2009), our resultsshow that explicit control over the recommendations leads to a higher recommendationquality through an increase of perceived variety, but that beyond the effect throughvariety, there is no increase in recommendation quality (e.g. by means of a higheraccuracy). The marginal effect on the perceived quality of the recommendations forMF-E and MF-I is about equal, and higher than the quality of the non-personalizedrecommendations (GMP). The same holds for perceived system effectiveness (seeFig. 10).
An interesting way to exploit the difference between MF-I and MF-E would be tocombine this result with the result of FT3, which found that diversity decreases overtime (see Fig. 8). In this respect, a recommender system could start out with the MF-Ialgorithm, which can provide high-quality recommendations from the start (as it doesnot need any ratings). As the diversity of the recommendations starts decreasing, thealgorithm can put more weight on the users’ ratings in determining their preferences,or even switch to the MF-E algorithm altogether. This would give the system a boost inrecommendation variety, which should provide a better user experience in the long run.
Several behavioral correlates corroborate our subjective measures (requirement7). The perceived variety of the recommendations is related to the number of itemsclicked in the player. These items are related to the item that is currently playing,and are therefore arguably more specialized (and thus over time more varied) thanother recommendations. The results further show that users reward good recommen-dations with higher ratings, and system effectiveness is correlated with the number ofratings the user provides (see also requirement 6). The causal effect here is unclear:participants that rate more items may end up getting a better experience because thealgorithms gain more knowledge about the user (INT → EXP). On the other hand, as
123

476 B. P. Knijnenburg et al.
found in FT1 (see Fig. 3), users may intend to rate more items when they notice thatthis improves their experience (EXP → INT).
4.7 EX1 choice overload experiment
The four studies described above are all field trials, testing real-life user-behavior inreal-world systems. These studies have a high ecological validity, but it is hard to ana-lyze decision processes in detail, because users are unrestricted in their needs, goals,and actions. To get more in-depth knowledge about users’ decision processes, we con-ducted two controlled lab experiments. The tasks in these experiments are fixed, asis the interaction with the system: Users first rate a set of test-items and then make asingle decision, each considering the same choice goal. The first of these experimentslooked at the effect of the size and quality of the recommendation set on the user expe-rience to study a phenomenon called choice overload. The experiment is described indetail in (Bollen et al. 2010), so here we will only briefly discuss the results and themerit of using the framework in this experiment.
4.7.1 Setup
The experiment was conducted with 174 Dutch participants (invited from a panel withstudents or recently graduated students from several Dutch universities) with an aver-age age of 26.8(SD = 8.6). 89 of them were male. Participants were paid e3 uponsuccessful completion of the experiment. They were asked to use the system (loadedwith the 1M MovieLens dataset,15 and using the Matrix Factorization algorithm imple-mentation from the MyMedia Software Framework) to find a good movie to watch. Totrain the recommender system, they first rated at least 10 movies they knew, and weresubsequently presented with a list of recommendations from which to make a choice.Users were randomly assigned to receive either one of three recommendation sets:Top-5 (the best five recommendations, according to our MF algorithm), Top-20 (thebest twenty recommendations), and Lin-20 (the best five recommendations, supple-mented with the recommendations with rank 99, 199, 299, …, 1499). After making achoice, users completed a set of questionnaires to measure perceived recommendationset variety, recommendation set attractiveness, choice difficulty, satisfaction with thechosen item, and movie expertise. A Structural Equation Model was fitted on thesequestionnaire constructs and our two dichotomous manipulation variables (“Top-20vs. Top-5” and “Lin-20 vs. Top-5”); Fig. 11 shows the resulting path model; for detailson the data analysis, refer to (Bollen et al. 2010).
4.7.2 Results
The model shows that satisfaction with the chosen item (outcome-EXP) is the resultof two opposing forces: a positive effect of the quality of the recommendations (SSA
15 The MovieLens datasets are freely available at http://grouplens.org. The 1M MovieLens dataset containsone million ratings for 3952 movies and 6040 users.
123

Experience of recommender systems 477
movie
expertisePC
+
+
+
+
+
.455 (.211)p < .05
.181 (.075)p < .05
.503 (.090)p < .001
1.151 (.161)p < .001
.336 (.089)p < .001
-.417 (.125)p < .005
+
+ +
.205 (.083)p < .05
.879 (.265)p < .001
.612 (.220)p < .01 -.804 (.230)
p < .001
.894 (.287)p < .005
perceived recommendation
varietySSA
perceived recommendation
qualitySSA
Top-20vs Top-5 recommendations
OSA
choice
satisfactionEXP
choice
cultyEXP
Lin-20vs Top-5 recommendations
OSA
legendObjective System Aspects (OSA)Top-20, Lin-20
Subjective System Aspects (SSA)variety, quality
Experience (EXP)culty, satisfaction
Personal Characteristics (PC) expertise
Fig. 11 The path model constructed for EX1 - Choice overload experiment. Please refer to Sect. 4.2.4“Graphical presentation of SEMs” for interpretation of this figure. Note that the manipulation of recom-mendation set size and quality is represented by the two rectangles “Top-20” (a larger set than Top-5) and“Lin-20” (a larger set than Top-5, but with lower ranked additional items)
→ outcome-EXP) and a negative effect of choice difficulty (process-EXP → out-come-EXP). Furthermore, high-quality recommendations increase choice difficulty(SSA → process-EXP), and recommendation quality itself depends strongly on theperceived recommendation variety (SSA → SSA; consistent with FT3 and FT4).
Relative to Top-5, the Top-20 condition increases the perceived variety of the recom-mendation set (OSA → SSA) and the difficulty of the choice (OSA → process-EXP):Top20 is more varied and more difficult to choose from. The Lin-20 set is also morevaried than Top-5 (OSA → SSA), and negatively affects the recommendation setattractiveness (OSA → SSA). Lin-20 furthermore has a positive residual effect (i.e.controlling for recommendation set quality and choice difficulty) on satisfaction (OSA→ outcome-EXP), relative to the Top-5 condition. Finally, in contrast to the findingsof Kamis and Davern (2004) and Hu and Pu (2010), increased movie expertise in ourstudy positively affects recommendation set attractiveness and perceived variety (PC→ SSA).
4.7.3 Discussion of results
The marginal effect of our manipulation of the recommendation set composition onchoice satisfaction is zero (requirement 2, see Sect. 3.7); there is no significant mar-ginal difference between the Top-5, Top-20 and Lin-20 sets (see Fig. 12). Thanksto our mediating SSAs and EXPs (requirement 4 and 5), the model is able to showexactly why this is the case. The Top-20 set is more varied (SSA) than Top-5 (andthereby more attractive), but it is also more difficult (process-EXP) to make a choicefrom this set, and these effects level out to eventually show no difference in choice
123

478 B. P. Knijnenburg et al.
Fig. 12 Tendency of marginal(direct and indirect) effects ofthe “recommendation setcomposition” condition onchoice satisfaction. Error barsindicate ±1 Standard Error. Thevalue of Top-5 is fixed to zero;scales are in sample standarddeviations
satisfaction (outcome-EXP). The Lin-20 set is less attractive than the Top-5 (SSA),but there is a positive residual effect on choice satisfaction (outcome-EXP). Arguably,this can be interpreted as a context effect: participants in this condition contrasted theirchoice against the inferior items that are in the tail of the Lin-20 distribution, makingthe choice more satisfying because it was easier to justify. In the end, however, theseeffects too cancel out, so the resulting net effect on choice satisfaction is approximatelyzero.
Finally, the results show that domain knowledge (PC) influences the perceptionof recommendation set variety and quality. Although requirement 8 specifies that PCshould be related to EXP or INT, we have now at several occasions shown a relation-ship between PC/SC and SSA. Apparently, situational and personal characteristics caninfluence users’ perceptions as well (e.g. “an expert’s eye”), something not recognizedin the earlier version of our framework (Knijnenburg et al. 2010a).
4.8 EX2 diversification experiment
As a final experiment, we set out to investigate the relative effect of algorithm accu-racy and recommendation set diversity on user experience. Ziegler et al. (2005) alreadyshowed that diversifying the output of a recommender algorithm, although detrimentalfor the accuracy of the recommended list, results in an increase in overall satisfac-tion (OSA → EXP). However, their experiment used single-question measures anda restricted set of algorithms (only item-based and user-based k-Nearest Neighbors).Furthermore, as we have shown in our previous experiments, perceived variety andperceived quality of the recommendations (SSAs) are important mediators betweenobjective aspects (OSA) and user experience (EXP).
To better understand the intricate relation between accuracy, diversity and satis-faction, we therefore conducted an experiment in which we manipulated algorithmand recommendation set variety (OSA) and measured perceived accuracy and diver-sity (SSAs) as well as several user experience variables (process-EXP, system-EXPand outcome-EXP). The experiment compares k-Nearest Neighbors (kNN) with anon-personalized “generally most popular” (GMP) algorithm (a baseline) and a state-of-the-art Matrix Factorization algorithm (MF). Like EX1, it uses the MovieLens 1Mdataset.
123

Experience of recommender systems 479
4.8.1 Setup
The experiment was conducted online, using Amazon’s Mechanical Turk service togather 137 participants (78 male, mean age of 30.2, SD = 10.0), mainly from the USand India. Participants were paid US $4 upon successful completion of the experiment.They were asked to rate at least ten items from the MovieLens 1M set, after whichthey would receive a list of ten recommendations. The composition of the list wasmanipulated in 3 × 3 conditions, independently varying the algorithm (GMP, kNN,MF) and the diversification (none, little, lot) between subjects. Participants were askedto choose one movie. Finally, they filled out the user experience questionnaires.
Diversification was based on movie genre, and implemented using the greedy heu-ristic of Ziegler et al. (2005). Specifically, the heuristic starts with the item with thehighest predicted rating, calculates a diversity score for each of the remaining itemsin the top 100 (based on how many movies in the current recommendation list wereof the same genre), creates a compound score S weighing the predicted rating R andthe diversity score D according to the formula S = aD + (1 − a)R, and then choosesfrom the top 100 the item with the highest compound score. This process is repeateduntil the list contains ten items. For none, little and lot, the values of ‘a’ were 0, 0.5and 0.9 respectively. Diversity scores were calculated using cosine similarity betweenthe genres of the movies.
Participants answered 40 questionnaire items on a 7-point scale. The answers werefactor analyzed and produced 6 conceptual factors:
• Perceived recommendation set diversity (5 items, e.g. “Several movies in the listof recommended movies were very different from each other”, factor R2 = .087)
• Perceived recommendation set accuracy16 (6 items, e.g. “The recommended mov-ies fitted my preferences”, factor R2 = .256)
• Perceived choice difficulty (4 items, e.g. “Selecting the best movie was easy/diffi-cult”, factor R2 = .312)
• Perceived system effectiveness (7 items, e.g. “The recommender system gives mevaluable recommendations”, factor R2 = .793)
• Choice satisfaction (6 items, e.g. “My chosen movie could become one of myfavorites”, factor R2 = .647)
• Expertise (3 items, e.g. “Compared to my peers I watch a lot of movies”, no incom-ing arrows)
8 items were deleted due to low communalities or excessive cross-loadings. The dis-covered constructs were then causally related with each other and with the 3 × 3 con-ditions in a Structural Equation Model. The resulting model (Fig. 13) has a reasonablygood fit (χ2(68) = 132.19, p < .001, CFI = .954, TLI = .976, rMSEA = .083).The interactions between diversification and algorithm were included in the model,but not in the graph. This means that the effect of diversification in the graph holds
16 In the previous studies we used the concept “perceived recommendation quality” instead of “perceivedrecommendation accuracy”. The concepts of “recommendation quality” and “recommendation accuracy”are slightly different: perceived accuracy merely looks at how well the recommendations fit ones prefer-ences, while recommendation quality allows for other possible sources of quality.
123

480 B. P. Knijnenburg et al.
-.567 (.112)p < .001
.401 (.089)p < .001
+.434 (.064)p < .001
+
1.690 (.202)p < .001
+
+
.151 (.072)p < .05
+
-.469 (.094)p < .001
.234 (.078)p < .005
+
.254 (.080)p < .005
.309 (.083)p < .001
+
-.657 (.216)p < .005
.410 (.206)p < .05
-.872 (.246)p < .001
.859 (.403)p < .05
-1.229 (.518)p < .05 .979 (.412)
p < .05 -1.036 (.470)p < .05
+++
perceived recommendation
accuracySSA
choice
satisfactionEXP
choice
cultyEXP
perceived recommendation
diversitySSA
recommendation
cationOSA
k-Nearest Neighbors (kNN)(versus most popular)
OSA
Matrix Factorization (MF)(versus most popular)
OSA
participants' movie
ExpertisePC
participants'
GenderPC
perceived system
effectivenessEXP
legendObjective System Aspects (OSA)
cation, kNN, MF
Subjective System Aspects (SSA)variety, accuracy
Experience (EXP)culty, effectiveness, satisfaction
Personal Characteristics (PC) expertise, gender
Fig. 13 The path model constructed for EX2 - Diversification experiment. Please refer to Sect. 4.2.4“Graphical presentation of SEMs” for interpretation of this figure. The manipulation “diversification” givesvalues 0, 1, and 2 to levels “none”, “little” and “lot” respectively. The manipulation of algorithm is rep-resented by the two rectangles “k-Nearest Neighbors” and “Matrix Factorization”, each tested against the“generally most popular” recommendations. Figure 14 gives a more insightful presentation of the effectsof our conditions
only for the “generally most popular” algorithm condition, and that the effects of kNNand MF hold only for the non-diversified condition.
4.8.2 Results
The model shows that non-diversified recommendations provided by the kNN and MFalgorithms are perceived as more accurate than the non-diversified “generally mostpopular” (GMP) recommendations (OSA → SSA). Diversified GMP recommenda-tions are also perceived as more accurate than non-diversified GMP recommendations(OSA → SSA), even though their predicted rating has been traded off with diversity(i.e., the predicted rating of the diversified item set is lower). Accurate recommenda-tions are generally more difficult to choose from (SSA → process-EXP), however,there is also a direct negative effect of kNN, MF and diversification on choice dif-ficulty (OSA → process-EXP). Looking at the marginal effects in Fig. 14 (“Choicedifficulty”) we observe that it is less difficult to choose from the recommendationsproduced by the high diversification settings and the kNN and MF algorithms (or inother words: it is mainly the non-diversified generally most popular recommendationsthat are difficult to choose from).
Surprisingly, the lack of a direct effect of diversification on perceived diversity sug-gests that diversified recommendations do not seem to be perceived as more diverse.Figure 14 (“Perceived recommendation diversity”) gives a possible explanation forthis lack of effect. The relation between manipulated diversity and perceived diversityis not consistent between the three algorithms. Most notably, two observations differstrongly from our initial expectations: the kNN algorithm with low diversification
123

Experience of recommender systems 481
Fig. 14 Tendency of marginal (direct and indirect) effects of algorithm and diversification on our subjectiveconstructs. Error bars indicate ±1 Standard Error. The value of GMP-none is fixed to zero; scales are insample standard deviations
provides surprisingly diverse recommendations, and the most diversified “gener-ally most popular” recommendations are not perceived to be as diverse as theyshould be.
In general, more diverse recommendations (in this case perceived diversity) are alsoperceived as more accurate (SSA → SSA) and less difficult to choose from (SSA →process-EXP; see also Willemsen et al. 2011). Users who rate the recommendationsas accurate also perceive the system to be more effective (SSA → system-EXP). Themore effective the system and the easier the choice, the more satisfied participants are
123

482 B. P. Knijnenburg et al.
with their choice (process-EXP → outcome-EXP and system-EXP → outcome-EXP,respectively).
Finally, we observe that males find the recommendations generally less accurate(PC → SSA), and that in contrast to findings by Kamis and Davern (2004) and Huand Pu (2010) expertise increases the perceived accuracy and diversity of the recom-mendations (PC → SSA) and also increases the choice satisfaction (PC → outcome-EXP).
4.8.3 Discussion of results
Like Ziegler et al. (2005), our results show a positive effect of diversification onthe user experience (requirement 2, see Sect. 3.7). The inclusion of several userexperience constructs in our experiment enables us to show that this effect ismainly due to a lower choice difficulty and a higher perceived system effective-ness (requirement 5). Interestingly, this effect is partially mediated by perceivedaccuracy, but not by perceived diversity (requirement 4). Arguably, users do notnecessarily see the diversified recommendations as more diverse. The higher per-ceived accuracy may have resulted from the fact that users evaluate the accuracyin our questionnaire not per item, but for the list of recommendations as a whole.Users may have noticed that more diverse lists more accurately reflect their diversetastes.
Figure 14 shows that the “GMP-none” condition (i.e. the non-diversified conditionwithout diversification) stands out; it is the only condition that results in a significantlyworse user experience. Also, Fig. 13 shows that the effects of diversification and algo-rithm are similar: they both increase recommendation accuracy and decrease choicedifficulty. In other words: diversification of GMP recommendations might be just aseffective in improving the user experience as introducing a recommendation algorithm.Moreover, despite the absence of an interaction effect in the model, Fig. 14 suggeststhat these effects are not additive: introducing diversification and personalization doesnot improve the user experience beyond introducing either of them separately. Pos-sibly, there is a ceiling-effect to the improvement of the perceived recommendationquality, at least in the between subjects design we employed in this study in whichparticipants do not compare between conditions themselves directly. The result seemsto suggest that providing a diversified but non-personalized list of recommendationsmay result in an equally good user experience as providing personalized recommenda-tions, but we would suggest a replication with other datasets to confirm this surprisingobservation.
We are puzzled by the fact that our diversification manipulation did not result ina higher perceived diversity of the recommendations. Our diversification algorithmreduces the similarity between movies in terms of genre. This may not fit the defini-tion of similarity as the users of the system judge it. Alternatively, our measurementof this concept could have been too weak to pick up on the subtle differences betweenthe recommendation lists. Finally, the effects of expertise and gender show supportfor requirement 8: users’ personal characteristics do indeed influence their user expe-rience.
123

Experience of recommender systems 483
5 Validation of the framework
The goal of this paper is to describe a generic framework for the user-centric evaluationof recommender systems. Such a framework should have merits beyond the scope ofa single research project. Despite their limited scopes, the field trials and experimentsdescribed in this paper can provide an initial test of the general applicability of theframework; any (lack of) consistency in our results gives valuable cues concerningthe external validity of the framework. Furthermore, the framework was designed toallow for ad-hoc findings that can be elaborated in future work. Taken together, theexpected and unexpected findings of our field trials and experiments allow us to reflecton the merit of our framework as a guiding tool for user-centric recommender systemsresearch.
Below, we consolidate the findings of our field trials and experiments by validat-ing parts of the framework separately and discussing the merit of the framework asa whole. We also assess whether parts of the framework need to be reconsidered infuture investigations.
The findings are summarized in Table 2. The table shows that most requirements(as defined in Sect. 3.7) are covered by at least two studies. As the requirements arisefrom gaps in the existing literature, the results of our studies bridge these gaps, andat the same time provide a thorough validation of the framework itself. Moreover,most of the specific results are confirmed in more than one study, thereby providingevidence for the robustness of the results as well as the general applicability of theframework.
Based on the current findings and the relation of the framework to a broad rangeof existing literature, we believe that the general requirements are extensible beyondthe scope of the current studies. However, specific results may very well only holdfor collaborative filtering media recommenders. Further research is needed to extendthese specific findings to other types of recommender systems.
5.1 Objective system aspects (OSA) and subjective system aspects (SSA)
We defined Objective System Aspects (OSAs) as the features of a recommender sys-tem that may influence the user experience, and as things to manipulate in our studies.Most work in the field of recommender systems is focused on algorithms. In ourstudies we therefore considered algorithms as a manipulation (requirement 1), but wealso considered the type of preference input data (requirement 2) and the compositionof the recommendation list (requirement 3). We reasoned that users would notice achange in an OSA: these subjective observations are the Subjective System Aspects(SSAs). Specifically, we argued that SSAs would mediate the effect of the OSAs onthe user’s experience (EXP; requirement 4).
Taken together, the manipulations in FT1, FT2, FT4 and EX2 show that users areable to perceive higher quality recommendations (OSA → SSA) and that this percep-tion mediated the effect of the recommendation quality on the user experience (SSA→ EXP), even though this mediation is in some cases only partial (i.e. in FT2, EX1,EX2).
123
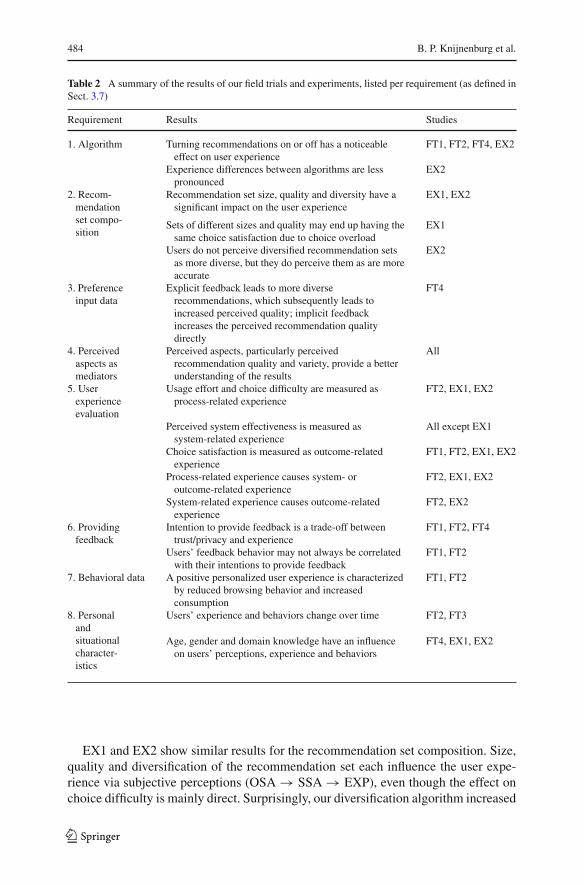
484 B. P. Knijnenburg et al.
Table 2 A summary of the results of our field trials and experiments, listed per requirement (as defined inSect. 3.7)
Requirement Results Studies
1. Algorithm Turning recommendations on or off has a noticeableeffect on user experience
FT1, FT2, FT4, EX2
Experience differences between algorithms are lesspronounced
EX2
2. Recom-mendationset compo-sition
Recommendation set size, quality and diversity have asignificant impact on the user experience
EX1, EX2
Sets of different sizes and quality may end up having thesame choice satisfaction due to choice overload
EX1
Users do not perceive diversified recommendation setsas more diverse, but they do perceive them as are moreaccurate
EX2
3. Preferenceinput data
Explicit feedback leads to more diverserecommendations, which subsequently leads toincreased perceived quality; implicit feedbackincreases the perceived recommendation qualitydirectly
FT4
4. Perceivedaspects asmediators
Perceived aspects, particularly perceivedrecommendation quality and variety, provide a betterunderstanding of the results
All
5. Userexperienceevaluation
Usage effort and choice difficulty are measured asprocess-related experience
FT2, EX1, EX2
Perceived system effectiveness is measured assystem-related experience
All except EX1
Choice satisfaction is measured as outcome-relatedexperience
FT1, FT2, EX1, EX2
Process-related experience causes system- oroutcome-related experience
FT2, EX1, EX2
System-related experience causes outcome-relatedexperience
FT2, EX2
6. Providingfeedback
Intention to provide feedback is a trade-off betweentrust/privacy and experience
FT1, FT2, FT4
Users’ feedback behavior may not always be correlatedwith their intentions to provide feedback
FT1, FT2
7. Behavioral data A positive personalized user experience is characterizedby reduced browsing behavior and increasedconsumption
FT1, FT2
8. Personalandsituationalcharacter-istics
Users’ experience and behaviors change over time FT2, FT3
Age, gender and domain knowledge have an influenceon users’ perceptions, experience and behaviors
FT4, EX1, EX2
EX1 and EX2 show similar results for the recommendation set composition. Size,quality and diversification of the recommendation set each influence the user expe-rience via subjective perceptions (OSA → SSA → EXP), even though the effect onchoice difficulty is mainly direct. Surprisingly, our diversification algorithm increased
123

Experience of recommender systems 485
perceived accuracy but not perceived diversity. Despite this, diversification was aseffective in improving the user experience as the introduction of a good algorithm.
In terms of preference input, FT4 shows that even though implicit feedback recom-mendations are based on more data than explicit feedback recommendations (all userbehavior versus ratings only), they are not always better from a user’s perspective,especially if one takes into account the variety of the recommendations.
Concluding, the core component of our framework—the link from algorithm orpreference input data (OSA) to subjective recommendation quality (SSA) to experi-ence (EXP)—is upheld throughout every conducted study. Some direct effects (OSA→ EXP) occur, which could indicate that not all possible SSAs were measured. Ingeneral the SSAs mediate the effects of OSA on EXP, thereby explaining the effects ofthe OSAs in more detail (i.e. the why and how of improved user experience). The capa-bility to explain both surprising and straightforward findings makes SSAs an essentialpart of our evaluation.
5.2 The different objects of experience (EXP)
We reasoned that user experience could be process-related, system-related and out-come-related. We argued that different recommender system aspects could influencedifferent types of experience, and that one type of experience could influence another.Previous research typically includes just one type of user experience in their evalua-tion. In most of our studies we therefore considered more than one type of experience(requirement 5).
Our research confirms that these different types of user experience indeed exist; thestudies discern the following user experience constructs: perceived usage effort (pro-cess-EXP; FT2), choice difficulty (process-EXP; EX1, EX2), perceived system effec-tiveness (system-EXP; all studies, except EX1) and choice satisfaction (outcome-EXP;FT1, FT2, EX1, EX2). In all cases, the main mediator that causes these experiencevariables is the perceived recommendation quality. Structurally, process-related expe-riences often cause system-related experiences, which in turn cause outcome-relatedexperiences (process-EXP → system-EXP → outcome-EXP).
5.3 Behavioral data and feedback intentions
We indicated that behavioral data could be triangulated with subjective experiencedata to improve the interpretation of behavioral results, and to ground self-report mea-sures in actual behavior (requirement 7). We also reasoned that the specific behaviorof providing preference feedback is of particular interest to recommender systemsresearchers, because in many systems this feedback is needed to provide good recom-mendations (requirement 6).
FT1, FT2 and FT4 show that feedback behavior is a trade-off between the users’trust or privacy concerns, and the user experience. The actual feedback behavior is notalways highly correlated with the intention to provide feedback.
Furthermore, all field trials show several significant triangulations. Consistently,reduced browsing and increased consumption are indicators of effective systems.
123

486 B. P. Knijnenburg et al.
In some cases behaviors are directly related to the OSAs. This probably means thatwe did not measure the specific SSAs that would mediate the effect.
5.4 Personal and situational characteristics (PC and SC)
We argued that personal and situational characteristics may influence the users’ expe-rience and interaction with the system (requirement 8). Our research (FT1 and FT2)addresses trust in technology (PC) and system-specific privacy concerns (SC), andshows how these concepts influence users’ feedback intentions (see requirement6). Furthermore, the experience and interaction of the recommender systems in ourresearch changes over time (SC; see FT2 and FT3). Concluding, several contextualeffects seem to influence the users’ interaction and experience with the recommendersystem. Our research addresses trust, privacy, time, age, gender and expertise (domainknowledge).
Our initial conception of the effect of personal and situational characteristics seemsto have been too restrictive: We only allowed these characteristics to influence theexperience (EXP) and interaction (INT). Based on the results of our research, weacknowledge that these characteristics can sometimes influence not only the evalua-tion, but also the perception of the system (i.e. influence the subjective system aspects,SSAs). We suggest including an additional arrow from personal and situational charac-teristics to subjective system aspects (PC → SSA and SC → SSA), and we encourageresearchers to investigate this connection in more detail in future experiments.
Our research on the users’ intention to provide feedback also alludes to possiblechanges in the framework. The results of FT1 and FT2 are not entirely consistentin terms of the factors that influence the intention to provide feedback, and furtherresearch is needed to specifically delineate what causes and inhibits users to providepreference feedback to the system (see Pommeranz et al. 2012, for a good example).
6 Conclusion
The framework provides clear guidance for the construction and analysis of new rec-ommender system experiments. It allows for an in-depth analysis that goes beyondalgorithmic performance: it can explain why users like a certain recommender systemand how this user experience comes about.
The framework also puts emphasis on the integration of research. When testingwith real users one cannot study algorithms in isolation; several system aspects (andpersonal and situational characteristics) have to be combined in a single experimentto gain a full understanding of the user experience.
For industry researchers, the user-centric focus of the framework provides a stepcloser to the customers, who may not consider the accuracy of the algorithm the mostimportant aspect of their experience. Questionnaire-taking and A/B testing (the indus-try term for testing several versions of a certain system aspect) are an accepted formof research in web technology. For academic researchers, the framework provides anopportunity to check the real-world impact of the latest algorithmic improvements.Moreover, interesting effects of situational and personal characteristics, as well as
123

Experience of recommender systems 487
behavioral correlates can be used as input for context-aware recommender engines.Even more so, when evaluating the relative merit of novel recommendation approachessuch as context-aware algorithms (Adomavicius et al. 2005) and recommenders usingsocial networks (Kautz et al. 1997), one has to rely on more sophisticated ways ofmeasuring the full user experience, and our framework could serve as a guideline forsuch evaluations.
7 Future research
This paper has argued that measuring algorithmic accuracy is an insufficient methodto analyze the user experience of recommender systems. We have therefore introducedand validated a user-centric evaluation framework that explains how and why the userexperience of a recommender system comes about. With its mediating variables andits integrative approach, the framework provides a structurally inclusive foundationfor future work. Our research validates the framework and, beyond that, producedsome unanticipated results.
Still, our work represents merely the tip of the iceberg of user-centric recommendersystems research. Our research is limited in scope: we only tested a small number ofmedia-oriented recommender systems. To determine the scope of applicability of ourframework, further validation of the framework should consider other content types,specifically “search products”. Moreover, some of our results are inconclusive andrequire further investigation.
The link between algorithmic accuracy and user experience is a fundamental ques-tion that currently still functions as the untested premise of a considerable part of therecommender systems research. The same holds for users’ intention to provide feed-back. And whereas our research shows some interesting results concerning the useof explicit versus implicit feedback, it is by no means exhaustive in this respect. Wefurthermore believe that future work could investigate the effects of other personal andsituational characteristics, and the results of these studies could be used to personalizenot only the recommendations of the system, but also the system itself (Knijnenburgand Willemsen 2010, 2009; Knijnenburg et al. 2011).
Because of the pioneering nature of our work, we took a very thorough approachin our evaluation. The proposed methodology of measuring constructs with multiplequestionnaire items and analyzing the results with exploratory factor analyses andstructural equation models improves the external validity of our results. We realize,however, that this methodology may be infeasible when testing recommender systemsin a fully operational industry setting. We therefore created a pragmatic procedure thatallows the measurement of specific concepts of recommender system user experiencewith just a few key questionnaire items and a simplified (possibly automated) statis-tical evaluation (Knijnenburg et al. 2011a). Our current results provided useful inputfor the development of this procedure.
Concluding, our framework provides a platform for future work on recommendersystems, and allows researchers and developers in industry and academia to consis-tently evaluate the user experience of their systems. The future of user-centric recom-mender systems research is full of exciting opportunities.
123

488 B. P. Knijnenburg et al.
Acknowledgements We would like to thank Mark Graus for programming the recommender systemsused in EX1 and EX2, Steffen Rendle for implementing the explicit feedback MF algorithm, Niels Reijmer,Yunan Chen and Alfred Kobsa for their comments at several stages of this paper, and Dirk Bollen for allowingus to incorporate the results of his choice overload experiment (EX1) in this paper. We also thank the threeanonymous reviewers for their extensive comments on the initial submission. We gratefully acknowledgethe funding of our work through the European Commission FP7 project MyMedia (www.mymediaproject.org) under the grant agreement no. 215006. For inquiries please contact [email protected].
Open Access This article is distributed under the terms of the Creative Commons Attribution Licensewhich permits any use, distribution, and reproduction in any medium, provided the original author(s) andthe source are credited.
Appendix A: Methodology
Statistical analysis of our field trials and experiments involved two main steps: validat-ing the measured latent concepts using exploratory factor analysis (EFA) and testingthe structural relations between the manipulations, latent concepts and behavioralmeasurements using structural equation modeling (SEM). In this section we providea detailed description of our methodological approach by means of a hypotheticalexample. See Knijnenburg et al. (2011a) for a more pragmatic procedure to evaluaterecommender systems.
In the example, we test two algorithms (A1 and A2) against a non-personalizedbaseline (A0). We measure perceived recommendation quality (Q) with 5 statements(Q1 . . . Q5) to which participants can agree or disagree on a 5-point scale. Satisfactionwith the system (S) is measured with 6 items (S1 . . . S6). Finally, we measure userbehavior (B) in terms of the number of clips watched from beginning to end.
Exploratory factor analysis (EFA)
The first step is to confirm whether the 13 items indeed measure the predicted twolatent concepts. This is done using exploratory factor analysis. This technique extractscommon variance between the measured items and distributes this variance over anumber of latent factors. We use the software package Mplus17 to do this analysiswith the command “analysis: type = efa 1 3; estimator = wlsmv;”. This runs theexploratory factor analysis with 1, 2 and 3 factors, and uses a weighted least squaresestimation procedure with mean- and variance-adjusted chi-square tests.
The factor analytical model can be represented as Fig. 15. Each item is essentiallya regression outcome,18 predicted by two unobserved latent variables. I1,1 to I2,11 arecalled the loadings of the items Q1 . . . S6 on the factors F1 and F2. The model triesto estimate these loadings so that the paths match the covariance matrix of the itemsQ1 to S6 as closely as possible (e.g. cov1,2 ≈ I1,1 ∗ I1,2 + I2,1 ∗ I2,2 + I1,1 ∗ w1,2 ∗I2,2 +I1,2 ∗w1,2 ∗I2,1). Intuitively, factor analysis tries to model the “overlap” betweenitems. The part of the variance that does not overlap is excluded (and represented by
17 http://www.statmodel.com/.18 Since these outcomes are measured on a 5-point scale, this regression model is an ordinal responsemodel.
123

Experience of recommender systems 489
Q1 Q2 Q3 Q4 Q5 S1 S2 S3 S4 S5 S6
I1,1 I1,2 I2,10 I2,11
F1 F2
w1,2
Fig. 15 Representation of the exploratory factor analysis example. Two factors, F1 and F2, are extractedfrom the questionnaire data (items Q1. . .Q5 and S1 . . . S6). The arrows from the factors to the questions(I1,1 . . . I2,11) represent the factor loadings. The arrows at the bottom represent the portion of the variancenot accounted for by the analysis. Factors have a certain reliability (represented by the arrows at the top),and may be correlated (represented by w1,2). If the grey arrows are close to zero, F1 effectively measuresrecommendation quality (Q) and F2 effectively measures satisfaction with the system (S)
the arrows at the bottom of Fig. 15). The more overlap extracted, the more reliable thefactor (the arrows at the top). The factors may be correlated with each other (w1,2).The solution has no standard coordinate system, so it is rotated so that each questionloads on only one factor as much as possible.
If the measurement tool was specified correctly, then the model has a good least-squares fit, and only the paths from F1 to Q1 . . . Q5 and from F2 to S1 . . . S6 are signif-icantly larger than zero (i.e. only the darker paths in Fig. 15). In that case F1 measuresrecommendation quality, and F2 measures satisfaction with the system. However, thefollowing problems may arise:
• A one-factor solution fits almost as well as a two-factor solution: In this case, wemust conclude that Q and S are essentially the same concept.
• A three-factor solution fits much better than a two-factor solution: In this case, thisquestionnaire measures three concepts (usually because either S or Q is in fact acombination of two factors).
• A certain item does not have enough in common with the other items to load on anyof the factors significantly (p < .05): In this case the item has “low communality”and should be removed from the analysis.
• A certain item loads on the wrong factor, or on both factors: The item has a high“cross-loading”, and unless we can come up with a good reason for this to occur,it should be removed from the analysis.
Once an adequate factor solution is established, the remaining items are used in thesecond step of the analysis.
123

490 B. P. Knijnenburg et al.
B
++
+.50 (.30)p < .05
.60 (.15)p < .001
.30 (.15)p < .05
+
.80 (.30)p < .005
Q1 Q2 Q3 Q4 Q5 S1 S2 S3 S4 S5 S6
QSSA
SEXP
A1vs. A0
OSA
A2vs. A0
OSA
Fig. 16 Representation of the structural equation modeling example. The algorithms (A1 and A2) influencethe perceived recommendation quality (Q), which in turn influences the satisfaction with the system (S).The satisfaction (S) is in turn correlated with the number of clips watched from beginning to end (B). Q ismeasured by (Q1 . . . Q5) and S is measured by (S1 . . . S6). In the models in the main text the questionnaireitems (Q1 . . . S6) are hidden in order to get a less cluttered representation
Structural equation modeling (SEM)
The second step is to test the structural relations between our manipulation (A), thelatent concepts (Q and S) and the behavior measurement (B). Our manipulation hasthree conditions (A0, A1, and A2), so we create two dummy variables (A1 and A2),which are tested against the baseline. The dummies are coded in such a way that theyrepresent the different conditions: For participants in the baseline A1 = 0, and A2 = 0;for participants with algorithm 1, A1 = 1, and A2 = 0; for participants with algorithm1, A1 = 0, and A2 = 1. As a result of this coding, the effect of A1 is therefore theeffect of algorithm 1 compared to the baseline, and the effect of A2 is the effect ofalgorithm 2 compared to the baseline.
The resulting model is tested using structural equation modeling. The specificationof the model defines the factors and the items with which they are measured (in Mplus:“Q by Q1–Q5; S by S1–S6;”), and the structural relations among the factors and othervariables (in Mplus: “S on Q A1 A2; Q on A1 A2;”). This creates a model that can berepresented as Fig. 16 (but, as of yet, without B).
Like any regression model, structural equation models make assumptions aboutthe direction of causality in the model. From a modeling perspective, an effect(Q → S) and its reverse (S → Q) are equally plausible (Netemeyer and Bentler2001). By including the manipulation(s) in our model, we are able to “ground”the causal effects: participants are randomly assigned to a condition, so con-dition assignment cannot be caused by anything in the model (i.e. A1 → Qis possible, but not Q → A1). Furthermore, the framework provides hypothe-ses for the directionality of causal effects (since in the framework we hypothe-size that SSA → EXP and not EXP → SSA, we can limit ourselves to testingQ → S, cf. Anderson and Gerbing 1988; Bagozzi and Yi 1988).
123

Experience of recommender systems 491
For each regression path in the model, a regression coefficient is estimated. Asthe values of the latent constructs are standardized (by means of the factor analysis),the regression coefficient between the two latent constructs (Q → S) shows that a 1standard deviation difference in Q causes a 0.60 standard deviation difference S. Thestandard error of the coefficient (0.15) can be used in a z-test to test whether the pathis significant (p = z[.60/.15] = .00003 < .001). The dummy variables A1 and A2are not standardized, but represent the presence (1) or absence (0) of a certain condi-tion. Therefore, the coefficient on the arrow A1 → Q shows that Q is 0.50 standarddeviations higher for participants in A1 than for those in A0.
In a typical model, not all initially specified paths are significant. This means thatsome effects will be fully mediated. For example: if the paths from A1 and A2 toS (the lighter paths in Fig. 16) are not significant, the effect of A1 and A2 on S isfully mediated. Otherwise, there is only partial mediation. Non-significant effects areremoved from the model and the model is ran again to create a more parsimoniousresult.19
Variables that have no hypothesized effect (such as B in this model) are initiallyincluded in the model without specifying any structural relation for it. Mplus can pro-vide a “modification index” for this variable, thereby showing where it best fits in themodel. Since such effect is ad-hoc, it is only to be included if it is highly significant.
Variables for which we have no hypothesized direction of effect (again, variable Bin this model, for which we don’t know whether B → S or S → B) are included as acorrelation. This means that no assumption about the direction of causality is made.
The final model (after excluding non-significant effects and including ad-hoceffects) can be tested as a whole. The Chi-square statistic tests the difference inexplained variance between the proposed model and a fully specified model. A goodmodel is not statistically different from the fully specified model (p > .05). How-ever, this statistic is commonly regarded as too sensitive, and researchers have there-fore proposed other fit indices (Bentler and Bonett 1980). Based on extensive sim-ulations, Hu and Bentler (1999) propose cut-off values for these fit indices to be:CFI > .96, TLI > .95, and rMSEA < .05. Moreover, a good model makes sensefrom a theoretical perspective. The model shown in Fig. 16 has this quality: The algo-rithms (A1 and A2) influence the perceived recommendation quality (Q), which in turninfluences the satisfaction with the system (S). The satisfaction (S) is in turn correlatedwith the number of clips watched from beginning to end (B).
Appendix B: Questionnaire items for each construct
This appendix lists all the questionnaire items shown to the participants of the fieldtrials and experiments. It makes a distinction between those items that were included
19 Not all non-significant effects are excluded from the models. For instance, when two conditions aretested against a baseline, and one of the conditions does not significantly differ from the baseline but theother does, then the non-significant effect is retained to allow a valid interpretation of the significant effect.Furthermore, in EX2, the interactions between diversity and algorithm, though not significant, are retained,as they allow a valid interpretation of the significant conditional main effects.
123

492 B. P. Knijnenburg et al.
in the final analysis, and those items that did not contribute to stable constructs andwere therefore deleted. Included questions are in order of decreasing factor loading.
FT1 EMIC pre-trial
Perceived recommendation quality
Included:• I liked the items recommended by the system.• The recommended items fitted my preference.• The recommended items were well-chosen.• The recommended items were relevant.• The system recommended too many bad items.• I didn’t like any of the recommended items.• The items I selected were “the best among the worst”.
Perceived system effectiveness
Included:• I would recommend the system to others.• The system is useless.• The system makes me more aware of my choice options.• I make better choices with the system.• I can find better items without the help of the system.• I can find better items using the recommender system.Not included:• The system showed useful items.
Choice satisfaction
Included:• I like the items I’ve chosen.• I was excited about my chosen items.• I enjoyed watching my chosen items.• The items I watched were a waste of my time.• The chosen items fit my preference.• I know several items that are better than the ones I selected.• Some of my chosen items could become part of my favorites.• I would recommend some of the chosen items to others/friends.
Intention to provide feedback
Included:• I like to give feedback on the items I’m watching.• Normally I wouldn’t rate any items.• I only sparingly give feedback.
123

Experience of recommender systems 493
• I didn’t mind rating items.• In total, rating items is not beneficial for me.
General trust in technology
Included:• Technology never works.• I’m less confident when I use technology.• The usefulness of technology is highly overrated.• Technology may cause harm to people.Not included:• I prefer to do things by hand.• I have no problem trusting my life to technology.• I always double-check computer results.
System-specific privacy concern
Included:• I’m afraid the system discloses private information about me.• The system invades my privacy.• I feel confident that the system respects my privacy.• I’m uncomfortable providing private data to the system.• I think the system respects the confidentiality of my data.
FT2 EMIC trial
Perceived recommendation quality
Included:• I liked the items shown by the system.• The shown items fitted my preference.• The shown items were well-chosen.• The shown items were relevant.• The system showed too many bad items.• I didn’t like any of the shown items.Not included:• The system showed useful items.• The items I selected were “the best among the worst”.
Effort to use the system
Included:• The system is convenient.• I have to invest a lot of effort in the system.• It takes many mouse-clicks to use the system.
123

494 B. P. Knijnenburg et al.
Included:• Using the system takes little time.• It takes too much time before the system provides adequate recommendations.
Perceived system effectiveness and fun
Included:• I have fun when I’m using the system.• I would recommend the system to others.• Using the system is a pleasant experience.• The system is useless.• Using the system is invigorating.• The system makes me more aware of my choice options.• Using the system makes me happy.• I make better choices with the system.• I use the system to unwind.• I can find better items using the recommender system.Not included:• I can find better items without the help of the system.• I feel bored when I’m using the system.
Choice satisfaction
Included:• I like the items I’ve chosen.• I was excited about my chosen items.• I enjoyed watching my chosen items.• The items I watched were a waste of my time.• The chosen items fit my preference.Not included:• I know several items that are better than the ones I selected.• Some of my chosen items could become part of my favorites.• I would recommend some of the chosen items to others/friends.
Intention to provide feedback
Included:• I like to give feedback on the items I’m watching.• Normally I wouldn’t rate any items.• I only sparingly give feedback.• I didn’t mind rating items.Not included:• In total, rating items is not beneficial for me.
123

Experience of recommender systems 495
General trust in technology
Included:• Technology never works.• I’m less confident when I use technology.• The usefulness of technology is highly overrated.• Technology may cause harm to people.
System-specific privacy concern
Included:• I’m afraid the system discloses private information about me.• The system invades my privacy.• I feel confident that the system respects my privacy.Not included:• I’m uncomfortable providing private data to the system.• I think the system respects the confidentiality of my data.
FT3 BBC pre-trial
Perceived recommendation quality
Included:• The recommended items were relevant.• I liked the recommendations provided by the system.• The recommended items fitted my preference.• The MyMedia recommender is providing good recommendations.• I didn’t like any of the recommended items.• The MyMedia recommender is not predicting my ratings accurately.• The recommendations did not include my favorite programmes.
Perceived recommendation variety
Included:• The recommendations contained a lot of variety.• All the recommended programmes were similar to each other.
Perceived system effectiveness
Included:• The MyMedia recommender is useful.• I would recommend the MyMedia recommender to others.• The MyMedia recommender has no real benefit for me.• I can save time using the MyMedia recommender.• I can find better programmes without the help of the MyMedia recommender.
123

496 B. P. Knijnenburg et al.
• The MyMedia recommender is recommending interesting content I hadn’t previ-ously considered.
Not included:• The system gave too many recommendations.
FT4 BBC trial
Perceived recommendation quality
Included:• The MyMedia recommender is providing good recommendations.• I liked the recommendations provided by the system.• The recommended items fitted my preference.• The recommended items were relevant.• I didn’t like any of the recommended items.• The MyMedia recommender is not predicting my ratings accurately.• The recommendations did not include my favorite programmes.
Perceived recommendation variety
Included:• The recommendations contained a lot of variety.• The MyMedia recommender is recommending interesting content I hadn’t previ-
ously considered.• The recommendations covered many programme genres.• All the recommended programmes were similar to each other.• Most programmes were from the same genre.
Perceived system effectiveness
Included:• The MyMedia recommender has no real benefit for me.• I would recommend the MyMedia recommender to others.• The MyMedia recommender is useful.• I can save time using the MyMedia recommender.• I can find better programmes without the help of the MyMedia recommender.Not included:• The system gave too many recommendations.
EX1 choice overload experiment
Perceived recommendation variety
Included:• The list of recommendations was varied.• The list of recommendations included movies of many different genres.
123

Experience of recommender systems 497
• Many of the movies in the list differed from other movies in the list.• All recommendations seemed similar.Not included:• No two movies in the list seemed alike.• The list of recommendations was very similar/very varied.
Perceived recommendation quality
Included:• The list of recommendations was appealing.• How many of the recommendations would you care to watch?• The list of recommendations matched my preferences.• I did not like any of the recommendations in the list.
Choice difficulty
Included:• Eventually I was in doubt between … items.• I changed my mind several times before making a decision.• I think I chose the best movie from the options.• The task of making a decision was overwhelming.Not included:• How easy/difficult was it to make a decision?• How frustrating was the decision process?
Choice satisfaction
Included:• My chosen movie could become one of my favorites.• How satisfied are you with the chosen movie?• I would recommend the chosen movie to others.• I think I would enjoy watching the chosen movie.• I would rather rent a different movie from the one I chose.• I think I chose the best movie from the options.Not included:• The list of recommendations had at least one movie I liked.
Expertise
Included:• I am a movie lover.• Compared to my peers I watch a lot of movies.• Compared to my peers I am an expert on movies.
123

498 B. P. Knijnenburg et al.
EX2 diversification experiment
Perceived recommendation accuracy
Included:• The recommended movies fitted my preference.• Each of the recommended movies was well-chosen.• I would give the recommended movies a high rating.• The provided recommended movies were interesting.• I liked each of the recommended movies provided by the system.• Each of the recommended movies was relevant.Not included:• I did not like any of the recommended movies.
Perceived recommendation variety
Included:• Several movies in the list of recommended movies were very different from each
other.• The list of recommended movies covered many genres.• The list of recommended movies had a high variety.• Most movies were from the same type.• The list of recommended movies was very similar/ very varied.Not included:• All recommended movies were similar to each other.
Choice difficulty
Included:• Selecting the best movie was very easy/very difficult.• Comparing the recommended movies was very easy/very difficult.• Making a choice was overwhelming.• I changed my mind several times before choosing a movie.Not included:• Making a choice was exhausting.• Making a choice was fun.• Making a choice was frustrating.• Eventually I was in doubt between … movies.
Perceived system effectiveness
Included:• The recommender system gave me valuable recommendations.• I would recommend the recommender system to others.• I can find better movies using the recommender system.
123

Experience of recommender systems 499
• I make better choices with the recommender system.• The recommender system is useless.• The recommender system makes me more aware of my choice options.• I don’t need the recommender system to find good movies.
Choice satisfaction
Included:• My chosen movie could become one of my favorites.• The chosen movie fits my preference.• I will enjoy watching my chosen movie.• I like the movie I have chosen.• I will recommend the movie to others/friends.• Watching my chosen movie will be a waste of my time.Not included:• I am excited about my chosen movie.
Expertise
Included:• Compared to my peers I watch a lot of movies.• Compared to my peers I am an expert on movies.• I only know a few movies.Not included:• I am a movie lover.
References
Ackerman, M., Cranor, L., Reagle, J.: Privacy in e-commerce: examining user scenarios and privacy pref-erences. In: Conference on Electronic Commerce, pp. 1–8. Denver, CO (1999)
Adomavicius, G., Tuzhilin, A.: Toward the next generation of recommender systems: a survey of the state-of-the-art and possible extensions. IEEE Trans. Knowl. Data Eng. 17, 734–749 (2005)
Adomavicius, G., Sankaranarayanan, R., Sen, S., Tuzhilin, A.: Incorporating contextual information inrecommender systems using a multidimensional approach. ACM Trans. Inf. Syst. 23, 103–145 (2005)
Anderson, J.C., Gerbing, D.W.: Structural equation modeling in practice: a review and recommended two-step approach. Psychol. Bull. 103, 411–423 (1988)
Bagozzi, R., Yi, Y.: On the evaluation of structural equation models. J. Acad. Market. Sci. 16,74–94 (1988)
Baudisch, P., Terveen, L.: Interacting with recommender systems. In: SIGCHI Conference on HumanFactors in Computing Systems, p. 164. Pittsburgh, PA (1999)
Bechwati, N., Xia, L.: Do computers sweat? The impact of perceived effort of online decision aids onconsumers’ satisfaction with the decision process. J. Consum. Psychol. 13, 139–148 (2003)
Bentler, P.M., Bonett, D.G.: Significance tests and goodness of fit in the analysis of covariance struc-tures. Psychol. Bull. 88, 588–606 (1980)
Berendt, B., Teltzrow, M.: Addressing users’ privacy concerns for improving personalization quality:towards an integration of user studies and algorithm evaluation. In: IJCAI 2003 Workshop on Intelli-gent Techniques for Web Personalization, LNAI, vol. 3169, pp. 69–88. Acapulco, Mexico (2005)
Bharati, P., Chaudhury, A.: An empirical investigation of decision-making satisfaction in web-based decisionsupport systems. Decis. Support Syst. 37, 187–197 (2004)
123

500 B. P. Knijnenburg et al.
Bhatnagar, A., Ghose, S.: Online information search termination patterns across product categories andconsumer demographics. J. Retail. 80, 221–228 (2004)
Bollen, D., Knijnenburg, B., Willemsen, M., Graus, M.: Understanding choice overload in recommendersystems. In: Fourth ACM Conference on Recommender systems, pp. 63–70. Barcelona, Spain(2010)
Bradley, K., Smyth, B.: Improving recommendation diversity. In: Twelfth Irish Conference on ArtificialIntelligence and Cognitive Science, pp. 85–94. Maynooth, Ireland (2001)
Brodie, C., Karat, C., Karat, J. : Creating an E-commerce environment where consumers are willing toshare personal information. In: Karat, C.-M., Blom, J.O., Karat, J. (eds.) Designing Personalized UserExperiences in eCommerce, pp. 185–206. Kluwer, Dordrecht (2004)
Burke, R.: Hybrid recommender systems: survey and experiments. User Model. User-Adap. Int. 12,331–370 (2002)
Cena, F., Vernero, F., Gena, C.: Towards a customization of rating scales in adaptive systems. In: 18th Inter-national Conference on User Modeling, Adaptation, and Personalization, vol. 6075, pp. 369–374. BigIsland, HI, LNCS (2010)
Chellappa, R., Sin, R.: Personalization versus privacy: an empirical examination of the online consumer’sdilemma. Inf. Technol. Manag. 6, 181–202 (2005)
Chen, L., Pu, P.: Interaction design guidelines on critiquing-based recommender systems. User Model.User-Adap. Inter. 19, 167–206 (2009)
Chen, L., Pu, P.: Critiquing-based recommenders: survey and emerging trends. User. Model. User-Adap.Inter. 22(1–2), 125–150 (2012)
Chin, D.: Empirical evaluation of user models and user-adapted systems. User Model. User-Adap.Inter. 11, 181–194 (2001)
Cooke, A., Sujan, H., Sujan, M., Weitz, B.A.: Marketing the unfamiliar: the role of context and item-specificinformation in electronic agent recommendations. J. Market. Res. 39, 488–497 (2002)
Cosley, D., Lam, S., Albert, I., Konstan, J., Riedl, J.: Is seeing believing?: how recommender systeminterfaces affect users’ opinions. In: SIGCHI Conference on Human Factors in Computing Systems,pp. 585–592. Ft. Lauderdale, FL (2003)
Cramer, H., Evers, V., van Someren, M., Ramlal, S., Rutledge, L., Stash, N., Aroyo, L., Wielinga, B.: Theeffects of transparency on trust and acceptance in interaction with a content-based art recom-mender. User Model. User-Adap. Inter. 18, 455–496 (2008a)
Cramer, H., Evers, V., van Someren, M., Ramlal, S., Rutledge, L., Stash, N., Aroyo, L., Wielinga, B.:The effects of transparency on perceived and actual competence of a content-based recommender. In:CHI’08 Semantic Web User Interaction Workshop. Florence, Italy (2008b)
Csikszentmihalyi, M.: Beyond Boredom and Anxiety. Jossey-Bass Publishers, San Fransisco (1975)Davis, F.: Perceived usefulness, perceived ease of use, and user acceptance of information technology. MIS
Q. 13, 319–340 (1989)Davis, F., Bagozzi, R., Warshaw, P.: User acceptance of computer technology: a comparison of two theo-
retical models. Manag. Sci. 35, 982–1003 (1989)Diehl, K., Kornish, L., Lynch, J. Jr.: Smart agents: when lower search costs for quality information increase
price sensitivity. J. Consum. Res. 30, 56–71 (2003)Felfernig, A., Teppan, E., Gula, B.: Knowledge-based recommender technologies for marketing and
sales. Int. J. Pattern Recog. Artif. Intell. 21, 333–354 (2007)Felix, D., Niederberger, C., Steiger, P., Stolze, M.: Feature-oriented vs. needs-oriented product access for
non-expert online shoppers. In: IFIP Conference on Towards the E-Society: E-commerce, E-business,and E-government, pp. 399–406. Zürich, Switzerland (2001)
Fishbein, M., Ajzen, I.: Belief, Attitude, Intention and Behavior: An Introduction to Theory andResearch. Addison-Wesley, Reading (1975)
Gena, C., Brogi, R., Cena, F., Vernero, F.: Impact of rating scales on user’s rating behavior. In: 19th Interna-tional Conference on User Modeling, Adaptation, and Personalization, LNCS, vol. 6787, pp. 123–134.Girona, Spain (2011)
Harper F., Li X., Chen Y., Konstan J.: An economic model of user rating in an online recommender system.In: 10th International Conference on User Modeling, LNCS, vol. 3538, pp. 307–316. Edinburgh, UK(2005)
Hassenzahl, M.: The thing and I: understanding the relationship between user and product. In: Blythe,M.A., Monk, A.F., Overbeeke, K., Wright, P.C. (eds.) Funology, pp. 31–42. Kluwer, Dordrecht(2005)
123

Experience of recommender systems 501
Hassenzahl, M.: User experience (UX): towards an experiential perspective on product quality. In: 20thInternational Conference of the Association Francophone d’Interaction Homme-Machine, pp. 11–15.Metz, France (2008)
Häubl, G., Trifts, V.: Consumer decision making in online shopping environments: the effects of interactivedecision aids. Market. Sci. 19, 4–21 (2000)
Häubl, G., Dellaert, B., Murray, K., Trifts, V. : Buyer behavior in personalized shopping environ-ments. In: Karat, C.-M., Blom, J.O., Karat, J. (eds.) Designing Personalized User Experiencesin eCommerce, pp. 207–229. Kluwer, Dordrecht (2004)
Hauser, J., Urban, G., Liberali, G., Braun, M.: Website morphing. Market. Sci. 28, 202–223 (2009)Hayes, C., Massa, P., Avesani, P., Cunningham, P.: An on-line evaluation framework for recommender
systems. In: AH’2002 Workshop on Recommendation and Personalization in E-Commerce, pp.50–59. Málaga, Spain (2002)
Herlocker, J., Konstan, J., Riedl, J.: Explaining Collaborative filtering recommendations. In: 2000 ACMConference on Computer Supported Cooperative Work, pp. 241–250. Philadelphia, PA (2000)
Herlocker, J., Konstan, J., Terveen, L., Riedl, J.: Evaluating collaborative filtering recommender sys-tems. ACM Trans. Inf. Syst. 22, 5–53 (2004)
Ho, S.Y., Tam, K.Y.: An empirical examination of the effects of web personalization at different stages ofdecision making. Int. J. Human-Comput. Interact. 19, 95–112 (2005)
Hostler, R., Yoon, V., Guimaraes, T.: Assessing the impact of internet agent on end users’ performance.Decis. Supp. Syst. 41, 313–323 (2005)
Hsu, C., Lu, H.: Why do people play on-line games? An extended TAM with social influences and flowexperience. Inf. Manag. 41, 853–868 (2004)
Hu, L.-T., Bentler, P.: Cutoff criteria for fit indexes in covariance structure analysis: conventional criteriaversus new alternatives. Struct. Equ. Model: A Multidiscip. J. 6, 1–55 (1999)
Hu, R., Pu, P.: A comparative user study on rating vs. personality quiz based preference elicitation meth-ods. In: 14th International Conference on Intelligent User Interfaces, pp. 367–371. Sanibel Island, FL(2009)
Hu, R., Pu, P.: A study on user perception of personality-based recommender systems. In: 18th InternationalConference on User Modeling, Adaptation, and Personalization, LNCS, vol. 6075. pp. 291–302. BigIsland, HI (2010)
Hu, R., Pu., P.: Enhancing recommendation diversity with organization interfaces. In: 16th InternationalConference on Intelligent User Interfaces, pp. 347–350. Palo Alto, CA (2011)
Hu, Y., Koren, Y., Volinsky, C.: Collaborative filtering for implicit feedback datasets. In: 2008 Eighth IEEEInternational Conference on Data Mining, pp. 263–272. Pisa, Italy (2008)
Huang, P., Lurie, N.H., Mitra, S.: Searching for experience on the web: an empirical examination of con-sumer behavior for search and experience goods. J. Market. 73(2), 55–69 (2009)
Iyengar, S., Lepper, M.: When choice is demotivating: can one desire too much of a good thing?. J. Pers.Soci. Psychol. 79, 995–1006 (2000)
Jones, N., Pu, P., Chen, L.: How users perceive and appraise personalized recommendations. In: 17th Inter-national Conference on User Modeling, Adaptation, and Personalization Conference, vol. 5535, pp.461–466. Trento, Italy, LNCS (2009)
Kamis, A., Davern, M.J.: Personalizing to product category knowledge: exploring the mediating effect ofshopping tools on decision confidence. In: 37th Annual Hawaii International Conference on SystemSciences. Big Island, HI (2004)
Kaplan, B., Duchon, D.: Combining qualitative and quantitative methods in information systems research:a case study. Mis Q. 12, 571–586 (1988)
Kautz, H., Selman, B., Shah, M.: Referral Web: combining social networks and collaborative filtering.Commun. ACM 40, 63–65 (1997)
Knijnenburg, B.P., Reijmer, N.J.M., Willemsen, M.C.: Each to his own: how different users call for differentinteraction methods in recommender systems. In: 5th ACM Conference on Recommender Systems,pp.141–148. Chicago, IL (2011)
Knijnenburg, B.P., Willemsen, M.C.: Understanding the effect of adaptive preference elicitation methodson user satisfaction of a recommender system. In: Third ACM Conference on Recommender Systems,pp. 381–384. New York, NY (2009)
Knijnenburg, B.P., Willemsen, M.C.: The effect of preference elicitation methods on the user experience ofa recommender system. In: 28th International Conference on Human Factors in Computing Systems,pp. 3457–3462. Atlanta, GA (2010)
123

502 B. P. Knijnenburg et al.
Knijnenburg, B.P., Willemsen, M.C., Kobsa, A.: A pragmatic procedure to support the user-centric eval-uation of recommender systems. In: 5th ACM Conference on Recommender Systems, pp. 321–324.Chicago, IL (2011a)
Knijnenburg, B.P., Meesters, L., Marrow, P., Bouwhuis, D.: User-centric evaluation framework for mul-timedia recommender systems. In: First International Conference on User Centric Media, LNICST,vol. 40, pp. 366–369. Venice, Spain (2010a)
Knijnenburg, B.P., Willemsen, M.C., Hirtbach, S.: Receiving recommendations and providing feedback:The user-experience of a recommender system. In: 11th International Conference on Electronic Com-merce and Web Technologies, LNBIP, vol. 61, pp. 207–216. Bilbao, Spain (2010b)
Kobsa, A. Teltzrow, M.: Contextualized communication of privacy practices and personalization benefits:impacts on users’ data sharing and purchase behavior. In: Workshop on Privacy Enhancing Technol-ogies, LNCS, vol. 3424, pp. 329–343. Toronto, Canada (2005)
Komiak, S.Y.X., Benbasat, I.: The effects of personalization and familiarity on trust and adoption of rec-ommendation agents. Mis Q. 30, 941–960 (2006)
Konstan J.A., Riedl J.: Recommender Systems: From Algorithms to User Experience. User Model. User-Adap. Inter. 22(1–2), 101–123 (2012)
Koren, Y., Bell, R., Volinsky, C.: Matrix factorization techniques for recommender systems. IEEE Com-put. 42, 30–37 (2009)
Koren, Y.: Factor in the neighbors: Scalable and accurate collaborative filtering. Trans. Knowl. Discov.Data 4, 1–24 (2010)
Koufaris, M.: Applying the technology acceptance model and flow theory to online consumer behavior. Inf.Syst. Res. 13, 205–223 (2003)
Kramer, T.: The effect of measurement task transparency on preference construction and evaluations ofpersonalized recommendations. J. Market. Res. 44, 224–233 (2007)
Krishnan, V., Narayanashetty, P., Nathan, M., Davies, R., Konstan, J.: Who predicts better?: Results froman online study comparing humans and an online recommender system. In: 2008 ACM Conferenceon Recommender Systems, pp. 211–218. Lausanne, Switzerland (2008)
Law, E., Roto, V., Hassenzahl, M., Vermeeren, A., Kort, J.: Understanding, scoping and defining user experi-ence: a survey approach. In: 27th International Conference on Human Factors in Computing Systems,pp. 719–728. Boston, MA (2009)
Lynch, J.G. Jr., Ariely, D.: Wine online: search cost and competition on price, quality, and distribution.Market. Sci. 19, 83–103 (2000)
Marrow, P., Hanbidge, R., Rendle, S., Wartena, C., Freudenthaler, C.: MyMedia: producing an extensibleframework for recommendation. In: Networked Electronic Media Summit 2009. Saint-Malo, France(2009)
McNamara, N., Kirakowski, J.: Functionality, usability, and user experience: three areas of concern. ACMInteract. 13, 26–28 (2006)
McNee, S., Albert, I., Cosley, D., Gopalkrishnan, P., Lam, S., Rashid, A., Konstan, J., Riedl, J.: On therecommending of citations for research papers. In: 2002 ACM Conference on Computer SupportedCooperative Work, pp. 116–125. New Orleans, LA (2002)
McNee, S., Riedl, J., Konstan, J.: Being accurate is not enough: how accuracy metrics have hurt rec-ommender systems. In: 24th International Conference Human factors in computing systems, pp.1097–1101. Montréal, Canada (2006a)
McNee, S., Riedl, J., Konstan, J.: Making recommendations better: an analytic model for human-rec-ommender interaction. In: 24th International Conference Human factors in computing systems, pp.1103–1108. Montréal, Canada (2006b)
Meesters, L., Marrow, P., Knijnenburg, B.P., Bouwhuis, D., Glancy, M.: MyMedia Deliverable 1.5 End-userRecommendation Evaluation Metrics (2008) http://www.mymediaproject.org/Publications/WP1/MyMedia_D1.5.pdf
Murray, K., Häubl, G.: Interactive consumer decision aids. In: Wierenga, B. (ed.) Handbook of MarketingDecision Models, pp. 55–77. Springer, Heidelberg (2008)
Murray, K., Häubl, G.: Personalization without interrogation: towards more effective interactions betweenconsumers and feature-based recommendation agents. J. Interact. Market. 23, 138–146 (2009)
Muthen, B.: A general structural equation model with dichotomous, ordered categorical, and continuouslatent variable indicators. Psychometrika 49, 115–132 (1984)
Nelson, P.: Information and consumer behavior. J. Polit. Econ. 78, 311–329 (1970)
123

Experience of recommender systems 503
Netemeyer, R., Bentler, P.: Structural equations modeling and statements regarding causality. J. Consum.Psychol. 10, 83–85 (2001)
Ochi, P., Rao, S., Takayama, L., Nass, C.: Predictors of user perceptions of web recommender sys-tems: how the basis for generating experience and search product recommendations affects userresponses. Int. J. Hum.-Comput. Stud. 68, 472–482 (2010)
Ozok, A.A., Fan, Q., Norcio, A.F.: Design guidelines for e?ective recommender system interfaces basedon a usability criteria conceptual model: results from a college student population. Behav. Inf. Tech-nol. 29, 57–83 (2010)
Paramythis, A., Weibelzahl, S., Masthoff, J.: Layered evaluation of interactive adaptive systems: frameworkand formative methods. User Model. User-Adap. Inter. 20, 383–453 (2010)
Pathak, B., Garfinkel, R., Gopal, R.D., Venkatesan, R., Yin, F.: Empirical analysis of the impact of recom-mender systems on sales. J. Manag. Inf. Syst. 27, 159–188 (2010)
Pedersen, P.: Behavioral effects of using software agents for product and merchant brokering: an experi-mental study of consumer decision-making. Int. J. Electron. Commer. 5, 125–141 (2000)
Pommeranz, A., Broekens, J., Wiggers, P., Brinkman, W.-P., Jonker, C. M.: Designing interfaces for explicitpreference elicitation: a user-centered investigation of preference representation and elicitation pro-cess. User Model. User-Adap. Inter. 22 (2012). doi:10.1007/s11257-011-9116-6
Preece, J., Rogers, Y., Sharp, H.: Interaction Design: Beyond Human-Computer Interaction. Wiley,New York (2002)
Pu, P., Chen, L.: Trust building with explanation interfaces. In: 11th International Conference on IntelligentUser Interfaces, pp. 93–100. Sydney, Australia (2006)
Pu, P., Chen, L.: Trust-inspiring explanation interfaces for recommender systems. Knowl.-Based Syst.20, 542–556 (2007)
Pu, P., Chen, L.: A user-centric evaluation framework of recommender systems. In: ACM RecSys 2010Workshop on User-Centric Evaluation of Recommender Systems and Their Interfaces, pp. 14–21.Barcelona, Spain (2010)
Pu, P., Chen, L., Hu, R.: Evaluating recommender systems from the user’s perspective: survey of the stateof the art. User Model. User-Adap. Inter. 22 (2012). doi:10.1007/s11257-011-9115-7
Pu, P., Chen, L., Kumar, P.: Evaluating product search and recommender systems for E-commerce environ-ments. Electron. Commer. Res. 8, 1–27 (2008)
Rendle, S., Schmidt-Thieme, L.: Online-updating regularized kernel matrix factorization models for large-scale recommender systems. In: 2008 ACM Conference on Recommender systems, pp. 251–258.Lausanne, Switzerland (2008)
Rendle, S., Freudenthaler, C., Gantner, Z., Schmidt-Thieme, L.: BPR: Bayesian personalized ranking fromimplicit feedback. In: Twenty-Fifth Conference on Uncertainty in Artificial Intelligence, pp. 452–461.Montreal, Canada (2009)
Resnick, P., Varian, H.: Recommender systems. Commun. ACM 40, 56–58 (1997)Scheibehenne, B., Greifeneder, R., Todd, P.: Can there ever be too many options? A meta-analytic review
of choice overload. J. Consum. Res. 37, 409–425 (2010)Schwartz, B.: The Paradox of Choice: Why More Is Less. HarperCollins, New York (2004)Senecal, S., Nantel, J.: The influence of online product recommendations on consumers’ online choices.
J. Retail. 80, 159–169 (2004)Sheeran, P.: Intention-behavior relations: a conceptual and empirical review. Eur. Rev. Soc Psychol. 12,
1–36 (2002)Simonson, I., Tversky, A.: Choice in context: tradeoff contrast and extremeness aversion. J. Market.
Res. 29, 281–295 (1992)Spiekermann, S., Grossklags, J., Berendt, B.: E-privacy in 2nd generation E-commerce: privacy prefer-
ences versus actual behavior. In: 3rd ACM Conference on Electronic Commerce, pp. 38–47. Tampa,FL (2001)
Stolze, M., Nart, F.: Well-integrated needs-oriented recommender components regarded as helpful. In:22nd International Conference on Human Factors in Computing Systems, p. 1571. Vienna, Austria(2004)
Tam, K.Y., Ho, S.Y.: Web personalization as a Persuasion strategy: an elaboration likelihood model per-spective. Inf. Syst. Res. 16, 271–291 (2005)
Teltzrow, M., Kobsa, A.: Impacts of user privacy preferences on personalized systems. Hum.-Comput.Interact. Ser. 5, 315–332 (2004)
123

504 B. P. Knijnenburg et al.
Tintarev, N., Masthoff, J.: Evaluating the Effectiveness of Explanations for Recommender Systems. UserModel. User-Adap. Inter. 22 (2012). doi:10.1007/s11257-011-9117-5
Torres, R., McNee, S., Abel, M., Konstan, J., Riedl, J.: Enhancing digital libraries with TechLens+.In: 4th ACM/IEEE-CS Joint Conference on Digital Libraries, pp. 228–236. Tucson, AZ (2004)
Van Velsen, L., VanDer Geest, T., Klaassen, R., Steehouder, M.: User-centered evaluation of adaptive andadaptable systems: a literature review. Knowl. Eng. Rev. 23, 261–281 (2008)
Venkatesh, V., Morris, M., Davis, G., Davis, F.: User acceptance of information technology: toward a unifiedview. Mis Q. 27, 425–478 (2003)
Viappiani, P., Faltings, B., Pu, P.: Preference-based search using example-critiquing with suggestions.J. Artif. Intell. Res. 27, 465–503 (2006)
Viappiani, P., Pu, P., Faltings, B.: Preference-based search with adaptive recommendations. AI Commun.21, 155–175 (2008)
Vijayasarathy, L.R., Jones, J.M.: Do internet shopping aids make a difference? an empirical investiga-tion. Electron. Markets 11, 75–83 (2001)
Wang, W., Benbasat, I.: Recommendation agents for electronic commerce: effects of explanation facilitieson trusting beliefs. J. Manag. Inf. Syst. 23, 217–246 (2007)
Willemsen, M.C., Knijnenburg, B.P., Graus, M.P., Velter-Bremmers, L.C.M., Fu, K.: Using latent featuresdiversification to reduce choice difficulty in recommendation lists. In: RecSys’11 Workshop on HumanDecision Making in Recommender Systems, CEUR-WS, vol. 811, pp. 14–20. Chicago, IL (2011)
Xiao, B., Benbasat, I.: ECommerce product recommendation agents: use, characteristics, and impact.Mis Q. 31, 137–209 (2007)
Yu, J., Ha, I., Choi, M., Rho, J.: Extending the TAM for a t-commerce. Inf. Manag. 42, 965–976 (2005)Ziegler, C., McNee, S., Konstan, J., Lausen, G.: Improving recommendation lists through topic diversifi-
cation. In: 14th international World Wide Web Conference, pp. 22–32. Chiba, Japan (2005)Zins, A., Bauernfeind, U.: Explaining online purchase planning experiences with recommender websites. In:
International Conference on Information and Communication Technologies in Tourism, pp. 137–148.Innsbruck, Austria (2005)
Author Biographies
Bart P. Knijnenburg is a Ph.D. candidate in Informatics at the University of California, Irvine. His workfocuses on the user experience of recommender systems, adaptive preference elicitation methods, andprivacy-aware interfaces for adaptive systems. He received his B.S. degree in Innovation Sciences andhis M.S. degree in Human-Technology Interaction from Eindhoven University of Technology (TU/e),The Netherlands, and his M.A. degree in Human-Computer Interaction from Carnegie Mellon University.The work described in the current paper was conducted while employed as a researcher on the MyMediaproject at TU/e.
Martijn C. Willemsen holds an M.S. in Electrical engineering and in Technology and Society, and a Ph.D.degree in cognitive psychology (decision making) from the TU/e. Since 2002 he is an assistant professorin the HTI group at TU/e. From 2003-2004 he was a visiting PostDoc at Columbia University (New York)to work with Prof. Eric Johnson on online (web-based) process tracing methods. His expertise is in onlineconsumer behavior and decision-making, and in user-centric evaluation. His current research includes theapplication of the psychology of decision making in recommender systems, and on this topic he served asan advisor in the MyMedia project from which the current paper originates.
Zeno Gantner is a researcher at University of Hildesheim’s Information Systems and Machine LearningLab. He received a Dipl.-Inf. degree (Master in computer science) from University of Freiburg, Germany.His research focus is machine-learning techniques for recommender systems. He is the main author of theMyMediaLite recommender algorithm library.
Hakan Soncu is a Software Development Engineer at EMIC. He received his M.S. in Software SystemsEngineering from RWTH Aachen.
Chris Newell is a Lead Technologist at BBC Research and Development. He received his B.A. in Phys-ics and D.Phil. in Engineering from the University of Oxford. His primary interests are user interfacesand the associated metadata in digital broadcasting systems and he has contributed to the DVB, ID3 andTV-Anytime standards.
123