exploring collaboration using motion sensors and multi
TRANSCRIPT

Exploring Collaboration Using Motion Sensors and Multi-
Modal Learning Analytics Joseph M. Reilly
Harvard Graduate School of Education 13 Appian Way
Cambridge, MA 02138 1-412-956-6116
Milan Ravenell Harvard University Massachusetts Hall
Cambridge, MA 02138 1-617-495-1000
Bertrand Schneider Harvard Graduate School of Education
13 Appian Way Cambridge, MA 02138
1-617-496-2094 [email protected]
ABSTRACT
In this paper, we describe the analysis of multimodal data
collected on small collaborative learning groups. In a previous
study [1], we asked pairs (N=84) with no programming
experience to program a robot to solve a series of mazes. The
quality of the dyad’s collaboration was evaluated, and two
interventions were implemented to support collaborative learning.
In the current study, we present the analysis of KinectTM and
speech data gathered on dyads during the programming task. We
first show how certain movements and patterns of gestures
correlate positively with collaboration and learning gains. We
next use clustering algorithms to find prototypical body positions
of participants and relate amount of time spent in certain postures
with learning gains as in Schneider & Blikstein’s work [2].
Finally, we examine measures of proxemics and physical
orientation within the dyads to explore how to detect good
collaboration. We discuss the relevance of these results to
designing and assessing collaborative small group activities and
outline future work related to other collected sensor data.
Keywords
Multi-modal learning analytics, physical synchrony,
computational thinking, collaboration
1. INTRODUCTION Collaboration is increasingly listed as a common factor in many
frameworks of 21st Century Skills that highlight how classrooms
and workplaces will differ from their traditional models due to
deluges of digital data from information and communications
technologies [3]. Likewise, computational thinking has been
deemed an essential set of skills and attitudes that are now central
to all science, technology, engineering, and mathematical (STEM)
disciplines as well as computer science [4]. The ability to rapidly
assess and evaluate collaborative computational thinking tasks can
facilitate instruction that aligns with these important aspects of
modern learning environments.
Multi-modal learning analytics utilizing multiple sensor
technologies and machine learning techniques can offer insights
into student learning in complex, open-ended scenarios such as
computer programming, robotics, and problem-based learning [5].
These methods allow researchers and educators to conduct
quantitative research without necessarily losing the richness of
open-ended, constructionist activities [6]. These techniques are
intended to be scalable and help implement better instruction by
generating formative feedback, visualizing performance, and
increasing the salience of important information for instructors.
This paper focuses on measuring the quality of collaboration by
analyzing participant movement and correlating a variety of
measures with task performance and a coding scheme for
assessing collaboration quality in dyads. We first summarize
relevant literature on collaborative problem solving and the
importance of gesturing in collaboration. Next, we explain the
design and methods of the study where our data originated.
Finally, we report our current findings and describe future work
for our research.
2. LITERATURE REVIEW
2.1 Collaborative Problem Solving Researchers in computer-supported collaborative learning (CSCL)
have long studied how small groups collaborate and co-construct
knowledge [7]. The joint problem space that collaboration entails
requires active social negotiation of the current problem, what can
be done to solve the problem, and the goals of the task [8]. By
studying how collaboration proceeds at a fine-grained level,
researchers can assess the quality of this collaboration and see
what measurable markers denote high quality collaboration.
Examples of such dimensions include synchrony of physical
actions and eye gaze [2, 9], physical reactions of participants to
the actions of others [10], and gestures made during activities
[11].
2.2 Gestures and Movement in Collaboration Emerging literature from multi-modal learning analytics has
explored the roles of gesture, posture, and gross motor movement
in collaborative, co-located activities. For example, facial
expressions and gestures related to the face predict engagement
and frustration, while facial expression and body posture have
been shown to predict learning [12]. Bimanual coordination has
been shown to be predictive expertise, where experts use both
hands in a construction task more equally than novices [13].
Researchers have also been able to predict agreement between
participants with a 75% accuracy using motion sensors and audio
data streams [21]. Automatically detected measures of non-verbal
synchrony (computed from Kinect data) have been found to
predict creativity in dyads [22]. Finally, interactive tabletops have
been a fruitful area of research for studying collaborative learning
Proceedings of the 11th International Conference on Educational Data Mining 333

groups; motion sensors and microphones have been used to
capture students’ interactions and provide feedback to teachers
about the status of the group [23].
Even if meanings of gestures cannot be automatically deduced
from sensor data, the amounts of gesticulation can be calculated
and used to augment analysis of learning [14]. While expert
coders in a qualitative study can extract context-dependent
meaning from a wide variety of gestures [15], quantitative work
can utilize unsupervised machine learning methods to cluster
student postures and movement patterns automatically to gain a
coarse-grained sense of how students are transitioning between
states in an activity and how those state transitions relate to
learning gains and collaboration measures [2].
This paper builds upon this emerging literature to look at
students’ micro-behaviors during their learning process (e.g.,
[20]). More specifically, we explore how unsupervised machine
learning algorithms can find prototypical states from dyads of
students when learning to program a robot.
3. The Study
3.1 Participants Forty-two dyads completed the study (N = 84) and forty groups
were used in the final data set (each researcher’s first session was
removed to improve overall fidelity.) Participants were drawn
from an existing study pool at a university in the northeastern
United States. 62.2% of participants reported being students, with
ages ranging from 19 to 51 years old with a mean age of 26.7
years. 60% of participants identified as female.
3.2 Design & Procedure Employing a two-by-two between-subjects design, dyads were
randomly assigned to one of four conditions: Condition #1
received neither intervention, Condition #2 received solely a
visualization intervention, Condition #3 received solely an
informational intervention, and Condition #4 received both
interventions. The informational intervention was delivered
verbally by the researcher and consisted of several research
findings relevant to collaborative tasks such as equity of speech
time predicting the overall quality of a collaboration. The
visualization intervention utilized speech data from the motion
sensor to visualize the relative proportion of speech coming from
each participant over the prior 30 seconds of the activity. Each
participant was represented by a color on their side of the tablet,
and the screen would fill with more or less of their color to reflect
their contribution (see Figure 1, right).
After signing informed consent paperwork, participants were
fitted with sensors described in 3.4. Participants were shown a
tutorial video illustrating the basics of writing a simple program in
Tinker, a block-based programming language. Participants then
had five minutes to write code to move a simple robot across a
line on the table roughly two feet in front of it. The robot
consisted of a microcontroller, two DC motors with wheels, and
proximity sensors mounted on the front, right, and left (see Figure
1, left).
Following the tutorial activity, dyads were shows a second tutorial
video that highlighted more advanced features of Tinker such as
using provided pre-written functions to turn the robot, checking
the values of the proximity sensors, and using conditional
statements. A hard copy of a reference sheet that summarized the
contents of the video was provided following this. Dyads then had
30 minutes to write code to allow the robot to solve a series of
increasingly complex mazes (see Figure 1, center). Once the
participants’ code successfully guided the robot through a maze
twice, a new maze was provided. During the main portion of the
activity, a series of predetermined hints were given to dyads at 5-
minute intervals regarding common pitfalls researchers identified
in pilot testing.
3.3 Dependent Measures The dyad’s collaboration and task behaviors were evaluated
during the task by the researcher running that session. Quality of
collaboration was assessed on nine scales based on Meier, Spada,
and Rummel’s work [16]: sustaining mutual understanding,
dialogue management, information pooling, reaching consensus,
task division, time management, technical coordination, reciprocal
interaction, and individual task orientation. Task behaviors
evaluated were task performance, task understanding, and
improvement over time. Following the activity, researchers coded
the quality of the final block-based code each dyad produced to
determine how well the code could theoretically guide the robot
through a maze of unknown layout.
To assess learning of computational thinking skills, participants
individually completed a pre- and post-test with four questions
assessing principles of computer science such as using conditional
statements, looping, and predicting the output of given code
(adapted from [17], [18]). Researchers coded the completeness of
answers based on their demonstrations of understanding of
computational thinking principles. Along with the post-test,
Figure 1. Materials used in the study: the robot that participants had to program (left), one example maze (middle) and the
Kinect-based speech visualization (right).
Proceedings of the 11th International Conference on Educational Data Mining 334
participants completed a self-assessment of the perceived quality
of their collaboration with their partner (also adapted from [16]).
Participants also filled out demographic information and
completed a free response reflection regarding how their thinking
changed over time.
3.4 Process Data from Multi-modal Sensors We used three types of sensors during the study: two mobile eye-
trackers captured participants gaze movements at 50Hz; two
Empatica wristbands captured physiological signals (e.g.,
electrodermal activity, heart rate, …) at various rates; and one
Kinect sensor captured body postures and facial information.
Finally, we also used several cameras and microphones to get an
overview of the interaction. The details of the exact sensors used
and the types of data collected are available in [1]. In this paper,
we focus more closely on the Kinect data.
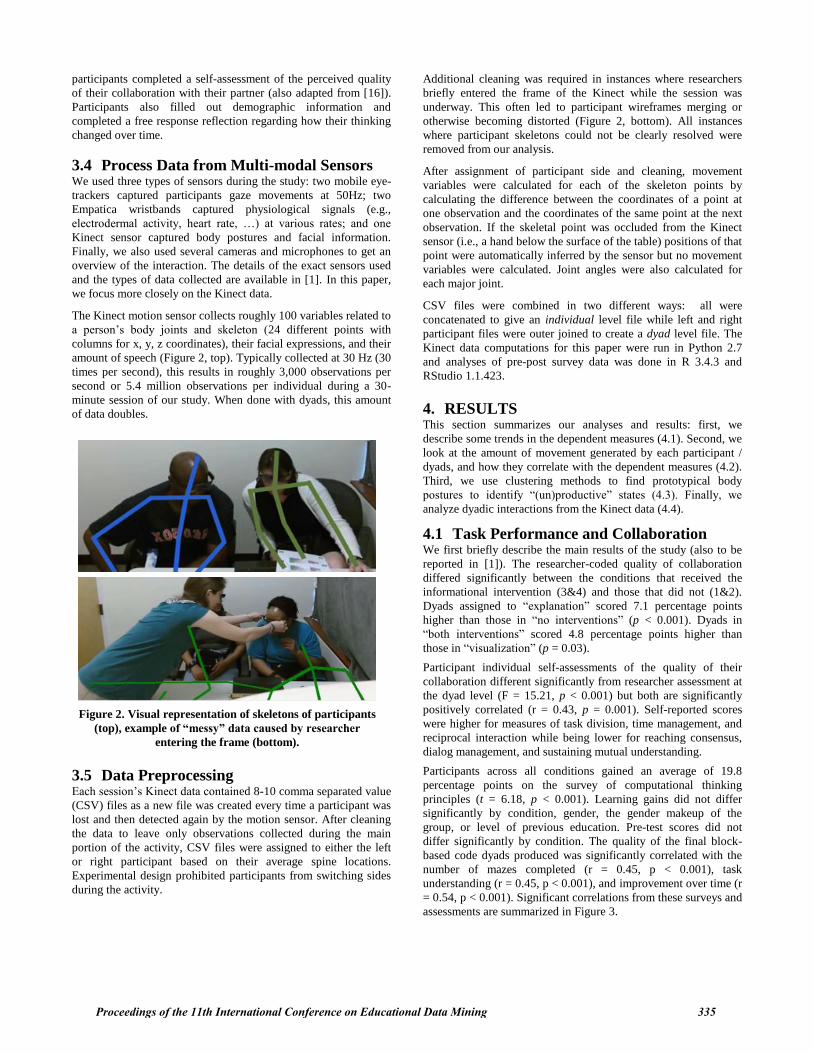
The Kinect motion sensor collects roughly 100 variables related to
a person’s body joints and skeleton (24 different points with
columns for x, y, z coordinates), their facial expressions, and their
amount of speech (Figure 2, top). Typically collected at 30 Hz (30
times per second), this results in roughly 3,000 observations per
second or 5.4 million observations per individual during a 30-
minute session of our study. When done with dyads, this amount
of data doubles.
3.5 Data Preprocessing Each session’s Kinect data contained 8-10 comma separated value
(CSV) files as a new file was created every time a participant was
lost and then detected again by the motion sensor. After cleaning
the data to leave only observations collected during the main
portion of the activity, CSV files were assigned to either the left
or right participant based on their average spine locations.
Experimental design prohibited participants from switching sides
during the activity.
Additional cleaning was required in instances where researchers
briefly entered the frame of the Kinect while the session was
underway. This often led to participant wireframes merging or
otherwise becoming distorted (Figure 2, bottom). All instances
where participant skeletons could not be clearly resolved were
removed from our analysis.
After assignment of participant side and cleaning, movement
variables were calculated for each of the skeleton points by
calculating the difference between the coordinates of a point at
one observation and the coordinates of the same point at the next
observation. If the skeletal point was occluded from the Kinect
sensor (i.e., a hand below the surface of the table) positions of that
point were automatically inferred by the sensor but no movement
variables were calculated. Joint angles were also calculated for
each major joint.
CSV files were combined in two different ways: all were
concatenated to give an individual level file while left and right
participant files were outer joined to create a dyad level file. The
Kinect data computations for this paper were run in Python 2.7
and analyses of pre-post survey data was done in R 3.4.3 and
RStudio 1.1.423.
4. RESULTS This section summarizes our analyses and results: first, we
describe some trends in the dependent measures (4.1). Second, we
look at the amount of movement generated by each participant /
dyads, and how they correlate with the dependent measures (4.2).
Third, we use clustering methods to find prototypical body
postures to identify “(un)productive” states (4.3). Finally, we
analyze dyadic interactions from the Kinect data (4.4).
4.1 Task Performance and Collaboration We first briefly describe the main results of the study (also to be
reported in [1]). The researcher-coded quality of collaboration
differed significantly between the conditions that received the
informational intervention (3&4) and those that did not (1&2).
Dyads assigned to “explanation” scored 7.1 percentage points
higher than those in “no interventions” (p < 0.001). Dyads in
“both interventions” scored 4.8 percentage points higher than
those in “visualization” (p = 0.03).
Participant individual self-assessments of the quality of their
collaboration different significantly from researcher assessment at
the dyad level (F = 15.21, p < 0.001) but both are significantly
positively correlated (r = 0.43, p = 0.001). Self-reported scores
were higher for measures of task division, time management, and
reciprocal interaction while being lower for reaching consensus,
dialog management, and sustaining mutual understanding.
Participants across all conditions gained an average of 19.8
percentage points on the survey of computational thinking
principles (t = 6.18, p < 0.001). Learning gains did not differ
significantly by condition, gender, the gender makeup of the
group, or level of previous education. Pre-test scores did not
differ significantly by condition. The quality of the final block-
based code dyads produced was significantly correlated with the
number of mazes completed (r = 0.45, p < 0.001), task
understanding (r = 0.45, p < 0.001), and improvement over time (r
= 0.54, p < 0.001). Significant correlations from these surveys and
assessments are summarized in Figure 3.
Figure 2. Visual representation of skeletons of participants
(top), example of “messy” data caused by researcher
entering the frame (bottom).
Proceedings of the 11th International Conference on Educational Data Mining 335
4.2 Movement Variables At the individual level, neither the total movement of any specific
joint nor the average movement of those points correlated
significantly with any of our collaboration or task performance
metrics. Amount of time talking was significantly correlated with
total quality of collaboration at the individual level (r = 0.30, p =
0.01) and will be investigated in-depth.
Most of our measures are at the dyad level, so movement variables
were aggregated by session rather than participant. Improvement
over time was significantly correlated with increased movement of
the right elbow (r = 0.47, p = 0.006), right shoulder (r = 0.38, p =
0.029), mid-spine (r = 0.41, p =0.018), and neck (r = 0.38, p =
0.028). Task performance was significantly correlated with right
elbow (r = 0.35, p =0.037), right shoulder (r = 0.35, p = 0.035),
right hand (r = 0.36, p = 0.027), and mid-spine movement (r =
0.40, p = 0.017). Code quality was significantly correlated with
increased movement of the right elbow (r = 0.34, p = 0.025), right
shoulder (r = 0.32, p = 0.032), mid-spine (r = 0.31, p =0.017), and
neck (r = 0.34, p = 0.024). Overall collaboration more strongly
correlated with higher average talk time at the dyad level than the
individual level (r = 0.48, p = 0.0008).
Clustering was done on the movement variables to identify
patterns of movement that may be relevant to our measures of
collaboration and task performance. Due to the unpredictable
nature of missing data due to occluded limbs and joints, the 18
movement variables per observation often had one or two missing
values. Rather than throw out the entire row, we utilized the K-
POD algorithm [19], a variant of k-means clustering that can
handle and impute missing data. We generated 2 through 9
clusters and visually inspected the separation of the different
centroids. We elected to keep three clusters due to good
separation and ease of interpretability.
Groups that spent a higher proportion of their time in the high
movement cluster had significantly higher task performance (r =
0.31, p = 0.049) and improvement over time (r = 0.44, p = 0.009).
Our overall rating of collaboration did not significantly correlate
with time spent in this cluster (p = 0.052) but ratings of reaching
consensus and dialogue management did differ significantly (r =
0.34, p = 0.04; r = 0.40, p = 0.02). Individuals overall spent
roughly 13% of their time in high movement states with the
remainder of their time evenly split between medium and low
movement states.
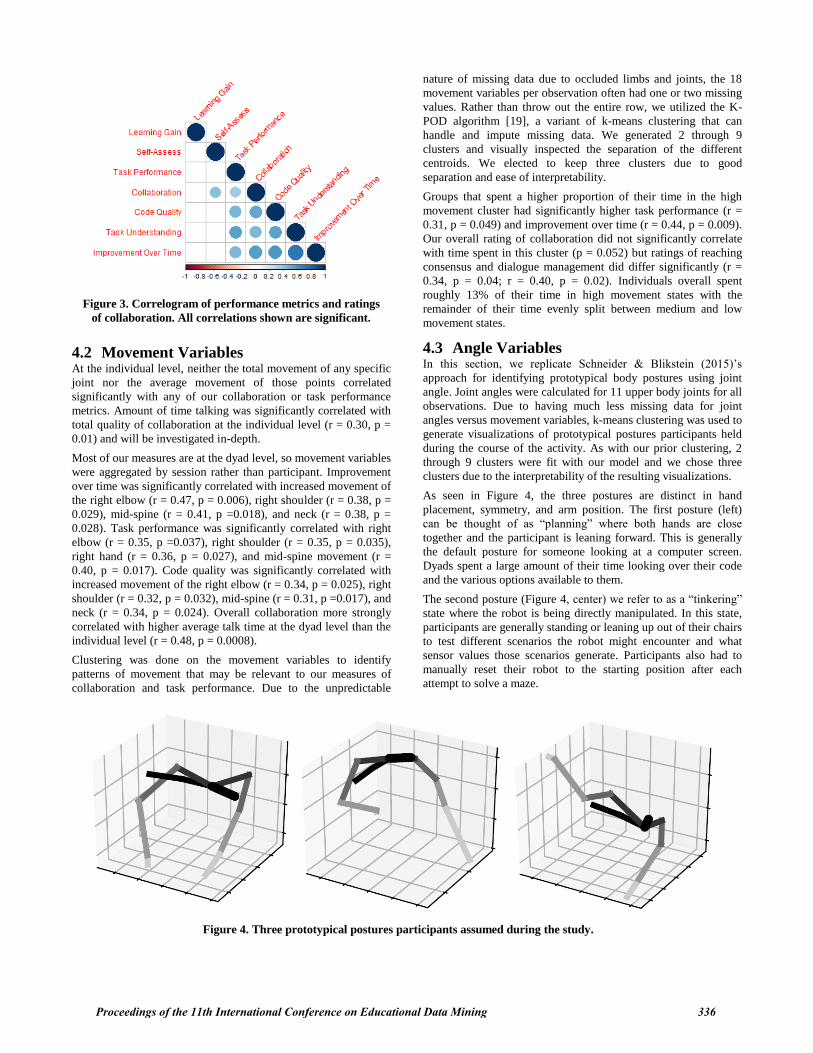
4.3 Angle Variables In this section, we replicate Schneider & Blikstein (2015)’s
approach for identifying prototypical body postures using joint
angle. Joint angles were calculated for 11 upper body joints for all
observations. Due to having much less missing data for joint
angles versus movement variables, k-means clustering was used to
generate visualizations of prototypical postures participants held
during the course of the activity. As with our prior clustering, 2
through 9 clusters were fit with our model and we chose three
clusters due to the interpretability of the resulting visualizations.
As seen in Figure 4, the three postures are distinct in hand
placement, symmetry, and arm position. The first posture (left)
can be thought of as “planning” where both hands are close
together and the participant is leaning forward. This is generally
the default posture for someone looking at a computer screen.
Dyads spent a large amount of their time looking over their code
and the various options available to them.
The second posture (Figure 4, center) we refer to as a “tinkering”
state where the robot is being directly manipulated. In this state,
participants are generally standing or leaning up out of their chairs
to test different scenarios the robot might encounter and what
sensor values those scenarios generate. Participants also had to
manually reset their robot to the starting position after each
attempt to solve a maze.
Figure 3. Correlogram of performance metrics and ratings
of collaboration. All correlations shown are significant.
Figure 4. Three prototypical postures participants assumed during the study.
Proceedings of the 11th International Conference on Educational Data Mining 336

The final state (Figure 4, right) comes from a design decision
made in the study. The small robot was tethered to the participant
laptop via a USB cord for power and to upload new code, so each
time the robot was in motion one participant had to hold the USB
cord high enough to avoid it getting tangled in the maze. The
prototypical posture shows this clearly. We refer to this posture as
“iterating” as it is only observed when running code in an attempt
to solve the maze. Examples of the “planning” and “iterating”
postures can be seen in Figure 5.
As with the movement variables, proportion of time spent in each
posture was aggregated for each participant. Increased proportions
of time spent in the “iterating” posture significantly correlated
with task performance (r = 0.28, p = 0.002), code quality (r =
0.24, p = 0.005), task understanding (r = 0.24, p = 0.02) and
improvement over time (r = 0.20, p = 0.02). Proportion of time
spent in the “tinkering” posture, however, negatively correlated
with the same four metrics: task performance (r = -0.31, p =
0.0004), code quality (r = -0.23, p = 0.008), task understanding (r
= -0.27, p = 0.003) and improvement over time (r = -0.27, p =
0.003).
To analyze the probabilities of state transitions taking place
between these prototypical postures, a Markov model was
constructed to visualize the probabilities of different state
transitions occurring (Figure 6). The size of the circles represents
the relative amount of time spent in each state and the labels of
the arrows indicate the probability of different transitions
occurring. The most likely transitions for the average participant
(Figure 6, center) all involve the “iterating” state, either staying in
it or moving from the other states to it. The least likely transitions
involve moving from “iterating” or “tinkering” back to the
“planning” state.
Markov models for individuals in the highest performing and
lowest performing quartiles (according to their task performance)
were generated to explore how state transitions may vary by
outcome. High performing individuals (Figure 6, top) were 13%
more likely to transition back from “iterating” to “planning” and
38% more likely to transition from “tinkering” to “planning”
versus their low performing peers (Figure 6, bottom). High
performing individuals spent 12% less time in the “tinkering”
state versus low performers, using this time to run more iterations
of their code versus adjusting the robot itself.
4.4 Dyad Interactions A proximity measure was calculated based on spine positions to
determine how closely participants were seated next to each other,
a leaning measure determined if participants were leaning towards
each other or away from each other, a facing measure based on
participant shoulders determined how much participant bodies
Figure 5. Examples of “iterating” posture (holding wire)
and “planning” (seated participant).
High Quartile:
Average Participant:
Low Quartile:
Figure 6. Markov state transition models.
Proceedings of the 11th International Conference on Educational Data Mining 337

were facing each other, and bimanual coordination was calculated
for each participant to see how evenly they used both of their
hands during the activity. While bimanual coordination is
calculated at the individual level, the dyad analysis explores
whether synchrony in bimanual coordination correlates with our
outcome measures.
Performance on the task correlates positively with dyads leaning
towards each other (r = 0.34, p = 0.030). Increased bimanual
coordination of the right participant correlates with task
understanding (r = 0.34, p = 0.018) but synchrony of coordination
does not seem significant. Due to the setup of the room where the
study was conducted, the mouse of the participant laptop was
placed on the right side and may have led the right participant to
use the laptop more. This may have had an uneven influence on
the impact of their bimanual coordination.
Alignment and proximity are strongly correlated (r = 0.83, p <
0.001) in our dyads but neither measure significantly correlates
with our task performance measures. While proximity was not
correlated with our overall measure of collaboration, participants
being closer together is significantly correlated with information
pooling (r = 0.35, p = 0.026).
5. DISCUSSION This paper provides some preliminary and promising results
describing the relationship between students’ body postures /
movements and their quality of collaboration, task performance
and learning gains. We found predictors for those dependent
measures in a naturalistic, open-ended task that routinely takes
place in makerspaces and engineering courses. While there are
limitations to this work, our contribution paves the way to rich
multimodal analyses of students’ collaboration. It also unlocks
new opportunities to design innovative interventions to support
social interactions in small groups (e.g., by providing visual
representations of students’ behavior to support self-reflection)
and classroom orchestration (e.g., by providing teachers with real-
time dashboards of the class).
The significant correlations found between average movement of
points along the upper right side of participants’ bodies with
outcome measures indicates the importance of gesturing and
physical movement when communicating ideas. Qualitative
coding of exemplar videos may detect specific gestures or
movements used more frequently by high performing groups, but
these movement variables offer a quick way to potentially predict
how well participants will do in an activity. While we do not
make any causal claims regarding increasing movement to
increase performance, future interventions could target visualizing
gesture and movement data for dyads as they work instead of
verbal contribution.
The clusters generated by our joint angle data reveal interesting
patterns in participant behavior. While time spent iterating has
been shown here to correlate with better performance, dyads may
benefit from more cycling through the three states to mimic ideal
cycles of cognition [20]. While iterating and testing their code is
certainly important, participants must be able to process what
went wrong and try to fix it before attempting to test their code
again. In several sessions, participants kept running their code
over and over in hopes that the robot would perform better the
next time. Even though they had the code in front of them to
manipulate, some novices may have lacked the computational
thinking knowledge to transfer errors they saw the robot making
to errors in their code.
6. LIMITATIONS We do not have data on the handedness of our participants, but an
open question is whether the mouse placement on the right side of
the shared laptop inadvertently lead the right participant to
assume a leadership role with the laptop. The uneven importance
of bimanual coordination for the right participant is an indication
the physical setup of the room may have impacted the study in
unintended ways. Analyzing the recordings of sessions and
identifying leader behavior or who is assuming driver / passenger
roles is an additional avenue for future work.
Some of our posture results are fairly idiosyncratic to our study
due to the USB cord attached to the robot, making generalization
of findings difficult.
As described in Section 3.5, the Kinect sensor generated a wide
variety of malformed skeletons that led to a lengthy and imprecise
period of manual cleaning prior to analysis. Experimental design
must be conscious of the limitations of the sensors and ensure that
as little noise as possible be added to the data.
7. FUTURE WORK We plan to further identify productive micro-behaviors from the
Kinect data to gain additional insights in the ways that dyads
synchronized their actions. Future work with regards to
prototypical postures would also explore both participants in a
dyad at once, clustering on both joint angles simultaneously. This
may reveal combinations of postures that are informative and
could extend our exploration of physical synchrony within dyads.
The differences between dyads in different conditions will also be
a main focus of analysis moving forward.
It should be noted that this paper only describes one aspect of a
positive collaboration. In future work, we plan to extend this line
of work to attentional alignment (also referred to as joint visual
attention [24]) using the eye-tracking data, verbal coherence [25]
using transcripts, physiological synchronization [26] using the
Empatica data, and ultimately combine those modalities together.
This will provide us with a richer and more comprehensive view
of students’ collaboration and potentially feed machine learning
algorithms to make predictions about the status of a group using
multimodal streams of data.
Future work will also revisit our coding of collaboration to
improve inter-rater reliability (currently Cronbach’s alpha = 0.65,
75% agreement). For our movement clustering, several
correlations with collaboration measures were close to being
significant but may have been hindered due to less-than-ideal
reliability of our initial coding. Additionally, patterns of missing
data in movement variables will be explored more thoroughly and
other clustering algorithms will be tested.
To further explore the importance of cycles of iteration, the
number of times participants ran the code on their robot might be
detected from screencast recordings of the participant laptop. We
do not have log files from Tinker to analyze, but computer vision
algorithms should be able to detect how often the “run” button
was pressed during a session. With the Kinect sensor no longer
being produced, future work may rely solely on video recording
with joints and coordinates determined by computer vision
software rather than sensors. This would aid the scalability of
these techniques by reducing the cost of implementation in
classrooms and other learning environments.
Proceedings of the 11th International Conference on Educational Data Mining 338

8. REFERENCES [1] Starr, E., Reilly, J., and Schneider, B. 2018, June. Using
Multi-Modal Learning Analytics to Support and Measure
Collaboration in Co-Located Dyads. Full paper to be
presented at the International Conference on the Learning
Sciences. London, England.
[2] Schneider, B., and Blikstein, P. 2015. Unraveling students’
interaction around a tangible interface using multimodal
learning analytics. Journal of Educational Data Mining 7, 3,
89-116.
[3] Dede, C. 2010. Comparing frameworks for 21st century
skills. 21st century skills: Rethinking how students learn, 20,
51-76.
[4] Grover, S. and Pea, R. 2013. Computational thinking in K–
12: A review of the state of the field. Educational
Researcher, 42, 1, 38-43.
[5] Blikstein, P. and Worsley, M. 2016. Multimodal Learning
Analytics and Education Data Mining: using computational
technologies to measure complex learning tasks. Journal of
Learning Analytics, 3, 2, 220-238.
[6] Berland, M., Baker, R.S. and Blikstein, P. 2014. Educational
data mining and learning analytics: Applications to
constructionist research. Technology, Knowledge and
Learning, 19, 1-2, 205-220.
[7] Stahl, G., Koschmann, T., and Suthers, D. 2006. Computer-
supported collaborative learning: An historical perspective.
In R. K. Sawyer (Ed.), Cambridge handbook of the learning
sciences, 409-426. Cambridge, UK: Cambridge University
Press.
[8] Roschelle, J. and Teasley, S.D. 1995. The construction of
shared knowledge in collaborative problem solving.
In Computer supported collaborative learning, 69-97.
Springer, Berlin, Heidelberg.
[9] Schneider, B. and Pea, R. 2013. Real-time mutual gaze
perception enhances collaborative learning and collaboration
quality. International Journal of Computer-supported
collaborative learning, 8, 4, 375-397.
[10] Raca, M., Tormey, R. and Dillenbourg, P. 2014, March.
Sleepers' lag-study on motion and attention. In Proceedings
of the Fourth International Conference on Learning
Analytics and Knowledge, 36-43. ACM.
[11] Schlömer, T., Poppinga, B., Henze, N. and Boll, S. 2008,
February. Gesture recognition with a Wii controller.
In Proceedings of the 2nd International Conference on
Tangible and Embedded Interaction, 11-14.
[12] Grafsgaard, J., Wiggins, J., Boyer, K.E., Wiebe, E. and
Lester, J., 2014, July. Predicting learning and affect from
multimodal data streams in task-oriented tutorial dialogue.
In Proceedings of the 7th International Conference on
Educational Data Mining, 122-129.
[13] Worsley, M. and Blikstein, P. 2013. Towards the
Development of Multimodal Action Based Assessment.
Proceedings of the Third International Conference on
Learning Analytics and Knowledge, 94–101. ACM.
[14] Howison, M., Trninic, D., Reinholz, D. and Abrahamson, D.
2011, May. The Mathematical Imagery Trainer: from
embodied interaction to conceptual learning. In Proceedings
of the SIGCHI Conference on Human Factors in Computing
Systems, 1989-1998.
[15] Roth, W.M. 2001. Gestures: Their role in teaching and
learning. Review of Educational Research, 71, 3, 365-392.
[16] Meier, A., Spada, H., and Rummel, N. 2007. A rating
scheme for assessing the quality of computer-supported
collaboration processes. Computer Supported Learning. 2,
63–86.
[17] Brennan, K. and Resnick, M. 2012. New frameworks for
studying and assessing the development of computational
thinking. Presented at the Proceedings of the 2012 annual
meeting of the American Educational Research Association,
Vancouver, Canada.
[18] Weintrop, D. and Wilensky, U. 2015. Using commutative
assessments to compare conceptual understanding in blocks-
based and text-based programs. Presented at the 11th Annual
ACM Conference on International Computing Education
Research. ICER.
[19] Chi, J.T., Chi, E.C. and Baraniuk, R.G. 2016. k-pod: A
method for k-means clustering of missing data. The
American Statistician, 70, 1, 91-99.
[20] Tschan, F. 2002. Ideal cycles of communication (or
cognitions) in triads, dyads, and individuals. Small Group
Research, 33, 6, 615-643.
[21] Ponce-López, V., Escalera, S., & Baró, X. 2013, December.
Multi-modal social signal analysis for predicting agreement
in conversation settings. In Proceedings of the 15th ACM on
International conference on multimodal interaction, 495-502.
ACM.
[22] Won, A. S., Bailenson, J. N., Stathatos, S. C., and Dai, W.
2014. Automatically detected nonverbal behavior predicts
creativity in collaborating dyads. Journal of Nonverbal
Behavior, 38, 3, 389-408.
[23] Martinez-Maldonado, R., Dimitriadis, Y., Martinez-Monés,
A., Kay, J., and Yacef, K. 2013. Capturing and analyzing
verbal and physical collaborative learning interactions at an
enriched interactive tabletop. International Journal of
Computer-Supported Collaborative Learning, 8, 4, 455-485.
[24] Schneider, B., Sharma, K., Cuendet, S., Zufferey, G.,
Dillenbourg, P., and Pea, R. 2016. Detecting collaborative
dynamics using mobile eye-trackers. Presented at the 12th
International Conference of the Learning Sciences,
Singapore: International Society of the Learning Sciences.
[25] Graesser, A. C., McNamara, D. S., Louwerse, M. M., and
Cai, Z. 2004. Coh-Metrix: Analysis of text on cohesion and
language. Behavior Research Methods, Instruments, &
Computers, 36, 2, 193–202.
[26] Pijeira-Díaz, H. J., Drachsler, H., Järvelä, S., & Kirschner, P.
A. (2016). Investigating collaborative learning success with
physiological coupling indices based on electrodermal
activity. Presented at the Proceedings of the sixth
international conference on learning analytics & knowledge,
64–73. ACM.
Proceedings of the 11th International Conference on Educational Data Mining 339