exploring gördes zeolite sites by feature oriented
TRANSCRIPT

Caspian J. Environ. Sci. 2016, Vol. 14 No.4 pp. 285~298
©Copyright by University of Guilan, Printed in I.R. Iran
[Research]
Exploring Gördes zeolite sites by feature oriented principle
component analysis of LANDSAT images
A. Vural*1, O. Corumluoglu2, İ. Asri2
1- Department of Geological Engineering, Gümüşhane University, Faculty of Engineering and Natural Sciences,
Baglarbasi, Gumushane, Turkey.
2- Department of Geomatics, Izmir Katip Celebi University, Cigli, Izmir, Turkey.
* Corresponding author’s E-mail: [email protected]
(Received: June. 30.2016 Accepted: Nov. 27.2016)
ABSTRACT Recent studies showed that remote sensing is an effective, efficient and reliable technique used in almost all the
areas of earth sciences. Remote sensing as being a technique started with aerial photographs and then developed
employing the multi-spectral satellite images. Nowadays, it benefits from hyper-spectral, RADAR and LIDAR data
as well. This potential has widen its applicability in the various areas and professional disciplines much more
efficiently as never been before. One of the areas that remote sensing has been applied well and has become one of
the indispensable tools for the earth science’s scientists are geologic and mineral exploration studies and especially
prospection stages of these studies. In this research, it was tried to determine and to map zeolite sites in Gördes
region (Turkey) which were formed as alteration products having high level of water content and developed in
volcanic rock beds by the help of remote sensing and GIS. The study area is about 400 km2 and located at the North-
East of Manisa Province. The results confirmed that the zeolite areas obtained by classical exploration techniques
can be determined using remote sensing techniques such as feature oriented principal component analysis. Other
zeolite areas in the same scene were also determined or at least predicted by this computer learning process
through the same remote sensing image analyses.
Key words: Zeolite, Feature Oriented Principal Component Analysis, Landsat images, Gordes.
INTRODUCTION
As known, objects reflect, observe and transfer
electromagnetic wavelengths in different
amount reaching to their surfaces due to their
different spatial, structural and surface
conditions with respect to one another.
Contrary to other and classical techniques,
remote sensing as a sole technique which is
used for the determination and discrimination
of natural resources and mapping their
distribution on land without being on the site,
uses generally reflected parts of these
wavelengths by each special object or
phenomenon in interest (Sabins 1999,
Corumluoglu et al. 2015). Except these reflected
Parts of electromagnetic wavelengths sent by
sun to the earth, RS mainly utilizes returned
part of a certain wavelengths in the microwave
region produced followed by sending to RS
sensors themselves and also thermal
wavelengths radiated by objects on the ground
(Drury 2001). These radiations can only be
obtained or acquired by specially designed
sensors mounted on carrying platforms. Data
acquired in such ways were analyzed and
processed in computers and used to produce
maps of timely changes, attributes and
specifications of features on an interested part
of the earth. Remote sensing is a cost effective
technique used in such kinds of applications
286 Exploring Gördes Zeolite Sites…
when it is compared with others, it is also
capable of determination of alteration areas and
structural and lithological features from the
space that they can never be determined while
being on the earth. It then becomes so crucial
data source for such resource areas with no
data and no work done yet. Remote sensing
makes a serious contribution to earth sciences
and especially to geology by developed
algorithms and methods especially for
producing lithology and mineralogy maps, for
determining the effect of natural disasters like
floods, landslides and earthquakes and petrol
leakages, for supporting coastal, change
detection, structural geology and hydrology
studies and exploration studies of mineral
deposits, raw material resources for industry
and energy (Sabins 1999). It is also currently
used in the active fault studies and found as a
useful tool for such studies (Tangestani &
Moore 2001). Movements and some other
specific parameters related to the active faults
in interest can be determined and monitored
very precisely by the help of images and other
data from sensors mounted on satellite
platforms sent to the space. Thus, it is worth to
underline that RS has found wide application
areas in the earth sciences, especially in geology
as long as the new techniques emerge.
The use of remote sensing in mineral and raw
material exploration studies
Remote sensing is exploited for mapping of
geologic structures and faults where these
places show up as the source of mineral
deposits and other raw materials in high
probability. Multi-spectral and now currently
the usage of hyper-spectral images are utilized
to delineate the spectral curve of any specific
mineral and thus to determine rock beds which
are rich in that specific minerals.
Rocks and their minerals have unique reflection
values for each individual electromagnetic
wavelength.
Curve formed by the reflection values of
electromagnetic wavelengths reflected by each
mineral or rock is called as characteristic curve
of that individual mineral or rock (Sabins 1999).
Rocks or minerals interact with the
electromagnetic energy wavelengths in three
ways when electromagnetic radiations in
several wavelengths reach to their surface. So,
they reflect, observe or transfer these
wavelengths in different amounts.
As mentioned above, these reflected parts of
incoming wavelengths delineate the curve and
then characteristic parts of this curve of the
individual mineral or rock help us to make our
decisions on which images of wavelengths
should be chosen for the determination of those
minerals or the raw materials locations on earth
through remote sensing image analysis. The
wall rocks which are host for raw materials and
mineral deposits show final products changing
the chemical structure of the rock and causing
settling down of ore and hydrothermal
minerals in the rock as a result of hydrothermal
fluid interaction with wall rock (Ruiz-Armenta
& Prol-Ledesma 1998). Thus, it is known that all
porphyry types of ore deposits show finely
developed zones and those zones can be
determined confidently by following
concentration diversities of main oxides and
trace elements in the zones. This elemental
composition appears as a change in mineral
composition of alteration zones. Secondary
alterations developed in surface conditions are
almost the main actor of characteristic
yellowish and dark brownish and reddish
colors in the altered rocks.
Those alteration products can easily be
determined by RS.
Before processing remote sensing images,
images are corrected for atmospheric noises by
filtering and for geometrical errors. Following
that corrections, some image enhancement
techniques are applied to improve the visual
quality of images such as contrast stretching,
filtering and color composite techniques. In the
final stage of image processing that can be
called as information extraction stage, the
techniques such as image rationing, principal
component analysis (PCA) and image
classification are applied to the corrected and
enhanced images of remote sensing image
scene.
Vural et al. 287
In mineral exploration studies, various types of
remote sensing images and scenes might be
utilized to fulfill the study oriented
requirements. Landsat scenes are the broadly
used one among them. Since those scenes cover
large areas, they are successful and useful for
the determination and identification of
regionally large objects and structures on earth.
Landsat data for almost 20-30 years have been
used to locate mineral deposits having iron-
oxide and hydroxide origins encountered in the
hydrothermally altered zones of ore deposits
and in the region where arid and semi-arid
climates are dominant (Abrams et al. 1983;
Kaufman 1988; Tangestani & Moore 2001).
Therefore, RS has been used especially for the
determination of hydrothermally altered zones.
It is known that rocky areas and soil appear in
dark gray color in band 7 (2.08 -2.35 μm), since
they absorb the captured wavelengths in the
band.
They also appear as bright areas in band 5 (1.55
-1.75 μm), since they highly reflect the
wavelengths of band 5. Furthermore, soil and
rocks appear more clearly in the ratio images of
these bands. Similarly, 7/1 band ratio image is
preferred for the determination of hydroxide
alteration zones, 5/7 ratio for clay zones and
3/2 ratio for iron-oxide alterations (Sabins 1997,
1999; Drury 2001). Thus, one can easily come to
such a conclusion that 1, 3, 5 & 7 bands of
LANDSAT 7 ETM+ can confidently be
employed in geological studies. It is also known
that RGB 731, RGB 754, RGB 753 & RGB 531
band combination images are very useful for
geologic studies. Especially subset image of the
study area from band 531 (RGB) combination
image gives the best result image showing the
boundary and texture of schist in the region.
Geological features of the study area
The study area covers the part of
approximately 400 km2 which are rich in zeolite
occurrences in volcanics appeared on the land
surface and located at Gördes and its near
vicinity, where it is in the North-East of Manisa
Province (Fig. 1).
When the study area geologically evaluated,
metamorphic rocks belonged to Menderes
massif which consist of gneiss, migmatites,
mica-schist and quartzite, stratigraphically
basement rocks.
Metamorphic rocks are unconformably
overlain by Kürtköy formation which
commonly consists of tufa, large
conglomerates, conglomerate and sandstone.
This unit is overlain by Yeniköy formation
which consists of conglomerate, sandstone and
algal limestone and sandstone containing
lignite and lignite. Çıtak formation consisting
limestone, shale, mudstone, sandstone, tuff and
bituminous shale is situated on Yeniköy
formastion (Göktaş, 1996) & riyolitic Gökyar
tuff & Azimdağ volcanics pass upward
respectively (Ercan 1983). Azimdağı volcanics
are characterized by dasite, riyodasite, and
riyolitic lava domes. On the Azimdağ volcanic,
Tekkedere formation consisting carbonaceous
shale at the bottom and limestone in upper part
is situated. Balçıkdere member consisting of
lacustrine limestone which belongs to Kepez
formation is situated to on Tekkedere
formation.
Alluviums are commonly observed in stream
insides (Figs. 1-2). Depending on diagenesis
and alteration, zeolite minerals occurred in
different levels of volcanics in the area. These
minerals occur under low temperature and
pressure hydrothermal alteration conditions. In
the process, minerals in feldspar mineral
bearing rocks are replaced by zeolite group
minerals. Generally, alkaline extrusive rocks
partly or completely are transformed to zeolite
group minerals. Zeolite group minerals in the
area are clinoptilolite [(Na, K, Ca)2-
3Al3(Al,Si)2Si13O36 ·12H2O.] and heuylandite
[(Ca,Na)2 - 3Al3(Al,Si)2 Si13O36· 12H2O] types
(Vural & Albayrak 2005). Zeolite minerals as
industrial raw materials find several places in
industrial production chains, especially they
are used in the light concrete production
processes, agricultural activities and as
additive to cement. Therefore, it is a raw
material which has a high commercial value.

288 Exploring Gördes Zeolite Sites…
Fig. 1. Geology of the study area.
Fig. 2. Geological colon profile of Gördes and its close vicinity (taken from Göktaş 1996).

Vural et al. 289
Usage of remote sensing techniques for
determination of zeolite group minerals
When checking up the remote sensing studies
on exploration of mineral and raw material
deposits through the literature, it is found that
general usage of satellite images is for the
production of alteration maps using remote
sensing techniques such as band rationing,
supervised and unsupervised classification,
and PCA (Abrams et al. 1983; Kaufman 1988;
Loughlin 1991; Bennett et al. 1993; Tangestani &
Moore 2001; Ranjbar 2002; Aydal et al. 2004,
2006a,b, 2007a,b; Vural et al. 2011, 2012;
Corumluoglu et al. 2015). Among these image
analysis and information extraction techniques,
feature oriented PCA technique suggested by
Crosta & Moore (1989) and called Crosta
technique gives reasonable and fine results).
Feature oriented PCA technique is then chosen
as remote sensing image analysis technique in
order to determine the zeolites which were
developed as alterations of volcanic rocks since
feldspar minerals in volcanic rocks of the study
area turned into zeolite minerals by taking full
amount of water in their structures. Analysis of
eigenvector values in this technique assures the
description of principal components having
high radiometric contribution from the
interested materials appeared in the original
spectral bands and carrying spectral
information of certain minerals. This technique
depends on that the interested material or
mineral appears as dark or bright pixels in the
images of PCA according to the positive and
negative eigenvector loads of these raw
materials or minerals. As feature oriented PCA
technique is one of the important image
enrichment technique, it is confidentially used
for the identification of ore and mineral deposit
areas where are rich in iron and having
hydrothermal alteration zones. When the
technique is applied to images of a Landsat
scene, 6 or 4 bands are used. In the use of 6
bands, the Landsat band images capturing
reflected radiations are exploited except
thermal bands. On the other hand, Crosta &
Moore (1989) suggests a selection of 4 bands
with respect to the strong and distinguishable
appearance of raw material and mineral of
interest in those 4 images (Ruiz-Armenta &
Prol-Ledesma 1998). Since this study focuses on
zeolites, it is crucial to locate hydroxide and
iron-oxide zones. Therefore a set of 4 bands
including bands of 5 and 7 that emphasize
hydroxide and another set of 4 bands including
bands of 1 and 3 emphasizing iron-oxide are
suggested to be chosen. After PCA of these two
sets, principal components from each sets
showing highest opposite loads in + & – signs
and thus a largest eigen value difference with
respect to one another are used to make up final
RGB composite image (Crosta & More 1989;
Loughlin 1991; Tangestani & Moore 2000). To
follow this procedure, two sets with 4 images
were formed from 6 bands out of 8 in the
Landsat scene. The obtained Landsat scene
covering the study area was the Landsat 7
ETM+ scene of path 180 and row 33 acquired
on 20th August 2006. This scene with bands 2, 4,
& 3 assigned to RGB colors respectively can be
seen as subset covering the study area in Fig. 3.
As mentioned above, both image sets include
only 4 images among 6 reflection bands of the
Landsat scene. The first set consists of 1st, 4th, 5th
& 7th bands and the second one with 1st, 3rd, 4th
& 5th bands. Following PCA of these both sets,
statistics and covariance eigenvector values are
generally revised to find out principal
components of both sets that are showing
highest differences between eigen values of
both PCA individually and highest opposite
loads from bands 5 & 7 in the first set and from
bands 1 & 3 in the second set.
After this revision in this study, 4th principal
components from both sets were found as the
most appropriate principal components having
highest eigen-value differences with highest
opposite loads (Tables 1-2).
The second and third bands were not used
intentionally to suppress iron oxide in the first
set consisting of 1st, 4th, 5th & 7th bands.
Thus, PC4 came out as the PC with highest
negative eigenvector load from band 7 and
positive highest load from band 5, as shown in
Table 1.
This PC is the principal component
emphasizing hydroxide and therefore called as

290 Exploring Gördes Zeolite Sites…
“H component”, while hydroxide minerals are
shown as bright pixels after multiplying each
pixel in the PC4 image by -1 (Fig. 4).
Fig. 3. LANDSAT RGB combination scene of bands respectively 2, 4 and 3 (covering sample sites).
Table 1. PC4 of 1st, 4th, 5th and 7th bands as the PC with maximum opposite load from bands 5 and 7 (for
Hydroxide).
BAND 1-4-5-7
PC1 PC2 PC3 PC4
BAND 1 0.43322569 0.60685175 -0.64540360 -0.16583317
BAND 4 0.37486014 0.54516373 0.68702066 0.30046463
BAND 5 0.66248766 -0.40332686 0.21769600 -0.59249134
BAND 7 0.48260281 -0.41455386 -0.25311115 0.72881710
BAND 7-BAND 5 0.17988485 0.01122700 0.47080716 -1.32130845
Table 2. PC4 of 1st, 3th, 4th & 5th bands as the PC with maximum opposite load from bands 1 and 3 (for Ferrite
oxide).
BAND 1-3-4-5
PC1 PC2 PC3 PC4
BAND 1 0.42930710 -0.60221319 -0.19080680 0.64546685
BAND 3 0.52044091 -0.00597796 -0.65663405 -0.54583628
BAND 4 0.36820298 -0.44312847 0.67680263 -0.45825966
BAND 5 0.63973685 0.66403365 0.27269523 0.27465138
BAND 1-BAND 3 0.09113381 0.59623524 -0.46582725 -1.19130313
As in the first set, in the second set consisting of
1st, 3rd, 4th & 5th bands, similar result was also
obtained. Thus, as shown in Table 2, 4th
principal component (PC4) came out as the PC
with highest negative eigenvector load from
band 1, while positive highest load from band
3. This PC is the principal component
emphasizing ferrite-oxide, called as “F
component” and ferrite-oxide minerals are
shown as bright pixels after multiplying each

Vural et al. 291
pixel in the PC4 image by -1 (Fig. 5). On the next
step of the image processing procedure, final
PCA took place. The images put into this final
analysis were those obtained on the previous
step, H & F component images only. After PCA
of these two images, two principal component
images, PC1 & PC2 were derived. Eigenvector
values of PC1 & PC2 were revised to find out
which component gave the highest opposite
load from these two PC4 images. It was PC1
(Fig. 6).
Thus, PC1 produced by this final PCA was
added into an image stack together with these
H & F components to form final RGB composite
image.
It is better to pay attention while forming this
final composite, thus to get a fine visual
interpretation.
So that, -PC4 as H component is suggested to
be assigned to Red color (R) in the false color
composite, -PC4 as F component to Green color
(G) and PC1 from PCA of both PC4 images to
Blue color (B), as shown in Fig. 7.
Fig. 4. Negative PC4 image of 1st, 4th, 5th and 7th bands for Hydroxide (as H component).
Fig. 5. Negative PC4 image of 1st, 3rd, 4th and 5th bands for Ferrite-oxide (as F component).

292 Exploring Gördes Zeolite Sites…
Fig. 6. PC1 from PCA of both PC4 images (H and F components).
Fig. 7. Final false color composite image consisting of -PC4 from PCA of 1st, 4th, 5th and 7th bands (R), -PC4 from
PCA of 1st, 3rd, 4th and 5th bands (G) and PC1 from PCA of both PC4 images (B).
In the present study, a sample data set collected
by Vural & Albayrak (2005) was used for the
verification of zeolite locations found by
feature oriented Principal Component analysis
in the way how Crosta & Moore (1989)
suggested in their study. The sample locations
can be seen in Fig. 7 as well. The sample data
also fit into locations appearing especially as
red colors in the image. Hydroxides show up as
bright red pixels and iron-oxides as bright
green pixels as represented in the Fig. 7. The
Locations overlapping with the sample data
can be grouped as sample sites shown as region
1 within black rectangle in Fig. 7. Two other
regions numbered as 2 & 3 in Fig. 7 were also
found as possible zeolite sites that show the
same spectral attributes with respect to those
sample sites. Therefore, these locations
appeared in red color as sample sites in Fig. 7.
Later field check also confirmed the finding.
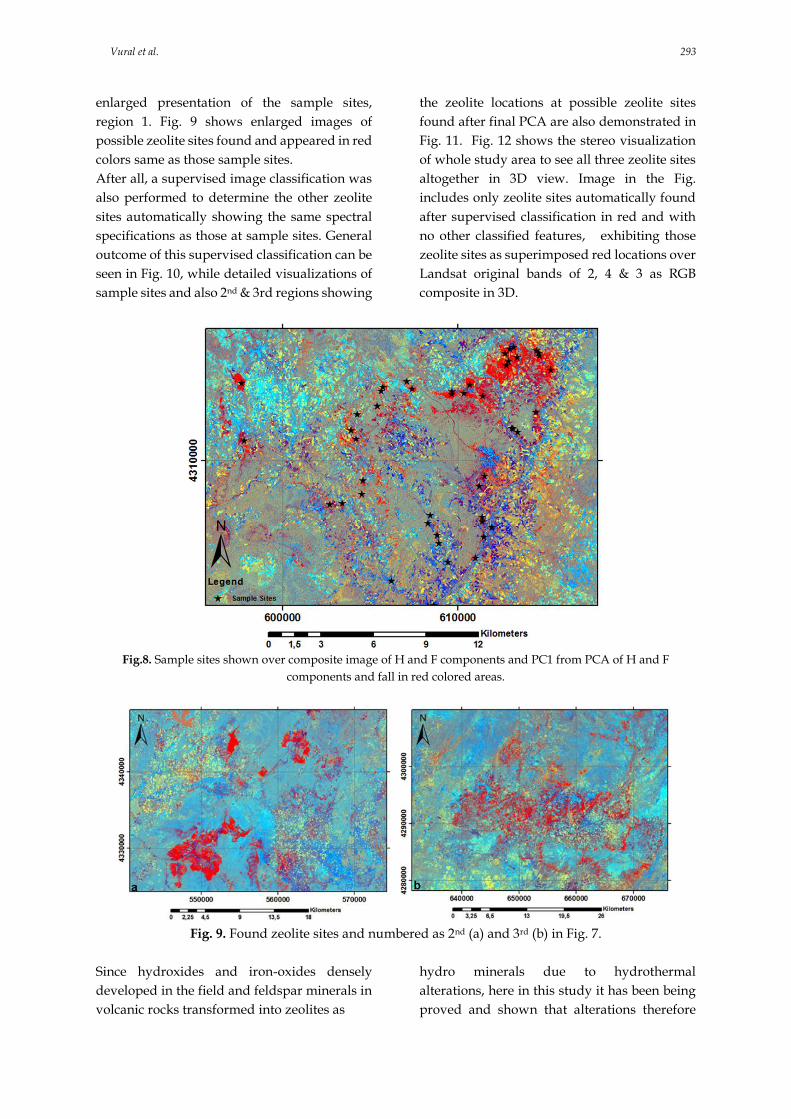
Zeolite sample site fall in red colored locations
in Fig. 7 can clearly be seen in Fig. 8 which is
Vural et al. 293
enlarged presentation of the sample sites,
region 1. Fig. 9 shows enlarged images of
possible zeolite sites found and appeared in red
colors same as those sample sites.
After all, a supervised image classification was
also performed to determine the other zeolite
sites automatically showing the same spectral
specifications as those at sample sites. General
outcome of this supervised classification can be
seen in Fig. 10, while detailed visualizations of
sample sites and also 2nd & 3rd regions showing
the zeolite locations at possible zeolite sites
found after final PCA are also demonstrated in
Fig. 11. Fig. 12 shows the stereo visualization
of whole study area to see all three zeolite sites
altogether in 3D view. Image in the Fig.
includes only zeolite sites automatically found
after supervised classification in red and with
no other classified features, exhibiting those
zeolite sites as superimposed red locations over
Landsat original bands of 2, 4 & 3 as RGB
composite in 3D.
Fig.8. Sample sites shown over composite image of H and F components and PC1 from PCA of H and F
components and fall in red colored areas.
Fig. 9. Found zeolite sites and numbered as 2nd (a) and 3rd (b) in Fig. 7.
Since hydroxides and iron-oxides densely
developed in the field and feldspar minerals in
volcanic rocks transformed into zeolites as
hydro minerals due to hydrothermal
alterations, here in this study it has been being
proved and shown that alterations therefore

294 Exploring Gördes Zeolite Sites…
zeolites are determined apparently well by
using feature of oriented PCA technique on the
remote sensing multi spectral images, followed
by the procedure suggested by Crosta.
Fig. 10. General distribution of zeolites found after supervised classification over final PCA scene.
Fig. 11. Classification results of sample, 2nd and 3rd zeolite sites in detail.

Vural et al. 295
Fig. 12. Stereo visualization of sample and two other zeolite sites found after the classification.
CONCLUSION
Gördes and its near vicinity were chosen as the
study area in this study, since zeolites formed
after hydrothermal alterations which are rich in
iron and hydro minerals are seen densely in the
region. The study is then focused on
determination of zeolite sites in the region by
remote sensing image analysis technique
depending on feature oriented PCA. To reach
this scope, first of all a confirmation data was
obtained. Then, this geologic data collected by
previous field works run in the region was
transferred into digital medium by the help of
CAD and GIS software.
The other data obtained in the field was sample
data from some zeolite locations collected by
Vural & Albayrak and their previous work
carried out in the region (Vural & Albayrak
2005).
The locations of sample data set for zeolite sites
were then compared with the zeolite locations
from remote sensing image analysis run in this
study. According to this comparison, it can be
underlined that sample data obtained using
classical techniques confirmed the zeolite
locations from remote sensing image analysis.
In this concept, remote sensing image analysis
technique was chosen as feature oriented PCA.
PC4s from both PCAs showed up as PCs
having highest opposite loads according to the
outcomes of PCAs run for both LANDSAT
image groups including 1st, 4th, 5th & 7th bands
and also 1st, 3rd, 4th & 5th bands respectively.
Then negative images of these two PC4s & PC1
obtained after PCA of these two PC4s were
composed as a stack image scene to form the
final RGB composite image. Thus, zeolites
developed in the region were successfully
located red and reddish colors in this image
depending on hydro and ferrite minerals on the
land.
REFERENCES
Abrams, MJ, Brown, D, Lepley, L & Sadowski,
R 1983, Remote sensing for porphyry
copper deposits in Southern Arizona.
Economic Geology, 78: 591-604.
Aydal, D, Vural, A & Polat, O 2004, Definition
of the base metal and gold bearing
hydrothermally altered areas in volcanic
rocks using by Landsat 7 TM Imagery:
Case study from Bayramiç (Çanakkale).
57th Geological Congress of Turkey
Abstract Book, March 08-12, Ankara,
Turkey, 89-90.
Aydal, D, Vural, A, Taşdelen-Uslu, İ & ve
Aydal, EG 2006a, Crosta technique
application on Kuşçayırı-Kartaldağı
(Bayramiç-Çanakkale) mineralized area by
using Landsat 7 ETM+ data. 1st Remote
Sensing-GIS Workshop and Panel Book

296 Exploring Gördes Zeolite Sites…
11p. İstanbul Technical University,
İstanbul, November 27-29.
Aydal, D, Vural, A, Taşdelen-Uslu, İ, ve Aydal,
EG 2006b, Crosta technique application on
Bayramic (Alakeçi-Kisacik) mineralized
area by using Landsat 7 TM data. 30th
Anniversary Fikret Kurtman Geology
Symposium. Selçuk University Geology
Engineering Department of Abstracts
Book, p. 195, Konya, September, 20-23.
Aydal, D, Vural, A, Taşdelen-Uslu, İ, & Aydal,
EG 2007a, Crosta technique application on
Bayramic (Alakeçi-Kısacık) mineralized
area by using Landsat 7 Etm+ Data. Journal
of Faculty of Engineering and Architectural of
Selcuk University 22: 29-40.
Aydal, D, Arda, E & Dumanlılar, Ö 2007b,
Applications of Crosta Techniques on
alteration mapping of the granitoidic rocks
using Landsat ETM+ 7: A case study in
eastern taurite belt, SE Turkey.
International Journal of Remote Sensing, 28:
3895-3913.
Bennet, SA, Atkinson, WW & Kruse, FA 1993,
Use of thematic mapper imagery to
identify mineralization in the Santa Teresa
district, Sonara, Mexico. International
Geology Review 35: 1009-1029.
Crosta, A & Moore, JMcM 1989, Enhancement
of landsat thematic mapper imagery for
residual soil mapping in SW Minais Gerais
State, Brazil: a prospecting case history in
Greenstone belt terrain. In: Proceeding of
the 7th ERIM Thematic Conference: Remote
sensing for exploration geology, Calgary,
October 2-6, 1173-1187.
Drury, SA 2001, Image Interpretation in Geology,
3th ed., Blackwell Science Inc. (USA),
Nelson Thornes (UK), 304 p.
Ercan, T 1983, Petrology and genetic
interpretation of Gördes volcanics
(Manisa). Türkiye Jeoloji Kurumu Bülteni 26:
41 -48.
Göktaş, F 1996, Geology of Gördes Neogene
Basin. MTA Report No: 9931. Ankara,
Turkey, 140 p.
Kaufman, H 1988, Mineral exploration along
the Agaba-Levant structure by use of TM-
data concepts, processing and results.
International Journal of Remote Sensing, 9:
1630-1658.
Loughlin, WP 1991, Principal component
analysis for alteration mapping.
Photogrammetric Engineering and Remote
Sensing, 57: 1163-1169.
Ranjbar, H, Honarmand, M & Moezifar, Z 2002,
Application of the Crosta technique for
porphyry copper alteration mapping,
using ETM+ data: A case study of Meiduk
and Sar Cheshmeh areas, Kerman, Iran.
Exploration and Mining Geology, 11: 43 -48.
Ruiz-Armenta, JR & Prol-Ledesma, RM 1998,
Techniques for enhancing the spectral
response of hydrothermal alteration
minerals in Thematic Mapper images of
Central Mexico. International Journal of
Remote Sensing, 19: 1981-2000.
Sabins, FF, Sabins, FFJr 1997, Remote sensing –
principles and interpretation, 3rd ed., WH
Freeman New York, 494 p.
Sabins, FF 1999, Remote sensing for mineral
exploration. Ore Geology Reviews, 14: 157-
183.
Tangestani, MH & Moore, F 2000, Iron oxide
and hydroxyl enhancement using the
Crosta method: A case study from the
Zagros belt, Fars Province, Iran.
Communication, JAG, 2: 140-146.
Tangestani, MH & Moore, F 2001, Comparison
of three principal component analysis
techniques to porphyry copper alteration
mapping. A case study, Meiduk area,
Kerman, Iran. Canadian Journal of Remote
Sensing, 27: 176-182.
Vural, A & Albayrak, M 2005, Mineralogy of
Zeolites around Gördes. 58th Geological
Congress of Turkey Abstracts Book, 140-
141. Ankara, April 11-14.
Vural, A, Çorumluoğlu, Ö & Asri, İ 2011,
Investigation of lithological differences
and alterations of Gümüşhane (Hazine
Cave-Deremadeni) by remote sensing
techniques. Turkey National
Photogrammetry and Remote Sensing
Association (TUFUAB) VIth Technical

Vural et al. 297
Symposium, Antalya, Turkey, February
23-26.
Vural, A, Çorumluoğlu, Ö & Asri, İ 2012,
Determination of alteration in old
Gümüşhane (Süleymaniye) by crosta
technique using Landsat images.
Gümüşhane Üniversitesi Fen Bilimleri
Enstitüsü Dergisi, 2: 36-48.
298 Exploring Gördes Zeolite Sites…
های اصلی متمایل به وضعیت مربوط به های زئولیتی گوردس با استفاده از آنالیز مولفهکشف مکان
Landsatتصاویر
2سریآ، آی. 2لواوغ ، او. کوروملو *1الف. وورال
گروه مهندسی زمین شناسی، دانشکده علوم مهندسی و منابع طبیعی، دانشگاه گوموشین، باگلارباسی، گوموشین، ترکیه -1
گروه محاسبات زمین شناسی، دانشگاه کاتیپ سلبی ازمیر، سیلگی، ازمیر، ترکیه -2
( 10/15/59: تاریخ پذیرش 11/14/59: تاریخ دریافت)
چکیده
مطالعات اخیر نشان داده است که سنجش از دور روشی موثر، کارآمد و قابل اطمینان برای استفاده در تقریباً همه علوم مربوط
های هوایی شروع شد و سپس با به کارگیری تصاویر ابتدا با عکس ،به کره زمین است. سنجش از دور به عنوان یک روش
کند. نیز استفاده می LIDARو RADARای چندطیفی توسعه پیدا کرد. امروزه این روش از دیتاهای چندطیفی، ماهواره
فاده ای به طور موثری استهای حرفههای دیگر نیز گسترش داده و از دیسیپلیناین توان بالقوه، قابلیت استعمال آن را به عرصه
ها که در آن سنجش از دور به خوبی مورد استفاده قرار گرفته است، به یکی یکی از این عرصهکرده که تاکنون امکانپذیر نبود.
شناسی است. در مطالعه حاضر تلاش شد تا شناسی و معدناز مراحل ضروری این مطالعات تبدیل شده، مطالعات اکتشاف زمین
تعیین کنیم. این نواحی از مواد متغیری شکل GISهای زئولیت را در نواحی گوردس )ترکیه( توسط سنجش از دور و مکان
کیلومتر 411ای آتشفشانی توسعه یافته است. مساحت این نواحی گرفته است که مقادیر زیادی آب دارد و از بسترهای صخره
یک سهای کلامربع است و در شمال شرقی استان مانیسا قرار گرفته است. نتایج نشان داد که نواحی زئولیتی را که با روش
تعیین کرد. نواحی (PCA)یا Feature Orientedهای اصلی توان با استفاده از آنالیز مولفهاند، میاکتشاف به دست آمده
ای از طریق همین آنالیزهای تصاویر سنجش از دور توان با این فرآیند آموزشی رایانهدیگر زئولیتی در همین عرصه را نیز می
.تعیین یا حداقل پیش بینی کرد
مولف مسئول *