exploring lean implementation success factors in job shop, batch shop, and assembly line
TRANSCRIPT

Eastern Michigan UniversityDigitalCommons@EMU
Master's Theses and Doctoral Dissertations Master's Theses, and Doctoral Dissertations, andGraduate Capstone Projects
3-15-2013
Exploring lean implementation success factors injob shop, batch shop, and assembly linemanufacturing settingsDaniela Todorova
Follow this and additional works at: http://commons.emich.edu/theses
Part of the Operations Research, Systems Engineering and Industrial Engineering Commons
This Open Access Dissertation is brought to you for free and open access by the Master's Theses, and Doctoral Dissertations, and Graduate CapstoneProjects at DigitalCommons@EMU. It has been accepted for inclusion in Master's Theses and Doctoral Dissertations by an authorized administrator ofDigitalCommons@EMU. For more information, please contact [email protected].
Recommended CitationTodorova, Daniela, "Exploring lean implementation success factors in job shop, batch shop, and assembly line manufacturing settings"(2013). Master's Theses and Doctoral Dissertations. 481.http://commons.emich.edu/theses/481

Exploring Lean Implementation Success Factors in
Job Shop, Batch Shop, and Assembly Line Manufacturing Settings
by
Daniela Todorova
Dissertation
Submitted to the College of Technology
Eastern Michigan University
in partial fulfillment of the requirements for the degree of
DOCTOR OF PHILOSOPHY IN TECHNOLOGY
Concentration in Engineering Management
Dissertation Committee:
Dr. Dugger, Ph. D, Dissertation chair
Dr. Haddad, Ph.D
Dr. Bellamy, Ph.D
Dr. Fields, Ph.D
Dr. Dobrzykowski, Ph.D
March 15, 2013
Ypsilanti, Michigan

ii
Abstract
This study was motivated by the differences in manufacturing settings, which provide
challenges for those organizations undertaking a lean implementation. The levels of applicability
of sixteen lean tools were examined in three different manufacturing settings: a job shop, a batch
shop, and an assembly line. Specifically, this study explored the perceptions of managers
familiar with lean regarding which lean tools were associated with better operational
performance. The level of satisfaction with the lean programs in each of the three manufacturing
settings was explored as well. The data were collected through a survey that was emailed to one
thousand managers working in manufacturing companies located in the US.
The results revealed that different lean tools are used at different levels in the three
manufacturing settings, and the lean tools contributing most to the group differences were
Heijunka (HEIJ), Just in Time (JIT) and Kaizen (KAIZ). The analysis revealed statistically
significant positive relationships between the perceived operational performance of firms in job
shop and batch shop settings and the implementation of Workers Involvement (WINV) and Muda
Elimination (MUDA) lean tools. Assembly line settings had statistically significant positive
relationships with the implementation of Standardized Work (STANDW) and Value Stream
Mapping (VSM). The results highlighted the importance of Workers Involvement (WINV),
which is consistent with prior work.
The managers’ satisfaction with the lean program was most associated with the
implementation of Heijunka (HEIJ) in a job shop setting, Workers Involvement (WINV) in a
batch shop setting, and Continuous Flow (CONTFL) in an assembly line setting. This study
presents a decision-making model which can be helpful in the successful implementation of the

iii
lean paradigm in each of the three manufacturing settings. A number of recommendations for
future research are proposed.

iv
Dedication
To my daughter, Iva; son, Tsvetoslav; husband, Ivo;
and parents, Vera and Ivan,
for their understanding
and support.

v
ACKNOWLEDGEMENTS
I would like to express my sincere gratitude to Dr. Dugger, chair of my dissertation
committee, and to Dr. Dobrzykowski, member of my dissertation committee, for their support,
guidance, encouragement, and valuable input throughout the dissertation process. I would also
like to thank the other dissertation committee members: Dr. Fields, Dr. Bellamy, and Dr. Haddad
for their valuable advice, support, and feedback throughout this process.
I am grateful to all faculty members at the College of Technology who taught me during
the PhD program. Gratitude is extended to the judges in the Q-sort pilot testing, for their time
and effort to provide assistance and expert advice during the instrument development. I am also
grateful to Dennis Holmquist for his help with the data collection and to all lean professionals
who took my survey and made this study possible.
vi
TABLE OF CONTENTS
Abstract ........................................................................................................................................... ii
Dedication ...................................................................................................................................... iv
Acknowledgements ......................................................................................................................... v
List of Tables .................................................................................................................................. x
List of Figures .............................................................................................................................. xiii
Chapter 1: Introduction and Background ........................................................................................ 1
Statement of the Problem ............................................................................................................ 2
Elements of a Lean Implementation............................................................................................ 2
Barriers to Success ...................................................................................................................... 5
Rationale for the Study ................................................................................................................ 6
Purposes of the Research............................................................................................................. 9
Research Questions ................................................................................................................... 10
Research hypothesis .............................................................................................................. 11
Delimitations and Limitations ................................................................................................... 11
Assumptions .............................................................................................................................. 12
Definition of Terms ................................................................................................................... 12
Summary ................................................................................................................................... 13
Chapter 2: Review of the Literature .............................................................................................. 14
Lean Manufacturing .................................................................................................................. 14
Implementing lean ................................................................................................................. 16
Sustaining lean ....................................................................................................................... 19

vii
Benefits of lean ...................................................................................................................... 20
Need for lean ......................................................................................................................... 22
Applicability of lean to different businesses ......................................................................... 23
Lean measures ....................................................................................................................... 24
Lean tool and construct definitions ....................................................................................... 25
Production Processes ................................................................................................................. 37
Job shop ................................................................................................................................. 39
Batch shop ............................................................................................................................. 40
Assembly line ........................................................................................................................ 42
Universality of Lean Depends on Different Contextual Factors ............................................... 42
Contingency Theory .................................................................................................................. 43
Appropriate Alignment ............................................................................................................. 45
Summary ................................................................................................................................... 46
Chapter 3: Methods ....................................................................................................................... 47
Research Methods ..................................................................................................................... 47
Population and Sample .............................................................................................................. 48
Instrument Development ........................................................................................................... 49
Concept identification ............................................................................................................ 49
Items construction.................................................................................................................. 50
Q-sort pilot testing ................................................................................................................. 52
Validity .................................................................................................................................. 53
Reliability .............................................................................................................................. 55

viii
Human Subjects Approval ........................................................................................................ 55
Data Collection .......................................................................................................................... 56
Data Analysis ............................................................................................................................ 56
Summary ................................................................................................................................... 62
Chapter 4: Results ......................................................................................................................... 63
Q Sort Results............................................................................................................................ 63
Response Rate ........................................................................................................................... 64
Results of Demographic ............................................................................................................ 65
Instrument Validation ................................................................................................................ 69
Discriminant Validity ................................................................................................................ 78
Descriptive Statistics ................................................................................................................. 82
Testing Hypotheses One............................................................................................................ 84
Step 1: Evaluate group differences on a multivariate profile. ............................................... 85
Step 2: Research design and sample size .............................................................................. 90
Step 3: Assumptions of discriminant analysis. ...................................................................... 91
Step 4: Estimation of the discriminant model, assessing overall fit and interpretation of the
results. .................................................................................................................................... 91
Testing Hypothesis Two and Three .......................................................................................... 98
PLS and moderating effect .................................................................................................... 98
Step 1: Determine the significance of moderating effects. .................................................... 99
Step 2: Determining the Strength of Moderating Effects .................................................... 103
Chapter Summary .................................................................................................................. 114

ix
Chapter 5: Discussion, Conclusions, and Implications ............................................................... 115
Discussion of Findings and Conclusions ................................................................................ 115
Implications ............................................................................................................................. 124
Limitations and Future Research............................................................................................. 127
References ................................................................................................................................... 129
Appendices .................................................................................................................................. 151
Appendix A: Items entering the first round of Q sorting ............................................................ 152
Appendix B: Q-sort Results ........................................................................................................ 155
Appendix C: Online Survey Instrument Used to Collect Data ................................................... 159
Appendix D: Human Subject Approval ...................................................................................... 168
Appendix E: PLS Cross Loadings .............................................................................................. 169

x
LIST OF TABLES
1 Toyota’s 14 Principles ........................................................................................................... 3
2 Lean Success Factors ............................................................................................................. 4
3 Lean Benefits ....................................................................................................................... 21
4 Construct Definitions ........................................................................................................... 36
5 Framework of the Instrument............................................................................................... 51
6 Expected Level of Application of the Lean Tools ............................................................... 58
7 Inter judges’ Agreement ...................................................................................................... 64
8 Response Rate Summary ..................................................................................................... 64
9 Usable Surveys..................................................................................................................... 65
10 Job Titles of Respondents .................................................................................................... 66
11 Lean Expertise of Respondents ............................................................................................ 66
12 Number of Employees ......................................................................................................... 67
13 Processes .............................................................................................................................. 67
14 Level of Lean Implementation of Respondents’ Companies ............................................... 68
15 Number of Years of Lean Implementation .......................................................................... 68
16 KMO and Bartlett’s Test ...................................................................................................... 69
17 Factor Loading ..................................................................................................................... 71
18 Outer Loading Coefficient ................................................................................................... 73
19 Convergent Validity ............................................................................................................. 75
20 Discriminant Validity........................................................................................................... 80
21 Cronbach Alfa Coefficient and Composite Reliability ........................................................ 81

xi
22 Central Tendency of the Utilization of the Lean Tools ....................................................... 84
23 Means of Utilization of Sixteen Lean Tools in JS, BS and AL ........................................... 86
24 Tests of Equality of Group Means ....................................................................................... 88
25 Differences in Means between Job Shop, Batch Shop, and Assembly Line (Multiple Range
Test) .............................................................................................................................................. 89
26 Variables Entered/Removed ................................................................................................ 92
27 Wilks’ Lambda..................................................................................................................... 93
28 Eigenvalues of Functions 1 and 2 ........................................................................................ 93
29 Wilks’ Lambda of Functions 1 and 2 ................................................................................... 93
30 Discriminant Function Coefficients ..................................................................................... 94
31 Functions at Group Centroids .............................................................................................. 95
32 Prior Probabilities for Groups .............................................................................................. 95
33 Classification Results ........................................................................................................... 96
34 Perceived Operational Performance, Path Coefficient, and T-Statistic. ............................ 100
35 Satisfaction with the Lean Program, Path Coefficient, and T-Statistic. ............................ 102
36 Moderating Effect d, for Perceived Operational Performance .......................................... 105
37 Moderating Effect, Satisfaction with the Lean Program ................................................... 107
38 Moderating Effect of Manufacturing Category on Perceived Operational Performance .. 109
39 Moderating Effect of Manufacturing Category on Ssatisfaction with the Lean Program . 110
40 Job Shop Perceived Operational Performance ................................................................... 119
41 Batch Shop Perceived Operational Performance. .............................................................. 120
42 Assembly Line Perceived Operational Performance. ........................................................ 121
43 Job Shop Managers’ Satisfaction with the Lean Program ................................................. 122

xii
44 Batch Shop Managers’ Satisfaction with the Lean Program ............................................. 123
45 Assembly Line Managers’ Satisfaction with the Lean Program ....................................... 124

xiii
LIST OF FIGURES
1 Theoretical Model .................................................................................................................. 10
2 Toyota Production System house........................................................................................... 15
3 The product-process matrix ................................................................................................... 38
4 Research phases ..................................................................................................................... 48
5 Rader/Spider Plot ................................................................................................................... 61
6 Means of utilization of sixteen lean tools in JS, BS, and AL. ............................................... 86
7 Territorial Map ....................................................................................................................... 97
8 Detecting a moderating effect (d) through group comparisons ........................................... 104

Chapter 1: Introduction and Background
Lean production is applicable in a variety of business contexts (Hong et al., 2010). The
goal of lean was defined by Kim et al. (2006, p. 195) as “….transforming waste into value from
the customer’s perspective” and by Shah and Ward (2007) as eliminating waste by reducing
variability of supply, processing time, and demand. The lean approach is “…a principle-based
system of management whose objective is to change the way all work activities are performed,
not just those in operations” (Emiliani & Stec, 2005, p. 384). However, the benefits of
implementing lean may vary based on an individual organization’s settings and goals
(Mackelprang & Nair, 2010). Many companies are willing to implement lean manufacturing
because of the improved competitive advantage, but creating a lean success trajectory is a
difficult process because of the uniqueness of each lean implementation (Lewis, 2000).
“Only 2 percent of companies who began a lean transformation have fully achieved their
objectives” (Pay, 2008, p. 1).
The lean tools, supporting lean implementations, are Just in Time, Continuous Flow,
Heijunka, Quick Set Up, Jidoka, Poke-Yoke, Andon, Standardized Work, the Five S’s, Total
Productive Maintenance, Visual Management, Kaizen, Multifunctional Teams, Workers
Involvement, Value Stream Mapping, and Muda elimination (Dennis, 2007; Detty & Yingling,
2000; Fang & Kleiner, 2003; Fullerton & Watters 2001; Fullerton et al., 2003; Faizul & Lamb,
1996; Miltenburg, 2007; Liker, 2004; Veech, 2001).
Hayes and Wheelwright (1984) introduced four types of manufacturing settings: job
shop, batch shop, assembly line, and continuous flow, each one with different characteristics.
Hayes and Wheelwright (1984) felt that such a classification system would be useful in
determining which process is the most appropriate for each product life cycle.

2
Statement of the Problem
Although a number of lean tools have been identified and generally accepted, these tools
have not been sufficiently examined regarding their level of use in the various categories of
manufacturing settings as identified by Hayes and Wheelwright (1984).
Elements of a Lean Implementation
Lean should be viewed more as a philosophy or condition than as a process (Bhasin &
Burcher, 2004). A successful lean implementation requires dramatic changes at all organizational
levels and departments involving work organization and culture (Sohal, 1996). Moreover, the
firm who implements a lean approach will need a decision making system based on bottom up
measures, quality reports and vendors reliability and adapted control system by “... linking
compensation rewards to quality results” (Fullerton & McWatters, 2002, p. 730). Lean has to be
seen as a direction, not as a reached after certain time state (Karlsson & Ahlstrom1996). In Lean
Thinking, Womack and Jones (1996) identified five lean principles essential for successful lean
implementation: (a) specify value, (b) identify the value stream, (c) flow, (d) pull, (e) perfection.
In addition, Liker (2004, pp. 37-40) proposed the 14 Toyota principles listed in Table 1.

3
Table 1
Toyota’s 14 Principles
Sections Principles
1 Long-term philosophy 1 Base your management decision on a long term
philosophy (Customer is the starting point)
2 The right process will
produce the right results
2 Continuous Flow
3 Pull
4 Level out the work load (Heijunka)
5 Get quality right the first time (Jidoka)
6 Standardized task
7 Visual control
8 Reliable Equipment
3 Add value to the
organization by developing
your people and partners
9 Grow leaders from within
10 Develop exceptional people
11 Respect your partners and help them improve
4 Continuously solving root
problems drive
organizational learning
12 Go and see for yourself
13 Make decision slowly considering all options
14 Become learning organization through reflection
and Kaizen
Lean principles are defined by Womack and Jones (1996) and Liker (2004) as the basis
for a successful lean implementation. Shah et al. (2008) wrote that lean principles reflect the
flow and standardization and are crucial for the competitive advantage of a manufacturing firm.
Since the heart of the Toyota production system is elimination of the wastes at all levels
(Liker, 2004; Dennis, 2007; Womack & Jones, 1996; Bhasin & Burcher, 2006), it is important to
categorize the types of waste. Liker (2004) identified three types of waste: Muda, Muri, and
Mura. Muda is defined as non-value adding operations. Muri and Mura are defined as
overburden (of people and equipment) and unevenness respectively. The eight non value-adding
operations of Muda are (a) correction/scrap, (b) over-production; (c) waiting; (d) conveyance; (e)
processing; (f) inventory; (g) motion (Dennis, 2007; Womack & Jones, 1996; Liker, 2004); and
(h) unused employees’ creativities (Liker, 2004).

4
Several research efforts (Liker, 2004; Dennis, 2007; Womack & Jones, 1996) have
addressed these eight wastes, but little attention has been paid to Muri—overburden of people
and equipment—or Mura—unevenness (Liker, 2004). Lean is about the elimination of all three
types of waste—Muda, Muri and Mura—not only the eight known wastes of Muda (Dennis,
2007; Liker, 2004).
The success of a lean implementation in an organization depends on the human element
(Sawhney & Chason, 2005). Continuous improvement and respect for people are the two key
principles of the Toyota production system (Emiliani & Stec, 2005), while the employees are the
heart (Dennis, 2007). “The root of the Toyota way is encouraging people continuously to
improve the process they work on. …It is the people who bring the system to life and make it
work” (Liker 2004, p. 36). Recent research efforts listed in Table 2 have identified a few
essentials that contribute to lean success.
Table 2
Lean Success Factors
Lean Success Factors Literature
Leadership commitment Achanga et al., 2006; Dickson et al., 2009;
Scherrer-Rathje et al., 2009; Emiliani and Stec,
2005
Local culture Achanga et al., 2006; Dickson et al., 2009;
Emiliani and Stec, 2005
Skills and expertise Achanga et al., 2006
Workforce’s flexibility to change Dickson et al., 2009
Autonomy Scherrer-Rathje et al. 2009; Emiliani and Stec,
2005
Long-term lean goals Scherrer-Rathje et al. 2009; Emiliani and Stec,
2005

5
To convert an organization into a lean learning organization, the right combination of a
long-term philosophy, processes, people, and problem solving is needed (Liker, 2004). Lean is
about changing corporate culture and reducing waste at all levels (Bhasin & Burcher, 2006).
Barriers to Success
According to Pay (2008), “Only 2 percent of companies who began a lean transformation
have fully achieved their objectives and only 24 percent of these companies reported achieving
significant results. That leaves 74 percent of the responding companies admitting that they are
not making good progress with lean” (p. 1).
Dickson et al. (2009) reported that reasons for the failure of a lean implementation
include (a) lean is not implemented properly or (b) the social context is not taken into account.
In addition, the “bottom-up” approach to a lean implementation produces a cascading effect of
problems such as “lack of senior management commitment, lack of team autonomy, and lack of
organizational communication of, and interest in, lean” (Scherrer-Rathje, 2009, p. 81) or the
company lacks the right people in the right positions (Pay, 2008).
“Cherry picking” single tools and practices in manufacturing and engineering without
consideration of the environment within the system is a reason for failure or only partial success
of many lean initiatives (Morgan & Liker, 2006). According to Liker (2004), the problem is that
“…companies have mistaken a particular set of lean tools for deep ‘lean thinking.’ Lean thinking
based on the Toyota Way involves a far deeper and more pervasive cultural transformation than
most companies can begin to imagine” (pp. 10, 11). However, without “a total end-to-end view,
companies often fail to migrate to a lean enterprise” (Loftus, 2006, p. 46).
Emiliani and Stec (2005) identified two types of lean manufacturing adopted by the
companies: “real lean” and “imitation lean.” “Real lean” refers to the faithful adoption of the

6
lean management system across the entire enterprise, consistent with the lean principles even
when modified to work with the specific company culture. “Imitation lean” occurs when only
selected lean principles and practices are adopted. The author clarified that “imitation lean”
focuses on continuous improvement just as a tool, and “respect for people” as part of the lean
culture is missed.
Implementing “real lean” is a long and difficult process involving a commitment from all
management levels (Emiliani, 2004). An important key for a successful implementation is that
the first team member has to be the company CEO (Raymond, 2006). In addition, lean
implementation success depends on the “….relationship between the external facilitator, internal
line managers and the sponsor of the lean project, including those who work the processes”
(Atkinson, 2010, p. 41).
Rationale for the Study
Lean is popular in a variety of manufacturing and service businesses and has been the
focus of many scholarly investigations. Lewis (2000) stated that creating a lean success
trajectory is a difficult process because of the uniqueness of each individual lean implementation.
The lean research efforts identified many reasons why companies fail to implement lean, but
many questions remain. The relationship between organizational culture and radical changes
required for a lean implementation is not clear (Nahm et al., 2003), nor is the effect of size and
industry type on a lean implementation (Shah & Ward, 2003).
Four types of manufacturing settings have been identified by Hayes and Wheelwright
(1984): job shop, batch shop, assembly line and continuous flow. The job shop relies on
knowledge of the workers and is characterized by high flexibility, many different products, and
low volumes (NetMBA, 2011), such as a machine tool shop, a machining center, or a paint shop.

7
Hayes and Wheelwright (1984) described a job shop as producing “small batches of a large
number of different products” requiring different processing steps. In addition, Montreuil et al.
(1999, p. 501) defined a job shop as “manufacturing units that process a variety of individual
products requiring diverse workstation types in varied sequences” with different product routes
and lack of a dominant flow pattern. Characteristics of a job shop are variability in the job
demand, constantly changing product mix, and small to medium volume, which makes a
production line uneconomical to set up.
The batch shop is characterized with moderate flexibility, several products, and moderate
volumes. The products are produced in batches with disconnected activities; usually set-up time
is required for change from one product to another (NetMBA, 2011). Examples of this include
injection-molding manufacturing. Hayes and Wheelwright (1984) described the batch shop as a
standardized job shop with stable line of products. A batch production process is useful for
highly customized products in low volumes; it enables the buffering of the manual work into the
production system leading to innovation (Cooney, 2002).
The assembly line is associated with low flexibility, a few products, and high volumes.
The sequence of activities is fixed (NetMBA, 2011), such as in an automobile plant. Moreover,
the assembly line consists of sequenced workstations producing highly similar products (Hayes
& Wheelwright, 1984) with operators performing assembly tasks, and product moving from
workstation to workstation (Eswaramoorthi et al., 2011).
Continuous flow is characterized by very low flexibility, one product, and very high
volume. The sequence of action is fixed; usually the product is measured with weight or volume
(NetMBA, 2011), like petroleum refinery or sugar refinery. In process manufacturing, the
materials flow from one machine to another without stopping (Ha, 2007).

8
Most of the lean success stories are from companies with market and product technology
similar to Toyota’s: limited product offerings, with only cosmetic customization, high volume
production, repetitive manufacturing and stable or predictive demand (Lander & Liker, 2007),
which is an assembly line production. Safizadeh et al. (1996) found that firms with different
process choices have a different competitive priority. As an example: Job shop and batch
organizations stress flexibility and speed of response, while mass and process production
emphasize reliability, productivity, and lower cost (Han, 1997). Moreover, according to Cua et
al. (2001), the “….process type plays a significant role in differentiating performance” (p. 688).
Despite the uniqueness of the individual implementations, there is a possibility for “…generating
useful, contingent descriptions of the lean production development trajectory” (Lewis, 2000, p.
971). Kim et al. (2006) clarified that lean is unique because of the specified value from the
customer’s perspective. The “universality” of lean applications depends upon business
conditions (Cooney, 2002). Moreover, Shingo (1981) explained that the lean is universally
applicable after adaptation to the characteristics of each industry or plant.
White and Prybutok (2001) found out that an association between the type of production
system and lean manufacturing implementation exists. Lean manufacturing as a concept is well
understood and addressed by many research efforts, but its applicability to high value, low
volume complex products has not been determined (James-Moore & Gibbons, 1997). The
unchanged lean formula is applicable to a small sector of manufacturers; for most manufacturers,
good judgment is needed to adapt to the company’s circumstances (Jina et al., 1997). In addition,
which of the lean principles and tools are relevant to a specific environment is important for
successful lean implementations (Corbett, 2007). Consequently, if the appropriate fit between the

9
manufacturing processes and lean tools is defined, the companies will be able to implement lean,
sustain the results, and improve organizational performance.
Purposes of the Research
One purpose of this study was to examine the level of use of the sixteen lean tools as
defined by Liker (2004), Dennis (2007), and Womack and Jones (1996) in the different settings
of manufacturing operations identified by Hayes and Wheelwright (1984): job shop, batch shop,
and assembly line. The relationship between the type of manufacturing category and the levels of
use of the lean tools in each manufacturing category was tested through Hypothesis 1 (See
Figure 1). Moreover, a prioritization of the lean tools on which the different types of
manufacturing settings could emphasize during a successful lean implementation was proposed.
Another purpose of this study was to explore whether a relationship exists between the
perceived operational performance and the alignment of the identified lean tools with the type of
manufacturing category. In addition, this study investigated whether a relationship exists
between the perceived satisfaction with a lean program and the alignment of the identified lean
tools with the type of manufacturing category. The moderating effect of the type of
manufacturing settings on the relationships between the levels of use of the lean tools and the
perceived operational performance was tested through Hypothesis 2. The moderating effect of
the type of manufacturing settings on the relationships between the levels of utilization of the
lean tools and the satisfaction with the lean program was tested through Hypothesis 3 (See
Figure 1). For definitions, please refer to Chapter 2.

10
Figure 1. Theoretical Model
Research Questions
Lander and Liker (2007) suggested that the successful lean implementation depends on
designing and implementing specific tools for your organization, achieving the lean objectives,
and supporting your people. Based on the literature review, the level of use of the different lean
tools to the different categories of manufacturing organizations is crucial for a successful lean
implementation (Corbett, 2007). This study addressed three research questions related to
successful lean implementation in job shop, batch shop, and assembly line manufacturing
settings:
RQ1: Are the sixteen lean tools perceived by respondents to be equally used in job shop,
batch shop, and assembly line manufacturing settings?
RQ2: Is there a relationship between the operational performance of the firm as perceived
by the respondents and the perceived alignment of the lean tools with the type of manufacturing
setting?
H1 H2
H3
Type of
Manufacturing
Category
Lean Tools
Managers’ Satisfaction
with the Lean Program
Perceived Operational
Performance

11
RQ3: Is there a relationship between the reported satisfaction with the lean program and
the perceived alignment of the lean tools with the type of manufacturing setting?
Research hypothesis. Grounded in the contingency theory and in the universality of lean
dependent on different contextual factors (Chapter 2), the present study hypothesized:
H1 (Null): There will be no significant difference between the degrees of utilization of each lean
tool, when the companies are grouped by the three manufacturing settings: job shop, batch shop,
and assembly line.
This study hypothesized:
H2 (Null): The type of manufacturing setting will not have a significant moderating
effect on the relationship between the lean tools and the operational performance as
perceived by the respondents.
H3 (Null): The type of manufacturing setting will not have a significant moderating
effect on the relationship between the lean tools and the respondents’ satisfaction with the
lean program.
Delimitations and Limitations
The study was limited to manufacturing companies located in the US that were in some stage of
lean implementation. Data were collected using an electronic survey-questionnaire using a
checklist and a rating scale. A limitation of this survey research was that it captured a fleeting
moment in time and relied on self-reported data (Leedy & Ormrod, 2005). In addition, surveys
rely on participant honesty, and the quality of data obtained depends on how well the
respondents understand the survey item or question (Passmore & Parchman, 2002). Another
limitation was that the personal biases could not be controlled. Moreover, when using an online

12
survey, there was a probability of sampling bias issues (Selm & Jankowski, 2006). A
delimitation was that only three of the four settings identified by Hayes and Wheelwright (1984)
were used for this study. The study was further delimitated to Lean Enterprise Institute members
and LinkedIn Continuous Improvement group members.
Assumptions
It was assumed that all survey takers would provide honest answers to the survey
questions and that the chosen instrument would reflect accurately the lean implementations and
the perceptions of the respondents.
Definition of Terms
Continuous flow: The product flow, at rate one piece at a time, from one process to another
without WIP inventory between the processes (Dennis, 2007; Liker, 2004).
Five S: S-sort, S-set in order, S-shine, S-standardize, and S-sustain (Dennis, 2007).
Heijunka: Production leveling (Dennis, 2007).
Jidoka: automation with human touch (Dennis, 2007).
Kaizen: continuous improvement through employees’ contribution to the company’s
development (Brunet & New, 2003).
Kanban: system of visual tools synchronizing the production (Dennis, 2007).
Muda: Waste (Dennis, 2007).
Mura: Unevenness (Dennis, 2007).
Muri: Overburden of people and equipment (Dennis, 2007).
Poka-yoke: Error-proofing device (Dennis, 2007).
Pull: product is manufactured when is placed the actual order (Haaster et al., 2010).
Standardization: current best practices for each process (Detty & Yingling, 2000).

13
Total productive maintenance (TPM): progressive maintenance methodologies in which shop
floor employees perform basic maintenance work (Dennis, 2007).
Value Stream Map: material and information flow diagram (Dennis, 2007).
Work-in-process (WIP): inventory between the different processes (Dennis, 2007).
Summary
This chapter introduced the background of lean manufacturing and described the
problems encountered when implementing lean and justified the need to explore the level of
utilization of the different lean tools in the three manufacturing settings: job shop, batch shop,
and assembly line. In the next chapter, a review of related to the topic literature provides more
information about the lean manufacturing and the types of manufacturing categories.

14
Chapter 2: Review of the Literature
This chapter provides a summary of the current literature relevant to the definition and
purpose of lean manufacturing, the difficulty when implementing and sustaining lean, the
benefits achieved when lean is successfully implemented, the need for lean in order to keep more
manufacturing in the US, and the universality of lean when implemented in different types of
businesses. Moreover, this chapter provides information about the three types of manufacturing
settings: job shop, batch shop, and assembly line.
Lean Manufacturing
Researchers defined lean as a philosophy, a process, a systems approach, a method and a
business strategy. “Lean manufacturing is a comprehensive philosophy for structuring, operating,
controlling, managing, and continuously improving industrial production systems” (Detty &
Yingling, 2000, p. 429). Moreover, lean is a collection of tools and techniques, incorporated in
the business processes with goal optimizing time, human resources, assets, productivity, and
improving the quality level (Becker, 1998). Lean is a systems approach with integrated value
delivery processes (Allen, 2000), a total lean enterprise system concentrated on elimination of
non-value added activity (Haaster et al., 2010) and a dynamic process driven by set of principles
and practices (Womack et al., 1990). According to the National Institute of Standards and
Technology Manufacturing Extension Partnership’s Lean Network, “Lean manufacturing is a
systematic approach to identifying and eliminating waste through continuous improvement,
flowing the product at the pull of the customer in pursuit of perfection” (Kilpatrick, 2003, p. 1)

15
Figure 2. Toyota Production System house
Source: Liker, J. K. (2004, p. 33). Toyota way 14 management principles from the world's
greatest manufacturer. New York: McGraw-Hill
Lean manufacturing has synonyms such as lean production and just-in-time (Kilpatrick,
2003). Moreover, in a manufacturing environment, the term lean also refers to the Toyota
Production System (TPS) established by the Toyota Corporation (Chen et al., 2010).
At the present time, lean is the most effective way of manufacturing (Kristjuhan, 2010).
However, lean is not the application of a few lean tools on the shop floor but a complete change
of the way everyone relates in an organization when performing their daily work (Melton, 2005).
The adoption of lean involves “…complex evolutionary process of organizational learning and
interpretation” (Lee & Jo, 2007, p. 3665). The focus of lean manufacturing is based on the
combination of human and technological subsystems, because Kanban, heijunka, and

16
autonomaton are part of the technological system, while creative thinking, problem solving, and
team work are part of the human system (Paez et al., 2004).
The three underlying lean elements are philosophical underpinnings, managerial culture,
and technical tools (Dibia & Onuh, 2010). Other lean characteristics are team-based work,
organization with cross-functional teams, shop floor problem solving, lean operations, high
employee commitment, involved suppliers, and make-to-order strategy (Sohal & Egglestone,
1994). In addition, lean manufacturing combines product development, supplier management,
customer management, and policy focusing processes for the whole organization (Holweg,
2007). Finally, lean manufacturing coordinates all processes in the chain from the customer to
the supplier (Smeds, 1994).
Implementing lean. “Optimal lean implementation depends on using effective lean
mechanisms within the boundaries of system constraints and strategic goals” (Deif, 2011, pp. 11-
12). For a successful lean implementation, a decision-making system is needed which is based on
bottom-up measures, quality reports, vendors’ reliability, and an adapted control system linking
compensation rewards to quality results (Fullerton & McWatters, 2002). Moreover, essential is
the development of comprehensive in scope and content, plant specific manufacturing strategies
(Crute et al., 2003). A successful lean implementation requires dramatic changes at all
organizational levels and departments, involving work organizational and cultural issues (Sohal,
1996).
Black (2007, p. 3645) proposed seven preliminary steps for successful lean
implementation:
1. Education of everybody in the plant on lean production philosophy and concepts,
2. Top-down commitment,

17
3. Financial decision based on the lean practices as lean accounting,
4. Selection of measurable parameters that track organizational changes,
5. Full involvement of production workers,
6. The company must share the gains with those who contributed, and
7. The middle management reward structure must support the system design.
Liker et al. (1998) grouped Toyota managerial practices into six organizational
mechanisms: mutual adjustment, close supervision, integrative leadership from product heads,
standard skills, standard work processes, and design standards, which are working well as a
whole, but alone each one of them would accomplish little. On the other hand, Allen (2000)
defined the five phases of lean implementation as stability, continuous flow, synchronized
production, pull system, and leveled production. “Activities, connections, and production flows
are standardized and rigidly specified to provide the necessary performance and flexibility to
supply a wide range of standardized products at low costs” (Alfnes & Strandhagen, 2000, p. 5).
According Crute et al. (2003), the lean capabilities are plant specific. In order to work,
the Toyota product development system must be redesigned to suit the uniqueness of each
organization and must be integrated in the overall system, realizing the potential of the best
practiced and tools (Liker et al., 1998).
Sohal (1996) wrote that employees’ education and training is a foundation of all change
initiatives and is critical for successful lean implementation. Other success factors are
management’s commitment to changes and active involvement in the improvement initiatives
(Sohal & Egglestone, 1994) and culture supporting autonomous working (Crute et al., 2003), or
in other words, a leadership dedicated to lean. Becoming lean requires tremendous learning and a
high level of commitment to the process (Chen et al., 2010).
18
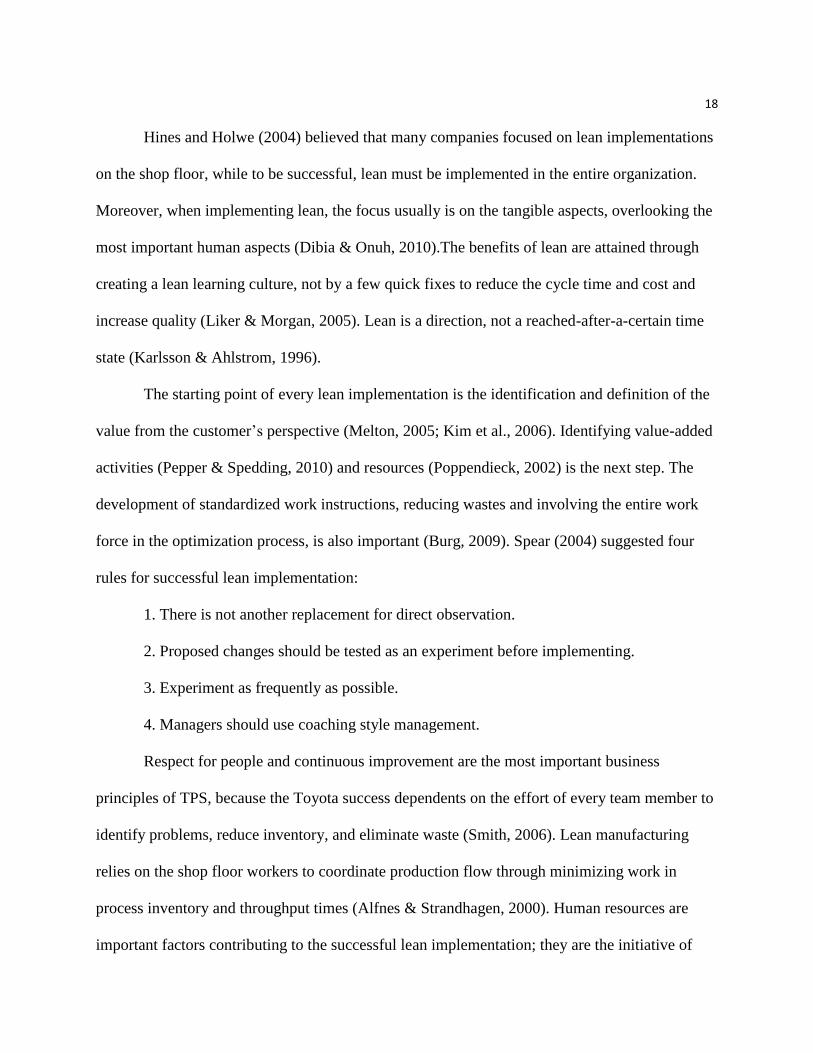
Hines and Holwe (2004) believed that many companies focused on lean implementations
on the shop floor, while to be successful, lean must be implemented in the entire organization.
Moreover, when implementing lean, the focus usually is on the tangible aspects, overlooking the
most important human aspects (Dibia & Onuh, 2010).The benefits of lean are attained through
creating a lean learning culture, not by a few quick fixes to reduce the cycle time and cost and
increase quality (Liker & Morgan, 2005). Lean is a direction, not a reached-after-a-certain time
state (Karlsson & Ahlstrom, 1996).
The starting point of every lean implementation is the identification and definition of the
value from the customer’s perspective (Melton, 2005; Kim et al., 2006). Identifying value-added
activities (Pepper & Spedding, 2010) and resources (Poppendieck, 2002) is the next step. The
development of standardized work instructions, reducing wastes and involving the entire work
force in the optimization process, is also important (Burg, 2009). Spear (2004) suggested four
rules for successful lean implementation:
1. There is not another replacement for direct observation.
2. Proposed changes should be tested as an experiment before implementing.
3. Experiment as frequently as possible.
4. Managers should use coaching style management.
Respect for people and continuous improvement are the most important business
principles of TPS, because the Toyota success dependents on the effort of every team member to
identify problems, reduce inventory, and eliminate waste (Smith, 2006). Lean manufacturing
relies on the shop floor workers to coordinate production flow through minimizing work in
process inventory and throughput times (Alfnes & Strandhagen, 2000). Human resources are
important factors contributing to the successful lean implementation; they are the initiative of

19
processes, business, and continuous improvement activities (Dibia & Onuh, 2010). In the lean
environment, variances and uncertainty are easily managed through teamwork and group
problem solving, leading to decentralized decision-making (Forza, 1996).
Sustaining lean. Sustaining a lean culture is not easy because it requires workers
dedicated to continuous improvement, accepting that there exists a better way of doing
everything (Flinchbaugh, 2006). According Liker and Rother (n.d.), “The Shingo Prize
committee, which gives awards for excellence in lean manufacturing, went back to past winners
and found that many had not sustained their progress after winning the award” (p. 1). The lean
system functions properly in a social collaborative environment with foreseeable and reliable
production resources (Forza, 1996). An open environment of timely information sharing,
communication, trust, and openness between the employees is necessary (Sohal, 1996).
The lean achievement is sustainable through implementing teamwork for problem
solving, employees’ suggestion program, quality feedback, statistical process control,
standardized procedures, and employees performing a variety of tasks (Forza, 1996). In addition,
everyone must be involved in the transformation changes and must understand that the well-
being of the firm means job security for everyone (Sohal, 1996).
The TPS is working with a flat hierarchy, democratic culture, understanding that the
employees and managers have a common interest in the well-being of organization (Fang &
Kleiner, 2003). Lean culture characteristics are the decentralization of responsibility to the
production workers and the decrease of hierarchic levels in the company (Sanchez & Perez,
2001).
Sustainable lean improvement is achieved when the local culture adapts to and embraces
the lean principles (Dickson et al., 2009). A sustainable lean culture is contingent on the

20
“training and development targeted at learning and knowledge sharing, compensation and reward
schemes, and focus on lean as a means towards career development” (Jorgensen et al., 2007, p.
377). Similarly, lean should be seen as a direction, not as a state, reached after a certain time
(Karlsson & Ahlstrom, 1996). Moreover, sustainable success of lean depends on the appropriate
assessment tool taking into account technical and organizational perspectives (Jorgensen et al.,
2007). Toyota culture is built and sustained through company uniforms, songs, after-work social
gathering (Fang & Kleiner 2003), and a high level of continuous leadership commitment to lean
(Dickson et al., 2009). The lean implementation is a long-term strategy with incorporated
continuous improvement (Loftus, 2006).
Benefits of lean. Lean manufacturing is a very effective management system, achieving
better results while using less of everything: half the human effort, half the manufacturing space,
half the engineering hours, and decreased labor cost (Dibia & Onuh 2010; Sohal & Egglestone,
1994). The lean manufacturing companies design and distribute products in less than half the
time that other companies do (Sohal, 1996).
The goal of lean is reduction of labor, space, capital, and delivery time (Taninecz, 2005).
The benefits of implementing lean are achieved through associated improvement techniques and
methodologies (Katayama & Bennett, 1996), but they vary in different manufacturing systems
(Lima et al., n.d.). “Companies which have adopted the lean production concepts can typically
design, manufacture, and distribute products in less than half the time taken by other companies”
(Sohal, 1996, p. 92).

21
Table 3
Lean Benefits
Lean Benefits Literature
Reduction of lead time Koenigsaecker, 2005; Pavnaskar et al., 2010
Reduction of accidents Koenigsaecker, 2005;
Reduction in customers complaint Koenigsaecker, 2005;
Reduction in floor space Koenigsaecker, 2005; Pavnaskar et al., 2010
Improved quality Chen et al., 2010; Pavnaskar et al., 2010
Reduced processing time Chen et al., 2010;
Reduction of WIP inventory level Chen et al., 2010; Cudney, 2010;
Easily traceable quality problems Chen et al., 2010;
Simplified communication Chen et al., 2010;
Time-based responses Fullerton and Watters, 2001;
Employee flexibility Fullerton and Watters, 2001;
Accounting simplification Fullerton and Watters, 2001;
Increased firm profitability Fullerton and Watters, 2001;
Inventory reductions Fullerton and Watters, 2001; Cudney, 2010;
Reduced scraps cost Cudney, 2010; Pavnaskar et al., 2010
Improved delivery time Cudney, 2010; Pavnaskar et al., 2010
Increased flexibility Sohal and Egglestone, 1994;
Lowering of cycle times Sohal and Egglestone, 1994;
Greater sensitivity to market changes Sohal and Egglestone, 1994;
Increased productivity levels Sohal and Egglestone, 1994; Cudney, 2010;
Pavnaskar et al., 2010
Stronger focus on performance Sohal and Egglestone, 1994;
Improved supplier bonds Sohal and Egglestone, 1994;
Reduced labor Cudney, 2010; Pavnaskar et al., 2010
Increased machine utilization Cudney, 2010; Pavnaskar et al., 2010
22
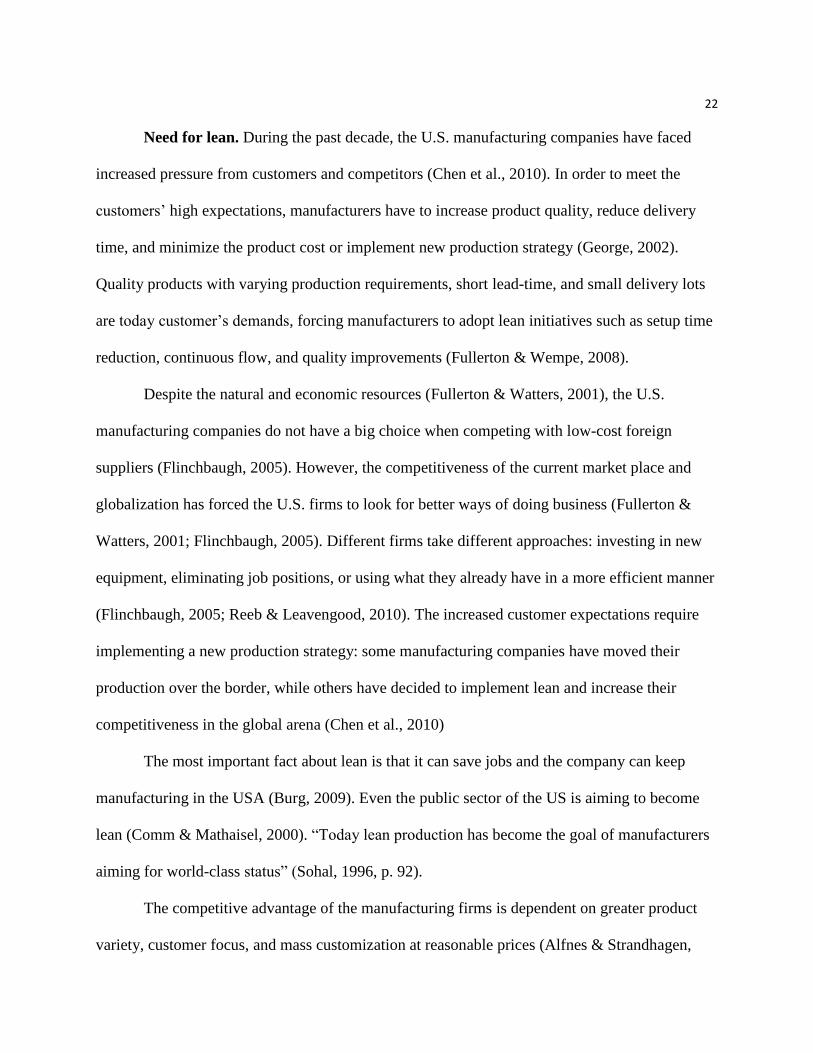
Need for lean. During the past decade, the U.S. manufacturing companies have faced
increased pressure from customers and competitors (Chen et al., 2010). In order to meet the
customers’ high expectations, manufacturers have to increase product quality, reduce delivery
time, and minimize the product cost or implement new production strategy (George, 2002).
Quality products with varying production requirements, short lead-time, and small delivery lots
are today customer’s demands, forcing manufacturers to adopt lean initiatives such as setup time
reduction, continuous flow, and quality improvements (Fullerton & Wempe, 2008).
Despite the natural and economic resources (Fullerton & Watters, 2001), the U.S.
manufacturing companies do not have a big choice when competing with low-cost foreign
suppliers (Flinchbaugh, 2005). However, the competitiveness of the current market place and
globalization has forced the U.S. firms to look for better ways of doing business (Fullerton &
Watters, 2001; Flinchbaugh, 2005). Different firms take different approaches: investing in new
equipment, eliminating job positions, or using what they already have in a more efficient manner
(Flinchbaugh, 2005; Reeb & Leavengood, 2010). The increased customer expectations require
implementing a new production strategy: some manufacturing companies have moved their
production over the border, while others have decided to implement lean and increase their
competitiveness in the global arena (Chen et al., 2010)
The most important fact about lean is that it can save jobs and the company can keep
manufacturing in the USA (Burg, 2009). Even the public sector of the US is aiming to become
lean (Comm & Mathaisel, 2000). “Today lean production has become the goal of manufacturers
aiming for world-class status” (Sohal, 1996, p. 92).
The competitive advantage of the manufacturing firms is dependent on greater product
variety, customer focus, and mass customization at reasonable prices (Alfnes & Strandhagen,

23
2000). In addition, the competitive advantage of manufacturing firms is accomplished through
quality beyond the competition and technology before the competition or, on the other hand,
better, faster, and cheaper, which is a characteristic of lean (Comm & Mathaisel, 2000).
“Achieving long term competitive advantage depends on the firm understanding how to position
its manufacturing skills vis a vis its competitors” (Fine & Hax, 1985, p. 30).
Dibia and Onuh (2010) explained that lean is a significant enabler in the manufacturing
world because new customers’ expectations are high quality, customer-driven products, cost
effectiveness, technology, and new human resources practices. Powerful business drivers,
delivering value to shareholders, are cost reduction and innovations (Dlott, 2011). The U.S.
manufacturing landscape is transforming itself through the lean production paradigm (Fullerton
& Wempe, 2008). “Lean manufacturing has proved to be one of the most successful tools that
manufacturing facilities can employ” (Green et al., 2010, p. 2992). Because of the increased
global competition, almost every manufacturing industry is willing to implement lean
(Pavnaskary et al., 2003; Vinodh & Chintha, 2011).
Applicability of lean to different businesses. The lean principles, developed by TPS,
are not restricted to only large multinational companies, but they are also applicable to small and
medium-sized firms (Karlsson & Ahlstrom, 1996). Incidentally, different aspects of lean are
implemented in larger and small firms (White et al., 1999). Quality controls, total preventive
maintenance, set-up time reduction, and kanban are implemented in the large businesses, while
the multifunction employee concept is implemented in the small businesses (Shah & Ward,
2003).
Lean manufacturing is applicable to the aerospace industry, resulting in a high level of
process and product quality along with low cost and significant reduction in lead times (Crute et

24
al., 2003; Cudney, 2010). However, the problems when implementing lean in aerospace are very
similar to high volume sectors such as automobiles (Crute et al., 2003). Moreover, lean is well
understood and successfully applied in the software development practices, resulting in many
benefits (Poppendieck, 2002). Similarly, lean when applied in the construction and forest
products industries improves efficiency and competitiveness (Reeb & Leavengood, 2010; Höök
& Stehn, 2008). The application of lean in many industry sectors has resulted in performance
improvement (Reichhart & Holweg, 2007). Finally, the lean principles are applied to a range of
business processes, although there continues to be the existing challenges of transferring lean
from the production floor to the service area (Taninecz, 2005).
Lean measures. “Leanness” is a lean performance measure, defined by Vinodh and
Balaji (2011). For this reason Wan and Chen (2008) proposed a “unit- invariant” leanness
measure quantifying the leanness of the manufacturing systems through extracting “….the value-
adding investments from a production process to determine the leanness frontier as a
benchmark” (p. 6567). Moreover, the application of lean principles is measured by “…faster
throughput times for in-bound, work in progress (WIP) and out-bound material; smaller
manufacturing batch sizes; shorter set-up and change-over times and greater ‘up time’; greater
schedule stability; lower rework and rectification costs” (Jina et al., 1997, p. 5 ).
On the other hand, Jing and Xuejun (2009) explained that lean production is an integrated
social technology system, where the implementation can be measured by measuring the
implementation degree of “…. team work, simple structure, multi skill, employee involvement,
visualization, training, skill based and group based performance pay, organizational support,
kanban, set up time reduction, cell manufacturing, group technology, statistical process control,
preventive maintenance, supplier involvement, and customer focus” (p. 549 ).

25
Lean tool and construct definitions. Just in Time (JIT) is one of the pillars of the Lean
House (Liker, 2004; Dennis, 2007) and a key lean production element (Hines, 1996). JIT is
defined as the extent to which the parts are delivered in the right quantity at the right time using
the minimum necessary resources (Sanchez & Perez, 2001; Haak, 2006; Detty & Yingling, 2000,
Kasul & Motwani, 1997). JIT is also called a “pull system,” in which the product is
manufactured when the actual order is placed and the firm produces only what is needed in
requested quantities and time (Haaster et al., 2010; Dennis, 2007). The purpose of pull
production is to match production with demand (Detty & Yingling, 2000; Kilpatrick, 2003).
The benefits of JIT are lower inventory, space and cost savings, reduced risk of
obsolesce, and reduced response time (Beard & Butler, 2000; Haak, 2006; Haaster et al., 2010;
Billesbach & Hayen, 1994). According Fullerton et al. (2003), positive relationships exist
between the degrees to which waste reduction practices, profitability of the firm, and marginal
return to long-term JIT investment are implemented.
Beard and Butler (2000) explained that actually JIT theory differs from JIT practice,
because different industries have different manufacturing processes, and JIT is not applicable to
all of them. For successful implementation of JIT, human resources support and understanding is
a crucial factor (Gupta et al., 2000). Moreover, the master production schedule is very
deterministic for the JIT system (Faizul & Lamb, 1996). JIT is supported through Kanban, a card
or other visual control, pulling production through the manufacturing process (Melton, 2005).
Kanban is a pull signal, controlling work in process inventory (de Araujo & de Queiroz, 2005)
and indicating how much material is needed and when (Kilpatrick, 2003). Adler et al. (1997)
explained that NUMMI did not use a computer production schedule, but instead used kanban,
signaling that the downstream needed something to be produced.

26
Kanban is a scheduling system replacing what has been used by the next process,
resulting in minimum inventory and shorter lead-time (Kasul & Motwani, 1997). Two kinds of
Kanban are identified by Kasul and Motwani (1997): (a) Withdrawal Kanban “specifies the kind
and quantity of product which the subsequent process should withdraw from the preceding
process” (p. 277) and (b) Production Kanban “specifies the kind and quantity of product which
the preceding process must produce” (p. 277). In cases when pure flow is not possible because of
different cycle times between processes or another reason, the Kanban system is the next choice
(Liker, 2004).
Continuous Flow (CONTFL) is defined as the extent to which the product flows one
piece at a time, from one process to another without WIP inventory between the processes
(Dennis, 2007; Liker, 2004). Flow is the most difficult concept to understand, because first one
needs an understanding of the linkage of events and activities delivering value to the customer
(Melton, 2005). Continuous flow is achieved through the implementation of work cells, which is
a technique arranging operations in a cell with one piece flow and better use of people and
equipment (Kilpatrick, 2003). Disconnected processes and people or areas with material
stagnation are signs that the workflow has to increase through cells implementation (Lander &
Liker, 2007).
Because the ideal batch size, one, is not always applicable, when working in batches, the
goal is to decrease the batch size as low as possible (Kilpatrick, 2003). As a first step in the lean
journey, Liker (2004) recommended creating continuous flow whenever applicable to the
processes. Continuous flow is created through defining value from the customers’ perspective
and moving machines and people together (Dennis, 2007). “Flow is at the heart of the lean

27
message that shortening the elapsed time from raw materials to finished goods will lead to the
best quality, lowest cost, and shortest delivery time” (Liker, 2004 pp. 87, 88).
Heijunka (HEIJ) is defined as the extent to which the production is leveled over a defined
period in order to achieve constant flow of mixed parts and to minimize peaks and valleys in the
workload (Furmans, 2005., Haaster et al., 2010, Adler et al., 1997; Coleman & Vaghefi, 1994;
Deif, 2011; Hampson, 1999; Huttmeir et al., 2009). In addition, heijunka is defined as a
production planning method, taking into account process leads, capacities, external demand, and
takt time to mix the items’ sequence in the most efficient way (Coleman & Vaghefi, 1994). On
the other hand, heijunka is defined as a manufacturing strategy eliminating the overproduction
and synchronizing all production operations to match customer demand (Deif, 2011, Detty &
Yingling, 2000). Heijunka prevents uneven workloads or having too many of one part and not
enough of another (Kasul & Motwani, 1997).
Production leveling aims to smooth the product line utilization, to level the workload, and
to set up standardized processes (Průša & Schacherl, 2007). Consequently, even work
distribution results in stable and even output and creates a continuous flow, which is required for
lean manufacturing (Haaster et al., 2010). Leveling production is achieved through quick change
over small lots and mixed model-sequenced product scheduling (Detty & Yingling, 2000).
Quick Set Up (QSETUP) is defined as the extent to which the amount of time for change-
over is reduced from running one product to another (Kilpatrick, 2003). The leveling of
production quantity requires that one product be manufactured for a specific time, called takt
time (Art of Lean, Inc., n.d.). According to Melton (2005), the single-minute exchange of dies is
a change over reduction technique. Reduced “change over” time is necessary to avoid costs
associated with heijunka (Adler et al., 1997).

28
The other pillar of the lean house is called automation with a human touch or Jidoka.
Jidoka (JID) is defined as the extent to which quality is built into the process through people and
machine detection of abnormal conditions, preventing defective parts passing to the next process
and determining and eliminating the root cause (Hinckley, 2007; Art of lean, Inc., n.d.; Veech,
2001; Dennis, 2007). Moreover, jidoka refers to machine autonomous monitoring for defects.
With automatic stopping devices triggered by a defect or poor quality products, in the case of
continuous flow, the whole production line can stop until the defect is fixed (Haak, 2006;
Haaster et al., 2010; Detty & Yingling, 2000). Jidoka is an interaction of team members and
machinery, bringing attention to the problems (Veech, 2001). The best automation is achieved
through constantly revised manufacturing strategies (Morey, 2008). Suzuki (2004) identified two
kinds of jidoka: the first one stops a machine when a problem occurs, while the second one stops
a machine when the processing is complete. The main purpose of jidoka is to produce defect-free
products (Kasul & Motwani, 1997). High quality is achieved through implementation of mistake-
proofing devices and inspecting one hundred percent of the time (Hinckley, 2007).
Poka-Yoke (PYOKE) is defined as the extent to which the error-proofing device has low
cost, high reliability, and is designed for specific work place conditions (Melton, 2005; Dennis,
2007). In the lean manufacturing environment, the mistakes are controlled through mistake-
proofing devices, which are the most cost efficient and quality reliable alternative (Hinckley,
2007). Poke-yoke is a low cost simple device, detecting abnormal situations before they occur, or
stopping the line to prevent a defect. The poke-yoke requirement is long life, low maintenance,
high reliability, low cost and designed for the specific work place conditions (Dennis, 2007).
Andon (AND) is defined as the extent to which the device allows everyone working on
the production line to stop the production if a defect is detected (Kasul & Motwani, 1997).
29
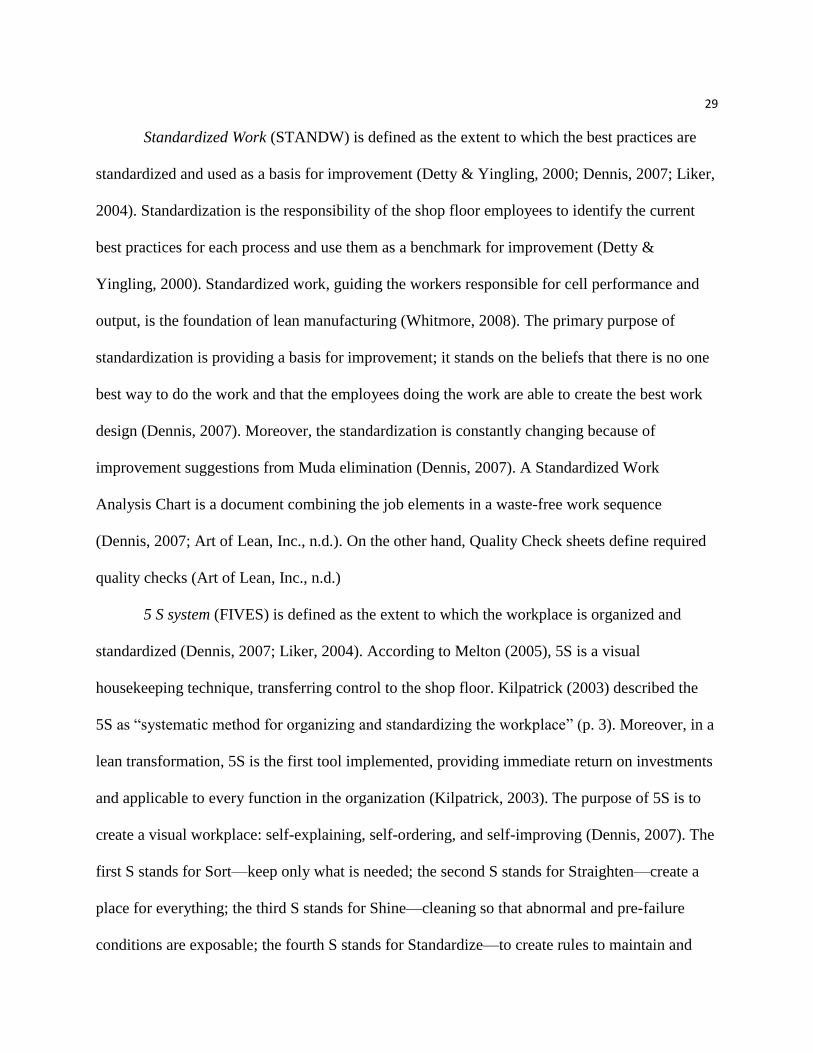
Standardized Work (STANDW) is defined as the extent to which the best practices are
standardized and used as a basis for improvement (Detty & Yingling, 2000; Dennis, 2007; Liker,
2004). Standardization is the responsibility of the shop floor employees to identify the current
best practices for each process and use them as a benchmark for improvement (Detty &
Yingling, 2000). Standardized work, guiding the workers responsible for cell performance and
output, is the foundation of lean manufacturing (Whitmore, 2008). The primary purpose of
standardization is providing a basis for improvement; it stands on the beliefs that there is no one
best way to do the work and that the employees doing the work are able to create the best work
design (Dennis, 2007). Moreover, the standardization is constantly changing because of
improvement suggestions from Muda elimination (Dennis, 2007). A Standardized Work
Analysis Chart is a document combining the job elements in a waste-free work sequence
(Dennis, 2007; Art of Lean, Inc., n.d.). On the other hand, Quality Check sheets define required
quality checks (Art of Lean, Inc., n.d.)
5 S system (FIVES) is defined as the extent to which the workplace is organized and
standardized (Dennis, 2007; Liker, 2004). According to Melton (2005), 5S is a visual
housekeeping technique, transferring control to the shop floor. Kilpatrick (2003) described the
5S as “systematic method for organizing and standardizing the workplace” (p. 3). Moreover, in a
lean transformation, 5S is the first tool implemented, providing immediate return on investments
and applicable to every function in the organization (Kilpatrick, 2003). The purpose of 5S is to
create a visual workplace: self-explaining, self-ordering, and self-improving (Dennis, 2007). The
first S stands for Sort—keep only what is needed; the second S stands for Straighten—create a
place for everything; the third S stands for Shine—cleaning so that abnormal and pre-failure
conditions are exposable; the fourth S stands for Standardize—to create rules to maintain and

30
monitor the first 3s, and the fifth S stands for Sustain—create self-discipline for continuous
improvement (Liker, 2004).
Total Productive Maintenance (TPM) is defined as the extent to which everyone on the
shop floor is involved in preventive basic maintenance work (Dennis, 2007; Liker, 2004). TPM
is a progressive maintenance methodology dependent on the knowledge and cooperation of
operators and support personal, with a goal of achieving longer equipment life, reliable
equipment, lower maintenance costs, and improved utilization and quality (Kilpatrick, 2003).
Moreover, “TPM assigns basic maintenance work such as inspection, cleaning, lubricating, and
tightening to production team members” (Dennis, 2007, p. 45).
Visual management (VISM) is the extent to which value-added information is displayed
to everyone (Hogan, 2009; Dennis, 2007). With visual management, the problems are apparent
to all because the production operations status is displayed to all workers. The visual information
creates a self-directing, self-explaining and self-improving workplace (Hogan, 2009).
Information distribution is essential for the manufacturing teams, in order to perform according
to the company’s goals (Karlsson & Ahlstrom, 1996). TPS visual management communicates
information to all employees (Kasul & Motwani, 1997). Kilpatrick (2003) defined visual
management as simple signals providing immediate and obvious understanding of a situation
within a short period. Visual management is a communication aid, a tool driving real time
operations and processes (Parry & Turnerz, 2006), and a method for a shop floor performance
measurement (Melton, 2005).
Toyota strategy is based on lasting cost reduction, with high quality, availability, and
customer satisfaction, achieved through continuous improvement (Alukal, 2007). Kaizen
(continuous improvement; KAIZ) is defined as the extent to which employees contribute to the

31
company’s development through suggestions aimed at elimination of all kinds of waste (Boyer,
1996; Alukal, 2007; Dennis, 2007; Imai, 1997). Kaizen is a Toyota management philosophy
involving everyone working for the company contributing to continuous improvement of the
structures and systems with the goal of eliminating all kinds of waste (Haak, 2006). Kaizen
“….consists of pervasive and continual activities, outside the contributor’s explicit contractual
roles, to identify and achieve outcomes he believes contribute to the organizational goals”
(Brunet & New, 2003, p. 1428). Employees’ creativity and idea generation is the basis of
continuous improvement (Alukal, 2007). The connection between lean and growth is Kaizen,
which eliminates manufacturing and administrative wastes and depends on employees’
engagement (Hettler, 2008).
The workers’ training in problem solving is a very important element of continuous
improvement (Adler et al., 1997). The base of lean production is well trained and multi-skilled
workers, creating an environment which promotes continuous improvement (Boyer, 1996). The
goal of continuous improvement is improving safety, quality, and productivity through working
in employee teams (Detty & Yingling, 2000). Kaizen refers to the gradual improvement made
over time (Manos, 2007).
According Adler et al. (1997), workers’ participation in the suggestion program is a
reliable measure of plant performance. Kaizen-oriented suggestions are applicable to
organizations with process- and result-oriented employees, empowered and committed to
company’s long-term viability, with free flow of information (Recht & Wilderom, 1998).
A Team (TEAM) is defined as the extent to which employees with complementary skills work
together to achieve a common goal (Sanchez & Perez, 2001; Karlsson & Ahlstrom, 1996). At
Toyota, teamwork is promoted through shared vision and purpose (Alukal, 2007), and the

32
workers rotate every two hours and share their mistakes with their fellow workers (Bodek, 2008).
The purpose of teamwork is the transferring of responsibilities to the production workers and
reducing indirect labor costs, because beside the production, the teamwork requires maintenance
and material handling (Sanchez & Perez, 2001). The success of NUMMI is based on cross-
trained workers rotating between different tasks (Adler et al., 1997). The success and
sustainability of the TPS depends on the team members, the power of highly skilled motivated
workforce as the most competitive advantage of any company, because satisfying and motivating
the team members is the primary goal of a lean company (Veech, 2001).
In a lean environment, product teams and personnel management are working together to
achieve common goals (Haak, 2006). Manufacturing teamwork is essential for a successful lean
organization, resulting in improved quality, shorter cycle time, and lower costs (Jina et al., 1997).
Cross training is a method for achieving multi-skilled employees, which is the requirement for
increasing flexibility in meeting fluctuating demand, creating a shared sense of responsibility,
and balancing the workload in a lean manufacturing organization (McDonald et al., 2009). At the
beginning, the training of employees reduces the profit margin, but it is a long-term investment,
resulting in the achievement of the lean benefits (Fullerton et al., 2003). When implementing
lean, the first step is improving people’s skills, because this step is directly related to the success
of continuous process improvement (Veech, 2001).
Workers involvement (WINV) is defined as the extent to which employees are motivated
to participate in continuous improvement and problem-solving activities (Bodek, 2010; Fullerton
& Wempe, 2008). The human side of lean is very important in implementing a team-based
environment in which employees follow the standards and use all tools and lean techniques
(Alukal, 2007). All of the keys to lean manufacturing are dependent on people doing the work

33
(Dibia & Onuh, 2010). The successful implementation of TPS depends on creating and
sustaining high level of worker involvement because employees decide when to stop the line,
develop the standardization, and generate the kaizen ideas (Adler et al., 1997). Moreover,
Fullerton and Wempe (2008) confirmed in their study that successful adoption of lean
manufacturing depends on the shop floor employee involvement. Only the front line workers can
identify and fix small problems (Dennis, 2007). Working out a plan for a personal growth is a
good motivator because the employees feel that they are in charge of their own lives, and by
contributing to the organization they are contributing to their growth (Bodek, 2010).
The most important for Kaizen success is employees’ motivation to participate and
implement small but constant improvements to the shop-floor activities (Imai, 1997). Self-
efficiency motivates team members to participate in problem-solving and continuous
improvement activities (Veech, 2001). Another motivator is the involvement of “production line
workers in the identification and adjustment of defective parts, in order to prevent defective parts
from arriving at the quality control department” (Sanchez & Perez, 2001, p. 1436). Confidence in
job security is essential for workers to bring ideas (Detty & Yingling, 2000).
Value Stream Mapping (VSM) is defined as the extent to which the current process is
mapped to make the improvement opportunities obvious (Dennis, 2007; Hettler, 2008). When
improving a process, the first step is to create a baseline value stream map (Jovag, 2011). A
value stream map makes the wastes in the process obvious and is a visual representation of the
value- and no-value-added materials and information moving through the process (Hettler,
2008). If implemented correctly, Value Stream Mapping (VSM) defines the current and desirable
state of the system, provides a reliable analysis tool (Pepper & Spedding, 2010), tracks the

34
redesign of the production system (Serrano et al., 2008), and helps in identifying and eliminating
wastes (Seth & Gupta, 2005)
The value stream map is a communication tool and the foundation for decision-making
(Hettler, 2008). The current value stream is mapped to serve as a basis for improvement; the
ideal value stream is mapped as a future direction with only value added processes (Hettler,
2008).
Muda (MUDA) is defined as the extent to which the activity or the process is not value-
added (Dennis, 2007). There are eight types of Muda within lean:
1. Overproduction Muda is defined as the extent to which unordered items are produced
(Liker, 2004). Overproduction generates storage, transportation, inventory,
maintenance, labor, and energy costs (Liker, 2004).
2. Overprocessing Muda is defined as the extent to which the items are processed more
than is the customer’s requirement, producing higher than necessary quality parts
(Dennis, 2007; Liker, 2004).
3. Excess inventory Muda is defined as the extent to which unnecessary raw materials,
parts, and WIP are kept. Problems as production imbalance, late delivery from
suppliers, long set-up times, and equipment downtime are hidden behind the excess
inventory (Liker, 2004).
4. Correction/scrap Muda is defined as the extent to which defective parts are reworked
or corrected (Liker, 2004).
5. Conveyance Muda is defined as the extent to which work in process inventory is
conveyed long distances or parts are moved between processes (Dennis, 2007; Liker,
2004).

35
6. Waiting Muda is defined as the extent to which the workers wait for material or for
the next processing steps, parts, and so on (Dennis, 2007; Liker, 2004).
7. Motion Muda is defined as the extent to which employees perform unnecessary
motion (Dennis, 2007; Liker, 2004).
8. Unused employees creativity Muda is defined as the extent to which improvement
and learning opportunities are lost (Liker, 2004)
Operational Performance (OPPER) is defined as the extent to which the firm’s
operational performance indicators focus on the key operational success factors leading to
financial performance (Venkatrama & Ramanujam, 1986). The implication of the lean practices
is related to improvements in the firm operational performance measures as quality cost scrap
and rework cost, productivity costs, cycle time and customer lead-time (Shah & Ward, 2003).
Satisfaction (SATISF) is defined as the extent to which “one’s feelings or attitudes
toward a variety of factors affecting the situation” are summed (Legris et al., 2003, p. 192;
Bailey & Pearson, 1983, p. 531). Three categories of variables measuring satisfaction were
identified by Cheney (1986): uncontrollable, partly controllable, and fully controllable. Ives et al.
(1983) linked satisfaction with the needs addressed by the system. However, the satisfaction is a
critical factor in determining the success or failure of the system implementation (Doll &
Torkzadeh, 1988; Bailey & Pearson, 1983). “Satisfaction cannot be evaluated directly using an
objective measure” (Dehghan & Shahin, 2011, p. 3; Dehghan & Trafalis, 2012, p. 154). Palvia
(1996) proposed a comprehensive model measuring user satisfaction with technology.

36
Table 4
Construct Definitions
Construct Construct Definition Literature
Just in Time
(JIT)
The extent to which is produced the right
item, at right time, in right quantity when
is placed an actual order.
Dennis, 2007; Detty and Yingling, 2000;
Fang and Kleiner, 2003; Fullerton and
Watters, 2001; Fullerton et al., 2003;
Faizul and Lamb, 1996; Miltenburg, 2007;
Liker, 2004; Veech, 2001
Continuous Flow
(CONTFL)
The extent to which, the product flow, at
rate one piece at a time from one process to
another without WIP inventory between
the processes.
Dennis, 2007; Liker, 2004; Fullerton and
Wempe, 2008; Allen, 2000; Veech, 2001;
Haaster et al., 2010
Heijunka
(HEIJ)
The extent to which the workload and
production is leveled over defined period
in order to achieve constant flow of mixed
parts and to minimize the peaks and
valleys in the workload.
Furmans, 2005; Haaster et al., 2010; Adler
et al., 1997; Coleman and Vaghefi, 1994;
Deif, 2011; Hampson, 1999; Huttmeir et
al., 2009
Quick Set Up
(QSETUP)
The extent to which is reduced the amount
of time for change over from running one
product to another.
Kilpatrick, 2003; Dennis, 2007; Detty and
Yingling, 2000;
Jidoka
(JID)
The extent to which quality is built into the
process through people and machine
detecting abnormal conditions, preventing
defective parts of passing to the next
process and determining and eliminating
the root cause.
Dennis, 2007; Haak, 2006; Haaster et al.,
2010; Detty and Yingling, 2000;
Hinckley, 2007; Kasul and Motwani,1997;
Morey, 2008; Sugimorit et al., 1997; Liker,
2004; Suzuki, 2004;
Poke Yoke
(PYOKE)
The extent to which the error proofing
device is low cost, high reliability, and
designed for specific work place
conditions.
Melton, 2005; Dennis, 2007
Andon
(AND)
the extent to which the devise allows
everyone working on the production line to
stop the production if defect is detected
Kasul and Motwani, 1997
Standardized Work
(STANDW)
the extent to which the best practices are
standardized and used as a base for
improvement
Höök and Stehn, 2008; Dennis, 2007;
Detty and Yingling, 2000; Melton, 2005;
Whitmore, 2008; Liker, 2004;

37
5 S system
(FIVES)
The extent to which the workplace is
organized and standardized.
Dennis, 2007; Liker, 2004; Veech, 2001;
Melton, 2005; Kilpatrick, 2003
Total Productive
Maintenance (TPM)
The extent to which everyone on the shop
floor is involved in preventive basic
maintenance work.
Dennis, 2007; Liker, 2004; Kilpatrick,
2003; Shah and Ward, 2007
Visual Management
(VISM)
The extent to which value added
information is displayed to everyone.
Hogan, 2009; Dennis, 2007; Adler et al.,
1997; Kasul and Motwani, 1997; Parry and
Turnerz, 2006; Melton, 2005; Kilpatrick,
2003
Kaizen (Continuous
Improvement)
(KAIZ)
The extent to which employees contribute
to the company’s development through
suggestions aiming elimination of all kinds
of wastes.
Alukal, 2007; Bernett and Nentl, 2010;
Adler et al., 1997; Boyer, 1996; Sanchez
and Perez, 2001; Brunet and New, 2003;
Detty and Yingling, 2000; Haak, 2006;
Harari, 1997
Teams
(TEAM)
The extent to which team members with
supplementary skills work together to
achieve common goals.
Sanchez and Perez, 2001; Karlsson and
Ahlstrom, 1996; Detty and Yingling, 2000;
Haak, 2006; Dennis, 2007; Liker, 2004
Workers
Involvement
(WINV)
The extent to which employees are
motivated to participate in continuous
improvement and problem-solving
activities.
Bodek, 2010; Fullerton and Wempe, 2008;
Alukal, 2007; Dibia and Onuh, 2010;
Adler et al., 1997; Boyer, 1996; Dennis,
2007
Value Stream
Mapping
(VSM)
The extent to which the current process is
mapped to make the improvement
opportunities obvious.
Dennis, 2007; Hettler, 2008; Jovag, 2011;
Hettler, 2008; Pepper and Spedding, 2010;
Serrano et al., 2008; Seth and Gupta, 2005
Muda
(MUDA)
The extent to which the process is not
value added.
Dennis, 2007; Liker, 2004; Womack and
Jones, 1996
Operational
Performance
(OPPERF)
The extent to which the firm’s operational
performance indicators focus on the key
operational success factors leading to
financial performance.
Venkatrama and Ramanujam, 1986
Satisfaction with the
lean program
(SATISF)
The extent to which “one’s feelings or
attitudes toward a variety of factors
affecting the situation” are summed.
Legris et al., 2003; Bailey and Pearson,
1983
Production Processes
According to Fine and Hax (1985), the manufacturing operations element is the most
complex and difficult for management. Consequently, when developing integrated business

38
strategy, the most important is the interaction between manufacturing and rest of the
management functions (Fine & Hax, 1985). The range of products and processes is one of the
reasons that the management of manufacturing tasks is more difficult (Skinner, 1969).
Hayes and Wheelwright (1979) proposed the first product–process matrix linking the
process life cycle with the product life cycle. Consequently, the most appropriate manufacturing
process depends on the number of products, degree of standardization, and product volume. The
traditional approach for managing process and technology is matching the process type: job
shop, batch shop, assembly line, and continuous flow with the product characteristics, despite
matching processes having become more complicated because of the new technologies such as
computer-aided design (Fine & Hax, 1985).
Figure 3. The product-process matrix
Source: Hayes, R., and Wheelwright, S. (1979). Link manufacturing process and product life
cycles. Harvard Business Review 57 (1): 133-140

39
Different combinations of technology are needed for every one of the different
production processes: job shop, batch shop, assembly line, and continuous flow (Han, 1997).
Burack (1967) viewed the industrial units along a technological field as follows: at one end, low
volume and general purpose equipment; in the middle is the “mass production” as final assembly
line and high volume assembling; and at the other end, quasi-process and product types using
process flow with high volume and product standardization.
Ballard and Howell (1998) categorized job shops and batch shops as fabricators, and
assembly line and continuous flow as assemblers. Moreover, job shop and batch shop
organizations stress flexibility and speed of response; on the other hand, mass and process
production emphasize reliability, productivity, and lower cost (Han, 1997).
Job shop. The job shop is a firm producing small batches of a large number of different
products requiring a different set of sequences of processing steps (Hayes & Wheelwright, 1984;
Chase & Aquilano, 1995). Moreover, a job shop is a flexible production facility, producing
variety of individual products (Graves, 1986), requiring diverse workstation types with different
product routes and the lack of a dominant flow pattern (Montreuil et al., 1999).
One of the job shop characteristics is a large amount of in-process inventory, making it
difficult to know the exact location of a specific job at a specific time (Hayes & Wheelwright,
1984). Other job shop characteristics are variability in the job demand, constantly changing
product mix, and small to medium volume, which makes it uneconomical to set up a production
line (Montreuil et al., 1999; Hayes & Wheelwright, 1984). Calculating a job shop’s capacity is
very difficult because of their flexible flow path, products produced, and resources used (Hayes
& Wheelwright, 1984). The processing requirement dictates the route of each job through the

40
machine center; consequently, some pattern in the workflow cannot be distinguished because of
the wide variety of jobs and processing requirements (Graves, 1986).
Graves (1986) reported that in the job shop, production control is difficult and cannot be
sophisticated because there is not a dominant workflow. On the other hand, according Oosterman
et al. (2000), pure job shops do not exist because there is a more or less dominant flow. Some
lean principles such as JIT and production leveling are very difficult to apply to a high-level
mass customization environment; as an alternative, the company can increase efficiency of MC
operations through integrating other lean strategies (Stump & Badurdeen, 2009). Moreover, the
implementation of heijunka is very challenging in a high variety production (Huttmeir et al.,
2009). The Toyota production system is working for low variety and high volume productions,
but when applied to a high variety and low volume, kanban and heijunka are not manageable,
machine cells cannot be dedicated to one product, and more complex scheduling techniques are
needed (Masson et al., 2007).
According to Hogan (2005), in order to be profitable, the low volume production needs
the implementation of lean manufacturing. Howard and Newman (1993) described a conversion
of job shop to a just-in-time environment, resulting in labor saving, reduced customer lead-time,
and inventory reduction. With the implementation of JIT, the job shop can convert to a
continuous manufacturing process (Faizul & Lamb, 1996).
Batch Shop. The batch shop is a standardized job shop (Chase & Aquilano, 1995; Hayes
& Wheelwright, 1984). A batch shop process is implemented when the business has a reasonably
stable line of products produced in periodic batches to meet customer requirements or for
inventory (Chase & Aquilano, 1995; Hayes & Wheelwright, 1984). Brown and Mitchell (1997)
described batch shop manufacturing as involving the “….movement of large lots of goods

41
between functionally specialized departments or work centers” (p. 907) with group of employees
performing similar tasks in each department and each batch having different routine and different
process requirements. A batch shop is a standardized job shop with less variety in the product
flow path (Hayes & Wheelwright, 1984). According to Susman and Chase (1986), in the typical
batch system, the parts are usually queued up at workstations. “Batch systems may be subject to
excess work in process, long lead times, scheduling problems, and large rework quantities”
(Brown & Mitchell, 1991, p. 907).
In batch production, the work planning and controlling depends on the degree of
“….complexity and uncertainty inherent in production scheduling tasks” (Reeves & Turner
1972, p. 81). Woodward (1965) found that in batch production, the way work is controlled is
important, because the link between technology and organization is not clear. In addition, the
technical center is a major source of uncertainty; consequently, coordination and standardization
are not well applicable (Reeves & Turner, 1972). Batch production processes are useful for
highly customized products in low volumes (Cooney 2002) because of the high flexibility of the
production resources (Reeves & Turner 1972). In a batch shop environment, production lead-
times are shorter, work in process is less, and forecasting batch completion is easier (Hayes &
Wheelwright, 1984).
In a decision to use batch production, the low production volume is a significant factor
(Cooney, 2002). Batch production may adopt some lean principles, but there is not a lean
transition because producing low volumes of diverse products makes it difficult to balance the
flow, and production leveling is not applicable (Cooney, 2002).

42
Assembly Line. Eswaramoorthi et al. (2011) described the typical assembly line as a
group of workstations with a material handling system and operators performing the assembly
tasks in which the product is moving from workstation to workstation with a goal of achieving
continuous workflow. In an assembly line, the workstations are arranged in the needed sequence,
producing groups of highly similar products (Hayes & Wheelwright, 1984) moving from
workstation to workstation at a controlled rate (Chase & Aquilano, 1995). The assembly line
plays a significant role in both mass production and lean production (Parker, 2003).
High volume, low variety production organizations level the production schedule through
decoupling the internal supply chain from the outbound supply chain (Jina et al., 1997). A mixed
model assembly line refers to producing a variety of given products at the same time (Hayes &
Wheelwright, 1984). The Toyota final assembly lines are mixed product lines, with calculated
production per day (Sugimorit et al., 1997). In some cases, “assembly line is employed as a final
step in a long series of production activities” (Hayes & Wheelwright, 1984, p.178).
Very good performance is achieved through implementing lean in high volume, low
variety situations (Jina et al., 1997). The Toyota production system is developed to solve
problems in such an environment.
Universality of Lean Depends on Different Contextual Factors
Unit and small batch production is characterized by production schedules based on the
firm’s orders; the financial planning is a short term and relies on skills and experiences of the
labor forces (Woodward, 1965, p. 128). Implementing cellular manufacturing in small batch and
one-of-a-kind manufacturing facilities is not an acceptable solution because of the diverse
demand pattern, so Zijm and Kals (1995, p. 429) proposed using flexible planning and control to
manage those complexities. Some of the characteristics of large batch and mass production are

43
longer-term planning, production schedules not dependent on firm orders, and long terms plans
made based on a sales forecast (Woodward, 1965, p. 135).
Most of the lean success stories are from companies with production technology similar
to Toyota: limited product offering, cosmetic customization, high volume, repetitive
manufacturing, and stable or predictable demand (Lander & Liker, 2007). The lean
implementations have not been as successful in low volume-high variety productions because
each job is different and production approaches cannot be standardized; characteristics of the
product create production constraints, and small firms do not possess as many resources as the
large ones, resulting in less flexibility (Pepper & Spedding, 2010). Applicability of lean
principles depends on the level of mass customization and customer’s involvement, despite the
fact that most of the lean principles and tools are applicable to most manufacturing environments
(Stump & Badurdeen, 2009).
The universality of lean applications is dependent upon business conditions (Cooney,
2002). White and Prybutok (2001) found evidence that the implementation of JIT practices is
influenced by the type of production system. According Poppendieck (2002), the principles of
lean are universal, successfully applied in many industries, and successful in improving results.
On the other hand, Shingo (1981) explained that the TPS is universally applicable after
adaptation to the characteristics of each industry or plant. Defined by Toyota, lean tools are
solving Toyota’s problems, but for a specific organization’s problems, specific tools must be
designed and implemented (Lander & Liker 2007).
Contingency Theory
“Contingency theories are a class of behavioral theory that contends that there is no one
best way of organizing/leading and that an organizational/leadership style that is effective in

44
some situations may not be successful in others” (Fiedler, 1964, p./n.a.). The contingency model
is one of the major theories for leadership effectiveness (Mitchell et al., 1970). The effectiveness
of an organization is contingent upon the motivation system of the leader and the “degree to
which the situation itself gives the leader power and influence” (Fiedler, 1972, p. 454); the
different leaders perform well under different conditions. Moreover, using the contingency
model, Leister et al. (1977, p. 645) predicted that the leaders can learn how to “modify their
situational control.” The contingency model suggests that providing human relations training will
improve the leader’s ability to work better with the coworkers and will improve leader-member
relations (Fiedler, 1972). The contingency theory has led to new insights into the leadership
process (Mitchell et al., 1970). The leader’s experience is the major factor determining how
favorable one system is (Fiedler, 1972).
In order for an organization to perform well, the context and structure must somehow fit
together (Drazin & Ven, 1985), or the effectiveness of one organization is contingent on
goodness of fit between structural and environmental variables (Shenhar, 2001). “Contingency
theory assumes that the better the ‘fit’ among contingency variables (e.g., between technology
and organizational structure), the better the performance of the organization” (Weill & Olson,
1989, p. 61). Environment and strategic conditions influence the performance of one particular
organizational structure. Moreover, there is no single structure equally appropriate for all
environmental circumstances, and “no single structure will produce equally good performances
on all performance dimensions; there is typically a trade-off between short run efficiency and
effectiveness, on the one hand, and the adaptability necessary for longer term effectiveness, on
the other” (Ruekert et al., 1985, p. 19). “Each business activity should be categorized by the
characteristic of the task itself, by the nature of the environment, and by the relative importance

45
of alternative performance dimensions” (Ruekert et al., 1985, p. 23). The structural characteristic
of an organizational subunit is dependent on the managerial selection switching rules contingent
on task uncertainty (Drazin & Ven, 1985). Shenhar (2001) proved that “one size does not fit all”
because the different projects have a wide range of variations, and the managerial style is
affected by technological uncertainty and system scope. Higher performing organizations have
strong relationships between structure and context (Drazin & Ven, 1985).
The success of lean is contingent on the organization’s environment context;
consequently, the lean practices will need customization to the organization’s environment
(Browning & Heath, 2009). There is not a “best approach” appropriate for all organizations, and
building a theory of lean has to take into account the moderating factor of contextual variables,
because the lean success is contingent on the organization environmental context (Browning &
Heath, 2009). For successful lean implementation, it is very important to know which of the lean
tools are relevant to which specific environment (Corbett, 2007). Grounded in the contingency
theory and in the universality of lean dependent on different contextual factors (Chapter 2), the
present study hypothesizes the following.
Appropriate Alignment
Different perspectives of the lean concept have to be taken into account when
implementing the lean approach; the organizations must find a production concept that aligns
with the contextual factors and existing production practices (Pettersen, 2009). The alignment
between context and structure is “…adherence to a linear relationship between dimensions of
context and structure” (Drazin & Ven, 1985, p. 519), and “….the degrees to which operational
elements match the business strategy” (Smith & Reece, 1998: p. 158). Moreover, alignment is
the interaction effect that the organizational context and structure have on the organizational

46
performance, with purpose identifying the organizational processes effective for different context
configurations (Drazin & Ven, 1985).
The effectiveness of an organization depends on the quality of fit between structural and
environmental variables, because as contingency theory states: different external conditions may
require different organizational characteristics (Shenhar, 2001). In addition, the organization’s
performance is dependent on the internal alignment (Venkatraman & Camillus, 1984), the
alignment between the organization’s product’s market domain, technology, and organizational
structure and performance (Miles & Snow, 2003), and proper external alignment between
business and manufacturing strategy (Smith & Reece 1998). Higher-performing organizations
have stronger relationships between structure and contest than low-performing organizations
(Drazin & Ven, 1985). The alignment between operational elements and strategy is very
important for organizational performance (Smith & Reece, 1998). The alignment of appropriate
variables results in internally consistency, matching the contextual settings pattern of processes
and structure (Drazin & Ven, 1985).
Because the nature of the alignment is dependent on different contextual factors, the
different industry types have different forms of alignment (Drazin & Ven, 1985).
Summary
This chapter provides a comprehensive literature review of the lean manufacturing
philosophy, the lean tools supporting the system, the need for lean, and the three types of
production processes: job shop, batch shop, and assembly line. The next chapter provides
information on the research methods used for this study, instrument development, validation,
data collection, and data analysis.

47
Chapter 3: Methods
The objectives of this chapter are to discuss the choice of research design and methods,
population and sample, instrument development, pilot testing, validation, data collection
procedure, and appropriate data analysis steps.
Research Methods
This study determined the differences in the level of utilization of the sixteen lean tools
for the three different categories of manufacturing organizations: job shop, batch shop, and
assembly line. In addition, this research investigated which lean tools play major roles for lean
implementation success in the three different categories of manufacturing organizations. In order
to identify the lean tools on which the operational performance of a firm depends, a survey
questionnaire was used for data collection. “Survey research involves acquiring information
about one or more groups of people by asking them questions and tabulating their answers”
(Leedy & Ormrod, 2005; p. 183). Developing a quality instrument is the biggest challenge in
survey research (Passmore & Parchman, 2002). Conducting an online survey has some
advantages: Anonymity facilitates sharing of the participants’ experience, and respondents
directly entered the data in the electronic file (Selm & Jankowski, 2006).
The data analysis for this study involved three major steps: data preparation, descriptive
statistics, and inferential statistics (Trochim, 2006). Use of descriptive statistics is appropriate
when exploring a possible correlation among two or more phenomena or when identifying the
characteristics of the observed phenomena (Leedy & Ormrod, 2005). Inferential statistics is
appropriate for hypothesis testing (Trochim, 2006). Therefore, for the purposes of this study,
descriptive and inferential statistical tools were used.

48
This research consisted of five phases: instrument development, Q-sort pilot testing,
instrument validation, data collection, and data analysis.
Figure 4. Research phases
Population and Sample
The population is defined by Leedy and Ormrod (2005, p. 205) as “…generally homogenous
group of individual units.” The first step when conducting a study is to identify the population
(Creswell, 2009). Consequently, the population for this study was manufacturing leaders,
managers or engineers with knowledge of lean manufacturing, working for manufacturing
companies located in US, that were in some stage of implementing lean and were not involved in
any operations that could be categorized as continuous flow manufacturing. Because of the
limited number of companies in the continuous flow manufacturing setting, researchers did not
expect to collect the number of survey responses needed for data analysis.
The sampling technique used for this study was non-probability convenience sampling:
“it takes people or units that are readily available…” (Leedy & Ormrod, 2005, p. 201). The
sample for this study was manufacturing leaders, managers, and/or engineers of U.S.
Phase 4:
Instrument
Validation
-Content
validity
-Convergent
validity
-Discrimin.
validity
-Reliability
Phase 3:
Data
Collection
-Survey
Phase 2:
Q-sort pilot
testing
Phase 1:
Instrument
development
-Concept
Identification
-Items
Construction
Phase 5:
Data
Analysis
-Descriptive
Statistics
-Inferential
Statistics
49
manufacturing companies, who were members of the Lean Enterprise Institute (LEI) or members
of Continuous Improvement, Six Sigma, and Lean LinkedIn groups. An introductory email and a
hyperlink to the web-based survey were posted in the LEI manufacturing forum and emailed to
700 members of the Continuous Improvement, Six Sigma, and Lean group in LinkedIn.
Instrument Development
To examine the level of use of the lean tools in the different types of manufacturing
categories and to investigate on which lean tools the perceived operational performance of the
firm and the satisfaction with the lean transformation depend, an instrument was developed. A
valid and reliable instrument that was easily understood by the sample was the goal of this step.
The four steps for instrument development, suggested by Davis (1996), included concept
identification, item construction, validity testing, and reliability testing.
Concept identification. The first step of instrument development was identifying what
the tool would measure (Davis, 1996). Moreover, according to Aladwania and Palvia (2002), the
starting point for the measuring process is conceptualization, defining the domain of construct,
and generating items representing the concepts under reflection. Therefore, based on the process
defined in Chapter 2 constructs, the proposed instrument measured (a) the level of adoption of
the sixteen different lean tools identified by the literature review: Just in Time (JIT), Continuous
Flow (CONTFL), Heijunka (HEIJ), Quick set up (QSETUP), Jidoka (JID), Poke-Yoke
(PYOKE), Andon (AND), Standardized Work (STANDW), the Five S’s (FIVES), Total
Productive Maintenance (TPM), Visual Management (VISM), Kaizen (KAIZ), Teams (TEAM),
Workers Involvement (WINV), Value Stream Mapping (VSM) and Muda elimination (MUDA);
(b) the satisfaction with the firm’s lean transformation (SATISF); and (c) the perceived
operational performance of the firm (OPPER). Moreover, questions about the company size,

50
company revenue, number of employees, type of industry, and duration of the lean
implementation were added.
Items construction. The next step of instrument development was item construction,
during which a framework of the instrument was created, reflecting the content area that needed
to be tested (Davis, 1996). Based on the comprehensive review of literature in Chapter 2, a
framework of the instrument was developed (See Table 5) and, as recommended, an item format
was chosen (Davis, 1996). To reflect the purpose of this instrument, researchers selected a
Likert-type scale. When using a Likert-type scale, the responses are numerical, and the
respondents make an evaluation of the statement based on magnitude (Leedy & Ormrod, 2005).
The coding chosen for the Likert-type scale was: 1-strongly disagree, 2-disagree, 3-neutral, 4-
agree, and 5-strongly agree.
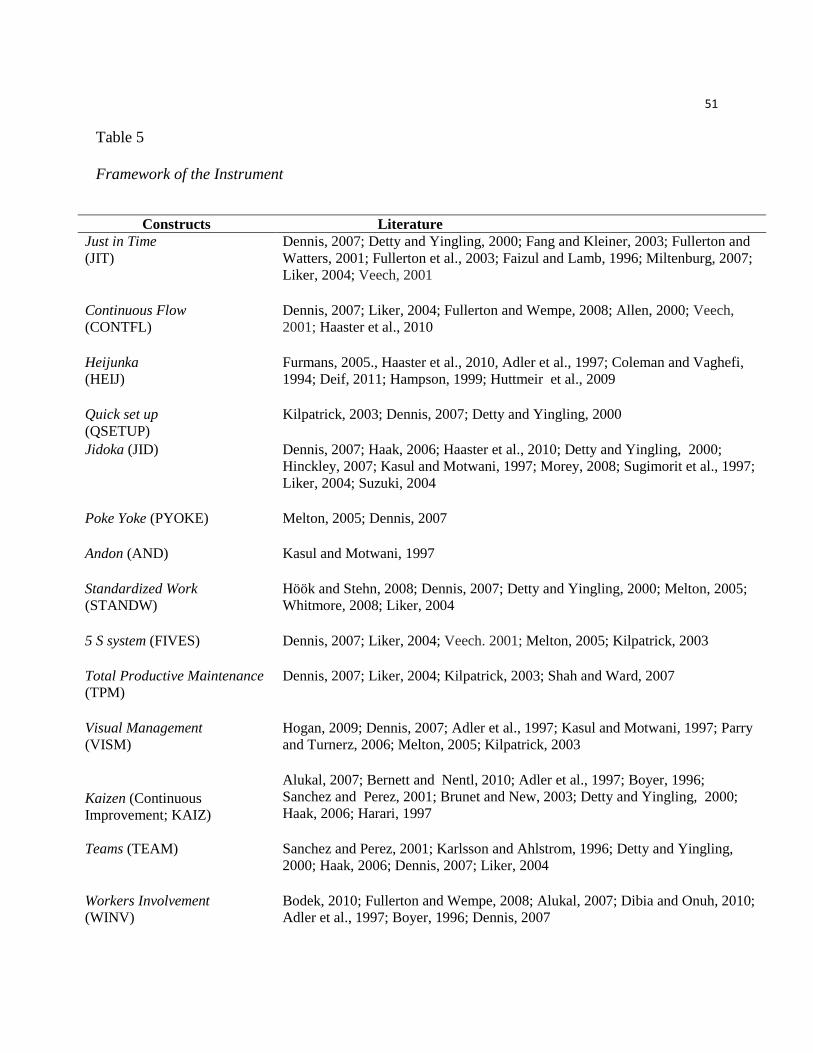
51
Table 5
Framework of the Instrument
Constructs Literature Just in Time (JIT)
Dennis, 2007; Detty and Yingling, 2000; Fang and Kleiner, 2003; Fullerton and
Watters, 2001; Fullerton et al., 2003; Faizul and Lamb, 1996; Miltenburg, 2007;
Liker, 2004; Veech, 2001
Continuous Flow (CONTFL)
Dennis, 2007; Liker, 2004; Fullerton and Wempe, 2008; Allen, 2000; Veech,
2001; Haaster et al., 2010
Heijunka (HEIJ)
Furmans, 2005., Haaster et al., 2010, Adler et al., 1997; Coleman and Vaghefi,
1994; Deif, 2011; Hampson, 1999; Huttmeir et al., 2009
Quick set up (QSETUP)
Kilpatrick, 2003; Dennis, 2007; Detty and Yingling, 2000
Jidoka (JID) Dennis, 2007; Haak, 2006; Haaster et al., 2010; Detty and Yingling, 2000;
Hinckley, 2007; Kasul and Motwani, 1997; Morey, 2008; Sugimorit et al., 1997;
Liker, 2004; Suzuki, 2004
Poke Yoke (PYOKE)
Melton, 2005; Dennis, 2007
Andon (AND) Kasul and Motwani, 1997
Standardized Work (STANDW)
Höök and Stehn, 2008; Dennis, 2007; Detty and Yingling, 2000; Melton, 2005;
Whitmore, 2008; Liker, 2004
5 S system (FIVES) Dennis, 2007; Liker, 2004; Veech. 2001; Melton, 2005; Kilpatrick, 2003
Total Productive Maintenance
(TPM) Dennis, 2007; Liker, 2004; Kilpatrick, 2003; Shah and Ward, 2007
Visual Management (VISM)
Hogan, 2009; Dennis, 2007; Adler et al., 1997; Kasul and Motwani, 1997; Parry
and Turnerz, 2006; Melton, 2005; Kilpatrick, 2003
Kaizen (Continuous
Improvement; KAIZ)
Alukal, 2007; Bernett and Nentl, 2010; Adler et al., 1997; Boyer, 1996;
Sanchez and Perez, 2001; Brunet and New, 2003; Detty and Yingling, 2000;
Haak, 2006; Harari, 1997
Teams (TEAM) Sanchez and Perez, 2001; Karlsson and Ahlstrom, 1996; Detty and Yingling,
2000; Haak, 2006; Dennis, 2007; Liker, 2004
Workers Involvement (WINV)
Bodek, 2010; Fullerton and Wempe, 2008; Alukal, 2007; Dibia and Onuh, 2010;
Adler et al., 1997; Boyer, 1996; Dennis, 2007

52
Value Stream Mapping (VSM)
Dennis, 2007; Hettler, 2008; Jovag, 2011; Hettler, 2008; Pepper and Spedding,
2010; Serrano et al., 2008; Sethy and Gupta, 2005
Muda (MUDA) Dennis, 2007; Liker, 2004, Womack and Jones, 1996
Operational Performance (OPPERF)
Venkatrama and Ramanujam, 1986
Satisfaction with the lean
program (SATISF)
Legris et al., 2003; Bailey and Pearson, 1983
Q-sort pilot testing. In addition to identifying ambiguous survey items, Q-sort pilot
testing was recommended for assessing content validity and convergent validity (Moore &
Benbasat, 1991). Moreover, the Q-sort pilot testing was used to assess the survey items’
readability. Professionals with experience in the fields under study served as judges in the Q-sort
pilot testing. Each judge was asked to sort the various survey items into the appropriate construct
categories (Moore & Benbasat, 1991). Two judges were needed for each round. Different pairs
of judges were used in the different sorting rounds.
Agreement between judges was measured through calculating Cohen’s Kappa (Blackman
& Koval 2000) and making an assessment over the level of agreement across the pairs of judges:
inter-judges raw agreement and placement ratio (Moore & Benbasat, 1991). High inter-judge
agreement and “correct” placement ratio assured a high degree of construct validity (Moore &
Benbasat, 1991).
According to Blackman and Koval (2000, p. 723), “Cohen's Kappa statistic is a very
well known measure of agreement between two raters with respect to a dichotomous outcome.”
A Cohen’s Kappa greater than 0.65 is an acceptable score (Todd & Benbasat, 1989; Moore &
Benbasat, 1991). According to Landis and Koch (1977), perfect agreement is achieved if
Cohen’s Kappa score is between 0.81 and 1.00.

53
For the purpose of this study, four lean professionals were selected and invited to
participate as judges in the Q-sort pilot test. The lean knowledge of the professionals was
confirmed by their lean experience, lean certificates, and lean consulting experience. Structured
interviews were conducted with the first two judges, and a Cohen’s Kappa was calculated. The
agreement between judges had Cohen’s Kappa score less than 0.81; consequently, the survey
items were reduced and clarified as suggested. The second round of the Q sort testing was
conducted with the second set of judges. Reviewing and refining the survey items continued until
the agreement between judges had a Cohen’s Kappa score of at least 0.81.
Validity. Validity testing was the third step suggested by Davis (1996). Validity is the
extent to which “the instrument measure what it is supposed to measure” (Leedy & Ormrod,
2005, p. 28). For the purpose of this study, content validity, convergent validity, and discriminant
validity were tested.
Content validity is the extent to which congruence exists between the survey items
operationalizing the concept and the conceptual definitions (Davis, 1996). “Content validity
refers to how much a measure covers the range of meanings included within a concept” (Babbie,
2007, p. 147). Content validity can be assessed through a comprehensive literature review
(Davis, 1996) and Q-sort pilot testing (Moore & Banbasat, 1991). Based on the comprehensive
literature review, conceptual definitions of the constructs were defined and, in congruence with
them, the survey items were developed (Davis, 1996).
This study adjusted from the empirically validated measurement instruments for
measuring the companies’ lean implementations proposed by Shah and Ward (2007), operational
items for Just in Time (JIT), Continuous Flow (CONTFL), Total Productive Maintenance
(TPM), Workers Involvement (WINV), and Quick Set Up (QSETUP). According Shah and Ward

54
(2007), the tested empirically operational measure is “reliable and meets established criteria for
assessing validity” (p. 28). In addition, one operational item from the instrument developed by
Fullerton and McWatters (2002) was modified: Just in Time (JIT).
This study developed a new measurement scale for Heijunka (HEIJ), Jidoka (JID), Poke-
Yoke (PYOKE), Andon (AND), Standardized work (STANDW), 5S (FIVES), Visual
Management (VISM), Kaizen (KAIZ), Teams (TEAM), Value Stream Mapping (VSM), Muda
Elimination (MUDA), perceived Operational performance (OPPERF), and Satisfaction with the
lean program (SATISF). In order to assess content validity, this study employed a
comprehensive literature review (Davis, 1996) and Q-sort pilot testing (Moore & Banbasat,
1991).
Convergent validity is the extent to which two measures of the same construct are
correlated (Cunningham et al., 2001; Hair et al., 2009). “Convergent validity assesses the extent
to which the measurement items in one construct come together to form a single common
dimension” (Dobrzykowski, 2010, p. 148). If the correlation among the items is high, the
intended scale is measuring the concept (Hair et al., 2009).
Confirmatory factor analysis (CFA) is an acceptable method for evaluating convergent
validity (Cunningham et al., 2001). Bagossi (1982) recommended assessing convergent validity
with at least two measures from two different procedures. Besides the confirmatory factor
analysis, Q-sort pilot testing is another method for measuring convergent validity (Moore &
Benbasat, 1991). Consequently, the convergent validity of the proposed instrument was assessed
through two methods: confirmatory factor analysis using the SmartPLS software and Q-sort pilot
testing.

55
Discriminant validity is defined as the extent to which two conceptually similar concepts
are distinct (Hair et al., 2009). In order to ensure that one construct is different from the other
related constructs, discriminant validity of the investigated constructs was evaluated (Lucas et
al., 1996). One of the suggested methods for assessing discriminant validity is through extracting
average variance (AVE; Fornell & Larcker, 1981). Next, the AVE of each construct is compared
with the estimated correlation between constructs (Segars, 1997). There is evidence of
discriminant validity if the AVE for each construct is greater than the squared correlation
between constructs (Segars, 1997). In order to assess the discriminant validity, SmartPLS
software was employed to calculate the AVE of each construct, which was compared with the
squared correlation between constructs.
Reliability. Reliability testing was the fourth step suggested by Davis (1996). Reliability
is the extent to which the measuring instrument yields the same consistent results independent of
the testing circumstances (Leedy & Ormrod, 2005, p. 29). Test-retest, Cronbach alpha, or other
tools have been used to estimate the reliability of an instrument (Leedy & Ormrod, 2005). Hair et
al. (2009) suggested using the Cronbach alpha coefficient for assessing the consistency of the
entire scale. A perfect relationship is indicated by a Cronbach alpha of 1.00, while small alpha
indicates that the performance of one item is not predictable on the performance of other items
(Davis, 1996). Hair et al. (2009) suggested that the lower limit for Cronbach alpha is 0.60. For
the purpose of this study, Cronbach alpha was calculated to assess reliability of each construct.
Human Subjects Approval
Health and human service (HHS) policy for the protection of human research subject
applies to all research involving human subjects (USDHHS, 2009). According to the EMU
Dissertation Manual (2008, p. 13), “If the doctoral students plan to use human subjects as a part

56
of their research, the first step is to submit a Request for Approval of Research Involving Human
Subjects along with their dissertation proposal to the university human subjects review
committee (UHSRC) at the graduate school.” The first page of the research survey was the
informed consent: The participants were made aware of the research procedure and that they
could change their mind regarding their participation. Request for human subject approval was
submitted to the human subjects review committee, and approval was obtained (Appendix D).
Data Collection
A survey questionnaire was used for data collection. “Survey research involves acquiring
information about one or more groups of people by asking those questions and tabulating their
answers” (Leedy & Ormrod, 2005, p. 183). Selm and Jankowski (2006) suggested using online
surveys for non-probability sampling. Survey Monkey was used for the creation and electronic
distribution of the survey. The survey was anonymous; the participant names were not associated
with their responses. According to Sheehan (2001), the survey response rate is higher when a
single email contains both an introductory letter and a hyperactive link to the survey. A follow-
up email is another method for increasing the response rate (Sheehan & Hoy, 1999). An
introductory email and a hyperlink to the web-based survey were posted in the Lean Enterprise
Institute (LEI) manufacturing forum and were emailed to 700 members of the Continuous
Improvement, Six Sigma, and Lean Group in LinkedIn.
Data Analysis
In most research, the data analysis involves three major steps: data preparation,
descriptive statistics, and inferential statistics (Trochim, 2006). Data preparation refers to
checking the data for accuracy and transforming the data (Trochim, 2006). Use of descriptive
statistics identifies the characteristics of the observed phenomena (Leedy & Ormrod, 2005).

57
Univariate analysis involves the examination of one variable at a time, looking at the
distribution, the central tendency, and the dispersion (Trochim, 2006; Babbie, 2007).
Consequently, in this study the distribution of the data was determined. Next, a central tendency
as mean, median, and mode of the data distribution was estimated. Standard deviation is the most
accurate estimate of dispersion (Trochim, 2006; Babbie, 2007). Finally, the standard deviation of
the data was calculated. Inferential statistics is useful for reaching conclusions beyond the data
(Trochim, 2006). As recommended by Trochim (2006), inferential tools were used for
hypotheses testing in this study.
H1 (Null): There will be no significant difference between the degrees of utilization of
each lean tool when the companies are grouped by the three manufacturing settings: job
shop, batch shop, and assembly line.
In order to test H1, the companies were grouped based on the three manufacturing categories: job
shop, batch shop, and assembly line. This study did not include the continuous flow
manufacturing setting. Because of the limited number of companies in the continuous flow
manufacturing setting, researchers did not expect to collect the number of survey responses
needed for data analysis. In situations in which the total sample can be divided in groups based
on categorical variables, most appropriate is using cluster or discriminate analysis (Hair et al.,
2009). Therefore, a discriminant analysis was performed to distinguish the differences between
the levels of utilization of the 16 identified lean tools to the three types of manufacturing
categories. Moreover, for better visualization, the results of the analysis were plotted in
radar/spider plot.
As an example, based on the literature review and logic, a matrix with predicted results
was generated (See Table 6).

58
Table 6
Expected Level of Application of the Lean Tools
Lean Tools/ Manufacturing Processes Job Shop Batch Shop Assembly Line
Just in Time (JIT) L M H
Continuous Flow (CONTFL) L M H
Heijunka (HEIJ) L M H
Poke –Yoke (PYOKE) L M H
Andon (AND) n/a M H
Quick Set Up (QSETUP) H M L
Jidoka (JID) L M H
Standardized Work (STANDW) L M H
5S(FIVES) H H H
Total Productive Maintenance (TPM) H H H
Visual Management (VISM) H H H
Kaizen(KAIZ) H H H
Teams (TEAM) H H H
Workers Involvement (WINV) H M L
Value Stream Mapping (VSM) L M H
Muda Elimination (MUDA) L M H
Just in Time (JIT) implementation was expected to be low in job shop environment and
higher in batch shop and assembly line environment. One of the job shop characteristics is large
amounts of in process inventory (Hayes and Wheelwright, 1984). Moreover, JIT is very difficult
to apply to a high-level mass customization environment (Stump & Badurdeen, 2009).
Continuous flow (CONTFL) implementation was expected to be low in job shop
environment and gradually to increase in batch shop and assembly line. Continuous flow is
achieved through implementation of manufacturing cells, which are not applicable in small batch
and one of a kind manufacturing facility (Zijm, 1995). In a job shop, dominant flow pattern
cannot be distinguished (Montreuil et al., 1999).
Heijunka (HEIJ) implementation was expected to be low in job shop environment and
gradually to increase in batch shop and assembly line. In high variety production,

59
implementation of Heijunka is very challenging (Huttmeir et al., 2009) because it is very difficult
to balance the flow (Cooney, 2002).
Quick Set Up (QSETUP) implementation was expected to be high in job shop and
gradually to decrease in batch shop and assembly line. According Hayes and Wheelwright
(1984), the set-ups in job shop environment are frequent, in batch shop are some, while in
assembly line are few.
Jidoka (JID) implementation was expected to be low in job shop, medium in batch shop
and high in assembly line. Job shops have many different products (high variety, low volume), so
designing error-proofing devises for a product that will run only one time is not justified.
Standardized Work (STANDW) implementation was expected to be low in a job shop
environment because of the high variety products (each job is different and production
approaches cannot be standardized [Pepper & Spedding, 2010]), moderate in batch shops, and
high in assembly line.
5S (FIVES) implementation was expected to be high in the three different processes: job
shop, batch shop, and assembly line. 5S is the first implemented tool when the lean
transformation starts (Dennis, 2007).
Total Productive Maintenance (TPM) implementation was expected to be equally high in
the three production processes: job shop, batch shop, and assembly line. TPM refers to
preventive maintenance work involving everyone working on the shop floor (Dennis, 2007) in
order to achieve reliable equipment with longer life (Kilpatrick, 2003).
Visual Management (VISM) implementation was expected to be equally high in the three
production processes: job shop, batch shop, and assembly line. Visual management is creating a
self-directing, self-explaining and self-improving workplace (Hogan 2009).

60
Kaizen (KAIZ) implementation was expected to be equally high in the three production
processes: job shop, batch shop, and assembly line. Kaizen refers to employees contributing to
the company development with Muda eliminating suggestions (Boyer 1996).
Teams (TEAM) implementation was expected to be equally high in the three production
processes: job shop, batch shop, and assembly line. Teams are essential for successful lean
manufacturing, resulting in improved quality, shorter cycle time, and lower costs (Jina et al.
1997).
Workers Involvement (WINV) implementation was expected to be high in job shop
because of the higher workers skills compared to moderate in batch shop and low in assembly
line workers skills (Hayes & Wheelwright, 1984).
Value Stream Mapping (VSM) implementation was expected to be implemented at low
level in job shop, moderate in batch shop and high in assembly line processes. Because of the
high variety of products in the job shop environment, use of VSM is not justified.
Muda Elimination (MUDA) implementation was expected to be high in assembly line,
medium in batch shop and low in job shop. Some of the eight identified types of Muda are
characteristics of the job shop and batch shop processes. Parts in typical batch system are queued
up at workstations (Susman & Chase, 1986). Work-in-process inventory is large in job shop,
moderate in batch shop, and small in assembly line (Hayes & Wheelwright, 1984). Moreover,
job shops do not have finished goods inventory; in batch shop it varies; and in assembly line it is
high (Hayes & Wheelwright, 1984).
A spider plot was generated when employing the predicted values of use of the lean tools
in Statgraphics software (See Figure 5). It was expected that testing of Hypothesis 1 would result
in similar Spider Plot.

61
Figure 5. Radar/Spider Plot
Second, to test Hypotheses 2 and 3, SmartPLS was used to investigate whether the type
of manufacturing setting has a moderating effect on the relationships between the lean tools and
perceived operational performance and between the lean tools and satisfaction with the lean
program.
Baron and Kenny (1986) defined moderator as “qualitative or quantitative variable that
affects the direction or the strength of the relation between an independent (predictor) variable
and a dependent (criterion) variable” (p. 1174). The fit between the independent variable and the
moderator is determining the dependent variable, mathematically represented by “Y = f (X, Z, X
• Z) where Y — performance, X = strategy and Z = the contextual variable that fits with strategy
for performance improvement; here X • Z reflects the joint effect of X and Z” (Venkatraman,
1989, p. 425). For the purposes of this research, the dependent variables were (a) perceived
operational performance and (b) satisfaction with the lean program. The independent variables
are the levels of implementation of the sixteen lean tools to the three types of manufacturing

62
categories. Moderator is the type of manufacturing category for job shop, batch shop, and
assembly line. The alignment between the manufacturing category (Z) and the appropriate lean
tools (X) will be determining the dependent variables: satisfaction with lean program or
perceived operational performance (Y). A confirmatory factor analysis using Smart PLS was
performed to investigate whether the perceived operational performance and satisfaction with a
lean program are related to the alignment of appropriate lean tools with the right manufacturing
category.
Summary
This chapter described the research design and methods that were used for this study and
explained the steps used for instrument development. Moreover, the testing of instrument
validity and reliability, data collection, and data analysis were described.

63
Chapter 4: Results
This chapter reports the Q-sort results, response rate, characteristics of the survey
respondents, validity and reliability estimates of the survey instrument, and the results of
hypothesis testing. The data were collected from professionals possessing knowledge of the lean
approach who worked in the manufacturing industry during July, August, and September of
2012. The survey was administered via Survey Monkey web link.
Q-Sort Results
Q-Sort pilot testing was used for assessing content validity and convergent validity,
which produced favorable results. In addition, the number of items was significantly reduced and
readability improved. All sixteen constructs were tested in two rounds. Seventy-four items
entered the first Q-sort round. The inter-judge raw agreement score was 79.72% (59/74), the
placement ratio was 79.05% (117/148), and the Cohen Kappa was 38.8% (See Appendix B).
Based on the first Q-sort round, 23 items on which the first two judges did not agree were deleted
from the survey instrument. In addition, some of the questions were rewritten as suggested.
The revised instrument was tested in the second Q-sort round. The inter-judge raw
agreement was 96.08% (49/51), the placement ratio was 91.18 percent (93/102), and the Cohen
Kappa was 87.80% (See Appendix B). The Cohen Kappa score indicated one almost perfect
agreement between the judges. The placement ratio of 91.18 indicated that the items were placed
where intended (Moore & Benbasat, 1991; See Table 7). The final 51 items were used for the
large-scale survey. The final survey instrument is located in Appendix C.

64
Table 7
Inter-judges’ Agreement
Round 1 Round 2
Inter-judge raw agreement 79.72% 96.08 %
Placement ratio 79.05% 91.18%
Cohen Kappa 38.8% 87.80%
Response Rate
Surveys were distributed to two groups of professionals with knowledge of lean
practices: the members of Lean Enterprise Institute and 700 members of Continuous
Improvement, Six Sigma, and Lean Group in LinkedIn. The response rate for the Lean
Enterprise Institute (LEI) sample was calculated by dividing the number of completed surveys by
the number of LEI members who have seen the introductory letter containing the link to the
survey. The response rate for the Lean Enterprise Institute (LEI) was low because of lack of
interaction with the potential respondents. The response rate for Continuous Improvement, Six
Sigma, and Lean Group was calculated by the number of completed surveys divided by the
number of surveys e-mailed through LinkedIn to the lean professionals working in
manufacturing fields and members of the group. The response rate for the LinkedIn group was
high because each of the potential respondents was contacted individually. The survey response
rate is summarized in Table 8.
Table 8
Response Rate Summary
Surveys Surveys
Completed Response Rate
in Percent
Lean Enterprise Institute 300 59 19.7
Continuous Improvement, Six Sigma Group 700 241 37.9
Total 1000 300 33.3

65
After reviewing the 300 completed surveys, 38 of them were deleted from the database
due to excessive missing values. Another 32 were excluded because their respondents were
based in companies outside of the US, and those do not belong to the defined population in the
study. Twenty-seven more survey responses were taken out of the study because the respondents
reported that their manufacturing setting was not categorized as a job shop, a batch shop, or an
assembly line. In addition, fourteen responses were removed from the study because the survey
respondents reported that their company had not started the lean transformation yet. Overall, 189
survey responses were used for the data analysis (See Table 9).
Table 9
Usable Surveys
Completed
Surveys Respondents
located in USA Respondents in
JS, BS, and
AL
Company
Implementing
Lean
Overall
Usable
surveys Lean Enterprise
Institute 47/59(80%) 35/47 (74%) 27/35 (77%) 23/27 (85%) 23/59 (39%)
Continuous
Improv., Six
Sigma Group
215/241 (89%) 195/215 (91%) 176/195 (90%) 166/176 (94%) 166/241 (69%)
Total
262/300 (87%) 230/262 (88%) 203/230 (88%) 189/203(93%) 189/300 (63%)
Results of Demographic
Job titles of the individual respondents are displayed in Table 10. A large group of the
respondents, 40%, were company executives: 2 CEOs, 2 Global Continuous Improvement
directors, 2 Corporate lean managers, 2 VP of Operations, and 1 VP of Continuous
Improvement. The next largest group of respondents had job titles as Lean Project Manager

66
(21%) and Quality Manager (19%). Thirteen percent of the survey respondents had the job title
of engineer, and 5% had other job titles.
Table 10
Job Titles of Respondents
Job titles Respondents Percentage
Director 41 21.70%
Lean Project Manager 40 21.20%
Quality Manager 36 19%
Engineer 24 12.70%
Plant Manager 21 11.10%
Other 9 4.80%
Production Manager 5 2.70%
Operations Manager 4 2.10%
CEO 2 1%
Global CI Director 2 1%
Corporate Lean Manager 2 1%
VP of Operations 2 1%
VP of Continuous Improvement 1 0.50%
The lean expertise of the individual respondents is displayed in Table 11. The largest
group of respondents (53%) holds Six Sigma Black Belts or Six Sigma Master Black Belts. The
Lean Certificate holders account for 13.8% of the population, and Six Sigma Green Belts holders
make up 21.7%. Survey respondents with lean experience or lean training account for 11.2%.
Table 11
Lean Expertise of Respondents
Lean Expertise Respondents Percentage
Lean Certificate 26 13.8%
Lean Experience 6 3.2%
Lean Training 15 8%
Six Sigma Green Belt 41 21.7%
Six Sigma Black Belt 69 36.5%
Six Sigma Master Black Belt 32 17%

67
The size of the plants in which the respondents worked is displayed in Table 12. Sixty-
seven percent of the respondents reported working in plants which had fewer than 500
employees, 17.7% of the respondents reported working in plants which had between 501 and
1000 employees, 10.8% of the respondents reported working in plants which had between 1001
and 5000 employees, and only 3.4% of the respondents reported working in plants which had
more than 5001 employees.
Table 12
Number of Employees
Number of Employees Respondents Percentage
1-100 33 17.5%
101-250 51 27%
251-500 43 22.7%
501-1000 35 17.7%
1001-5000 20 10.8%
5001 7 3.4%
The manufacturing settings used in the plants are displayed in Table 13. Job shop
manufacturing settings were used in 29.1% of the companies; batch shop-manufacturing settings
were used in 37% of the companies, and assembly line manufacturing settings were used in
33.8% of the companies.
Table 13
Processes
Process Respondents Percentage
Job shop 55 29.1%
Batch shop 70 37%
Assembly line 64 33.8%
The level of implementation of the lean approach of the companies is displayed in Table
14. Forty percent of the companies have implemented lean in some manufacturing processes,

68
46% of the companies have implemented lean in many manufacturing processes, and 14% of the
companies have fully implemented lean.
Table 14
Level of Lean Implementation of Respondents’ Companies
Lean Implementation Respondents Percentage
1. Implemented in some manufacturing processes. 76 40.2%
2. Implemented in many manufacturing processes. 87 46%
3. Fully implemented lean 26 13.8%
The number of years of lean implementation is displayed in Table 15. Fifty-six percent of
the companies have been involved in a lean transition for more than five years, 20% of the
companies for between 2 and 4 years, and 20% of the respondents for less than 2 years.
Table 15
Number of Years of Lean Implementation
Years of lean transition Respondents Percentage
0-2 40 20.2%
2.1-4 39 19.7%
5.1 -6 44 22.2%
6.1-10 42 21.2%
10.1-23 24 12.3%
In summary, 81% of the respondents had job titles as company executive, lean project
manager, and quality manager. Fifty-eight percent of the respondents held Six Sigma Black Belts
or Six Sigma Master Black Belts, and 36% of the respondents had lean certificates or Six Sigma
green belts. All of the respondents’ companies had implemented lean in some manufacturing
process, in many manufacturing processes, or have fully implemented lean. Fifty-six percent of
the companies had been in a lean transition for more than five years.

69
Instrument Validation
After the data preparation step was complete (Trochim, 2006), the measurement
instrument was tested for validity and reliability. First, as recommended by Gaskin (2012),
Exploratory Factor Analysis (EFA) was employed to determine the data structure. Second, the
PLS-SEM was employed as the best approach to assess the measurement model validity and
reliability, in cases when the latent variable’s scores are used in subsequent analysis (Hair et al.,
2012).
EFA defined sets of highly correlated variables: factors (Hair et al., 2005). The linkage of
the items to their underlying factor is described by the Principal Component Analyses (PCA; Di
et al., 2009; Dehghan, 2012). As seen in Table 16, the PCA resulted in Kaiser-Meyer-Olkin
measure of sampling adequacy of 0.904, which is a marvelous result (Gaskin, 2012). Bartlett's
Test of Sphericity proves significant result of .000 (Sig. < 0.001), indicating that the variables
relate to each other (Gaskin, 2012).
Table 16
KMO and Bartlett’s Test
KMO and Bartlett's Test
Kaiser-Meyer-Olkin Measure of Sampling Adequacy. .904
Bartlett's Test of Sphericity
Approx. Chi-Square
7277.818
Df
1275
Sig.
.000
A communality is the total amount of variance, which the original variable shares with
other variables in the analysis (Hair, 2005) and the extent to which an item correlates

70
with all other items (Gaskin, 2012). The communalities of the survey’s items have values
between 0.578 and 0.884, indicating that all survey items are correlated well with each other.
The variance of the data was explained through twelve factors. To identify the variables
with the factor, the component matrix was rotated using the Varimax technique. The rotation
revealed that two questions were not placed in the right group. Consequently, one question from
the Kaizen group— “Our employees participate in rapid improvement events”—and one
question from the Five S group—“We have cleaning responsibilities assigned to the team
members”—were transferred to the Workers’ Involvement group, probably because the concepts
behind Kaizen and Workers’ involvement are overlapping and the specific Five S question is
about the involvement of the employees in the cleaning responsibility.
According to Hair et al. (2005), factor loadings greater than 0.40 are considered
significant, while loadings greater than 0.5 are considered very significant. Twenty-one survey
items had factor loadings greater than 0.70, twenty-one survey items had factor loadings between
0.50-0.70, and the remaining nine survey items had factor leadings between 0.40 and 0.50 (See
Table 17). Consequently, 42 survey items had very significant factor loadings, and nine survey
items had significant factor loading. The factor loadings confirmed the construct validity of the
survey instrument.

71
Table 17
Factor Loading
# Items Cod Survey Items Factor
Loading
Fac
tor
1:
Inv
olv
emen
t of
the
wo
rkin
g i
n t
eam
sho
p f
loor
emp
loy
ee
s
WINV2 Our shop floor employees drive suggestions programs .697
WINV4 Most of our shop floor employees are working in teams .684
WINV3 Our shop floor employees lead production improvement effort .668
WINV1 Our shop floor employees are key to problem solving .626
WINV5 Our employees work to eliminate waste in an outgoing fashion. .557
TEAM1 We have cleaning responsibility assigned to the team members .540
TEAM2 Our shop floor employees are cross trained .443
TEAM3 Our shop floor employees change tasks within the team. .439
Fac
tor
2:
Wo
rk p
lace
org
aniz
atio
n a
nd
mai
nte
nan
ce
TPM2 We maintain all our equipment regularly. .734
TPM3 We maintain excellent records of all equipment maintenance related
activities. .687
TPM1 We dedicate a portion of everyday to planned equipment maintenance
related activities. .630
FIVES3 We keep our workplace organized .518
QSETUP1 Our employees achieve setups that save time. -.496
QSETUP2 We are working to lower setup times in our plant. -.446
FIVES1 We organize our workplace with labeled positions for each tool. .442
QSETUP3 We have low setup times of equipment in our plant -.432
Fac
to
r 5
:
Mu
da MUDA3 Everybody participates in eliminating non-value added activities. .827
MUDA1 Our workers identify non-value added activities. .808
MUDA2 We are working to minimize non-value added activities. .749
Fac
tor
4:
Jid
ok
a
JID2 We detect quality deviations with automated technology. .880
JID3 Most inspections are done by automated technology. .827
JID1 We detect process deviations with automated technology.
.818
Fac
tor
5:
Just
In
Tim
e
JIT2 We do not produce a product unless the customer has order it. .755
JIT4 Production at each station is “pulled” by demand from the next station. .615
JIT6 We produce exactly as many pieces as needed. .604
JIT3 We link all processes to customer demand through Kanban .550
JIT1 We use JIT with our suppliers. .528
JIT5 We use Kanban signals for production control. .479
Fac
tor
6:
Pro
cess
imp
rov
eme
nt
VSM3 We use VSM to improve our production flow. .739
VSM1 We use VSM to eliminate Muda. .679
VSM2 We use VSM to improve our business processes. .630
KAIZ1 Our employees participate in rapid improvement events. .461
KAIZ2 Our employees suggestions are generally implemented .449
Fac
tor
7:
Vis
ual
Man
age
men
t VISM1 We use a visual board to display key information. .726
VISM2 We use visual indicators, signs, and controllers. .705
VISM3 We use simple signals to provide immediate understanding of the
situation. .683
Fac
to
r 8
:
Hei
ju
nk
a
HEDJ2 We do not have picks and valleys in our production schedule. .828
HEDJ3 Our production mix is distributed evenly over time. .797
HEDJ1 Our production volume is distributed evenly over time. .741
Fac
tor
9:
Sta
nd
Wo
rk STANDW2 We use our standards as a basis for improvement. -.797
STANDW3 We change our work process standards as needed for improvement. -.733
STANDW1 Our work processes are standardized. -.608

72 F
acto
r
10
:
Co
nt.
Flo
w CONTFL1 Products are classified into groups with similar processing requirements. .749
CONTFL2 Equipment is grouped to produce a continuous flow of families of
products .715
CONTFL3 Families of products determine our factory layout .628
Fac
to
r 1
1:
Po
ke
Yo
ke PYOKE2 We use simple, inexpensive error-proofing devices. .730
PYOKE3 Our poke-yoke devices are used 100% of the time. .621
PYOKE1 We have poke –yoke devices designed for our work place conditions. .581
Fac
tor
12
:
An
do
n
AND1 Everyone working on the production floor is able to stop the production
line if a defect is detected. .804
AND3 Our employees stop the production line if a defect is detected. .778
AND2 We have a device (cord or button) to stop the production line if a defect is
detected. .643
Second, by using the PLS-SEM procedure, the confirmatory factor analysis (CFA) was
performed to confirm the factor structure that was extracted in the Exploratory Factor Analysis
(EFA; Gaskin, 2012). In addition, the PLS-SEM is the best approach for assessment of the
measurement model if the latent variable’s scores are used in subsequent analysis (Hair et al.,
2011)
In the PLS-SEM, the relationships between unobserved latent variables and their related
observed variables are specified by the outer measurement model (Henseler et al., 2009). The path
relationships between the unobserved latent variables and their related observed variables are
described by a reflective or a formative model (Henseler et al., 2009). When using PLS-SEM,
specification of the measurement model is the first step (Hair et al., 2011). “Measurement model
misspecification is an often observed phenomenon” (Henseler et al., 2009, p. 290). In the
formative measurement model, the direction of causality is from measure to the construct, while
in reflective measurement model the direction of causality is form the construct to measure
(Hoeck et al., 2010). The measurement model in this study is reflective, because the direction of
casualty is from the construct to measure. The coefficients in the PLS-SEM associated with the
reflective measurement model are called outer loadings (Hair et al., 2011). The significance of
the outer loading coefficients confirmed the results from the EFA.

73
Table 18
Outer Loading Coefficient Indicator relationship Outer Loading
Path Coefficient
T-stat
Andon (AND)
AND1 0.877223*** 30.636782
AND2 0.783636*** 17.692996
AND3 0.844223*** 22.731347
Continuous Flow (CONTFL)
CONTFL1 0.827008*** 29.522150
CONTFL2 0.906083*** 45.020181
CONTFL3 0.782387*** 16.488419
Five S (FIVES)
FIVES1 0.906193*** 46.179011
FIVES2 0.913703*** 57.626450
Heijunka (HEIJ)
HEIJ1 0.893855*** 43.800073
HEIJ2 0.865183*** 23.409770
HEIJ3 0.878318*** 25.639323
Jidoka (JID)
JID1 0.944465*** 95.269737
JID2 0.955204*** 104.825624
JID3 0.846036*** 21.816611
Just in Time (JIT)
JIT1 0.700581*** 13.759591
JIT2 0.697774*** 8.562793
JIT3 0.808582*** 23.468050
JIT4 0.815826*** 32.317061
JIT5 0.828956*** 31.052155
JIT6 0.707018*** 12.571980
Kaizen (KAIZ)
KAIZ1 0.887688*** 36.833133
KAIZ2 0.911967*** 57.656742
Muda Elimination (MUDA)
MUDA 0.965380*** 122.527795
MUDA 0.958078*** 97.898385
MUDA 0.966899*** 115.901186
Poke Yoke (PYOKE)
PYOKE1 0.903696*** 51.209612
PYOKE2 0.852261*** 29.944044
PYOKE3 0.815502*** 25.322729
Quick Set Up (QSETUP)
QSETUP1 0.882749*** 50.341729
QSETUP2 0.767795*** 15.594564
QSETUP3 0.782283*** 17.472421
Standardized Work (STANDW)
STANDW1 0.837218*** 25.946189
STANDW2 0.873734*** 21.163717
STANDW2 0.876902*** 36.497927
Teams (TEAM)

74
TEAM1 0.774833*** 18.101564
TEAM2 0.911343*** 63.907891
TEAM3 0.895112*** 47.261526
Total Productive Maintenance (TPM)
TPM1 0.874114*** 42.874565
TPM2 0.925897*** 73.274066
TPM3 0.849836*** 33.315466
Visual Management (VISM)
VISM1 0.905449*** 43.800303
VISM2 0.938092*** 83.683513
VISM3 0.901830*** 60.658748
Value Stream Mapping (VSM)
VSM1 0.826169*** 23.397614
VSM2 0.879980*** 64.174106
VSM3 0.927273*** 53.755007
Workers Involvement (WINV)
WINV1 0.813123*** 21.658996
WINV2 0.885455*** 51.089020
WINV3 0.862399*** 43.164181
WINV4 0.702961*** 12.441757
WINV5 0.839164*** 38.447851 ***Significant at p0.001
According to Hair et al. (2011), the next step of the PLS-SEM measurement assessment
was to examine the measures and to confirm that they represent the construct of interest through
assessing their reliability and validity. A composite reliability greater than 0.70 confirmed the
internal consistency reliability (Hair et al., 2011; See Table 18). The indicator reliability was
confirmed by indicator outer loadings greater than 0.70 (See Table 18).
Convergent validity was established by composite reliability (CR) greater than the
average variance extracted (AVE; Gaskin, 2012). In addition, a sufficient degree of convergent
validity was an AVE value greater than 0.50, “meaning that the latent variable explains more
than half of the indicators variances” (Hair et al., 2011, p. 145). Convergent validity was
established in three ways: (a) CR values greater than the AVE values, (b) all AVE values are
greater than 0.5 (see Table 19), and (c) as recommended by Moore and Benbasat (1991). Q-sort
pilot testing was performed for assessing convergent validity.

75
Table 19
Convergent Validity
Lean Tools AVE Composite Reliability
Andon (AND) 0.6988 0.8741
Continuous Flow (CONTFL) 0.7056 0.8775
5S’s (FIVES) 0.828 0.9059
Heijunka (HEIJ) 0.773 0.9108
Jidoka (JID) 0.8401 0.9402
Just in Time (JIT) 0.5487 0.8777
Kaizen (KAIZ) 0.8098 0.8949
Muda Elimination (MUDA) 0.9282 0.9749
Poke- Yoke (PYOKE) 0.81 0.9275
Quick Set Up (QSETUP) 0.7361 0.8931
Standardized Work (STANDW) 0.6602 0.8531
Teams (TEAM) 0.8003 0.9231
Total Productive Maintenance
(TPM) 0.7444 0.8973
Visual Management (VISM) 0.744 0.8967
Value Stream Management (VSM) 0.7812 0.9145
Workers Involvement (WINV) 0.8377 0.9393
Andon (AND) 0.7723 0.9103
Continuous Flow (CONTFL) 0.6711 0.9101
Discriminant Validity
Discriminant validity determines whether each latent variable shares more variances with
its own manifest items than with other constructs (Fornell & Bookstein, 1982; Chin, 1998). In
the PLS path modeling, the discriminant validity is measured through the Fornell-Larcker
criterion and the cross-loading (Henseler et al., 2009, p. 299). In the Fornell-Larcker criterion,
the discriminant validity is established by the square root of a construct’s AVE greater than the
correlations between constructs (Koufteros, 1999; Koufteros et al., 2001). Found on the diagonal
of Table 20 is the bolded square root of the AVE for each construct, greater than the value of the
correlations in its corresponding row and column, which is evidence of discriminant validity. In
addition, the discriminant validity was confirmed through cross-loadings coefficients, indicating

76
that there is no higher correlation with another latent variable than with its respective latent
variable (Henseler et al., 2009; See Appendix D).

Table 20
Discriminant Validity
* Square Root of each variables AVE is on the diagonal.
AND
CONTF FIVES HEDJ JID JIT KAIZ MUDA POKEY
QSETUP
STANDW
TEAMS TPM
VISMAN
VSM
WINV
AND 0.836 0 0 0 0 0 0 0 0 0 0 0 0 0 0 0
CONTFL 0.337 0.84 0 0 0 0 0 0 0 0 0 0 0 0 0 0
FIVES 0.316 0.420 0.910 0 0 0 0 0 0 0 0 0 0 0 0 0
HEDJ 0.38 0.440 0.314 0.880 0 0 0 0 0 0 0 0 0 0 0 0
JID 0.359 0.345 0.305 0.402 0.917 0 0 0 0 0 0 0 0 0 0 0
JIT 0.412 0.445 0.521 0.557 0.38 0.741 0 0 0 0 0 0 0 0 0 0
KAIZ 0.370 0.36 0.537 0.247 0.337 0.423 0.900 0 0 0 0 0 0 0 0 0
MUDA 0.245 0.452 0.494 0.24 0.290 0.439 0.565 0.963 0 0 0 0 0 0 0 0
POKEY 0.410 0.413 0.455 0.441 0.499 0.527 0.466 0.329 0.858 0 0 0 0 0 0 0
QSETUP -0.374 -0.496 -0.575 -0.379 -0.366 -0.556 -0.459 -0.381 -0.523 0.813 0 0 0 0 0 0
STANDW -0.343 -0.415 -0.521 -0.397 -0.437 -0.520 -0.399 -0.385 -0.492 0.517 0.863 0 0 0 0 0
TEAMS 0.455 0.441 0.697 0.407 0.394 0.581 0.485 0.48 0.540 -0.632 -0.609 0.863 0 0 0 0
TPM 0.411 0.486 0.589 0.398 0.355 0.536 0.541 0.489 0.437 -0.618 -0.504 0.648 0.8839 0 0 0
VISMAN 0.439 0.438 0.571 0.345 0.391 0.52 0.541 0.493 0.587 -0.510 -0.513 0.530 0.5417 0.9153 0 0
VSM 0.316 0.431 0.472 0.274 0.331 0.489 0.631 0.570 0.397 -0.488 -0.456 0.556 0.5302 0.5258 0.879 0
WINV 0.431 0.381 0.590 0.310 0.355 0.529 0.687 0.599 0.476 -0.542 -0.530 0.697 0.5584 0.5007 0.6 0.819
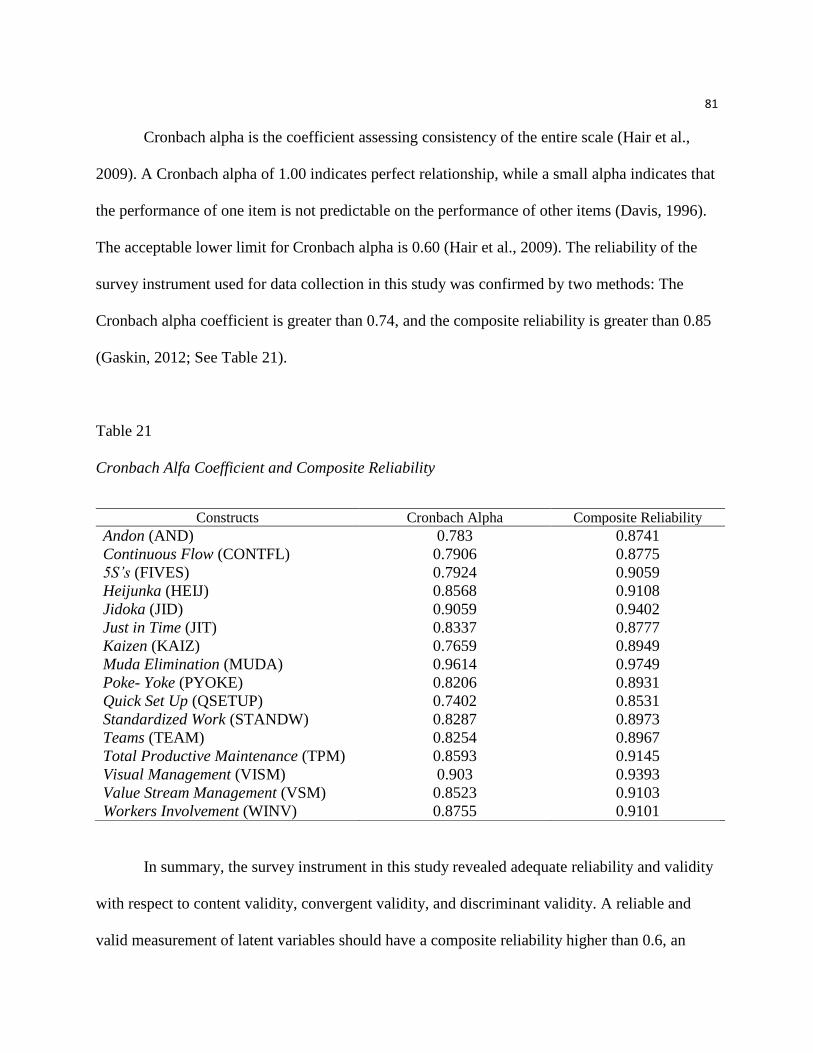
81
Cronbach alpha is the coefficient assessing consistency of the entire scale (Hair et al.,
2009). A Cronbach alpha of 1.00 indicates perfect relationship, while a small alpha indicates that
the performance of one item is not predictable on the performance of other items (Davis, 1996).
The acceptable lower limit for Cronbach alpha is 0.60 (Hair et al., 2009). The reliability of the
survey instrument used for data collection in this study was confirmed by two methods: The
Cronbach alpha coefficient is greater than 0.74, and the composite reliability is greater than 0.85
(Gaskin, 2012; See Table 21).
Table 21
Cronbach Alfa Coefficient and Composite Reliability
Constructs Cronbach Alpha Composite Reliability
Andon (AND) 0.783 0.8741
Continuous Flow (CONTFL) 0.7906 0.8775
5S’s (FIVES) 0.7924 0.9059
Heijunka (HEIJ) 0.8568 0.9108
Jidoka (JID) 0.9059 0.9402
Just in Time (JIT) 0.8337 0.8777
Kaizen (KAIZ) 0.7659 0.8949
Muda Elimination (MUDA) 0.9614 0.9749
Poke- Yoke (PYOKE) 0.8206 0.8931
Quick Set Up (QSETUP) 0.7402 0.8531
Standardized Work (STANDW) 0.8287 0.8973
Teams (TEAM) 0.8254 0.8967
Total Productive Maintenance (TPM) 0.8593 0.9145
Visual Management (VISM) 0.903 0.9393
Value Stream Management (VSM) 0.8523 0.9103
Workers Involvement (WINV) 0.8755 0.9101
In summary, the survey instrument in this study revealed adequate reliability and validity
with respect to content validity, convergent validity, and discriminant validity. A reliable and
valid measurement of latent variables should have a composite reliability higher than 0.6, an

82
indicator loadings higher than 0.7, AVE higher than 0.5, and discriminant validity (Henseler et
al., 2009).
1. Reliability was established by Cronbach alpha coefficients greater than 0.74 (Davis,
1996) and composite reliability coefficients greater than 0.85 (Gaskin, 2012).
2. Content validity was assessed through a comprehensive literature review (Davis, 1996)
and Q-sort pilot testing (Moore & Banbasat, 1991).
3. Internal consistency reliability was confirmed through a Composite reliability greater
than 0.70 (Hair et al. 2011; See Table 19).
4. Indicator reliability was confirmed by indicator outer loadings greater than 0.70 (Hair et
al. 2011; See Table 18).
5. Convergent validity was established by CR values greater than the AVE values, AVE
values greater than 0.5 (Hair et al., 2011) and Q-sort pilot testing (Moore & Benbasat,
1991).
6. Discriminant validity was established through Fornell-Larcker criterion by the square
root of a construct’s AVE, greater than the correlations between constructs (Koufteros,
1999; Koufteros et al., 2001, Hair et al., 2011), and by cross-loading indicating higher
correlation with its latent variable than with other latent variables (Henseler et al., 2009;
Hair et al., 2011; See Appendix D).
Descriptive Statistics
Descriptive statistics identify the characteristics of the observed phenomena (Leedy &
Ormrod, 2005). Univariate analysis involves the examination of one variable at time, looking at
the distribution, the central tendency, and the dispersion (Trochim, 2006; Babbie, 2007). As
recommended by Trochim (2006) and Babbie (2007), the distribution of the data was examined

83
using the MatTab software’s function for distribution fitting, and the result was no perfect
normally distributed data, which is common when using Likert scale (Norman, 2010). The data
distribution is positively or negatively skewed, as seen in Table 21, because the “Likert ratings
are ordinal which in turn means that the distributions are highly skewed” (Norman, 2010, p. 4).
On the other hand, Schwab (n/a) suggested that for data analysis, accepted normality is defined
by skewness and kurtosis between -1 and 1. As seen from Table 21, all of the independent
variables have skewness between -1 and 1, and almost all of the independent variables have
kurtosis between -1 and 1. Only Quick Set Up (QSETUP), Standardized Work (STANDW), and
Kaizen (KAIZ) had kurtosis greater than 1.
Next, a central tendency as the mean, median, and mode of the data was estimated using
SPSS. The central tendency of all latent variables, which were calculated by the average of their
construct variables, is listed in Table 22. The mean, the median, the mode, the standard
deviation, and the variances were calculated for the 189 valid cases. The means of four latent
variables—Heijunka (HEIJ), Quick Set Up (QSETUP), Jidoka (JID) and Standardized Work
(STANDW)—were below 3, while their mode was 2, indicating that the lean tools represented
by the four latent variables are not used in a job shop, a batch shop, and in assembly line
manufacturing settings, while the rest of them—Just in Time (JIT), Continuous Flow
(CONTFL), Poke Yoke (PYOKE), Andon (AND), 5 S’s (FIVES), Total Productive Maintenance
(TPM), Visual Management (VISM), Kaizen (KAIZ), Teams (TEAM), Workers Involvement
(WINV), Value Stream Mapping (VSM) and Muda Elimination (MUDA)—are used in all three
manufacturing settings. In addition, Just in Time (JIT) had mode of 3.83, Poke-Yoke (PYOKE)
had mode of 3.67, and the rest of the lean tools had mode of 4. Standard deviation is the most
accurate estimate of dispersion (Trochim, 2006; Babbie, 2007). Most of the latent variables have

84
a standard deviation between 0.77 and 0.98, while only two variables have a standard deviation
greater than 1: Jidoka (JID) and Muda Elimination (MUDA).
Table 22
Central Tendency of the Utilization of the Lean Tools
N
Mean Median Mode Std. Deviation
Skewness (Std.
Error=0177)
Kurtosis (Std
Error=0352)
Valid Missing
JIT 189 0 3.2063 3.1667 3.83 .87013 -.034 -.472
CONTFL 189 0 3.7019 4.0000 4.00 .86017 -.529 -.195
HEDJ 189 0 2.6631 2.6667 2.00 .98270 .274 -.674
QSETUP 189 0 2.4356 2.3333 2.00 .77498 .790 1.025
JID 189 0 2.7425 3.0000 2.00 1.08428 .019 -.706
PYOKE 189 0 3.2857 3.3333 3.67 .88764 -.354 .103
ANDON 189 0 3.3527 3.3333 4.00 .99358 -.471 -.062
STANDW 189 0 2.1834 2.0000 2.00 .76599 .965 1.546
FIVES 189 0 3.8704 4.0000 4.00 .79082 -.715 .679
TPM 189 0 3.5573 3.6667 4.00 .91406 -.532 -.122
VISM 189 0 3.8871 4.0000 4.00 .78035 -.817 .994
KAIZ 189 0 3.7460 4.0000 4.00 .83095 -.822 1.076
TEAM 189 0 3.7407 4.0000 4.00 .79101 -.825 .925
WINV 189 0 3.5926 3.8000 4.00 .83421 -.455 -.190
VSM 189 0 3.7072 3.6667 4.00 .87052 -.460 -.190
MUDA 189 0 3.5802 4.0000 4.00 1.11095 -.694 -.244
Testing Hypotheses 1
Inferential statistics are useful for reaching conclusions beyond the data (Trochim, 2006).
As recommended by Trochim (2006), inferential statistics were used for hypotheses testing in
this study.
H1 (Null): There will be no significant difference between the degrees of utilization of
each lean tool when the companies are grouped by the three manufacturing settings: job
shop, batch shop, and assembly line.

85
Discriminant analysis was performed to understand if there is a difference between the degrees
of utilization of the sixteen lean tools when the companies are grouped by the three
manufacturing settings: a job shop, a batch shop, and an assembly line. According to Hair et al.
(2009), discriminant analysis is useful if the dependent variable is categorical and the
independent variable is metric. “Discriminant analysis is the appropriate statistical technique for
testing the hypothesis that the group means of a set of independent variables for two or more
groups are equal” (Hair et al., 2009, p. 236). Using the SPSS software, discriminant analysis was
performed to establish whether means of the level of implementation of the lean tools for three
types of manufacturing settings are equal. When performing discriminant analysis, Hair et al.
(2009) recommended following a few steps.
Step 1: Evaluate group differences on a multivariate profile. First the means of the
level of utilization of the sixteen lean tools were calculated for the different groups and were
plotted in a spider diagram.

86
Table 23
Means of Utilization of Sixteen Lean Tools in JS, BS, and AL
Job Shop, N=55 Batch Shop, N=70 Assembly Line, N=64 Total, N=189
Mean
Std.
Deviation Mean
Std.
Deviation Mean
Std.
Deviation Mean
Std.
Deviation
JIT 3.0697 .83622 2.9786 .77133 3.5729 .89328 3.2063 .87013
CONTFL 3.5212 .87668 3.7095 .82809 3.8490 .86461 3.7019 .86017
HEDJ 2.2667 .78672 2.5190 .93876 3.1615 .98667 2.6631 .98270
QSETUP 2.6000 .84230 2.4238 .70178 2.3073 .77733 2.4356 .77498
JID 2.3333 1.01227 2.6000 .99532 3.2500 1.05576 2.7425 1.08428
PYOKE 2.9030 .95511 3.1714 .76084 3.7396 .76398 3.2857 .88764
ANDON 3.0970 1.02374 3.2190 .91311 3.7187 .95990 3.3527 .99358
STANDW 2.4182 .87540 2.2619 .76538 1.8958 .55990 2.1834 .76599
FIVES 3.6636 .87694 3.9071 .73373 4.0078 .74797 3.8704 .79082
TPM 3.4727 .98275 3.5429 .89761 3.6458 .87665 3.5573 .91406
VISM 3.6909 .89086 3.8000 .74730 4.1510 .64222 3.8871 .78035
KAIZ 3.4909 .97890 3.7500 .72106 3.9609 .75227 3.7460 .83095
TEAM 3.5818 .90089 3.6905 .73408 3.9323 .72052 3.7407 .79101
WINV 3.5055 .91640 3.5171 .77384 3.7500 .81416 3.5926 .83421
VSM 3.5879 1.03829 3.6714 .75607 3.8490 .82280 3.7072 .87052
MUDA 3.3515 1.28527 3.6286 1.03333 3.7240 1.01411 3.5802 1.11095
Figure 6. Means of utilization of sixteen lean tools in JS, BS, and AL.

87
As seen in Figure 6, there was a visible difference between the degree of utilization of the
sixteen lean tools in a job shop, a batch shop, and assembly line manufacturing settings.
Just in Time (JIT) was not used in the job shop and batch shop (µ≈3) but is used in the
assembly line (µ=3.6). Continuous Flow (CONTFL) was used in all three manufacturing
settings: job shop (µ=3.52), batch shop (µ= 3.71) and assembly line (µ=3.85). Heijunka (HEIJ) is
not used in job shop and batch shop (µ3) but is used in assembly line (µ=3.16). Quick Set Up
(QSETUP) is not used in all three manufacturing settings (µ3). Jidoka (JID) is not used in job
shop and batch shop (µ3) but is used in assembly line (µ=3.25). Poke-Yoke (PYOKE) is not
used in job shop (µ3) but is used in batch shop (µ=3.17) and assembly line (µ=3.74). Andon
(AND) is used in all three manufacturing categories: job shop (µ=3.10), batch shop (µ=3.22) and
assembly line (µ=3.72). Standardized Work (STANDW) is not used in all three: job shop, batch
shop, and assembly line (µ3). 5S’s (FIVES), Total Productive Maintenance (TPM), Visual
Management (VISM), Kaizen (KAIZ), Teams (TEAM), Workers Involvement (WINV), Value
Stream Mapping (VSM), and Muda Elimination (MUDA; µ>3) are used in all three
manufacturing settings (See Table 23).
Second, tests of the Equality of Group Means were perfumed in order to understand if
there is a significant difference between the three groups.

88
Table 24
Tests of Equality of Group Means
Wilks' Lambda F df1 df2 Sig.
JIT .907 9.552 2 186 .000
CONTFL .977 2.179 2 186 .116
HEDJ .857 15.539 2 186 .000
QSETUP .977 2.149 2 186 .120
JID .877 13.003 2 186 .000
PYOKE .850 16.354 2 186 .000
ANDON .928 7.250 2 186 .001
STANDW .921 8.018 2 186 .000
FIVES .969 2.983 2 186 .053
TPM .994 .542 2 186 .583
VISM .938 6.155 2 186 .003
KAIZ .950 4.931 2 186 .008
TEAM .967 3.201 2 186 .043
WINV .982 1.739 2 186 .178
VSM .985 1.431 2 186 .242
MUDA .981 1.782 2 186 .171
As seen in Table 24, there is a statistically significant difference between the means of
the level of utilization of Just in Time (JIT; p=0.000), Heijunka (HEIJ; p= 0.000), Jidoka (JID;
p=0.000), Poke-Yoke (PYOKE; p=0.000), Andon (AND; p= 0.001), Standardized Work
(STANDW; p=0.000), Visual Management (VISM; p=0.003), Kaizen (KAIZ; p= 0.008), and
Teams (TEAM; p= 0.043) lean tools from one manufacturing setting to another. On the other
hand, there is not a statistically significant difference between the means of the level of
utilization of Continuous Flow (CONTFL), Quick Set Up (QSETUP), Total Productive
Maintenance (TPM), Workers Involvement (WINV), Value Stream Mapping (VSM), and Muda
Elimination (MUDA) from one manufacturing setting to another, while the 5S’s (FIVES)

89
(p=0.053) was very close to being significant. The significance states that there is a high
probability that the difference in means is not due to chance (Creswell, 2012).
Third, a multiple range test was performed to determine if there is a statistically
significant difference between the means of utilization of the lean tools in the different groups
when paired two by two: job shop and batch shop, job shop and assembly line, and batch shop
and assembly line manufacturing settings.
Table 25
Differences in Means Between Job Shop, Batch Shop, and Assembly Line (Multiple Range Test)
N Job shop-
Batch Shop
Batch shop-
Assembly line
Job shop-
Assembly line
Andon (AND) 189 0.0907403 -0.594411*** -0.50367**
Continuous Flow (CONTFL) 189 -0.188156 -0.140103 -0.328259*
5S’s (FIVES) 189 -0.252779 -0.642576*** -0.895355***
Heijunka (HEIJ) 189 0.175818 0.117125 0.292943
Jidoka (JID) 189 -0.266325 -0.649857*** -0.916182***
Just in Time (JIT) 189 -0.268117 -0.568429*** -0.836545***
Kaizen (KAIZ) 189 -0.121662 -0.500179** -0.621841**
Muda Elimination (MUDA) 189 0.156468 0.365933** 0.52240***1
Poke- Yoke (PYOKE) 189 -0.243506 -0.10067 -0.344176*
Quick Set Up (QSETUP) 189 -0.0702727 -0.103562 -0.173835
Standardized Work (STANDW) 189 -0.109442 -0.350536** -0.459977**
Teams (TEAM) 189 -0.259091 -0.210938 -0.470028**
Total Productive Maintenance (TPM) 189 -0.109 -0.241188 -0.350187*
Visual Management (VISM) 189 -0.0116883 -0.232857 -0.244545
Value Stream Management (VSM) 189 -0.0845455 -0.177219 -0.261764
Workers Involvement (WINV) 189 -0.277364 -0.09475 -0.372114
***p 0.000, **p 0.01, *p 0.05
There is no statistically significant difference between the means of the level of
utilization of the lean tools in job shop-batch shop groups. There is a statistically significant
difference between the means of the level of utilization of Just in Time (JIT; p 0.000), Heijunka
90
(HEIJ; p 0.000), Jidoka (JID; p 0.000), Poke-Yoke (PYOKE; p 0.000), Andon (AND; p
0.01), Standardized Work (STANDW; p 0.01), and Visual Management (VISM; p 0.01) lean
tools in the batch shop-assembly line groups. There is a statistically significant difference
between the means of the level of utilization of JIT (p 0.01), Continuous Flow (CONTFL; p
0.05), Heijunka (HEIJ; p 0.000), Jidoka (JID; p 0.000), Poke-Yoke (PYOKE; p 0.000),
Andon (AND; p 0.01), Standardized Work (STANDW; p 0.000), 5S’s (FIVES; p 0.05),
Visual Management (VISM; p 0.01), Kaizen (KAIZ; p 0.01), and Teams (TEAM; p 0.05)
lean tools in the batch shop-assembly line groups (See Table 25). Consequently, based on the
three types of analysis, there are proven group differences on a multivariate profile.
Step 2: Research design and sample size. Three groups discriminant analysis was
performed. The three types of manufacturing settings—job shop, batch shop, and assembly
line—were used as a categorical dependent variable. “The most appropriate independent
variables are those that differ across at least two of the groups of the dependent variable” (Hair et
al. 2009, p. 249). The independent variables that significantly differed across the groups were
Just in Time (JIT), Heijunka (HEIJ), Jidoka (JID), Poke-Yoke (PYOKE), Andon (AND),
Standardized Work (STANDW), Visual Management (VISM), Kaizen (KAIZ), and Teams
(TEAM).
Hair et al. (2009) recommend using a ratio of the sample size to the number of predictor
variables, with value of 20. The sample size in this study is 189 observations. The independent
variables that differ across at least two of the groups are nine. The ratio of observations to
predictors variables is 189/9=21, which is larger than the suggested ratio value of 20. In addition,
the discriminant analysis requires the sample size of each group to be at least 20 observations

91
(Hair et al., 2009). The number of cases in the smallest group (job shop), is 55 cases, which is
larger than the suggested number of 20 cases.
Step 3: Assumptions of discriminant analysis. The first assumption is normality of
independent variables (Hair et al., 2009). Standardized Work (STANDW) had kurtosis of 1.546;
consequently, the variable was transformed to acceptable normality with a logarithmic
transformation. In addition, Kaizen (KAIZ) had kurtosis of 1.076, but neither transformation
transformed the variable to acceptable normality. A caution should be added to the findings
(Schwab, n/a).
The second assumption is “unknown, but equal dispersion and covariance structure for
the groups as defined by the dependent variable” (Hair et al. 2009, p. 251). The equal dispersion
is tested with Box’s M test. The non-significant probability level indicates that differences
between the group covariance matrices do not exist (Hair et al. 2009). The Box’s M test resulted
in Box’s M of 18.812, F of 1.529, and significance of 0.106, which is greater than 0.05,
indicating that the dispersion and population covariance matrices are equal.
Step 4: Estimation of the discriminant model, assessing overall fit and interpretation
of the results. First, the classification accuracy was calculated before removing the outliers. The
result was 49.2% of cross-validated grouped cases, correctly classified. As recommended by
Schwab (n/a), the critical value for Mahalanobis D2 was calculated. Five cases with Mahalanobis
D2 larger than the critical value of 23.1 were removed from the analysis. The new classification
accuracy was 53% of cross-validated grouped cases correctly classified.
“Stepwise method is useful when the researcher wants to consider a relatively large
number of independent variables for inclusion in the function” (Hair et al., 2009, p. 254). Nine
independent variables, significantly different across the three groups, were identified in this

92
study, so stepwise method was performed as the most appropriate. In the stepwise method, at
each step, the variable that maximizes the Mahalanobis distance between the two closest groups
is entered (SPSS, 2012). The two closest groups with no significant difference between them are
job shop and batch shop groups.
Table 26
Variables Entered/Removed
Variables Entered/Removeda,b,c,d
Step
Min. D Squared
Exact F
Entered Statistic Between Groups Statistic df1 df2 Sig.
1 KAIZ .093 1 and 2 2.715 1 180.000 .101
2 JIT .157 1 and 2 2.279 2 179.000 .105
3 HEDJ .247 1 and 2 2.379 3 178.000 .071
At each step, the variable that maximizes the Mahalanobis distance between the two closest groups is entered.
a. Maximum number of steps is 18.
b. Maximum significance of F to enter is .05.
c. Minimum significance of F to remove is .10.
d. F level, tolerance, or VIN insufficient for further computation.
As shown in Table 26: Variables Entered/Removed, Heijunka (HEIJ; D2=0.247) is the
best predictor, followed by Just in Time (JIT; D2=0.157) and Kaizen (KAIZ; D2=0.0.93). Those
three variables are included in the model to get the best possible prediction. Those three variables
describe the differences between job shop and batch shop manufacturing settings.

93
Table 27
Wilks’ Lambda
Wilks' Lambda
Step
Number of
Variables Lambda df1 df2 df3
Exact F
Statistic df1 df2 Sig.
1 1 .945 1 2 180 5.264 2 180.000 .006
2 2 .867 2 2 180 6.608 4 358.000 .000
3 3 .810 3 2 180 6.613 6 356.000 .000
The model is the best fit of data with just one predictor, two predictors, or with all three
predictors. The Wilks’ Lambda is statistically significant for all three options, which means that
all three predictors add predictive power to the discriminant function (Table 27). Discriminant
analysis estimated one less discriminant function than there are groups (Hair et al., 2009; See
Table 28).
Table 28
Eigenvalues of Functions 1 and 2
Eigenvalues
Function Eigenvalue % of Variance Cumulative % Canonical Correlation
1 .193a 84.6 84.6 .402
2 .035a 15.4 100.0 .185
a. First 2 canonical discriminant functions were used in the analysis.
Table 29
Wilks’ Lambda of Functions 1 and 2
Wilks' Lambda
Test of Function(s) Wilks' Lambda Chi-square Df Sig.
1 through 2 .810 37.827 6 .000
2 .966 6.206 2 .045

94
The stepwise analysis identified two statistically significant discriminant functions. The
Wilks’ lambda statistics for the test of function 1 through 2 (chi-square=37.827) had a significant
probability of 0.000. The Wilks’ lambda statistics for the test of function 2 (chi-square= 6.206)
had a significant probability of 0.045 (See Table 29).
The squared canonical correlation’s value suggests the percent of the variation in the
grouping variable, which the model explains (Agresti, 1996). “Wilks’ lambda also shows the
proportion of the total variance in the discriminant scores not explained by differences among the
groups” (Leles et al., 2009, p. 911). Values of Wilks’ lambda close to one indicate small
differences between the dispersions (Lopez & Sanchez, 2009). The result is not surprising due to
their being no significant difference between the level of utilization of the lean tools in job shop
and batch shop manufacturing categories.
Table 30
Discriminant Function Coefficients
Standardized Canonical Discriminant Function Coefficients
Function
1 2
JIT .284 -1.079
HEDJ .706 .459
KAIZ .312 .751
The predictive equations for both functions are (See Table 30):
DF1=0.284*JIT+0.706*HEDJ+0.312*KAIZ
DF2= -1.079 *JIT+0.459*HEDJ +0.751*KAIZ (Cook, 2010)

95
Table 31
Functions at Group Centroids
Function 1 separates the assembly line (the positive value of .592) from job shop
(negative value of -0.422) and batch shop (negative value of -0.232) settings. Function 2
separates batch shop (the positive value of .215) from job shop (negative value of -0.244) and
assembly line (negative value of -0.145) settings (See Table 31).
Table 32
Prior Probabilities for Groups
Prior Probabilities for Groups
PROCESS Prior
Cases Used in Analysis
Unweighted Weighted
1 .273 50 50.000
2 .383 70 70.000
3 .344 63 63.000
Total 1.000 183 183.000
If the cross-validated classification accuracy rate is significantly higher than the accuracy
attainable by chance alone, means that the independent variables are useful predictor of
membership in the groups defined by the dependent variables (Schwab, n/a). Schwab (n/a)
Functions at Group Centroids
PROCESS
Function
1 2
Job Shop -.422 -.244
Batch Shop -.232 .215
Assembly Line .592 -.045
Unstandardized canonical discriminant functions evaluated at group means

96
suggested calculating the proportional by chance accuracy rate by squaring and summing the
proportion of cases in each group from the table of prior probabilities for groups:
(0.2732+0.3832+0.3442 =0.3395; See Table 32).
Table 33
Classification Results
Classification Resultsb,c
PROCES
S
Predicted Group Membership
Total 1 2 3
Original Count 1 19 20 11 50
2 9 40 21 70
3 3 21 39 63
% 1 38.0 40.0 22.0 100.0
2 12.9 57.1 30.0 100.0
3 4.8 33.3 61.9 100.0
Cross-validateda Count 1 18 21 11 50
2 9 40 21 70
3 3 21 39 63
% 1 36.0 42.0 22.0 100.0
2 12.9 57.1 30.0 100.0
3 4.8 33.3 61.9 100.0
a. Cross validation is done only for those cases in the analysis. In cross validation, each case is classified by the
functions derived from all cases other than that case.
b. 53.6% of original grouped cases correctly classified.
c. 53.0% of cross-validated grouped cases correctly classified.
An acceptable cross-validated classification accuracy rate should be 25% or more, higher
than the proportional by chance accuracy rate (Schwab, n/a). The cross-validated accuracy rate
computed by SPSS was 53.0 percent, which was greater than the proportional by chance
accuracy criteria of 42.44% (1.25 x 33.95 = 43.7%; See Table 33). The criterion for classification
accuracy is satisfied.

97
Figure 7. Territorial Map
Consequently, the H1 (Null) “There will be no significant difference between the degrees
of utilization of each lean tool when the companies are grouped by the three manufacturing
settings: Job shop, Batch shop and Assembly line” is rejected for Just in Time (JIT), Heijunka
(HEIJ), Jidoka (JID), Poke-Yoke (PYOKE), Andon (AND), Standardized Work (STANDW),
Visual Management (VISM), Kaizen (KAIZ) and Teams (TEAM), which are with significantly
different means of utilization in the three groups. Moreover, taken into account that there is no
statistically significant difference between the means of utilization of the lean tool in the job
shop-batch shop group, the discriminant analysis identified two discriminant functions between
Batch Shop
Job Shop
Assembly Line

98
the three groups under investigation (Figure 7). The discriminant functions revealed significant
relationship between the three groups—a job shop, a batch shop, and an assembly line—and the
lean tools contributing most to the group separation: Heijunka (HEIJ), Just in Time (JIT), and
Kaizen (KAIZ).
Testing Hypothesis Two and Three
When the research objectives are theory development or prediction, the preferred analysis
method is PLS (Hair et al., 2011). A PLS method was used for testing Hypothesis 2, asking if the
type of manufacturing setting has a significant moderating effect on the relationship between the
lean tools and the operational performance as perceived by the respondents. A PLS method was
also used for testing Hypothesis 3, which asks if the type of manufacturing setting has a
significant moderating effect on the relationship between the lean tools and the managers’
satisfaction with the lean program as perceived by the respondents. Validity and reliability of the
measurement model were assessed (Hair et al., 2011) and reported in the instrument validation
section of Chapter 4. The next step is calculating the inner path model (Hair et al. 2011). The
inner path model specifies the relationships between unobserved variables (Hensler, 2010) and
refers to “the number of path relationships directed at a particular construct” (Hair et al., 2012, p.
420).
PLS and moderating effect. Baron and Kenny (1986) defined moderator as a
“qualitative or quantitative variable that affects the direction or the strength of the relation
between an independent (predictor) variable and a dependent (criterion) variable” (p. 1174). The
causes of moderating effects are called “moderator variables” or just “moderators” (Henseler &
Fassott, 2010). Partial least squares (PLS) path modeling is suitable for testing moderating
effects (Dijkstra & Henseler, 2011). “When the moderator variable is categorical (as, e. g., sex,

99
race, class) it can be used as a grouping variable without further refinement” (Henseler &
Fassott, 2010, p. 720). The moderator variable in this study is categorical (manufacturing
category: a job shop, a batch shop, and an assembly line) and is used as grouping variable. As
recommended by Henseler and Fassott (2010), multiple group analysis was performed. First, a
model with the direct effects was estimated for the main model without the moderating effect.
Second, after the observations were grouped by the manufacturing category—job shop, batch
shop, and assembly line—the model with the direct effects was estimated separately for each
group of observations. “Differences in the model parameters between the different data groups
are interpreted as moderating effects” (Henseler & Fassott, 2010; p. 720). Analyzing the
moderating effect required two steps: (a) testing “whether the path coefficient capturing the
moderating effect differs significantly from zero” and (b) assessing the strength of the identified
moderating effect (Henseler & Fassott, 2010).
Step 1: Determine the significance of moderating effects. As recommended by Chain
(2010), a T-test based on the estimates and standard errors generated by bootstrapping was
executed (Yi & Gong, 2010). T-test was the primary approach for group comparison (Keil et al.,
2000). “In the case of group comparisons, the researcher is interested in whether certain path
coefficients differ across groups” (Henseler & Fassott, 2010, p. 730). Bootstrap resampling
analysis was conducted in order to obtain the significance of the differences between the path
coefficients in the different groups. The number of cases were set to be equal to the number of
observations in the original sample (Hair et al., 2011). The critical t values for a two-tailed test
are 1.65 for significance levels that equal 10%, 1.96 for significance levels that equal 5%, and
2.58 for significance levels that equal 1% (Hair et al., 2011).

100
Table 34
Perceived Operational Performance, Path Coefficient, and T-Statistic
OPPERF All
Path
coefficient
T
Statistics
All
OPPERF
Job shop
Path
coefficient
T
Statistics
Job shop
OPPERF
Batch Shop
Path
coefficient
T
Statistics
Batch
shop
OPPERF
Assembly Line
Path coefficient
T
Statistics
Assembly
Line
AND -0.068155 1.126116 -0.034245 0.404212 -0.054981 0.468839 0.110906 0.670141
CONTFL -0.013460 0.238095 -0.010606 0.123620 0.018096 0.135708 -0.044770 0.393405
FIVES 0.034659 0.471431 -0.112160 0.934603 -0.044910 0.301841 0.336747 1.638077
HEDJ 0.069313 1.395758 0.108583 1.611218 0.097016 0.571843 0.095864 0.718843
JID 0.004586 0.097762 -0.025258 0.300346 -0.090058 0.877738 0.103077 0.894746
JIT 0.011999 0.168822 0.070653 0.690563 -0.146609 1.160259 0.164352 1.002056
KAIZ 0.004845 0.064102 -0.062136 0.486912 0.030675 0.232004 0.117436 0.728235
MUDA 0.258483*** 3.621143 0.236774** 2.173435 0.304932** 2.120111 0.189797 1.481658
PYOKE -0.070640 1.164158 -0.055809 0.582526 -0.138707 1.062338 -0.031848 0.301452
QSETUP -0.048820 0.695072 -0.238181* 1.902134 0.197955 1.466122 -0.065078 0.349129
STANDW -0.025434 0.347686 0.072864 0.701521 -0.397256*** 2.667475 0.319406** 2.465131
TEAM -0.051764 0.641822 -0.064244 0.471210 -0.017878 0.118232 -0.267945 1.127320
TPM 0.097675 1.289909 0.026824 0.200703 0.142351 1.162062 0.046393 0.324893
VISM 0.117006* 1.713482 0.105979 0.958570 0.031291 0.200680 -0.007115 0.054290
VSM 0.142564** 2.189890 0.196648 1.581094 0.152615 1.120590 0.226371* 1.821356
WINV 0.414434*** 4.423209 0.522829*** 3.496109 0.434641*** 2.582732 0.286799 1.544459
*Significant at p ≤0.1
**Significant at p ≤0.05
*** Significant at p ≤0.01
First, the direct effect path coefficient for the main model without the moderating effect
was estimated, and the significance of the path coefficients was examined by performing a
bootstrapping analysis. Statistically significant is the coefficient for the path from MUDA to
OPPERF (β=0.258483***, t=3.621143or p=0.01), from VISM to OPPERF (β=0.117006*,
t=1.713482 or p=0.10), from VSM to OPPERF (β=0.142564**, t=2.189890 or p=0.05), and from
WINV to OPPERF (β=0.414434***, t=2.189890 or p=0.05; See Table 34).
Second, the direct effect path coefficient was estimated only for the job shop model. The
significance of the path coefficients was examined by performing a bootstrapping analysis.

101
Statistically significant is the coefficient for the path from MUDA to OPPERF (β=0.236774,
t=2.173435 or p=0.05), from WINV to OPPERF (β=0.522829, t= 3.496 or p=0.01), and
QSETUP (β=-0.238181, t= 1.902134 or p=0.10), while the results for the path from HEDJ to
OPPERF (β= 0.108583, t= 1.611218) and from VSM to OPPERF (β= 0.196648, t= 1.581094)
are very close to significant.
Third, the direct effect path coefficient was estimated only for the batch shop model. The
significance of the path coefficients was examined by performing a bootstrapping analysis.
Statistically significant is the coefficient for the path from MUDA to OPPERF (β=0.236774,
t=2.120111or p=0.05), STANDW to OPPERF (β=0.397256***, t=2.667475 or p=0.01), and
WINV to OPPERF (β=0.434641***, t= 2.582732or p=0.01), while the results for the path from
QSETUP to OPPERF (β= 0.197955, t= 1.466122) are very close to significant.
Fourth, the direct effect path coefficient was estimated only for the assembly line model.
The significance of the path coefficients was examined by performing a bootstrapping analysis.
Statistically significant is the coefficient for the path from STANDW to OPPERF
(β=0.0.319406**, t=2.465131or p=0.05) and from VSM to OPPERF(β=0.226371*, t= 1.821356
or p=0.10), while the results for the path from FIVES to OPPERF (β= 0.336747, t= 1.638077),
from MUDA to OPPERF (β= 0.189797, t= 1.481658), and from WINV to OPPERF (β=
0.286799, t= 1.544459) are very close to significant.

102
Table 35
Satisfaction with the Lean Program, Path Coefficient, and T-Statistic
SATISF All
Path
coefficient
T
Statistics
All
SATISF
Job Shop
Path
coefficient
T
Statistics
Job Shop
SATISF
Batch Shop
Path
coefficient
T
Statistics
Batch
Shop
SATISF
Assembly
Line
Path
coefficient
T Statistics
Assembly
Line
AND -0.01714 0.25461 -0.12388 0.828221 -0.00124 0.010292 0.106164 0.638687
CONTFL 0.129047 1.49186 0.004565 0.029998 -0.22157* 1.748651 0.385634** 2.423373
FIVES -0.02389 0.281138 -0.14099 0.626949 0.032057 0.180606 0.061629 0.351637
HEDJ 0.03164 0.489685 0.2293* 1.757913 0.013638 0.118586 -0.17618 0.972079
JID -0.02737 0.467527 -0.11814 0.831186 0.131883 1.212365 -0.05532 0.416998
JIT 0.068911 0.9002 0.041305 0.247616 0.107736 0.882324 0.297097 1.315472
KAIZ 0.051176 0.516525 0.292192 1.285892 -0.13348 0.828779 0.106431 0.484066
MUDA 0.03973 0.508552 0.16382 0.80512 0.151184 1.108891 -0.11803 0.775903
PYOKE -0.01421 0.185345 -0.07644 0.529373 0.129553 0.990006 -0.14426 0.814672
QSETUP -0.06881 0.779541 -0.2607 1.27001 -0.08737 0.658403 -0.10185 0.454726
STANDW 0.012809 0.149423 -0.11437 0.478825 -0.12359 0.846612 0.094812 0.528993
TEAM 0.157453 1.415461 0.231816 0.915596 -0.12074 0.72583 0.290601 1.080544
TPM 0.047079 0.607119 -0.04121 0.182376 0.136204 0.936075 0.035803 0.188153
VISM 0.259103*** 2.578752 0.120196 0.575314 0.245837 1.389948 0.096473 0.540956
VSM 0.096786 1.191904 0.165677 0.715301 0.081616 0.488922 0.014255 0.089012
WINV 0.128218 1.152364 -0.10847 0.354536 0.357362* 1.880079 -0.04327 0.154435
*Significant at p ≤0.1
**Significant at p ≤0.05
*** Significant at p ≤0.01
First, the direct effect path coefficient was estimated for the main model without the
moderating effect, and the significance of the path coefficients was examined by performing a
bootstrapping analysis. Statistically significant is the coefficient for the path from VISM to
SATISF (β=0.259103***, t=2.578752, p=0.01; See Table 35).
Second, the direct effect path coefficient was estimated only for the job shop model. The
significance of the path coefficients was examined by performing a bootstrapping analysis.

103
Statistically significant is the coefficient for the path from HEDJ to SATISF (β=0.2293*,
t=1.757913, p=0.10).
Third, the direct effect path coefficient was estimated only for the batch shop model. The
significance of the path coefficients was examined by performing a bootstrapping analysis.
Statistically significant is the coefficient for the path from CONTFL to SATISF (β=0.22157*,
t=1.748651, p=0.10) and from WINV to SATISF (β=0.357362*, t= 1.880079, p=0.1).
Fourth, the direct effect path coefficient was estimated only for the assembly line model.
The significance of the path coefficients was examined by performing a bootstrapping analysis.
Statistically significant is the coefficient for the path from CONTFL to SATISF (β=0.385634**,
t=2.423373 or p=0.05), while the results for the path from JIT to SATISF (β= 0.297097, t=
1.315472) are very close to significant.
Step 2: Determining the strength of moderating effects. “Differences in the model
parameters between the different data groups are interpreted as moderating effects” (Henseler &
Fassott, 2010: p. 720). Hair et al. (2011) described exogenous variables as latent constructs
without structural path relationships, while the endogenous variables are the target constructs,
explained through the structural model relationships. In Figure 8, the influence of the exogenous
variable on the endogenous variable, without moderating effect, is described by the coefficient b.
The path coefficient d indicates the extent to which the exogenous variable’s influence on the
endogenous variable changes because of the moderating effect (Henseler & Fassott, 2010;
Henseler et al., 2009).

104
Figure 8. Detecting a moderating effect (d) through group comparisons. Source: Henseler and
Fassott, 2010, p. 721.
As recommended by Henseler and Fassott (2010), the moderating effect d was detected
through group comparison of the path coefficients for the different manufacturing categories and
calculated by d =b (1) -b (2). The moderating effect d of the different manufacturing categories on
the perceived operational performance was calculated (See Table 36).

105
Table 36
Moderating Effect d, for Perceived Operational Performance
OPPERF All
Path
coefficient
(b1)
OPPERF JS
Path
coefficient
(b2)
Job Shop
D=b2-b1
OPPERF BS
Path
coefficient
(b3)
Batch Shop
D=b3-b1
OPPERF AL
Path
coefficient
(b4)
Assembly
Line
D=b4-b1
AND -0.068155 -0.034245 0.03391 -0.054981 0.013174 0.110906 0.179061
CONTFL -0.013460 -0.010606 0.002854 0.018096 0.031556 -0.044770 -0.03131
FIVES 0.034659 -0.112160 -0.14682 -0.044910 -0.07957 0.336747 0.302088
HEDJ 0.069313 0.108583 0.03927 0.097016 0.027703 0.095864 0.026551
JID 0.004586 -0.025258 -0.02984 -0.090058 -0.09464 0.103077 0.098491
JIT 0.011999 0.070653 0.058654 -0.146609 -0.15861 0.164352 0.152353
KAIZ 0.004845 -0.062136 -0.06698 0.030675 0.02583 0.117436 0.112591
MUDA 0.258483*** 0.236774** -0.02171 0.304932** 0.046449 0.189797 -0.06869
PYOKE -0.070640 -0.055809 0.014831 -0.138707 -0.06807 -0.031848 0.038792
QSETUP -0.048820 -0.238181** -0.18936 0.197955 0.246775 -0.065078 -0.01626
STANDW -0.025434 0.072864 0.098298 -0.397256*** -0.37182 0.319406** 0.34484
TEAM -0.051764 -0.064244 -0.01248 -0.017878 0.033886 -0.267945 -0.21618
TPM 0.097675 0.026824 -0.07085 0.142351 0.044676 0.046393 -0.05128
VISM 0.117006* 0.105979 -0.01103 0.031291 -0.08572 -0.007115 -0.12412
VSM 0.142564** 0.196648 0.054084 0.152615 0.010051 0.226371* 0.083807
WINV 0.414434*** 0.522829*** 0.108395 0.434641*** 0.020207 0.286799 -0.12764
*Significant at p ≤0.1
**Significant at p ≤0.05
*** Significant at p ≤0.01
The path coefficients between the lean tools and OPPERF All described the effect of
different lean tools on the perceived operational performance when the moderator variable is
zero. The path coefficients between the lean tools and OPPERF job shop described the effect of
the lean tools on the perceived operational performance for a job shop manufacturing settings.
The path coefficient d was calculated as a difference between the path coefficients without
moderator and the job shop’s path coefficients. The positive path coefficient d indicated positive
moderating effect, while the negative path coefficient d indicated negative moderating effect.
The job shop has a positive moderating effect on the interaction between the lean tools and

106
perceived operational performance for Andon (AND), Continuous Flow (CONTFL), Heijunka
(HEIJ), Just in Time (JIT), Poke-Yoke (PYOKE), Standardized Work (STANDW), Value Stream
Mapping (VSM), and Workers Involvement (WINV).
Path coefficients between the lean tools and perceived operational performance in batch
shop setting described the effect of the lean tools on the perceived operational performance for
batch shop manufacturing settings. The path coefficient d was calculated as a difference between
the path coefficients without moderator and the batch shop’s path coefficients. The batch shop
manufacturing setting had a positive moderating effect on the interaction between the lean tools
and perceived operational performance for Andon (AND), Continuous Flow (CONTFL),
Heijunka (HEIJ), Kaizen (KAIZ), Muda Elimination (MUDA), Quick Set Up (QSETUP), Teams
(TEAM), Total Productive Maintenance (TPM), Value Stream Mapping (VSM), and Workers
Involvement (WINV).
The path coefficients between the lean tools and perceived operational performance in the
assembly line settings described the effect of the lean tools on the perceived operational
performance for assembly line manufacturing settings. The path coefficient d was calculated as a
difference between the path coefficients without moderator and the assembly line path
coefficients. The assembly line manufacturing setting had a positive moderating effect on the
interaction between the lean tools and perceived operational performance for Andon (AND), 5S’s
(FIVES), Heijunka (HEIJ), Jidoka (JID), Just in Time (JIT), Kaizen (KAIZ), Poke-Yoke
(PYOKE), Standardized Work (STANDW), and Value Stream Mapping (VSM).

107
Table 37
Moderating Effect, Satisfaction with the Lean Program
SATISF All
Path
coefficient
(b1)
SATISF JS
Path
coefficient
(b2)
Job Shop
D=b2-b1
SATISF
BS
Path
coefficient
(b3)
Batch
Shop
D=b3-b1
SATISF AL
Path
coefficient
(b4)
Assembly
Line
D=b4-b1
AND -0.017138 -0.12388 -0.106742 -0.00124 0.015898 0.106164 0.123302
CONTFL 0.129047 0.004565 -0.124482 -0.22157* -0.350618 0.385634** 0.256587
FIVES -0.023894 -0.140987 -0.117093 0.032057 0.055951 0.061629 0.085523
HEDJ 0.03164 0.2293* 0.19766 0.013638 -0.018002 -0.17618 -0.20782
JID -0.027368 -0.118142 -0.090774 0.131883 0.159251 -0.05532 -0.027949
JIT 0.068911 0.041305 -0.027606 0.107736 0.038825 0.297097 0.228186
KAIZ 0.051176 0.292192 0.241016 -0.133477 -0.184653 0.106431 0.055255
MUDA 0.03973 0.16382 0.12409 0.151184 0.111454 -0.11803 -0.157762
PYOKE -0.014205 -0.076441 -0.062236 0.129553 0.143758 -0.14426 -0.13005
QSETUP -0.068809 -0.260698 -0.191889 -0.087367 -0.018558 -0.10185 -0.03304
STANDW 0.012809 -0.11437 -0.127179 -0.123588 -0.136397 0.094812 0.082003
TEAM 0.157453 0.231816 0.074363 -0.120737 -0.27819 0.290601 0.133148
TPM 0.047079 -0.041214 -0.088293 0.136204 0.089125 0.035803 -0.011276
VISM 0.259103*** 0.120196 -0.138907 0.245837 -0.013266 0.096473 -0.16263
VSM 0.096786 0.165677 0.068891 0.081616 -0.01517 0.014255 -0.082531
WINV 0.128218 -0.108469 -0.236687 0.357362* 0.229144 -0.04327 -0.171491 *Significant at p ≤0.1
**Significant at p ≤0.05
*** Significant at p ≤0.01
The path coefficients between the lean tools and managers’ satisfaction with the lean
program for all described the effect of different lean tools on the satisfaction with the lean
program when the moderator variable is zero. The path coefficients between the lean tools and
managers’ satisfaction with the lean program for job shop setting described the effect of the lean
tools on the satisfaction with the lean program for job shop manufacturing settings. The path
coefficient d was calculated as a difference between the path coefficients without moderator and
the job shop’s path coefficients. The job shop has a positive moderating effect on the interaction
108
between the lean tools and the satisfaction with the lean program for HEIJ (d= 0.19766), MUDA
(d=0.12409), KAIZ (d=0.241016), TEAM (d= 0.074363), and VSM (d=0.068891; See Table
37).
The path coefficients between the lean tools and managers’ satisfaction with the lean
program in the batch shop setting described the effect of the lean tools on the satisfaction with
the lean program for batch shop manufacturing settings. The path coefficient d was calculated as
a difference between the path coefficients without moderator and the batch shop’s path
coefficients. The batch shop had a positive moderating effect on the interaction between the lean
tools and the satisfaction with the lean program for Andon (AND), 5S’s (FIVES), Jidoka (JID),
Just in Time (JIT), Muda Elimination (MUDA), Poke-Yoke (PYOKE), Total Productive
Maintenance (TPM) and Workers Involvement (WINV).
The path coefficients between the lean tools and managers’ satisfaction with the lean
program in the assembly line setting described the effect of the lean tools on the satisfaction with
the lean program for the assembly line manufacturing settings. The path coefficient d was
calculated as a difference between the path coefficients without moderator and the path
coefficients for assembly line manufacturing setting. The assembly line manufacturing setting
had a positive moderating effect on the interaction between the lean tools and the satisfaction
with the lean program for Andon (AND), Continuous Flow (CONTFL), 5S’s (FIVES), Just in
Time (JIT), Kaizen (KAIZ), Standardized Work (STANDW), and Teams (TEAM).
Moreover, the moderating effect was assessed by “comparing the proportion of variance
explained (as expressed by the determination coefficient R2) of the main effect model (i. e. the
model without moderating effect) with the R2 of the full model (i. e. the model including the
moderating effect”; Henseler & Fassott, 2010, p. 732; See Table 38). “R² values of 0.75, 0.50, or

109
0.25 for endogenous latent variables in the structural model can, as a rule of thumb, be described
as substantial, moderate, or weak, respectively” (Hair et al., 2011, p. 145). In addition, as
Henseler and Fassott (2010) recommended, the effect size f2 was calculated with the formula f=
(R2 [model with moderator] - R2 [model without moderator])/ (1- R2 [model with moderator]).
“Moderating effects with effect sizes f 2 of 0.02 may be regarded as weak, effect sizes from 0.15
as moderate, and effect sizes above 0.35 as strong” (Henseler et al., 2009).
Table 38
Moderating Effect of Manufacturing Category on Perceived Operational Performance
R Square f2 Moderating effect OPPERF All 0.714686*
OPPERF Job shop 0.904364** 1.98 Very strong OPPERF Batch Shop 0.697727* -0.056 Negative OPPERF Assembly Line 0.775719** 0.272 Moderate
R square: *moderate, ** substantial
In the main model describing the relationship between the lean tools and the perceived
operational performance, R2 equals 0.71 (moderate), which means that the lean tools explain
71% of the variance in the perceived operations performance. On the other hand, after examining
the relationships between the lean tools and the perceived operational performance in the
different manufacturing categories, R2 increased to 0.90 (substantial) for a job shop, indicating
positive moderating effect; decreased to 0.69 (moderate) for a batch shop, indicating a negative
moderating effect; and increased to 0.78 (substantial) for an assembly line, indicating a positive
moderating effect. In addition, as recommended by as Henseler and Fassott (2010), the effect
size f 2 was calculated, resulting in 1.98 (very strong moderating effect) for job shop,
-0.056 (negative moderating effect) for batch shop, and 0.272 (moderate moderating effect) for
an assembly line.

110
There is a moderating effect of the different manufacturing settings on the relationship
between the lean tools and perceived operational performance. The perceived operational
performance depends on different lean tools for a job shop, batch shop, and an assembly line. R2
for the job shop is 0.90 (substantial), which means that 90% of the variance in the operational
performance is explained by the job shop lean tools. R2 for the batch shop is 0.70 (moderate),
which means that 70% of the variance in the perceived operational performance is explained by
the batch shop lean tools. R2 for the assembly line is 0.78 (substantial), which means that 78% of
the variance in the perceived operational performance is explained by the assembly line lean
tools.
Table 39
Moderating Effect of Manufacturing Category on Satisfaction with the Lean Program
R Square F2 Moderating effect
SATISF All 0.575291*
SATISF Job shop 0.695129* 0.393 Strong
SATISF Batch Shop 0.659987* 0.249 Moderate
SATISF Assembly Line 0.638079* 0.173 Moderate R square: * moderate
In the main model of the relationship of lean tools and satisfaction with the lean program,
R2 equals 0.58 (moderate), which means that the lean tools explain 58% of the variance in the
satisfaction with the lean program (See Table 39). On the other hand, after examining the
relationships between the lean tools and the satisfaction with the lean program in the different
manufacturing settings, R2 increased from 0.58 to 0.70 (moderate) for a job shop, indicating
positive moderating effect; increased from 0.58 to 0.66 (moderate) for a batch shop; and
increased from 0.58 to 0.64 (moderate) for an assembly line, indicating a positive moderating
effect. In addition, as recommended by Henseler and Fassott (2010), the effect size f2 was

111
calculated, resulting in 0.39 (strong moderating effect) for a job shop, 0.25 (moderate moderating
effect) for a batch shop, and 0.272 (moderate moderating effect) for an assembly line.
There is a moderating effect of the different manufacturing settings on the relationship
between the lean tools and the satisfaction with the lean program. The satisfaction with the lean
program depends on different lean tools for a job shop, a batch shop, and an assembly line. R2
for the job shop is 0.70 (moderate), which means that 70% of the variance in the satisfaction with
the lean program is explained the job shop lean tools. R2 for the batch shop is 0.66 (moderate),
which means that 66% of the variance in the satisfaction with the lean program is explained by
the batch shop lean tools. R2 for the assembly line is 0.64 (moderate), which means that 64% of
the variance in the satisfaction with the lean program is explained by the assembly line lean
tools.
The moderating effect of the manufacturing category on the relationship of lean tools –
perceived operational performance suggests that the lean performance depends on different lean
tools for a job shop, a batch shop, and an assembly line.
H2(Null): The type of manufacturing setting will not have significant moderating effect
on the relationship between the lean tools and the operational performance as perceived
by the respondents.
The job shop manufacturing setting is a very strong moderator (f2= 1.92) on the
relationship: lean tools – perceived operational performance. The R2 for the job shop is 0.90,
which means that 90% of the variance in the perceived operational performance depends on the
job shop lean tools. The statistical analysis provided support for rejecting the null Hypothesis 2
for job shop manufacturing settings. The lean tools affecting the perceived operational
performance of the firm in job shop manufacturing settings are (a) Workers Involvement

112
(WINV), (b) Muda Elimination (MUDA), (c) Negative Quick Set Up (QSETUP), (d) Heijunka
(HEIJ) and (e) Value Stream Mapping (VSM).
Batch shop manufacturing setting is a negative moderator (f2= -0.056) on the
relationship: lean tools – perceived operational performance. R2 for the batch shop is 0.70,
which means that 70% of the variance in the perceived operational performance depends on the
batch shop lean tools. The statistical analysis provides support for accepting Hypothesis 2 for
batch shop manufacturing settings. The lean tools affecting the perceived operational
performance in a Batch shop-manufacturing setting are (a) Workers Involvement, (b) Muda
Elimination (MUDA), (c) Negative Standardized Work (STANDW), and (d) Quick Set Up
(QSETUP).
Assembly line manufacturing category is a moderate moderator (f2= 0.27) on the
relationship: lean tools – perceived operational performance. R2 for the assembly line is 0.78,
which means that 78% of the variance in the perceived operational performance is explained by
the assembly line lean tools. The statistical analysis provides support for rejecting Hypothesis 2c
for assembly line manufacturing settings. The lean tools affecting the perceived operational
performance in assembly line-manufacturing settings are (a) Standardized Work (STANDW), (b)
Value Stream Mapping (VSM), (c) 5S’s (FIVES), (d) Muda Elimination (MUDA) and (e)
Workers Involvement (WINV).
H3(Null): The type of manufacturing setting will not have significant moderating effect
on the relationship between the lean tools and managers’ satisfaction with the lean
program, as perceived by the respondents.
The job shop is a strong moderator (f=0.39) on the relationship with lean tools –
satisfaction with the lean program. The R2 for the job shop is 0.70 (moderate), which means that

113
70% of the variance in the satisfaction with the lean program is explained by the job shop lean
tools. The statistical analysis provides support for rejecting Hypothesis 3 for job shop
manufacturing settings. The only lean tool affecting the satisfaction with lean program in job
shop manufacturing settings is Heijunka (HEIJ). This suggests for example, that if job shops are
concerned with the satisfaction with the lean program, the most important lean tool is Heijunka
(HEIJ).
The batch shop is a moderate moderator (f=0.25) on the relationship lean tools –
satisfaction with the lean program. The R2 for the batch shop is 0.66 (moderate), which means
that 66% of the variance in the satisfaction with the lean program is explained by the batch shop
lean tools. The statistical analysis provides support for rejecting Hypothesis 3 for batch shop
manufacturing settings. The lean tool affecting the satisfaction with lean program in batch shop-
manufacturing settings is Workers Involvement (WINV), while Continuous Flow (CONTFL) is
negatively affecting the satisfaction. This suggests for example, that if batch shops are concerned
with the satisfaction with the lean program, the most important lean tools are Workers Involvement
(WINV) and negative Continuous Flow (CONTFL).
The assembly line is a moderate moderator (f= 0.17) on the relationship lean tools –
satisfaction with the lean program. The R2 for the assembly line-manufacturing setting is 0.64
(moderate), which means that 64% of the variance in the satisfaction with the lean program is
explained by the assembly line lean tools. The statistical analysis provides support for rejecting
Hypothesis 3 for assembly line manufacturing settings. The only lean tool significantly affecting
the satisfaction with lean program in the assembly line manufacturing settings is Continuous
Flow (CONTFL). This suggests for example, that if assembly lines are concerned with the
satisfaction with the lean program, the most important lean tool is Continuous Flow (CONTFL).

114
Chapter Summary
This chapter reported the response rate for both groups of lean professionals: the Lean
Enterprise Institute and the Continuous Improvement, Six Sigma, and Lean Group. In addition,
this chapter provided the demographic characteristics of the survey respondents. Validity of the
measurement instrument was estimated through exploratory factor analysis, which defines sets of
highly correlated factors. The variance of the data was explained through twelve factors. In
addition, the convergent and discriminant validity were estimated through confirmatory factor
analysis. Reliability was established by calculating a Cronbach alpha coefficients and composite
reliability coefficients. Discriminant analysis was used to test Hypothesis 1 resulting in rejecting
the null hypothesis for Just in Time (JIT), Heijunka (HEIJ), Jidoka (JID), Poke-Yoke (PYOKE),
Andon (AND), Standardized Work (STANDW), Visual Management (VISM), Kaizen (KAIZ),
and Teams (TEAM). In addition, two discriminate functions were identified. A PLS method was
used for testing Hypotheses 2 and 3. Hypothesis 2 was rejected for job shop and assembly line
settings, while it was accepted for batch shop settings. Hypothesis 3 was rejected for job shop,
batch shop, and assembly line settings. The findings and implications will be discussed in the
next chapter.

115
Chapter 5: Discussion, Conclusions, and Implications
Based on the results reported earlier, this chapter presents the findings, discusses their
applications in the real world settings, and proposes conclusions relevant to the overall effort.
The final section identifies the study limitations and provides suggestions for future research.
The previous chapter provided evidence that job shop, batch shop, and assembly line
settings have different levels of utilization for each of the sixteen lean tools. In addition, the
perceived operational performance of firms with job shop, batch shop, and assembly line settings
is associated with different lean tools for the three manufacturing settings. Furthermore, the
managers’ satisfaction with the lean program is related to different lean tools for job shop, batch
shop, and assembly line settings. This study revealed that the type of manufacturing setting
moderates the relationships between the lean tools and the perceived operational performance of
the firms as well as the relationships between the lean tools and the managers’ satisfaction with
the lean program. A summary of the findings is provided under each of the following headings.
Discussion of Findings and Conclusions
Research Question 1, “Are the sixteen lean tools perceived by respondents to be equally
utilized in job shop, batch shop, and assembly line manufacturing settings?” was addressed by
testing Hypothesis 1.
The null Hypothesis 1 was rejected for each of the following lean tools: Just in Time
(JIT), Heijunka (HEIJ), Jidoka (JID), Poke Yoke (PYOKE), Andon (AND), Standardized Work
(STANDW), Visual Management (VISM), Kaizen (KAIZ), and Teams (TEAM), which have
significantly different means of utilization in the three manufacturing settings. When examined
more closely, the results revealed that there was no significant difference between two of the

116
manufacturing settings groups, the job shop and batch shop groups, which is not surprising
because Hayes and Wheelwright (1984) described the batch shop as a standardized job shop with
a stable line of products. To explore the differences in the level of utilization of each lean tool in
all three manufacturing settings, a discriminant analysis procedure was used. The discriminant
analysis identified two statistically significant discriminant functions with acceptable cross-
validated classification accuracy rates. Both functions were calculated based on the utilization
ratings for Heijunka (HEIJ), Just in Time (JIT), and Kaizen (KAIZ). The discriminant analysis
was based on Mahalanobis D2, which is the minimum squared distance. Both functions
discriminated between all three groups: job shop, batch shop, and assembly line. The
discriminant functions revealed that a significant relationship exists among the three groups. The
lean tools that produced the greatest differences among the settings are Heijunka (HEIJ), Just in
Time (JIT), and Kaizen (KAIZ).
Since the Five S’s (FIVES) is typically the first tool implemented when the lean
transformation begins (Dennis, 2007), it was expected that the level of utilization of the Five S’s
(FIVES) would be the same in the three manufacturing settings. In addition, it was expected that
the level of utilization of Visual Management (VISM) would be the same in the three
manufacturing settings, because Visual Management (VISM) refers to creating a self-directing,
self-explaining, and self-improving workplace (Hogan 2009). Since Kaizen (KAIZ) is defined as
the employees’ contribution to the company development by providing Muda-eliminating
suggestions (Boyer 1996), it was expected that the level of utilization of Kaizen (KAIZ) would
be the same in all three manufacturing settings.
This study revealed that there was a statistically significant difference in the levels of
utilization of Visual Management (VISM) in a batch shop-assembly line group and in a job shop-

117
assembly line group. In addition, there was a statistically significant difference in the level of
utilization of the Five S’s (FIVES) and Kaizen (KAIZ) in the job shop-assembly line group. This
result is of particular interest, because based on the concepts behind these three lean tools, they
would appear to be equally applicable to all three manufacturing settings.
Another interesting finding was that the Quick Set Up (QSETUP) and Standardized Work
(STANDW) tools are not used at all in the three manufacturing settings (M 3, µ3). The use of
Standardized Work (STANDW) was expected to be low in a job shop environment because of
the high variety products (each job is different, and production approaches cannot be
standardized; Pepper and Spedding, 2010), moderate in a batch shop, and high in an assembly
line environment. It was surprising that the assembly line manufacturing setting used
Standardized Work (STANDW) even less than the job shop and batch shop settings, because
very good performance is achieved through implementing lean in high volume/low variety
situations (Jina et al., 1997) such as an assembly line setting. Standardized Work (STANDW) is
the foundation of lean manufacturing (Whitmore, 2008) and provides a base for improvement
(Dennis, 2007). If Standardized Work (STANDW) was not being used, what then would be the
basis for process improvements, which the companies must continue to pursue? The level of
utilization of Quick Set Up (QSETUP) was expected to be high in a job shop and lower in a
batch shop and an assembly line. According to Hayes and Wheelwright (1984), the set-ups in a
job shop environment are frequent, in a batch shop less frequent, and in an assembly line far less
frequent. The use of Quick Set Up (QSETUP) in a job shop manufacturing settings should be
investigated further.
The data analysis revealed that Total Productive Maintenance (TPM), Workers
Involvement (WINV), Value Stream Mapping (VSM), and Muda Elimination (MUDA) are

118
almost equally utilized in all three manufacturing settings. It was expected that Total Productive
Maintenance (TPM) and Workers Involvement (WINV) would be equally utilized. Total
Productive Maintenance (TPM) refers to preventive maintenance work involving everyone
working on the shop floor (Dennis, 2007) in order to achieve reliable equipment with longer life
(Kilpatrick, 2003), while the Workers Involvement (WINV) is the extent to which employees are
motivated to participate in continuous improvement and problem-solving activities (Bodek,
2010; Fullerton and Wempe, 2008). On the other hand, it was expected that Value Stream
Mapping (VSM) would be implemented at a low level in a job shop setting, moderate in a batch
shop setting, and high in an assembly line setting. With the high variety of products in a job shop
environment, the use of Value Stream Mapping (VSM) would not be justified. Muda Elimination
(MUDA) was expected to be used at a high level in an assembly line, medium in a batch shop,
and low in a job shop. Some of the eight identified types of Muda are characteristics of the job
shop and batch shop processes (Susman and Chase, 1986). The use of VSM and MUDA in all
three manufacturing settings should be investigated further.
Research Question 2, “Is there a relationship between the operational performance of the
firm as perceived by the respondents and the perceived alignment of the lean tools with the type
of manufacturing setting?” was addressed by testing Hypotheses 2.
The results suggested that the perceived operational performance of the job shops is
predicted by the implementation of Muda Elimination (MUDA), Workers Involvement (WINV),
and negative Quick Set Up (QSETUP). The Quick Set Up (QSETUP) is the only lean tool with a
significant negative path coefficient. Why the path coefficient of Quick Set Up (QSETUP)-
perceived operational performance of the firm is negative, when, according Hayes and

119
Wheelwright (1984), the set ups in a job shop environment are frequent, appears to need further
investigation.
Heijunka (HEDJ) and Value Stream Mapping (VSM) must be taken into account because
their T-scores are very close to the .05 level of significance. Based on a positive path coefficient
and T-scores, a ranking of the lean tools on which the perceived operational performance of job
shop firm depends is displayed in Table 40.
Table 40
Job Shop Perceived Operational Performance
Operational Performance
Job shop path coefficient
T Statistics Ranking
Workers Involvement (WINV) 0.522829*** 3.496109 1
Muda Elimination (MUDA) 0.236774** 2.173435 2
Quick Set Up (QSETUP) -0.238181* 1.902134 3
Heijunka (HEDJ) 0.108583 1.611218 4
Value Stream Management (VSM) 0.196648 1.581094 5
Visual Management (VISM) 0.105979 0.95857 6
Standardized Work (STANDW) 0.072864 0.701521 7
Just in Time (JIT) 0.070653 0.690563 8
Total Productive Maintenance (TPM) 0.026824 0.200703 9 *Significant at p ≤0.1
**Significant at p ≤0.05
*** Significant at p ≤0.01
The results obtained from this study suggest that the perceived operational performance
of the batch shop is impacted most strongly by the implementation of Muda Elimination
(MUDA), and Workers’ Involvement (WINV) and negatively correlated with Standardized Work
(STANDW). In addition, Quick Set Up (QSETUP) must be considered as a lean tool for
improving the operational performance of the firm, because the result is only slightly outside the
.05 level selected for significance. Based on a positive path coefficient and T-statistics, a ranking
of the lean tools on which the perceived operational performance of a batch shop is impacted is

120
displayed in Table 41. The Standardized Work (STANDW) was the only lean tool with a
statistically significant negative path coefficient. The negative path coefficient of Standardized
Work (STANDW)-perceived operational performance of the Batch shop firms needs to be
investigated further.
Table 41
Batch Shop Perceived Operational Performance
OPPERF
Batch Shop
path coefficient
T Statistics
Ranking
Standardized Work (STANDW) -0.397256*** 2.667475 1
Workers Involvement (WINV) 0.434641*** 2.582732 2
Muda Elimination (MUDA) 0.304932** 2.120111 3
Quick Set Up (QSETUP) 0.197955 1.466122 4
Total Productive Maintenance (TPM) 0.142351 1.162062 5
Value Stream Mapping (VSM) 0.152615 1.12059 6
Heijunka (HEIJ) 0.097016 0.571843 7
Kaizen (KAIZ) 0.030675 0.232004 8
Visual Management (VISM) 0.031291 0.20068 9
Continuous Flow (CONTFL) 0.018096 0.135708 10 *Significant at p ≤0.1
**Significant at p ≤0.05
*** Significant at p ≤0.01
The results suggest that the perceived operational performance of the firms using the
assembly line manufacturing setting depended on the implementation of Standardized Work
(STANDW) and Value Stream Mapping (VSM). In addition, Five S’s (FIVES), Muda
Elimination (MUDA) and Workers’ Involvement (WINV) must be considered because their path
coefficients are very close to the .05 level of significance. Based on a positive path coefficient
and T-statistics, a ranking of the lean tools on which the perceived operational performance of a
firm employing an assembly line setting is displayed in Table 42. Despite a result that suggests
that the assembly line firms do not use Standardized Work (STANDW), it is the most important

121
lean tool on which the perceived operational performance of firms depends. The primary purpose
of standardization is to provide a base for improvement; this is based on the belief that there is no
one best way to do the work, and the employees doing the work are able to create the best work
design (Dennis, 2007). Moreover, standardization is constantly changing because of the
implementation of process improvements being made to address Muda elimination (Dennis,
2007).
Table 42
Assembly Line Perceived Operational Performance
OPPERF
Assembly Line
Path Coefficient
T Statistics
Ranking
Standardized Work (STANDW) 0.319406** 2.465131 1
Value Stream Mapping (VSM) 0.226371* 1.821356 2
Five S’s (FIVES) 0.336747 1.638077 3
Workers Involvement (WINV) 0.286799 1.544459 4
Muda Elimination(MUDA) 0.189797 1.481658 5
Just in Time (JIT) 0.164352 1.002056 6
Jidoka (JID) 0.103077 0.894746 7
Kaizen (KAIZ) 0.117436 0.728235 8
Heijunka (HEIJ) 0.095864 0.718843 9
Andon (AND) 0.110906 0.670141 10
Total Productive Maintenance (TPM) 0.046393 0.324893 11 *Significant at p ≤0.1
**Significant at p ≤0.05
*** Significant at p ≤0.01
Based on the perceptions of the respondents, there was a significant relationship between
the perceived operational performance of the firm and the utilization of the lean tools within each
manufacturing setting. The operational performance of firms depends on the use of different lean
tools in the three different manufacturing settings.

122
Research Question 3 (“Is there a relationship between the reported managers’ satisfaction
with the lean program and the perceived alignment of the lean tools with the type of
manufacturing setting?”) was addressed by testing Hypothesis 3. The results of the statistical
analysis in Chapter 4 provided support for rejecting the null Hypothesis 3 for job shop, batch
shop, and assembly line settings. The only lean tool significantly affecting the managers’
satisfaction with the lean program in a Job shop manufacturing setting is Heijunka (HEIJ). Based
on a positive path coefficient and T-statistics, the ranking of the lean tools on which the
managers’ satisfaction with the lean program in a job shop setting depends is displayed in Table
43.
Table 43
Job Shop Managers’ Satisfaction with the Lean Program
SATISF T Statistics Job Shop Ranking
Heijunka (HEDJ) 0.2293* 1.757913 1
Kaizen (KAIZ) 0.292192 1.285892 2
Teams (TEAM) 0.231816 0.915596 3
Muda Elimination (MUDA) 0.16382 0.80512 4
Value Stream Mapping (VSM) 0.165677 0.715301 5
Visual Management (VISM) 0.120196 0.575314 6
Just in Time (JIT) 0.041305 0.247616 7
Continuous Flow (CONTFL) 0.004565 0.029998 8 *Significant at p ≤0.1
**Significant at p ≤0.05
*** Significant at p ≤0.01
The lean tools affecting the managers’ satisfaction with the overall lean program in a
batch shop-manufacturing setting are Workers Involvement (WINV) and Continuous Flow
(CONTFL); it is interesting why the latter is negatively related to the managers’ satisfaction with
the lean program. Based on a positive path coefficient and T-statistics, ranking of the lean tools

123
on which managers’ satisfaction with the lean program in a batch shop setting depends is
displayed in Table 44.
Table 44
Batch Shop Managers’ Satisfaction with the Lean Program
SATISF
T Statistics Batch
Shop Ranking
Workers’ Involvement (WINV) 0.357362* 1.880079 1
Continuous Flow (CONTFL) -0.22157* 1.748651 2
Visual Management (VISM) 0.245837 1.389948 3
Judoka (JID) 0.131883 1.212365 4
Muda Elimination (MUDA) 0.151184 1.108891 5
Poke Yoke (PYOKE) 0.129553 0.990006 6
Total Productive Maintenance (TPM) 0.136204 0.936075 7
Just in Time (JIT) 0.107736 0.882324 8
Value Stream Mapping (VSM) 0.081616 0.488922 9
Five S’s (FIVES) 0.032057 0.180606 10
Heijunka (HEIJ) 0.013638 0.118586 11 *Significant at p ≤0.1
**Significant at p ≤0.05
*** Significant at p ≤0.01
The only lean tool significantly affecting the managers’ satisfaction with a lean program
in an assembly line manufacturing settings was Continuous Flow (CONTFL). Based on a
positive path coefficient and significance, the ranking for the lean tools on which the managers’
satisfaction with the lean program in an assembly line setting depends is displayed in Table 45.

124
Table 45
Assembly Line Managers’ Satisfaction with the Lean Program
SATISF
T Statistics
Assembly Line Ranking
Continuous Flow (CONTFL) 0.385634** 2.423373 1
Just in Time (JIT) 0.297097 1.315472 2
Teams (TEAM) 0.290601 1.080544 3
Andon (AND) 0.106164 0.638687 4
Visual Management (VISM) 0.096473 0.540956 5
Standardized Work (STANDW) 0.094812 0.528993 6
Kaizen (KAIZ) 0.106431 0.484066 7
Five S’s (FIVES) 0.061629 0.351637 8
Total Productive Maintenance (TPM) 0.035803 0.188153 9
Value Stream Mapping (VSM) 0.014255 0.089012 10 *Significant at p ≤0.1
**Significant at p ≤0.05
*** Significant at p ≤0.01
Consequently, there was a statistically significant relationship between the managers’
satisfaction with the lean program as perceived by the respondents and the perceived alignment
of the lean tools with the type of manufacturing setting. The level of the managers’ satisfaction
with the lean program was affected by different lean tools for the three manufacturing settings.
Implications
No study comparing the level of application of the sixteen lean tools to the three
manufacturing settings—a job shop, a batch shop, and an assembly line—could be found.
Moreover, no previous research could be found which explored whether the lean tools affect the
operational performance of firms that employ these settings and the managers’ satisfaction with
the lean program for the three manufacturing settings. The first contribution of this study was to
confirm that the lean success trajectory is a difficult path because of the uniqueness of each lean
implementation (Lewis, 2000).

125
The second contribution of this study was in testing the moderating effect of the three
types of manufacturing settings on the relationship between the levels of utilization of the sixteen
lean tools and the performance of the firm based on the perceptions of the respondents. This
study provided empirical evidence that the perceived operational performance of the firm
depends on the use of different lean tools in each of the three manufacturing settings. In addition,
this study identified the lean tools on which the perceived operational performance of a job shop,
a batch shop, or an assembly line was most likely impacted.
The third contribution of this study is testing the moderating effect of the three types of
manufacturing settings on the relationship between the levels of use of the sixteen lean tools and
the managers’ satisfaction with the lean program. Based on the results, the perception of the
respondents’ satisfaction with the lean program is correlated to different lean tools in job shop,
batch shop, and assembly line manufacturing settings. Furthermore, this research identified the
lean tools on which the managers’ satisfaction with the lean program in a job shop, a batch shop,
or an assembly line firm depends.
The fourth contribution of this study was the development of 11 scales measuring the
level of implementation of Heijunka (HEIJ), Jidoka (JID), Poke- Yoke (PYOKE), Andon (AND),
Standardized Work (STANDW), 5S (FIVES), Visual Management (VISM), Kaizen (KAIZ),
Teams (TEAM), Value Stream Mapping (VSM), and Muda Elimination (MUDA) lean tools. The
scales were tested through a Q-sort pilot test and empirical data analysis, which provided strong
evidence of construct validity.
This study provided many valuable insights that, when considered, could likely help
practitioners successfully implement lean manufacturing principles in their job shop, batch shop,
or assembly line manufacturing operations. This study confirmed that the level of utilization of

126
the different lean tools within the different categories of manufacturing settings is crucial for a
successful lean implementation (Corbett, 2007).
The findings revealed that the perceived operational performance in a job shop setting
would likely depend on the implementation of Workers Involvement (WINV), Muda Elimination
(MUDA), Heijunka (HEIJ), and Value Stream Mapping (VSM) lean tools. The results suggest
that those job shops looking to improve the operational performance of the firm need to
emphasize the implementation of these four lean tools. In addition, the data analysis revealed that
the managers’ satisfaction with the lean program as perceived by the respondents depends on the
implementation of Heijunka (HEIJ) in the job shop firms. Consequently, job shops concerned
with the managers’ satisfaction with the lean program need to emphasize the implementation of
the Heijunka (HEIJ) lean tool.
The findings revealed, as well, that the perceived operational performance of batch shop
firms depend on the implementation of Workers Involvement (WINV), Muda Elimination
(MUDA), Quick Set Up (QSETUP), and Total Productive Maintenance (TPM) lean tools. The
results suggested that batch shop firms looking to improve their operational performance need to
emphasize the implementation of these four lean tools. In addition, the analysis revealed that the
managers’ satisfaction with the lean program depends on the implementation of Workers
Involvement (WINV), Visual Management (WINV), Jidoka (JID), and Muda Elimination
(MUDA) lean tools in batch shop firms. Consequently, batch shops firms concerned with the
managers’ satisfaction with the lean program need to emphasize the implementation of Workers
Involvement (WINV), Visual Management (WINV), Jidoka (JID), and Muda Elimination
(MUDA) lean tools.

127
Third, the findings revealed that the perceived operational performance of the firms using
an assembly line setting depends on the implementation of Standardized Work (STANDW),
Value Stream Mapping (VSM), Five S’s (FIVES), Workers Involvement (WINV), and Muda
Elimination (MUDA). The results suggested that in order to improve their operational
performance, firms with assembly line settings need to emphasize the implementation of these
five lean tools. In addition, the data analysis revealed that the managers’ satisfaction with the
lean program depends on the implementation of Continuous Flow (CONTFL) and Just in Time
(JIT) lean tools in an Assembly line setting.
Fourth, the managers should know that the Workers Involvement (WINV) tool is a key
factor on which the operational performance in all three manufacturing settings depends. This
study highlighted the importance of Workers Involvement (WINV) confirming that the root of
the Toyota way is encouraging people continuously to improve the process they work on, saying
“It’s the people who bring the system to life: working, communicating, resolving issues, and
growing together” (Liker 2004, p. 36).
Limitations and Future Research
There are several limitations in this research study. The first limitation involves the
sample; the population of this study included lean managers in U.S. companies, and the results
may differ if the population were not limited to the US. There is a need to replicate this study
with an extended sample including manufacturing managers from other countries.
The second limitation is that this study examined the level of utilization of the lean tools
based on the perception of the respondents. An extension of this study could be to measure the
level of utilization of the lean tools based on actual events and observations. The third limitation
of this survey research is that it captures a fleeting moment in time and relies on self-reported

128
data (Leedy & Ormrod, 2005). Moreover, the personal biases of the respondents cannot be
controlled. In addition, when using an online survey, there is a possibility of sampling bias issues
(Selm & Jankowski, 2006).
The results of the analysis revealed that the Standardized Work (STANDW) lean tool is
not used at all in job shop, batch shop, and assembly line manufacturing settings. Standardized
Work (STANDW) is the foundation of lean manufacturing (Whitmore, 2008). Further research
should investigate which are the lean tools that manufacturers may use as a basis for
improvement during the Kaizen events.
Future research should examine the reason why Value Stream Mapping (VSM) and Muda
Elimination (MUDA) are almost equally implemented in all three manufacturing settings. In
addition, an extension of this study would determine if the perceived operational performance of
the firm was a mediator of the relationships between the job shop lean tools and the managers’
satisfaction with the lean program. A future study should examine why Visual Management
(VISM), Five S’s (FIVES), and Kaizen (KAIZ) are implemented at different levels within job
shop and assembly line settings, when these concepts seem to be equally applicable to both types
of settings.

129
References
Achanga, P., Shehab, E., Roy, R., & Nelder, G. (2006). Critical success factors for lean
implementation within SMEs. Journal of Manufacturing Technology Management, 17(4),
460.
Adler, P., Goldoftas, B., & Levine, D. (1997). Stability and change at NUMMI. Working paper,
Oxford University Press.
Advanced Productivity, Innovations and Competitive Success (APICS), Chapter Detroit. (2012).
Retrieved December 2010 from http://apicsdetroit.org/
Agresti, A. (1996). An Introduction to Categorical Data Analysis. New York. John Wiley &
Sons, Inc.
Aladwania, A. M., & Palvia, P. C. (2002). Developing and validating an instrument for
measuring user-perceived Web quality. Information and Management, 39 (6), 467–476.
Alfnes, E., & Strandhagen, J. (2000). Enterprise design for mass customization, the control
model methodology. Working paper. Department of Production and Quality Engineering.
Norwegian University of Science and Technology
Allen, J. H. (2000). Make lean manufacturing work for you. Manufacturing Engineering, 124(6),
54.
Art of Lean, (n.d.) Toyota production system, basic handbook. Art of Lean, Inc.
Atkinson, P. (2010). “Lean” is a Cultural Issue. Management Services, 54(2), 35-41.
Babbie, E. (2007). The practice of social research. CA, Belmont. Thomson Learning, Inc.
Bagozzi, R. P., and Phillips, L. W. (1982). Representing and testing organizational theories: a
holistic construct. Administrative Science Quarterly, 27, 459-489.

130
Bailey, J. E., & Pearson, S. W. (1983). Development of a tool for measuring and analyzing
computer user satisfaction. Management Science, 29(5), 530-545.
Ballard, G., & Howell, G. (1998). Shielding Production: Essential Step in Production Control. J.
Constr. Engrg. and Mgmt., 124 (1) 11 - 17.
Baron, R., & Kenny, D. (1986). The moderator-mediator variable distinction in social
psychological research: conceptual, strategic, and statistical considerations. Journal of
Personality and Social Psychology, 51(6), 1173-1182.
Beard, L., & Butler, S. A. (2000). Introducing JIT manufacturing: It's easier than you think.
Business Horizons, 43(5), 61-64.
Becker, R. (1998). Lean manufacturing and the Toyota production system. Encyclopedia of
World Biography, MI, Detroit, Gale Inc.
Bernett, R., & Nentl, N. (2010).Opinions and expectations about continuous improvement
programs. The Journal for Quality and Participation, 32(4), 35.
Bhasin, S., & Burcher, P. (2004). Lean viewed as a philosophy. Journal of Manufacturing
Technology Management. 17(1), 56-72. Retrieved June 17, 2008, from
www.emeraldinsight.com/1741-038X.htm.
Billesbach, T. J., & Hayen, R. (1994). Long-term impact of just-in-time on inventory
performance measures. Production and Inventory Management Journal, 35(1), 62.
Black, J. (2007). Design rules for implementing the Toyota Production System. International
Journal of Production Research, 45(16), 3639-3664.
Blackman, N. J., & Koval, J. J. (2000). Interval estimation for Cohen’s kappa as a measure of
agreement. Statistics in Medicine, 19(5), 723-741.
Bodek, N. (2008). Leadership is critical to lean. Manufacturing Engineering, 140(3), 145.

131
Bodek, N. (2010). A new way to become lean. Manufacturing Engineering, 145(2), 17.
Boyer, K. K. (1996). An assessment of managerial commitment to lean production. International
Journal of Operations & Production Management, 16(9), 48.
Brown, K. A., & Mitchell, T. R. (1991). A comparison of just-in-time and batch manufacturing:
The role of performance obstacles. Academy of Management Journal, 34(4), 906.
Browning, T. R., & Heath, R. D. (2009). Reconceptualizing the effects of lean on production
costs with evidence from the F-22 program. Journal of Operations Management, 27(1),
23-44.
Brunet, A., & New, S. (2003). Kaizen in Japan: an empirical study. International Journal of
Operations & Production Management, 23 (12), 1426 - 1446
Burack, E. H. (1967). Industrial management in advanced production systems: Some theoretical
concepts and preliminary findings. Administrative Science Quarterly, 12(3), 479-500.
Burg, J. (2009). LEAN PRINCIPLES: Don't exclude automation. Manufacturing Engineering,
143(1), 63.
Chase, R. B., and Aquilano, N. J. (1995). Production and Operations Management: A Life Cycle
Approach, 7th Ed., Irwin, Homewood, IL.
Chen, J., Li, Y., & Shady, B. (2010). From value stream mapping toward a lean/sigma
continuous improvement process: an industrial case study. International Journal of
Production Research, 48 (4), 1069-1086.
Cheney, H., Mann, R., & Amoroso, D. (1986). Organizational factors affecting the success of
end-user computing. Journal of Management Information Systems III (1), 65– 80.
Chin, W. W. (1998b). The partial least squares approach for structural equation modeling. In

132
G. A. Marcoulides (Ed.), Modern methods for business research (pp. 295–336).
Hillsdale, NJ: Lawrence Erlbaum Associates.
Chong, A., Ooi, K., Lin, B., & Tang, S. (2009). Influence of inter-organizational relationships on
SMEs’ e-business adoption. Internet Research, 19(3), 313- 331.
Cohen, A. (1996). On the discriminant validity of the Meyer and Allen measure of organizational
commitment: How does it fit with the work commitment construct? Educational and
Psychological Measurement, 56(3), 494-503.
Coleman, J., and Vaghefi, R. (1994).Heijunka (?): A key to the Toyota production system.
Production and Inventory Management Journal. 35(4), 31-36.
Comm, C. L., & Mathaisel, D. F. X. (2000).A paradigm for benchmarking lean initiatives for
quality improvement. Benchmarking, 7(2), 118.
Cook, P. (2010). Discriminant Function Analysis in SPSS. University of Colorado Denver,
Center for Nursing Research.
Cooney, R. (2002). Is "lean" a universal production system? Batch production in the automotive
industry. International Journal of Operations & Production Management, 22(9/10),
1130.
Corbett, S. (2007). “Beyond manufacturing: the evolution of lean production.” The McKinsey
Quarterly, August.
Creswell, J. (2009). Research design: qualitative, quantitative, and mixed methods approach.
CA, Thousand Oaks. Sage Publications, Inc.
Creswell, J. (2012). Educational research: Planning, conducting, and evaluating quantitative
and qualitative research (4th.). Upper Saddle River, NJ: Pearson Education, Inc.
Crute, V., Ward, Y., Brown, S., & Graves, A. (2003). Implementing lean in aerospace—

133
challenging the assumptions and understanding the challenges. Technovation, 23(12),
917-928.
Cua, K. O., McKone, K. E., & Schroeder, R. G. (2001). Relationships between implementation
of TQM, JIT, and TPM and manufacturing performance. Journal of Operations
Management, 19(6), 675-694.
Cudney, E. (2010). Implementing lean manufacturing. Manufacturing Engineering, 144(3), 83.
Cunningham, A., Preacher, K. & Banaji, M. (2001). Implicit attitude measures: consistency,
stability, and convergent validity. Psychological Science. 12(2), 163-170.
Davis, A. (1996). Instrument development: getting started. Journal of Neuroscience Nursing.
28(3), 204.
De Araujo, L., & De Queiroz, A. (2010). A conceptual model for production leveling (heijunka)
implementation in batch production systems. IFIP (International Federation for
Information Processing) AICT 338, 81–88.
Dehghan, A. (2012). Student Loyalty Assessment with Online Master's Programs. Dissertation.
Masters Theses and Doctoral Dissertations. Paper 431.
Dehghan, A., & Shahin, A. (2011). Customer Loyalty Assessment—A Case Study in
MADDIRAN, the Distributor of LG electronics in Iran. Business Management and
Strategy. 2(1)
Dehghan, A., & Trafalis, T. (2012). Examining Churn and Loyalty Using Support Vector
Machine. Business and Management Research. 1(4)
Deif, A. (2011). Dynamic analysis of a lean cell under uncertainty. International Journal of
Production Research, 1(13).
Dennis, P. (2007). Lean production simplified (2nd ed.). University Park, IL: Productivity

134
Press.
Detty, R., & Yingling, J. (2000). Quantifying benefits of conversion to lean manufacturing with
discrete event simulation: A case study. International Journal of Production Research,
38(2), 429-445.
Di, C.-Z., Crainiceanu, C. M., Caffo, B. S., and Punjabi, N. M. (2009). Multilevel functional\
principal component analysis. Annals of Applied Statistics 3, 458
Dibia, I., & Onuh, S. (2010). Lean Revolution and the Human Resource Aspects. Proceedings of
the World Congress on Engineering 2010 Vol IIIWCE 2010, June 30 - July 2, 2010,
London, U.K.
Dickson, E. W., Anguelov, Z., Vetterick, D., Eller, A., & Singh, S. (2009). Use of lean in the
emergency department: A case series of 4 hospitals. Annals of Emergency Medicine,
54(4), 504-510.
Dijkstra, T., & Henseler, J. (2011). Linear indices in nonlinear structural equation models:
best fitting proper indices and other composites. Quality Quant 45, 1505–1518.
Dlott, J. (2011). Sustainability: getting down to business. American Vegetable Grower 59(6), 32.
Dobrzykowski, D. (2010). Linking antecedents and consequences of value density in the
healthcare delivery supply chain. Doctoral Dissertation, University of Toledo, OH.
Doll, W. J., & Torkzadeh, G. (1988).The measurement of end-user computing satisfaction. MIS
Quarterly, 12(2), 259-274.
Drazin, R., & Ven, A. H. (1985). Alternative forms of fit in contingency theory. Administrative
Science Quarterly, 30(4), 514-539.
Eastern Michigan University (EMU). (2008). Dissertation Manual.Graduate School.
Emiliani, M. L., & Stec, D. J. (2005). Leaders lost in transformation. Leadership & Organization

135
Development Journal, 26(5/6), 370.
Emiliani, M. L. (1998). Lean behaviors. Management Decision, 36(9), 615.
Eswaramoorthi, M., Kathiresan, G., Jayasudhan, T., Prasad, P. & Mohanram, P. (2011). Flow
Index based line balancing: a tool to improve the leanness of assembly line design.
International Journal of Production Research, 1(14).
Faizul, H., & Lamb, W. B. (1996). Impact of short-term variations in demand on opportunity
costs in a just-in-time.
Fang, S., & Kleiner, B. (2003). Excellence at Toyota motor manufacturing in the United States.
Management Research News, 26 (2/3/4), 116 – 122.
Fiedler, F. E. (1972). The effects of leadership training and experience: A contingency model
interpretation. Administrative Science Quarterly, 17(4), 453-470.
Fiedler, F. E. (n.d.). Contingency Theory-Fiedler. Value Based Management. Net. Retrieved
September 2011 from
http://www.valuebasedmanagement.net/methods_contingency_theory.html
Fine, C., & Hax, A., (1985). Manufacturing Strategy: A Methodology and an Illustration.
Interfaces, 15(6), 28-46
Flinchbaugh, J. (2005). Lean can combat off shoring. Manufacturing Engineering, 134(6), 144.
Flinchbaugh, J. (2006). Learning is a key to lean. Manufacturing Engineering, 136(4), 18.
Fornell, C., & Larcker, D. (1981). Evaluating Structural Equations Models with Unobservable
Variables and Measurement Error. Journal of Marketing Research, 18, 39-50.
Fornell, C. and Bookstein, F. (1982) Two Structural Equation Models: LISREL and PLS Applied
to Consumer Exit-Voice Theory. Journal of Marketing Research, 19 (4), 440-452

136
Forza, C. (1996). Work organization in lean production and traditional plants what are the
differences? International Journal of Operations & Production Management, 16(2), 42.
Fullerton, R. R., & McWatters, C. S. (2001). The production performance benefits from JIT
implementation. Journal of Operations Management, 19(1), 81-96.
Fullerton, R. R., & McWatters, C. S. (2002). The role of performance measures and incentive
systems in relation to the degree of JIT implementation. Accounting, Organizations and
Society, 27 (8) (2002), 711–735
Fullerton, R. R., McWatters, C. S., & Fawson, C. (2003). An examination of the relationships
between JIT and financial performance. Journal of Operations Management, 21(4), 383-
404.
Fullerton, R. R., & Wempe, W. F. (2009). Lean manufacturing, non-financial performance
measures, and financial performance. International Journal of Operations & Production
Management, 29(3), 214.
Furmans, K. (2005). Models of heijunka-leveled kanban-systems. Working paper. IFL, \
University of Karlsruhe (TH).
Gaskin, J. (2012). "Name of section,” Gaskination's StatWiki. http://statwiki.kolobkreations.com
George, M. (2002). Lean Six Sigma: Combining Six Sigma quality with Lean speed. New
York: McGraw-Hill.
Graves, S. C. (1986). A tactical planning model for a job shop. Operations Research, 34(4), 522-
533.
Green, J., Lee, J., & Kozman, T. (2010). Managing lean manufacturing in material handling
operations, International Journal of Production Research, 48(10), 2975-2993.
Gupta, M., Holladay, H., & Mahoney, M. (2000).The human factor in JIT implementation: A

137
case study of Ambrake Corporation. Production and Inventory Management Journal,
41(4) 29.
Ha, S. (2007). Continuous processes can be lean. Manufacturing Engineering, 138(6), 103.
Haak, R. (2006). Implementing Process Innovation – The Case of the Toyota Production System.
Working paper.
Haaster, R., Hoogenboom, P., Ingen, J., Knoben, V., Overkamp, P., Romijn, K., & Vermeij, R.
(2010). Lean for jet support. University of Applied Sciences Amsterdam.
Hair, J., Black, W., Babin, B., Anderson, R., & Tatham, R. (2005). Multivariate Data
Analysis, 6th ed. Prentice-Hall: Englewood Cliffs, NJ.
Hair, J., Black, W., Babin, B., Anderson, R., and Tatham, R. (2009). Multivariate Data Analysis,
Seventh edition. Pearson Prentice Hall: Upper Saddle River, NJ.
Hair, J. F., Ringle, C. M., & Sarstedt, M. (2011). PLS-SEM: indeed a silver bullet. Journal of
Marketing Theory and Practice, 19(2), 139–151.
Hair, J., Sarstedt, M., Ringle, C., & Mena, J. (2012). An assessment of the use of partial least
squares structural equation modeling in marketing research. J Acad Market Sci
(forthcoming).
Hampson, I. (1999). Lean Production and the Toyota Production System Or, the
Case of the Forgotten Production Concepts. Economic and Industrial Democracy. 20,
369.
Han, S. (1997). A conceptual framework of the impact of technology on customer-supplier
relationships. The Journal of Business & Industrial Marketing, 12(1), 22.
Harari, O. (1997). Kaizen is not enough. Management Review, 86(8), 25.
Hayes, R., & Wheelwright, S. (1984). Restoring our Competitive Edge: Competing Through

138
Manufacturing. New York. John Wiley & Sons, Inc.
Hayes, R., and Wheelwright, S. (1979). Linking manufacturing process and product life cycles.
Harvard Business Review 57(1), 133-140.
Henseler, J. (2010). On the convergence of the partial least squares path-modeling algorithm.
Computational Statistics, 25(1), 107–120.
Henseler, J., & Fassott, G. (2010). Testing moderating effects in PLS path models: An
illustration of available procedures. In V. E. Vinzi, W. W. Chin, J. Henseler, & H. Wang
(Eds.), Handbook of partial least squares: Concepts, methods and applications in
marketing and related fields (pp. 713–735). Berlin: Springer.
Henseler, J., Ringle, C. M., & Sinkovics, R. R. (2009). The use of partial least squares path
modeling in international marketing. Advances in international marketing, 20, 277–319.
Hettler, N. (2008). Lean means business. Manufacturing Engineering, 140(1), 103.
Hinckley, C. (2007). Combining mistake-proofing and Jidoka to achieve world class quality in
clinical chemistry. Accred. Qual. Assur. 12, 223–230.
Hines, P. (1996). Purchasing for lean production: the new strategic agenda. International Journal
of Purchasing and Materials Management. 32(1), 2-10.
Hines, P., Holwe, M., & Rich, N. (2004). Learning to evolve: A review of contemporary lean
thinking. International Journal of Operations & Production Management, 24(9/10), 994.
Hogan, B. (2009). Sustaining a lean culture. Manufacturing Engineering, 143(5), 71.
Hogan, B. J. (2005). Is there a new manufacturing paradigm? Manufacturing Engineering,
135(5), 10.
Holweg, M. (2007). The genealogy of lean production. Journal of Operations Management,
25(2), 420-437.

139
Hong, P., Dobrzykowski, D., & Vonderembse, M. (2010). Integration of supply chain IT and
lean practices for mass customization: benchmarking of product and service focused
manufacturers. Benchmarking: An International Journal, 17(4), 561-592.
Höök, M., & Stehn, L. (2008). Applicability of lean principles and practices in industrialized
housing production. Construction Management and Economics, 26(10), 1091-1100.
Howard, M., & Newman, R. (1993). From job shop to just-in-time. A successful conversion.
Production and Inventory Management Journal, 34(3), 70.
Hüttmeir, A., de Treville, S., van Ackere, A., Monnier, L., & Prenninger, J. (2009). Trading off
between heijunka and just-in-sequence. International Journal of Production Economics,
118(2), 501-507.
Imai, M. (1997). Gemba kaizen: a commonsense, low cost approach to management. NY. New
York, McGraw Hill, Inc.
Ives, B., Olson, M., & Baroudi, S. (1983). The measurement of user information satisfaction.
Communications of the ACM, 26(10), 785-793.
James-Moore, S. M., & Gibbons, A. (1997). Is lean manufacture universally relevant? An
investigative methodology. International Journal of Operations & Production
Management, 17(9), 899.
Jina, J., Bhattacharya, A., & Walton, A. (1997). Applying lean principles for high product
variety and low volumes: some issues and propositions. Logistics Information
Management, 10(1), 5-13.
Jing, Z., & Xuejun, X. (2009). Research on lean production based on organizational change
model. Third International Symposium on Intelligent Information Technology
Application.

140
Jones, D. T. (2006). Heijunka: Leveling production. Manufacturing Engineering, 137(2), 29.
Jorgensen, F., Mathiessen, R., Nielsen, J., & Johansen, J. (2007). Lean Maturity, Lean
Sustainability. IFIP International Federation for Information Processing, 246, Advances
in Production Management Systems, eds. Olhager, J., Persson, F., (Boston: Springer),
249. 371.
Jovag, L. (2011). Connect process flows to become lean. Manufacturing Engineering, 146(5),
97.
Karlsson, C., & Ahlstrom, P. (1996). Assessing changes towards lean production. International
Journal of Operations & Production Management, 16(2), 24.
Kasul, R., & Motwani, J. (1997). Successful implementation of TPS in a manufacturing setting: a
case study. Industrial Management & Data Systems, 97(7), 274–279.
Katayama, H., & Bennett, D. (1996). Lean production in a changing competitive world: A
Japanese perspective. International Journal of Operations & Production Management,
16(2), 8.
Keil, M., Tan, B. C., Wei, K.-K., Saarinen, T., Tuunainen, V., & Wassenaar, A. (2000). A cross-
cultural study on escalation of commitment behavior in software projects. Management
Information Systems Quarterly, 24(2), 299–325.
Kilpatrick, J. (2003). Lean principles. Utah Manufacturing Extension Partnership
Retrieved December 2010
fromhttp://supplychain.tamu.edu/academics/444/LeanPrinciples.pdf
Kim, C. S., Spahlinger, D. A., Kin, J. M., & Billi, J. E. (2006). Lean health care: What can
hospitals learn from a world-class automaker? Journal of Hospital Medicine, 1(3), 191–
199.

141
Koenigsaecker, G. (2005). Leadership and the lean transformation. Manufacturing Engineering,
135(5), L7.
Koufteros, X., Vonderembse, M. A., & Doll, W. (2001). Concurrent engineering and its
consequences. Journal of Operations Management, 19, 97–115.
Koufteros, X. (1999). Testing a model of pull production: a paradigm for manufacturing research
using structural equation modeling. Journal of Operations Management, 17, 467–488.
Kristjuhan, K. (2010). Lean production, its related production management approaches and
other contemporaries. 7th International DAAAM Baltic Conference "Industrial
Engineering,” April 2010, Tallinn, Estonia.
Lander, E., & Liker, J. (2007). The Toyota Production System and art: making highly
customized and creative products the Toyota way. International Journal of Production
Research, 45(16), 3681-3698.
Landis, J. R., and Koch, G. G. (1977). The measurement of observe agreement for categorical
data. Biometrics, 33, 159.
Law, K. S., Wong, C. S., and Mobley, W. H. (1998). Toward a taxonomy of multidimensional
constructs. Academy of Management Review, 23(4), 741-755.
Lee, B., & Jo, H. (2007). The mutation of the Toyota Production System: adapting the TPS at
Hyundai Motor Company. International Journal of Production Research, 45(16), 3665-
3679.
Leedy, P., & Ormrod, J. (2005). Practical Research: Planning and Design. Boston, MA: Upper
Saddle River.
Legris, P., Ingham, J., & Collerette, P. (2003). Why do people use information technology?
A critical review of the technology acceptance model. Information & Management, 40,

142
191–204.
Leister, A., Borden, D., & Fiedler, F. E. (1977). Validation of contingency model leadership
training: Leader match. The Academy of Management Journal, 20(3), 464-470.
Leles, C., Martins, R., Silva, E., & Nunes, M. (2009). Discriminant analysis of patients’ reasons
for choosing or refusing treatments for partial edentulism. Journal of Oral Rehabilitation
2009. 36, 909–915.
Lewis, M. A. (2000). Lean production and sustainable competitive advantage. International
Journal of Operations & Production Management, 20(8), 959.
Liker, J. K. (2004). The Toyota way: 14 management principles from the world's greatest
manufacturer. New York: McGraw-Hill.
Liker, J., & Rother, M. (n.d.). Why lean programs fail. Lean Enterprise Institute. Retrieved
December 2010 from www. Lean.org
Lima, P., Lobo, C., & Fumagali, A. (n.d.). Comparison of the implementation of lean assembly
cells in different production environments. Taktica, Lean Consulting, Brazil.
LinkedIn (2011). Retrieved December 2011 from http://www.linkedin.com/
Loftus, P. (2006). When lean companies stay fat. Chief Executive, (221), 44.
Lopez, L., & Sanchez, J. (2009). Discriminant methods for radar detection of hail. Atmospheric
Research. 93,358–368.
Lucas, R., Diener, E., & Suh, E. (1996). Discriminant Validity of Weil-Being Measures. Journal
of Personality and Social Psychology, 71(3), 616-628.
Mackelprang, A. W., & Nair, A. (2010). Relationship between just-in-time manufacturing
practices and performance: A meta-analytic investigation. Journal of Operations
Management, 28(4), 283-302.

143
Manos, A. (2007). The benefits of kaizen and kaizen events. Quality Progress, 40(2), 47.
Marsh, H., Balla, J., & McDonald, R. (1988). Goodness-of-Fit Indexes in Confirmatory Factor
Analysis: The Effect of Sample Size. Psychological Bulletin, 103(3), 391-400.
Masson, C., Smith, A., & Jacobson, S. (2007). Demand-Driven Manufacturing. AMR Research
Report. AMR Research, Inc.
McDonald, T., Ellis, K., Van Aken, E., & Koelling, P. (2009). Development and application of a
worker assignment model to evaluate a lean manufacturing cell. International Journal of
Production Research, 47(9), 2427-2447.
Melton, T. (2005). The benefits of lean manufacturing what lean thinking has to offer the process
industries. Chemical Engineering Research and Design, 83(A6): 662–673.
Miles, R., & Snow, C. (2003). Organization Strategy, Structure and Process. Stanford, CA.
Stanford University Press.
Miltenburg, J. (2007). Level schedules for mixed-model JIT production lines: characteristics of
the largest instances that can be solved optimally. International Journal of Production
Research, 45(16), 3555-3577.
Mitchell, T. R., Biglan, A., Oncken, G. R., & Fiedler, F. E. (1970). The contingency model:
Criticism and suggestions. The Academy of Management Journal, 13(3), 253-267.
Montreuil, B. (1999). Fractal layout organization for job shop environments. International
Journal of Production Research, 37(3), 501-521.
Moore, G. C., & Benbasat, I. (1991). Development of an instrument to measure the perceptions
of adopting an information technology innovation. Information Systems Research, 2(3),
192-222.
Morey, B. (2008). Automating LEAN TOOLS. Manufacturing Engineering, 141(1), 115.

144
Morgan, J., & Liker, J. (2006). The Toyota product development system. New York:
Productivity Press.
Nahm, A. Y., Vonderembse, M. A., & Koufteros, X. A. (2003). The impact of organizational
structure on time-based manufacturing and plant performance. Journal of Operations
Management, 21(3), 281-306.
NetMBA, Business Knowledge Center. (2010). Process Flow Structures. Retrieved February
2010 from http://www.netmba.com/operations/process/structure/
Norman, G. (2010). Likert scales, levels of measurement and the “laws” of statistics. Adv in
Health Sci Educ. DOI 10.1007/s10459-010-9222-y
Ohno, T. (1988). Toyota production system: beyond large scale production. Portland,
OR. Productivity, Inc.
Oosterman, B., Land, M., & Gaalman, G. (2000). The influence of shop characteristics on
workload control. International Journal of Production Economics, 68(1), 107-119.
Paez, O., Dewees, J., Genaidy, A., Tuncel, S., Karwowski, W., & Zurada, J. (2004). The lean
manufacturing enterprise: An emerging socio-technological system integration. Human
Factors and Ergonomics in Manufacturing & Service Industries, 14(3), 285-306.
Palvia, P. C. (1996). A Model and Instrument for Measuring Small Business User Satisfaction
with Information Technology. Information & Management, 31,151-163.
Parker, S. (2003). Longitudinal effects of lean production on employee outcomes and the
mediating role of work characteristics. Journal of Applied Psychology, 88 (4), 620.
Parry, G., & Turner, C. (2006). Application of lean visual process management tools. Production
Planning & Control, 17(1), 77-86.
Pavnaskar, S., Gershenson, J., & Jambekar, A. (2003). Classification scheme for lean

145
manufacturing tools. International Journal of Production Research, 41(13), 3075-3090.
Pay, R. (2008). Being taken for a lean ride. Lean Manufacturing.
Pepper, M. P. J., & Spedding, T. A. (2010). The evolution of lean six sigma. The International
Journal of Quality & Reliability Management, 27(2), 138.
Pettersen, J. (2009). Defining lean production: Some conceptual and practical issues.TQM
Journal, 21(2), 127.
Poppendieck, M. (2002). Principles of Lean Thinking. Working paper. Poppendieck. LLC
Průša, P., & Schacherl, L. (2007). The leveling. Scientific Papers of the University of Pardubice
Series B - The Jan Perner Transport Faculty 13.
Raymond, A. (2006). Becoming lean.FDM.78 (8), 26
Recht, R., & Wilderom, C. (1998). Kaizen and culture: On the transferability of Japanese
suggestion systems. International Business Review, 7(1), 7-22.
Reeb, J., & Leavengood, S. (2010). Introduction to lean manufacturing. Extension Service.
Oregon State University.
Reeves, T., & Turner, B. A. (1972). A theory of organization and behavior in batch production
factories. Administrative Science Quarterly, 17(1), pp. 81-98.
Reichhart, A., & Holweg, M. (2007). Lean distribution: concepts, contributions, conflicts.
International Journal of Production Research, 45(16), 3699-3722.
Ringle, C., Wende, S., & Will, S. (2005). SmartPLS 2.0 (M3) Beta, Hamburg
http://www.smartpls.de.
Ruekert, R. W., Walker, O. C., Jr., & Roering, K. J. (1985). The organization of marketing
activities: A contingency theory of structure and performance. The Journal of Marketing,
49(1), 13-25.

146
Safizadeh, M. H., Ritzman, L. P., Sharma, D., & Wood, C. (1996). An empirical analysis of the
product-process matrix. Management Science, 42(11), 1576.
Sanchez, A. M., & Perez, M. P. (2001). Lean indicators and manufacturing strategies.
International Journal of Operations & Production Management, 21(11), 1433.
Sawhney, R., & Chason, S. (2005). Human behavior based exploratory model for successful
implementation of lean enterprise in industry. Performance Improvement Quarterly,
18(2), 76-96.
Scherrer-Rathje, M., Boyle, T. A., & Deflorin, P. (2009). Lean, take two! Reflections from the
second attempt at lean implementation. Business Horizons, 52(1), 79-88.
Schwab (n/a). Data Analysis & Computers II Strategy for complete discriminant analysis. The
University of Texas at Austin.
Segars, A. H. (1997). Assessing the unidimensionality of measurement: A paradigm and
illustration within the context of information systems research. Omega, 25(1), 107-121.
Selm, M., & Jankowski, N. (2006). Conducting online surveys. Quality & Quantity, 40, 435–
456.
Serrano, I., Ochoa, C., & De Castro, R. (2008). Evaluation of value stream mapping in
manufacturing system redesign. International Journal of Production Research, 46(16),
4409-4430.
Seth, D., & Gupta, V. (2005). Application of value stream mapping for lean operations and cycle
time reduction: an Indian case study. Production Planning & Control, 16(1), 44-59.
Shah, R., Goldstein, S., Unger, B., & Henry, T. (2008). Explaining anomalous high performance
in a health care supply chain. Egglestone Decision Sciences, 39(4), 759-789.
Shah, R., & Ward, P. T. (2003). Lean manufacturing: Context, practice bundles, and

147
performance. Journal of Operations Management, 21(2), 129-149.
Shah, R., & Ward, P. T. (2007). Defining and developing measures of lean production. Journal
of Operations Management, 25(4), 785-805.
Sheehan, K. B. (2001). E-mail survey response rates: A review. Journal of Computer Mediated
Communication, 6(2).
Sheehan, K. B., & Hoy, M. B. (1999). Using e-mail to survey internet users in the United
States: Methodology and assessment. Journal of Computer Mediated Communication,
4(3).
Shenhar, A. (2001). One size does not fit all projects: Exploring classical contingency domains.
Management Science, 47(3), 394-414.
Shinohara, I. (1988). NPS: New Production System, Productivity Press, Cambridge, MA, 153-5.
Shingo, S. (1981). Study of Toyota production system from industrial engineering viewpoint.
Tokyo: Japan Management Association.
Skinner, W. (1969). Manufacturing – missing link in corporate strategy, Harvard Business
Review, 47(3), 136-45.
Smeds, R. (1994). Managing change towards lean enterprises. International Journal of
Operations & Production Management, 14(3), 66.
Smith, J. (2006). Driving continuous improvement. Plant Engineering, 60(12), 42.
Smith , T., & Reece, J. (1998). The relationship of strategy, fit, productivity, and business
performance in a services setting. Journal of Operations Management, 17, 145–161.
Sohal, A. S. (1996). Developing a lean production organization: An Australian case study.
International Journal of Operations & Production Management, 16(2), 91.
Sohal, A. S., & Egglestone, A. (1994). Lean production: Experience among Australian

148
organizations. International Journal of Operations & Production Management, 14(11),
35.
Spear, S. J. (2004). Learning to lead at Toyota. Harvard Business Review, 82(5), 78–86.
Spence, H. (1997). Structure of anxiety symptoms among children: A confirmatory factor-
analytic study. Journal of Abnormal Psychology, 106(2), 280-297.
Stump, B., & Badurdeen, F. (2009). Integrating lean and other strategies for mass customization
manufacturing: a case study. Journal of Intilligent Manufacturing. 23(1), 109-124.
Sugimori, Y., Kusunoki, K., Cho, F., & Uchikawa, S. (1977). Toyota production system and
Kanban system materialization of just-in-time and respect-for-human system.
International. Journal of Production Research, 15(6), 553-564.
Susman, I., & Chase, B. (1986). A socio-technical analysis of the integrated factory. Journal of
Applied Behavioral Science, 22, 257-270.
Suzuki, Y. (2004). Structure of the Japanese Production System: Elusiveness and Reality. Asian
Business & Management, 3, 201–219.
Swanson, R., & Holton III, E. (2005). Research in Organizations: Foundations and Methods of
Inquiry. San Francisko, CA. Berrett-Koehler Publishers.
Taninecz, G. (2005). Lean beyond production. Lean Enterprise Institute, Brookline, MA
www.lean.org
Todd, P. A., & Benbasat, I. (1989). An Experimental Investigation of the Impact of Computer
Based Decision Aids on the Process of Preferential Choice. Working Paper, School of
Business, Queen's University, Kingston, Ontario.
Trochim, W. (2006). Research Methods Knowledge Base. Retrieved January, 2012 from
http://www.socialresearchmethods.net/kb/analysis.php

149
U.S. Department of Health & Human Services (2009). Code of Federal Regulations, Title 45:
Public Welfare, Part 46: Protection of Human Subjects. Retrieved November, 2010 from
http://www.hhs.gov/ohrp/humansubjects/guidance/45cfr46.html
Veech, D. (2001). A person centered approach to sustaining a lean environment-job design for
self-efficacy. Defense Acquisition Review Journal. 159-171
Venkatraman, N., & Camillus, J. C. (1984). Exploring the concept of "fit" in strategic
management. The Academy of Management Review, 9(3), 513-525.
Venkatraman, N., & Ramanujam, V. (1986). Measurement of business performance in strategy
research: A comparison of approaches. The Academy of Management Review, 11(4),
801-814.
Venkatraman, N. (1989). The concept of fit in strategy research: toward verbal and statistical
correspondence. Academy of Management Review, 14(3), 423-444.
Vinodh, S., & Balaji, S. (2011). Fuzzy logic based leanness assessment and its decision support
system. International Journal of Production Research, 49(13), 4027-4041.
Vinodh, S., & Chintha, S. (2011). Leanness assessment using multigrade fuzzy approach.
International Journal of Production Research, 49(2), 431-445.
Wan, H., & Chen, F. (2008). A leanness measure of manufacturing systems for quantifying
impacts of lean initiatives. International Journal of Production Research, 46(23), 6567-
6584.
Weill, P., & Olson, M. (1989). An assessment of the contingency theory of management
information systems. Journal of Management Information Systems, 6(1), 59-85.
White, R. E., Pearson, J. N., & Wilson, J. R. (1999). JIT Manufacturing: a survey of
Implementation in small and large US manufacturers. Management Science 45(1), 1–15.

150
White, R. E., & Prybutok, V. (2001). The relationship between JIT practices and type of
production system. Omega, 29(2), 113-124.
Whitmore, T. (2008). Standardized WORK. Manufacturing Engineering, 140(5), 171.
Womack, J. P., Jones, D. T., Roos, D. (1990). The Machine That Changed the World. Harper
Perennial, New York.
Womack, J. P., Jones, D. T. (1996). Lean Thinking: Banish Waste and Create Wealth in Your
Corporation. New York, Simon & Schuster.
Woodward, J. (1965). Industrial organization: theory and practice. London, Oxford University
Press.
Yi, Y. & Gong, T. (2008). The Electronic Service Quality Model: The Moderating Effect of
Customer Self-Efficacy. Psychology & Marketing, 25(7), 587–601.
Zijm, W. H. M., & Kals, H. J. J. (1995). The integration of process planning and shop floor
scheduling in small batch part manufacturing. CIRP Annals - Manufacturing Technology,
44(1), 429-432.

151
Appendices

152
Appendix A: Items entering the first round of Q sorting
External JIT
We use JIT purchasing.
We do not produce something, unless the customer has order it.
We link all processes to customer demand through Kanban.
Internal JIT
Production at stations is “pulled” by the current demand of the next station.
We use Kanban signals for production control.
We produce exactly as much pieces as needed.
Continuous Flow
Products are classified into groups with similar processing requirements.
Products are classified into groups with similar routing requirements.
Equipment is grouped to produce a continuous flow of families of products.
Families of products determine our factory layout.
Heijunka
Our production volume and mix is distributed evenly over time.
We do not have peaks and valleys in our production schedule.
We change our heijunka model dependent on the demand at least every few days.
We change our heijunka model dependent on the demand at least every few weeks.
We change our heijunka model dependent on the demand at least every few months.
Quick change over and set up
Our employees practice setups to reduce the time required.
We are working to lower setup times in our plant.
We have low setup times of equipment in our plant.
Jidoka
We detect process deviations with automated technology.
We detect quality deviations with automated technology.
Most inspections are done by automated technology.
Poke-Yoke
We have poke-yoke devices designed for our work place conditions.
We use simple, inexpensive error-proofing devices.
Our poke-yoke devices inspect 100% of the time.

153
Andon
Everyone working on the production floor is able to stop the production line if defect is detected.
We have a device (cord or button) able to stop the production line if defect is detected.
Our employees stop the production line if defect is detected.
Standardized Work
Our work processes are standardized.
Our shop floor employees are responsible for the design of work process standards.
We use our standards as a base for improvement.
We change our work process standards every week.
We change our work process standards every month.
We change our work process standards every year.
5 S systems
We organize our work place with marked positions for each tool.
We have cleaning responsibility assigned to the team members.
We have cleaning schedule assigned to the team members.
We have standardized approach to measure the 5 s conditions.
5s is owned by the team members.
Our employees have 5s training.
TPM
We dedicate a portion of everyday to planned equipment maintenance related activities.
We maintain all our equipment regularly.
We maintain excellent records of all equipment maintenance related activities.
We post equipment maintenance records on shop floor for active sharing with employees.
Everyone on the shop floor participates in the TPM activities with performing basic tasks.
Visual Management
We use visual board to display value added information.
We use visual indicators, signs and controllers.
We use simple signals providing immediate understanding of situation.
Kaizen
Our employees have numbers of suggestions per month.
Our employees have numbers of suggestions per year.
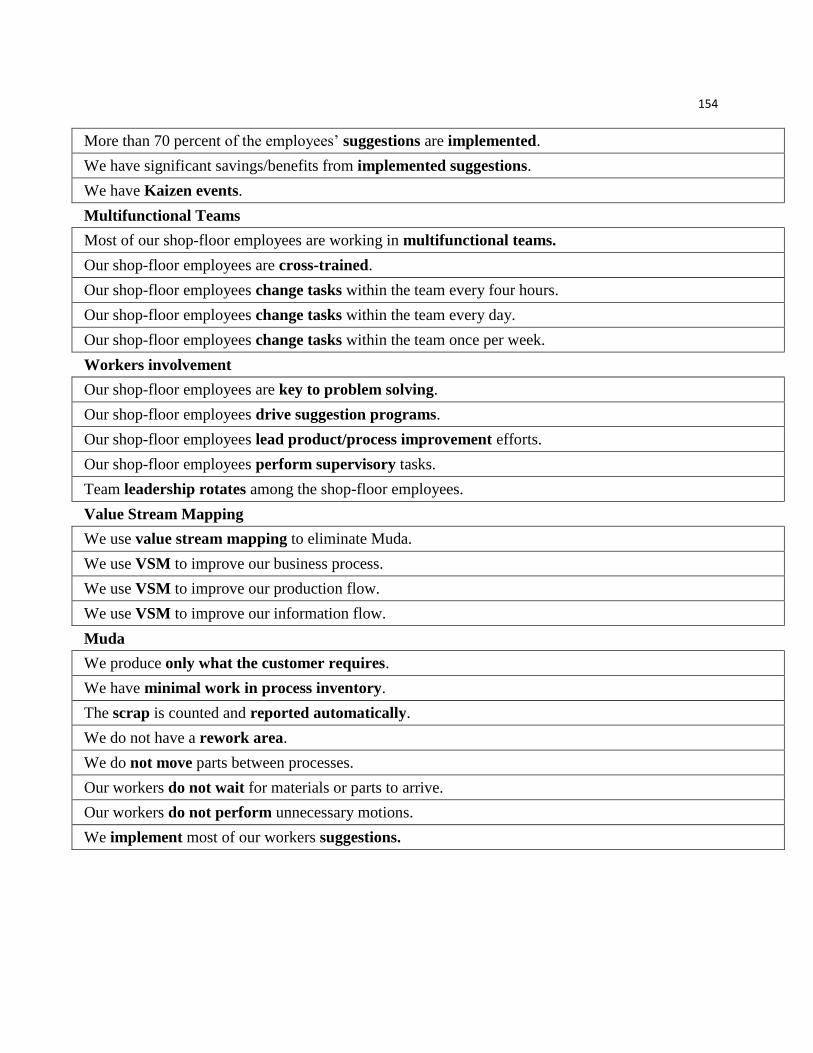
154
More than 70 percent of the employees’ suggestions are implemented.
We have significant savings/benefits from implemented suggestions.
We have Kaizen events.
Multifunctional Teams
Most of our shop-floor employees are working in multifunctional teams.
Our shop-floor employees are cross-trained.
Our shop-floor employees change tasks within the team every four hours.
Our shop-floor employees change tasks within the team every day.
Our shop-floor employees change tasks within the team once per week.
Workers involvement
Our shop-floor employees are key to problem solving.
Our shop-floor employees drive suggestion programs.
Our shop-floor employees lead product/process improvement efforts.
Our shop-floor employees perform supervisory tasks.
Team leadership rotates among the shop-floor employees.
Value Stream Mapping
We use value stream mapping to eliminate Muda.
We use VSM to improve our business process.
We use VSM to improve our production flow.
We use VSM to improve our information flow.
Muda
We produce only what the customer requires.
We have minimal work in process inventory.
The scrap is counted and reported automatically.
We do not have a rework area.
We do not move parts between processes.
Our workers do not wait for materials or parts to arrive.
Our workers do not perform unnecessary motions.
We implement most of our workers suggestions.

155
Appendix B: Q-Sort Results
Table 46: Items Placement Ratios: First Q-sort Round

156
Table 47: Inter-Judge Raw Agreement Scores: First Q-sort Round

157
Table 48: Items Placement Ratios: Second Q-sort Round

158
Table 49: Inter-Judge Raw Agreement Scores: Second Q-sort Round

159
Appendix C: Online Survey Instrument Used to Collect Data
Introductory Email:
Based on your extensive experience in manufacturing and your knowledge of lean systems, your
help is being solicited in an effort to better understand the utilization of the lean approach within
different types of manufacturing organizations. Specifically this study will attempt to identify the
best lean practices for job shops, batch shops, an assembly lines, and continuous flow
manufacturing settings. Please take up to fifteen minutes to complete the survey instrument that
can be accessed by the link below.
https://www.surveymonkey.com/s/KW8KPKT
As an incentive, all survey completers will be entered into a drawing where the winner will
receive $200 in cash. In addition, anyone who requests a summary report will be emailed a Word
file with a summary of the results of the survey.
If you have any questions, please email me at [email protected]
Thank you very much
Daniela Todorova

160

161

162

163

164

165
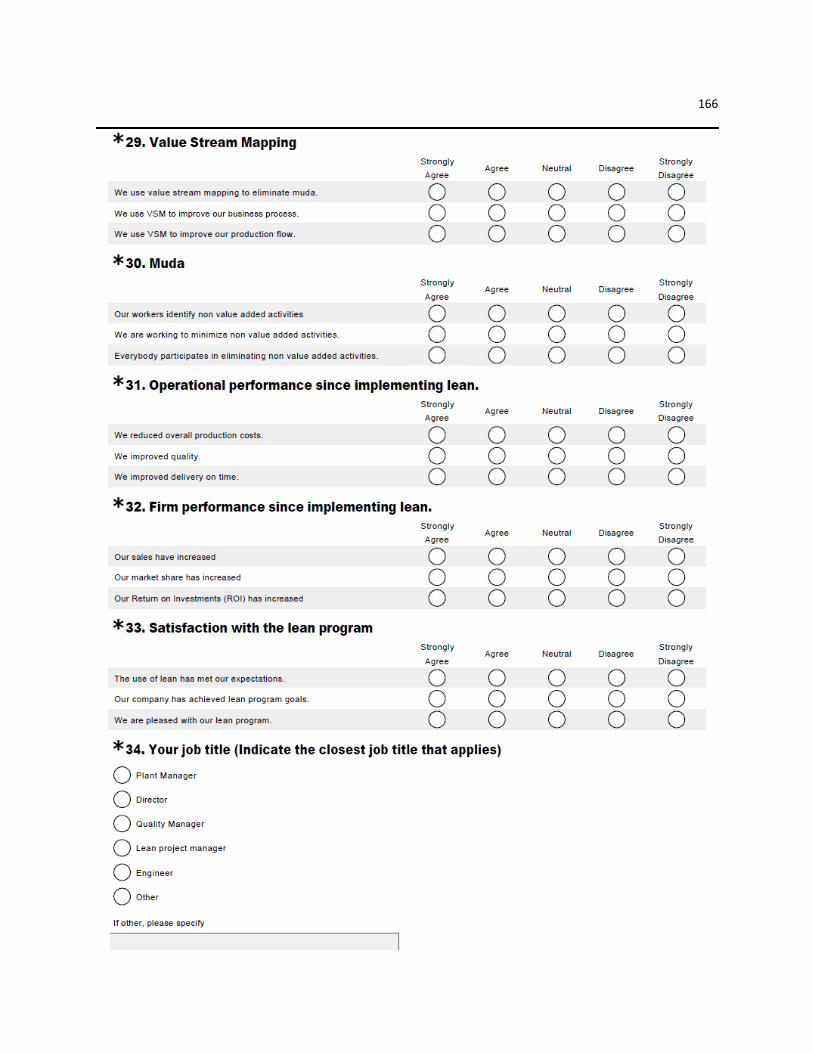
166

167

168
Appendix D: Human Subject Approval

169
Appendix E: PLS Cross Loadings
AND CONTFL FIVES HEDJ JID JIT KAIZ MUDA
AND1 0.877223 0.306538 0.250120 0.302429 0.247855 0.353425 0.293445 0.236500
AND2 0.783636 0.281219 0.255299 0.368278 0.453693 0.287661 0.355324 0.204141
AND3 0.844223 0.255924 0.288230 0.291998 0.204252 0.389276 0.281870 0.171648
CONTFL1 0.288883 0.827008 0.293852 0.320930 0.276519 0.263117 0.279135 0.347802
CONTFL2 0.294617 0.906083 0.445102 0.397502 0.331487 0.440060 0.325587 0.410926
CONTFL3 0.263944 0.782387 0.312247 0.398557 0.254984 0.432314 0.305513 0.383965
FIVES1 0.246324 0.299225 0.906193 0.287756 0.256149 0.480731 0.461772 0.479482
FIVES3 0.327957 0.462661 0.913703 0.283766 0.298951 0.467167 0.515270 0.420968
HEDJ1 0.348749 0.460112 0.334134 0.893855 0.347834 0.500949 0.257096 0.268690
HEDJ2 0.307411 0.360250 0.233231 0.865183 0.370366 0.479805 0.229944 0.168396
HEDJ3 0.350595 0.310396 0.236651 0.878318 0.348520 0.486835 0.147497 0.171482
JID1 0.342363 0.352584 0.321133 0.387724 0.944465 0.372041 0.351060 0.280824
JID2 0.325616 0.322621 0.293783 0.371677 0.955204 0.343781 0.285415 0.249564
JID3 0.319594 0.256729 0.203339 0.345341 0.846036 0.327027 0.283290 0.271362
JIT1 0.297869 0.261971 0.311140 0.368314 0.320398 0.700581 0.212400 0.172469
JIT2 0.211445 0.084613 0.175192 0.240786 0.085138 0.697774 0.113200 0.153707
JIT3 0.327940 0.377662 0.452887 0.479580 0.409370 0.808582 0.370248 0.340435
JIT4 0.341963 0.396149 0.450690 0.402290 0.254498 0.815826 0.331575 0.389779
JIT5 0.383837 0.418945 0.450137 0.511733 0.377409 0.828956 0.424409 0.475747
JIT6 0.231806 0.333704 0.389725 0.415241 0.168128 0.707018 0.333361 0.311291
KAIZ1 0.292338 0.326946 0.477471 0.229991 0.314820 0.421303 0.887688 0.557881
KAIZ2 0.369957 0.321846 0.489722 0.214996 0.293832 0.345465 0.911967 0.464973
MUDA1 0.240658 0.395839 0.441090 0.197721 0.280334 0.415458 0.540810 0.965380
MUDA2 0.254317 0.471688 0.515670 0.259426 0.271417 0.426503 0.562250 0.958078
MUDA3 0.209714 0.436141 0.468100 0.234350 0.286783 0.427196 0.528011 0.966899
OPPERF1 0.287558 0.333052 0.469014 0.256988 0.289553 0.437423 0.525315 0.607534
OPPERF2 0.258178 0.416059 0.502902 0.310492 0.299705 0.439788 0.549851 0.687546
OPPERF3 0.330621 0.419019 0.571985 0.352296 0.330904 0.533536 0.614221 0.577070
PYOKE1 0.397667 0.383960 0.432820 0.421591 0.521191 0.497200 0.432255 0.311597

170
PYOKE2 0.301203 0.366411 0.384353 0.321323 0.329606 0.409253 0.441704 0.307808
PYOKE3 0.359602 0.306848 0.347435 0.397382 0.433974 0.450724 0.313354 0.218115
QSETUP1 -0.398820 -0.442519 -0.534295 -0.351043 -0.371070 -0.520358 -0.412262 -0.335400
QSETUP2 -0.256181 -0.325886 -0.433824 -0.228426 -0.202230 -0.348760 -0.356691 -0.244705
QSETUP3 -0.247437 -0.441381 -0.427233 -0.344911 -0.314605 -0.485400 -0.348820 -0.349157
SATISF1 0.348065 0.429487 0.466171 0.390152 0.298404 0.442768 0.450073 0.445653
SATISF2 0.327913 0.458985 0.531214 0.353658 0.348966 0.529081 0.519305 0.472035
SATISF3 0.356863 0.462226 0.452761 0.261947 0.260819 0.481491 0.478233 0.465122
STANDW1 -0.284879 -0.361070 -0.487181 -0.391622 -0.429445 -0.513969 -0.305913 -0.316950
STANDW2 -0.294614 -0.316229 -0.433176 -0.295980 -0.373310 -0.424090 -0.355687 -0.372009
STANDW3 -0.308099 -0.390693 -0.431767 -0.341043 -0.334125 -0.413574 -0.368407 -0.311678
TEAM1 0.326571 0.371772 0.722641 0.271359 0.309290 0.439477 0.376568 0.448735
TEAM2 0.363562 0.413213 0.587652 0.362728 0.339294 0.509300 0.433946 0.391391
TEAM3 0.483962 0.357345 0.511569 0.412659 0.368707 0.550334 0.442308 0.409512
TPM1 0.379432 0.459233 0.499190 0.305069 0.261289 0.481034 0.441947 0.434776
TPM2 0.381879 0.440456 0.519373 0.387121 0.341412 0.517043 0.483418 0.392808
TPM3 0.325221 0.386724 0.544975 0.364606 0.341173 0.419024 0.511801 0.472110
VISM1 0.345598 0.426736 0.499723 0.286188 0.324225 0.450040 0.472791 0.478229
VISM2 0.409720 0.429597 0.518812 0.338521 0.380189 0.526947 0.499133 0.456478
VISM3 0.448448 0.344486 0.550590 0.320847 0.366506 0.446103 0.514567 0.420102
VSM1 0.271157 0.369176 0.369402 0.214367 0.209266 0.368173 0.463870 0.421437
VSM2 0.282864 0.400833 0.491550 0.298829 0.370175 0.493991 0.653193 0.590292
VSM3 0.279058 0.362305 0.368543 0.199527 0.274748 0.413471 0.525890 0.470742
WINV1 0.347919 0.283421 0.378258 0.168194 0.192401 0.374915 0.528762 0.499929
WINV2 0.359844 0.292833 0.516448 0.287932 0.346287 0.460343 0.589540 0.518796
WINV3 0.376732 0.276147 0.469233 0.253095 0.282138 0.456734 0.558311 0.468092
WINV4 0.272783 0.283767 0.417966 0.266189 0.252768 0.345259 0.377512 0.448630
WINV5 0.395880 0.418994 0.613820 0.293440 0.360588 0.508946 0.716103 0.516750

171
PYOKE QSETUP STANDW TEAM TPM VISM VSM WINV
AND1 0.292624 -0.305289 -0.293871 0.379998 0.333250 0.380359 0.299540 0.352147
AND2 0.367095 -0.281568 -0.272422 0.336071 0.306170 0.437257 0.201526 0.348708
AND3 0.371355 -0.351911 -0.294394 0.423760 0.389743 0.284999 0.289018 0.380367
CONTFL1 0.290477 -0.404125 -0.335922 0.352078 0.358036 0.319251 0.336455 0.287742
CONTFL2 0.418905 -0.475199 -0.392637 0.423485 0.493693 0.444117 0.387972 0.388683
CONTFL3 0.329144 -0.363262 -0.311617 0.330952 0.366453 0.333175 0.364586 0.277033
FIVES1 0.360375 -0.474565 -0.456957 0.591166 0.496883 0.495578 0.435217 0.500817
FIVES3 0.465152 -0.570266 -0.491110 0.675550 0.573203 0.543404 0.423914 0.572508
HEDJ1 0.394496 -0.380260 -0.343231 0.427658 0.423253 0.326605 0.291391 0.320707
HEDJ2 0.366013 -0.277384 -0.353154 0.281991 0.282470 0.252121 0.239218 0.224103
HEDJ3 0.402632 -0.324782 -0.357843 0.335639 0.313016 0.321829 0.172718 0.253591
JID1 0.507404 -0.367834 -0.459888 0.401361 0.385712 0.406436 0.323175 0.377987
JID2 0.452360 -0.362217 -0.376269 0.374355 0.315348 0.338259 0.300030 0.309827
JID3 0.395680 -0.258123 -0.348641 0.287593 0.251386 0.317259 0.284728 0.270430
JIT1 0.437205 -0.431339 -0.413236 0.337019 0.407347 0.306680 0.242692 0.275346
JIT2 0.143478 -0.154005 -0.165648 0.247403 0.155535 0.180093 0.266639 0.288625
JIT3 0.405741 -0.447820 -0.408960 0.460562 0.428946 0.434709 0.405690 0.387466
JIT4 0.452497 -0.494093 -0.461092 0.520987 0.421453 0.438820 0.403223 0.456728
JIT5 0.438743 -0.443693 -0.452068 0.509775 0.472889 0.465855 0.438017 0.438146
JIT6 0.393672 -0.428819 -0.338937 0.428898 0.421603 0.397324 0.371778 0.470496
KAIZ1 0.419088 -0.366730 -0.315858 0.389741 0.480938 0.518846 0.592501 0.572596
KAIZ2 0.420783 -0.456474 -0.398044 0.478947 0.492413 0.459672 0.547113 0.660642
MUDA1 0.303110 -0.353069 -0.354947 0.419911 0.447129 0.482576 0.542790 0.556550
MUDA2 0.349588 -0.396110 -0.413986 0.517166 0.505537 0.492467 0.575018 0.622129
MUDA3 0.296126 -0.349059 -0.339289 0.445547 0.457813 0.448641 0.525989 0.547177
PYOKE1 0.903696 -0.498908 -0.484098 0.555434 0.426619 0.558848 0.358435 0.448677
PYOKE2 0.852261 -0.452210 -0.412481 0.423006 0.352449 0.461666 0.359367 0.387255
PYOKE3 0.815502 -0.387120 -0.360492 0.402067 0.340048 0.489758 0.298940 0.389266
QSETUP1 -0.483508 0.882749 0.495763 -0.615604 -0.550003 -0.467103 -0.381388 -0.492697
QSETUP2 -0.314069 0.767795 0.339276 -0.403271 -0.455992 -0.404056 -0.397390 -0.406346
QSETUP3 -0.477036 0.782283 0.418504 -0.513065 -0.498788 -0.367977 -0.415618 -0.419483
STANDW1 -0.492403 0.462436 0.837218 -0.522242 -0.462500 -0.472436 -0.359791 -0.468059
STANDW2 -0.396267 0.382766 0.873734 -0.541028 -0.400754 -0.403112 -0.369347 -0.471119

172
STANDW3 -0.389904 0.484786 0.876902 -0.515265 -0.440588 -0.451087 -0.443874 -0.436019
TEAM1 0.418295 -0.538236 -0.466603 0.774833 0.528258 0.446099 0.444933 0.587701
TEAM2 0.460735 -0.576378 -0.547214 0.911343 0.575539 0.457010 0.520854 0.603697
TEAM3 0.516745 -0.521448 -0.557404 0.895112 0.572855 0.469381 0.471237 0.615377
TPM1 0.355259 -0.568567 -0.428000 0.575732 0.874114 0.523880 0.449360 0.498340
TPM2 0.406840 -0.587782 -0.438882 0.582510 0.925897 0.469686 0.471253 0.518502
TPM3 0.397155 -0.478566 -0.472470 0.559684 0.849836 0.439562 0.487260 0.462375
VISM1 0.476431 -0.487809 -0.452439 0.471343 0.520703 0.905449 0.506402 0.441681
VISM2 0.557720 -0.466786 -0.458433 0.482844 0.482904 0.938092 0.475321 0.438450
VISM3 0.575922 -0.448277 -0.498948 0.500480 0.485002 0.901830 0.463152 0.496476
VSM1 0.276801 -0.462207 -0.339526 0.413435 0.392034 0.390638 0.826169 0.477126
VSM2 0.411433 -0.437938 -0.454757 0.545860 0.532878 0.514817 0.879980 0.604485
VSM3 0.343854 -0.389026 -0.395872 0.493477 0.457667 0.467868 0.927273 0.486018
WINV1 0.282805 -0.363375 -0.440415 0.523135 0.403049 0.349977 0.474146 0.813123
WINV2 0.402141 -0.484536 -0.464849 0.609785 0.488556 0.413816 0.491415 0.885455
WINV3 0.399753 -0.440779 -0.423358 0.601101 0.456220 0.425566 0.516370 0.862399
WINV4 0.359004 -0.350902 -0.336912 0.519052 0.374933 0.345047 0.381235 0.702961
WINV5 0.495262 -0.554988 -0.486744 0.599271 0.545089 0.502120 0.575701 0.839164