“exploring solutions beyond the obvious reflects our ...€¦annual report2000 “exploring...
TRANSCRIPT

Annual Report2000
“ Exploring solutions beyond the obvious ref lects our commitment
to the future.”

137th Annual Report 2000Swiss Reinsurance Company
Swiss ReMythenquai 50/60P. O. BoxCH-8022 Zurich
Telephone +411 285 21 21Fax +411 285 29 99Internet www.swissre.com
Published April 2001

Dealing with the climate meansdealing with uncertainty. It is ascientific fact that global warm-ing is taking place, so whatdoes this mean for Swiss Reand, ultimately, for society?What are the risks; how andwhen will their effects be felt?What can and must be done tocounteract this trend? Findingpractical answers to these ex-tremely complex questions isimperative, and a challengewhich fascinates me day afterday.
Gerry LemckeClimate and Natural HazardsSpecialist, Swiss Re, Zurich
Boo
km@
rk: m
ore
abou
t Ger
ry L
emck
e at
ww
w.s
wis
sre.
com
Water: risk and opportunity
Water is an important andmulti-faceted topic. It embod-ies the double-edged sword ofrisk and opportunity with itspower not only to save but alsoto destroy life. Seven special-ists who have a link with Swiss Re explain what theyfind so fascinating about wa-ter, and where their individualprofessional and personalchallenges lie. For more information, visitwww.swissre.com (click Inve-stor Relations/Annual Report-ing 2000/Annual report –comprehensive overview / Por-traits of water specialists)

Performance of Swiss Re sharesand key figures
An investor who investedCHF100 000 in Swiss Reshares at the end of 1990 andreinvested all subsequentdividends, share rights, andthe1996 par value repaymentof CHF10, without investingany new funds, held a posi-tion with a market value ofCHF1119 267 on 20 April2001.The total performanceamounts to 1019.3% or anaverage of 26.4% per year.
An investment of CHF100 000 in the total Swissmarket at the end of 1990would have increased in valueto CHF 551712 on 20 April2001 (basis: Swiss Per-formance Index with reinvest-ment of income).The totalperformance amounts to451.7% or 18.0% per year.
Key figures
CHF millions 1999 2000 Change in %
Gross premiums written 20 661 26 057 26Premiums earned (net) 18 051 22 081 22– Non-Life Business Group 8 916 11 530 29– Life & Health Business Group 7 311 8 330 14– Financial Services Business Group 1 824 2 221 22Net income 2 446 2 966 21Shareholders’ equity 24 832 22 787 –8
Combined ratio Non-Life in % 122 117Return on operating revenues Life&Health in % 9.3 9.2Return on total revenues Financial Services in % 24.4 11.9Return on investment in % 8.8 10.0Return on equity in % 10.9 11.9
Earnings per share in CHF 171 208 22Dividend per share in CHF 50 50*
Number of employees 9 010 9 585 6– of which in Switzerland 2 870 2 841 – 1* Subject to approval by the General Meeting, not including a capital repayment of CHF 8 per share
in %
100
90
80
70
60
50
40
30
20
10
0
–10
1991 1992 1993 1994 1995 1996 1997 1998 1999 2000 2001* 1991–
2001*
p.a.
Annual performance of Swiss Re shares (left-hand scale)
Annual performance of Swiss Performance Index (left-hand scale)
Price of Swiss Re share weekly (logarithmic right-hand scale)
Source: Datastream
*as of 20 April 2001:
Closing share price: CHF 3 361, Stockmarket capitalisation: CHF 47 904 million
Performance of Swiss Re shares and the Swiss Performance Index from 31 December 1990 to 20 April 2001
in CHF
4000
34003000
2600
2200200018001600
1400
1200
1000
800
600
400
300

1 Swiss Re Annual Report 2000
Contents
Performance of Swiss Re shares and key figures
Annual report of the Chairman and the Chief Executive Officer 2
Board of Directors 4
Executive Board 5
Business report Financial year 2000 7Non-Life Business Group 10Life & Health Business Group 15Financial Services Business Group 18Corporate Centre 23Income reconciliation 25Capital management 26Group risk management 28Recent events and outlook 30
Spotlightse-business 33Environmental report 34Social report 35Rüschlikon 36
Group financial statementsIncome statement 39Balance sheet 40Statement of shareholders’ equity 42Statement of comprehensive income 43Statement of cash flow 44Notes 46Report of the Group auditors 85
Annual report Swiss Reinsurance CompanyIncome statement 89Balance sheet 90Notes 92Proposal for allocation of profit 98Report of the statutory auditors 99
Glossary 101
Financial years 1997–2000 105
Swiss Re securities 106
Chart analysis 107

2 Swiss Re Annual Report 2000
Peter Forstmoser Chairman of the Board ofDirectors
Fellow shareholders, colleagues, ladies and gentlemen
In the year under review, Swiss Re once again achieved a strong increase in profits, which rose by
21.3% from CHF 2 446 million in 1999 to CHF 2 966 million in 2000. Earnings per share rose
from CHF 171 in 1999 to CHF 208 in 2000. This result is the latest in a long series of marked
improvements. Over the past six years – in other words, since the strategic reorientation of the Group
and the sale of our direct insurance interests in 1994 – profits have grown by an average of 22% per
annum.
The Board of Directors will propose to the Annual General Meeting an unchanged dividend of CHF 50
and, in addition, a capital repayment of CHF 8 per share. The nominal value of Swiss Re shares is
currently CHF 10, and would reduce to CHF 2 after the capital repayment. In addition, the Board of
Directors will propose a 20-for-1 split of the shares, which should increase the liquidity of the stock in
the marketplace.
The present accounts have been prepared in accordance with new basis Swiss GAAP accounting stan-
dards (explained in detail on p. 83–84 of this report) – which significantly improve both the quality
and the breadth of information on our operations when compared with the previous method. With this
new accounting basis, our reporting will in future focus on our three business groups: Non-Life rein-
surance, Life & Health reinsurance and Financial Services, as well as the Corporate Centre.
In 2000, the three business groups showed varying development: after several years of fierce com-
petitive pressure, the non-life business benefited from signs of recovery. Premium income was up 29%,
from CHF 8 916 million in 1999 to CHF 11 530 million in 2000. Operating income rose by no less
than 43% to CHF 2 164 million (1999: CHF 1 513 million). The European winter storms Lothar
and Martin – which had a substantial impact on results in 1999 and also left their mark on the fig-
ures for 2000 – were a key factor prompting firmer pricing in non-life reinsurance. This process is still
very much under way, and we confidently expect to see further sharp improvements in the perfor-
mance of the non-life business.
We are now probably witnessing the end of one of the most severe periods of “soft market” conditions
ever experienced by the traditionally cyclical non-life reinsurance business. Swiss Re emerges con-
siderably strengthened from this difficult period because, throughout the cycle, our priority has been to
maintain a strong balance sheet. This is apparent from two indicators: equalisation reserves totalled
CHF 1 788 million at the end of 1995 and CHF 3 019 million at the end of 2000. The reserve ratio,
which includes equalisation reserves, was 244% of premiums at the end of 1995 (when the soft mar-
ket began), and at the end of 2000 it stood at 337%. These figures indicate that we have consistently
adhered to our standards for prudently establishing claims reserves and provisions for major catastro-
phes, even if the results reported by the company suffered as a consequence. Thus, we are now well
placed to benefit from the expected upturn in the non-life business cycle.
Our life and health reinsurance business continued the positive development of recent years with pre-
miums rising by 14%. The operating result decreased by 4% to CHF 1 447 million attributable to a
reduction in the capital gains realised as the life and health business took capital losses on bonds to
maximise the Group’s investment strategy. The fundamental performance of our Life & Health Busi-
ness Group continues to be very strong, exceeding management’s targets, and is an important and sta-
ble contributor to Swiss Re’s overall growth.
Annual Report of the Chairman and the Chief Executive Officer

7
Walter Kielholz Chief Executive Officer
The financial services business comprises a selected range of activities. Results for 2000 were marked by
an above-average number of major loss events for large industrial risks and weather contracts and the
absence of a significant gain realised on the sale of our 20% interest in Credit Suisse Financial
Products in 1999. In addition, in the area of run-off covers, provisions for policies from the previous
year had to be increased. Consequently, the excellent results achieved in 1999 could not be repeated in
2000. However, our belief in the business remains strong, particularly as the traditional non-life cycle
continues to tighten.
After a series of very successful years, the Group's asset management entities achieved another out-
standing return on investments of 10.0%, despite difficult market conditions. The decision to reduce
the equity positions early in the year was very beneficial, generating significant gains and reducing the
exposure to the later downturn of the markets.
Swiss Re’s Corporate Centre essentially manages the Group’s most important shared resources and
functions: finances, risk, human resources, information technology, brand and reputation.
For the last two years, our Group has been committed to the “Triple 20” programme, which sought to
respond to the harsh competitive environment and the downward phase of the business cycle by focus-
ing the company’s efforts on improving operating results. Today, we can report progress: a turnaround
has been achieved in non-life underwriting results, underpriced natural hazard risks have been largely
eliminated, total natural hazard exposure has been reduced and – a particularly important achieve-
ment – productivity has been improved dramatically, with costs rising at a considerably slower rate
than premium income despite further expansion of the Group. The successes of the Triple 20 programme
have made the company significantly more efficient. This puts Swiss Re in a strong position to now
capitalise on the improving markets in which we compete.
We are convinced that all three sectors of the business are extremely well positioned in the global mar-
ketplace. They hold a leading position in their respective markets, and they are leaner and fitter than
just a few years ago. They have demonstrated their powers of innovation, can offer our clients a com-
prehensive range of products and they are underpinned by a strong financial base. In the future, Swiss
Re will go on to even greater recognition as one of the world’s leading successful financial services
groups.
On behalf of the Board of Directors and the Executive Board, we would like to take this opportunity to
thank the employees who, at our offices throughout the world, devote all their energies to the success of
the Group – day in, day out. We would also like to thank our clients and shareholders, who repeatedly
place their trust in our company, even at a time when the global financial services industry is under-
going rapid and radical changes. Your continuing loyalty cannot be taken for granted, and it is sin-
cerely appreciated.
3 Swiss Re Annual Report 2000

4 Swiss Re Annual Report 2000
Board of Directors Peter Forstmoser Chairman 2002
Thomas W. Bechtler 2001
George L. Farr 2004
Rajna Gibson From 1 July 2000 2004
Bénédict G. F. Hentsch 2001
Ernesto Jutzi 2003
Walter B. Kielholz Chief Executive Officer 2002
Jorge Paulo Lemann 2003
Lukas Mühlemann Deputy Chairman 2002
Thomas Hodler Corporate Secretary
Committees Audit Committee
Compensation and Appointments Committee
Finance and Risk Committee
Investments Committee
Shareholder Relations Committee
Max E. Eisenring, our Honorary Chairman, passed away on 21 January 2001, short-ly after his 91st birthday. Mr Eisenring joined Swiss Re in 1944 as an actuary in the Life Department. In 1958 he was appointed a member of the Executive Board.From 1964 to 1979 he was Chairman of the Board of Directors. In recognition ofhis outstanding achievements, he was appointed Honorary Chairman at the AnnualGeneral Meeting of Shareholders in 1979. Mr Eisenring’s contribution and encour-agement helped Swiss Re grow into a truly international enterprise. His ability tocommunicate, his humanity and openness to new developments were exemplary.We shall long remember Max E. Eisenring with gratitude and respect.
Board of Directors
Term
expi
res
in

5 Swiss Re Annual Report 2000
Chief Executive OfficerWalter B. Kielholz1
Deputy Chief Executive OfficerRudolf Kellenberger1
Corporate Centre divisions Risk & Knowledge Finance Communications & InformationHuman Resources Technology
Bruno Porro1 John H. Fitzpatrick1 Walter Anderau Yury Zaytsev
Business groups Non-Life Life & Health Financial ServicesStefan Lippe1 John R. Coomber1 Walter B. Kielholz a.i.
Business divisions Europe Swiss Re Life & Health Swiss Re InvestorsMichel M. Liès John R. Coomber Giuseppe Benelli
Jacques E. Dubois
Americas Capital PartnersAndreas Beerli John J. Hendrickson
Asia Swiss Re New MarketsPierre L. Ozendo Erwin K. Zimmermann
Auditors PricewaterhouseCoopers Ltd
1 Members of the Committee of the Executive Board
Executive Board

“ Mastering the unpredictable needs passion, logic and intuition.”
Boo
km@
rk: m
ore
abou
t Er
ika
Ann
a S
choc
h at
ww
w.s
wis
sre.
com

7 Swiss Re Annual Report 2000
Business reportFinancial year 2000
Swiss Re’s record of outstanding earnings growth continuedin 2000 with an increase in earnings per share of 22%. TheNon-Life Business Group delivered significant improvementsin underwriting performance despite having to absorb lossdevelopments from prior years and a larger than usual contri-bution to equalisation reserves. The Life & Health BusinessGroup continued to perform strongly and the Financial Ser-vices Business Group further developed its capabilities whiledelivering exceptional returns on the Group’s investments.Swiss Re is now poised to emerge from this period of softpricing with its balance sheet strength intact, well placed totake advantage of the opportunities that lie ahead.
Gross premiums written increased to CHF 26.1 billion, a rise of 26% over1999, while net premiums earned grew by 22%. The Non-Life Business Groupincreased its premium volume by 29%. The acquisition of Underwriters Re inMay 2000, together with growth in North America and Europe, more thanoffset any losses from business cancelled through Swiss Re’s drive to improveprofitability during the renewal process. Premiums in the Life & HealthBusiness Group increased by 14% to CHF 8.3 billion. The completion of newAdministrative ReinsuranceSM (Admin Re) transactions – as well as the inclu-sion of the first full-year policy revenue on certain second-half 1999 Admin Retransactions – more than counterbalanced any impact from the remaining run-off of US medical business. The Financial Services Business Group increasedpremiums to CHF 2.2 billion, up 22% compared to the prior year.
The combined ratio in the Non-Life Business Group improved from 122% to117%, primarily due to an absence of natural catastrophes on the scale ofthose seen in 1999. In the Life & Health Business Group, continuing goodoperating profitability was mainly driven by strong returns from Swiss Re’sAdmin Re business.
Swiss Re achieved a record investment result of CHF 9.1 billion, up 22% onthe prior year. The return on investment was 10%, compared with 8.8% in1999, marking the fifth year in a row of a return at or above Swiss Re’s long-term target rate of 7%. This was achieved despite generally mixed market con-ditions.
Amortisation of goodwill increased from CHF 211 million in 1999 to CHF 310million in 2000, mainly related to the acquisition of Underwriters Re. Severalother smaller acquisitions – such as of Washington International Insurance Com-pany and Società Italiana Cauzioni – also contributed to the increase.Amortisation of all intangible assets arising from acquisitions increased fromCHF 453 million in 1999 to CHF 580 million in 2000. This includes the amor-tisation of goodwill and the effects of amortising the acquired present value offuture profits from life and health acquisitions including Admin Re transactions.This latter component is included in the results for the Life & Health BusinessGroup.
The sea is probably one of themost unpredictable forces ofnature, a quality which hascharacterised all the activitiesassociated with it, such asfishing, sport, trade – as wellas reinsurance. While devel-oping an online rating tool for yacht business, my majorchallenge was to identify theconstants that govern theunpredictability of maritimeactivities. In order to do so, you need not only passion andlogic, technical know-how,experience and perseverance,but also intuition. Creating anelectronic tool for the web-based reinsurance of yachtswas previously consideredalmost impossible. It is great to lead the team that has man-aged to cope with that chal-lenge.
Erika Anna SchochMarine centre of competence,Swiss Re, Zurich

1999 2000
Earnings per share in CHF 171 208Return on equity in % 10.9 11.9
8 Swiss Re Annual Report 2000
Other operating expenses increased from CHF 2.8 billion to CHF 3.1 billion,mainly due to the acquisition of Underwriters Re, as well as continued invest-ment in information technology and e-business to achieve Swiss Re’s efficiencytargets. The Group also incurred restructuring charges of CHF 110 million in2000; this relates to various initiatives being undertaken by the Non-LifeBusiness Group to improve operating efficiency – most notably the merger of theformer divisions Bavarian Re and Europe which was announced in early 2001.
Shareholders’ equity decreased from CHF 24.8 billion to CHF 22.8 billion.This ref lects a reduction in unrealised gains on equity securities, due to move-ments in world stock markets in 2000. The effect of net income in 2000 waspartly offset by payments made to shareholders in the form of dividends andshare repurchases.
Swiss Re’s effective rate of taxation declined from 24% to 19%, due to a numberof one-off changes which took effect this year.
The Group’s net income increased by 21% to CHF 2 966 million; earnings pershare increased from CHF 171 to CHF 208, continuing the Group’s record ofdouble-digit earnings growth. Return on equity increased from 10.9% to 11.9%.
Investments
Following a good first quarter, most equity markets declined throughout 2000,ending an extended period of exceptionally high returns on equities. The well-publicised fall from grace of the technology, media and telecommunicationsstocks and the peaking of the US economy both contributed largely to this set-back. In the favourable market conditions at the beginning of the year, Swiss Reactively reduced its exposure to equities by eight percentage points. In addi-tion, 10% of the remaining equity portfolio was hedged against potential losses,including a portion of key holdings in financial stocks. Both actions paid offhandsomely, leading to substantial realised gains and significantly reducedexposure to the subsequent equity market decline.
Interest rates in most major markets peaked around the beginning of the year,helping to support high average earnings on the fixed income portfolio andthereby contributing to Swiss Re’s strong investment result. Rates then recededthroughout the year, most notably in the US, leading to price appreciation onthe fixed income portfolio. By focusing early in the year on long durations in itssubstantial USD portfolio, Swiss Re achieved a relative performance on the fixedincome portfolio far in excess of market indices.
Asset allocationin %
62% 34% 4% 1999
69% 26% 5% 2000
Fixed income investmentsEquitiesOther investments

9 Swiss Re Annual Report 2000
At the year end, fixed income investments accounted for CHF 62 billion, or 69%of the total portfolio, compared with 62% in 1999. This increase is attributableto company and portfolio acquisitions in the US – mostly related to Admin Re –as well as to Swiss Re's more cautious stance towards equities. These acquisitionsalso account for the growth in total investments to CHF 90 billion and for anincreased weighting of both bonds and the US dollar within the investment port-folio. Despite the high level of realised gains in 2000, Swiss Re had unrealisedgains on the investment portfolio of CHF 8.6 billion at 31 December 2000.
Expansion of the Group
The US broker reinsurance company Underwriters Reinsurance Group, Inc., of Calabasas, California, was acquired and consolidated as of 10 May 2000.Renamed Swiss Re Underwriters Agency Inc., it has been operating as a sepa-rate underwriting entity since 1 January 2001.
The remaining 65% of Società Italiana Cauzioni, Rome (“SIC”), was acquiredas of 13 November 2000. Its balance sheet is consolidated in the 2000accounts. Earlier in the year SIC, which specialises in the surety bond andcredit insurance sector, announced its co-operation with NCM, a Dutch creditinsurer and member of the Swiss Re Group.
On 1 January 2000, Swiss Re completed the acquisition of Washington Inter-national Insurance Company. It has been included as from this date in theGroup financial statements.
During 2000, there were three administrative reinsurance transactions. Admin-istrative reinsurance is the purchase of closed blocks of in-force business andcan be facilitated through either a stock purchase or reinsurance. The stock of Midland Life was purchased on 31 July 2000 for CHF 496 million. TheGroup also entered into two reinsurance-based deals with CIGNA and Unum-Provident. The results of all of these deals have been included from the date of the transactions.

10 Swiss Re Annual Report 2000
Swiss Re’s non-life premiums grew strongly in 2000, parti-cularly in European property and motor business – as well asthrough the acquisition of Underwriters Re. The combinedratio improved significantly, mainly due to the low number ofnatural catastrophes in 2000; this was partially offset, how-ever, by the adverse development of prior treaty years – in-cluding the 1999 European winter storms. At the January2001 renewal, Swiss Re secured significant improvements inreinsurance rates, terms and conditions in many markets.
Primary market
In 2000, non-life insurance showed the first signs of improvement in selectedmarkets. Pressure towards further improvement should continue to build, particularly in those markets which have so far withstood the general priceincrease – thereby holding overall market performance nearer to 1999 levels.
The US market saw a partial reversal in the rate deterioration of the last fewyears; this, together with the market’s strong economic activity, contributed toa premium volume growth of 5%. In the future this should lead to a lowercombined ratio, which in 2000 suffered from an unusual increase in loss fre-quency, particularly in the personal lines business.
The positive trend was less pronounced in Europe, although price increases inselected markets and lines of business at least kept pace with claims inf lation.Late loss reporting from the winter storms Lothar and Martin put additionalstrain on profitability, keeping the underwriting result comparable to the pre-vious year’s level; there are, however, good prospects for improvement in thecoming years.
Premium income in Japan stagnated in 2000, ref lecting the continuing diffi-cult economic situation. Contrary to European and US experience, the Japa-nese insurance industry was affected by natural disasters which weighed heavilyon overall performance.
Reinsurance market
In 2000, the non-life reinsurance markets saw a clear, though still small, rever-sal of pricing trends. After years of downward pressure, global prices stabilisedin 1999 and then picked up during 2000. In retrospect, this is a further con-firmation that the breakdown of the retrocession market in London at the endof 1999 was a definite turning point from a soft market into a general ratehardening.
Non-Life Business Group

Premiums earned by currency in %
Strong premium growth despite a drive to reduce unprofitable business
■ USD 40.3■ EUR 28.8■ GBP 11.2■ JPY 2.2■ AUD 2.3■ CAD 2.2■ CHF 1.3■ other 11.7
11 Swiss Re Annual Report 2000
This favourable trend has had a positive impact on business newly written in2000. Overall, however, the reinsurance market was affected by late reportingof claims from previous years, leading to an estimated combined ratio for theglobal reinsurance industry somewhat below the level of 1999. This, togetherwith the unfavourable stock-market development both in 2000 and 2001 year-to-date, has increased pressure on reinsurers to push through significant rateincreases, both during the renewals in January and April 2001 and throughoutthe remainder of the year.
Non-Life Business Group results
CHF millions 1999 2000 Change in %
RevenuesPremiums earned 8 916 11 530 29Net investment income 1 564 1 722 10Net realised investment gains 1 904 2 459 29
ExpensesClaims and claim adjustment expenses – 7 980 – 10 143 27Acquisition costs – 2 062 – 2 653 29Other operating costs and expenses – 829 – 751 – 9
Operating income 1 513 2 164 43
Claims ratio in % 90 88Expense ratio in % 32 29Combined ratio in % 122 117
Net premiums earned
Net premiums earned increased by 29% from 1999 to 2000, due to growth inEurope and North America, the acquisition of Underwriters Re in May 2000and the continuing weakness of the Swiss franc against other major currencies.Swiss Re was able to replace a sizeable portion of its underperforming contractswith better-priced business and increased participations. A shift from lower,more loss-exposed layers to higher, less loss-exposed layers has also improvedSwiss Re’s premium-to-risk ratio.

12 Swiss Re Annual Report 2000
Combined ratio
The measures taken since 1999 to reduce the non-life combined ratio haveshown improvement: a drop from 122% in 1999 to 117% in 2000. This im-provement underlines Swiss Re’s determination to keep to sound underwritingprinciples and also ref lects the low number of natural catastrophe losses inmost regions. It was partially offset by more medium-sized man-made losses,such as fires, explosions and pharmaceutical liability claims. A continuing nega-tive inf luence from adverse loss developments of prior treaty years, particularlyrelating to the 1999 storms Lothar and Martin, prevented an even more pro-nounced improvement in 2000. In addition, Swiss Re made a larger than nor-mal contribution to equalisation reserves of CHF 691 million. Excluding theeffects of this contribution, and the effect of Lothar and Martin on year-2000results, the combined ratio was 110% – a meaningful improvement over the1999 baseline figure of 114% (the baseline combined ratio adjusts for the im-pact of losses above or below expectations).
Operating result
The operating result rose by 43% from CHF 1 513 million in 1999 to CHF 2 164 million in 2000. Markedly higher investment returns, lower oper-ating costs and expenses and an improved claims ratio led to this significantimprovement.
Technical reserves
Swiss Re’s technical reserve ratio in the Non-Life Business Group decreasedfrom 399% to 337%, driven mainly by the strong growth in premiums earnedin 2000 and the impact of foreign exchange movements.
Lines of business
PropertyDespite the termination of certain under-performing contracts, property busi-ness achieved a robust earned-premium growth of 34% over 1999. The acquisi-tion of Underwriters Re accounted for one-third of that growth, but it also be-nefited from increased rates and new sources of business in Europe and NorthAmerica. Moreover, premium income for the underwriting year 1999 had beenunderestimated and was therefore revised upwards. Substantial price improve-ments following the winter storms which hit Western Europe in the last days of1999 will only show their effect in 2001, since most reinsurance contracts hadalready been concluded for 2000 at the date the events occurred.
Property claims experience improved substantially and a significant contri-bution to the equalisation reserves was made. Claims and claim adjustmentexpenses in Europe dropped by more than 20%. There was also a markedimprovement in Asia, where in 1999 reinsurers had suffered from a high inci-
Results improve in difficult conditions
CHF millions 1999 2000
PropertyPremiums earned 2 869 3 850Combined ratio in % 130 129

13 Swiss Re Annual Report 2000
dence of natural catastrophes. Although these are only first steps towards satis-factory profitability in this line of business, the signs are promising that a posi-tive trend will continue in the years to come. Results were affected negativelyby some significant losses from man-made events, such as the explosion of anoil refinery in Kuwait, a chemical plant in Texas, a coal mine in Utah (USA)and a fireworks factory in the Netherlands. Natural events such as storms andearthquakes produced a much lower loss burden for the insurance industry in2000 than in 1999: USD 7.6 billion as against USD 24.4 billion. According toexperts, though, this single year experience does not change the trend towardsgreater frequency and severity of losses from natural catastrophes in the world.
LiabilityGrowth was less pronounced in liability, with earned premiums rising by only5%. Again, the portfolio of Underwriters Re made the largest contribution tothis increase. Solid growth in certain lines of business, such as professionalindemnity in Europe, helped to compensate for the absence of some large sin-gle transactions which were recorded in 1999. In industrial liability, the chal-lenge of overcapacity continued, impeding the improvements in original ratesand reinsurance terms seen in other business segments. Swiss Re thereforemaintains its cautious underwriting approach – and has noted indications of awider movement to sounder underwriting at the January 2001 renewal.
Swiss Re’s prudent acceptance policy kept its liability result at a very satisfacto-ry level, despite the adverse development of prior underwriting years – mainlyin product liability – and some large losses, such as the Kaprun tunnel fire inAustria. Swiss Re has also benefited from its conservative reserve-setting inasbestos and environmental exposures, which resulted in a positive contribu-tion from some successful commutations agreed in 2000.
MotorEarned premiums grew strongly by 35%, benefiting from new business as wellas increased original rates. Premium volume grew in almost all geographicalareas, with the UK as the most productive market. Re-underwriting also led tomore favourable terms and conditions in the existing portfolio, particularly fornon-proportional business in Germany, France, the UK and Switzerland.
Results improved significantly, ref lecting the absence of large loss events as wellas the continued upward move of original rates in a number of key Europeanmarkets and in the US. These developments bolstered proportional results,while non-proportional business benefited from better reinsurance terms andconditions.
AccidentThe solid 74% growth in accident premiums stems primarily from workers’compensation in the US, where rates started to harden significantly followingthe Unicover failure.
CHF millions 1999 2000
LiabilityPremiums earned 2 220 2 326Combined ratio in % 108 106
CHF millions 1999 2000
MotorPremiums earned 1 860 2 520Combined ratio in % 134 118
CHF millions 1999 2000
AccidentPremiums earned 511 889Combined ratio in % 95 115

14 Swiss Re Annual Report 2000
The accident underwriting result worsened as a consequence of two factors.Firstly, additional reserves had to be established for losses from prior under-writing years. Secondly, new business written in the US had to be reserved at acombined ratio well in excess of 100%. In this business line, however, a nega-tive result for newly-accepted covers in the first underwriting year is normal asthe profit will only emerge in future years, in the form of investment returns.
Other linesThe 34% rise in earned premiums is mainly attributable to marine business andthat portion of credit and surety programmes underwritten in the Non-LifeBusiness Group. Marine premium volume increased worldwide, with thestrongest growth recorded in the US – in part through the consolidation of the Underwriters Re portfolio. Engineering saw modest premium growth dueto Swiss Re’s restrained underwriting approach; terms and conditions in thisbusiness segment have still not reached a satisfactory level.
Underwriting results improved in all business lines, with marine showing a par-ticularly strong increase. Positive developments from previous years helpedboost profitability through the consequent release of reserves established inprior years. Engineering could not escape a generally depressed market situa-tion and also felt the effects of a large f lood loss in Northern India.
Outlook
Swiss Re sees clear signs of a recovery from the prolonged soft phase of thenon-life business cycle and expects a markedly positive development in thecoming years. Improvements are being recorded in original premium levels aswell as in reinsurance conditions. The newly formed Non-Life Business Groupwill further sharpen Swiss Re’s skills and processes to exploit this marketupturn and offer superior value to clients.
Strict underwriting discipline and focused deployment of capacity have alreadybrought a significant improvement in Swiss Re’s book of business during theJanuary 2001 renewal negotiations. Swiss Re is determined to continue theseefforts, giving particular attention to consistent and thorough assessment ofexposures and allocated capital in relation to potential returns.
Swiss Re continues with initiatives to optimise internal business processes andachieve strategic cost leadership. New, specific e-business applications, current-ly in the implementation phase, are key drivers in transforming Swiss Re’s mid-dle and back office operations into an efficient and lean business-support unit.The first results of these changes are already visible.
CHF millions 1999 2000
Other linesPremiums earned 1 456 1 945Combined ratio in % 120 109

Premiums grew by 14% for Swiss Re’s Life & Health BusinessGroup in 2000. The operating result decreased by 4% to CHF 1 447 million due to reduced realised gains as the busi-ness group took capital losses on bonds to maximise theGroup’s investment strategy. The fundamental performanceof the Life & Health Business Group continues to be verystrong exceeding management targets.
Primary market
Strong growth continues in the life and health insurance industry. This growthis likely to be sustained into the future by the market responses to the chal-lenges facing national social insurance programmes and the resulting need forprivate provision.
In the US market, consolidation has continued as companies seek the capitaland cost efficiencies of increased scale. Insurers have redesigned their products,often using reinsurance to reduce both earnings volatility and capital require-ments. Primary life insurers are also managing their cost base and capitalrequirements by selling blocks of in-force business.
In several European countries, market developments centre around social secu-rity reforms, mainly in relation to pensions. The impact on life reinsurancerequirements has so far been minor. The UK market in 2000 was stronglyinf luenced by capital and cost pressures which have prompted consolidationand demutualisations. The strains on capital resources have simultaneouslyheightened interest in reinsurance as a capital management tool.
In Japan, the market situation continues to be affected by some legacy prob-lems specific to the industry, as well as general economic uncertainties.Elsewhere in Asia, primary market trends are generally positive, ref lecting thehigh level of personal responsibility for welfare provision and a cultural biastowards savings.
Health business continues to offer unfulfilled potential in a number of marketsworldwide. While a global trend towards privatising health and welfare provi-sion means there is a growing recognition of the protection provided by healthpolicies, it has proved difficult in some countries to develop products whichboth meet policyholder needs and provide a reasonable return for insurers.Some existing health products have made losses because of unrealistic policybenefits, lax policy conditions or insufficient underwriting enquiries. Suchbusiness is not only detrimental to the interests of primary companies and rein-surers, but also ultimately disadvantageous to the consumer.
15 Swiss Re Annual Report 2000
Strong growth and consolidation: opportunities for reinsurers
Health – still seeking the properbalance
Life & Health Business Group

16 Swiss Re Annual Report 2000
Reinsurance market
Cost and capital pressure on primary companies during 2000 has stimulateddemand for reinsurance in key markets. Life reinsurance in particular has bene-fited both from strong growth in direct insurance and the ceding of more mor-tality risk to reinsurers. While competition among reinsurers has been intense,this has not led to a systematic underpricing.
Life & Health Business Group results
CHF millions 1999 2000 Change in %
RevenuesPremiums earned 7 311 8 330 14Net investment income 1 839 2 530 38Net realised investment gains 655 453 – 31
ExpensesClaims and claim adjustment
expenses; life and health benefits – 6 119 – 7 448 22Acquisition costs – 1 732 – 1 912 10Other operating costs and expenses – 449 – 506 13
Operating income 1 505 1 447 – 4
Management expense ratio in % 4.9 4.7Return on operating revenues in %1 9.3 9.21Operating revenues include premiums earned and net investment income
Premiums for life business grew by 17% in the year 2000. If adjustments aremade for distorting factors – exchange rate movements and a large single pre-mium treaty in 1999 – the underlying rise was 12%. Life Admin Re premiumsmore than doubled, thanks both to the full-year effect of 1999 transactions andto new deals in 2000. Traditional business benefited from strong demand forlife reinsurance in the North American and UK markets.
Health business premiums were 5% higher than in 1999; if exchange rate dis-tortions are eliminated, however, the underlying figures show a decline of 1%,which ref lects withdrawals from unprofitable lines. The run-off of US medicalbusiness is now essentially complete, contributing positively to results for 2000.
Premiums by region
Good underlying growth for lifebusiness
CHF millions 1999 2000
PremiumsLife 5 514 6 439Health 1 797 1 891Total 7 311 8 330
■ North America■ Europe■ Rest of world

17 Swiss Re Annual Report 2000
The operating result of CHF 1 447 million was modestly below the 1999 levelof CHF 1 505 million due to a reduction of CHF 202 million in net realisedgains. The reduction in capital gains was due to capital losses the businessgroup took on bonds to maximise the Group’s investment strategy. Operatingperformance exceeded management targets. Life business in particular per-formed well, with North America providing the main impetus. During 2000,Swiss Re undertook three major Admin Re transactions, with Cigna Re,Midland Life and UnumProvident. These transactions involved total investedcapital of CHF 1.3 billion and added CHF 6.1 billion to the Group’s assets.Health business results in 2000 also improved compared to 1999, but remaineddisappointing, due primarily to adverse performance in Latin America andAustralia. Unprofitable business is now in the course of being run off.
The management expense ratio (other operating costs and expenses in relationto operating revenues) declined in 2000. A continued focus on cost efficiencyand the implementation of new systems should together generate further sav-ings in the next two years.
Outlook
Demand for traditional life reinsurance in the US should remain strong. Pri-mary companies will continue to need the specialised capital and risk-manage-ment solutions which leading reinsurers offer. In addition, the extension ofprimary market distribution channels, especially through banks, will create newreinsurance opportunities. Swiss Re's strong market position and full-servicecapability mean that the Group is well positioned to satisfy clients’ needs in all these areas of business. Continuing consolidation and rationalisation in theprimary market should also sustain the demand for Admin Re.
In Europe, the welfare and health-care provision regimes are likely to changesignificantly in the medium term; insurance and reinsurance products will needto be developed or adapted to respond to evolving conditions. Swiss Re will beworking closely with clients to meet these challenges.
In Asia, and particularly in Japan, insurance and reinsurance markets will bestrongly inf luenced by general economic conditions. Liberalisation of the insur-ance markets in China and India should provide new reinsurance opportunitiesfor Swiss Re over the long term.
Admin Re: a market-leading capitalmanagement tool
Global opportunities for a full-servicereinsurer

18 Swiss Re Annual Report 2000
Swiss Re’s strategy in response to the convergence of thereinsurance and financial services industries has been tobuild up its ability to address clients’ capital managementneeds through its divisions Swiss Re New Markets, CapitalPartners and Swiss Re Investors. In early 2001, Swiss Re an-nounced the next step forward in this strategy by combiningthese divisions into the new Financial Services BusinessGroup.
Through this business group, Swiss Re offers a unique range of insurance-basedcapital management solutions covering the spectrum from risk financing andrisk transfer to asset management and merchant banking. The strategy is both asector play – the target clients are insurance companies, other financial institu-tions and corporates with risk-related needs – and a theme play, ie the solu-tions all benefit from Swiss Re’s expertise in the risk and capital managementfield. The growth potential in this field is attractive, given the market trendstowards convergence, the expanding capital and risk management needs of theclients, Swiss Re’s established track record of innovation, and the strong fran-chise Swiss Re has with clients.
During 2001, work already in progress will create the synergistic benefits fromcombining these product businesses into one organisation, while still continu-ing Swiss Re’s efforts to achieve profitable growth in each business on a stand-alone basis. Being an integrated financial solutions provider should result inabove-average growth and return on capital. The main synergies are expected tocome from greater cross-referrals and cross-selling between units based on abetter understanding of client needs. In addition, more efficient and effectiveoperations should be set up by combining common processes, for instance inrisk management, financial management and client account management.
Financial Services Business Group results
CHF millions 1999 2000 Change in %
RevenuesPremiums earned 1 824 2 221 22Net investment income 422 458 9Net realised investment gains 659 738 12Other revenues 97 217 124
ExpensesClaims and claim adjustment expenses – 1 382 – 2 040 48Acquisition costs – 179 – 318 78Other operating costs and expenses – 708 – 845 19
Operating income 733 431 – 41Return on total revenues in % 24.4 11.9
Financial Services Business Group

19 Swiss Re Annual Report 2000
Results for 2000 were marked by the above-average number of major loss eventsin the sectors of large industrial risks and weather contracts and the absence of aCHF 341 million gain realised on the sale of the Group’s 20% interest in CreditSuisse Financial Products in 1999. A detailed view is structured around classesof products which share similar economic characteristics: credit, structured riskfinance, corporate risk underwriting, asset management, private equity, and the equity and fixed income business.
CreditThis business area consists of Swiss Re New Markets’ credit and surety reinsur-ance and structured credit solutions businesses as well as Swiss Re’s interest inthe primary credit and surety insurer NCM.
Swiss Re extended its leading position by exploiting its prudent credit riskmanagement and underwriting expertise while also benefiting from a favourableeconomic situation in Europe. In the US, Swiss Re significantly increased andconsolidated its position in the credit and surety business despite an environ-ment characterised by sharp increases in the number of insolvencies in the con-struction industry and a deterioration of overall credit quality after 10 years oflargely uninterrupted economic growth. Appropriate underwriting adjustmentshave been implemented to guard against these adverse factors undermining thequality of the credit portfolio. Furthermore, Swiss Re is a leading provider ofstructured credit products for corporates and banks. It expects continued strongdemand for tailor-made solutions in the future.
In its core markets, NCM, a primary credit insurer, maintained its strong mar-ket positions, and further expanded its business activities with the acquisitionof SIC (Società Italiana Cauzioni), the leading primary surety provider in theItalian market.
In total, the unit achieved a moderate growth of gross revenues at stable mar-gins, despite highly competitive conditions in the major credit markets andgeneral deterioration in credit quality. In order to further reduce operatingcosts, Swiss Re has investigated possibilities to deliver some of its short-termcredit products through electronic platforms. Such solutions are expected tohave an economic impact in the coming years.
Structured risk financeThis product unit includes finite reinsurance for non-life and certain productspecialities of structured finance for life, loss portfolio run-off solutions and thealternative asset reinsurance business.
Swiss Re experienced sustained strong demand for sophisticated, risk-based,corporate finance solutions, which resulted from the continued convergence ofthe banking and insurance sectors. Very good performance was seen in alterna-tive asset reinsurance, contingent capital, life financial reinsurance solutions,and special asset-backed risks. In the run-off business, the unit closed a modestnumber of new transactions, ref lecting both Swiss Re Financial Services’ con-tinued disciplined approach to this business, and the fact that the run-off mar-ket in general was very competitive.
CHF millions 1999 2000
CreditPremiums earned 860 874Net investment income1 68 75Other revenues2 25 35Gross revenues 953 984
CHF millions 1999 2000
Structured risk financePremiums earned 403 400Net investment income1 333 528Other revenues2 28 65Gross revenues 764 993
1 including current income, realisedgains and trading returns
2 including fees, commissions andincome on deposits

Swiss Re New Markets’ solid position as the market leader for risk-based corpo-rate finance solutions was recently confirmed when it was nominated“Alternative Risk Solutions House of the Year” by the industry publication Riskmagazine. Innovative structured transactions for Enron, Michelin, Royal Bankof Canada, and Arby’s were cited as prime examples of Swiss Re’s ability todeliver sophisticated solutions for its clients’ expanding risk and capital man-agement needs.
Gross revenues for 2000 showed a strong increase over 1999 ref lecting growthin net investment income. In addition, the expanding portfolio resulted inincreased fee income. While new business generation was good, the structuredrisk finance business suffered in 2000 due to three main factors: losses from a small number of prior years’ stop-loss transactions; adverse development fromrun-off contracts written in prior years; and weather-related contracts due tothe extreme weather patterns in the US in the first quarter of 2000. Manage-ment has made the necessary reinforcements to reserves and has taken strong,positive measures to strengthen underwriting and risk management.
The outlook for 2001 is positive. The pipeline for new transactions remainsstrong and robust; with the hardening of the market for traditional risk trans-fer, expectations are high that demand for structured transactions will continueto grow.
Corporate risk underwritingThis product unit offers mainly facultative reinsurance products to large corpo-rate (Fortune 500) clients, financial institutions and the aviation market in thehigh-severity/low-frequency risk segment. During 2000, the risk underwritingarea implemented an aggressive, two-pronged strategy of pushing rates higher,while following a very selective client acceptance and retention policy. Thisapproach was adapted in order to improve the overall pricing and quality of itsrisk underwriting portfolio of Fortune 500 business. This strategy will continueto be pursued in 2001.
Premiums earned as well as net investment income substantially increased dueto growth especially in the accountants and aviation/space business as well asdue to new business written in marine for oil industry participants.
Property business experienced a difficult year mainly due to a series of large,man-made losses. As the market is expected to continue to harden, the effortsto narrow policy coverage, increase deductibles and increase premium levels are expected to be successful. This should mitigate the reduction of premiumvolume written as a result of decreased capacity provided in critical naturalcatastrophe areas of business.
Casualty business produced a satisfactory result with continued sound reservesetting particularly in light of the very difficult and competitive market condi-tions. Recent offers are providing evidence that market conditions are firmingup, reinforcing the optimistic outlook for 2001.
CHF millions 1999 2000
Corporate risk underwritingPremiums earned 488 842Net investment income1 243 391Other revenues2 6 1Gross revenues 737 1 234
1 including current income, realisedgains and trading returns
2 including fees, commissions andincome on deposits
20 Swiss Re Annual Report 2000

Aviation premium volume increased substantially due to growth in the spacebusiness and to the successfully managed aviation cycle, whereby Swiss Reincreased its involvement in an improving market. Swiss Re New Markets isvery optimistic that the continued growth of aviation premium levels in 2001will generate continued volume growth and an improved result in 2001.
Asset managementSwiss Re Investors manages fixed income investments and traded equity invest-ments, on behalf of Swiss Re as well as on behalf of third parties. Its presencewith dedicated units in all major financial markets centres is geared to optimis-ing investment returns on a global basis while observing intricate and dynamicrequirements concerning risk, return and liquidity. These requirements are thetypical adjunct of an insurance company's asset and liability management con-siderations. Value is added both on a market assessment level as well as on asecurity selection level. Third party assets under management increased fromCHF 4.6 billion to CHF 6.8 billion by organic growth. Proprietary investedassets under management including private equity and participations grew fromCHF 86 billion to CHF 90 billion in 2000.
For 2001, growth of assets under management is expected both in the propri-etary and in the third party segment, with a positive impact on fee income.Expenses are expected to develop at a slower pace than the fees, thus improv-ing the profitability of the product unit.
Private equity and participationsGross revenues declined due to the absence of a CHF 341 million gain realisedon the sale of the Group’s 20% interest in Credit Suisse Financial Products in1999.
Capital Partners manages in its private equity business several funds, totallingover CHF 1 billion, both for Swiss Re and for third parties. Securitas, a USD500 million fund, was formed in 1995 to invest in the insurance industry.While the insurance investing environment in 1999 was not very conducive togreat economics, the environment changed in 2000 when the pace of invest-ment activities doubled, directly committing over USD 143 million to 7 com-panies in 4 countries. The portfolio at year-end ref lected total commitments of USD 245.8 million.
Securitas Ventures, L. P., a USD 100 million fund, was formed in 2000 toinvest in early-stage companies in the insurance industry. During 2000, com-mitments were made totalling USD 13.2 million to 4 companies. Both thesefunds were funded by commitments made by Swiss Re and Credit Suisse.
Capital Partners also makes private equity investments in the non-insurancearea; this strategy allows an optimal diversification by industry sector, maturitylevel and geographical distribution. These benefits are especially manifest inEurope, which lags behind North America’s pace in terms of private equity andventure capital spending. During 2000, Swiss Re committed over CHF 284million to 11 funds. The portfolio at year-end ref lected total commitments ofover CHF 2 billion.
CHF millions 1999 2000
Asset managementPremiums earned 0 0Net investment income1 0 1Other revenues2 209 212Gross revenues 209 213
CHF millions 1999 2000
Private equity and participationsPremiums earned 0 4Net investment income1,3 359 96Other revenues2 0 0Gross revenues 359 100
1 including current income, realisedgains and trading returns
2 including fees, commissions andincome on deposits
3 1999 includes realised gains on saleof CSFP
21 Swiss Re Annual Report 2000

Capital Partners also actively manages the portfolio of Swiss Re’s direct minori-ty holdings in insurance companies. The portfolio at year-end had a marketvalue of over CHF 5 billion and a book value of approximately CHF 3.2 bil-lion.
Equity and fixed incomeThe investment bank Fox-Pitt, Kelton (“FPK”) focuses on equity brokerage(research, sales and trading) and corporate finance (M&A and equity capitalmarkets), specialising in insurance companies, banks and other financial institu-tions. In 2000, FPK was able to substantially grow gross revenues and operat-ing income, with the brokerage business contributing heavily to the increase.
Swiss Re Financial Products (“SRFP”) as a separate business unit was estab-lished at the beginning of 2001 to participate in the ongoing convergence ofinsurance and capital markets. SRFP works closely with many Swiss Re divisionsto develop synergies that will enhance existing Swiss Re businesses, therebybuilding its competitive advantage in both the insurance and capital marketsarenas. SRFP's client base is the global insurance industry and selected financialservices companies. SRFP's aim is to become a leading provider of variousforms of capital, structured investment products and financial risk managementsolutions through the integration of cash and derivative capabilities: fixedincome, credit and equity derivatives structuring, trading and distributionincluding fixed income bond sales, and trading with particular focus on insur-ance linked, asset-backed and structured credit securities.
CHF millions 1999 2000
Equity and fixed incomePremiums earned 0 0Net investment income1 21 35Other revenues2 88 177Gross revenues 109 212
1 including current income, realisedgains and trading returns
2 including fees, commissions andincome on deposits
22 Swiss Re Annual Report 2000

23 Swiss Re Annual Report 2000
The Corporate Centre acts as a strategic architect, definingGroup-wide business direction for financial and human capi-tal, information and technology, knowledge and risk, brandand communications. This supports Swiss Re’s policy of man-aging shared resources and skills efficiently while makingthem available to all business units worldwide.
CHF millions 1999 2000 Change in %
Operating expenses – 293 – 321 10
In 2000 the Corporate Centre continued its programme to improve the Group’sefficiency by making prudent investments in web technology. The CorporateCentre advanced plans to “e-enable” the Group’s systems by starting to roll outsome of the key components of the planned information technology architec-ture. It also continued to invest in ideas and technology that will maintainSwiss Re’s competitive advantage. In order to improve long-term efficiency cer-tain initiatives were undertaken to reduce the cost base – such as a reduction in the number of data centres in 2000. The Corporate Centre also completed a number of other notable achievements in 2000, including the opening ofRüschlikon, Swiss Re’s centre for global dialogue.
The costs associated with these initiatives have led to a modest increase inCorporate Centre expenses in 2000. Swiss Re is convinced that these invest-ments are essential to maintain its competitive advantage and to leverage theknowledge and experience of its employees. The Corporate Centre continuesto be focused on value for money.
Finance Division
The Finance Division provides planning and reporting information for strategicmanagement, performance assessment and external accounting. ThroughGroup-wide financial management it ensures best use of capital, balancing over-all risk and expected returns. It maintains close and continuous relationshipswith the investment community, keeping regular contacts with all stakeholders– including analysts, investors and key media.
During 2000, the division introduced new basis Swiss GAAP and enhancedGroup performance measurement for all non-life business: a major milestonetowards Group-wide integration of management reporting and control.
Risk & Knowledge Division
The Risk & Knowledge Division anticipates, monitors and reports on theGroup risk landscape from an underwriting, credit and financial risk perspec-tive. It supports Swiss Re’s strategic capital allocation process and ensures opti-mal risk diversification. Group claims reserves are based on a best practice
Increased Group-wide reporting efficiency by the implementation of the Financial Systems Architecture
Corporate Centre

24 Swiss Re Annual Report 2000
assessment of potential threats. To improve the underwriting and reportingprocess, new tools were implemented in 2000, setting Group-wide standards,enhancing underwriting quality and increasing cost efficiency.
Knowledge networks, training and publications serve to build and disseminatereinsurance skills. Swiss Re’s recent initiatives include Intranet-based trainingactivities; internal knowledge networks, which allow specialists to share andexchange information; and externally acquired and disseminated reinsuranceskills. Swiss Re’s clients can access special knowledge platforms, such as theFood Forum, and benefit from a broad expertise. The Intranet-based ‘knowl-edge portal’ enables 9000 Swiss Re employees around the globe to obtain fastaccess to the specific information they need to do their jobs.
sigma, Swiss Re’s periodic publication, is a recognised source for research arti-cles in the business and trade press; it covers developments and driving forcesin the insurance and reinsurance markets. In 2000, Swiss Re also created anInternet-based industry chart resource and began selling insurance data to itsclients.
Information Technology Division
The IT division supports Swiss Re’s global IT organisation in its dual role:enabling efficient business processes Group-wide and driving innovation. Italso ensures efficient project portfolio management and resource allocation tomake best use of synergies.
New business solutions for 2000 included a Group-wide client managementsystem to enhance global client relationships; a harmonised information archi-tecture to support worldwide risk and performance analysis; and an Internet-based knowledge management facility. A cost-efficient, standardised technicalIT infrastructure has enabled the implementation of further innovative web-enabled systems throughout the Group.
Communications & Human Resources Division
This division enhances Swiss Re’s brand recognition, maintaining its distinctcorporate profile and culture in open dialogue with all its stakeholders. It alsopromotes Swiss Re as the employer of choice for professionals worldwide:attracting, rewarding, developing and retaining the best people.
In 2000, Swiss Re enhanced its already strong brand identity through increas-ing use of web technology. Clients and other stakeholders can now access SwissRe information, services and transactions through the new Swiss Re Portal.
Rüschlikon, Swiss Re’s centre for global dialogue, opened for business inNovember 2000 – a unique, inspiring platform for meeting internal and exter-nal partners and developing new industry solutions.
Web-based applications harmonise business practices for Non-Life, Life & Health and Financial Services

25 Swiss Re Annual Report 2000
Income reconciliation
Income reconciliation
The following table reconciles the income from Swiss Re’s business groups andthe operations of its Corporate Centre with the Group consolidated netincome before tax.
CHF millions 1999 2000
Business groups’ operating income 3 751 4 042Corporate Centre expenses – 293 – 321Items excluded from the business groups:
Net realised gains/losses 370 625Amortisation of goodwill – 211 – 310Other income/expenses – 388 – 381
Net income before tax 3 229 3 655
Net realised gains or losses on own shares; amortisation of goodwill; and otherincome or expenses – such as indirect taxes, capital taxes, interest charges,restructuring costs and certain other income and expense items – have beenexcluded when assessing the performance of each business group.

26 Swiss Re Annual Report 2000
In 2000, as an integral part of its Corporate Centre activities,Swiss Re continued to build on the efficient use of its capitalbase. The active management of the capital structure – equity,debt and hybrid capital – allows Swiss Re to retain financialflexibility at a low weighted average cost of capital. Amongother initiatives in 2000, the launch of a European MediumTerm Note programme and the repurchase of Swiss Reshares exemplified the successful implementation of thisstrategy.
In 2000, Swiss Re redeemed its 1995 USD 500 million issue of 2% convertiblebonds. Due to the favourable development of the Group’s share price since1995, nearly all of the bonds were converted into Swiss Re shares. There wereno other maturities of debt or hybrid capital instruments in 2000. In order tofurther optimise its corporate capital structure, Swiss Re issued about USD 80million of long-dated structured financial debt at favourable rates.
Swiss Re also launched a European Medium Term Note (EMTN) programme, aplatform for raising funds from different investor categories in 14 different cur-rencies, up to a nominal USD 1 billion outstanding at any time. At the end of2000, pursuant to this programme Swiss Re had debt outstanding of an aggre-gate face value of USD 240.4 million, rising to USD 527.5 million by the endof March 2001.
In February 2001, Swiss Re repurchased Adjustable Conversion-Rate EquitySecurity Units (ACES), assumed in the acquisition of Life Re Corporation. Thenominal amount of the repurchases was USD 37.6 million. The remaining secu-rities were redeemed on 15 March 2001, retiring a nominal amount of USD 42million.
Share repurchases and dividend payments are both ways of returning capital to shareholders. Using both of these instruments allows Swiss Re to manage the capital base of the company efficiently. On 6 May 1999 the companyannounced a second share repurchase programme of up to CHF 1 billion, sub-ject to market conditions. As part of this programme, in 2000 Swiss Re repur-chased 72 650 shares for a total value including commissions of CHF 195.6million, which results in an average repurchase price of CHF 2 692 per share.The Annual General Meeting held in June 2000 agreed to cancel these sharesand to reduce the share capital accordingly. Swiss Re has CHF 804.7 million of remaining capacity for share repurchases.
Favourable adjustments to Swiss Re’sdebt structure
Active management of Swiss Re’scapital base
Capital management

24 8322 5661 9982 949
27 Swiss Re Annual Report 2000
Swiss Re was a net seller of own shares, at an average price well above the levelin the repurchase programme. This was achieved partly by the sale of a largeblock of shares to an institutional investor.
Outlook
Apart from a private placement of CHF 200 million which will mature on 7 June 2001, Swiss Re has no other maturities of senior debt or hybrid capitalduring this year. It does, however, plan to increase the capacity of its EMTNprogramme to USD 2.0 billion during 2001, thus further extending its finan-cial f lexibility.
The Board of Directors of Swiss Re proposes to the Annual General Meeting adividend of CHF 50 per share. In addition to the CHF 50 dividend, the Boardof Directors proposes a capital repayment of CHF 8 per share. The capitalrepayment has become possible as a result of a change in the law, due to comeinto effect on 1 May 2001, which provides for a minimum nominal share valueof CHF 0.01 for public limited companies (Aktiengesellschaften) registeredunder Swiss law. The Board of Directors also proposes that the registeredshares, after the capital repayment each with a nominal value of CHF 2, besplit in the ratio 20-for-1 to a nominal value of CHF 0.10.
Following the reduction in share capital and the share split, the Board ofDirectors proposes to the General Meeting that conditional capital amountingto no more than CHF 900 000 be created for issuance of convertible bonds,and CHF 700 000 for employee share and option plans.
Sources of capitalCHF millions 1999
22 7873 0191 9413 013
Shareholders’ equityEqualisation reservesSubordinated debtSenior debt
CHF millions 2000

28 Swiss Re Annual Report 2000
Through its underwriting and investment activities, Swiss Reis in the business of managing insurance, credit and financialmarket risks. These risks must be measured accurately tohelp achieve an optimum risk/return profile. Group risk man-agement focuses on the combined impact of individual risksto identify potential accumulation and diversification effects.
Group risk management provides the Executive Board and the Board ofDirectors with the necessary tools to measure risks accurately. It supports arange of processes, including adequate risk identification and measurement,reporting and controlling, capacity allocation and approval – all of which areessential for value-oriented decision-making.
Swiss Re’s shareholder capital ultimately absorbs any large, unexpected lossesresulting from the Group’s various exposures. Swiss Re measures its risk expo-sure in terms of the amount of capital required to maintain normal operationseven under such rare adverse conditions. This risk exposure is counterbalancedby the return Swiss Re expects to generate from its reinsurance and investmentoperations.
Swiss Re takes an integrated approach to managing its risk, modelling the com-bined effect of all individual risk exposures. The effect of adding any new risk– such as through an acquisition – is assessed in the context of the whole port-folio. In particular, the model identifies accumulation and diversificationeffects. A new exposure to California earthquakes, for example, will diversify aportfolio with existing exposure to earthquakes in Japan. Groups of interdepen-dent exposures within a portfolio, however – such as a set of California earth-quake risks – will not have this desired diversification effect. A case in point iscredit risk, which is highly interdependent with financial market risk.
Swiss Re is exposed to a great diversity of risks. The Group risk model regularyupdates all relevant insurance, credit and financial market risk exposures, toensure that every new exposure and risk interdependency is considered. Amongthe latest developments in this field is a model which describes the dependencybetween financial market and credit risks.
Reports to key management
Group risk management reports to the Executive Board and Board of Directorsgiving a detailed analysis of the Group’s risk exposure and its sources as well asviews on the adequacy of Swiss Re’s capitalisation. This reporting analyseschanges in the risk landscape and also serves as the basis for evaluating busi-ness plans or possible acquisitions.
Shareholder capital is also risk capital
An integrated, quantitative approach tomanaging risk
Group risk management
Marketvalue ofassets
Economic value of liabilities
Risk BearingCapital (RBC)
Excess capital
Risk AdjustedCapital (RAC)
Assets Liabilities

29 Swiss Re Annual Report 2000
Adjusting the portfolio in response to a changing risk landscape
Changes in the risk landscape
In 1999, Swiss Re’s exposure to financial market risk was considerably higherthan its exposure to credit and underwriting risk. In the course of 2000, SwissRe shifted its portfolio balance towards underwriting and credit exposure. Theacquisition of Underwriters Re in North America, for instance, increased expo-sure to California earthquake and North Atlantic hurricane risks. At the sametime, the Group recorded strong growth in credit and life and health businessand reduced its financial market risk exposure by paring down its equity hold-ings.
Financial market risk
Swiss Re applies standard risk-measurement methods when assessing potentiallosses from f luctuations in equity prices, interest and exchange rates. Due to itsasset allocation strategy, the financial market risk exposure of Swiss Re’s invest-ment portfolio is determined largely by the European and US markets. Vola-tility in these markets was comparatively high in the first quarter of 2000, sta-bilising on a lower level through the second and third quarters before increas-ing again in the fourth quarter. The decision taken early in the year to lowerSwiss Re’s equity exposure reduced the financial market risk on the investmentportfolio. This reduction, however, was offset in absolute terms by growth inthe fixed income portfolio through acquisitions and the shift to fixed incomeinvestments.
Over the year, the net effect was a modest increase of the risk within theinvestment portfolio, assessed on a stand-alone basis. From an integral Groupperspective, however, financial market risk exposure decreased because, by andlarge, the interest rate and currency risk of bonds are balanced by the corre-sponding exposure of reinsurance liabilities, which tends to run in the oppositedirection.
Swiss Re continues to manage and monitor investment risk closely, beingparticularly careful to avoid financial leverage at a portfolio level, limit equityexposure and maintain strict credit-rating requirements for bonds.

30 Swiss Re Annual Report 2000
The reorganisation of Swiss Re’s non-life operations, announ-ced in early 2001, is designed to further improve its com-petitive position in a substantially hardening market. Demandfor insurance-based corporate finance solutions – an area inwhich Swiss Re has well-established strengths – is also in-creasing. In the life business, Swiss Re can take advantage ofits leadership position, benefiting from economies of scale instrongly-growing traditional life reinsurance markets, and ex-panding its Admin Re business.
In the first quarter of 2001, Swiss Re consolidated its European non-life busi-ness into one organisation by merging the Bavarian Re and Europe divisions.The goal is to improve and streamline services, foster knowledge-sharing andeliminate duplications – thus lowering costs and enhancing client benefit. TheNon-Life Business Group will also benefit more directly from product and risk-management resources transferred from the Corporate Centre. Overall,these measures will contribute to achieving strategic cost leadership in the non-life reinsurance business and strengthen the Group’s competitive position inEurope.
Early 2001 also saw the formation of the Financial Services Business Group,comprising: Swiss Re Investors, with its asset management and asset liabilitymanagement focus; Swiss Re New Markets, which concentrates on underwritingbusiness to large corporate clients, as well as aviation and space risks, struc-tured finance and credit solutions; and Capital Partners, Swiss Re’s privateequity division, which includes the investment bank Fox-Pitt, Kelton and creditinsurer NCM. The aim of the Financial Services Business Group is to promotethe convergence of reinsurance and financial solutions and judiciously expandthe existing range of products and services while co-ordinating marketing activi-ties and consolidating the risk management and financial management areas.
Swiss Re successfully negotiated significant improvements in non-life reinsur-ance conditions and prices during the 1 January 2001 renewal period. Theseimprovements covered most of its business in the largest non-life markets:Europe, North America and parts of Asia. Business relationships which werenot in line with profit requirements were either re-underwritten, reduced orclosed. Swiss Re expects any loss of business to be recouped, in original curren-cies, by new business and price increases.
The renewals per 1 April in three major Far East markets showed overall posi-tive results. In Japan natural catastrophe business improved, especially industri-al earthquake coverages. Terms of earthquake treaties improved as well andSwiss Re shifted capacity from proportional to non-proportional business. Therates of wind and f lood catastrophe covers increased after many years of ratereductions. In Korea, where Swiss Re has received a provisional reinsurancelicence, a general trend towards raising rates and conditions was also observed.In the Indian market liberalisation continues and Swiss Re maintained itsleadership presence.
Recent events and outlook

31 Swiss Re Annual Report 2000
Swiss Re’s entire non-life reinsurance portfolio is showing the positive effects ofimproved conditions and higher prices. In parallel with this welcome trend inits own reinsurance business, Swiss Re sees direct insurance rates and condi-tions improving in its largest relevant markets. One cause of hardening pricesand conditions has been the withdrawal of capital from reinsurance marketsand a similar reduction of capacity in the retrocession markets. Swiss Re there-fore expects that the trend towards improved prices and conditions will contin-ue for the balance of renewals in 2001 and on into 2002. Given this expecta-tion and barring extraordinary or unusually high losses, Swiss Re believes thatone of its major targets for 2001 is within reach: a combined ratio of 107%.
Swiss Re has already achieved a leading position in insurance-based corporatefinance solutions. Changes in the non-life market environment and in thefinancial options facing large corporate clients suggest that demand in this areais likely to increase, offering attractive growth opportunities for Swiss Re.
Swiss Re’s life and health business will benefit from continued strong demandfor traditional life reinsurance in US. Further consolidation in the primary market should also sustain demand for Admin Re. In Europe, the gradual movetowards private provision in social security and health care will create new chal-lenges and opportunities for the industry; Swiss Re is ready to meet thesealongside its clients. Overall, Swiss Re’s life business margins are expected toremain stable while benefiting from further improvements in productivity.

“ Our computer model will facilitate much improved risk management.”
Boo
km@
rk: m
ore
abou
t Iv
o M
enzi
nger
at
ww
w.s
wis
sre.
com

33 Swiss Re Annual Report 2000
Swiss Re has built a leading e-business position in the rein-surance industry: 22 e-solutions are currently available toclients and further diversified e-initiatives are being imple-mented. The Swiss Re Client Portal increasingly serves as theintegrated entrance point to all Swiss Re’s e-business solu-tions and services.
Swiss Re’s determination to add value through e-business was underlined in thepublic announcement of its e-business strategy in May 2000. The initial focuswas on risk placement: on-line submission and quoting for standardised rein-surance products – as well as a customised client-renewal process developed inpartnership with selected global clients. This was quickly complemented bybusiness services such as comprehensive reinsurance accounting transaction ser-vices. Other service components were expanded to allow client access to SwissRe’s knowledge and expertise: web-enabled underwriting tools, in-depth infor-mation and visual summaries of hazard exposure, loss frequencies, financial/insurance benchmarking, performance comparisons and calculation of claimsindices.
Clients actively participate in interactive services such as the Food Forum, thefirst of several planned industry communities. In December 2000, Swiss Relaunched an industry-wide reinsurance risk exchange inreon (insurance meetsreinsurance online), in partnership with Munich Re, Accenture and the ven-ture-capitalist Internet Capital Group.
In 2000, nearly 300 people at Swiss Re were working on the development of e-solutions.
During 2001, Swiss Re expects to create further substantial value, both for it-self and for its clients, through e-business. The focus will be on implementingthe most promising initiatives and integrating e-related activities into normalbusiness practices. Success will depend on three factors: adding value for SwissRe’s clients through substantially simplified business transactions and reducedcosts; providing B2B applications which allow clients to transact and admini-ster a significant portion of their premium volume through e-business; andstrengthening client relationships by providing enriched information content.
Swiss Re’s e-business strategy is beingimplemented
Spotlightse-business
In 2000, the insurance indus-try witnessed the highest lossamounts due to flooding everrecorded. Floods are anextremely complex phenome-non. To date, there has notbeen a computer-aided modelbased on physical processesand probabilities which can beused to estimate this insurancerisk. My team and I want to bethe ones to make this break-through, thus laying the foun-dation for much improved riskmanagement. We are well onthe way to achieving this.
Ivo MenzingerHead of Flood Group, Swiss Re, Zurich

34 Swiss Re Annual Report 2000
“Companies which do business accord-ing to the principles of sustainabilityhave the best chance of success in thelong term.” Bruno Porro, Head of Risk & Knowledge
Swiss Re’s continuing commitment to environmental man-agement covers three areas: reinsurance, investment and in-ternal operations. During 2000, the Group further developedits environmental risk management, increased the impor-tance of sustainability-relevant factors in its business andcontinued a risk dialogue with its stakeholders.
Swiss Re has a leading position as a reinsurer in the US environmental market.In Europe, it is closely involved in national environmental insurance pools. It has also built up its environmental presence in the emerging economies ofEastern Europe and Asia by providing training courses and client seminars.Swiss Re’s study on greenhouse gas emission trading shows promising futuremarket opportunities.
Swiss Re has further increased its environmental portfolio to CHF 87 million.This portfolio now comprises balanced direct investments in 11 companies, 2 holding companies and 2 investment funds.
All Swiss Re’s construction and renovation projects in Switzerland conform tothe recognised MINERGIE standard, which defines limits for a building’s ener-gy consumption. Internal environmental management in Zurich has been certi-fied to the ISO 14001 standard.
Swiss Re is represented in the Dow Jones Sustainability Group Index; othersustainability and environmental rating agencies, such as Oekom and CentreInfo, continue to rank the Group as a leader within the insurance industry.Around 2% of all Swiss Re shares are estimated to be held by institutionalinvestors who build up their portfolios through systematic consideration ofenvironmental and social performance criteria.
Swiss Re’s environmental report can be accessed at www.swissre.com or orderedfrom Swiss Re Publishing.
Environmental report

35 Swiss Re Annual Report 2000
Consistent with its role as a global leader in risk manage-ment, Swiss Re places the highest importance on goodcorporate citizenship in its internal and external relations.The Group-wide Code of Conduct defines individual and cor-porate roles in maintaining the high standards of responsibil-ity which form the core of Swiss Re’s brand and reputation.
Swiss Re’s commitment to its employees includes a broad spectrum of servicesand benefits, customised to the needs of the individual. Compensation is basedon a global “pay-for-performance” philosophy with a variable wage componentand, in most countries, an opportunity to purchase Swiss Re shares at attractiveterms. A strong emphasis on continuing education includes intensive manage-ment development, identifying and training individuals with high potential atall levels of the company; the centre for global dialogue at Rüschlikon will bean essential part of this process.
Swiss Re’s employment model includes f lexible annual working time, telework-ing, part-time opportunities and an increased number of apprenticeships. TheGroup encourages staff to strike a healthy long-term balance between work andprivate life, with support and counselling packages for maternity or paternityleave and childcare. In the wider world, Swiss Re offers financial and intellec-tual support to a variety of institutions and projects with humanitarian, social,environmental and cultural goals.
Good corporate citizenship: as a re-insurer, as an employer and as a sponsor
Social report

36 Swiss Re Annual Report 2000
“Rüschlikon has been called not just thebrain, but the new heart of Swiss Re.”Walter Anderau, Head of Communica-tions & Human Resources
Rüschlikon, Swiss Re’s centre for global dialogue, opened inNovember 2000. It offers a platform for sharing knowledge,building networks, identifying the topics of the future andgenerating sustainable innovation. A broad range of internaland external events take place in Rüschlikon, focusing onapplied research, business solutions and corporate develop-ment – designed to generate tangible results for all stake-holders.
Applied research, in this context, means detecting emerging risks and identify-ing business opportunities. Together with its partners in risk management,Swiss Re examines issues in the economy, business, science and technology, toassess their impact on the industry. The inaugural Rüschlikon conference,Digital Worlds, investigated the strategic, legal and risk implications of increas-ing digitalisation.
The knowledge generated in applied research needs to be translated into viablebusiness solutions which bring value to clients. The centre therefore provides ashared space for workshops with clients and specialists to develop tailor-madeproducts and services in risk and capital management.
Corporate development means shaping corporate strategy, communicatingshared values and developing the talents of employees. Management develop-ment programmes bring together staff from all divisions across the globe toshare knowledge, exchange best practice and establish networks – activitieswhich are further facilitated by the Media Net. For more information, visit:www.ruschlikon.net.
Rüschlikon

37 Swiss Re Annual Report 2000
“ Water is an investment topic with a bright future.”
Boo
km@
rk: m
ore
abou
t Alo
is F
latz
at w
ww
.sw
issr
e.co
m
Water is gradually emerging asan investment topic. Billions ofdollars need to be invested torenew drinking water andsewage systems in industri-alised countries. In some devel-oping countries, this type ofinfrastructure does not exist atall. Furthermore, in thenorthern and southern hemi-spheres, very innovative andsustainable concepts and tech-nologies are needed that allowenvironmentally-friendlydeployment of scarce waterresources. I find it fascinatingto search out and invest incompanies who are todayworking on solutions fortomorrow, thereby creating forthemselves an excellentfoothold in a growing market.
Alois FlatzHead Research, SAMSustainable AssetManagement, Zurich

38 Swiss Re Annual Report 2000
Group financial statements
Income statement 39Balance sheet 40Statement of shareholders’ equity 42Statement of comprehensive income 43Statement of cash flow 44Notes 46Report of the Group auditors 85

39 Swiss Re Annual Report 2000
Income statementFor the years ended 31 December
CHF millions Notes 1999 2000
RevenuesPremiums earnedNet investment incomeNet realised investment gainsOther revenuesTotal revenues
ExpensesClaims and claim adjustment expensesLife and health benefitsAcquisition costsAmortisation of goodwillOther operating costs and expensesTotal expenses
Income before income tax expenseIncome tax expenseNet income on ordinary activities
Extraordinary incomeExtraordinary chargesNet income
Earnings per common share in CHFBasicDiluted
The accompanying notes are an integral part of the consolidated financial statements.1999 figures have been restated (see notes 1 and 19).
8 18 051 22 0812 3 846 4 8022 3 588 4 275
246 39525 731 31 553
7,8 – 9 333 – 12 1538 – 6 200 – 7 4785 – 3 973 – 4 8834 – 211 – 310
– 2 785 – 3 074– 22 502 – 27 898
3 229 3 65511 – 783 – 689
2 446 2 966
450– 4502 446 2 966
10 171 20810 171 207

Balance sheetAs of 31 December
2,3
46 023 49 826579 646
29 426 23 2243 100 6 9201 143 1 183
3 015 4 1562 398 3 629
85 684 89 584
3 300 3 433832 1 383
8 601 10 8246 995 6 4599 537 10 922
174 7805 2 469 4 4444 2 678 2 6284 4 084 4 574
632 5395 214 7 070
130 200 142 640
Assets
CHF millions Notes 1999 2000
InvestmentsFixed income securities:
Available for sale, at amortised cost (fair value: 1999: 44 659;2000: 51 019)Trading, at fair value (amortised cost: 1999: 574; 2000: 648)
Equity securities – Available for sale, at fair value (cost: 1999: 18 008; 2000: 16 812)
Mortgages and other loansInvestment real estateShort-term investments, at amortised cost which approximates
fair valueOther invested assetsTotal investments
Cash and cash equivalentsAccrued investment incomePremiums receivableReinsurance recoverable on paid and unpaid claimsFunds held by ceding companiesPrepaid reinsurance premiumsDeferred acquisition costsAcquired present value of future profitsGoodwillIncome taxes recoverableOther assetsTotal assets
The accompanying notes are an integral part of the consolidated financial statements.1999 figures have been restated (see notes 1 and 19).
40 Swiss Re Annual Report 2000

41 Swiss Re Annual Report 2000
Balance sheetAs of 31 December
Liabilities and shareholders’ equity
CHF millions Notes 1999 2000
Current liabilitiesUnpaid claims and claim adjustment expensesLiabilities for life and health policy benefitsUnearned premiumsFunds held under reinsurance treatiesReinsurance balances payableIncome taxes payableDeferred income taxesShort-term debtAccrued expenses and other liabilitiesTotal current liabilitiesLong-term debtTotal liabilities
Shareholders’ equityCommon shares, CHF 10 par value;
1999: 14 730 951 and 2000: 14 658 301 shares authorised and issuedAdditional paid-in capitalAccumulated other comprehensive income:
Net unrealised investment gains, net of deferred taxesCumulative translation adjustments
Total accumulated other comprehensive incomeRetained earningsReserve for own sharesTotal shareholders’ equityTotal liabilities and shareholders’ equity
The accompanying notes are an integral part of the consolidated financial statements.1999 figures have been restated (see notes 1 and 19).
7 54 072 59 60023 279 29 300
4 251 6 1314 284 4 2473 286 3 6971 120 582
11 4 223 3 4421 116 2 074
4 790 5 722100 421 114 795
6 4 947 5 058105 368 119 853
147 1471 934 1 753
8 829 5 7141 874 871
10 703 6 58511 043 14 053
10 1 005 24924 832 22 787
130 200 142 640

42 Swiss Re Annual Report 2000
Statement of shareholders’ equity
Net
unrealised Cumulative
Additional gains translation Reserve
Common paid-in (losses) adjust- Retained for own
CHF millions stock capital net of tax ments earnings shares Total
Balance as of 31 December 1998Net incomeUnrealised gains on securities,
net (note 2)Foreign currency translation
adjustmentsDividendsChange in own shares (note 10)
Balance as of 31 December 1999Net incomeUnrealised losses on securities, net
(note 2)Foreign currency translation
adjustmentsDividendsChange in own shares (note 10)
Balance as of 31 December 2000
The accompanying notes are an integral part of the consolidated financial statements.1999 figures have been restated (see notes 1 and 19).
147 1 934 7 317 276 9 162 1 127 19 9632 446 2 446
1 512 1 512
1 598 1 598– 687 – 687
122 – 122
147 1 934 8 829 1 874 11 043 1 005 24 8322 966 2 966
– 3 115 – 3 115
– 1 003 – 1 003– 712 – 712
– 181 756 – 756 – 181
147 1 753 5 714 871 14 053 249 22 787

Statement of comprehensive incomeFor the years ended 31 December
CHF millions 1999 2000
Net incomeOther comprehensive income:
Change foreign currency translation adjustmentsChange unrealised gains (losses), net of tax
Comprehensive income
The accompanying notes are an integral part of the consolidated financial statements.1999 figures have been restated (see notes 1 and 19).
2 446 2 966
1 598 – 1 0031 512 – 3 1155 556 – 1 152
43 Swiss Re Annual Report 2000

Statement of cash flowFor the years ended 31 December
CHF millions 1999 2000
Cash flows provided (used) by operating activitiesNet incomeAdjustments to reconcile net income to net cash provided (used) by operations:Depreciation, amortisation and other non-cash itemsNet realised investment gainsChange in technical provisions, netChange in reinsurance receivables and funds held by ceding companiesChange in other assets and liabilitiesChange in income taxes payable (recoverable)Income from equity accounted investeesNet cash provided (used) by operating activities
Cash flows provided (used) by investing activitiesFixed income securities – Available for sale:
Proceeds from sale of investmentsPurchase of investmentsNet purchase of short-term investments
Equity securities – Available for sale:Proceeds from sale of investmentsPurchase of investments
Cash paid for acquisitions and reinsurance transactions, netOther investments, netNet cash provided (used) by investing activities
Cash flows provided (used) by financing activitiesIssuance of long-term debtIssuance (repayment) of other debtRepurchase of common sharesDividends paidNet cash provided (used) by financing activities
Effect of foreign currency translationChange in cash and cash equivalents (including short-term investments)Cash and cash equivalents as of 1 JanuaryCash and cash equivalents as of 31 December
The accompanying notes are an integral part of the consolidated financial statements.1999 figures have been restated (see notes 1 and 19).
2 446 2 966
722 940– 3 588 – 4 275
4 212 2 135– 2 990 – 2 102
– 590 – 53478 157
– 29 – 31261 – 744
42 288 33 846– 41 821 – 35 219
– 366 – 116
12 172 17 902– 10 874 – 12 389
– 747 – 1 727743 – 1 404
1 395 893
1 048 142– 1 107 732
– 181– 687 – 712– 746 – 19
– 244 3666 133
2 634 3 3003 300 3 433
44 Swiss Re Annual Report 2000

45 Swiss Re Annual Report 2000
Non-point source (NPS)pollution deals with the uncon-trolled run-off into bodies ofwater resulting from pollutedrainfall, snowmelt or irrigationpractices. Agriculture is a majorsource of NPS. We research thetopic and its impact on the en-vironment, the population as awhole, and our business. Wefollow developments in regula-tions, produce guidelines forunderwriting, and assist ourclients in product development.What fascinates me is the po-tential we have as a reinsurer topositively impact the effects ofhuman practices on the envi-ronment and human health.
Adrienne AtwellManager EnvironmentalLiability Department (ELD),Swiss Re Americas Division,Armonk (USA)
“We help to manage and prevent water pollution.”
Boo
km@
rk: m
ore
abou
t Adr
ienn
e A
twel
l at w
ww
.sw
issr
e.co
m

Nature of operations
Basis of presentation
Scope of consolidation
1. Organisation and summary of significant accounting policies
The Swiss Re Group, which is headquartered in Zurich, Switzerland, comprises SwissReinsurance Company (the parent company, referred to as “Swiss Re Zurich”) and itssubsidiaries (collectively, the “Swiss Re Group” or the “Group”). The Group providesreinsurance, alternative risk transfer products and services to life and non-lifeinsurance companies, clients and others world-wide. Reinsurance and other relatedproducts and services are delivered to clients through a network of more than 70offices in over 30 countries as well as through reinsurance brokers.
The accompanying consolidated financial statements have been prepared in accor-dance with the Accounting and Reporting Recommendations (ARR) and comply withthe Swiss Company Law and include the financial statements of Swiss Re Zurich andits subsidiaries. The presentation requirements of ARR 14 have been complied withexcept certain financial information has been disclosed in the notes and not in theprimary financial statements. All significant intercompany transactions and balanceshave been eliminated in consolidation.
In the current year the Swiss Re Group is modifying the presentation of its consolidat-ed financial information to improve comparability with more widely accepted interna-tional practice. In connection with this effort, the Group has also changed certainaccounting policies from one acceptable method to another under the Swiss ARRbasis and has restated its previously reported 1999 consolidated financial state-ments to conform to the new basis (see note 19).
Companies in which Swiss Re Zurich, directly or indirectly, holds a voting majority orotherwise controls are consolidated in the Group accounts. Companies in whichSwiss Re Zurich maintains a direct or indirect holding of between 20% and 50% andhas a significant influence, but not controlling interest, are accounted for using the equity method and are included in other invested assets. The Swiss Re Group’sshare of net profit or loss in investees accounted for under the equity method isincluded in net investment income. Equity and net income of these companies areadjusted as necessary to be in line with the Group accounting policies. The results ofconsolidated subsidiaries and investees accounted for using the equity method areincluded in the financial statements for the period commencing from the date ofacquisition.
Notes
46 Swiss Re Annual Report 2000

47 Swiss Re Annual Report 2000
Use of estimates in the preparation of financial statements
Investments
The preparation of financial statements requires management to make significantestimates and assumptions that affect the reported amounts of assets, liabilities,revenues and expenses as well as the related disclosure including contingent assetsand liabilities. The Swiss Re Group’s liabilities for unpaid claims and claim adjust-ment expenses and policy benefits for life and health include estimates for premium,claim and benefit data not received from ceding companies at the date of thefinancial statements. In addition, the Group uses certain financial instruments andinvests in securities of certain entities for which exchange trading does notexist. The Group determines these estimates on the basis of historical information,actuarial analyses, financial modelling and other analytical techniques. Actual resultscould differ from the estimates described above.
The Group’s investments in fixed income securities are classified as Available for sale(“AFS”) or Trading. Fixed income securities AFS are reported at amortised cost.Trading fixed income securities are carried at fair value with unrealised gains andlosses being included in the income statement.
Investments in equity securities are classified as AFS and carried at fair value withtemporary declines in fair value below acquisition cost and subsequent recoveriesup to acquisition cost being recognised in the income statement, and all movementsin fair value above acquisition cost being reported as a separate component ofshareholders’ equity.
Interest on fixed income securities is recorded as income when earned and isadjusted for the amortisation of any purchase premium or discount. Dividends onequity securities are recorded on the basis of the ex-dividend date. Realised gainsand losses on sales are included in the income statement.
Mortgages and other loans are carried at amortised cost (effective yield method), net of any allowance for amounts estimated to be uncollectible. Other loans consistof mortgage participations associated with linked investment contracts where thecontract holders bear all investment risk.
Investment real estate that the Group intends to hold for the production of income iscarried at depreciated cost, net of any write-down for impairment in value. An impair-ment in value is recognised if the estimated future undiscounted cash flows from the use of the real estate asset are less than its carrying value. Impairments in value,depreciation and other related charges or credits are included in net investmentincome. Investment real estate held for sale is carried at the lower of cost or fairvalue, less estimated selling costs, and is not depreciated. Reductions in the carryingvalue of real estate held for sale are included in net realised investment losses.
Short-term investments are carried at amortised cost, which approximates fair value.The Group considers highly liquid investments purchased with an original maturity ofone year or less, but greater than three months, to be short-term investments.

48 Swiss Re Annual Report 2000
Notes
Derivative financial instruments
Interest rate and foreign currency swaps
Foreign currency and interest rateforward contracts
The Group enters into security lending arrangements under which it loans certainsecurities in exchange for collateral and receives security lending fees. The Group’spolicy is to require collateral equal to at least 102% of the carrying value of the secu-rities loaned. The collateral held consists of deposits, cash or other securities. Theliability for collateral held is included in accrued expenses and other liabilities.Security lending fees are recognised over the term of the related loans.
The Group uses a variety of derivative financial instruments including swaps, options,forwards and exchange traded financial futures as part of an overall risk manage-ment strategy. These instruments are included in other invested assets and areprimarily used as a means of managing exposure to price, foreign currency and/orinterest rate risk on planned or anticipated investment purchases, existing assets orliabilities and also to lock in attractive investment conditions for funds which becomeavailable in the future.
Derivative instruments which do not meet the criteria for hedge accounting or whichare held for investment purposes are carried at fair value with changes in unrealisedgains and losses recognised in income.
Interest rate swaps involve the periodic exchange of payments without the exchangeof underlying principal or notional amounts. The Group utilises interest rate swaps toconvert its variable rate debt into fixed rate debt and accordingly records interestexpense using the fixed interest rate. Any related fees are amortised as yield adjust-ments.
A foreign currency swap operates in a similar way to an interest rate swap. Differentcurrencies are exchanged, based on a notional amount, at an agreed upon exchangerate at the beginning and the end of the swap. Foreign currency swaps purchased in anticipation of a firm commitment to make foreign currency asset purchases arecarried at fair value with related unrealised gains or losses deferred until the assetpurchase date, at which time the deferred gain or loss is recognised in income offset-ting the change in value of the underlying asset or liability.
The Group uses foreign currency and interest rate forward contracts to manage its exposure to future movements in foreign exchange and interest rates. Foreigncurrency forward contracts are agreements to exchange fixed amounts of twodifferent currencies at a specified future date and at a specified price. The Groupgenerally utilises foreign currency forward contracts with terms of between one andsix months. Foreign currency forward contracts designated as a hedge at inceptionand qualifying as a hedge are accounted for as a hedge with unrealised gains orlosses deferred. Foreign currency forward contracts that do not qualify for hedgeaccounting are carried at fair value with changes in unrealised gains or losses recog-nised in income.

49 Swiss Re Annual Report 2000
Bond forward contracts
Equity and equity index contracts
Cash and cash equivalents
Deferred acquisition costs
Acquired present value of future profits
The Group uses interest rate forwards to lock in an interest rate at a future date.Accordingly interest expense is recognised using the forward rate.
The Group uses bond forward contracts to lock in sales prices for fixed income secu-rities that it intends to sell at a future date. The contracts are used to determine thecarrying value of the related investments.
Equity index options, which are used to manage the market and liquidity risks ofequity securities, represent an option to either purchase or sell a “basket” of sharesunderlying a well-established stock market index; delivery of the stocks is notrequired as the contracts are settled for cash on maturity. Equity index options areincluded in other invested assets with changes in unrealised gains and lossesincluded in investment income.
The Group uses equity options to lock in sales prices for investments in equity securi-ties and to improve investment returns on its equity security investments. Options arecarried at fair value as available for sale, with changes in carrying value included inother comprehensive income.
Cash and cash equivalents include cash on hand, highly liquid debt instruments, andshort-term deposits purchased with an original maturity of three months or less.
Acquisition costs, which vary with, and are primarily related to, the production of newbusiness, are deferred to the extent they are deemed recoverable from future grossprofits. Deferred acquisition costs consist principally of commissions. Deferredacquisition costs associated with non-life reinsurance business are amortised toincome in proportion to non-life premiums earned. Future investment income is con-sidered in determining the recoverability of deferred acquisition costs on non-lifebusiness.
Deferred acquisition costs associated with life and health reinsurance business areamortised over the premium paying period. For investment-type contracts, deferredacquisition costs are amortised in relation to the present value of estimated grossprofits and are adjusted to reflect the estimated effect of realising unrealised invest-ment gains and losses with an offset to unrealised investment gains and lossesincluded in shareholders’ equity.
The acquired present value of future profits (“PVFP”) of in-force business is recordedin connection with the acquisition of life reinsurance operations. The initial value isdetermined actuarially by discounting estimated future gross profits as a measure ofthe value of business acquired. The resulting asset is amortised on a constant yieldbasis over the expected revenue recognition period of the business acquired,generally over periods ranging up to 30 years, with the accrual of interest added tothe unamortised balance at the earned rate.
The carrying value of PVFP is reviewed periodically for indicators of impairment invalue. Adjustments to reflect impairment in value are recognised in income duringthe period in which the determination of impairment is made.

50 Swiss Re Annual Report 2000
Notes
Goodwill
Other assets
Capitalised software costs
Deferred income taxes
Unpaid claims and claim adjustmentexpenses
The excess of the cost of acquired businesses over the fair value of net assetsacquired is recorded as goodwill (purchase method). It is amortised using thestraight-line method over periods that correspond with the benefits expected to bederived from the related acquisition. Goodwill is amortised over periods of between 5 and 20 years.
The carrying value of goodwill is reviewed periodically for indicators of impairment invalue. Adjustments to reflect an impairment in value are recognised in income in theperiod in which the determination of impairment is made.
Other assets consist of investments for separate account business relating to certaintypes of insurance contracts where the contract holder bears the investment risk,deferred expenses on retroactive reinsurance, own use real estate, property, plantand equipment, accrued income and prepaid assets.
Separate account business assets and liabilities are valued at market value and unre-alised gains/losses are included in the income statement. Own use real estate andproperty, plant and equipment are carried at depreciated cost. Deferred expenses onretroactive reinsurance policies are amortised into income over the expected claimspaying period.
External direct costs of materials and services incurred to develop or obtain internaluse software, payroll and payroll-related costs for employees who are directly associ-ated with software development and interest cost incurred while developing internaluse software are capitalised and amortised on a straight-line basis over a period of 3 years through the income statement.
Deferred income tax assets and liabilities are recognised based on the differencebetween financial statement carrying amounts and the corresponding income taxbases of assets and liabilities using enacted income tax rates and laws. A valuationallowance is recorded against deferred tax assets when it is deemed more likely thannot that some or all of the deferred tax asset may not be realised.
Liabilities for unpaid claims and claim adjustment expenses for non-life reinsurancecontracts are accrued when insured events occur and are based on the estimatedultimate cost of settling the claims, using reports and individual case estimatesreceived from ceding companies. A provision is also included for claims incurred butnot reported, which is developed on the basis of past experience adjusted for currenttrends and other factors that modify past experience. The establishment of theappropriate level of reserves is an inherently uncertain process involving estimatesand judgements made by management, and therefore there can be no assurance thatultimate claims and claim adjustment expenses will not exceed the loss reservescurrently established. These estimates are continually reviewed, and adjustments fordifferences between estimates and actual payments for claims and for changes inestimates are reflected in income in the period in which the estimates are changed orpayments are made.
Unpaid non-life claims provisions may only be discounted if the payment pattern andultimate cost are fixed and reasonably determinable.

51 Swiss Re Annual Report 2000
Equalisation reserves
Liabilities for life and health policybenefits
Premiums
Reserves prescribed by local regulatory authorities for future claim fluctuations andfor large and catastrophic losses are established and included in the unpaid claimsand claim adjustment expenses liabilities.
Liabilities for life and health policy benefits are generally calculated using the net levelpremium method, based on assumptions as to investment yields, mortality, withdrawalsand policyholder dividends. Assumptions are set at the time the contract is issued or, inthe case of contracts acquired by purchase, at the purchase date. The assumptions arebased on projections from past experience, making allowance for possible adversedeviation. Interest assumptions for life and health reinsurance benefits liabilities rangefrom 4% to 14%. Assumed mortality rates are generally based on experience multiplesapplied to actuarial select and ultimate tables commonly used in the industry. With-drawal assumptions for individual life reinsurance contracts issued by the Group rangefrom 1% to 20% and are based on historical experience.
Liabilities for investment-type contracts, including separate account (unit-linked) lifereinsurance business, are based either on the contract account balance, if futurebenefit payments in excess of the account balance are not guaranteed, or on thepresent value of future benefit payments, if such payments are guaranteed. Liabilitiesfor policy benefits are increased if it is determined that future cash flows, includinginvestment income, are insufficient to cover future benefits and expenses.
The liability for accident and health policy benefits consists of active life reserves andthe estimated present value of the remaining ultimate net costs of incurred claims.The active life reserves include unearned premiums and additional reserves. Theadditional reserves are computed on the net level premium method using assump-tions for future investment yield, mortality and morbidity experience. The assump-tions are based on projections of past experience and include provisions for possibleadverse deviation.
Non-life reinsurance premiums are recorded when written and include an estimatefor written premiums receivable at period end. Premiums earned are generally recog-nised in income over the contract period in proportion to the amount of reinsuranceprovided. Unearned premiums consist of the unexpired portion of reinsuranceprovided.
Life reinsurance premiums are earned when due. Related policy benefits arerecorded in relation to the associated premium or gross profits so that profits arerecognised over the expected lives of the contracts. For investment type contracts,charges assessed against policyholders’ funds for the costs of insurance, surrendercharges, actuarial margin and other fees are recorded as income.
Life and health reinsurance premiums for group coverages are generally earned overthe term of the coverage. For group contracts that allow experience adjustments topremiums, such premiums are recognised as the related experience emerges.

52 Swiss Re Annual Report 2000
Reinsurance ceded
Pensions and other post-retirementbenefits
Foreign currency
The Group uses retrocession arrangements to increase its aggregate underwritingcapacity, to diversify its risk and to reduce the risk of catastrophic loss on reinsuranceassumed. The ceding of risks to retrocessionaires does not relieve the Group of itsobligations to its ceding companies. The Group regularly evaluates the financialcondition of its retrocessionaires and monitors the concentration of credit risk tominimise its exposure to financial loss from retrocessionaires’ insolvency.
Premiums and losses ceded under retrocession contracts are reported as reductionsof premiums earned and claims and claim adjustment expenses. Amounts recover-able for ceded claims and claim adjustment expenses and ceded unearned premiumsunder these retrocession agreements are reported as assets in the accompanyingconsolidated balance sheet.
Contracts which do not meet risk transfer requirements defined as transferring a rea-sonable possibility of a significant loss to the reinsurer are accounted for as depositarrangements. Deposit amounts are adjusted for payments received and made, aswell as for amortisation or accretion of interest.
The Group provides reserves for uncollectible amounts on reinsurance balancesceded and assumed, based on management’s assessment of the collectibility of theoutstanding balances.
The excess of estimated liabilities for claims and claim costs payable over considera-tion paid in respect of retroactive non-life reinsurance contracts which meet risktransfer tests is recorded as a deferred charge. The deferred charges are amortisedover the expected settlement periods of the claims liabilities.
The Group accounts for its pension and other post-retirement benefit costs under the accrual method of accounting. Amounts charged to expense are based onperiodic actuarial determinations.
Assets and liabilities denominated in foreign currencies are translated at the rates ofexchange on the balance sheet date. Revenues and expenses are translated ataverage exchange rates. Unrealised gains or losses resulting from translation of func-tional currencies to the reporting currency are included as a separate component ofshareholders’ equity, net of applicable deferred income taxes. Realised currencygains and losses resulting from foreign currency transactions are included in income.
Notes

53 Swiss Re Annual Report 2000
Own shares
Earnings per common share
Fair value of financial instruments
Currency exchange rates in CHF per 100 units of foreign currency are as follows:
1999 2000
Closing rate Average rate Closing rate Average rate
British pound GBP 257.97 244.16 242.08 256.43Euro EUR 160.44 160.21 152.15 156.11US dollar USD 160.07 150.32 162.05 168.81Canadian dollar CAD 110.29 101.14 107.89 113.75Japanese yen JPY 1.56 1.35 1.42 1.57Australian dollar AUD 104.74 96.84 90.04 98.24South African rand ZAR 26.00 24.74 21.41 24.41Mexican peso MXP 16.89 15.74 16.87 17.83
Shares purchased are recorded at market value and are classified and accounted foras equity securities Available for sale. Unrealised gains and losses are recorded inequity. The average cost method is used to determine the cost of own shares sold.Any gains or losses on the disposition of own shares are recorded in the incomestatement.
Basic earnings per common share is determined by dividing income available tocommon shareholders by the weighted average number of common shares entitledto dividends during the year. Diluted earnings per common share reflects the effect onearnings and average common shares outstanding associated with dilutive securi-ties.
The Group carries financial instruments generally at fair value on its balance sheet,with the exception of fixed income securities AFS, real estate, mortgages and otherloans and debt. Fair values for investment real estate and mortgages are presentedin Note 2.

54 Swiss Re Annual Report 2000
Notes
2. Investments
Amortised cost or cost and estimated fair values of investments in fixed income andequity securities classified as Available for sale were as follows:
Gross Gross
As of 31 December 1999 Amortised unrealised unrealised Estimated
CHF millions cost or cost gains losses fair value
Debt securities issued by govern-ments and government agencies:United StatesSwitzerlandGermanyUnited KingdomCanadaOther
Corporate debt securitiesMortgage and asset-backed
securitiesFixed income securities
Available for sale
Equity securitiesAvailable for sale
Gross Gross
As of 31 December 2000 Amortised unrealised unrealised Estimated
CHF millions cost or cost gains losses fair value
Debt securities issued by govern-ments and government agencies:United StatesSwitzerlandGermanyUnited KingdomCanadaOther
Corporate debt securitiesMortgage and asset-backed
securitiesFixed income securities
Available for sale
Equity securitiesAvailable for sale
The Group has an investment concentration with Credit Suisse Group. As of 31 December 1999 and 2000, the Group’s investments in equity securities includedCHF 3 481 million and CHF 2 469 million, respectively, of Credit Suisse Group securi-ties at fair values and CHF 370 million and CHF 331 million, respectively, of otheroperating assets.
Investment concentration
14 798 3 – 631 14 1701 249 4 – 24 1 2293 051 17 – 106 2 9622 450 59 – 55 2 4542 841 79 – 95 2 8257 624 186 – 259 7 551
11 853 105 – 584 11 374
2 157 5 – 68 2 094
46 023 458 – 1 822 44 659
18 008 11 820 – 402 29 426
15 673 664 – 26 16 311917 4 – 18 903
2 035 31 – 13 2 0532 952 98 – 5 3 0452 917 245 – 5 3 1577 268 164 – 55 7 377
13 641 333 – 304 13 670
4 423 97 – 17 4 503
49 826 1 636 – 443 51 019
16 812 7 324 – 912 23 224

55 Swiss Re Annual Report 2000
The Group also has an investment concentration with ING Groep N.V., a European-based financial institution. As of 31 December 1999 and 2000, the Group held CHF 1 222 million and CHF 1 239 million, respectively, of common stock at fairvalue, and CHF 1 439 million and CHF 1 516 million, respectively, of other operatingassets.
The amortised cost and estimated fair values of investments in fixed income securi-ties by remaining maturity are shown below. Fixed maturity investments are assumednot to be called for redemption prior to the stated maturity date. As of 31 December1999 and 2000, CHF 1 945 million and CHF 2 180 million, respectively, of fixedincome securities were callable or had call options in the instruments’ structure.
1999 2000
As of 31 December Amortised Estimated Amortised Estimated
CHF millions cost fair value cost fair value
Due in one year or lessDue after one year through five yearsDue after five years through ten yearsDue after ten yearsMortgage and asset-backed securitiesTotal fixed income securities
As of 31 December 1999 and 2000 securities with a carrying value of CHF 808million and CHF 653 million, respectively, were on deposit with regulatory agenciesin accordance with local requirements.
As of 31 December 1999 and 2000 investments with a carrying value of approxi-mately CHF 4 575 million and CHF 4 161 million, respectively, were placed on depositor pledged to secure certain reinsurance liabilities.
Cash and cash equivalents included short-term deposits with a carrying value of CHF 2 208 million and CHF 1 424 million as of 31 December 1999 and 2000,respectively.
As of 31 December 1999 and 2000 investments in mortgage and other loans, realestate and investment for separate account business comprised the following:
As of 31 December 1999 2000
CHF millions Carrying value Fair value Carrying value Fair value
Mortgages and other loansInvestment real estateInvestment for separate
account business
As of 31 December 1999 and 2000 the Group’s investment in mortgages and otherloans included CHF 170 million and CHF 204 million, respectively, of loans due fromemployees and CHF 284 million and CHF 322 million due from officers. These loansgenerally consist of mortgages offered at variable and fixed interest rates.
Maturity of fixed income securities
Assets on deposit or pledged
Cash and cash equivalents
Mortgages, loans and real estate
1 689 1 689 1 435 1 41710 771 10 733 25 571 26 23113 413 12 980 10 937 11 16618 651 17 808 8 320 8 5641 499 1 449 3 563 3 641
46 023 44 659 49 826 51 019
3 100 3 100 6 920 6 9201 143 2 122 1 183 2 167
1 688 1 688 1 964 1 964

The Group’s investment in mortgages and other loans included CHF 955 million andCHF 1 483 million of mortgage participations associated with linked investmentcontracts as of 31 December 1999 and 2000, respectively. Contract holders bear allinvestment risk related to mortgage participations. Fair value for other loans is con-sidered to be equal to carrying value.
As of 31 December 1999 and 2000 investments in real estate included CHF 20 mil-lion and CHF 11 million, respectively, of real estate held for sale.
Depreciation expense related to income producing properties was CHF 28 millionand CHF 27 million for 1999 and 2000, respectively. Accumulated depreciation oninvestment real estate totalled CHF 631 million and CHF 638 million as of 31 Decem-ber 1999 and 2000, respectively.
Substantially all mortgages and other loans receivable are secured by buildings andland. The ultimate collectibility of the receivables is evaluated regularly and an appro-priate allowance for uncollectible amounts is established.
Investment real estate Affiliated companies
CHF millions 1999 2000 1999 2000
Carrying value as of 1 JanuaryForeign currency translation
adjustmentsDepreciationAdditions/sales/disposalsUnrealised gains/lossesGains or losses on salesCarrying value as of 31 December
56 Swiss Re Annual Report 2000
Notes
1 102 1 143 1 446 1 274
23 – 25 151 – 29– 28 – 27
14 51 – 451 – 855
32 41 128 1301 143 1 183 1 274 1 422
Development of real estate andinvestments in affiliated companies

Net investment income by source was as follows:
CHF millions 1999 2000
Fixed income securitiesEquity securitiesMortgages and other loansReal estateShort-term investmentOther current investmentIncome on investments in affiliated companiesEquity in earnings of equity accounted investeesCash and cash equivalentsDeposits with ceding companiesGross investment incomeLess investment expensesNet investment income
Dividends received from investees accounted for using the equity method were CHF 31 million and CHF 40 million in 1999 and 2000, respectively.
Realised gains and losses for fixed income securities, equity securities and otherinvestments were as follows:
CHF millions 1999 2000
Fixed income securities:Gross realised gainsGross realised losses
Equity securities:Gross realised gainsGross realised losses
Net realised gains on other investmentsValue readjustmentsValue adjustmentsNet realised investment gains
For fixed income and equity securities, gross realised gains of CHF 1 607 million andgross realised losses of CHF 493 million as of 31 December 1999 were calculatedusing the specific identification method of determining investment cost. The remain-der of realised gains and losses were calculated using the average cost method.All realised gains and losses for the year ended 31 December 2000 were calculatedusing the specific identification method.
57 Swiss Re Annual Report 2000
2 407 3 027571 516152 404
88 89171 281
61 12658 1560 7165 94
474 3914 107 5 014– 261 – 2123 846 4 802
614 469– 672 – 735
3 807 5 837– 514 – 976
334 242305 303
– 286 – 8653 588 4 275
Investment income
Realised gains and losses

58 Swiss Re Annual Report 2000
Notes
3. Derivative financial instruments
Derivative financial instruments include futures, forward, swap or option contractsand other financial instruments with similar characteristics. The Group, under its riskmanagement strategy, uses these instruments to manage risk.
The Group uses derivative financial instruments with the following characteristics:
Contract/ Carrying
As of 31 December 1999 notional Positive Negative value assets
CHF millions amount fair value fair value (liabilities)
Interest rate contractsForwards and futuresSwapsFloors and capsTotal interest rate contracts
Equity and index contractsForwards and futuresOptionsTotal equity and index contracts
Foreign currencyForwards and futuresSwapsTotal foreign currency
Other derivativesCredit derivativesCatastrophe derivativesWeather derivativesTotal other derivatives
Total
3 019 3 – 9 – 61 915 35 – 56 145 442 254 – 254
10 376 292 – 319 8
69 – 2 – 26 408 178 – 141 376 477 178 – 143 35
14128 – 3 – 3142 – 3 – 3
21 175 17 – 20 – 3144 – 1 – 1235 – 43 – 43
21 554 17 – 64 – 47
38 549 487 – 529 – 7

59 Swiss Re Annual Report 2000
Contract/ Carrying
As of 31 December 2000 notional Positive Negative value assets
CHF millions amount fair value fair value (liabilities)
Interest rate contractsForwards and futuresOptionsSwapsSwaptionsFloors and capsTotal interest rate contracts
Equity and index contractsForwards and futuresOptionsTotal equity and index contracts
Foreign currencyForwards and futuresSwapsTotal foreign currency
Other derivativesCredit derivativesWeather derivativesOtherTotal other derivatives
Total
4. Acquisitions and dispositions
Underwriters Reinsurance Group, Inc., a US broker reinsurance company based inCalabasas, California, was acquired for CHF 1 084 million on 10 May 2000.
On 1 January 2000, the acquisition of Washington International Insurance Companyfor CHF 82 million was completed by the Group. Washington International writesmainly credit and surety business.
Both of these acquisitions were accounted for as purchases, and the companies’results were included in the Group’s results from the date of purchase.
The outstanding 65% of Società Italiana Cauzioni, Rome, not previously owned by the Group was acquired on 13 November 2000 for CHF 53 million. Società ItalianaCauzioni is an Italian specialist credit insurer.
4 101 3 – 6 – 345 – 1 – 1
392 3 – 1 2395 1 1227
5 160 7 – 8 – 1
109 1 – 16 261 127 – 71 566 370 128 – 72 56
1 994 107 – 19 884 014 76 – 70 66 008 183 – 89 94
36 197 93 – 77 16382 11 – 43 – 32
62 1 – 6 – 536 641 105 – 126 – 21
54 179 423 – 295 128

60 Swiss Re Annual Report 2000
Acquired present value of future profits
Goodwill
During 2000, there were three Admin Re transactions. Admin Re is the purchase ofclosed blocks of in-force business and can be facilitated through either a stockpurchase or reinsurance. The stock of Midland Life was purchased on 31 July 2000for CHF 496 million. The Group also entered two reinsurance-based deals withCIGNA and UnumProvident. The results of all of these deals have been included fromthe date of the transaction.
Swiss Re’s share of Euler SA of 19.99% was reduced to 8% during 2000 through asale which realised CHF 125 million. This investment, which had been accounted forunder the equity method of consolidation, has now been deconsolidated and isrecorded as an available for sale equity security.
Acquisitions resulted in CHF 539 million and CHF 426 million being capitalised in1999 and 2000, respectively. The net amortisation charge recorded in the incomestatement for 1999 and 2000 amounted to CHF 242 million and CHF 270 million,respectively. The change in unrealised gains increased the balance by CHF 242 mil-lion in 1999 and decreased the balance by CHF 200 million in 2000. The foreignexchange impact in 1999 was CHF 298 million, and in 2000 CHF –6 million.
The percentage of the PVFP which is expected to be amortised in each of the nextfive years is 7%, 7%, 6%, 6% and 5%, respectively.
In conjunction with the acquisitions, CHF 126 million and CHF 874 million ofgoodwill was recorded in 1999 and 2000, respectively. During the years ended 31December 1999 and 2000, goodwill of CHF 211 million and CHF 310 million, respec-tively, was amortised.
As of 31 December 1999 and 2000, the balance of accumulated goodwill amorti-sation was CHF 394 million and CHF 664 million, respectively.
5. Deferred acquisition costs
The following table presents changes in deferred acquisition costs:
CHF millions 1999 2000
Balance as of 1 JanuaryDeferredEffect of portfolio acquisitionsAmortisationForeign exchangeBalance as of 31 December
Notes
1 846 2 4694 094 5 440
35 1 306– 3 731 – 4 613
225 –1582 469 4 444

61 Swiss Re Annual Report 2000
Long-term financial debt
6. Debt
The Group enters into long- and short-term debt arrangements to obtain funds forgeneral corporate use and specific transaction financing. It also issues operationaldebt for financing of specific assets on a matched basis as part of its business activi-ties. The Group defines long-term debt as debt having a maturity greater than oneyear. The Group’s long-term debt as of 31 December 2000 was:
Senior debt as of 31 December 2000:
Issued Nominal Interest Book value
Maturity Instrument in Currency in m rate in CHF m
2002 Syndicated loans 1997 ITL 600 000 Libor+10bp 471
2003 Exchangeable bonds 1998 NLG 925 1.25% 639
2004 Exchangeable bonds (TRIPLES) 1999 USD 530 2.25% 859
2006 Senior Notes1 1996 USD 200 7.875% 321
2007 Trust preferred stock2 (TruPs) 1997 USD 46 8.72% 93
2007 Straight bond 1997 CHF 500 3.75% 500
2013 Payment Undertaking Agreement 2000 USD 24 Libor-15bp 38
2026 Payment Undertaking Agreement 2000 USD 57 Libor-15bp 92
Total senior debt 3 013
Total senior debt 1999 2 949
Subordinated debt as of 31 December 2000:
Book
Issued Cur- Nominal Interest ...to first value in
Maturity Instrument in rency in m rate... reset in CHF m
– Subordinated perpetual loan
(PARCS) 1999 EUR 250 Euribor+55bp 2006 380
– Subordinated perpetual loan 1998 DEM 340 Libor+40bp 2008 264
– Subordinated perpetual loan 1998 DEM 400 5.71% 2008 311
– Subordinated perpetual loan 1998 CHF 300 Libor+37.5bp 2008 300
– Subordinated perpetual loan 1998 DEM 110 Libor+45bp 2010 86
– Subordinated perpetual bond
(SUPERBs) 1999 CHF 600 3.75% 2011 600
Total subordinated debt 1 941
Total subordinated debt 1999 1 998
1 assumed in the acquisition of Underwriters Re Group2 assumed in the acquisition of Life Re Corporation

62 Swiss Re Annual Report 2000
Long-term operational debt Operational debt as of 31 December 2000:
Issued Nominal Interest Book value
Maturity Instrument in Currency in m rate in CHF m
2017 Payment Undertaking Agreement 2000 USD 64 Libor–15bp 104
Interest expense on long-term financial debt as of 31 December 1999 and 2000,respectively, was as follows:
CHF millions 1999 2000
Senior debtSubordinated debtTotal
The majority of interest payments on debentures are payable annually with theprincipal due at maturity. Interest on bank and other loans is generally due semi-annually with principal due upon maturity.
In June 1995, the Group issued convertible bonds with a face value of USD 500million, bearing interest at 2% and maturing on 30 June 2000 in exchange forproceeds of USD 439.5 million. The bond conversion rights were exercisable inmultiples of USD 5 000 in exchange for 4.9033 Swiss Re shares through 30 June2000. Interest was payable semi-annually. As of 30 June 2000, when the conversionright expired, 99 833 bonds of nominal value USD 499 million had been convertedinto 489 447 shares of the Group.
In July 1997, the Group issued a straight bond with a face value of CHF 500 million,bearing interest at 3.75%, maturing on 2 July 2007, in exchange for proceeds of CHF 511 million. Interest is payable annually and the principal is due at maturity.
In May 1998, the Group issued CHF 1 010 million of multi-currency subordinateddebt with a perpetual term, bearing interest at the rate of six-month LIBOR plus 37.5basis points, for the first tranche of CHF 300 million, LIBOR plus 40 basis points for atranche of DEM 340 million, LIBOR plus 45 basis points for a tranche of DEM 110million payable semi-annually and 5.71% for a tranche of DEM 400 million, payableannually. The loan is subordinated in the event of liquidation to all senior creditors ofSwiss Re Zurich, but will be paid in priority to all holders of its equity.
Notes
89 10574 90
163 195

In June 1998, the Group issued exchangeable bonds with a face value of NLG 925million bearing interest at 1.25% payable annually and maturing on 23 June 2003, inexchange for proceeds of NLG 901 million. The bond exchange rights are exercisablein multiples of NLG 1 000 into 5.4054 ING depositary receipts in respect of fully paidordinary shares of ING Groep N.V.
In June 1999, the Group issued CHF 600 million in subordinated perpetual debt, withan interest rate of 3.75% for 12 years, resetting to six-month LIBOR plus 100–140basis points thereafter, depending upon the rating of Swiss Re.
In June 1999, the Group also issued EUR 250 million of subordinated PerpetualAuction Reset Capital Solvency bonds, with a coupon of six-month EURIBOR plus55 basis points for the first seven years. After seven years, and every five years there-after, an auction will be conducted to determine the re-offer yield.
In June 1999, the Group also issued USD 530 million exchangeable notes with a fiveyear term, bearing interest of 2.25% payable annually. The notes are exchangeable atthe noteholders’ option for shares of Swiss Re, Credit Suisse Group or Novartis AG.
In 2000, the Group entered into three Payment Undertaking Agreements, which are aform of financing transactions in which a counterparty deposits funds with the Grouphaving fixed repayment terms and interest rates on the deposited funds.
63 Swiss Re Annual Report 2000

64 Swiss Re Annual Report 2000
Asbestos and environmental claimsexposure
7. Unpaid claims and claim adjustment expenses
The Swiss Re Group’s obligation for claims payments and claims settlement chargesalso includes obligations for long latent injury claims arising out of policies writtenprior to 1985, in particular in the area of US asbestos and environmental liability.
A reconciliation of the beginning and ending reserve balances for asbestos, environ-mental and other long latent liability claims and claim adjustment expenses for theperiods presented is as follows:
CHF millions 1999 2000
Balance as of 1 JanuaryLess reinsurance recoverableNetClaims incurredLess paidEffect of foreign currency translationEffect of acquisitionNetPlus reinsurance recoverableBalance as of 31 December
The routine reassessment has demonstrated that reserves established in prior yearscontinue to be sufficient. This, in combination with an active commutation strategy,allowed for an overall release of provisions relating to long latent injury claims during2000 of roughly 8%. In both 1999 and 2000, the Group was successful in achievingsome major commutations which have significantly reduced future exposure to thesetypes of claims. When commutation payments are made, the traditional “survivalratio” is artificially reduced by premature payments which should not imply areduction in reserve adequacy.
The Swiss Re Group continues to make provisions at the undiscounted value ofpotential ultimate claims payments and claims settlement charges, less amountspaid to date.
Provisions for long latent injury claims outstanding on 31 December 2000 reflect theestimated future trend of claims payments and claims settlement charges. Due to theinherent uncertainties and assumptions on which these estimates are based,however, we cannot exclude the need to make further additions to these provisions inthe future.
Notes
4 279 4 293– 450 – 4783 829 3 815– 293 – 292– 314 – 746
593 9094
3 815 2 961478 319
4 293 3 280

65 Swiss Re Annual Report 2000
8. Reinsurance
Premiums, claims and claim adjustment expenses are reported net of retrocession in the Group’s income statement. Gross, retroceded and net amounts for these itemswere as follows:
Non-Life Business Group
1999 2000
CHF millions Gross Retro Net Gross Retro Net
Premiums writtenChange unearned
premiumsClaims paidClaims and claim
adjustment expenses
Change equalisation reserves
Acquisition costs
Life & Health Business Group1999 2000
CHF millions Gross Retro Net Gross Retro Net
Premiums writtenClaims paidChange life and health
benefitsAcquisition costs
Financial Services Business Group1999 2000
CHF millions Gross Retro Net Gross Retro Net
Premiums writtenChange unearned
premiumsClaims paidClaims and claim
adjustment expenses
Change equalisation reserves
Acquisition costs
10 192 – 820 9 372 12 944 – 895 12 049
– 426 – 30 – 456 – 537 18 – 519– 7 393 882 – 6 511 – 9 995 1 168 – 8 827
– 2 851 599 – 2 252 – 246 – 379 – 625
783 783 – 691 – 691– 2 252 190 – 2 062 – 2 810 157 – 2 653
7 978 – 667 7 311 9 147 – 817 8 330– 5 201 586 – 4 615 – 5 905 627 – 5 278
– 1 537 33 – 1 504 – 1 988 – 182 – 2 170– 1 920 188 – 1 732 – 2 167 255 – 1 912
2 491 – 419 2 072 3 966 – 1 011 2 955
– 264 16 – 248 – 1 308 574 – 734– 871 – 257 – 1 128 – 1 422 – 72 – 1 494
– 423 194 – 229 – 469 – 217 – 686
– 25 – 25 140 140– 297 118 – 179 – 442 124 – 318

66 Swiss Re Annual Report 2000
Unpaid claims and claim adjustment expenses, liabilities for life and health policybenefits and unearned premiums are reported net of retrocession in the Group’sbalance sheet. Gross, retroceded and net amounts for these items were as follows:
Non-Life Business Group
1999 2000
CHF millions Gross Retro Net Gross Retro Net
Provisions for un-earned premiums
Unpaid claims and claim adjustment expenses
Provisions for profitcommissions
Equalisation reserves
Life & Health Business Group
1999 2000
CHF millions Gross Retro Net Gross Retro Net
Provisions for un-earned premiums
Unpaid claims and claim adjustment expenses
Life and healthpolicy benefits
Provisions forprofit commissions
Separate account liabilities
Financial Services Business Group
1999 2000
CHF millions Gross Retro Net Gross Retro Net
Provisions for un-earned premiums
Unpaid claims and claim adjustment expenses
Life and healthpolicy benefits
Provisions for profitcommissions
Equalisationreserves
Notes
3 146 – 136 3 010 3 704 – 180 3 524
36 375 – 3 214 33 161 39 543 – 3 531 36 012
624 – 2 622 742 742
2 409 2 409 2 869 2 869
183 – 1 182 227 – 2 225
8 862 – 976 7 886 9 444 – 1 225 8 219
23 014 – 2 249 20 765 29 024 – 1 206 27 818
218 – 3 215 271 – 2 269
1 688 1 964
922 – 37 885 2 200 – 598 1 602
6 269 – 556 5 713 7 594 – 498 7 096
265 265 276 276
19 19 79 79
157 157 150 150

9. Personnel expenses
CHF millions 1999 2000
Wages and salariesEmployee benefits
10. Shareholders’ equity
All of the Group’s reinsurance companies prepare statutory financial statementsbased on local laws and regulations, which in some jurisdictions impose complexregulatory requirements. Most jurisdictions require reinsurers to maintain a minimumamount of capital in excess of a statutory definition of net assets or maintain certainminimum capital and surplus levels. In addition, some jurisdictions place certainrestrictions on amounts that may be loaned or transferred to the parent company. TheGroup’s ability to pay dividends may be restricted by these requirements.
In 1999, the Board of Directors announced a share repurchase programme. In theperiod to end of March 2000, 72 650 shares with a total value of CHF 195.3 millionhad been repurchased. These shares were approved for cancellation by the share-holders in June 2000.
On 26 May 1997, the Group issued 5 000 000 call options. The options were exercis-able up to and including 5 May 1999. They were exercisable at a minimum number of 100 options, with 50 options entitling the holder to receive one Swiss Re share fora purchase price of CHF 1 900.
67 Swiss Re Annual Report 2000
1 219 1 395192 233

68 Swiss Re Annual Report 2000
Share data
Own shares
CHF millions 1999 2000
Basic earnings per shareIncome available to common sharesWeighted average common shares outstandingNet income per share in CHF
Effect of dilutive securitiesChange in average number of shares due to:
Employee options
Diluted earnings per shareIncome available to common shares assuming
debt conversion and exercise of optionsWeighted average common shares outstandingNet income per share in CHF
Included in treasury shares are 126 032 and 196 805 authorised and issued sharesas of 31 December 1999 and 2000, respectively, which are kept in escrow for satis-fying obligations arising from employee options.
The effects of debt conversion have not been included in the 1999 and 2000earnings per share, as the effect of converting to 169 408 and 77 186 shares,respectively, was anti-dilutive.
The following own shares of Swiss Re Zurich, are held by the Swiss Re Group:
Number
of registered CHF
shares millions
Own shares held on 1January1999 at cost 808 092 1 127Purchases in 1999 54 682 177Sales in 1999 – 282 278 – 819Realised gains 520Own shares held on 31 December 1999 at cost 580 496 1 005Own shares held on 31 December 1999 at market value 580 496 1 497
Own shares held on 1 January 2000 at cost 580 496 1 005Purchases in 2000 150 915 444Sales in 2000 – 583 807 –1 396Capital reduction from share repurchase –72 650 –195Realised gains 391Own shares held on 31 December 2000 at cost 74 954 249Own shares held on 31 December 2000 at market value 74 954 293
Notes
2 446 2 96614 307 811 14 275 717
171 208
21 547 31 768
2 446 2 96614 329 358 14 307 485
171 207

69 Swiss Re Annual Report 2000
11. Income taxes
The Group is generally subject to corporate income taxes based on the taxable netincome in various jurisdictions in which the Group operates. The components of theincome tax charge were:
CHF millions 1999 2000
Current taxesDeferred taxesIncome tax expense
The components of deferred income taxes were as follows:
CHF millions 1999 2000
Deferred tax assetsTechnical provisionsUnrealised losses on investmentsBenefit on loss carryforwardsOther
Gross deferred tax assetValuation allowance
Total deferred tax asset
Deferred tax liabilitiesPresent value of future profitsDeferred acquisition costsTechnical provisionsBond amortisation Unrealised gains on investmentsOtherTotal deferred tax liability
Deferred income taxes
As of 31 December 2000, the Group had CHF 1 476 million of foreign net operatingtax loss carryforwards, expiring as follows: CHF 7 million in 2001, CHF 7 million in2004, CHF 12 million in 2005 and CHF 1 450 million after 2005. The Group also hascapital loss carryforwards of CHF 125 million expiring as follows: CHF 4 million in2003, CHF 10 million in 2004, CHF 104 million in 2005 and CHF 7 million after2005.
Income taxes paid in 2000 were CHF 627 million, and in 1999 CHF 635 million.
832 364– 49 325783 689
1 107 1 526248 432391 567608 964
2 354 3 489– 440 – 2771 914 3 212
634 772404 846
1 022 675203 691
2 633 1 9681 241 1 7026 137 6 654
4 223 3 442

70 Swiss Re Annual Report 2000
12. Compensation and remuneration of directors and executive officers
The Group paid an aggregate of CHF 26.4 million in 1999 and CHF 31.8 million in2000 to the members of the Executive Board and to the members of the Board ofDirectors (28 persons in total) for services in all capacities, of which CHF 12.4 millionin 1999 and CHF 18.5 million in 2000 represented bonuses taken in restrictedshares. In addition, the Group contributed or accrued CHF 1.8 million in 1999 andCHF 2.4 million in 2000 for pension, retirement or similar benefits for the ExecutiveBoard members in the year ended 31 December.
Notes

71 Swiss Re Annual Report 2000
Pension plans and post-retirementbenefits
13. Benefit plans
The Group sponsors various funded defined benefit pension plans covering its world-wide operations. Employer contributions to the plans are charged to income on abasis which recognises the costs of pensions over the expected service lives ofemployees covered by the plans. The Group’s funding policy for these plans is to con-tribute annually at a rate that is intended to maintain a level percentage of compensa-tion for the employees covered. A full valuation is prepared at least every three years.
The Group also provides certain health-care and life insurance benefits for retiredemployees and their dependents. Employees become eligible for these benefits whenthey become eligible for pension benefits.
1999 2000 1999 2000
CHF millions Pension benefits Other benefits
Benefit obligation as of 1 JanuaryService costInterest costAmendmentsActuarial loss (gain)Benefits paidAcquisitionsForeign currency translation
adjustmentsBenefit obligation as of
31 December
Fair value of plan assets as of 1 January
Actual return on plan assetsCompany contributionsBenefits paidAcquisitionsCurtailment/settlementForeign currency translation
adjustmentsFair value of plan assets as of
31 December
Reconciliation of balance sheetFunded statusUnrecognised loss (gain)Unrecognised prior service costUnrecognised transition obligation
(asset)Net amount recognised
2 414 2 660 329 378112 114 29 34119 133 15 20
42 – 43– 17 – 73 42 – 20– 68 – 81 – 7 – 8
27 6
100 – 40 13 15
2 660 2 782 378 425
2 865 3 424433 184
58 44 7 8– 68 – 81 – 7 – 8
25– 74
136 – 48
3 424 3 474
764 692 – 378 – 425– 431 – 415 101 78
21 58 – 43 – 25
– 138 – 112216 223 – 320 – 372

72 Swiss Re Annual Report 2000
1999 2000 1999 2000
CHF millions Pension benefits Other benefits
Amounts recognised in the balance sheet consist of
Prepaid benefit costAccrued benefit liabilityNet amount recognised
Components of net periodic benefit costService cost
(net of participant contributions)Interest costExpected return on assetsAmortisation of:
Net (gain) lossPrior service costTransition obligation (asset)
SubtotalEffect of settlement, curtailment
and terminationNet periodic benefit cost
Weighted average assumptions at year-end
Discount rateExpected return on plan assetsRate of compensation increaseMedical trend – initial rateMedical trend – ultimate rate
Assumed health-care cost trend rates have a significant effect on the amountsreported for the health-care plans. A one percentage point change in assumedhealth-care cost trend rates would have the following effects for 2000:
1 percentage 1 percentage
CHF millions point increase point decrease
Effect on total of services and interest cost componentsEffect on post-retirement benefit obligation
Notes
412 428– 196 – 205 – 320 – 372
216 223 – 320 – 372
112 114 29 34119 133 15 20
– 164 – 187
– 2 – 8 2 42 5 – 2
– 25 – 2542 32 46 56
4
42 36 46 56
5.1% 5.1% 5.0% 5.0%5.7% 6.0%3.4% 3.5%
7.8% 7.8%4.6% 4.6%
12 978 60

73 Swiss Re Annual Report 2000
14. Stock compensation plans
As of 31 December 1999 and 2000, the Group had two and one, respectively, stock-based compensation plans, which are described below.
Under the fixed option plan, the Group may grant options for a certain number ofSwiss Re shares to members of the Executive Board and certain members of manage-ment each year. Under the plan, the exercise price of each option equals the marketprice of the shares on the date of the grant. Options issued vest at the end of thefourth year and have a maximum life of ten years.
A summary of the activity of the Group’s fixed stock option plan is as follows:
Weighted 1999 Weighted 2000
average average
exercise exercise
price in CHF Shares price in CHF Shares
Outstanding, 1 JanuaryOptions grantedOptions exercisedOptions forfeitedOutstanding, 31 December
Exercisable, 31 DecemberWeighted average fair value of
options granted during the year
The following table summarises the status of fixed stock options outstanding as of31 December 2000.
Range of Weighted average Weighted average
exercise remaining contrac- exercise
price in CHF Number of options tual life in years price in CHF
1 206 – 1 487 40 200 2.3 1 4532 080 – 3 040 107 653 8.7 2 7043 254 – 4 000 48 952 8.2 3 2601 206 – 4 000 196 805 7.3 2 587
The fair value of each option grant is estimated on the date of the grant using abinomial option-pricing model with the following weighted average assumptionsused for grants in 1999 and 2000, respectively: dividend yield of 1.9% and 2.5%;expected volatility of 22% and 22%; risk-free interest rate of 2.3% and 3.8%;expected life of 5.5 years and 5.5 years.
From annual option plans 1995 – 1999, an aggregate of 40 030 options to purchasethe same number of shares were held by members of the Executive Board, as of 31 December 2000. Options vest after four years.
Fixed option plan
2 033 79 587 2 518 126 0323 250 50 365 2 594 80 778
1 567 – 8 6602 090 – 3 920 3 092 –1 3452 518 126 032 2 587 196 805
11 250
641 550

74 Swiss Re Annual Report 2000
Employee stock purchase plan (discount plan)
Other commitments
The Group does not recognise compensation expense for these options. If compensa-tion expense for the options had been recognised, the Group’s net income andearnings per share would approximate the pro forma amounts in the following table:
CHF millions 1999 2000
Net incomeEarnings per common share in CHF:Basic Diluted
Under the terms of the discount plan for 1999, eligible employees of Swiss Re Zurichcould choose to purchase shares at a discount of CHF 1 000 per share, or receive acash equivalent of 90% of Swiss Re Zurich’s contribution. Swiss Re Zurich purchasesthese shares on the open market. The required service for eligibility is one calendaryear. The number of shares that an employee can purchase are 15 shares for seniormanagers, 10 shares for managers and 5 shares for other staff. This plan was dis-continued after 1999.
Under the plan, Swiss Re Zurich sold 6 525 shares to employees with an associatedcost of CHF 7 million in 1999. This cost is included in other operating costs andexpenses.
15. Commitments and contingent liabilities
As of 31 December 1999 and 2000, the Group had outstanding guarantees of CHF 2 455 million and CHF 2 815 million, respectively.
As a participant in limited investment partnerships, the Group commits itself to mak-ing available certain amounts of investment funding, callable by the partnership forperiods of up to 10 years.The total commitments remaining uncalled as of 31 Decem-ber 1999 and 2000 were CHF 964 million and CHF 1 074 million, respectively.
As part of its regular business, the Group makes capital (equity, debt) available toclients, contingent on the occurrence of a defined event. These commitments expireas follows:
As of 31 December 2000 CHF millions
2001 2492002 812004 552005 984Total 1 369
Notes
2 414 2 922
169 205169 204

75 Swiss Re Annual Report 2000
The Group had four and five guarantees as of 31 December 1999 and 2000, respec-tively, which primarily indemnify the purchasers of former Group entities for possiblerun-off losses or claims for pending litigation. The Group enters into guarantees withregulators, purchasers of former group entities and others in the ordinary course ofbusiness.
As part of its normal business operations, the Group enters into a number of agree-ments for the leasing of premises. Such agreements, which are operating leases,total the following obligations for the next five years and thereafter:
As of 31 December 2000 CHF millions
2001 442002 412003 382004 372005 35After 2005 210Total 405
The corresponding lease expenses incurred in 1999 and 2000 were CHF 44 millionand CHF 41 million, respectively.
In the normal course of business operations, the Group is involved in various claims,lawsuits and regulatory matters. In the opinion of management, the disposition ofthese or any other legal matters will not have a material adverse effect on the Group’sbusiness, consolidated financial position or results of operations.
16. Assets under management
The Group acts as manager for certain pooled funds that operate similar to mutualfunds. As of 31 December 1999 and 2000, net third party assets under managementat market value were CHF 3 720 million and CHF 6 017 million, respectively. TheGroup also manages an investment portfolio belonging to a group of companies inwhich the Group has an investment that is accounted for using the equity method.The market value of the portfolio, which is not recorded in the Group’s balance sheet,amounted to CHF 864 million and CHF 784 million as of 31 December 1999 and2000, respectively.

76 Swiss Re Annual Report 2000
Notes
17. Information on business segments
The Group provides reinsurance and financial services throughout the world. Swiss Re Group has threebusiness groups, which are determined by the organisational structure. These are Non-Life Business Group,which includes property-casualty reinsurance; Life & Health Business Group, which includes life, healthand disability reinsurance; Financial Services Business Group, which includes Swiss Re Investors, CapitalPartners and New Markets. The Corporate Centre provides direction and Group-wide support to thebusiness groups.
The main expenses excluded from the measurement of segments are goodwill amortisation, interestexpenses, indirect taxes and foreign exchange gains/losses.
Investment income and assets are allocated to business groups based on the investment income andassets of the legal entities that are operated by these business groups. Where one entity is controlled bytwo or more business groups, the investment income and assets are hypothecated to these businessgroups using technical liabilities and other information as a key for the allocation.
1999 Life Financial Corporate Reconcili- Consoli-
CHF millions Non-Life & Health Services Centre ation dated
RevenuesPremiums earnedNet investment incomeNet realised investment gainsOther revenues
ExpensesClaims and claim adjustment ex-
penses; life and health benefitsAcquisition costsAmortisation of goodwillOther operating costs and expenses
Operating income/expense
8 916 7 311 1 824 18 0511 564 1 839 422 21 3 8461 904 655 659 370 3 588
97 149 246
– 7 980 – 6 119 – 1 382 – 52 –15 533– 2 062 – 1 732 – 179 – 3 973
– 211 – 211– 829 – 449 – 708 – 293 – 506 – 2 785
1 513 1 505 733 – 293 – 229 3 229

77 Swiss Re Annual Report 2000
2000 Life Financial Corporate Reconcili- Consoli-
CHF millions Non-Life & Health Services Centre ation dated
RevenuesPremiums earnedNet investment incomeNet realised investment gainsOther revenues
ExpensesClaims and claim adjustment ex-
penses; life and health benefitsAcquisition costsAmortisation of goodwillOther operating costs and expenses
Operating income/expense
a) Non-Life Business Group – Line of business
Non-Life
1999 Accident, Other Business
CHF millions Property Liability Motor health lines Group
RevenuesPremiums earned
ExpensesClaims and claim adjustment expensesAcquisition costsOther operating costs and expenses
Underwriting result
Claims ratio in %Expense ratio in %Combined ratio in %
2 869 2 220 1 860 511 1 456 8 916
– 2 609 – 1 875 – 1 973 – 327 – 1 196 – 7 980– 800 – 357 – 430 – 121 – 354 – 2 062– 332 – 168 – 94 – 37 – 198 – 829
– 872 – 180 – 637 26 – 292 – 1 955
91 84 106 64 82 9039 24 28 31 38 32
130 108 134 95 120 122
11 530 8 330 2 221 22 0811 722 2 530 458 92 4 8022 459 453 738 625 4 275
217 178 395
– 10 143 – 7 448 – 2 040 – 19 631– 2 653 – 1 912 – 318 – 4 883
– 310 – 310– 751 – 506 – 845 – 321 – 651 – 3 074
2 164 1 447 431 – 321 – 66 3 655

78 Swiss Re Annual Report 2000
Notes
Non-Life
2000 Accident, Other Business
CHF millions Property Liability Motor health lines Group
RevenuesPremiums earned
ExpensesClaims and claim adjustment expensesAcquisition costsOther operating costs and expenses
Underwriting result
Claims ratio in %Expense ratio in %Combined ratio in %
b) Life & Health Business Group
CHF millions 1999 2000
RevenuesPremiums earnedNet investment incomeNet realised investment gains
ExpensesClaims and claim adjustment
expenses; life and health benefitsAcquisition costsOther operating costs and expenses
Operating income/expense
– 6 119 – 7 448– 1 732 – 1 912
– 449 – 506
1 505 1 447
7 311 8 3301 839 2 530
655 453
3 850 2 326 2 520 889 1 945 11 530
– 3 827 – 1 822 – 2 384 – 718 – 1 392 – 10 143– 913 – 485 – 478 – 230 – 547 – 2 653– 219 – 154 – 120 – 72 – 186 – 751
– 1 109 – 135 – 462 – 131 – 180 – 2 017
99 78 94 81 71 8830 28 24 34 38 29
129 106 118 115 109 117

79 Swiss Re Annual Report 2000
1 824 2 221422 458659 738
97 217
– 1 382 – 2 040– 179 – 318– 708 – 845
733 431
3 904 4 8382 909 3 5782 063 2 661
644 1 046601 800289 429
1 489 2 519753 1 008
12 652 16 8798 009 9 178
20 661 26 057
6 450 8 3542 541 3 8011 747 1 8661 400 1 4471 068 1 139
847 781814 1 570
5 794 7 09920 661 26 057
c) Financial Services Business Group
CHF millions 1999 2000
RevenuesPremiums earnedNet investment incomeNet realised investment gainsOther revenuesExpensesClaims and claim adjustment expensesAcquisition costOther operating costs and expenses
Operating income/expense
d) Geographic gross premiums written
CHF millions 1999 2000
United StatesUnited KingdomGermanyThe NetherlandsItalyCanadaSwitzerlandOther Total
e) Gross premiums written by line of business
CHF millions 1999 2000
PropertyLiabilityMotorAccident/healthMarineAviationCredit/suretyEngineering/other linesSubtotal non-lifeLifeTotal gross premiums written

Method of consolidation:f fulle equity1 voting share 24.74%
Aff
iliat
ion
in %
as
of
31.1
2.2
00
0
Met
hod
of
con
solid
atio
n
80 Swiss Re Annual Report 2000
18. Subsidiaries and equity investees
Europe
SwitzerlandEuropean Reinsurance Company of Zurich 100 fSchweiz Allgemeine Versicherungsgesellschaft 100 fSwiss Re Investors Zurich 100 fSwiss Re Partnership Holding AG 100 fXenum Finance AG 42.5 e
GermanyBavarian Reinsurance Company Limited 100 fBayerische Rück-Holding Aktiengesellschaft 100 f
United KingdomEuropean Credit and Guarantee Insurance PCC Limited 100 fFox-Pitt, Kelton Group Limited 66.6 fPalatine Insurance Company Limited 100 fSR International Business Insurance Company Ltd. 100 fSwiss Re Asset Management Ltd. 100 fSwiss Re Capital Markets Limited 100 fSwiss Re GB Limited 100 fSwiss Re Life & Health Limited 100 fSwiss Re New Markets Ltd. 100 fSwiss Re (UK) House Ltd. 100 fSwiss Reinsurance Company UK Limited 100 fThe Mercantile & General Reinsurance Company 100 f
IrelandSwiss Re International Treasury Ltd. 100 fBavarian Reinsurance Ireland Ltd. 100 f
ItalySwiss Re Italia S.p.A. 100 f
LuxembourgRück Treasury & Management (Luxembourg) S.A. 100 fSwiss Re Treasury (Luxembourg) S.A. 100 f
NetherlandsHolland Re Holding B.V. with 2 subsidiaries 100 fNCM Holding N.V. with 11 subsidiaries 90 f
NorwayBayerische Rück Norge AS 100 f
Notes

81 Swiss Re Annual Report 2000
Aff
iliat
ion
in %
as
of
31.1
2.2
00
0
Met
hod
of
con
solid
atio
n
North America
BarbadosAtlantic International Reinsurance Company Ltd. 100 fEuropean Atlantic Reassurance Company Ltd. 100 fEuropean Finance Reinsurance Company Ltd. 100 fEuropean International Holding Company Ltd. 100 fEuropean International Reinsurance Company Ltd. 100 fStockwood Reinsurance Company Ltd. 100 f
BermudaEnglewood Reinsurance Company Ltd. 100 fHarrington International Insurance Ltd. 71.43 fLife Re International, Ltd. 100 fPartner Reinsurance Company1 24.51 eSwissRe Finance (Bermuda) Ltd. 100 fSwissRe Investments (Bermuda) Ltd. 100 f
CanadaSwiss Reinsurance Company Canada 100 fSwiss Re Holdings (Canada) Inc. 100 fSwiss Re Life & Health Canada 100 f
Grand CaymanHarrington Holdings Ltd. 71.43 f
USFacility Insurance Holding Corporation 100 fAllied Life Financial Corporation 100 fAssure America, Inc. 100 fInternational Risk Management Group Ltd. with 28 subsidiaries 100 fLife Re Capital Trust I 100 fLife Re Capital Trust II 100 fLife Reassurance Corporation of America 100 fLSL Financial Corporation 100 fMidland Life Insurance Company 100 fReassure America Life Insurance Company 100 fTexas Re Life Insurance Company 100 fNAS Management Inc. 100 fNorth American Capacity Insurance Company 100 fNorth American Elite Insurance Company 100 fNorth American Specialty Insurance Company 100 fSwiss Reinsurance America Corporation 100 fSwiss Re America Holding Corporation 100 fSwiss Re Atrium Corporation 100 fSwiss Re Capital Markets Corporation 100 fSwiss Re Financial Products Corporation 100 fSwiss Re Investors America 100 fSwiss Re Life & Health America Inc. 100 fSwiss Re Management Corporation 100 f

Method of consolidation:f fulle equity
82 Swiss Re Annual Report 2000
Aff
iliat
ion
in %
as
of
31.1
2. 2
00
0
Met
hod
of
con
solid
atio
n
Swiss Re New Markets Corporation 100 fUnderwriters Re 100 fWashington International Insurance Company 100 f
Latin America
MexicoSwiss Re México, S.A. 94.78 f
AustraliaSwiss Re Australia Ltd. 100 fSwiss Re Life & Health Australia Limited 100 fThe Mercantile and General Reinsurance 100 f
Company of Australia LimitedSwiss Re Investors Australia Pty Ltd. 100 f
Africa
South AfricaSwiss Re Southern Africa Limited 100 fSwiss Re Life & Health Southern Africa Limited 100 fSwiss Re Investors Southern Africa 100 f
Asia
Hong KongSwiss Re Investors Asia Limited 100 f
Notes

83 Swiss Re Annual Report 2000
Goodwill
Acquired present value of future profits
Investment valuation changes
19. Change in accounting basis
The Group has changed its accounting policies and presentation to conform to morewidely accepted international practice. Therefore certain accounting policieschanged from one acceptable method to another under the Swiss ARR basis. Thenature and impact of these changes are set out below.
Reconciliation of previously published 1999 figures to new basis Swiss GAAP
CHF millions Net income Net equity
As previously published 2 789 17 778Goodwill – 211 4 121Acquired present value of future profits (PVFP) – 242 2 678Investment valuation changes 367 1 307Non-life reserves and loss adjustment expense (LAE) 110 – 1 613Life reserves and deferred acquisition costs – 287 1 020Exchange rate impacts – 215 118Deferred tax 82 – 935Other 53 358New basis Swiss GAAP 2 446 24 832
The main differences between the accounting standards used by the Swiss Re Groupin the 1999 Annual Report as previously published and those now adopted are setout below.
For new basis Swiss GAAP, the excess of the cost of the acquired businesses overthe fair value of the net assets acquired is recorded as goodwill and amortised overperiods of between 5 and 20 years. Under the old basis, goodwill arising on theacquisition of consolidated entities was offset through retained earnings.
PVFP represents the discounted value of estimated future gross profits on in-forcelife business acquired. The asset is amortised over the expected revenue recognitionperiod of the underlying acquired business. Under the old basis, elements of PVFPwere implicitly included in goodwill.
Land and buildings leased to unrelated third parties are recorded at depreciated cost,net of any impairment charges and classified as investment property. Real estateinvestments held for resale are accounted for at the lower of carrying value or marketand are not depreciated. Under the old basis, investments in land and buildings were recorded at market value with realised gains and losses from sales as well asvaluation adjustments included in the income statement.
Under the new basis, minority (typically less than 20% interests) shareholdings areaccounted for as “Available for sale” securities, and are recorded at fair value.Unrealised gains and losses are recorded in equity and other than temporary declinesin value below cost are recorded in income. Other minority shareholdings wereaccounted for at the lower of cost or market under the old basis.

84 Swiss Re Annual Report 2000
Non-life reserves and loss adjustmentexpense (LAE)
Life reserves and deferred acquisitioncosts
Exchange rate impacts
Deferred tax
Contracts that do not meet the risk transfer requirements defined as transferring asignificant possibility of a significant loss to the reinsurer are accounted for asdeposit arrangements. Assets and liabilities transferred for such transactions arerecorded as assets and liabilities in the balance sheet, with a service fee recognisedin revenues. Under the old basis, such transactions were recorded as reinsurance,with all transferred assets and claims provisions recorded in the balance sheet, andas premium revenues and claims expenses, respectively, in the income statement.
For new basis Swiss GAAP, unpaid non-life claims provisions may only be discountedif the payment pattern and ultimate cost are fixed and determinable on an individualbasis. Under the old basis, claims provisions for finite risk reinsurance and acquiredblocks of retroactive reinsurance business were discounted if this was required forstatutory reporting of the Group company.
Included with provisions for unpaid claims are provisions for estimated future costsassociated with the settling of incurred claims. The change in the provision isrecorded as part of claims expenses in the income statement. For the old basis, therecording of such items was in accordance with statutory practice of the respectiveGroup company.
Liabilities for life and health policy benefits are generally calculated using the netlevel premium method, based on assumptions which are set at the time the contractis issued or, in the case of contracts acquired by purchase, at the purchase date.Under the old basis, liabilities for policy benefits were based on the statutoryrequirements for each Group company.
Assets and liabilities denominated in foreign currencies are translated at the rates ofexchange on the balance sheet date. Revenues and expenses are translated ataverage exchange rates. Unrealised gains or losses resulting from translation offunctional currencies to the reporting currency are included in the currency transla-tion account in equity. Under the old basis, all items in the balance sheet and incomestatement denominated in a foreign currency were translated at the year-end rate ofexchange. The difference resulting from the revaluation of opening balances wasrecorded in retained earnings.
This is the impact of deferred taxes on the differences described above.
Notes

85 Swiss Re Annual Report 2000
Report of the Group auditors
To the General Meeting of Swiss Reinsurance CompanyZurich
To the General Meeting of Swiss Reinsurance CompanyZurich
As auditors of the Group, we have audited the consolidated financial statements(income statement, balance sheet, statement of shareholders’ equity, statementof comprehensive income, statement of cash f low and notes / pages 39 to 44 and46 to 84) of Swiss Re Group for the year ended 31 December 2000.
These consolidated financial statements are the responsibility of the Boardof Directors. Our responsibility is to express an opinion on these consolidatedfinancial statements based on our audit. We confirm that we meet the legalrequirements concerning professional qualification and independence.
Our audit was conducted in accordance with auditing standards promulgatedby the Swiss profession and with the International Standards on Auditing issuedby the International Federation of Accountants (IFAC), which require that anaudit be planned and performed to obtain reasonable assurance about whetherthe consolidated financial statements are free from material misstatement. Wehave examined on a test basis evidence supporting the amounts and disclosuresin the consolidated financial statements. We have also assessed the accountingprinciples used, significant estimates made and the overall consolidated financialstatement presentation. We believe that our audit provides a reasonable basis forour opinion.
In our opinion, the consolidated financial statements give a true and fair viewof the financial position, the results of operations and the cash f lows inaccordance with the Accounting and Reporting Recommendations (ARR) andcomply with Swiss law.
We recommend that the consolidated financial statements submitted to yoube approved.
PricewaterhouseCoopers Ltd
Michael P. Nelligan Rudolf A. Bless
Zurich, 24 April 2001

“ Access to sufficient water of good quality is a basic human need.”
Boo
km@
rk: m
ore
abou
t A
lexa
nder
J.B
. Zeh
nder
at
ww
w.s
wis
sre.
com

87 Swiss Re Annual Report 2000
Annual report Swiss Reinsurance Company
Reinsurance and holding company
Swiss Reinsurance Company performs a dual role within the Swiss Re Group asboth a reinsurance and a holding company. The assessment of the market posi-tion, profitability and financial strength of our world-wide organisation mustfocus primarily on the consolidated financial statements.
The following commentary on the 2000 financial year of the parent companytherefore complements the review of the financial year of the Swiss Re Groupand is intentionally kept short.
Profit for the financial year
After-tax profit for the financial year amounted to CHF 1 146 million, follow-ing CHF 1 759 million in 1999.
This decline in profit is attributable to the technical result, which fell consider-ably from CHF –487 million in the previous year to CHF –1 321 million. Incontrast, the non-technical result rose from CHF 2 436 million in 1999 toCHF 2 646 million.
Reinsurance result
In the year under report, a strong growth in premium volume was recorded, asnet premiums written increased by 16% to CHF 8 525 million. This was ac-companied by lower administrative expenses and only modestly higher overalloperating expenses. The technical result is marked by a considerable increase in claims incurred of CHF 1 354 million, which is partly related to Groupinternal retrocessions and a contribution of CHF 371 million to the provisionfor catastrophe claims (release of CHF 833 million in 1999).
Investment income and investments
The investment result rose by CHF 149 million to CHF 3 673 million. As aresult of capital market trends, which continued favourably, realised gains on the sale of investments once again increased significantly and reached CHF 4 183 million. These were accompanied by valuation adjustments of CHF 2 044 million, which consisted predominantly of precautionary valuationadjustments to the securities portfolio as well as the write-off of goodwillresulting from acquisitions in recent years.
The balance sheet amount of investments increased by CHF 1.0 billion to CHF 37.8 billion. Most notably, participation assets increased due to capitalcontributions to existing subsidiaries.
Access to sufficient water ofgood quality is a basic humanneed. Today, over one-fifth ofthe world’s population stilldoes not have access to safedrinking water and naturalwater resources are continuallybeing polluted. Unless properlymanaged, water scarcity willalso curb additional food pro-duction. Since Switzerland isso fortunate as to be located in the “water tower” of Europe,it is our task to back others intheir efforts to deploy theirwater resources wisely. Myinstitute and I are acceptingthe challenge to become aglobal player in helping toachieve fair partnerships forwater.
Alexander J. B. ZehnderDirector of Swiss FederalInstitute for EnvironmentalScience and Technology, Zurich

88 Swiss Re Annual Report 2000
Technical provisions
The technical provisions continued to rise and amounted to CHF 23 486 mil-lion on the balance sheet date. The increase of CHF 1707 million ref lects thehigher business volume and the loss burden incurred during the financial year.Furthermore, reserves were strengthened by a contribution to the provision forcatastrophe claims in the amount of CHF 371 million; as of the balance sheetdate, this provision amounted to CHF 1696 million.
Subordinated liabilities
As of 31 December 2000, the company held four different perpetual sub-ordinated liabilities totalling CHF 1942 million. These liabilities combineelements of debt and equity, and may be included in solvency calculations.
Shareholders’ equity
Shareholders’ equity at year-end 1999 amounted to CHF 6 470 million.Movements during the year include the dividend payment of CHF 712 millionas well as the consideration of the capital reduction from shares repurchased toa total value of CHF 195 million. Furthermore, a special allocation of CHF130 million mainly related to a Group internal merger was considered. Withthe inclusion of the profit for the financial year 2000, shareholders’ equityequalled CHF 6 839 million at year-end 2000.
At the General Meeting on 30 June 2000, a capital reduction in the amount ofthe 72 650 shares repurchased was approved, thus reducing the nominal sharecapital of the company to CHF 146 583 010, consisting of 14 658 301 regis-tered shares with a par value of CHF 10.

89 Swiss Re Annual Report 2000
Income statement Swiss Reinsurance CompanyFor the years ended 31 December
1999 2000
CHF millions Notes Net Net
Technical accountPremiums earnedClaims incurredChange in the provisions for life reinsuranceProfit commissionsOperating expensesAllocated investment returnTechnical result
Non-technical accountInvestment incomeInvestment chargesAllocated investment returnInterest chargesOther incomeOther chargesNon-technical result
Extraordinary income and chargesExtraordinary incomeExtraordinary chargesExtraordinary result
Total resultProfit before taxTaxProfit for the financial year
The accompanying notes are an integral part of the financial statements.
1 7 060 7 6802 – 5 818 – 7 1723 – 53 1124 – 174 – 2485 – 2 416 – 2 692
914 999– 487 – 1 321
6 5 774 6 3537 – 2 250 – 2 680
– 914 – 999– 188 – 195
214 353– 200 – 1862 436 2 646
450 –– 450 –
0 –
1 949 1 325– 190 – 1791 759 1 146

90 Swiss Re Annual Report 2000
Balance sheet Swiss Reinsurance CompanyAs of 31 December
Assets
CHF millions 1999 2000
InvestmentsLand and buildingsInvestments in subsidiaries and affiliated companiesLoans to subsidiaries and affiliated companiesSharesFixed income securities and registered debt instrumentsMortgages and loansTime depositsDeposits with ceding companiesTotal investments
DebtorsDebtors from reinsurance operationsOther debtorsTotal debtors
Other assets and accrualsCash at bank and in handIntangible assetsFixed and other assetsAccrued interest and rentOther accrualsTotal other assets and accruals
Total assets
1 843 2 02211 903 15 403
4 010 1 9236 713 6 9616 821 6 523
552 5801 138 3003 794 4 064
36 774 37 776
1 309 2 481389 256
1 698 2 737
214 287– 60
126 140160 152
98 74598 713
39 070 41 226

91 Swiss Re Annual Report 2000
Balance sheet Swiss Reinsurance CompanyAs of 31 December
Liabilities and shareholders’ equity
CHF millions Notes 1999 2000
Technical provisions
Provisions for other risks and charges
Deposits retained from ceded reinsurance business
Other liabilities and accruals
Subordinated liabilities
Shareholders’ equityShare capitalLegal reserveReserve for own sharesOther reservesDisposable profit
Retained earnings brought forwardProfit for the financial year
Total shareholders’ equity
Total liabilities and shareholders’ equity
The accompanying notes are an integral part of the financial statements.
8 21 779 23 486
4 405 4 117
68 226
9 4 350 4 616
1 998 1 942
10147 147650 650
1 005 2492 897 4 6381 771 1 155
91 146
6 470 6 839
39 070 41 226

The income statement and the balance sheet are presented in a format whichfollows the Accounting and Reporting Recommendations issued by the SwissFoundation for Accounting and Reporting. The financial statements and the notesare prepared in accordance with the regulations of the Swiss Company Law.
The 2000 financial year comprises the accounting period from 1 January to 31 December 2000. However, due to local convention, reinsurance business fromJapan included in the accounts is for the period from 1 April 2000 to 31 March2001.
The allocated investment return includes the actual investment income which canbe directly attributed to the reinsurance business. In addition, it contains theinvestment return generated on the investments covering the technical provisions.The interest rate reflects the currency-weighted five-year average yield on five-year government bonds.
The overall management charges are allocated to the reinsurance business andthe investment business on an imputed basis. Self-charged rent on propertiesused for own purposes is included in these expenses as well as in income fromland and buildings.
The taxes relate to the financial year and include taxes on income and capital aswell as indirect taxes. The taxes attributable to foreign branches are included onthe basis of local financial statements.
The following assets are stated at cost, less necessary and legally permissibledepreciation: – Land and buildings (purchase or construction cost)– Investments in subsidiaries and affiliated companies– Shares– Fixed income securities and registered debt instruments– Derivative financial instruments (without hedging intent)These assets are not subject to revaluation. Discounted securities are valued attheir amortised cost. Derivative financial instruments used for hedging purposesare valued on the basis of the underlying business. The valuation rules prescribedby the Swiss insurance supervisory authority are observed.
With the exception of property, fixed assets are stated at cost, less individuallyscheduled straight-line depreciation over their useful lives. Items of minor valueare not capitalised. The same principles apply to the capitalisation of intangibleassets which refer entirely to software development expenses.
The following items are stated at nominal value in the balance sheet, after deduc-tion of known credit risks if applicable: – Loans to subsidiaries and affiliated companies – Mortgages and loans – Time deposits – Deposits with ceding companies – Debtors – Cash at bank and in hand
Basis of presentation
Time period
Valuation methods:Income statement
Balance sheet / Assets
Notes Swiss Reinsurance CompanyValuation principles
92 Swiss Re Annual Report 2000

93 Swiss Re Annual Report 2000
The technical provisions are valued in accordance with the following principles:
Premiums written relating to future periods are stated as provisions for unearnedpremiums and are normally calculated by statistical methods.
The technical provisions for life reinsurance business are determined on the basisof actuarially calculated present values taking experience into account. They alsoinclude the provisions for unearned premiums of life reinsurance and the deduc-tion of deferred charges.
Provisions for claims outstanding are based on information provided by clients and own estimates of expected claims experience which are drawn from empiricalstatistics. These include provisions for claims incurred but not reported. Unpaidinsurance obligations are set aside at the full expected amount of future payment.
Provisions for profit commissions are based on contractual agreements withclients and depend on the results of reinsurance treaties.
At the direction of the Swiss insurance supervisory authority, a provision forcatastrophe claims is established.
Provisions for other risks and charges are formed according to business principlesand are based on estimated needs. Provisions for taxation contain prospectivetaxes on the basis of the financial year just ended.
Deposits retained from ceded reinsurance business as well as subordinated andother liabilities are stated at redemption value. Exceptions are the derivative finan-cial instruments included under the item Other creditors: these are valued usingthe same principles applied for the derivative financial instruments included underinvestments.
All items in the balance sheet and the income statement denominated in foreigncurrencies were uniformly translated into Swiss francs at the currency exchangerates applicable on the balance sheet date. Differences arising from therecalculation of the opening balance sheet are booked via a correspondingprovision and have no impact on the income statement.
Valuation differences from foreign exchange transactions versus the actuallyrealised transaction rates are recognised in the income statement.
The currency exchange rates applicable for key currencies are shown on page 53.
Balance sheet / Liabilities
Foreign currency translation

94 Swiss Re Annual Report 2000
Notes Swiss Reinsurance CompanyAdditional information on the financial statements
1999 2000
CHF millions Gross Retro Net Gross Retro Net
Technical accountPremiums writtenChange in the provision
for unearned premiums1. Premiums earned
Claims paidChange in the provision
for claims outstanding2. Claims incurred
3. Change in the provision for life reinsurance
4. Profit commissions
CommissionsAdministrative expenses5. Operating expenses
CHF millions 1999 2000
Investment resultIncome from land and buildingsDividend and interest from subsidiaries
and affiliated companiesDividend incomeIncome from fixed income securities,
loans and mortgagesIncome from time depositsIncome from deposits with ceding companiesRealised gains on sale of investments6. Investment income
Investment management chargesValuation adjustments on investmentsRealised losses on sale of investments7. Investment charges
Investment result
7 882 – 525 7 357 9 462 – 937 8 525
– 294 – 3 – 297 – 844 – 1 – 8457 588 – 528 7 060 8 618 – 938 7 680
– 5 025 385 – 4 640 – 5 916 222 – 5 694
– 1 299 121 – 1 178 – 1 589 111 – 1 478– 6 324 506 – 5 818 – 7 505 333 – 7 172
– 56 3 – 53 – 113 225 112
– 231 57 – 174 – 308 60 – 248
– 1 527 92 – 1 435 – 1 875 145 – 1 730– 981 – 962
– 2 416 – 2 692
139 146
1 954 1 140214 191
490 46535 44
155 1842 787 4 1835 774 6 353
– 121 – 105– 1 738 – 2 044
– 391 – 531– 2 250 – 2 680
3 524 3 673

95 Swiss Re Annual Report 2000
1999 2000
CHF millions Gross Retro Net Gross Retro Net
8. Technical provisionsProvisions for unearned premiumsProvisions for life reinsuranceProvisions for claims outstandingProvisions for profit commissionsProvision for catastrophe claims
Total technical provisions
CHF millions 1999 2000
9. Other liabilities and accrualsCreditors arising out of reinsurance operationsAmounts owed to banksDebenturesLoansOther creditorsAccruals
Total other liabilities and accruals
CHF millions 1999 2000
10. Shareholders’ equity
Change in shareholders’ equityShareholders’ equity on 31 December (previous year)
Dividend paid for the previous yearShare buyback / capital reductionSpecial allocationsProfit for the financial year
Shareholders’ equity on 31 December before allocation of profitDividend payment
Shareholders’ equity on 31 December after allocation of profit
Source of shareholders’ equity (after allocation of profit)From nominal capitalFrom share premium, less share buyback / capital reductionFrom profit allocationFrom other allocations
Shareholders’ equity on 31 December after allocation of profit
1 Board of Directors’ proposal to the General Meeting of 31 May 2001
1 557 – 18 1 539 2 363 – 18 2 3452 294 12 2 306 2 355 – 211 2 144
16 759 – 250 16 509 17 533 – 350 17 183104 – 4 100 123 – 5 118
1 325 – 1 325 1 696 – 1 696
22 039 – 260 21 779 24 070 – 584 23 486
1 763 1 76929 75
500 500908 959961 1 146189 167
4 350 4 616
5 398 6 470– 687 – 712
– – 195– 130
1 759 1 1466 470 6 839– 712 – 7131
5 758 6 126
147 1471 934 1 7533 493 3 927
184 2995 758 6 126

96 Swiss Re Annual Report 2000
Notes Swiss Reinsurance CompanyAdditional information
Contingent liabilities
Security deposits
Fire insurance value of tangible assets
Obligations towardsemployee pension funds
Bonds and debentures
Investments in subsidiaries
Own shares Swiss Re Group
Claims on and obligations towards Group companies
Provisions for other risksand charges
Other liabilities and accruals
Netting of income and charges
Contingent liabilities, mainly towards Group companies, amounted on 31 December 2000 to CHF 1 672 million (1999: CHF 2 149 million). In addition,there were 17 unlimited guarantees and other contingent liabilities; 14 of theseare for obligations towards Group companies. No payments are expected underthese guarantees.
To secure the technical provisions on the 2000 balance sheet date, securities inthe amount of CHF 1 987 million were deposited in favour of ceding companies(1999: CHF 2 132 million). In addition, a mortgage of CHF 7 million exists on areal estate property with a book value of CHF 16 million.
The insurance value of tangible assets, comprising the real estate portfolio andother tangible assets, amounted on 31 December 2000 to CHF 2 605 million(1999: CHF 2 325 million).
The current account obligations towards employee pension funds amounted toCHF 61 million on the 2000 balance sheet date (1999: CHF 151 million).
The company has the following outstanding bonds and debentures:33⁄4% interest, CHF 500 million, 2 July 1997–200733⁄4% interest, CHF 600 million, perpetual from 15 June 1999 but no less than 12 years; this bond is included in the item Subordinated liabilities.
Details on the Swiss Re Group’s subsidiaries are to be found on pages 80 ff.
Own shares held by the Swiss Re Group are stated on page 68.
CHF millions 1999 2000
Deposits with ceding companies 1504 1716Debtors 599 1432Deposits retained from ceded reinsurance business – 162Other liabilities 631 791
This item contains provisions for taxation in the amount of CHF 221 million (1999: CHF 229 million) and other provisions totalling CHF 3 896 million (1999: CHF 4 176 million). Other provisions notably include a provision derivingfrom the restructuring of participations and a provision for currency fluctuations.
Other liabilities and accruals are long-term liabilities in the amount of CHF 1177million (1999: CHF 1408 million) and short-term liabilities amounting to CHF 3 439 million (1999: CHF 2942 million).
In the 1999 income statement, income and charges in the equal amount of CHF 3 500 million were netted. These positions resulted from a Group internalrestructuring of participations and had no impact on the profit.

97 Swiss Re Annual Report 2000
Major shareholders
Personnel information
Actuarial audit
Based on the information at our disposal, Credit Suisse Group owned 977 441 reg-istered shares of Swiss Reinsurance Company on 20 April 2001, representing6.67% of the total share capital.
In Switzerland, Swiss Reinsurance Company employed a staff of 2 841 on the balance sheet date (1999: 2 870). Personnel expenses for the 2000 financial yearamounted to CHF 687 million (1999: CHF 648 million).
The independent actuary, Paul Embrechts, Oberrohrdorf, has confirmed in hisreport that the balance sheet provisions for the life reinsurance business stated atyear-end 2000 have been calculated in accordance with European Union guide-lines.

98 Swiss Re Annual Report 2000
The General Meeting to be held in Zurich on 31 May 2001 has at its disposalthe following balance sheet profit (cf. income statement and balance sheet,pages 89 to 91):
in CHF 1999 2000
Retained earnings brought forward from previous year
Profit for the financial year
Disposable profit
Number of Nominal
registered shares capital in CHF
Share structureFor the financial year 2000– eligible for dividend– not eligible for dividend
Total shares issued
The Board of Directors proposes to the General Meeting to allocate this profitas follows:
in CHF 1999 2000
DividendAllocation to reservesBalance carried forward
Disposable profit
Dividend
If the proposal of the Board of Directors is accepted, a dividend of CHF 50per share will be paid.
After deduction of the Federal Withholding Tax of 35%, the dividend will bepaid from 6 June 2001 by means of dividend order to shareholders recorded inthe share register or to their deposit banks.
Zurich, 24 April 2001
Proposal for allocation of profit
12 130 609 9 303 3571 758 930 798 1 146 087 021
1 771 061 407 1 155 390 378
14 253 041 142 530 410405 260 4 052 600
14 658 301 146 583 010
711 758 050 712 652 0501 050 000 000 430 000 000
9 303 357 12 738 328
1 771 061 407 1 155 390 378

99 Swiss Re Annual Report 2000
Report of the statutory auditors
To the General Meeting of Swiss Reinsurance CompanyZurich
As statutory auditors, we have audited the accounting records and thefinancial statements (income statement, balance sheet and notes / pages 89 to98) of Swiss Reinsurance Company for the year ended 31 December 2000.
These financial statements are the responsibility of the Board of Directors.Our responsibility is to express an opinion on these financial statements basedon our audit. We confirm that we meet the legal requirements concerningprofessional qualification and independence.
Our audit was conducted in accordance with auditing standards promulgatedby the Swiss profession, which require that an audit be planned and performedto obtain reasonable assurance about whether the financial statements are freefrom material misstatement. We have examined on a test basis evidencesupporting the amounts and disclosures in the financial statements. Wehave also assessed the accounting principles used, significant estimates madeand the overall financial statement presentation. We believe that our auditprovides a reasonable basis for our opinion.
In our opinion, the accounting records and financial statements and theproposed appropriation of available earnings comply with Swiss law and thecompany’s Articles of Association.
We recommend that the financial statements submitted to you be approved.
PricewaterhouseCoopers Ltd
Michael P. Nelligan Rudolf A. Bless
Zurich, 24 April 2001

Without water there would beno life. And good fresh water isbecoming scarce on our planet.How can we share this preciousresource in a sustainable waywithout resorting to violence?The River Nile, for example, liesat the centre of a complex sys-tem of waterways, economicand political aspirations, var-ious development programmes,basic human needs and sophis-ticated management methods.The conflict and risk potential ishuge, but so is the potential forfruitful cooperation. The Nile isbecoming a supreme paradigmof how (or whether) man is ableto deal with this new type ofcomplex problem. My challengeis to contribute to in-depth
understanding of such situa-tions and to the development ofconflict-solving strategies forthe equitable and sustainableuse of scarce resources.
Kurt R. SpillmannDirector of Centre for SecurityStudies and Conflict Research,Zurich
“We must learn to share scarce resources.”
Boo
km@
rk: m
ore
abou
t Kur
t R. S
pillm
ann
at w
ww
.sw
issr
e.co
m

101 Swiss Re Annual Report 2000
Concentration of risks which may be affected by the same claim event or concen-tration of shares in the same risk or same event through reinsurance treaties.
Admin Re is the acceptance of closed blocks of in-force life and health insurancebusiness either through acquisition or reinsurance including assuming the responsi-bility to administer the underlying policies.
The maximum amount of insurance coverage that a company may sell. Companiesmake judgements about how much insurance coverage they can prudently provide.One factor in determining capacity is state government regulations that defineminimum statutory surplus requirements. Capacity also refers to the amount ofinsurance coverage 1) to a particular policyholder or 2) in the marketplace in general.
Payment incurred under the terms of a (re)insurance contract for the claim event.
Claims handling: The work in connection with the investigation, settlement andpayment of claims from the time of their occurrence until settlement.
Claims incurred and claim adjustment expenses: All claims payments plus theadjustment in the outstanding claims provision of a business year and claimadjustment expenses.
Unpaid claims and claim adjustment expenses: Provision for claims and claim adjustment expenses which have been incurred but not yet finally settled.
Sum of claims paid, change in the provision for unpaid claims and claim adjustmentexpenses, in relation to net earned premiums. This ratio enables the assessment ofbusiness performance in non-life reinsurance.
Sum of the claims ratio and the expense ratio. This ratio enables the assessment ofbusiness performance in non-life reinsurance before inclusion of investment return.
Remuneration paid by the insurer to its agents, brokers or intermediaries, or by thereinsurer to the insurer, for its costs in connection with the acquisition and adminis-tration of insurance business.
Insurance and reinsurance protection based on contractual agreement.
The premiums attributable to the financial year, including unearned premiums of theprevious year and minus unearned premiums for the following years.
Sum of acquisition costs and other operating costs and expenses in relation to netpremiums earned. This ratio enables the assessment of business performance innon-life reinsurance.
Accumulation
Admin Re
Capacity
Claim
Claims ratio
Combined ratio
Commission
Cover
Earned premiums
Expense ratio
Glossary

102 Swiss Re Annual Report 2000
Insurance providing payment of a sum of money upon death of the insured, or in thecase of endowment insurance, upon survival of a specified period.
Annuity insurance: life insurance in which the benefits consist of a regular incomepayment for a specified period of time.
Life or endowment insurance: life insurance in which the benefits take the form of acontractually determined amount payable upon death or on survival to a specifiedage.
All classes of insurance business with the exception of life.
Accident insurance: Insurance of individuals or of groups against economic risks inthe event of death or temporary or permanent disability by accident.
Aviation insurance: Insurance of accident and liability risks, as well as hull damage,in connection with the operation of aircraft.
Burglary, fidelity guarantee and allied lines insurance: Insurance against burglary,breaking and entering, robbery, embezzlement; also includes water damage, glassbreakage, damage to and loss of jewellery or damage or losses in connection withthe keeping of animals.
Business interruption/loss of profits/business income protection insurance:Insurance against the financial effects of an insured loss on a company’s income.The insurance covers overhead costs and lost profit.
Credit insurance: Insurance against financial losses sustained through the failure for commercial reasons of policyholders’ customers to pay for goods or servicessupplied to them.
Disability insurance: Insurance against the incapacity to exercise a profession as aresult of sickness or other infirmity.
Employers’ liability insurance: Insurance by employers covering employees forinjuries arising out of their employment.
Engineering insurance: Insurance of construction and erection objects during theconstruction or erection period and the insurance of machinery in operating plants.
Fire insurance: Insurance against fire, lightning, explosion or damage caused byfalling aircraft; it can also embrace insurance against windstorm, earthquake, flood, and other natural hazards or political risks.
General third party liability insurance: Insurance of industrial, commercial,employers’, product, professional or private liability to third parties.
Hail crop insurance: Insurance of crops in open fields, or of greenhouses and theircontents against hail, storm and other natural hazards.
Life insurance
Non-life insurance

103 Swiss Re Annual Report 2000
Health insurance: Insurance against sickness as a result of accident or illness.
Marine insurance: Insurance against damage or loss of ships and cargoes: also includes offshore drilling platforms.
Mortgage guarantee insurance: Insurance protection of the mortgagee against lossof capital and interest.
Motor insurance: Insurance against accident and liability as well as againstaccidental collision damage in connection with motor vehicles.
Nuclear energy insurance: Insurance against property damage, liability and accidentin connection with the operation of nuclear energy installations.
Product liability insurance: Insurance of the liability of the manufacturer or supplierof goods for damage caused by their products.
Professional and directors’ and officers’ liability: Insurance of liabilities arising fromthe performance of professional or official company duties.
Property insurance: Collective term for fire and business interruption insurance aswell as burglary, fidelity guarantee and allied lines.
Surety insurance: Sureties and guarantees issued to third parties for the fulfilment ofcontractual liabilities.
Premiums earned plus net investment income plus other revenues.
The totality of risks assumed by an insurer or reinsurer; also the totality of invest-ments of a company.
The cost of insurance coverage, often described as “written” or “earned”. Writtenpremiums refer to premiums for all policies sold during a specific accounting period.Earned premiums refer to premiums an insurance company has recorded asrevenues during a specific accounting period. For example, a one-year policy sold on1 January would produce just three months’ worth of “earned premium” in the firstquarter of the year.
Insurance for insurance companies which spreads the risk of the direct insurer,making the risk of its portfolio more homogeneous.
Facultative reinsurance: Reinsurance of the insurer’s risks on an individual basis.
Financial reinsurance: Form of reinsurance treaty with specific consideration ofaccounting features of the insurer.
Non-proportional reinsurance: Form of reinsurance in which the reinsurer assumes – against payment of a specially calculated premium – the part of the insurer’sclaims that exceed a certain amount.
Operating revenues
Portfolio
Premiums
Reinsurance

104 Swiss Re Annual Report 2000
Retrocession
Risk
Underwriting result
Proportional reinsurance: Form of reinsurance in which the premiums and claims ofthe insurer are shared proportionally by the insurer and reinsurer.
Quota-share reinsurance: Form of proportional reinsurance in which a defined per-centage of all risks held by the insurer in a specific line is reinsured.
Surplus reinsurance: Form of proportional reinsurance in which risks are reinsuredover a specified amount.
Treaty reinsurance: Participation of the reinsurer in certain sections of the insurer’sbusiness as agreed by treaty.
Amount of the risk accepted in reinsurance that is passed on by the reinsurer to otherreinsurance companies.
The probability of loss due to an insured object, hazard or interest. Risk involves thepossibility of an event occurring causing a loss or an event occurring causing a lossthat was larger than previously estimated.
Risk category: Grouping together of risks with similar hazard characteristics.
Risk management: Management tool for the comprehensive identification andassessment of risks based on knowledge and experience in the fields of naturalsciences, technology, economics and statistics.
Risk of change: Fluctuation of actual from statistically anticipated claims experienceas a result of technical, social, commercial or political changes.
Premiums earned less insurance losses and loss adjustment expenses and under-writing expenses (determined on a GAAP or statutory basis). Also referred to asGAAP underwriting result or statutory underwriting result.

Financial years 1997–2000Based on new accounting principles (1997–1999 restated)
105 Swiss Re Annual Report 2000
CHF millions 1997 1998 1999 2000
Income statementRevenuesPremiums earnedNet investment incomeNet realised investment gainsOther revenuesTotal revenuesExpensesClaims and claim adjustment expensesLife and health benefitsAcquisition costsAmortisation of goodwillOther operating costs and expensesTotal expensesIncome before income tax expenseIncome tax expenseNet income on ordinary activities
Extraordinary incomeExtraordinary charges
Net income
Balance sheetInvestmentsOther assetsTotal assetsUnpaid claims and claim adjustment expensesLiabilities for life and health policy benefitsUnearned premiumsOther current liabilitiesLong-term debtTotal liabilities
Shareholders’ equity
Return on equity in %Earnings per share in CHF
15 862 16 727 18 051 22 0812 995 3 131 3 846 4 8021 281 2 509 3 588 4 275
143 286 246 39520 281 22 653 25 731 31 553
– 8 057 – 8 514 – 9 333 – 12 153– 4 185 – 4 881 – 6 200 – 7 478– 3 767 – 3 661 – 3 973 – 4 883
– 75 – 91 – 211 – 310– 1 940 – 2 698 – 2 785 – 3 074
– 18 024 – 19 845 – 22 502 – 27 8982 257 2 808 3 229 3 655– 480 – 647 – 783 – 6891 777 2 161 2 446 2 966
– – 450 –– – – 450 –
1 777 2 161 2 446 2 966
62 725 69 589 85 684 89 58428 657 38 748 44 516 53 05691 382 108 337 130 200 142 64041 876 45 866 54 072 59 6009 963 15 143 23 279 29 3003 691 3 174 4 251 6 131
13 757 19 142 18 819 19 7643 921 5 049 4 947 5 058
73 208 88 374 105 368 119 853
18 174 19 963 24 832 22 787
n/a n/a 10.9 11.9118 147 171 208
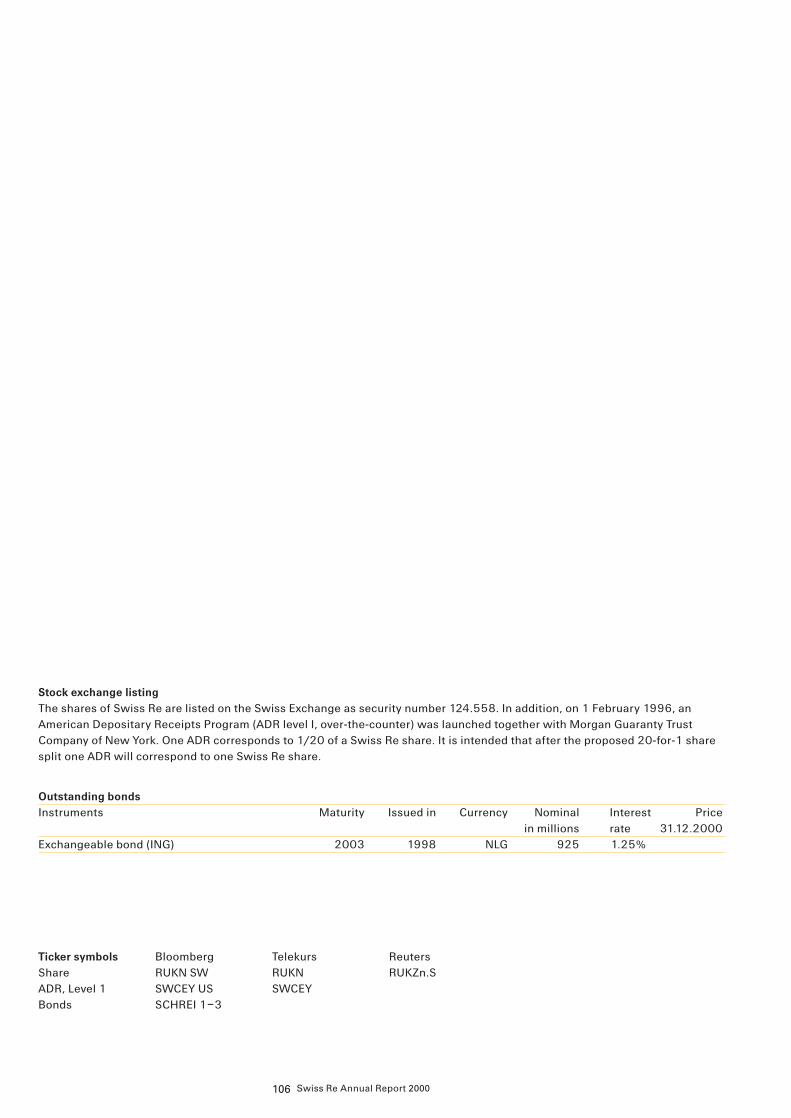
106 Swiss Re Annual Report 2000
Stock exchange listingThe shares of Swiss Re are listed on the Swiss Exchange as security number 124.558. In addition, on 1 February 1996, anAmerican Depositary Receipts Program (ADR level I, over-the-counter) was launched together with Morgan Guaranty TrustCompany of New York. One ADR corresponds to 1/20 of a Swiss Re share. It is intended that after the proposed 20-for-1 sharesplit one ADR will correspond to one Swiss Re share.
Ticker symbolsShareADR, Level 1Bonds
BloombergRUKN SWSWCEY USSCHREI 1–3
TelekursRUKNSWCEY
ReutersRUKZn.S
Outstanding bondsInstruments Maturity Issued in Currency Nominal Interest Price
in millions rate 31.12.2000Exchangeable bond (ING) 2003 1998 NLG 925 1.25%1 110.25Exchangeable bond (TRIPLES) 2004 1999 USD 530 2.25%1 102.12Straight bond 2007 1997 CHF 500 3.75%1 101.20Subordinated perpetual bond (SUPERBs) Perpetual 1999 CHF 600 3.75%* 94.00* until 2011
Key share data 1997 1998 1999 2000 20012
Number of shares issued (par value CHF 10):of which reserved for corporate purposes
Number of shares entitled to dividendDividend paid per shareNet income per share1
Equity per share1
Price per share:year-endyear highyear low
Average daily trading volumeStockmarket capitalisation3
1 per share entitled to dividend 3 based on shares entitled to dividend2 all data as of 20 April 2001 4 subject to approval by the General Meeting, not including capital repayment of CHF 8
Shareholder structure Shareholders % Shares %Number of registered shares as of 31 December 2000:
1 – 100 44 392 88.55 997 193 7.00101 – 1 000 5 074 10.12 1 456 385 10.221 001 – 5 000 495 0.99 1 019 346 7.165 001 – 10 000 72 0.14 501 110 3.52
over 10 000 99 0.20 6 061 227 42.55total 50 132 100.00 10 035 261 70.45
Number of unregistered shares 4 208 362 29.55Number of shares entitled to dividend 14 243 623 100.00
15 043 301 14 730 951 14 730 951 14 658 301 14 658 301
423 140 423 140 423 140 414 678 405 260
14 620 161 14 307 811 14 307 811 14 243 623 14 253 041
CHF 30 44 48 50 504
CHF 118 147 171 208
CHF 1 243 1 395 1 736 1 601
CHF 2 732 3 581 3 271 3 885 3 361
CHF 2 745 4 145 3 848 3 925 4 003
CHF 1 346 2 026 2 720 2 551 2 876
CHF millions 131.0 168.0 128.5 132.8 164.6
CHF millions 39 942 51 236 46 801 55 336 47 904
Swiss Re securities

107 Swiss Re Annual Report 2000
Premiums earnedCHF millions
2000 22 081
1999 18 051
1998 16 727
1997 15 862
I I I
Net incomeCHF millions
2000 2966
1999 2446
1998 2 161
1997 1 777
I I I I
Premiums, operating resultNon-Life Business GroupCHF millions
2000 11530
2164
1999 8 916
1513
I I I I
■ Premiums earned
■ Operating result
Premiums, operating resultLife & Health Business GroupCHF millions
2000 8330
1447
1999 7311
1505
I I I I
■ Premiums earned
■ Operating result
Premiums, operating resultFinancial Services Business GroupCHF millions
2000 2221
431
1999 1824
733
I I I I
■ Premiums earned
■ Operating result
Earnings per share
CHF
2000 208
1999 171
1998 147
1997 118
I I I
Chart analysis


Information
Contact addresses
Share RegisterKarl HaasTelephone +411 285 32 94Fax +411 285 34 80E-mail [email protected]
Investor RelationsStefan Senn, Andreas LeuTelephone +411 285 44 44Fax +411 285 55 55E-mail [email protected]
Public Relations/MediaJohann ThinnhofTelephone +411 285 32 81E-mail [email protected]
Stefan MüllerTelephone +41 1 285 24 81E-mail [email protected]
Fax +411 285 20 23
Important dates
31 May 2001137th Ordinary General Meeting
6 June 2001Payment of dividend
7 September 2001Interim Report
6 May 2002138th Ordinary General Meeting
French, German, Italian and Spanish trans-lations of this report are also available.
The Annual Report 2000 summary is avail-able in: English, French, German, Italian,Portuguese and Spanish.
© 2001Swiss Reinsurance CompanyZurich
TitleAnnual Report 2000
Published bySwiss Re Publishing
Editing and translationInvestor Relations, Language Services
Text harmonisationMichael KaplanProspero, Edinburgh
Concept and designCompostella & Perrot, Zurich
PhotographsClaude Stahel (cover, pages 45, 100)Neil Wilder (pages 6, 32, 37, 86)
Lithography byReprotechnik Kloten AG, Kloten
Printed byNZZ Fretz AG, Schlieren
Order no.208_01267_en
CC, 4/01, 25 000 en
Cautionary statement regarding forward-looking statements
Certain statements contained herein are statements of future expec-tations and other forward-looking statements that are based onmanagement’s current views and assumptions and involve knownand unknown risks and uncertainties that could cause actual results,performance or events to differ materially from those expressed orimplied in such statements. Actual results, performance or eventsmay differ materially from those in such statements due to, withoutlimitation, (i) general economic conditions, including in particulareconomic conditions in Swiss Re’s core markets, (ii) performance offinancial markets, (iii) the frequency and severity of insured lossevents, (iv) mortality and morbidity levels and trends, (v) interestrate levels, (vi) currency exchange rates, (vii) increasing levels ofcompetition, (viii) changes in laws and regulations, (ix) changes inthe policies of central banks and/or foreign governments, and (x)general competitive factors, in each case on a global, regionaland/or national basis.
