exploring the career aspirations of primary school
TRANSCRIPT
Exploring the career aspirations of primary school children from around the world
AUTHORS Nick Chambers, Dr Elnaz T Kashefpakdel, Jordan Rehill, Christian Percy
JANUARY 2018
January 2018
Page i
#DrawingtheFuture
About the report Report partners
This report represents the results of a collaboration between the charity Education and Employers, Tes, UCL
Institute of Education (IOE), the National Association of Head Teachers (NAHT) and the Organisation for Economic
Cooperation and Development Education and Skills(OECD).
About Education and Employers
www.educationandemployers.org
Education and Employers is a UK based charity created in 2009 which aims to provide young people with the
inspiration, motivation, knowledge, skills and opportunities they need to help them achieve their potential. It does
this though ensuring that every school and college has an effective partnership with employers, connecting
schools and colleges with volunteers from the world of work, quickly, easily and for free using innovative match-
making technology called www.inspiringthefuture.org. It also undertakes research into the effectiveness of
employer engagement in education and works with the leading national bodies representing education leaders,
business and government.
About the authors
Nick Chambers is CEO at Education and Employers. Prior to setting up the charity in 2009 Nick was Director of
Education at Business in the Community. During this time he oversaw the production of a report on school
governance on behalf of the National Council of Education Excellence. The council, chaired by the Prime Minister
considered how best to mobilise businesses and universities to work with schools and colleges. Between 2000
and 2006 he was Director of Development at St Paul’s School where he was responsible with the Governors for
reviewing and articulating the school’s vision as it approached its 500th anniversary and developing a strategic
plan to achieve this. Nick originally studied Environmental Management and then ran his own business as well as
being involved with various charities. In 1992, he obtained a PGCE and taught in an 11-16 comprehensive school
and an 11-18 grammar school. In 1997, he was appointed Development Director at the state school in Lancashire
– the first appointment of its kind in the UK where his responsibilities included employer engagement.
Jordan Rehill is Research Assistant at Education and Employers. He graduated from the University of Manchester
with a BA (Hons) degree in Modern History and Politics, focusing particularly on issues of youth homelessness.
Prior to joining Education and Employers he worked for the youth violence charity Redthread, where he assisted
in research on trends in youth violence and gang-related violence in central London. He has co-authored recent
projects on employer engagement in education with Elnaz T. Kashefpakdel and Anthony Mann including
Contemporary Transitions: Young Britons reflect on life after secondary school and college and How to make the
most of careers events with employers.
January 2018
Page ii
#DrawingtheFuture
Dr Elnaz T. Kashefpakdel is Head of Research at the Education and Employers. She is a trained quantitative analyst,
completed her PhD from the University of Bath for a study on higher education policy. Elnaz has co-authored
many works on employer engagement in education and school to work transitions including “Career Education
that works: an economic analysis using the British Cohort Study” in the Journal of Education and Work. Her
research is referenced in government documents such as Industrial Strategy and career education policy briefings.
Her work was also endorsed in national publications such as Engineering UK annual report 2017 and public media
including BBC Education and TES.
Christian Percy is a policy and strategy advisor, working primarily on education, labour market effectiveness and
social change. His clients cover a range of organisations, from the World Bank and governments through to
universities, charities and investors. He has a long-running research collaboration with Education and
Employers.
For more information about this report, contact: [email protected], Education and
Employers Research, Quantum House, 22-24 Red Lion Court, Fleet Street, London, EC4A 3EB. 020 7566 4880.
January 2018
Page iii
#DrawingtheFuture
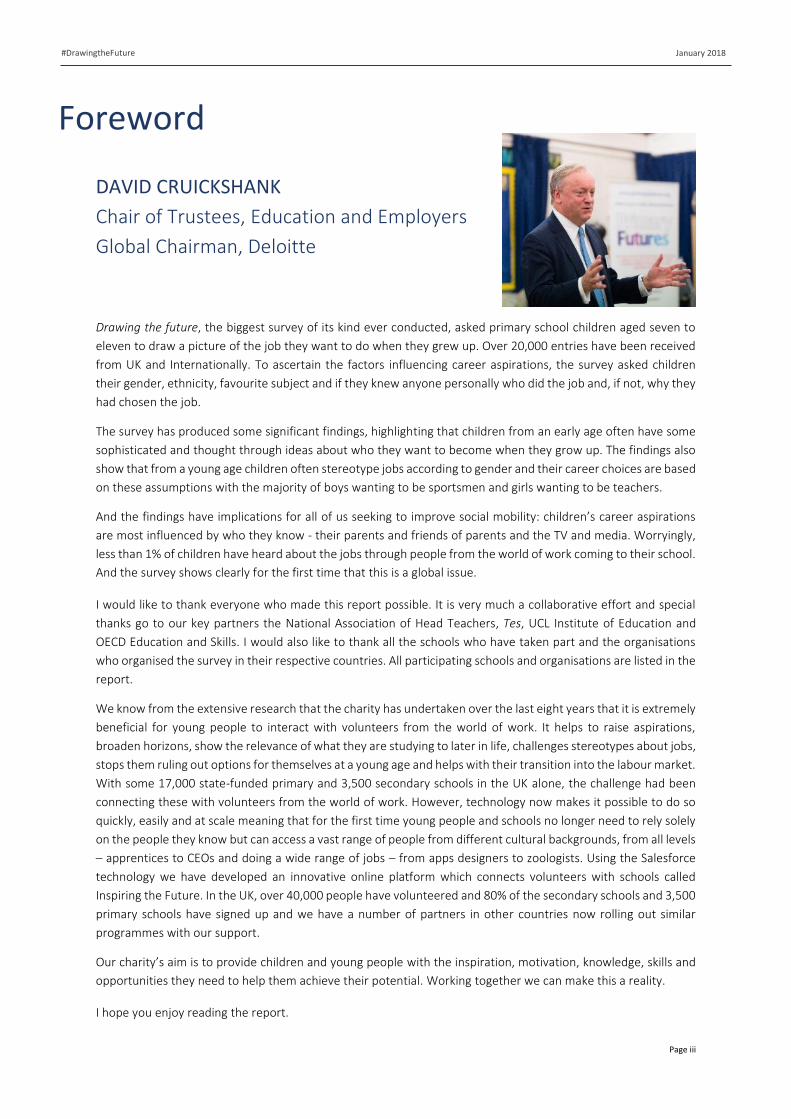
Foreword
DAVID CRUICKSHANK
Chair of Trustees, Education and Employers
Global Chairman, Deloitte
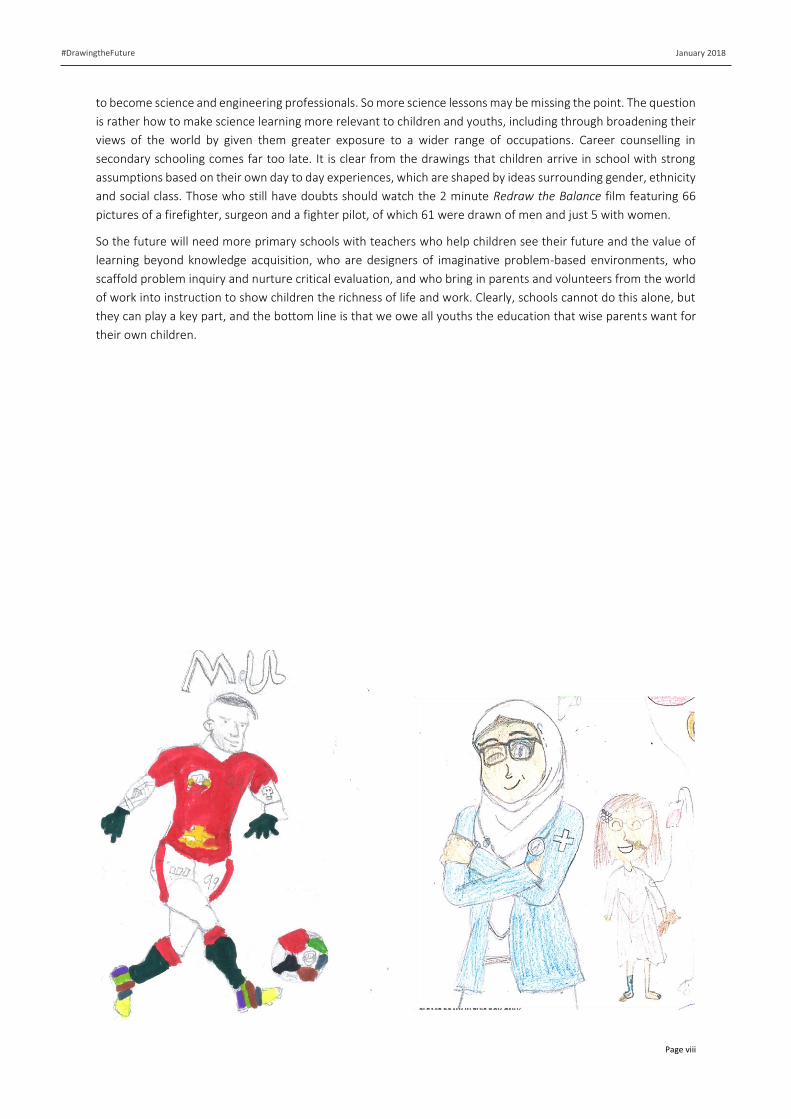
Drawing the future, the biggest survey of its kind ever conducted, asked primary school children aged seven to
eleven to draw a picture of the job they want to do when they grew up. Over 20,000 entries have been received
from UK and Internationally. To ascertain the factors influencing career aspirations, the survey asked children
their gender, ethnicity, favourite subject and if they knew anyone personally who did the job and, if not, why they
had chosen the job.
The survey has produced some significant findings, highlighting that children from an early age often have some
sophisticated and thought through ideas about who they want to become when they grow up. The findings also
show that from a young age children often stereotype jobs according to gender and their career choices are based
on these assumptions with the majority of boys wanting to be sportsmen and girls wanting to be teachers.
And the findings have implications for all of us seeking to improve social mobility: children’s career aspirations
are most influenced by who they know - their parents and friends of parents and the TV and media. Worryingly,
less than 1% of children have heard about the jobs through people from the world of work coming to their school.
And the survey shows clearly for the first time that this is a global issue.
I would like to thank everyone who made this report possible. It is very much a collaborative effort and special
thanks go to our key partners the National Association of Head Teachers, Tes, UCL Institute of Education and
OECD Education and Skills. I would also like to thank all the schools who have taken part and the organisations
who organised the survey in their respective countries. All participating schools and organisations are listed in the
report.
We know from the extensive research that the charity has undertaken over the last eight years that it is extremely
beneficial for young people to interact with volunteers from the world of work. It helps to raise aspirations,
broaden horizons, show the relevance of what they are studying to later in life, challenges stereotypes about jobs,
stops them ruling out options for themselves at a young age and helps with their transition into the labour market.
With some 17,000 state-funded primary and 3,500 secondary schools in the UK alone, the challenge had been
connecting these with volunteers from the world of work. However, technology now makes it possible to do so
quickly, easily and at scale meaning that for the first time young people and schools no longer need to rely solely
on the people they know but can access a vast range of people from different cultural backgrounds, from all levels
– apprentices to CEOs and doing a wide range of jobs – from apps designers to zoologists. Using the Salesforce
technology we have developed an innovative online platform which connects volunteers with schools called
Inspiring the Future. In the UK, over 40,000 people have volunteered and 80% of the secondary schools and 3,500
primary schools have signed up and we have a number of partners in other countries now rolling out similar
programmes with our support.
Our charity’s aim is to provide children and young people with the inspiration, motivation, knowledge, skills and
opportunities they need to help them achieve their potential. Working together we can make this a reality.
I hope you enjoy reading the report.
January 2018
Page iv
#DrawingtheFuture
Summary Only in recent years have the career aspirations which children begin to form in their primary and early years
received any serious consideration from policymakers. This is despite studies over recent decades which have all
come to the same, resounding conclusion; the perceptions children have about certain jobs and careers are
formed and sometimes cemented at a young age. These studies have emphasised that children’s aspirations are
often shaped, moulded and restricted by gender stereotyping, socio-economic background and, importantly, who
they know. These factors can, and do, go on to influence the academic effort children exert in certain lessons, the
subjects they choose to study and the jobs they end up pursuing.
This international survey offers an opportunity to explore who primary-age children ideally want to become, and,
what shapes (and often limits) their career aspirations and dreams for the future. The Drawing the Future survey
used a simple template to combine drawing alongside a number of key questions to better understand what may
be shaping the aspirations which some children hold.
Specifically, the survey asked children aged between 7 and 11-years-old to draw what they wanted to be when
they were older, and asked where they heard about that job, for instance was it through their parents or someone
they knew? Alternatively, were they influenced by other non-familial and local influences such as the internet,
television and/or social media?
UK findings:
Most popular jobs
• By a considerable margin (over 10 percentage points), the most popular job for children in the UK was either
a sportsman or sportswoman with a total of 21.3% of children drawing it as the job they would like to do when
they were older. This was followed by teacher, vet and social media and gaming.
• The outlook seems positive for STEM-related professions. In our sample, STEM-related careers ranked highly
as some of the top jobs which children aspired to become. Vet, Doctor, Scientist and Engineer (civil,
mechanical, electrical) were the 3rd, 6th, 7th and 11th most popular jobs respectively.
• A number of children in our sample also aspired to one day have a health-based job, though the percentage
share is significantly lower than either a sportsperson or teacher, with nearly 5% of young people wanting to
become Doctors and a further 2% wanting to become Nurses/Health visitors and less than 0.5% wanting to
become dentists, midwives and physiotherapists.
• There also seems to have been a shift in the aspirations of children, built largely upon new communication
methods and the growth of online and console based gaming. For more and more children and young people
online celebrities and YouTube gaming ‘vloggers’ have taken the place of TV and movie stars.
Gender stereotyping exists from the age of 7
• Across the sample, children’s aspirations appear to be shaped by gender-specific ideas about certain jobs.
Boys overwhelmingly aspire to take on roles in traditionally male dominated sectors and professions.
• Gendered patterns also emerge in STEM-related professions. Over four times the number of boys wanted to
become Engineers (civil, mechanical, electrical) compared to girls. Moreover, nearly double the number of
boys wanted to become scientists compared to girls in our sample. However, strikingly, two and half times the
number of girls wanted to become Doctors compared to boys, and nearly four times the number of girls want
to become Vets compared to boys.
• Conceptions of traditional femininity, specifically ideas around ‘nurturing’ or ‘caring’ roles, may also explain
the difference in the number of girls wanting to become a teacher or doctor compared to boys. In our sample,
January 2018
Page v
#DrawingtheFuture
nearly nine times the number of girls wanted to become Teachers compared to boys. It may also be influenced
by the teachers the children see, with the majority of primary school teachers being female.
Aspirations are influenced by social background
• Using the Free School Meal (FSM) eligibility of the pupils in a school, there is some evidence of children in less
deprived schools being relatively more likely to have aspirations in higher-earning professions. While the FSM
measure cannot accurately tell us about a child’s background and familial wealth, it does give an indication
that the school, and therefore its pupils, may live within a disadvantaged socio-economic area.
• Relative to those in higher deprivation schools, boys are more likely to choose engineer than mechanic, more
likely to choose manager than retail sales assistant, and more likely to choose lawyer than police. There is also
some evidence that certain creative professions with very high barriers to entry are more popular to boys in
less deprived schools, such as being a singer/musician, actor/actress and author. Among girls, architects,
engineers and vets are more popular in less deprived schools, whereas hairdresser, nurse, retail sales assistant
and beauty therapist are more popular in the more deprived schools.
How young people heard about the jobs they drew
• Among young people who did know someone, the analysis found that parents and other extended members
of the family (siblings, grandparents etc) were the most influential in defining children’s career aspirations.
The least influential person or people was a member of the local community.
• Among young people who did not know someone who did the job they drew, most young people indicated
that they heard about the job through TV / Film / Radio, this was followed by personal experiences or
encounters, for example visiting a doctor, seeing a train driver on the way to school.
• Less than 1% of children stated they heard about the job from a volunteer from the world of work coming in
to school.
There is a major disconnect between aspirations of children and the predicted jobs of the
future
• Similar to our report in 2013, Nothing in Common, our research finds a major disconnect between the careers
that primary-age children are most interested in and those that the economy needs.
• A similar misalignment is also evident among young people in secondary schooling, contrary to arguments
that career aspirations of children are transient, changing and should ultimately be ignored.
International findings:
• While aspirations, and the influences on these aspirations, vary by country, there are a number of global trends
which emerge from the data
• In terms of gender stereotyping and gendered career expectations, aspirations do tend to lay in stereotypical
masculine/feminine roles across the sample. One of the most popular jobs for boys across our sample is often
police and armed forces while teaching emerges as one of the most popular professions for girls.
• The trends for STEM related aspirations is largely similar. In keeping with popular theories around masculine
and feminine roles, boys in our samples have preference for working with things, for example working as an
Engineer or Scientist whereas girls seem to aspire to jobs working with people/caring professions for example
working as a teacher, nurse, doctor or vet.
• In all countries in our sample, Maths or Science is in the top two favourite subjects among children (for girls
and boys), apart from children in Australia and China.
January 2018
Page vi
#DrawingtheFuture
• The general trends suggest that in some developing countries children have more practical and high
professional ambitions (Doctor, Teacher), whereas in developed countries aspirations are often formed
around celebrity culture (e.g. Sportsperson, a career in social media and gaming).
• Parents, and other members of extended family, are often the biggest influencer if the respondent indicated
that they knew someone personally who did that job. The exception is in developing countries such as Uganda
and Zambia, where teacher is often the biggest influence. If a young person did not know someone personally
who did that job, TV/Film is the biggest influencer, again with exception of Uganda or Zambia. In all countries
in our sample, less than 1% of children state they had heard about the job from a volunteer from the world of
work coming in to school.
What can we do about it?
• A future career seems a long way off for most primary-age children. Making a connection between what they
learn in primary school and the jobs they might one day pursue is not easy, particularly for those from
challenging backgrounds, where local unemployment is high and horizons may be set low.
• Early intervention can be a very cost effective targeted way of raising children’s’ aspirations and broadening
their horizons. The evidence suggests that giving children the chance to meet volunteers from the world helps
them to see the meaning and relevance of the subjects they are studying at school work. Embedding
experiences of the real-world in learning and the school curriculum can lead to increased motivation resulting
in increased educational attainment. When they engage with children, volunteers are routinely perceived as
speaking from a vantage point of real authority: who better to testify how numeracy is used outside of the
classroom, after all than someone who earns a wage to apply it in a workplace? Volunteers from the world of
work can also play a key role in providing children with role models and tackling stereotyping around gender
and ethnicity and help ensure that children at a young age don’t start ruling out options for themselves.
Instead the aim is to show children the vast range of opportunities open to them and ensure they don’t; start
ruling out options for themselves at young age. This is at the heart of Primary Futures developed by Education
and Employers – giving primary schools access to a vast range of volunteers from the world of work.
January 2018
Page vii
#DrawingtheFuture
Notes from our partners
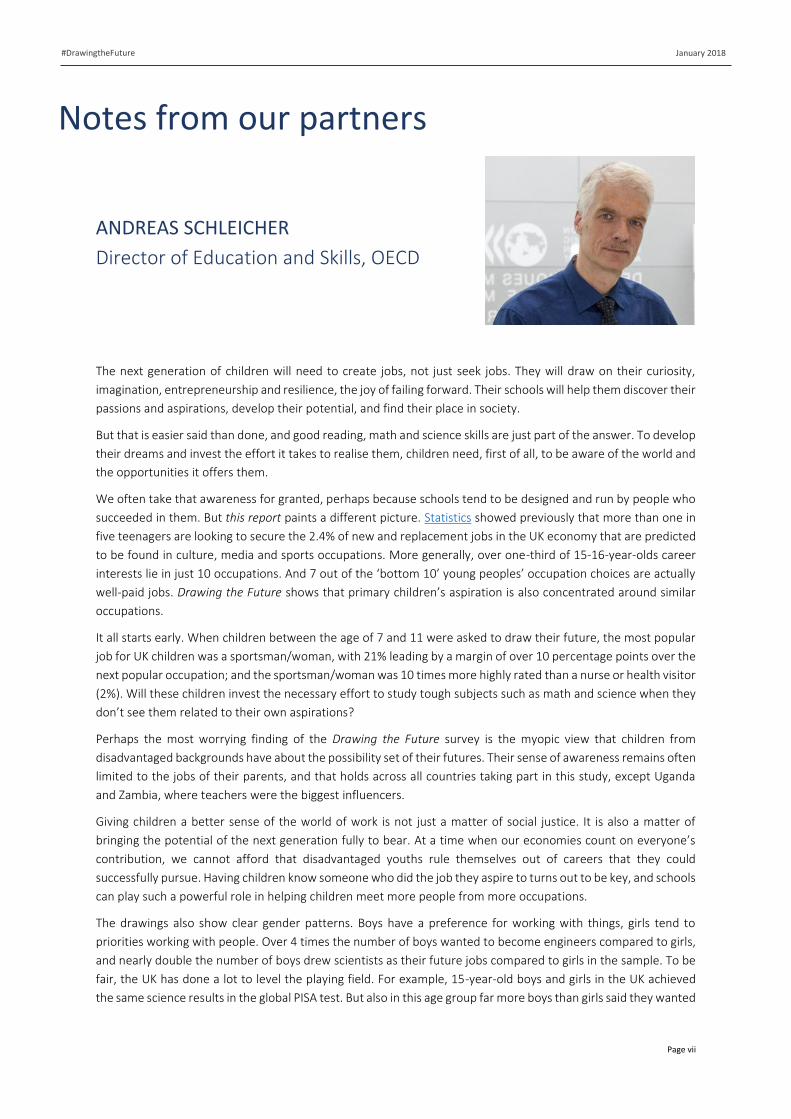
ANDREAS SCHLEICHER
Director of Education and Skills, OECD
The next generation of children will need to create jobs, not just seek jobs. They will draw on their curiosity,
imagination, entrepreneurship and resilience, the joy of failing forward. Their schools will help them discover their
passions and aspirations, develop their potential, and find their place in society.
But that is easier said than done, and good reading, math and science skills are just part of the answer. To develop
their dreams and invest the effort it takes to realise them, children need, first of all, to be aware of the world and
the opportunities it offers them.
We often take that awareness for granted, perhaps because schools tend to be designed and run by people who
succeeded in them. But this report paints a different picture. Statistics showed previously that more than one in
five teenagers are looking to secure the 2.4% of new and replacement jobs in the UK economy that are predicted
to be found in culture, media and sports occupations. More generally, over one-third of 15-16-year-olds career
interests lie in just 10 occupations. And 7 out of the ‘bottom 10’ young peoples’ occupation choices are actually
well-paid jobs. Drawing the Future shows that primary children’s aspiration is also concentrated around similar
occupations.
It all starts early. When children between the age of 7 and 11 were asked to draw their future, the most popular
job for UK children was a sportsman/woman, with 21% leading by a margin of over 10 percentage points over the
next popular occupation; and the sportsman/woman was 10 times more highly rated than a nurse or health visitor
(2%). Will these children invest the necessary effort to study tough subjects such as math and science when they
don’t see them related to their own aspirations?
Perhaps the most worrying finding of the Drawing the Future survey is the myopic view that children from
disadvantaged backgrounds have about the possibility set of their futures. Their sense of awareness remains often
limited to the jobs of their parents, and that holds across all countries taking part in this study, except Uganda
and Zambia, where teachers were the biggest influencers.
Giving children a better sense of the world of work is not just a matter of social justice. It is also a matter of
bringing the potential of the next generation fully to bear. At a time when our economies count on everyone’s
contribution, we cannot afford that disadvantaged youths rule themselves out of careers that they could
successfully pursue. Having children know someone who did the job they aspire to turns out to be key, and schools
can play such a powerful role in helping children meet more people from more occupations.
The drawings also show clear gender patterns. Boys have a preference for working with things, girls tend to
priorities working with people. Over 4 times the number of boys wanted to become engineers compared to girls,
and nearly double the number of boys drew scientists as their future jobs compared to girls in the sample. To be
fair, the UK has done a lot to level the playing field. For example, 15-year-old boys and girls in the UK achieved
the same science results in the global PISA test. But also in this age group far more boys than girls said they wanted
January 2018
Page viii
#DrawingtheFuture
to become science and engineering professionals. So more science lessons may be missing the point. The question
is rather how to make science learning more relevant to children and youths, including through broadening their
views of the world by given them greater exposure to a wider range of occupations. Career counselling in
secondary schooling comes far too late. It is clear from the drawings that children arrive in school with strong
assumptions based on their own day to day experiences, which are shaped by ideas surrounding gender, ethnicity
and social class. Those who still have doubts should watch the 2 minute Redraw the Balance film featuring 66
pictures of a firefighter, surgeon and a fighter pilot, of which 61 were drawn of men and just 5 with women.
So the future will need more primary schools with teachers who help children see their future and the value of
learning beyond knowledge acquisition, who are designers of imaginative problem-based environments, who
scaffold problem inquiry and nurture critical evaluation, and who bring in parents and volunteers from the world
of work into instruction to show children the richness of life and work. Clearly, schools cannot do this alone, but
they can play a key part, and the bottom line is that we owe all youths the education that wise parents want for
their own children.
January 2018
Page ix
#DrawingtheFuture
PROFESSOR BECKY FRANCIS
Director, UCL Institute of Education (IOE)
The world has certainly changed since the early second-wave feminist studies on children’s gendered perceptions
of occupations and working life – and indeed even since my own research on this topic, conducted over the turn
of the millennium. As my own research showed, girls’ occupational aspirations were already far higher and more
diverse than had been the case in the 1970s and ‘80s. This study demonstrates that this trend has continued in
the interim. The increased diversity and aspiration reflected in girls’ choices (and increasing diversity for boys’
choices too) is an important finding, and something we should celebrate. Nevertheless, this important report also
shows that some trends present in the early research remain stubbornly entrenched to this day. Especially, the
tendency for boys to be attracted to technical and physical occupations, and girls to be attracted to caring and
creative jobs, remains evident. These preferences (and later, choices) reflect the different life experiences
according to gender to which children are still subject, and the impact these different experiences and resources
continue to have on children’s identifications and preferences, including school and HE subject choices, and
occupational interests.
This matters, for several reasons. Economically it is desirable to see jobs allocated on merit, rather than based on
gender (or indeed, ethnicity or social class). More directly, as the report points out, some sectors face staff and
skills shortages, which are compounded by the lack of uptake by women or men respectively. And at an individual
level, such trends suggest that many people are still having their ambition and potential capped by horizons that
are narrowed by gender.
Of course, given the report focuses on personal choice, there is less attention to the important issues of
discrimination, and of workplace environments and cultures, that have been shown to deter and impede young
women – and BAME and/or white working class young people – from entering certain sectors. The issue requires
committed engagement from a range of stakeholders. In this regard, the report highlights the role of education,
and of teachers, in challenging stereotypes and widening horizons. This is important, because at present research
shows that rather than consistently challenging gender stereotypes, in some schools these are unthinkingly
exacerbated. The report also rightly calls for earlier careers interventions to be supported. While I am sceptical of
over-simplistic understandings of ‘role modelling’, my own research shows the importance for young people of
seeing that things are actually possible ‘for them’, and as such the impact of inputs from non-stereotypical
workers in different industries cannot be overstated.
You will enjoy reading this report! It provides an enormously timely and engaging update to the research on
children’s gendered occupational perceptions and aspirations. From as early as the beginning of the 1970s1,
feminist and other researchers have been using pictures in research with children on gender stereotyping – either
asking children to draw pictures, or providing pictures to children for discussion. This report applies this approach
to great effect, showing what children’s drawings reveal about their perceptions, and also providing engaging
reading. It is an important stimulation for educationalists to urgently reflect on classroom practice, and what can
be done to ensure we are broadening young people’s horizons.
1 ESchlossberg, H. & Goodman, J. (1972) A Woman’s Place: Children’s sex-stereotyping of occupations, Vocational Guidance Quarterly, 20(4), 266-270.
January 2018
Page x
#DrawingtheFuture
ANN MROZ
Editor, Tes
We become what we see around us. The picture we draw for our future selves is one of what we know. So it’s
hard to dream of being something you have never seen, or don’t know even exists.
Our children are encouraged to shoot for the stars but all the while, we glue their feet firmly to the ground. We
tell them that if only they stretched a little higher, they will reach. But how can you reach what you cannot see?
Research has shown that far too early, children learn to define jobs by gender and rule out certain subjects and
career routes. How can they fly if they are weighed down with the baggage of sexism and other people’s limited
ambitions?
I was not surprised, therefore, to see in this extensive survey that children’s career aspirations are still influenced
by gender stereotypes, but I was hugely saddened by it. In 2018, when we have our second female prime minister,
girls are far more likely to select careers traditionally seen as “women’s work”, such as hairdressing, nursing and
fashion design, while boys aspire to become mechanics, airline pilots and army officers. It only goes to show how
deeply entrenched gender norms still are, even among very young children. And it doesn’t help when even our
second female prime minister describes home life as having “boy jobs” and “girl jobs”.
However, there is a silver lining. In demonstrating the scale of the problem, Drawing the Future puts us in a great
position to finally do something about it. It is clear from the data gathered that gender stereotypes are already
embedded by the age of 7, which means we must begin tackling them before this. Careers education is not
something to save for college, or even secondary school; we must start earlier, at primary school and before.
We need to let little boys know that it’s OK to want to become nursery teachers and show little girls that flying
planes is something that they could do just as well as the boys sitting next to them. Getting a greater diversity of
role models into schools will be part of the solution, but schools themselves have a big role to play, too.
The fact that “teacher” was the second most popular job among the primary-age children who took part in this
survey is a testament to the positive experiences they have at school. Teachers are clearly important and
influential figures in their lives. They play a huge in effecting change and that’s why Tes is delighted to be involved
with this project.
We have asked children to draw the future. It’s now our responsibility to colour that picture in.
January 2018
Page xi
#DrawingtheFuture
ANNE LYONS
President, NAHT.
For far too long the notion that primary age children are too young to begin to think about their futures and future
opportunities has been an over played record. At long last there seems to be the developing understanding that
starting early might just make sense. Not in terms of primary children making career choices but more about
helping to raise children’s aspirations and to help them understand there may well be a world and opportunities
beyond the one they currently live in. As the report suggests, local circumstances and environment can influence
a child’s future ambition. Children can see the environment they live in as the norm and may have little incentive
to break the mould. Maybe they do not even know how to? How do they know what’s out there?
It is for that reason that in 2014 the NAHT were proud to become partners with Education and Employers charity
in developing Primary Futures – a simple yet successful way of inviting volunteers from all walks of the world of
work to come into school to work alongside teachers helping children to see beyond the horizon and how their
primary school learning really is of future value … not just to pass national tests!
It’s incredible to me to see that despite the best efforts of many organisations, stereotyping and particularly that
of gender seems to be as much of a challenge today as it always has been. Staggering in the 21st century! Looking
for the reasons behind this may not be time well spent. Surely instead we should all look for solutions to remedy
this going forward?
There is no doubt schools are well aware of the issues and are playing their part often in difficult circumstances.
However, I do not believe they can do it alone, particularly when faced with curriculum challenges and an ever-
changing educational landscape. This is where the valuable support from willing volunteers from all working
backgrounds comes in. From apprentices to CEOs to, all have a story to tell to enthuse and excite the children and
help to make learning relevant and bring it to life!
This report clearly shows the scale of the problem, but perhaps the solution lies in our own hands? There is little
doubt that a partnership approach between the world of work and schools can have a major impact and, as this
report suggests, should be a route we pursue together! We can’t expect children to reach for the stars if we don’t
get rid of the mist which far too often conceals them.
This report should be the catalyst for positive change. I look forward to seeing the next report in a few years’ time
demonstrating that we took these issues seriously, and, for the good of all primary children and for the future of
our country, we did something about it!
January 2018
Page xii
#DrawingtheFuture
Acknowledgements Education and Employers would like to thank the children, teachers, careers advisors and other school staff that
took part in the Drawing the Future survey, a full list of participating schools is available in the attached annex.
We would like to personally thank the staff and children at Branston Junior Academy in Lincolnshire and St
Edmund Campion School in Maidenhead for taking part in an initial pilot of the drawing survey, from which we
based the survey used throughout this report.
We would also like to thank our international partner organisations who worked tirelessly to recruit schools to
take part in the survey in their respective countries:
- Australia
Adrian Rhodes – Director, Inspiring the Future
Australia
- Austria
Heather Tinsley – Subject teacher, European
School Vienna, Austria
- Albania
Adriana Laze – Subject teacher, Shaban Sheshori
School, Tirana, Albania
- Belarus
Vladimir Glazunov – Director, Gomel Regional
Center for Testing and Vocational Guidance
of Students and Olga Sikorskaya – Teacher,
Gymnasium no.22, Minks, Republic of Belarus
- Bangladesh
Madiha Murshed – Managing Director,
Scholastica
- China
Mavis Meng Wnejing – Head of Education
Policy Projects, Cultural and Education
Section of the British Embassy, Beijing, China
- Colombia
Jose Litto Revelo Calvache – Subject teacher,
Institución Educativa Escuela Normal
Superior de Putumayo, Colombia
- Iceland
Sidse Frich Thygesen – Senior Consultant, DEA
and Hulda Björnsdóttir – Head of Department,
Salaskóli school, Iceland
- Indonesia
Dera Nugraha – School Management
Specialist, Tanoto Foundation
- Mexico
Connie Fuentes Garrido – Founder and
Director of Human Rights Awareness
- Pakistan
Abdul Waheed – JS Aitchison College, Lahore,
Pakistan and Fatima Omer – Iqbal Campus,
Pakistan
- Portugal
Maria Jose Ferreira – Agrupamento de Escolas
Dr. Francisco Sanches, Braga, Portugal
- Philippines
Danthea Bani – Subject teacher, Southville 3A
Elementary School, Calabarzon, Philippines
- Romania
Mirela Spita – Primary school teacher, Scoala
Gimnaziala, Bacau, Romania
- Russia
Marina Shtoyk – Research manager, Teach for
Russia
- Scotland
Georgia Hughes – Wood Foundation
- Serbia
Tatjana Savic – Subject teacher, Nikola
Vukicevic School, Sombor, Serbia
- Switzerland
Andrea Delannoy – President and Founder at
MOD-ELLE, Lausanne, Switzerland
- Uganda
Lynne Pritchard, Ronnie Katzler – Redearth
Education, Uganda
- Zambia
Alitili Nickson - Kayele Secondary School,
Ndola, Zambia
We would also like to thank Matteo Schleicher, Steve Iredale, Richard Barrett, Katarina Wallin Bureau, Professor Prue
Huddleston and Dr Deirdre Hughes (OBE) for their support in completing this report.
January 2018
Page xiii
#DrawingtheFuture
Contents
Background to Drawing the Future……………………………………………………………………………………………………………………………………………………………………………………….…………………………………………………………………..1
Why do children’s aspirations matter? ………………………………………………………………………………………………………………………………………………………………………………………………………………………......2
The impact of gender stereotypes on career aspirations……………………………………………………………………………………………………..………………………………………………………………….……..4
The impact of career aspirations on behaviour in school…………………………………………………………………………………………………………..……………………………………………………….…………..5
‘Nothing in Common’………………………………………………………………………………………………………………………………………………………………………………………………………………………………………………….…………………..7
The survey………………………………………………………………………………………………………………………………………………………………………………………………………………………………………………..………………………………………………….………………….9 UK data…………………………………………………………………………………………………………………………………………………………………………………………………………………………………………………………………..…………………..…………….10
International data……………………………………………………………………………………………………………………………………………………………….…………………………………………………………….…………………………………….………13
Why drawing? …………………………………………………………………………………………………………………………………………………………………………………………………………………………………………………………………………….……..13
UK findings……………………………………………………………………………………………………………………………………………………………………………………………………………………………………………………………………………………………………….….……...15
Trends in careers aspirations………………………………………………………………………………………………………………………………………………………………………………………………………………..……………………...………15
Gender stereotyping and gendered expectations…………………………………………………………………………………………………………………………………………………………………………………....………..19
Career aspirations across age groups………………………………………………………………………………………………………………………………………………………………………………………………………………………….…23
Career aspirations across the UK………………………………………………………………………………………………………………………………………………..…………………………………………………………………………..…………25
Career aspirations across ethnic group……………………………………………………………………………………………………………………………………………………………………………………………………………………..…25
Children’s favourite school subject……………………………………………………………………………………………………………………………………………………………………………………………………..…………………..………27
It’s who you know……………………………………………………………………………………………………………………………………………………………………………………………………………………………………………….……….….…………..…29
Labour market projections………………………………………………………………………………………………………………………………………………………………………………………………………………………………………………………31
International findings……………………………………………………………………………………………………………………………………………………………………………………………………………………………………………………………………………….……..…33
Larger sample sizes………………………………………………………………………………………………………………………………………………………………..……………………………………………………………………………………………...………35
Albania………………………………………………………………………………………………………………………………………………………………………………………………………………………………………………………………………………………………………35
Australia………………………………………………………………………………………………………………………………………………………………………………………………………………………………………………………………………………………………..…37
Bangladesh……………………………………………………………………………………………………………………………………………………………………………………………………………………………………………………………………………………..…….39
Belarus…………………………………………………………………………………………………………………………………………………………………………………………………………………………………………………………………………………..………………….42
China………………………………………………………………………………………………………………………………………………………………………………………………………………………………………………………………………………………….……………….44
Colombia……………………………………………………………………………………………………………………………………………………………………………………………………………………………………………………………………………………………..….47
Pakistan…………………………………………………………………………………………………………………………………………………………………………………………………………………………………………………………………………………………..…….…49
Portugal…………………………………………………………………………………………………………………………………………………………………………………………………………………………………………………………………...………………………………51
Romania………………………………………………………………………………………………………………………………………………………………………………………………………………………………………………………………………………….……………….54
Serbia………………………………………………………………………………………………………………………………………………………………………………………………………………………………………………………………………………………………………...56
Uganda……………………………………………………………………………………………………………………………………………………………………………………………………………………………………………………………….………………………………….…58
Smaller sample sizes…………………………………………………………………………………………………………………………………………………………………………………………………………………………………….…………………………….…60
Austria…………………………………………………………………………………………………………………………………………………………………………………………………………………………………………………………………………………………………….…60
Iceland…………………………………………………………………………………………………………………………………………………………………………………………………………………………………………………………..………………………………………....61
Indonesia………………………………………………………………………………………………………………………………………………………………………………………………………………………………………………………………………….…………………….63
Mexico………………………………………………………………………………………………………………………………………………………………………………………………………………………………………………………………………………………..………….…64
Philippines…………………………………………………………………………………………………………………………………………………………………………………………………………………………………………….…………………………………………..…..66
Russia…………………………………………………………………………………………………………………………………………………………………………………………………………………………………………………………..………………………………………….…67
Switzerland……………………………………………………………………………………………………………………………………………………………………………………………………………………………………………………………………………………………68
Zambia………………………………………………………………………………………………………………………………………………………………………………………………………………………………………………………………………………………………….…..69
Discussion………………………………………………………………………………………………………………………………………………………………………………………………………………………………………………………………………………………………………………..……70
It’s who you know……………………………………………………………………………………………………………………………………………………………………………………………………………………………………………………………………………73
Primary Futures…………………………………………………………………………………………………………………………………………………………………………………………………………………………………………………………………………………75
Conclusions……………………………………………………………………………………………………………………………………………………………………………………………………………………………………………………………………………………………………………….…77
References………………………………………………………………………………………………………………………………………………………………..…………………………………………………………………………………………………………………………………..…………… 80
Annex 1…………………………………………………..…………………………………………………………………………………………………………………………………………………………………………………………………………………………….……………………………..…………85
Annex 2………………………………………………………………………………………………………………………………………………………………………………………………………………………………………………………………………………………………..…………………………86
Annex 3……………………………………………………………………………………………………………………………………………………………………………………………………………………………………………………………………………………………………………………..……86
January 2018
Page 1
#DrawingtheFuture
Background to
Drawing the Future
January 2018
Page 2
#DrawingtheFuture
Are the dreams, hopes and aspirations of children important? Do they shape who and what a child can
become? The question, ‘What do you want to be when you are older?’ has been asked to children and
young people for generations with scant attention paid to the answer.
Only in recent years have the career aspirations which children begin to form in their primary and early years
received any serious consideration from policymakers. This is despite studies over recent decades all coming to
the same, resounding conclusion; the perceptions children have about certain jobs and careers are formed and
often at a young age.
This international survey offers an opportunity to explore who primary-age children ideally want to become, and,
what shapes (and often limits) their career aspirations and dreams for the future. The Drawing the Future survey
used a simple template to combine drawing alongside a number of key questions to better understand what may
be shaping the aspirations which some children hold.
Specifically, the survey asked children aged between 7 and 11-years-old to draw what they wanted to be when
they were older, and asked where they heard about that job, was it through their parents or someone they knew?
Or, were they influenced by other non-familial and local influences such as the internet, television and/or social
media?
In reviewing contemporary and historical research literature, the following sections seek to address doubts about
whether the career aspirations of children warrant attention. The literature highlights how these aspirations, often
influenced by social background and gender stereotyping, have been shown to impact the perceptions and ideas
children have about certain jobs and the pathways required to reach them.
Section two of the report then outlines the methodology and measurements used, including a short explanation
of why we chose to ask children to draw their aspirations. This is followed by a breakdown of the UK findings,
where we explore whether any patterns exist in children’s aspirations according to their gender, age and social
background. We then build on our previous work exploring the aspirations of secondary school pupils, to assess
whether the aspirations of primary-age children align in any way with the labour market demands and whether
the aspirations of children and young people become more aligned over time. Following section four, which
outlines the findings from 19 further countries, we investigate what is influencing the aspirations of children and
what can be done to broaden these aspirations, highlighting the importance of interactions with volunteers from
the world of work.
Why do children’s aspirations matter?
It has been argued that children’s ideas about the work they might do as adults are unlikely to give any indication
of what they might actually do in the future.2 Assumptions that children’s career ambitions may be transitory may
have dissuaded researchers from focusing on them in the past. Early career ideas of primary-age children can,
and should naturally be tentative and may be slightly imaginative. However, while these aspirations may not be
entirely realistic, they can be used to fruitfully investigate children’s perceptions of and ideas about adult work.3
Findings from various fields suggest that there is in fact a need to understand primary education better and start
engaging earlier. Research over the last 30 years has explored how gender interacts with early perceptions about
2 Gore, J. et al. (2016). Unpacking the career aspirations of Australian school students: towards an evidence base for university equity initiatives in schools. Higher Education Research and Development 36(7), 1383-1400. 3 Hutchings, M. (1993). ‘What will you do when you grow up?’: Some origins of primary school children’s ideas about work. London: Primary Schools and Industry Centre, University of North London.
January 2018
Page 3
#DrawingtheFuture
jobs and future roles, raising repeated concerns about children being channelled into lifelong gendered pathways
via gendered educational and occupational preferences.4 Akerlof and Kranton introduced identity and gender
identity in an economic model of behaviour analysing how it influences individuals’ economic outcomes.5 The
notion of beliefs is used in Breen and Garcia-Penalosa in order to explain the occupational segregation happening
in the labour market in ten OECD countries.6 According to these studies, men and women have different beliefs
on their probability to succeed and will choose their career path according to these beliefs, which are in turn
transmitted from one generation to the other.
The character of aspirations is also rooted in young people’s sense of what is ‘reasonable’ and ‘natural’ for ‘people
like me’ to pursue. Children come into schools with assumptions which have emerged out of their own day to day
experiences: experiences which are routinely shaped by ideas surrounding gender, ethnicity and social class.7 By
the age of eight, girls and boys routinely develop gendered ideas about jobs and careers, with long term
implications. Such “naïve early understandings have already turned them,” argue Gutman & Akerman from their
review of research literature on gender and aspiration “towards some possible futures and away from others.”8
Research has also more broadly argued that the “early years of a child’s life are a key time in [their] formation and
development”.9 The attitudes formed by children shape their later behaviour in ways of ultimate economic
importance. Looking at interest in science, for example, a King’s College London research team, led by Professor
Louise Archer, has shown that longitudinal tracking finds that students who do not express STEM related
aspirations at age 10 are unlikely to develop STEM aspirations by the age of 14. Consequently they are less likely
to pursue science subjects, achievement in which is related with higher adult earnings.10 To Archer, and to other
researchers, for instance, McMahon and Watson, the aspirations expressed by young people reflect the
complexity of their own emerging identities.11 Hughes et al undertook a detailed international literature review
on careers education and found that careers education is optimally facilitated when interventions are
personalised and targeted to individuals’ needs from an early age. 12 They indicate: “There is compelling evidence
that career learning should begin in primary school and continue through adulthood, however very few high-
quality intervention studies focused on primary pupils were identified” (p.3).
And yet, even with the growing body of evidence highlighting the significance of this period, successive policies in
the UK since 2012 have failed to adequately focus on careers work in primary schools as a key arena in which
issues of social mobility and inequality can be addressed. This is reflected in the share of spending allocated to
4 Kelly, A. (1989). “When I grow up I want to be a…”: A longitudinal study of the development of career preferences. British Journal of Guidance and Counselling 17, 179-200.; Holland, J. (1987). Girls and occupational choice: In search of meanings. Girls and occupational choice working paper No 10. London: University of London, Institute of Education; Francis, B. (1998). Power Plays: Primary School children’s constructions of gender, power and adult work, Stoke-on-Trent: Trentham Books. 5 Akerlof, G. A. and Kranton, R. E. (2000). Economics and identity. Quarterly Journal of Economics 115(3), 715-753. 6 Breen, R. and Garcia-Penalosa, C. (2002). Bayesian learning and gender segregation. Journal of Labor Economics, 20(4), 899–922. 7 Gottfredson, L. (2002) “Gottfredson’s Theory of Circumscription, Compromise and Self-Creation” in Brown, D. ed. Career Choice and Development. San Francisco: Jossey-Bass; Archer, L., DeWitt, J., Osborne, J., Dillon, J., Willis, B. and Wong, B. (2010). “’Doing’ Science versus ‘Being’ a Scientist: Examining 10/11-Year-Old Schoolchildren’s Constructions of Science through the Lens of Identity” Science Education 94: 617-639; Skelton, C., Francis, B. & Valkanova, Y. (2007) Breaking Down the Stereotypes: gender and achievement in schools (Manchester: Equal Opportunities Commission); 8 Gutman, L. M. and Akerman, R. (2008). Determinants of Aspirations. London: Institute of Education Centre for Research on the Wider Benefits of Learning 9 Gutman, L. M. and Akerman, R. (2008). Determinants of Aspirations. 8. 10 Archer, L., Osbourne, J., DeWitt, J., Dillon, J. and Wong, B. (2013). ASPIRES: Young People’s science and career aspirations, age 10-14. London: King’s College 11 Watson, M. and McMahon, M. (2005) ‘Children’s Career Development: A research review from a learning perspective’, Journal of Vocational Behavior, 67, 119–132. 12 Hughes, D., Mann, A., Barnes, S-A., Baldauf, B., and Mc Keown, R. (2016) An International Literature Review: Careers Education, on behalf of the Education Endowment Foundation (EEF), London.
January 2018
Page 4
#DrawingtheFuture
primary education compared to secondary. According to recent data from the Institute for Fiscal Studies, the UK
government spends around a third more per pupil on secondary education compared to primary.13
Moreover, recent reports and speeches on social mobility have, until very recently, seldom mentioned primary
schools. The UK Coalition Government’s Opening doors, breaking barriers: a strategy for social mobility (2011) and
then more recent reports including those by the House of Lords Select Committee (2016) and the Social Mobility
Commission (2017) for example make little reference to the vital role that primary schools play in raising
aspiration, broadening horizons and connecting children’s learning to their future lives. Policy does, however,
seem to be slightly shifting towards a greater focus on earlier careers interventions. For example in December
2017 the Department for Education published its Careers Strategy in England, which emphasised the importance
of early primary years interventions and recommends that schools should begin to raise aspirations and challenge
stereotypes about the people who do different jobs.14 If we are to improve social mobility, and gender and ethnic
equality, in both the UK and internationally, particular emphasis needs to be placed on addressing the perceptions
children hold about certain jobs and opportunities while they are still at primary school.
The impact of gender stereotypes on career aspirations
Despite the fact that women today are employed in greater numbers and in a wider range of roles and occupations
than ever before, children still tend to think of particular careers as ‘male’ or ‘female’. This conscious and
unconscious classification system, which starts at an early age, means young men and young women often rule
themselves out of careers that they might otherwise successfully pursue. 15 It also means that industries and
employers do not benefit from all the talent that is potentially available to them. 16
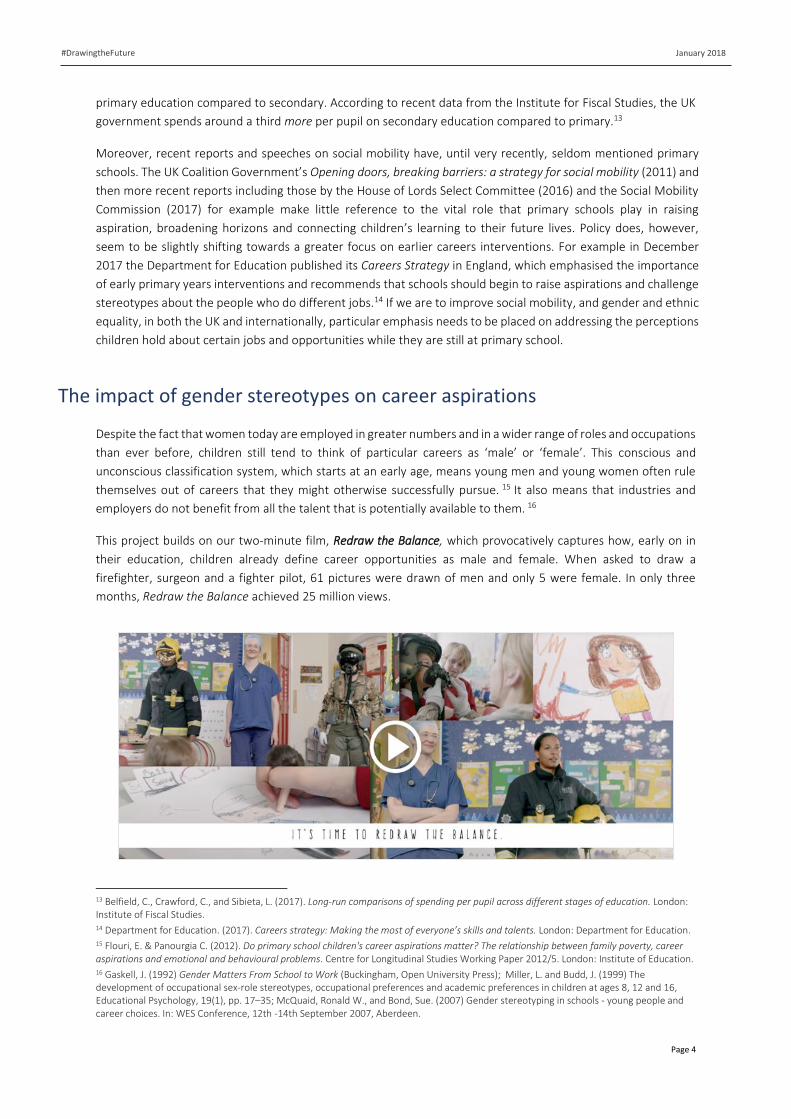
This project builds on our two-minute film, Redraw the Balance, which provocatively captures how, early on in
their education, children already define career opportunities as male and female. When asked to draw a
firefighter, surgeon and a fighter pilot, 61 pictures were drawn of men and only 5 were female. In only three
months, Redraw the Balance achieved 25 million views.
13 Belfield, C., Crawford, C., and Sibieta, L. (2017). Long-run comparisons of spending per pupil across different stages of education. London: Institute of Fiscal Studies. 14 Department for Education. (2017). Careers strategy: Making the most of everyone’s skills and talents. London: Department for Education. 15 Flouri, E. & Panourgia C. (2012). Do primary school children's career aspirations matter? The relationship between family poverty, career aspirations and emotional and behavioural problems. Centre for Longitudinal Studies Working Paper 2012/5. London: Institute of Education. 16 Gaskell, J. (1992) Gender Matters From School to Work (Buckingham, Open University Press); Miller, L. and Budd, J. (1999) The development of occupational sex-role stereotypes, occupational preferences and academic preferences in children at ages 8, 12 and 16, Educational Psychology, 19(1), pp. 17–35; McQuaid, Ronald W., and Bond, Sue. (2007) Gender stereotyping in schools - young people and career choices. In: WES Conference, 12th -14th September 2007, Aberdeen.
January 2018
Page 5
#DrawingtheFuture
These findings worryingly reiterate findings from research in previous decades. And recent analysis published in
2017 by KidZania reiterates this notion that gender bias in the talent pipeline does indeed start early. KidZania is
a child-sized city where visitors from the age of four to 14 choose realistic jobs and activities which they have an
interest. Their research tracked which jobs and activities 61,000 children who attended their London branch
would like to take part. The data exposes a predictable gender split, boys opted for engineering and sports
coaching while girls selected roles such as beautician or runway model. The same research found that the choices
made at 14-years-old by both genders were strikingly similar to those made by four-year-olds.17
The UK-based ASPIRES project also sheds new light on the understanding of how children’s aspirations develop
over the 10-14 age period, exploring in particular what influences the likelihood of a young person aspiring to a
science-related career. Drawing upon almost 19,000 surveys as well as a sample of longitudinal interviews the
data gives an important insight into what may be preventing certain children from taking up science subjects while
at school. The data highlights that girls are far more likely to aspire to arts-related and ‘caring’ careers. Among
12-13-year-old students, 18% of boys and 12% of girls aspire to become scientists – in comparison, 64%of girls
aspire to careers in the arts. Girls who define themselves as ‘girly’ (highly feminine) are particularly unlikely to
aspire to a career in science. Girls who do aspire to science and STEM-related careers tend to be highly academic
and are more likely to describe themselves as ‘not girly’. Those ‘girly’ girls who do aspire to science careers at age
10/11 tend to either drop or change these aspirations over time.9 According to this evidence, traditional or
conventional ideas about jobs are cemented at a in a child’s mind at a young age and prevail well into their teenage
years.
The impact of career aspirations on behaviour in school
Research has shown that children’s aspirations may also be used to demonstrate how a child’s ideas about a
particular career or job can have a profound impact on the academic effort a young person exerts. Researchers
working on the ASPIRES project noted that science related careers are routinely seen as ‘only for a the brainy
few’. Due to the association of ‘cleverness’ with white middle-class masculinity18, and the close association
between science and ‘braininess’, the authors suggest that female, working-class and some minority ethnic
students may be less likely to imagine themselves following science careers – even though they like science and
aspire highly.9
Another study, published by the academic journal Science, showed that gender stereotypes about intellectual
brilliance or ‘smartness’ also begin early. The research tested 400 children in the US from a range of backgrounds
and revealed that, while girls were more likely to associate their gender with getting good grades and working
hard, they did not appear to link this to their own intellectual abilities. The research found that by the age of 6,
girls were less likely than boys to believe members of their gender are “really really smart”. In fact, 6 and 7-year-
olds girls avoided participating in activities that were labelled for children who are “really really smart”.19
Moreover, the ambitions which children identify have also been shown to give a good indication of how a young
person acts and behaves while at school. Drawing on UK longitudinal data, Flouri and Panourgia found that
primary school children with higher career aspirations were less likely to have behavioural or emotional problems
17 Graus, G. (Forthcoming). “Children can only aspire to what they know exists.” Making role-play real play: Building a creative approach to social mobility. KidZania and Havas Helia. 18 Francis., Archer, A., Moote, J., DeWitt, J., Yeomans, L. & MacLeod, E. (2016) Perceptions of Gender Issues in Access to Physics: The Construction of Physics as a Quintessentially Masculine Subject, Sex Roles. Volume 76, Issue 3–4, pp 156–174 http://link.springer.com/article/10.1007/s11199-016-0669-z 19 Bian, L., Leslie, S-J., and Cimpian, A. (2017). Gender stereotypes about intellectual ability emerge early and influence children’s interests. Science 355 (6323), 389-391.
January 2018
Page 6
#DrawingtheFuture
while at school.20 After controlling for socio-economic background and prior attainment the authors argue that
early aspirations, may, therefore, be a very good proxy for self-perceptions regarding academic competence.
Huber et al.21 examine the impact of a five-day entrepreneurship education programme on primary school age
Dutch participants. A total of 2,751 pupils were randomly allocated to control and intervention groups by class.
The study found significant positive impact on the non-cognitive entrepreneurial skills of pupils (for example, risk-
taking, creativity, self-efficacy).
Despite the fact that stereotypes form large parts of the debate when gender issues are addressed, the difficulty
associated with their measurement may explain the limited literature investigating just how far they impact young
people’s lives. A 2017 study by researchers at Aix-Marseille University sought to do just that, the study used PISA
data to quantify the existence and impact of gender stereotypes at school. Though the study assesses slightly
older pupils (15-years-old) the findings remain relevant for primary-age learners, highlighting how self-
perceptions and gender-orientated expectations of others influence children’s perceptions of their abilities.22 The
authors remove any other type of stereotype threat by controlling for numerous variables such as;
• family background, among which we can find information on the immigration status,
• the wealth or cultural possession of the family
• the behaviour in mathematics is also reported (homework completed on time, paying 11 attention in
class, and so on).
The 2012 wave of PISA in mathematics provides a large set of variables concerning mathematics. Several
questions are asked to students about their level of confidence in solving mathematical related exercises. The
level of confidence exhibited by boys was substantially higher than that of girls, who feels “very confident” more
than girls.19 It could be argued that this difference is driven by the gap in boys’ and girls’ mathematical abilities: If
boys exhibit higher level of self-confidence it might be due to the fact that boys are better at mathematics. The
authors refute this argument and in a second step, compute the distance between self-assessed abilities and real
ones by subtracting PISA scores, which estimates students mathematical proficiencies to their estimated index of
self-confidence. The distance is significantly different between both genders in favour of men who have a
tendency to overestimate their mathematical abilities. By controlling for characteristics and mathematical
capabilities, the authors argue that this difference in self-confidence can be attributed to stereotypes and gender-
oriented-expectations.19
In another study by the OECD, the authors highlight that girls perform less well in PISA mathematics tests than
boys and tend to report lower levels of self-confidence in their mathematical ability and higher levels of anxiety
towards mathematics. However, this gender gap in performance disappears when girls have similar levels of self-
confidence in, and anxiety towards, mathematics as boys, which suggests a clear need to build girls’ self-
confidence in mathematics and more generally.23
Recent survey data seems to corroborate these findings. In a survey of more than 1,900 girls and young women
between the ages of seven and 21, conducted by the charity Girlguiding, it was revealed that over half – 51% - of
girls interviewed between the age of seven and 10 said that gender stereotypes affected how much they
participated in lessons.24 Given the work by researchers at ASPIRES and other leading researchers, it is likely that
not only are these early impressions of careers are highly gendered and influenced by social class, they also appear
to be hard to shift over time.
20 Flouri, E. & Panourgia C. (2012). Do primary school children's career aspirations matter? The relationship between family poverty, career aspirations and emotional and behavioural problems. 21 Huber, L., Sloof, R., and Van Praag, M. (2012). The effect of early entrepreneurship education: Evidence from a randomized field experiment. European Economic Review, 72, 76-97 In Hughes, D., Mann, A., Barnes, S-A., Baldauf, B., and Mc Keown, R. (2016) An International Literature Review: Careers Education. London: Education Endowment Foundation, 80. 22 Benzidia, M. (2017). If I were a boy: Gender stereotypes at school. Marseille: Aix-Marseille University 23 OECD. (2015). The ABC of Gender Equality in Education: Aptitude, Behaviour, Confidence. OECD: Paris. 24 Girlguiding. (2017). Girls Attitudes Survey. London: Girlguiding
January 2018
Page 7
#DrawingtheFuture
‘Nothing in Common’
Concerned by the importance of children’s career aspirations, Education and Employers decided to adapt one of
our previous research methodologies for secondary school pupils to primary-age children. We looked to build on
the concepts used in a 2013 report Nothing in Common: The career aspirations of young Britons mapped against
projected labour market demand (2010-2020) by Education and Employers in collaboration with the UK
Commission for Employment and Skills (UKCES) and B-Live. The report asked a simple question: is there any
alignment between the career aspirations of young people, aged between 15 and 16, and the best estimates of
actual demand within the current and future workforce?
Results from the data provided a picture of employment prospects (relating to some 13.5 million jobs in all) by
industry, occupation, qualification level, gender and employment status for the UK up to 2020. Launched by Sir
Martin Sorrell, the report assessed whether the individual decisions of teenagers aggregate into an overall picture
that reflects realistic opportunities in the world of work now and in the future.
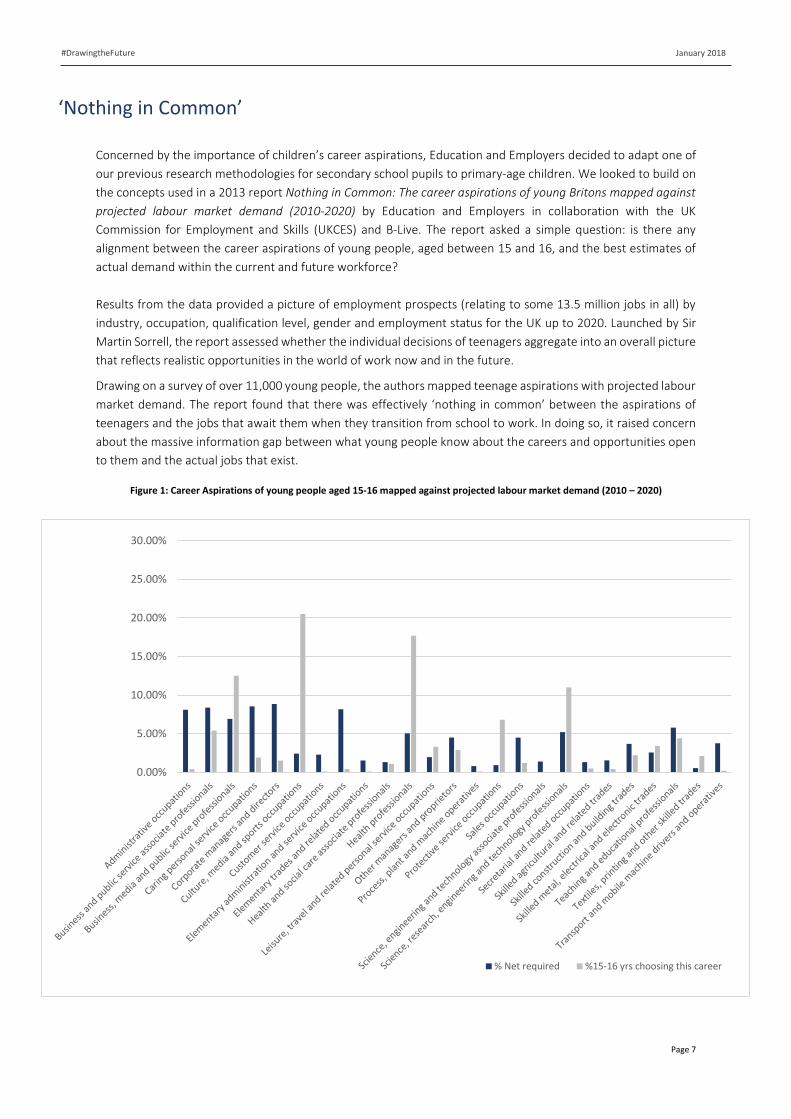
Drawing on a survey of over 11,000 young people, the authors mapped teenage aspirations with projected labour
market demand. The report found that there was effectively ‘nothing in common’ between the aspirations of
teenagers and the jobs that await them when they transition from school to work. In doing so, it raised concern
about the massive information gap between what young people know about the careers and opportunities open
to them and the actual jobs that exist.
Figure 1: Career Aspirations of young people aged 15-16 mapped against projected labour market demand (2010 – 2020)
0.00%
5.00%
10.00%
15.00%
20.00%
25.00%
30.00%
% Net required %15-16 yrs choosing this career
January 2018
Page 8
#DrawingtheFuture
More than a fifth (21%) of teenagers aged 15-16 may be competing to secure the 2.4% of new and replacement
jobs in the UK economy that are predicted to be found in Culture, Media and Sports occupations. Similarly, over
one-third of 15-16 year olds career interests lie in just 10 occupations. The statistics show that 7 out of the ‘bottom
10’ young peoples’ occupation choices are actually well-paid jobs (earning above the median UK salary in 2012 of
£21,473). Occupations such as Personnel/HR, Surveyor and Speech Therapist feature in this ‘bottom 10’ offering
annual salaries more than the UK’s then median average salary (£21,473).25 This "misalignment" could mean long-
term problems for young people, the report says, because they are making decisions about qualifications and
subjects with little awareness of the jobs market ahead of them.
The Drawing the Future survey seeks to build on these findings. As the research highlights, ideas about certain
careers which young people have as children are often carried into their teenage, decision making years. If future
skills shortages are to be filled, it may be worth exploring a hitherto untested route: helping primary-age children
understand a range of non-stereotypical roles alongside sectors and occupations which may not be ‘fashionable’
with young people, but will be prominent in the future. That is not to say that children should choose careers at
primary, or indeed be encouraged to do so. Rather, they need to see the opportunities the world presents, the
relevance of subjects they are studying, and therefore be motivated to learn keep as many options open, for as
long as possible. Later on in the report, the career aspirations children outlined for this report have been mapped
against projected labour market demand to see if any misalignment exists.
25 Mann, A., Massey, D., Glover, P., Kashefpakdel, E.T., and Dawkins, J. (2013) Nothing in Common: The career aspirations of young Britons mapped against projected labour market demand (2010-2020)
January 2018
Page 9
#DrawingtheFuture
The survey
January 2018
Page 10
#DrawingtheFuture
UK data
This report draws on the responses of 13,070 primary school children from the United Kingdom and Channel
Islands. From September to December 2017 children aged 7 to 11 from 146 primary schools were asked to draw
a picture of what they wanted to do when they were older. A small number of responses (~0.5%) were excluded
as it was not possible to identify the school of the respondent or they recorded an age below 7. Of the 13,070
respondents, 11,786 (90.2%) children drew a picture indicating their dream career whilst the remaining 1,284
(9.8%) either did not draw a job, or drew a job that was not identifiable within our category of careers.
Respondents were also asked to write in a free text box which career or job they wanted to be when they grew
up. The research team then coded these jobs according to the list of 69 occupations given to young people
responding to the 2013 Nothing in Common report, these occupations were drawn from UKCES occupation data
and the Standard Occupation Classification (SOC) codes used by the UK Government..
Respondents were then asked to record their age, gender, favourite school subject and ethnicity. In each primary
school, a member of teaching staff was asked to note down what region of the country they were in and the
percentage of their students that were eligible for Free School Meals (FSM).26 This information allowed us to
explore the influence of a student’s gender, who they know or the socio-economic neighbourhood of their school
on what they want to be when they grow up. Finally, the survey asked whether the child knew anyone who did
the job they wanted to do when they were older (e.g. family member, friend, teacher), and, if not, how did they
hear about the job (e.g. through television, social media, books).
The sample contains an equal mix of ages, with a slightly larger share of participating children coming from the
upper age ranges. In terms of gender, the sample is split broadly in line with current Department for Education
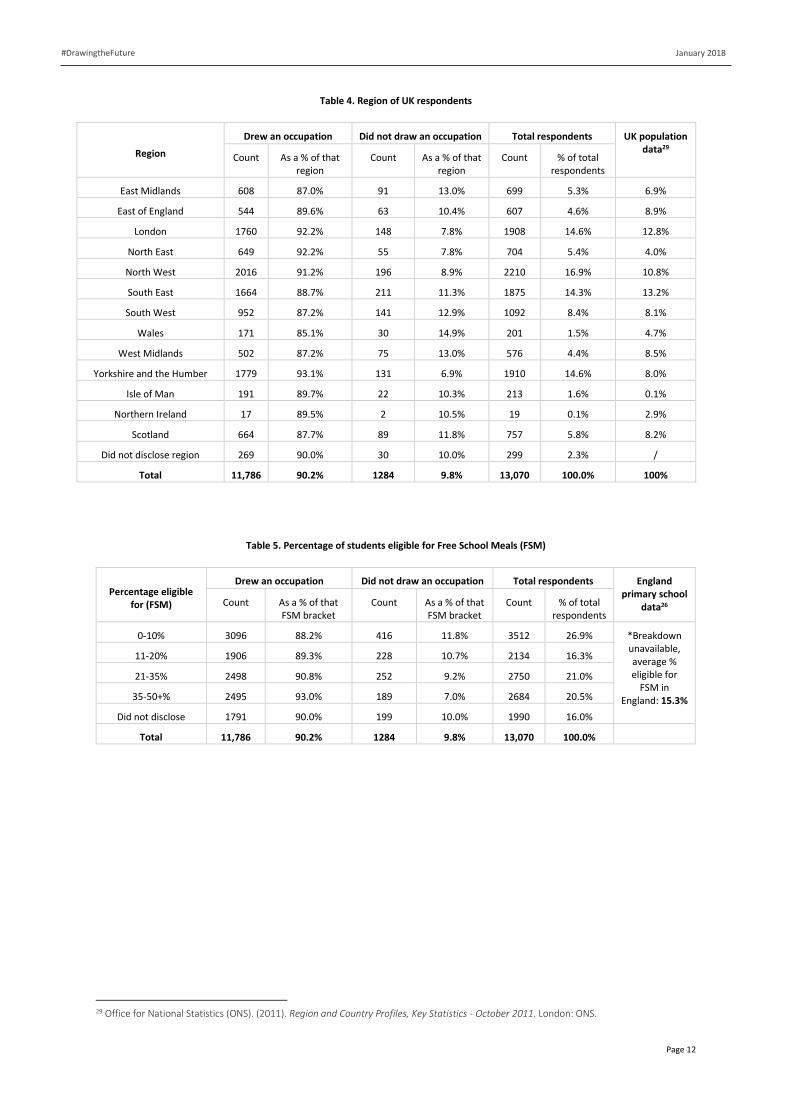
school and pupil statistics in England. Again, the regional breakdown shows a good mixture apart from Northern
Ireland, where only one school of 19 students took part. Relative to population distribution data, the North West
and Yorkshire and the Humber are most over-represented, while Scotland and Wales are most under-
represented.27 The sample is predominantly made up of non-selective state primary schools, while independent
or fee-paying schools make up just over 1% of the sample. As a result, our sample slightly under represents
independent schools according to current Department for Education and Independent Schools Council data,
which estimates that independent primary schools make up roughly 3% of the total primary schools in the
England.28
26 To gather this information children were asked to tick boxes on the bottom part of survey. In our instructions to teachers we asked that they provide support for the children in answering the more difficult demographic questions, particularly ethnicity. 27 Department for Education. (2017). Schools, pupils and their characteristics. London: Department for Education 28 Department for Education. (2017). Schools, pupils and their characteristics. London: Department for Education; Independent Schools Council. (2017). Independent Schools Council: 2016/17 key figures. London: Independent Schools Council
January 2018
Page 11
#DrawingtheFuture
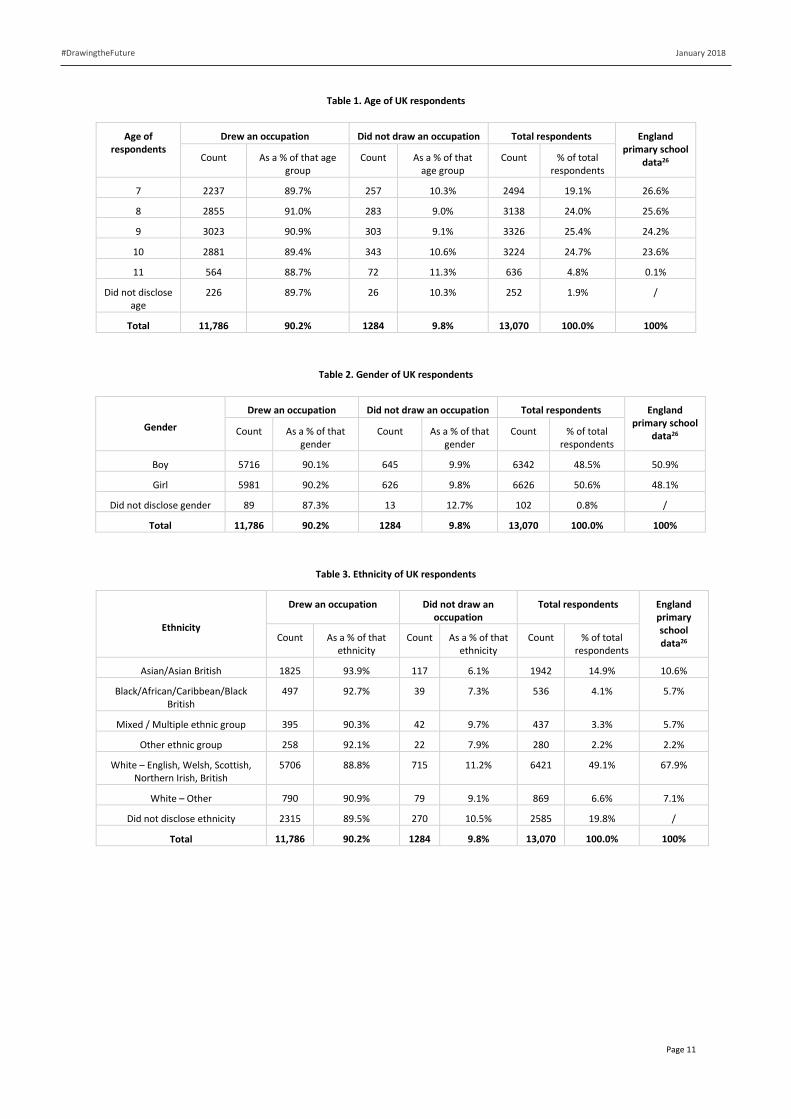
Table 1. Age of UK respondents
Age of respondents
Drew an occupation Did not draw an occupation Total respondents England primary school
data26 Count As a % of that age group
Count As a % of that age group
Count % of total respondents
7 2237 89.7% 257 10.3% 2494 19.1% 26.6%
8 2855 91.0% 283 9.0% 3138 24.0% 25.6%
9 3023 90.9% 303 9.1% 3326 25.4% 24.2%
10 2881 89.4% 343 10.6% 3224 24.7% 23.6%
11 564 88.7% 72 11.3% 636 4.8% 0.1%
Did not disclose age
226 89.7% 26 10.3% 252 1.9% /
Total 11,786 90.2% 1284 9.8% 13,070 100.0% 100%
Table 2. Gender of UK respondents
Gender
Drew an occupation Did not draw an occupation Total respondents England primary school
data26 Count As a % of that gender
Count As a % of that gender
Count % of total respondents
Boy 5716 90.1% 645 9.9% 6342 48.5% 50.9%
Girl 5981 90.2% 626 9.8% 6626 50.6% 48.1%
Did not disclose gender 89 87.3% 13 12.7% 102 0.8% /
Total 11,786 90.2% 1284 9.8% 13,070 100.0% 100%
Table 3. Ethnicity of UK respondents
Ethnicity
Drew an occupation Did not draw an occupation
Total respondents England primary school data26 Count As a % of that
ethnicity Count As a % of that
ethnicity Count % of total
respondents
Asian/Asian British 1825 93.9% 117 6.1% 1942 14.9% 10.6%
Black/African/Caribbean/Black British
497 92.7% 39 7.3% 536 4.1% 5.7%
Mixed / Multiple ethnic group 395 90.3% 42 9.7% 437 3.3% 5.7%
Other ethnic group 258 92.1% 22 7.9% 280 2.2% 2.2%
White – English, Welsh, Scottish, Northern Irish, British
5706 88.8% 715 11.2% 6421 49.1% 67.9%
White – Other 790 90.9% 79 9.1% 869 6.6% 7.1%
Did not disclose ethnicity 2315 89.5% 270 10.5% 2585 19.8% /
Total 11,786 90.2% 1284 9.8% 13,070 100.0% 100%
January 2018
Page 12
#DrawingtheFuture
Table 4. Region of UK respondents
Region
Drew an occupation Did not draw an occupation Total respondents UK population data29
Count As a % of that region
Count As a % of that region
Count % of total respondents
East Midlands 608 87.0% 91 13.0% 699 5.3% 6.9%
East of England 544 89.6% 63 10.4% 607 4.6% 8.9%
London 1760 92.2% 148 7.8% 1908 14.6% 12.8%
North East 649 92.2% 55 7.8% 704 5.4% 4.0%
North West 2016 91.2% 196 8.9% 2210 16.9% 10.8%
South East 1664 88.7% 211 11.3% 1875 14.3% 13.2%
South West 952 87.2% 141 12.9% 1092 8.4% 8.1%
Wales 171 85.1% 30 14.9% 201 1.5% 4.7%
West Midlands 502 87.2% 75 13.0% 576 4.4% 8.5%
Yorkshire and the Humber 1779 93.1% 131 6.9% 1910 14.6% 8.0%
Isle of Man 191 89.7% 22 10.3% 213 1.6% 0.1%
Northern Ireland 17 89.5% 2 10.5% 19 0.1% 2.9%
Scotland 664 87.7% 89 11.8% 757 5.8% 8.2%
Did not disclose region 269 90.0% 30 10.0% 299 2.3% /
Total 11,786 90.2% 1284 9.8% 13,070 100.0% 100%
Table 5. Percentage of students eligible for Free School Meals (FSM)
Percentage eligible for (FSM)
Drew an occupation Did not draw an occupation Total respondents England primary school
data26 Count As a % of that FSM bracket
Count As a % of that FSM bracket
Count % of total respondents
0-10% 3096 88.2% 416 11.8% 3512 26.9% *Breakdown unavailable, average % eligible for
FSM in England: 15.3%
11-20% 1906 89.3% 228 10.7% 2134 16.3%
21-35% 2498 90.8% 252 9.2% 2750 21.0%
35-50+% 2495 93.0% 189 7.0% 2684 20.5%
Did not disclose 1791 90.0% 199 10.0% 1990 16.0%
Total 11,786 90.2% 1284 9.8% 13,070 100.0%
29 Office for National Statistics (ONS). (2011). Region and Country Profiles, Key Statistics - October 2011. London: ONS.
January 2018
Page 13
#DrawingtheFuture
International data
The report also includes the responses of just under 7,000 children from 19 countries outside of the United
Kingdom. These are:
Albania
Australia
Austria
Bangladesh
Belarus
China
Colombia
Iceland
Indonesia
Mexico
Pakistan
Philippines
Portugal
Romania
Russia
Serbia
Switzerland
Uganda
Zambia
The survey was advertised to schools in the UK by the Tes and the NAHT and to schools and education
organisations around the world primarily via the OECD and interested organisations were provided details on how
to participate. Therefore, the schools and the range of countries included in this report, though diverse, is
ultimately self-selected, rather than representative. As a result, the sample is noticeably lacking in countries from
the MENA (Middle East and North Africa) as well as countries that are regarded by the OECD as having particularly
effective education systems such as Finland, Norway and Singapore. Any follow up study or investigation could
potentially look to involve these and other countries.
It is important to note that the international findings included in this report are based on a small sample (in most
countries around 500 children, though in certain countries the number is lower) and they therefore should not
be seen as being representative of children’s aspirations in each participating country. As such, the data offers a
glimpse of the career aspirations children have, but cannot replace a detailed analysis of the career aspirations in
each country. We hope that some countries may be inspired by this work to run larger studies to better
understand their own population and to take part in any subsequent international survey.
The international version of the survey asks respondents and their teachers largely identical background questions
to those participating in the United Kingdom. The only difference being that the children were asked which
language they spoke at home and at school, while teachers in non-UK schools were asked to describe their
location as urban, rural or remote. In each participating country, an organising party or body was responsible for
finding a number of schools to take part in the survey. Therefore, the data for each country is based, where
possible, on the responses of children from multiple schools.
Why drawing?
One question remains, why use drawing? Why ask children to draw, rather than write their aspirations on a survey
or answer questions from an interviewer? Psychological research and academic studies shed light on the
advantages of using illustrations and provide a strong methodological basis for using them to survey primary-age
children. Butler et al explore whether drawing helps children remember more after a particular event.30 In this
study the researchers staged two ‘memory events’ and asked children in a drawing group and an interview group
to recall what they remembered. Their analysis suggests that drawing allows children to describe what would
seem to be routine aspects of an event. In essence, they suggest that drawing allows children to ‘tell a better
30 Butler, S, Gross, J and Hayne, H. (1995). The effect of drawing on memory performance in young children. Developmental Psychology, 31(4): 597–608
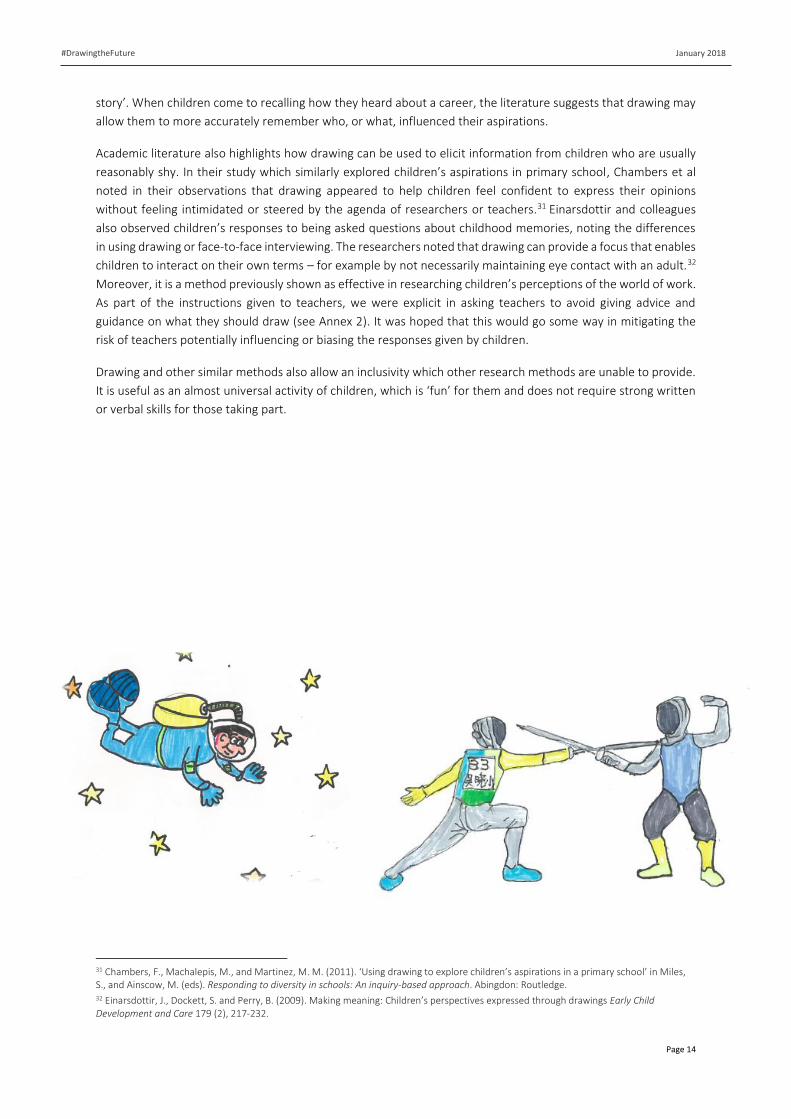
January 2018
Page 14
#DrawingtheFuture
story’. When children come to recalling how they heard about a career, the literature suggests that drawing may
allow them to more accurately remember who, or what, influenced their aspirations.
Academic literature also highlights how drawing can be used to elicit information from children who are usually
reasonably shy. In their study which similarly explored children’s aspirations in primary school, Chambers et al
noted in their observations that drawing appeared to help children feel confident to express their opinions
without feeling intimidated or steered by the agenda of researchers or teachers.31 Einarsdottir and colleagues
also observed children’s responses to being asked questions about childhood memories, noting the differences
in using drawing or face-to-face interviewing. The researchers noted that drawing can provide a focus that enables
children to interact on their own terms – for example by not necessarily maintaining eye contact with an adult.32
Moreover, it is a method previously shown as effective in researching children’s perceptions of the world of work.
As part of the instructions given to teachers, we were explicit in asking teachers to avoid giving advice and
guidance on what they should draw (see Annex 2). It was hoped that this would go some way in mitigating the
risk of teachers potentially influencing or biasing the responses given by children.
Drawing and other similar methods also allow an inclusivity which other research methods are unable to provide.
It is useful as an almost universal activity of children, which is ‘fun’ for them and does not require strong written
or verbal skills for those taking part.
31 Chambers, F., Machalepis, M., and Martinez, M. M. (2011). ‘Using drawing to explore children’s aspirations in a primary school’ in Miles, S., and Ainscow, M. (eds). Responding to diversity in schools: An inquiry-based approach. Abingdon: Routledge. 32 Einarsdottir, J., Dockett, S. and Perry, B. (2009). Making meaning: Children’s perspectives expressed through drawings Early Child Development and Care 179 (2), 217-232.
January 2018
Page 15
#DrawingtheFuture
UK findings
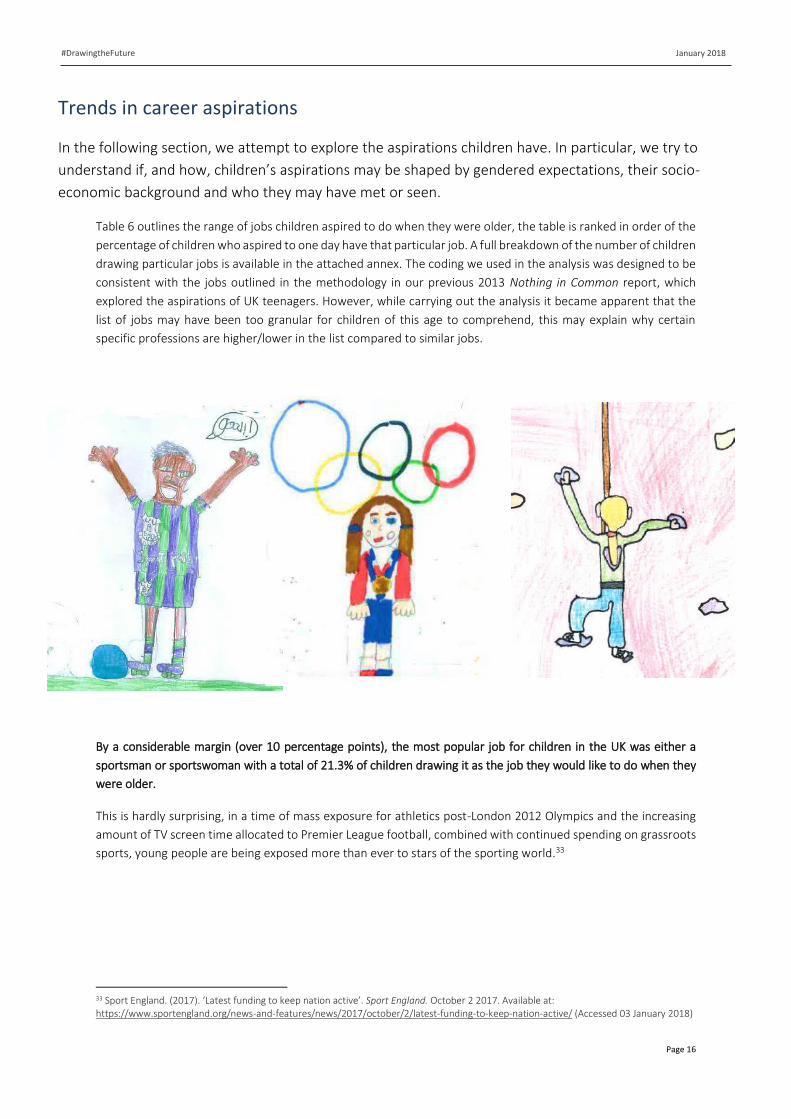
January 2018
Page 16
#DrawingtheFuture
Trends in career aspirations
In the following section, we attempt to explore the aspirations children have. In particular, we try to
understand if, and how, children’s aspirations may be shaped by gendered expectations, their socio-
economic background and who they may have met or seen.
Table 6 outlines the range of jobs children aspired to do when they were older, the table is ranked in order of the
percentage of children who aspired to one day have that particular job. A full breakdown of the number of children
drawing particular jobs is available in the attached annex. The coding we used in the analysis was designed to be
consistent with the jobs outlined in the methodology in our previous 2013 Nothing in Common report, which
explored the aspirations of UK teenagers. However, while carrying out the analysis it became apparent that the
list of jobs may have been too granular for children of this age to comprehend, this may explain why certain
specific professions are higher/lower in the list compared to similar jobs.
By a considerable margin (over 10 percentage points), the most popular job for children in the UK was either a
sportsman or sportswoman with a total of 21.3% of children drawing it as the job they would like to do when they
were older.
This is hardly surprising, in a time of mass exposure for athletics post-London 2012 Olympics and the increasing
amount of TV screen time allocated to Premier League football, combined with continued spending on grassroots
sports, young people are being exposed more than ever to stars of the sporting world.33
33 Sport England. (2017). ‘Latest funding to keep nation active’. Sport England. October 2 2017. Available at: https://www.sportengland.org/news-and-features/news/2017/october/2/latest-funding-to-keep-nation-active/ (Accessed 03 January 2018)
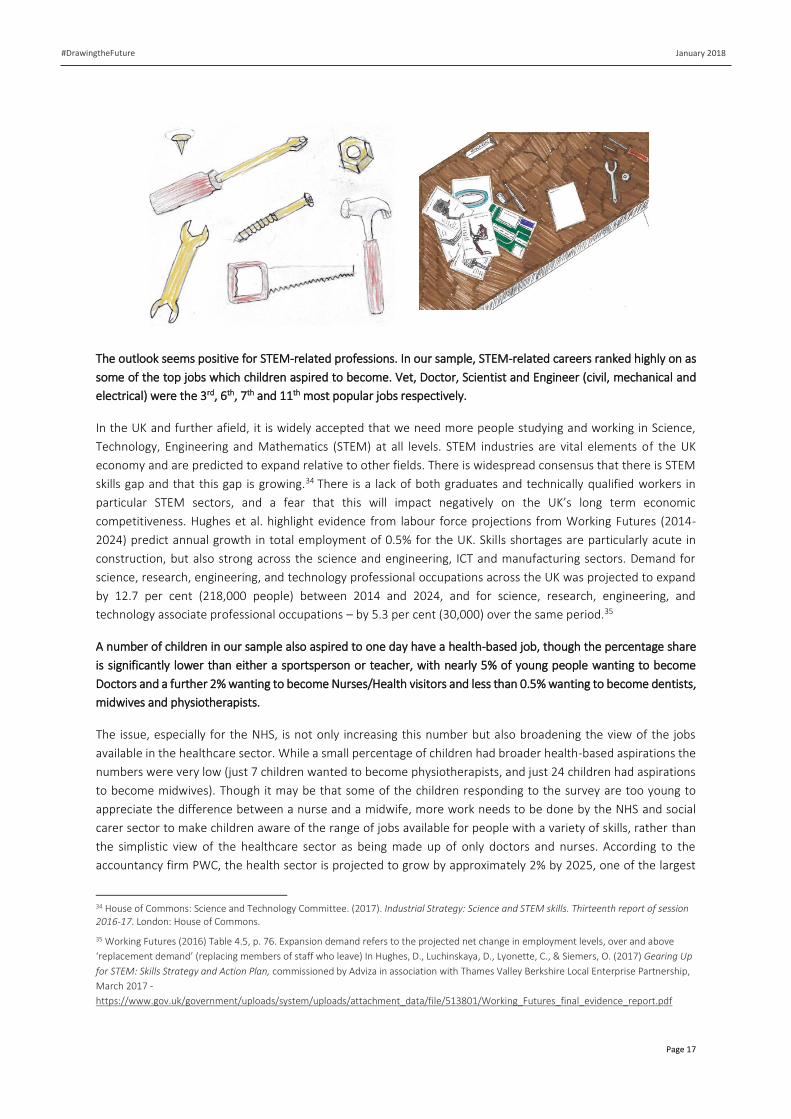
January 2018
Page 17
#DrawingtheFuture
The outlook seems positive for STEM-related professions. In our sample, STEM-related careers ranked highly on as
some of the top jobs which children aspired to become. Vet, Doctor, Scientist and Engineer (civil, mechanical and
electrical) were the 3rd, 6th, 7th and 11th most popular jobs respectively.
In the UK and further afield, it is widely accepted that we need more people studying and working in Science,
Technology, Engineering and Mathematics (STEM) at all levels. STEM industries are vital elements of the UK
economy and are predicted to expand relative to other fields. There is widespread consensus that there is STEM
skills gap and that this gap is growing.34 There is a lack of both graduates and technically qualified workers in
particular STEM sectors, and a fear that this will impact negatively on the UK’s long term economic
competitiveness. Hughes et al. highlight evidence from labour force projections from Working Futures (2014-
2024) predict annual growth in total employment of 0.5% for the UK. Skills shortages are particularly acute in
construction, but also strong across the science and engineering, ICT and manufacturing sectors. Demand for
science, research, engineering, and technology professional occupations across the UK was projected to expand
by 12.7 per cent (218,000 people) between 2014 and 2024, and for science, research, engineering, and
technology associate professional occupations – by 5.3 per cent (30,000) over the same period.35
A number of children in our sample also aspired to one day have a health-based job, though the percentage share
is significantly lower than either a sportsperson or teacher, with nearly 5% of young people wanting to become
Doctors and a further 2% wanting to become Nurses/Health visitors and less than 0.5% wanting to become dentists,
midwives and physiotherapists.
The issue, especially for the NHS, is not only increasing this number but also broadening the view of the jobs
available in the healthcare sector. While a small percentage of children had broader health-based aspirations the
numbers were very low (just 7 children wanted to become physiotherapists, and just 24 children had aspirations
to become midwives). Though it may be that some of the children responding to the survey are too young to
appreciate the difference between a nurse and a midwife, more work needs to be done by the NHS and social
carer sector to make children aware of the range of jobs available for people with a variety of skills, rather than
the simplistic view of the healthcare sector as being made up of only doctors and nurses. According to the
accountancy firm PWC, the health sector is projected to grow by approximately 2% by 2025, one of the largest
34 House of Commons: Science and Technology Committee. (2017). Industrial Strategy: Science and STEM skills. Thirteenth report of session 2016-17. London: House of Commons.
35 Working Futures (2016) Table 4.5, p. 76. Expansion demand refers to the projected net change in employment levels, over and above
‘replacement demand’ (replacing members of staff who leave) In Hughes, D., Luchinskaya, D., Lyonette, C., & Siemers, O. (2017) Gearing Up
for STEM: Skills Strategy and Action Plan, commissioned by Adviza in association with Thames Valley Berkshire Local Enterprise Partnership,
March 2017 -
https://www.gov.uk/government/uploads/system/uploads/attachment_data/file/513801/Working_Futures_final_evidence_report.pdf
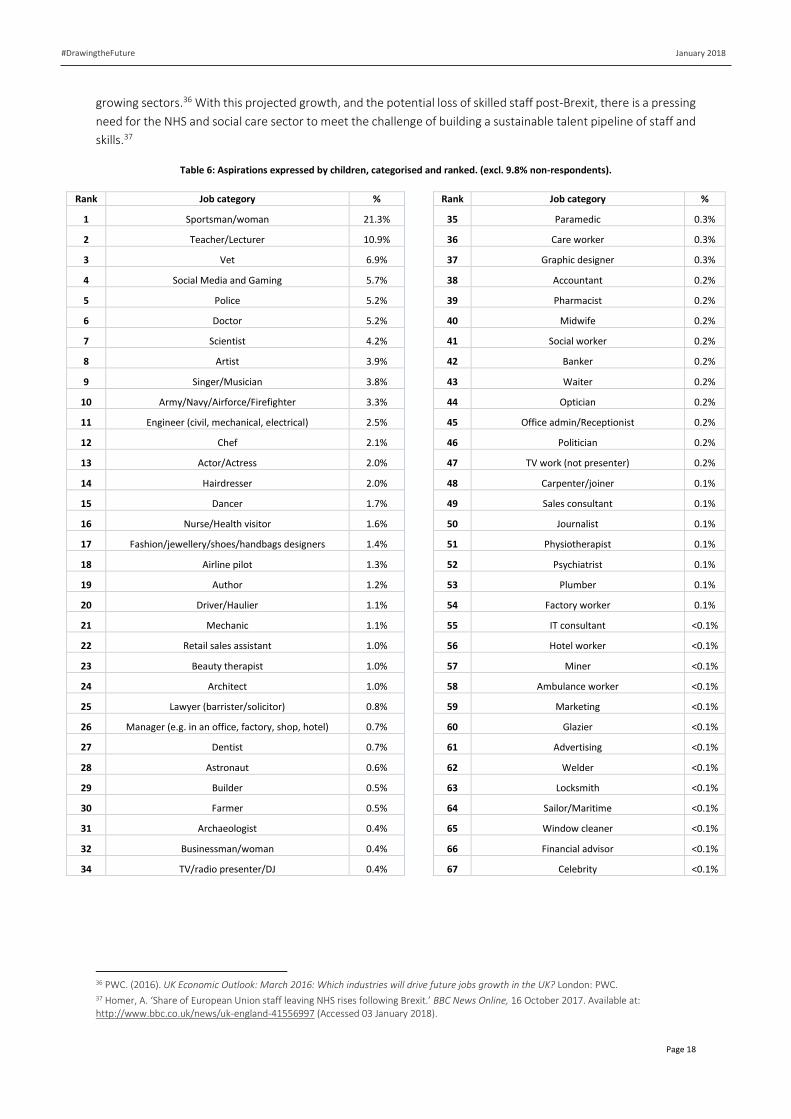
January 2018
Page 18
#DrawingtheFuture
growing sectors.36 With this projected growth, and the potential loss of skilled staff post-Brexit, there is a pressing
need for the NHS and social care sector to meet the challenge of building a sustainable talent pipeline of staff and
skills.37
Table 6: Aspirations expressed by children, categorised and ranked. (excl. 9.8% non-respondents).
Rank Job category % Rank Job category %
1 Sportsman/woman 21.3% 35 Paramedic 0.3%
2 Teacher/Lecturer 10.9% 36 Care worker 0.3%
3 Vet 6.9% 37 Graphic designer 0.3%
4 Social Media and Gaming 5.7% 38 Accountant 0.2%
5 Police 5.2% 39 Pharmacist 0.2%
6 Doctor 5.2% 40 Midwife 0.2%
7 Scientist 4.2% 41 Social worker 0.2%
8 Artist 3.9% 42 Banker 0.2%
9 Singer/Musician 3.8% 43 Waiter 0.2%
10 Army/Navy/Airforce/Firefighter 3.3% 44 Optician 0.2%
11 Engineer (civil, mechanical, electrical) 2.5% 45 Office admin/Receptionist 0.2%
12 Chef 2.1% 46 Politician 0.2%
13 Actor/Actress 2.0% 47 TV work (not presenter) 0.2%
14 Hairdresser 2.0% 48 Carpenter/joiner 0.1%
15 Dancer 1.7% 49 Sales consultant 0.1%
16 Nurse/Health visitor 1.6% 50 Journalist 0.1%
17 Fashion/jewellery/shoes/handbags designers 1.4% 51 Physiotherapist 0.1%
18 Airline pilot 1.3% 52 Psychiatrist 0.1%
19 Author 1.2% 53 Plumber 0.1%
20 Driver/Haulier 1.1% 54 Factory worker 0.1%
21 Mechanic 1.1% 55 IT consultant <0.1%
22 Retail sales assistant 1.0% 56 Hotel worker <0.1%
23 Beauty therapist 1.0% 57 Miner <0.1%
24 Architect 1.0% 58 Ambulance worker <0.1%
25 Lawyer (barrister/solicitor) 0.8% 59 Marketing <0.1%
26 Manager (e.g. in an office, factory, shop, hotel) 0.7% 60 Glazier <0.1%
27 Dentist 0.7% 61 Advertising <0.1%
28 Astronaut 0.6% 62 Welder <0.1%
29 Builder 0.5% 63 Locksmith <0.1%
30 Farmer 0.5% 64 Sailor/Maritime <0.1%
31 Archaeologist 0.4% 65 Window cleaner <0.1%
32 Businessman/woman 0.4% 66 Financial advisor <0.1%
34 TV/radio presenter/DJ 0.4% 67 Celebrity <0.1%
36 PWC. (2016). UK Economic Outlook: March 2016: Which industries will drive future jobs growth in the UK? London: PWC. 37 Homer, A. ‘Share of European Union staff leaving NHS rises following Brexit.’ BBC News Online, 16 October 2017. Available at: http://www.bbc.co.uk/news/uk-england-41556997 (Accessed 03 January 2018).
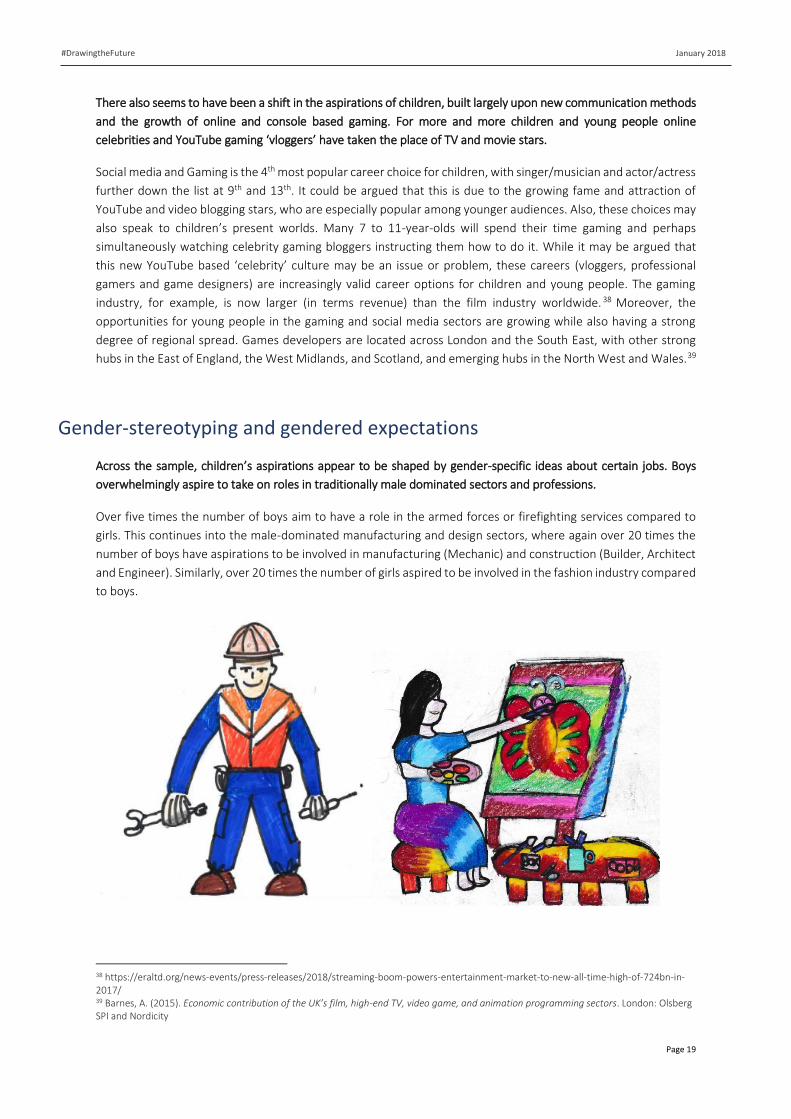
January 2018
Page 19
#DrawingtheFuture
There also seems to have been a shift in the aspirations of children, built largely upon new communication methods
and the growth of online and console based gaming. For more and more children and young people online
celebrities and YouTube gaming ‘vloggers’ have taken the place of TV and movie stars.
Social media and Gaming is the 4th most popular career choice for children, with singer/musician and actor/actress
further down the list at 9th and 13th. It could be argued that this is due to the growing fame and attraction of
YouTube and video blogging stars, who are especially popular among younger audiences. Also, these choices may
also speak to children’s present worlds. Many 7 to 11-year-olds will spend their time gaming and perhaps
simultaneously watching celebrity gaming bloggers instructing them how to do it. While it may be argued that
this new YouTube based ‘celebrity’ culture may be an issue or problem, these careers (vloggers, professional
gamers and game designers) are increasingly valid career options for children and young people. The gaming
industry, for example, is now larger (in terms revenue) than the film industry worldwide. 38 Moreover, the
opportunities for young people in the gaming and social media sectors are growing while also having a strong
degree of regional spread. Games developers are located across London and the South East, with other strong
hubs in the East of England, the West Midlands, and Scotland, and emerging hubs in the North West and Wales.39
Gender-stereotyping and gendered expectations
Across the sample, children’s aspirations appear to be shaped by gender-specific ideas about certain jobs. Boys
overwhelmingly aspire to take on roles in traditionally male dominated sectors and professions.
Over five times the number of boys aim to have a role in the armed forces or firefighting services compared to
girls. This continues into the male-dominated manufacturing and design sectors, where again over 20 times the
number of boys have aspirations to be involved in manufacturing (Mechanic) and construction (Builder, Architect
and Engineer). Similarly, over 20 times the number of girls aspired to be involved in the fashion industry compared
to boys.
38 https://eraltd.org/news-events/press-releases/2018/streaming-boom-powers-entertainment-market-to-new-all-time-high-of-724bn-in-2017/ 39 Barnes, A. (2015). Economic contribution of the UK’s film, high-end TV, video game, and animation programming sectors. London: Olsberg SPI and Nordicity
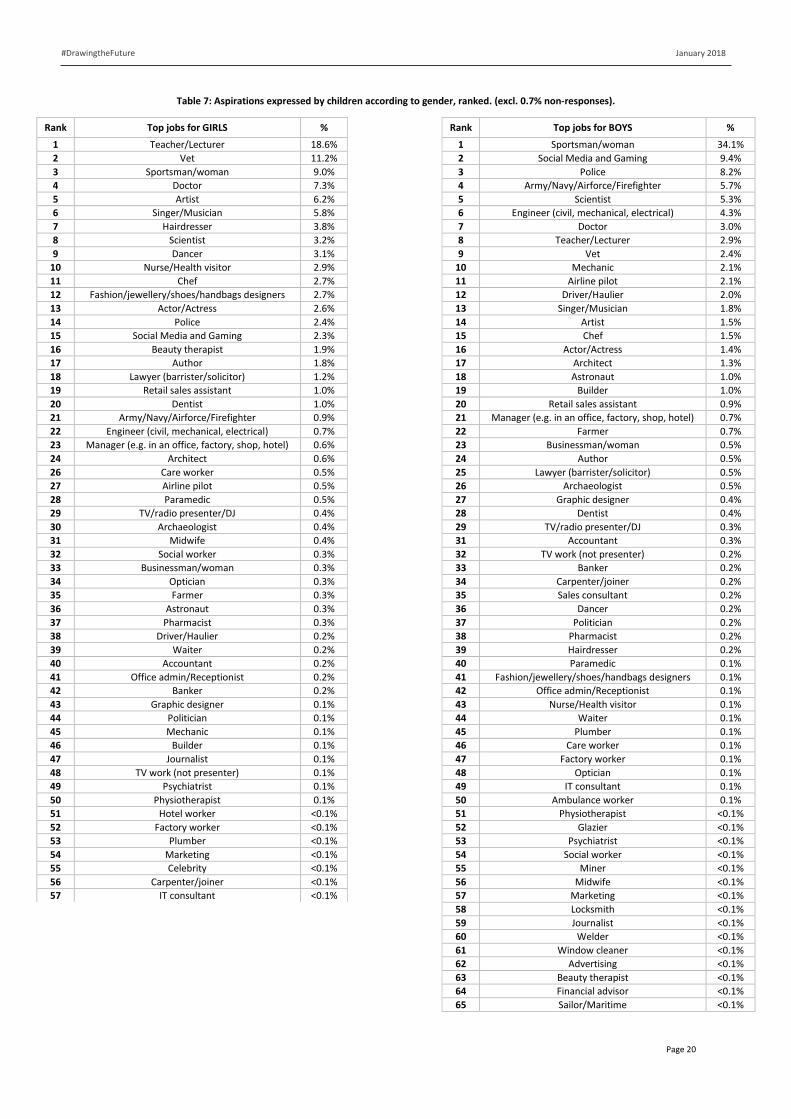
January 2018
Page 20
#DrawingtheFuture
Table 7: Aspirations expressed by children according to gender, ranked. (excl. 0.7% non-responses).
Rank Top jobs for GIRLS % Rank Top jobs for BOYS %
1 Teacher/Lecturer 18.6% 1 Sportsman/woman 34.1%
2 Vet 11.2% 2 Social Media and Gaming 9.4%
3 Sportsman/woman 9.0% 3 Police 8.2%
4 Doctor 7.3% 4 Army/Navy/Airforce/Firefighter 5.7%
5 Artist 6.2% 5 Scientist 5.3%
6 Singer/Musician 5.8% 6 Engineer (civil, mechanical, electrical) 4.3%
7 Hairdresser 3.8% 7 Doctor 3.0%
8 Scientist 3.2% 8 Teacher/Lecturer 2.9%
9 Dancer 3.1% 9 Vet 2.4%
10 Nurse/Health visitor 2.9% 10 Mechanic 2.1%
11 Chef 2.7% 11 Airline pilot 2.1%
12 Fashion/jewellery/shoes/handbags designers 2.7% 12 Driver/Haulier 2.0%
13 Actor/Actress 2.6% 13 Singer/Musician 1.8%
14 Police 2.4% 14 Artist 1.5%
15 Social Media and Gaming 2.3% 15 Chef 1.5%
16 Beauty therapist 1.9% 16 Actor/Actress 1.4%
17 Author 1.8% 17 Architect 1.3%
18 Lawyer (barrister/solicitor) 1.2% 18 Astronaut 1.0%
19 Retail sales assistant 1.0% 19 Builder 1.0%
20 Dentist 1.0% 20 Retail sales assistant 0.9%
21 Army/Navy/Airforce/Firefighter 0.9% 21 Manager (e.g. in an office, factory, shop, hotel) 0.7%
22 Engineer (civil, mechanical, electrical) 0.7% 22 Farmer 0.7%
23 Manager (e.g. in an office, factory, shop, hotel) 0.6% 23 Businessman/woman 0.5%
24 Architect 0.6% 24 Author 0.5%
26 Care worker 0.5% 25 Lawyer (barrister/solicitor) 0.5%
27 Airline pilot 0.5% 26 Archaeologist 0.5%
28 Paramedic 0.5% 27 Graphic designer 0.4%
29 TV/radio presenter/DJ 0.4% 28 Dentist 0.4%
30 Archaeologist 0.4% 29 TV/radio presenter/DJ 0.3%
31 Midwife 0.4% 31 Accountant 0.3%
32 Social worker 0.3% 32 TV work (not presenter) 0.2%
33 Businessman/woman 0.3% 33 Banker 0.2%
34 Optician 0.3% 34 Carpenter/joiner 0.2%
35 Farmer 0.3% 35 Sales consultant 0.2%
36 Astronaut 0.3% 36 Dancer 0.2%
37 Pharmacist 0.3% 37 Politician 0.2%
38 Driver/Haulier 0.2% 38 Pharmacist 0.2%
39 Waiter 0.2% 39 Hairdresser 0.2%
40 Accountant 0.2% 40 Paramedic 0.1%
41 Office admin/Receptionist 0.2% 41 Fashion/jewellery/shoes/handbags designers 0.1%
42 Banker 0.2% 42 Office admin/Receptionist 0.1%
43 Graphic designer 0.1% 43 Nurse/Health visitor 0.1%
44 Politician 0.1% 44 Waiter 0.1%
45 Mechanic 0.1% 45 Plumber 0.1%
46 Builder 0.1% 46 Care worker 0.1%
47 Journalist 0.1% 47 Factory worker 0.1%
48 TV work (not presenter) 0.1% 48 Optician 0.1%
49 Psychiatrist 0.1% 49 IT consultant 0.1%
50 Physiotherapist 0.1% 50 Ambulance worker 0.1%
51 Hotel worker <0.1% 51 Physiotherapist <0.1%
52 Factory worker <0.1% 52 Glazier <0.1%
53 Plumber <0.1% 53 Psychiatrist <0.1%
54 Marketing <0.1% 54 Social worker <0.1%
55 Celebrity <0.1% 55 Miner <0.1%
56 Carpenter/joiner <0.1% 56 Midwife <0.1%
57 IT consultant <0.1% 57 Marketing <0.1%
58 Locksmith <0.1%
59 Journalist <0.1%
60 Welder <0.1%
61 Window cleaner <0.1%
62 Advertising <0.1%
63 Beauty therapist <0.1%
64 Financial advisor <0.1%
65 Sailor/Maritime <0.1%
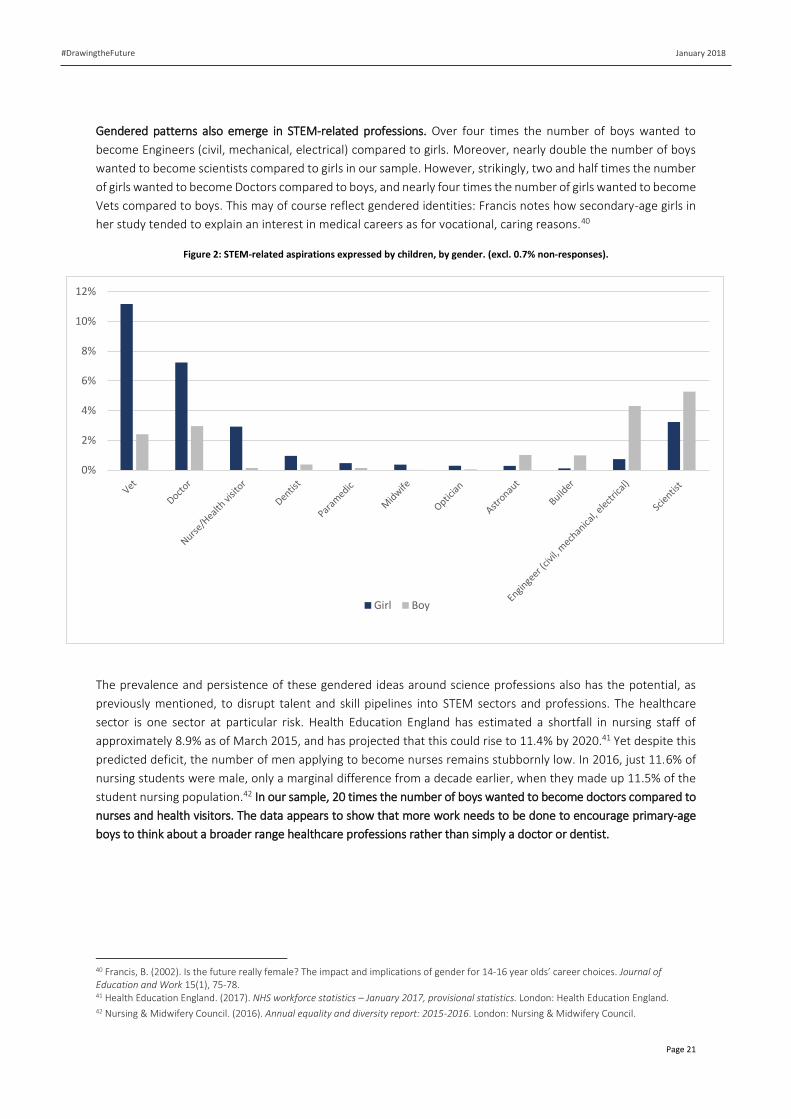
January 2018
Page 21
#DrawingtheFuture
Gendered patterns also emerge in STEM-related professions. Over four times the number of boys wanted to
become Engineers (civil, mechanical, electrical) compared to girls. Moreover, nearly double the number of boys
wanted to become scientists compared to girls in our sample. However, strikingly, two and half times the number
of girls wanted to become Doctors compared to boys, and nearly four times the number of girls wanted to become
Vets compared to boys. This may of course reflect gendered identities: Francis notes how secondary-age girls in
her study tended to explain an interest in medical careers as for vocational, caring reasons.40
Figure 2: STEM-related aspirations expressed by children, by gender. (excl. 0.7% non-responses).
The prevalence and persistence of these gendered ideas around science professions also has the potential, as
previously mentioned, to disrupt talent and skill pipelines into STEM sectors and professions. The healthcare
sector is one sector at particular risk. Health Education England has estimated a shortfall in nursing staff of
approximately 8.9% as of March 2015, and has projected that this could rise to 11.4% by 2020.41 Yet despite this
predicted deficit, the number of men applying to become nurses remains stubbornly low. In 2016, just 11.6% of
nursing students were male, only a marginal difference from a decade earlier, when they made up 11.5% of the
student nursing population.42 In our sample, 20 times the number of boys wanted to become doctors compared to
nurses and health visitors. The data appears to show that more work needs to be done to encourage primary-age
boys to think about a broader range healthcare professions rather than simply a doctor or dentist.
40 Francis, B. (2002). Is the future really female? The impact and implications of gender for 14-16 year olds’ career choices. Journal of Education and Work 15(1), 75-78. 41 Health Education England. (2017). NHS workforce statistics – January 2017, provisional statistics. London: Health Education England. 42 Nursing & Midwifery Council. (2016). Annual equality and diversity report: 2015-2016. London: Nursing & Midwifery Council.
0%
2%
4%
6%
8%
10%
12%
Girl Boy
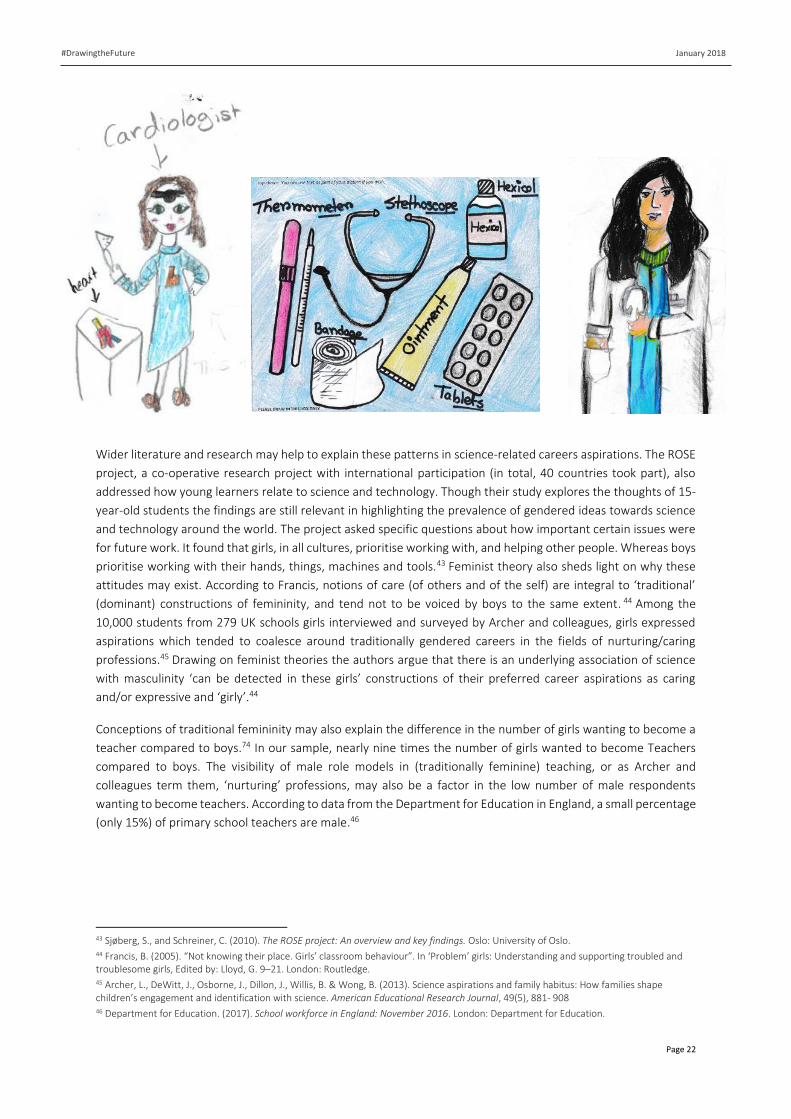
January 2018
Page 22
#DrawingtheFuture
Wider literature and research may help to explain these patterns in science-related careers aspirations. The ROSE
project, a co-operative research project with international participation (in total, 40 countries took part), also
addressed how young learners relate to science and technology. Though their study explores the thoughts of 15-
year-old students the findings are still relevant in highlighting the prevalence of gendered ideas towards science
and technology around the world. The project asked specific questions about how important certain issues were
for future work. It found that girls, in all cultures, prioritise working with, and helping other people. Whereas boys
prioritise working with their hands, things, machines and tools.43 Feminist theory also sheds light on why these
attitudes may exist. According to Francis, notions of care (of others and of the self) are integral to ‘traditional’
(dominant) constructions of femininity, and tend not to be voiced by boys to the same extent. 44 Among the
10,000 students from 279 UK schools girls interviewed and surveyed by Archer and colleagues, girls expressed
aspirations which tended to coalesce around traditionally gendered careers in the fields of nurturing/caring
professions.45 Drawing on feminist theories the authors argue that there is an underlying association of science
with masculinity ‘can be detected in these girls’ constructions of their preferred career aspirations as caring
and/or expressive and ‘girly’.44
Conceptions of traditional femininity may also explain the difference in the number of girls wanting to become a
teacher compared to boys.74 In our sample, nearly nine times the number of girls wanted to become Teachers
compared to boys. The visibility of male role models in (traditionally feminine) teaching, or as Archer and
colleagues term them, ‘nurturing’ professions, may also be a factor in the low number of male respondents
wanting to become teachers. According to data from the Department for Education in England, a small percentage
(only 15%) of primary school teachers are male.46
43 Sjøberg, S., and Schreiner, C. (2010). The ROSE project: An overview and key findings. Oslo: University of Oslo. 44 Francis, B. (2005). “Not knowing their place. Girls’ classroom behaviour”. In ‘Problem’ girls: Understanding and supporting troubled and troublesome girls, Edited by: Lloyd, G. 9–21. London: Routledge. 45 Archer, L., DeWitt, J., Osborne, J., Dillon, J., Willis, B. & Wong, B. (2013). Science aspirations and family habitus: How families shape children’s engagement and identification with science. American Educational Research Journal, 49(5), 881- 908 46 Department for Education. (2017). School workforce in England: November 2016. London: Department for Education.
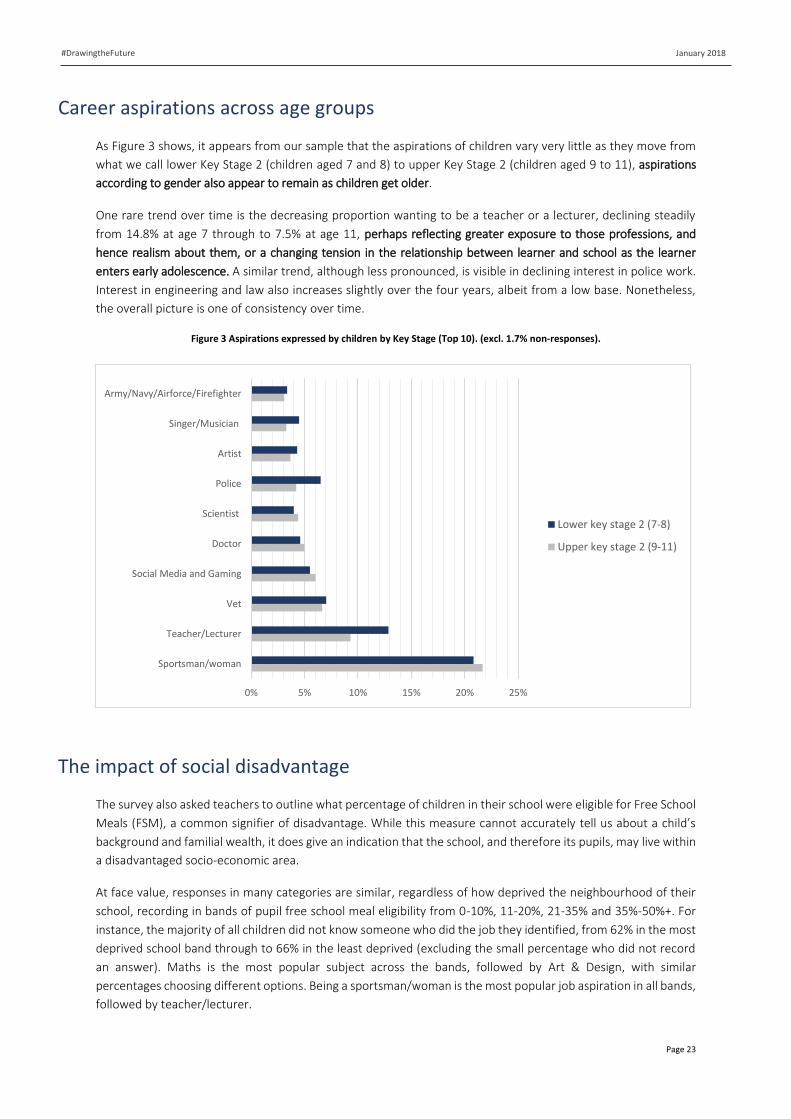
January 2018
Page 23
#DrawingtheFuture
Career aspirations across age groups
As Figure 3 shows, it appears from our sample that the aspirations of children vary very little as they move from
what we call lower Key Stage 2 (children aged 7 and 8) to upper Key Stage 2 (children aged 9 to 11), aspirations
according to gender also appear to remain as children get older.
One rare trend over time is the decreasing proportion wanting to be a teacher or a lecturer, declining steadily
from 14.8% at age 7 through to 7.5% at age 11, perhaps reflecting greater exposure to those professions, and
hence realism about them, or a changing tension in the relationship between learner and school as the learner
enters early adolescence. A similar trend, although less pronounced, is visible in declining interest in police work.
Interest in engineering and law also increases slightly over the four years, albeit from a low base. Nonetheless,
the overall picture is one of consistency over time.
Figure 3 Aspirations expressed by children by Key Stage (Top 10). (excl. 1.7% non-responses).
The impact of social disadvantage
The survey also asked teachers to outline what percentage of children in their school were eligible for Free School
Meals (FSM), a common signifier of disadvantage. While this measure cannot accurately tell us about a child’s
background and familial wealth, it does give an indication that the school, and therefore its pupils, may live within
a disadvantaged socio-economic area.
At face value, responses in many categories are similar, regardless of how deprived the neighbourhood of their
school, recording in bands of pupil free school meal eligibility from 0-10%, 11-20%, 21-35% and 35%-50%+. For
instance, the majority of all children did not know someone who did the job they identified, from 62% in the most
deprived school band through to 66% in the least deprived (excluding the small percentage who did not record
an answer). Maths is the most popular subject across the bands, followed by Art & Design, with similar
percentages choosing different options. Being a sportsman/woman is the most popular job aspiration in all bands,
followed by teacher/lecturer.
0% 5% 10% 15% 20% 25%
Sportsman/woman
Teacher/Lecturer
Vet
Social Media and Gaming
Doctor
Scientist
Police
Artist
Singer/Musician
Army/Navy/Airforce/Firefighter
Lower key stage 2 (7-8)
Upper key stage 2 (9-11)
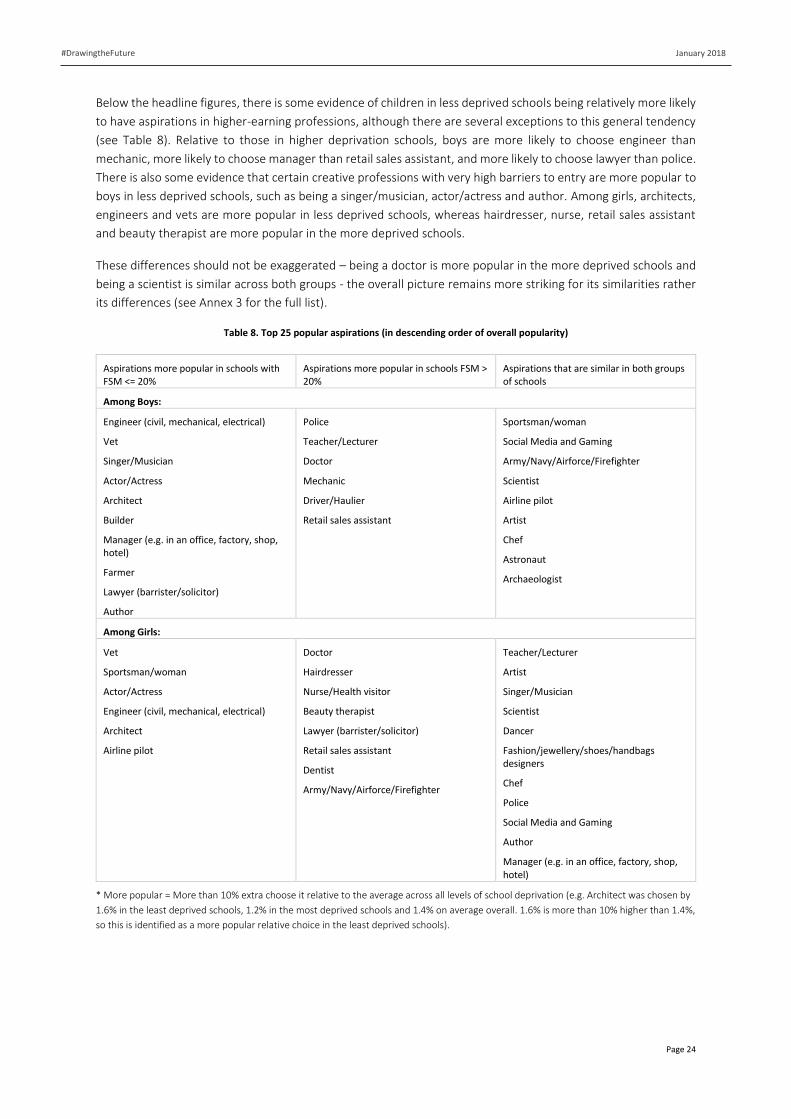
January 2018
Page 24
#DrawingtheFuture
Below the headline figures, there is some evidence of children in less deprived schools being relatively more likely
to have aspirations in higher-earning professions, although there are several exceptions to this general tendency
(see Table 8). Relative to those in higher deprivation schools, boys are more likely to choose engineer than
mechanic, more likely to choose manager than retail sales assistant, and more likely to choose lawyer than police.
There is also some evidence that certain creative professions with very high barriers to entry are more popular to
boys in less deprived schools, such as being a singer/musician, actor/actress and author. Among girls, architects,
engineers and vets are more popular in less deprived schools, whereas hairdresser, nurse, retail sales assistant
and beauty therapist are more popular in the more deprived schools.
These differences should not be exaggerated – being a doctor is more popular in the more deprived schools and
being a scientist is similar across both groups - the overall picture remains more striking for its similarities rather
its differences (see Annex 3 for the full list).
Table 8. Top 25 popular aspirations (in descending order of overall popularity)
Aspirations more popular in schools with FSM <= 20%
Aspirations more popular in schools FSM > 20%
Aspirations that are similar in both groups of schools
Among Boys:
Engineer (civil, mechanical, electrical)
Vet
Singer/Musician
Actor/Actress
Architect
Builder
Manager (e.g. in an office, factory, shop, hotel)
Farmer
Lawyer (barrister/solicitor)
Author
Police
Teacher/Lecturer
Doctor
Mechanic
Driver/Haulier
Retail sales assistant
Sportsman/woman
Social Media and Gaming
Army/Navy/Airforce/Firefighter
Scientist
Airline pilot
Artist
Chef
Astronaut
Archaeologist
Among Girls:
Vet
Sportsman/woman
Actor/Actress
Engineer (civil, mechanical, electrical)
Architect
Airline pilot
Doctor
Hairdresser
Nurse/Health visitor
Beauty therapist
Lawyer (barrister/solicitor)
Retail sales assistant
Dentist
Army/Navy/Airforce/Firefighter
Teacher/Lecturer
Artist
Singer/Musician
Scientist
Dancer
Fashion/jewellery/shoes/handbags designers
Chef
Police
Social Media and Gaming
Author
Manager (e.g. in an office, factory, shop, hotel)
* More popular = More than 10% extra choose it relative to the average across all levels of school deprivation (e.g. Architect was chosen by
1.6% in the least deprived schools, 1.2% in the most deprived schools and 1.4% on average overall. 1.6% is more than 10% higher than 1.4%,
so this is identified as a more popular relative choice in the least deprived schools).
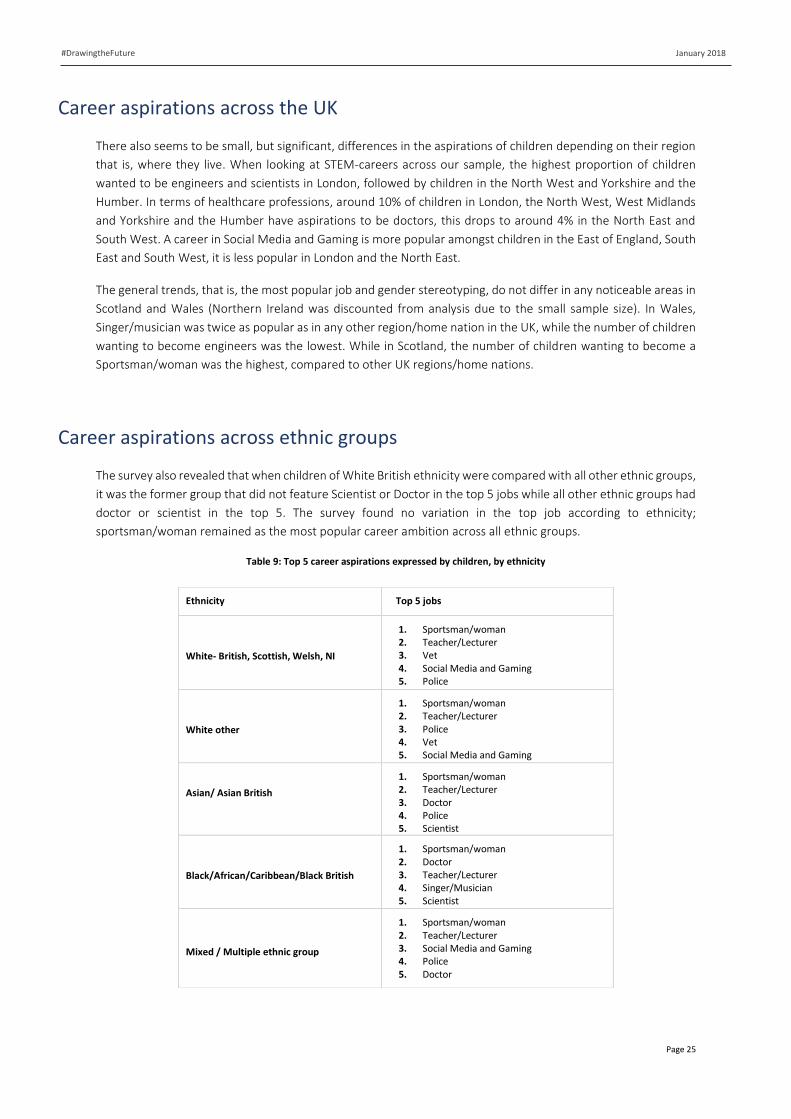
January 2018
Page 25
#DrawingtheFuture
Career aspirations across the UK
There also seems to be small, but significant, differences in the aspirations of children depending on their region
that is, where they live. When looking at STEM-careers across our sample, the highest proportion of children
wanted to be engineers and scientists in London, followed by children in the North West and Yorkshire and the
Humber. In terms of healthcare professions, around 10% of children in London, the North West, West Midlands
and Yorkshire and the Humber have aspirations to be doctors, this drops to around 4% in the North East and
South West. A career in Social Media and Gaming is more popular amongst children in the East of England, South
East and South West, it is less popular in London and the North East.
The general trends, that is, the most popular job and gender stereotyping, do not differ in any noticeable areas in
Scotland and Wales (Northern Ireland was discounted from analysis due to the small sample size). In Wales,
Singer/musician was twice as popular as in any other region/home nation in the UK, while the number of children
wanting to become engineers was the lowest. While in Scotland, the number of children wanting to become a
Sportsman/woman was the highest, compared to other UK regions/home nations.
Career aspirations across ethnic groups
The survey also revealed that when children of White British ethnicity were compared with all other ethnic groups,
it was the former group that did not feature Scientist or Doctor in the top 5 jobs while all other ethnic groups had
doctor or scientist in the top 5. The survey found no variation in the top job according to ethnicity;
sportsman/woman remained as the most popular career ambition across all ethnic groups.
Table 9: Top 5 career aspirations expressed by children, by ethnicity
Ethnicity Top 5 jobs
White- British, Scottish, Welsh, NI
1. Sportsman/woman 2. Teacher/Lecturer 3. Vet 4. Social Media and Gaming 5. Police
White other
1. Sportsman/woman 2. Teacher/Lecturer 3. Police 4. Vet 5. Social Media and Gaming
Asian/ Asian British
1. Sportsman/woman 2. Teacher/Lecturer 3. Doctor 4. Police 5. Scientist
Black/African/Caribbean/Black British
1. Sportsman/woman 2. Doctor 3. Teacher/Lecturer 4. Singer/Musician 5. Scientist
Mixed / Multiple ethnic group
1. Sportsman/woman 2. Teacher/Lecturer 3. Social Media and Gaming 4. Police 5. Doctor
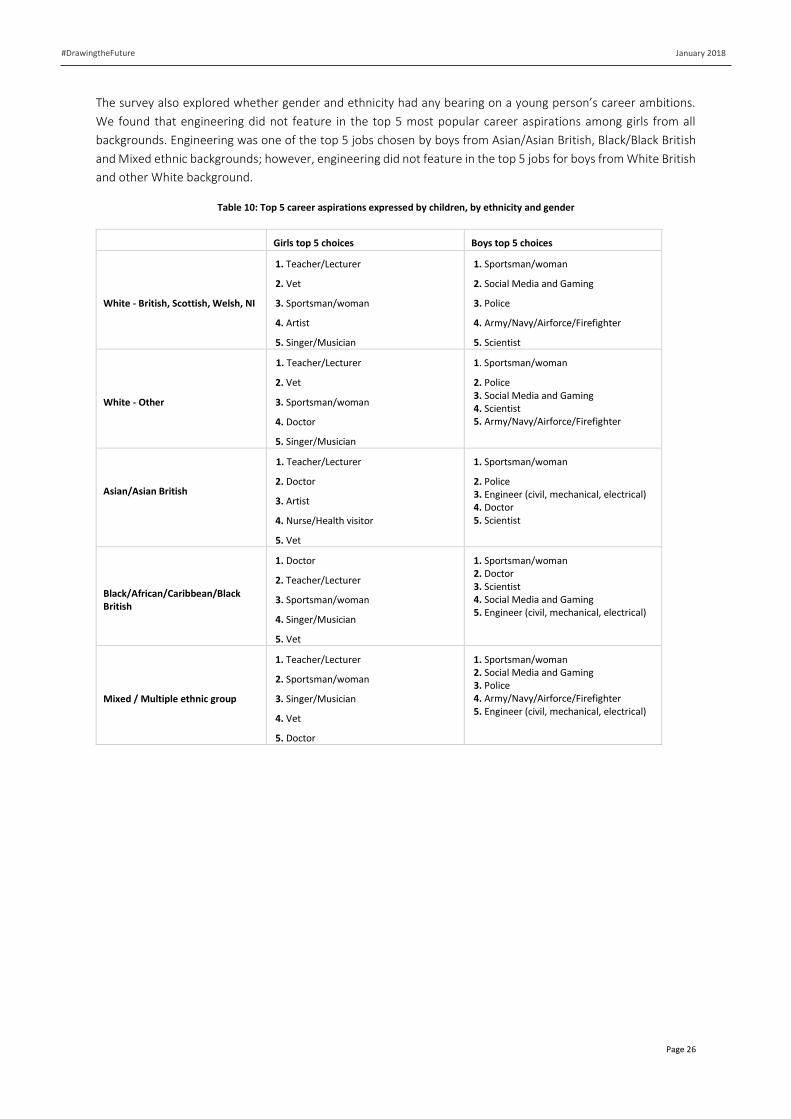
January 2018
Page 26
#DrawingtheFuture
The survey also explored whether gender and ethnicity had any bearing on a young person’s career ambitions.
We found that engineering did not feature in the top 5 most popular career aspirations among girls from all
backgrounds. Engineering was one of the top 5 jobs chosen by boys from Asian/Asian British, Black/Black British
and Mixed ethnic backgrounds; however, engineering did not feature in the top 5 jobs for boys from White British
and other White background.
Table 10: Top 5 career aspirations expressed by children, by ethnicity and gender
Girls top 5 choices Boys top 5 choices
White - British, Scottish, Welsh, NI
1. Teacher/Lecturer
2. Vet
3. Sportsman/woman
4. Artist
5. Singer/Musician
1. Sportsman/woman
2. Social Media and Gaming
3. Police
4. Army/Navy/Airforce/Firefighter
5. Scientist
White - Other
1. Teacher/Lecturer
2. Vet
3. Sportsman/woman
4. Doctor
5. Singer/Musician
1. Sportsman/woman
2. Police 3. Social Media and Gaming 4. Scientist 5. Army/Navy/Airforce/Firefighter
Asian/Asian British
1. Teacher/Lecturer
2. Doctor
3. Artist
4. Nurse/Health visitor
5. Vet
1. Sportsman/woman
2. Police 3. Engineer (civil, mechanical, electrical) 4. Doctor 5. Scientist
Black/African/Caribbean/Black British
1. Doctor
2. Teacher/Lecturer
3. Sportsman/woman
4. Singer/Musician
5. Vet
1. Sportsman/woman 2. Doctor 3. Scientist 4. Social Media and Gaming 5. Engineer (civil, mechanical, electrical)
Mixed / Multiple ethnic group
1. Teacher/Lecturer
2. Sportsman/woman
3. Singer/Musician
4. Vet
5. Doctor
1. Sportsman/woman 2. Social Media and Gaming 3. Police 4. Army/Navy/Airforce/Firefighter 5. Engineer (civil, mechanical, electrical)
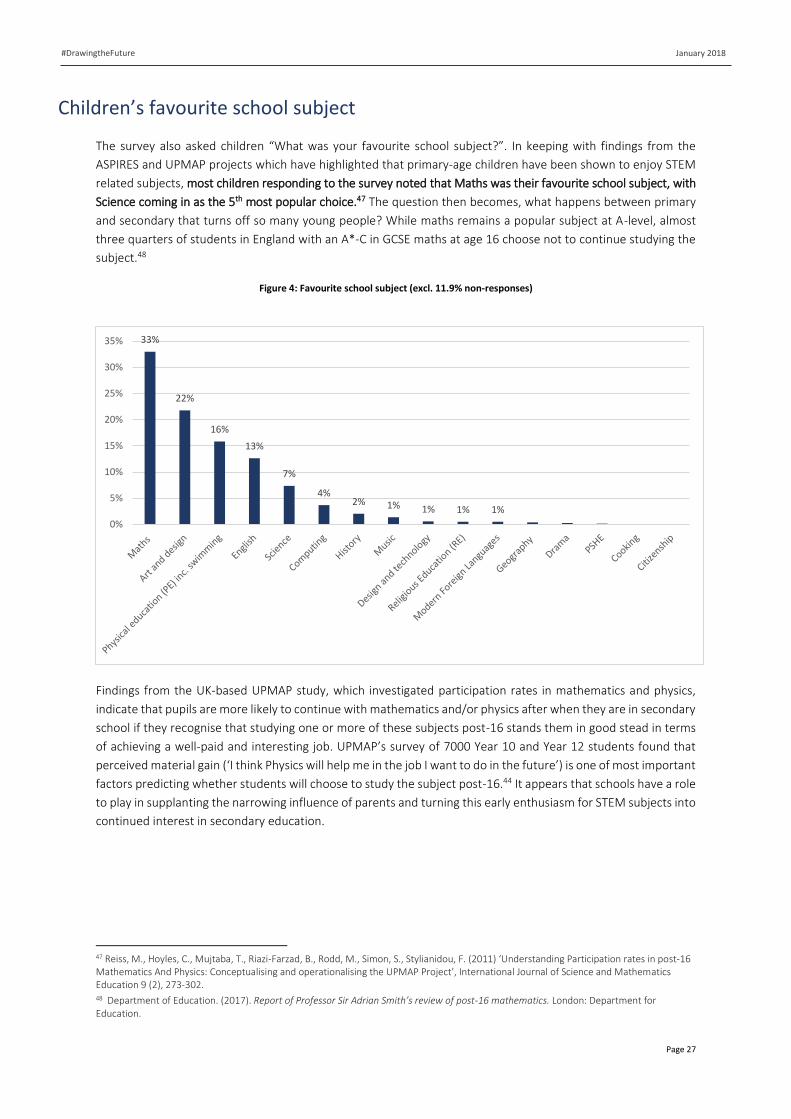
January 2018
Page 27
#DrawingtheFuture
Children’s favourite school subject
The survey also asked children “What was your favourite school subject?”. In keeping with findings from the
ASPIRES and UPMAP projects which have highlighted that primary-age children have been shown to enjoy STEM
related subjects, most children responding to the survey noted that Maths was their favourite school subject, with
Science coming in as the 5th most popular choice.47 The question then becomes, what happens between primary
and secondary that turns off so many young people? While maths remains a popular subject at A-level, almost
three quarters of students in England with an A*-C in GCSE maths at age 16 choose not to continue studying the
subject.48
Figure 4: Favourite school subject (excl. 11.9% non-responses)
Findings from the UK-based UPMAP study, which investigated participation rates in mathematics and physics,
indicate that pupils are more likely to continue with mathematics and/or physics after when they are in secondary
school if they recognise that studying one or more of these subjects post-16 stands them in good stead in terms
of achieving a well-paid and interesting job. UPMAP’s survey of 7000 Year 10 and Year 12 students found that
perceived material gain (‘I think Physics will help me in the job I want to do in the future’) is one of most important
factors predicting whether students will choose to study the subject post-16.44 It appears that schools have a role
to play in supplanting the narrowing influence of parents and turning this early enthusiasm for STEM subjects into
continued interest in secondary education.
47 Reiss, M., Hoyles, C., Mujtaba, T., Riazi-Farzad, B., Rodd, M., Simon, S., Stylianidou, F. (2011) ‘Understanding Participation rates in post-16 Mathematics And Physics: Conceptualising and operationalising the UPMAP Project’, International Journal of Science and Mathematics Education 9 (2), 273-302. 48 Department of Education. (2017). Report of Professor Sir Adrian Smith’s review of post-16 mathematics. London: Department for Education.
33%
22%
16%
13%
7%
4%2% 1% 1% 1% 1%
0%
5%
10%
15%
20%
25%
30%
35%
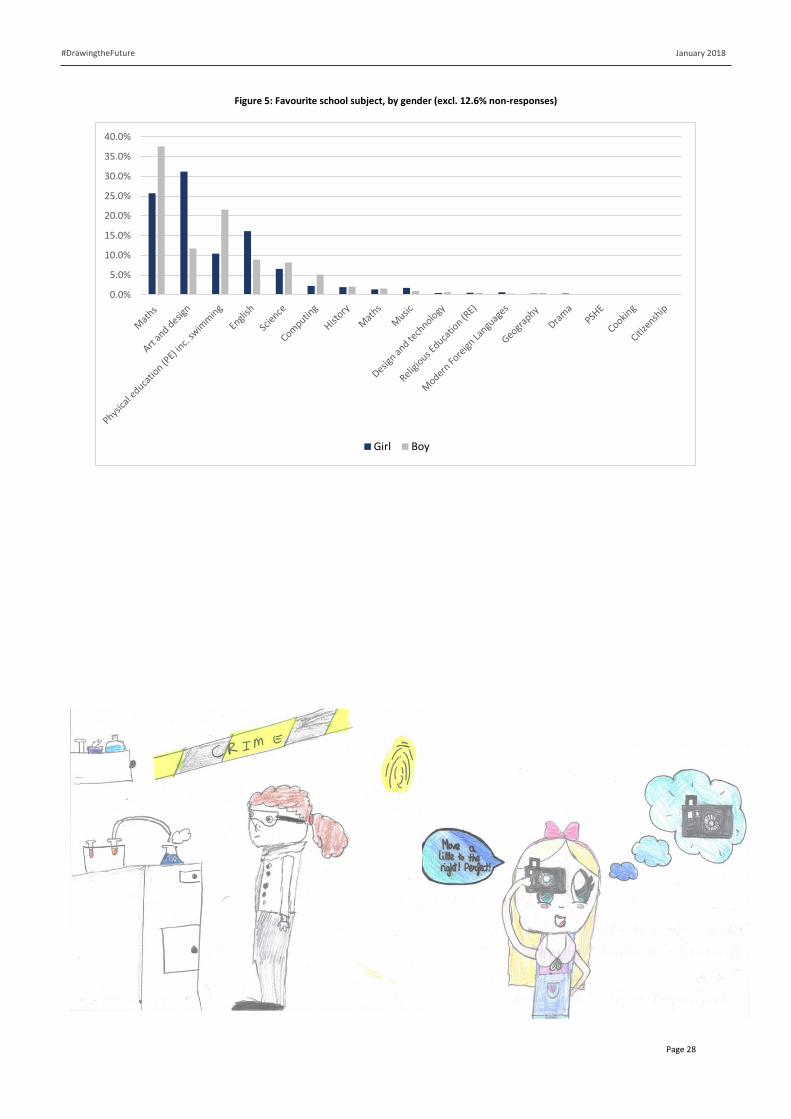
January 2018
Page 28
#DrawingtheFuture
Figure 5: Favourite school subject, by gender (excl. 12.6% non-responses)
0.0%
5.0%
10.0%
15.0%
20.0%
25.0%
30.0%
35.0%
40.0%
Girl Boy
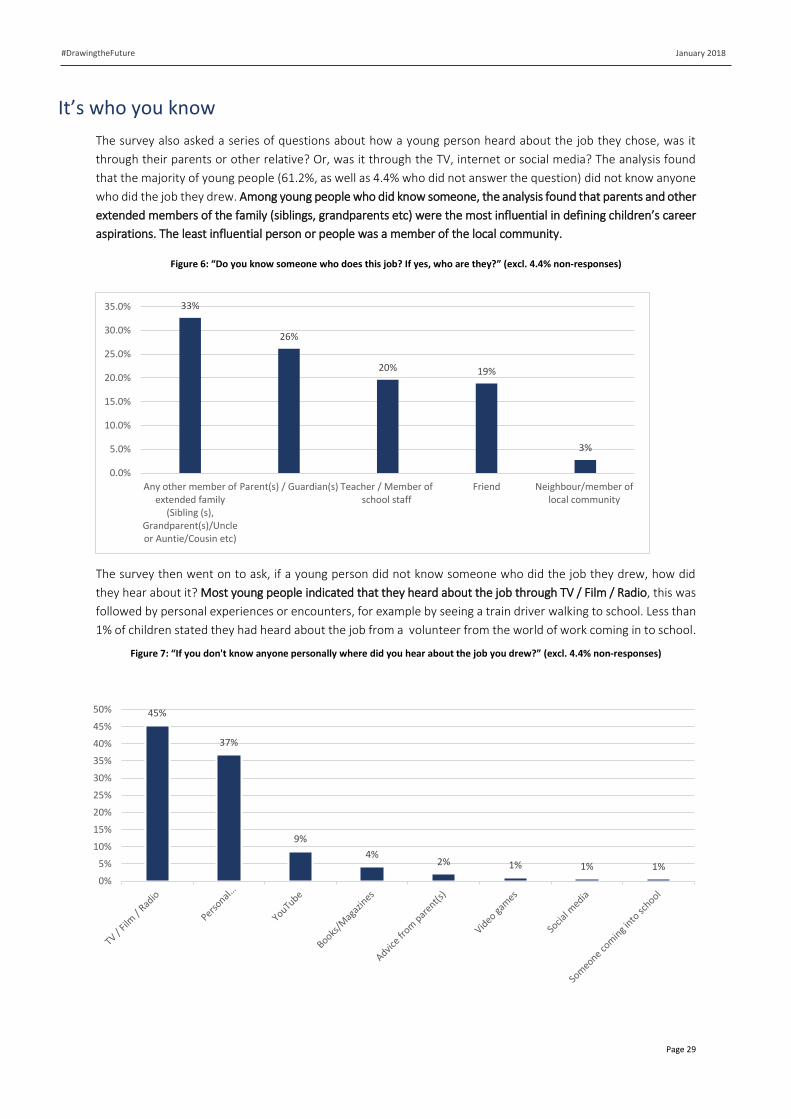
January 2018
Page 29
#DrawingtheFuture
It’s who you know
The survey also asked a series of questions about how a young person heard about the job they chose, was it
through their parents or other relative? Or, was it through the TV, internet or social media? The analysis found
that the majority of young people (61.2%, as well as 4.4% who did not answer the question) did not know anyone
who did the job they drew. Among young people who did know someone, the analysis found that parents and other
extended members of the family (siblings, grandparents etc) were the most influential in defining children’s career
aspirations. The least influential person or people was a member of the local community.
Figure 6: “Do you know someone who does this job? If yes, who are they?” (excl. 4.4% non-responses)
The survey then went on to ask, if a young person did not know someone who did the job they drew, how did
they hear about it? Most young people indicated that they heard about the job through TV / Film / Radio, this was
followed by personal experiences or encounters, for example by seeing a train driver walking to school. Less than
1% of children stated they had heard about the job from a volunteer from the world of work coming in to school.
Figure 7: “If you don't know anyone personally where did you hear about the job you drew?” (excl. 4.4% non-responses)
33%
26%
20% 19%
3%
0.0%
5.0%
10.0%
15.0%
20.0%
25.0%
30.0%
35.0%
Any other member ofextended family
(Sibling (s),Grandparent(s)/Uncleor Auntie/Cousin etc)
Parent(s) / Guardian(s) Teacher / Member ofschool staff
Friend Neighbour/member oflocal community
45%
37%
9%
4%2% 1% 1% 1%
0%
5%
10%
15%
20%
25%
30%
35%
40%
45%
50%
January 2018
Page 30
#DrawingtheFuture
The data presented above has shown how the aspirations primary-age children are often influenced by gender
stereotypes and gendered expectations about jobs and careers. Our analysis has also highlighted how
disadvantage has a role to play in shaping and influencing the aspirations of children. In the next section, we
explore how aligned children’s aspirations are to projected workforce needs, we also explore whether the
patterns of jobs chosen by primary-age children mirror those selected by secondary school pupils.
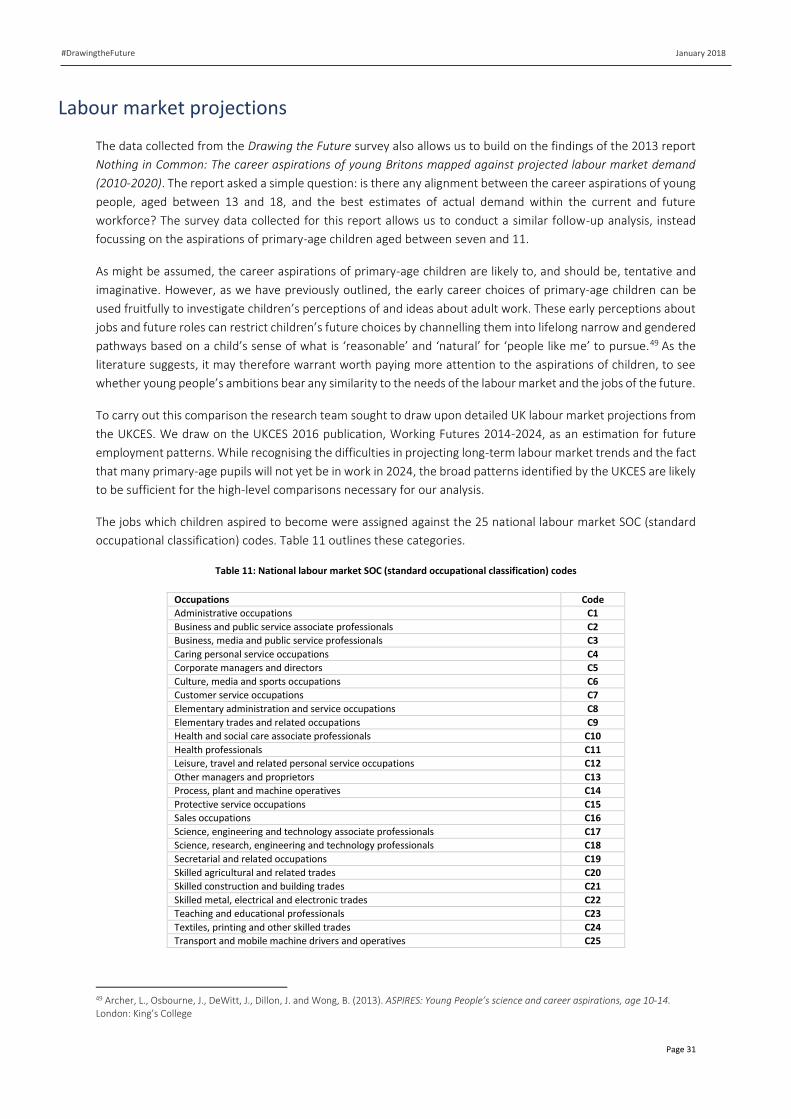
January 2018
Page 31
#DrawingtheFuture
Labour market projections
The data collected from the Drawing the Future survey also allows us to build on the findings of the 2013 report
Nothing in Common: The career aspirations of young Britons mapped against projected labour market demand
(2010-2020). The report asked a simple question: is there any alignment between the career aspirations of young
people, aged between 13 and 18, and the best estimates of actual demand within the current and future
workforce? The survey data collected for this report allows us to conduct a similar follow-up analysis, instead
focussing on the aspirations of primary-age children aged between seven and 11.
As might be assumed, the career aspirations of primary-age children are likely to, and should be, tentative and
imaginative. However, as we have previously outlined, the early career choices of primary-age children can be
used fruitfully to investigate children’s perceptions of and ideas about adult work. These early perceptions about
jobs and future roles can restrict children’s future choices by channelling them into lifelong narrow and gendered
pathways based on a child’s sense of what is ‘reasonable’ and ‘natural’ for ‘people like me’ to pursue.49 As the
literature suggests, it may therefore warrant worth paying more attention to the aspirations of children, to see
whether young people’s ambitions bear any similarity to the needs of the labour market and the jobs of the future.
To carry out this comparison the research team sought to draw upon detailed UK labour market projections from
the UKCES. We draw on the UKCES 2016 publication, Working Futures 2014-2024, as an estimation for future
employment patterns. While recognising the difficulties in projecting long-term labour market trends and the fact
that many primary-age pupils will not yet be in work in 2024, the broad patterns identified by the UKCES are likely
to be sufficient for the high-level comparisons necessary for our analysis.
The jobs which children aspired to become were assigned against the 25 national labour market SOC (standard
occupational classification) codes. Table 11 outlines these categories.
Table 11: National labour market SOC (standard occupational classification) codes
Occupations Code
Administrative occupations C1
Business and public service associate professionals C2
Business, media and public service professionals C3
Caring personal service occupations C4
Corporate managers and directors C5
Culture, media and sports occupations C6
Customer service occupations C7
Elementary administration and service occupations C8
Elementary trades and related occupations C9
Health and social care associate professionals C10
Health professionals C11
Leisure, travel and related personal service occupations C12
Other managers and proprietors C13
Process, plant and machine operatives C14
Protective service occupations C15
Sales occupations C16
Science, engineering and technology associate professionals C17
Science, research, engineering and technology professionals C18
Secretarial and related occupations C19
Skilled agricultural and related trades C20
Skilled construction and building trades C21
Skilled metal, electrical and electronic trades C22
Teaching and educational professionals C23
Textiles, printing and other skilled trades C24
Transport and mobile machine drivers and operatives C25
49 Archer, L., Osbourne, J., DeWitt, J., Dillon, J. and Wong, B. (2013). ASPIRES: Young People’s science and career aspirations, age 10-14. London: King’s College
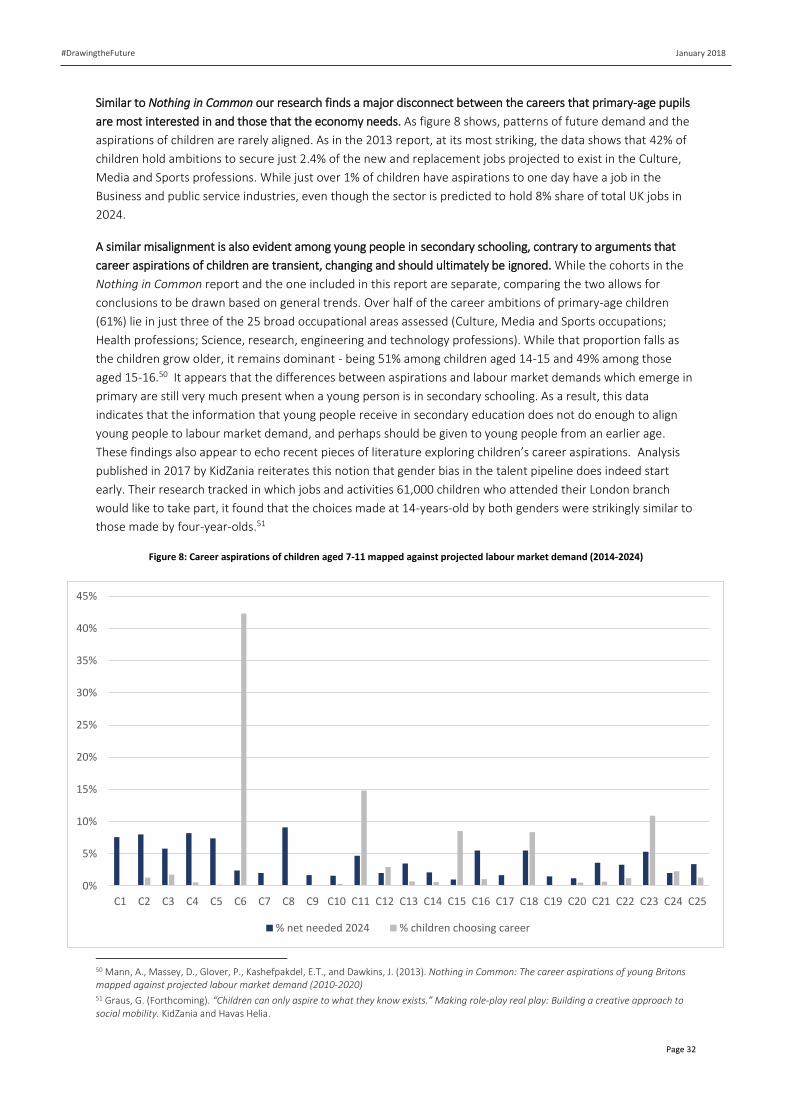
January 2018
Page 32
#DrawingtheFuture
Similar to Nothing in Common our research finds a major disconnect between the careers that primary-age pupils
are most interested in and those that the economy needs. As figure 8 shows, patterns of future demand and the
aspirations of children are rarely aligned. As in the 2013 report, at its most striking, the data shows that 42% of
children hold ambitions to secure just 2.4% of the new and replacement jobs projected to exist in the Culture,
Media and Sports professions. While just over 1% of children have aspirations to one day have a job in the
Business and public service industries, even though the sector is predicted to hold 8% share of total UK jobs in
2024.
A similar misalignment is also evident among young people in secondary schooling, contrary to arguments that
career aspirations of children are transient, changing and should ultimately be ignored. While the cohorts in the
Nothing in Common report and the one included in this report are separate, comparing the two allows for
conclusions to be drawn based on general trends. Over half of the career ambitions of primary-age children
(61%) lie in just three of the 25 broad occupational areas assessed (Culture, Media and Sports occupations;
Health professions; Science, research, engineering and technology professions). While that proportion falls as
the children grow older, it remains dominant - being 51% among children aged 14-15 and 49% among those
aged 15-16.50 It appears that the differences between aspirations and labour market demands which emerge in
primary are still very much present when a young person is in secondary schooling. As a result, this data
indicates that the information that young people receive in secondary education does not do enough to align
young people to labour market demand, and perhaps should be given to young people from an earlier age.
These findings also appear to echo recent pieces of literature exploring children’s career aspirations. Analysis
published in 2017 by KidZania reiterates this notion that gender bias in the talent pipeline does indeed start
early. Their research tracked in which jobs and activities 61,000 children who attended their London branch
would like to take part, it found that the choices made at 14-years-old by both genders were strikingly similar to
those made by four-year-olds.51
Figure 8: Career aspirations of children aged 7-11 mapped against projected labour market demand (2014-2024)
50 Mann, A., Massey, D., Glover, P., Kashefpakdel, E.T., and Dawkins, J. (2013). Nothing in Common: The career aspirations of young Britons mapped against projected labour market demand (2010-2020) 51 Graus, G. (Forthcoming). “Children can only aspire to what they know exists.” Making role-play real play: Building a creative approach to social mobility. KidZania and Havas Helia.
0%
5%
10%
15%
20%
25%
30%
35%
40%
45%
C1 C2 C3 C4 C5 C6 C7 C8 C9 C10 C11 C12 C13 C14 C15 C16 C17 C18 C19 C20 C21 C22 C23 C24 C25
% net needed 2024 % children choosing career
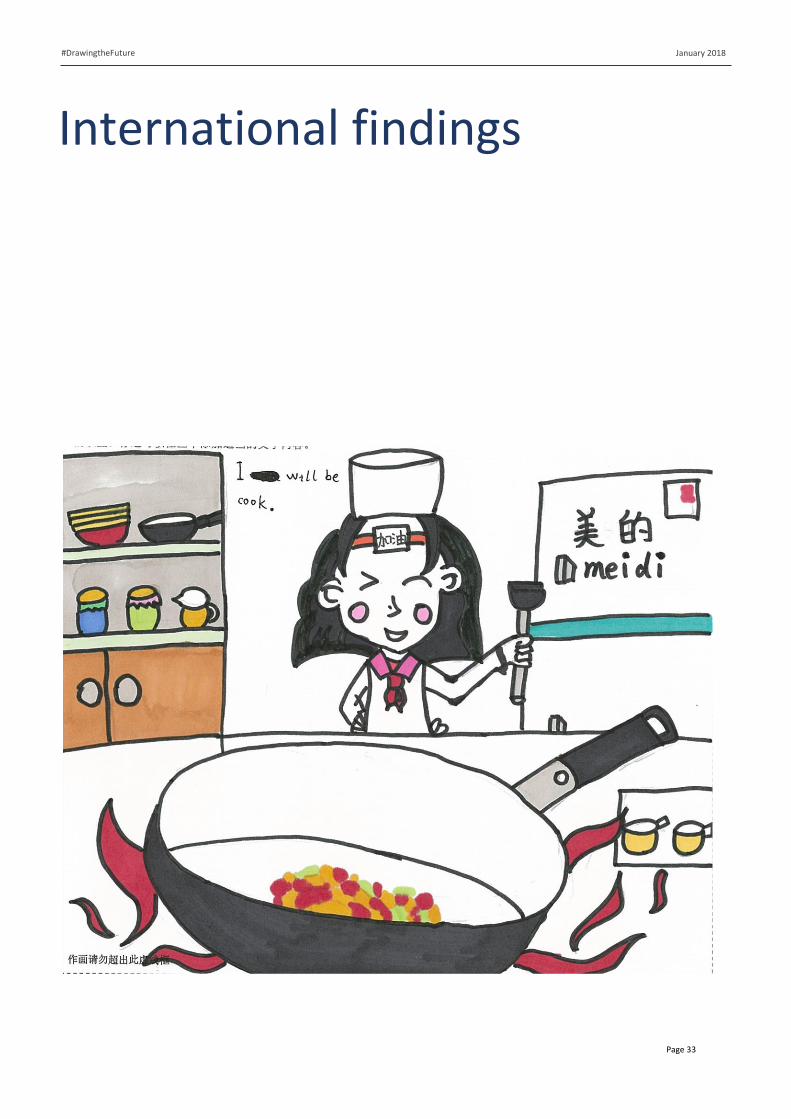
January 2018
Page 33
#DrawingtheFuture
International findings
January 2018
Page 34
#DrawingtheFuture
The following section outlines the key findings from the 19 further countries which took part in the
Drawing the Future survey. In each country, the most popular career aspirations are presented, followed by data on gender and how the child
heard about the job they had chosen. In countries where a larger number of children participated in the survey,
their career aspirations are compared to available local labour market projections and information. Again, it must
be emphasised that the findings included throughout this section are based on a small sample (in the first group
of countries around 500 children, while in the second section this number is lower) and they therefore should not
be seen as being representative of children’s aspirations in each participating country. The data should instead be
seen as an opportunity to glimpse at the career aspirations children have, but cannot replace a detailed analysis
of the career aspirations in each country. We hope that some countries may be inspired by this work to run larger
studies to better understand their own population and to take part in any subsequent survey.
While aspirations, and the influences on these aspirations, vary by country, there are a number of global trends
which emerge from the data. In terms of gender stereotyping and gendered career expectations, aspirations do
tend to lay in stereotypical masculine/feminine roles across the sample. One of the most popular jobs for boys
across our sample is often police and armed forces, while teaching emerges as one of the most popular
professions for girls.
The trends for STEM related aspirations are largely similar. In keeping with popular theories around masculine
and feminine roles, boys in our samples have preference for working with things, for example working as an
Engineer or Scientist whereas girls seem to aspire to jobs working with people/caring professions for example
working as a teacher, nurse, doctor or vet.
In all countries in our sample, Maths or Science is in the top two favourite subjects among children (for girls and
boys), apart from children in Australia and China.
The general trends suggest that in some developing countries children have more practical and high professional
ambitions (Doctor, Teacher), whereas in developed countries aspirations are often formed around celebrity
culture (such as Sportsperson, or a career in social media and gaming).
Parents, and other members of extended family, are often the biggest influencer if the respondent knew someone
personally who did that job, apart from developing countries such as Uganda and Zambia, where teacher is often
the biggest influence. If a young person did not know someone personally who did that job, TV/Film is the biggest
influencer, apart from Uganda or Zambia. In all countries in our sample, less than 1% of children has meet with
volunteers from the world of work.
January 2018
Page 35
#DrawingtheFuture
Participating countries with larger sample sizes
Albania
For Albania, there were 343 qualifying responses from a single school in the urban area of Elbasan (Sule Harri).
48% were boys and the almost all were aged 7-10 (90%), with fewer aged 11. 97% spoke exclusively Albanian at
home and 34% described speaking some other European languages at school, mostly English.
The most popular careers are, as elsewhere, highly concentrated into a few occupations, reflecting a combination
of celebrity focus (sportsman/woman, at 31%), traditionally high aspiration careers (doctor, at 30%), and highly
visible public service careers (teacher/lecturer at 9%). 70% of respondents selected one of these three careers.
Gender
There are significant differences by gender in the most common career aspirations. Sports dominates the
preferences for boys at 49% versus only 4% of girls. Doctor, architect, lawyer, artist and teacher appear in both
lists, but with doctor and teacher particularly popular for girls (34% versus 17% and 14% versus 2%).
Table 12: Albania. Top career aspirations of children aged 7-11 by gender
Girls top jobs % Boys top jobs %
Doctor 34% Sportsman/woman 49%
Teacher/Lecturer 14% Doctor 17%
Singer/Musician 8% Architect 5%
Artist 6% Police 4%
Dancer 6% Scientist 3%
Architect 5% Artist 3%
Lawyer (barrister/solicitor) 5% Dentist 3%
Pharmacist 4% Engineer (civil, mechanical, electrical) 3%
Sportsman/woman 4% Lawyer (barrister/solicitor) 2%
Vet 3% Teacher/Lecturer 2%
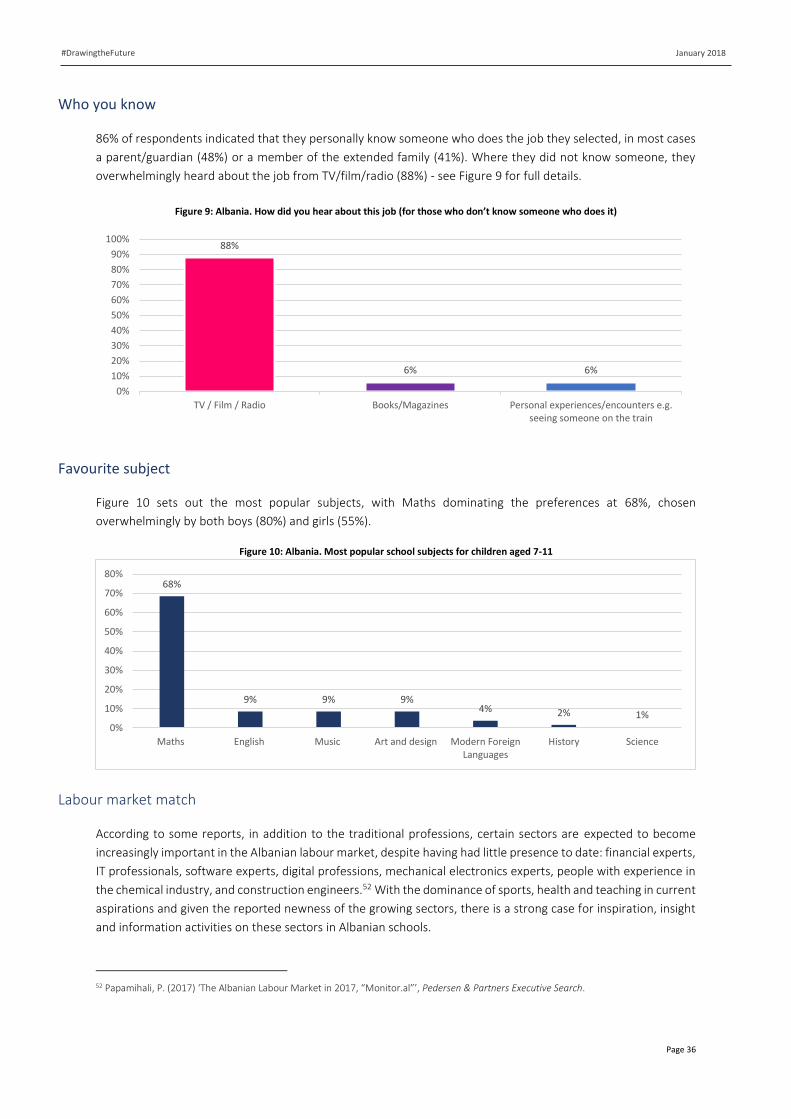
January 2018
Page 36
#DrawingtheFuture
Who you know
86% of respondents indicated that they personally know someone who does the job they selected, in most cases
a parent/guardian (48%) or a member of the extended family (41%). Where they did not know someone, they
overwhelmingly heard about the job from TV/film/radio (88%) - see Figure 9 for full details.
Figure 9: Albania. How did you hear about this job (for those who don’t know someone who does it)
Favourite subject
Figure 10 sets out the most popular subjects, with Maths dominating the preferences at 68%, chosen
overwhelmingly by both boys (80%) and girls (55%).
Figure 10: Albania. Most popular school subjects for children aged 7-11
Labour market match
According to some reports, in addition to the traditional professions, certain sectors are expected to become
increasingly important in the Albanian labour market, despite having had little presence to date: financial experts,
IT professionals, software experts, digital professions, mechanical electronics experts, people with experience in
the chemical industry, and construction engineers.52 With the dominance of sports, health and teaching in current
aspirations and given the reported newness of the growing sectors, there is a strong case for inspiration, insight
and information activities on these sectors in Albanian schools.
52 Papamihali, P. (2017) ‘The Albanian Labour Market in 2017, “Monitor.al”’, Pedersen & Partners Executive Search.
68%
9% 9% 9%4% 2% 1%
0%
10%
20%
30%
40%
50%
60%
70%
80%
Maths English Music Art and design Modern ForeignLanguages
History Science
88%
6% 6%
0%
10%
20%
30%
40%
50%
60%
70%
80%
90%
100%
TV / Film / Radio Books/Magazines Personal experiences/encounters e.g.seeing someone on the train
January 2018
Page 37
#DrawingtheFuture
Australia
For Australia, there were 326 qualifying responses from 4 different schools in the urban, rural and remote areas
of New South Wales. The majority of responses came from Werrington County PS (57%). 49% were boys and
almost all were aged 7-11 (90%).
The most popular careers are, as elsewhere, highly concentrated into a few occupations, reflecting a combination
of celebrity focus (sportsman/woman, at 32%), highly visible public service careers (teacher/lecturer at 21%,
police at 12%), health (vet, at 8%) and modern growth drivers (scientist, at 5%). 78% of respondents selected one
of these five careers.
Gender
There are some shared interests by gender in the most common career aspirations. For instance three appear in
the top five both genders (sportsman/woman; teacher/lecturer; police). However, there are sharply different
emphases among those common aspirations, with over a third of boys opting for sports and over a quarter of
girls choosing teaching, each around three times or more popular than it is for the other gender. Other
traditionally-observed gendered preferences can be seen, with hairdressing and beauty therapist appearing for
girls, and driver/mechanic appearing for boys.
Table 13: Australia. Top career aspirations of children aged 7-11 by gender
Girls top 10 jobs % Boys top 10 jobs %
Teacher/Lecturer 26% Sportsman/woman 37%
Sportsman/woman 13% Police 15%
Vet 9% Engineer (civil, mechanical, electrical) 7%
Hairdresser 6% Teacher/Lecturer 5%
Police 5% Driver/Haulier 5%
Artist 4% Mechanic 4%
Actor/Actress 4% Scientist 4%
Scientist 4% Farmer 4%
Beauty therapist 3% Actor/Actress 3%
Farmer 3% Vet 2%
Who you know
45% of respondents indicated that they personally know someone who does the job they selected, in most cases
a parent/guardian (36%) or a member of the extended family (29%), but school staff (18%) and friends (14%) also
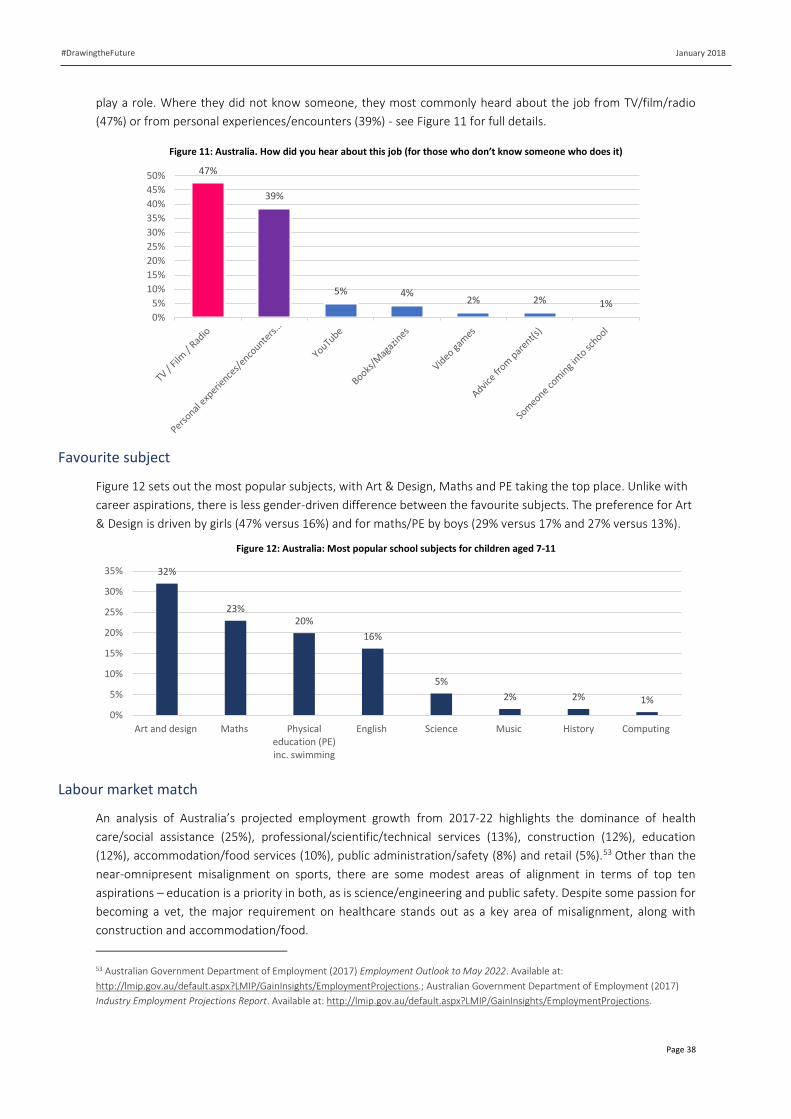
January 2018
Page 38
#DrawingtheFuture
play a role. Where they did not know someone, they most commonly heard about the job from TV/film/radio
(47%) or from personal experiences/encounters (39%) - see Figure 11 for full details.
Figure 11: Australia. How did you hear about this job (for those who don’t know someone who does it)
Favourite subject
Figure 12 sets out the most popular subjects, with Art & Design, Maths and PE taking the top place. Unlike with
career aspirations, there is less gender-driven difference between the favourite subjects. The preference for Art
& Design is driven by girls (47% versus 16%) and for maths/PE by boys (29% versus 17% and 27% versus 13%).
Figure 12: Australia: Most popular school subjects for children aged 7-11
Labour market match
An analysis of Australia’s projected employment growth from 2017-22 highlights the dominance of health
care/social assistance (25%), professional/scientific/technical services (13%), construction (12%), education
(12%), accommodation/food services (10%), public administration/safety (8%) and retail (5%).53 Other than the
near-omnipresent misalignment on sports, there are some modest areas of alignment in terms of top ten
aspirations – education is a priority in both, as is science/engineering and public safety. Despite some passion for
becoming a vet, the major requirement on healthcare stands out as a key area of misalignment, along with
construction and accommodation/food.
53 Australian Government Department of Employment (2017) Employment Outlook to May 2022. Available at:
http://lmip.gov.au/default.aspx?LMIP/GainInsights/EmploymentProjections.; Australian Government Department of Employment (2017)
Industry Employment Projections Report. Available at: http://lmip.gov.au/default.aspx?LMIP/GainInsights/EmploymentProjections.
32%
23%20%
16%
5%
2% 2% 1%
0%
5%
10%
15%
20%
25%
30%
35%
Art and design Maths Physicaleducation (PE)inc. swimming
English Science Music History Computing
47%
39%
5% 4%2% 2% 1%
0%
5%
10%
15%
20%
25%
30%
35%
40%
45%
50%
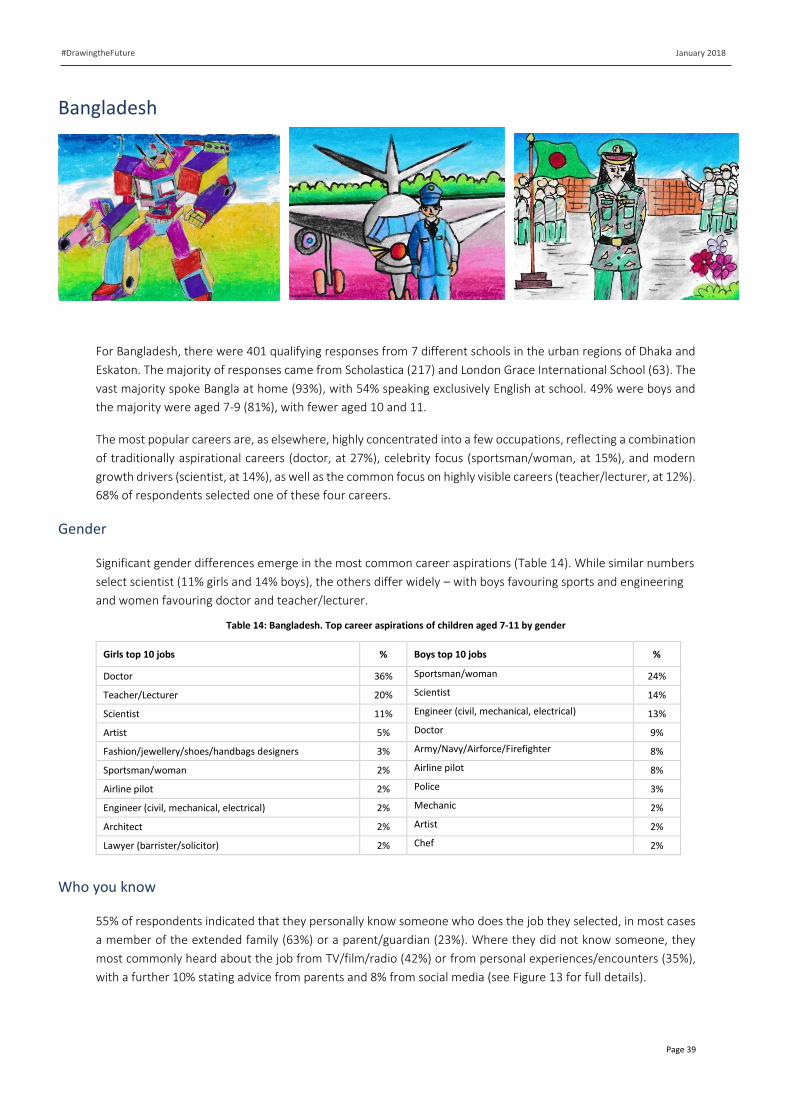
January 2018
Page 39
#DrawingtheFuture
Bangladesh
For Bangladesh, there were 401 qualifying responses from 7 different schools in the urban regions of Dhaka and
Eskaton. The majority of responses came from Scholastica (217) and London Grace International School (63). The
vast majority spoke Bangla at home (93%), with 54% speaking exclusively English at school. 49% were boys and
the majority were aged 7-9 (81%), with fewer aged 10 and 11.
The most popular careers are, as elsewhere, highly concentrated into a few occupations, reflecting a combination
of traditionally aspirational careers (doctor, at 27%), celebrity focus (sportsman/woman, at 15%), and modern
growth drivers (scientist, at 14%), as well as the common focus on highly visible careers (teacher/lecturer, at 12%).
68% of respondents selected one of these four careers.
Gender
Significant gender differences emerge in the most common career aspirations (Table 14). While similar numbers
select scientist (11% girls and 14% boys), the others differ widely – with boys favouring sports and engineering
and women favouring doctor and teacher/lecturer.
Table 14: Bangladesh. Top career aspirations of children aged 7-11 by gender
Girls top 10 jobs % Boys top 10 jobs %
Doctor 36% Sportsman/woman 24%
Teacher/Lecturer 20% Scientist 14%
Scientist 11% Engineer (civil, mechanical, electrical) 13%
Artist 5% Doctor 9%
Fashion/jewellery/shoes/handbags designers 3% Army/Navy/Airforce/Firefighter 8%
Sportsman/woman 2% Airline pilot 8%
Airline pilot 2% Police 3%
Engineer (civil, mechanical, electrical) 2% Mechanic 2%
Architect 2% Artist 2%
Lawyer (barrister/solicitor) 2% Chef 2%
Who you know
55% of respondents indicated that they personally know someone who does the job they selected, in most cases
a member of the extended family (63%) or a parent/guardian (23%). Where they did not know someone, they
most commonly heard about the job from TV/film/radio (42%) or from personal experiences/encounters (35%),
with a further 10% stating advice from parents and 8% from social media (see Figure 13 for full details).
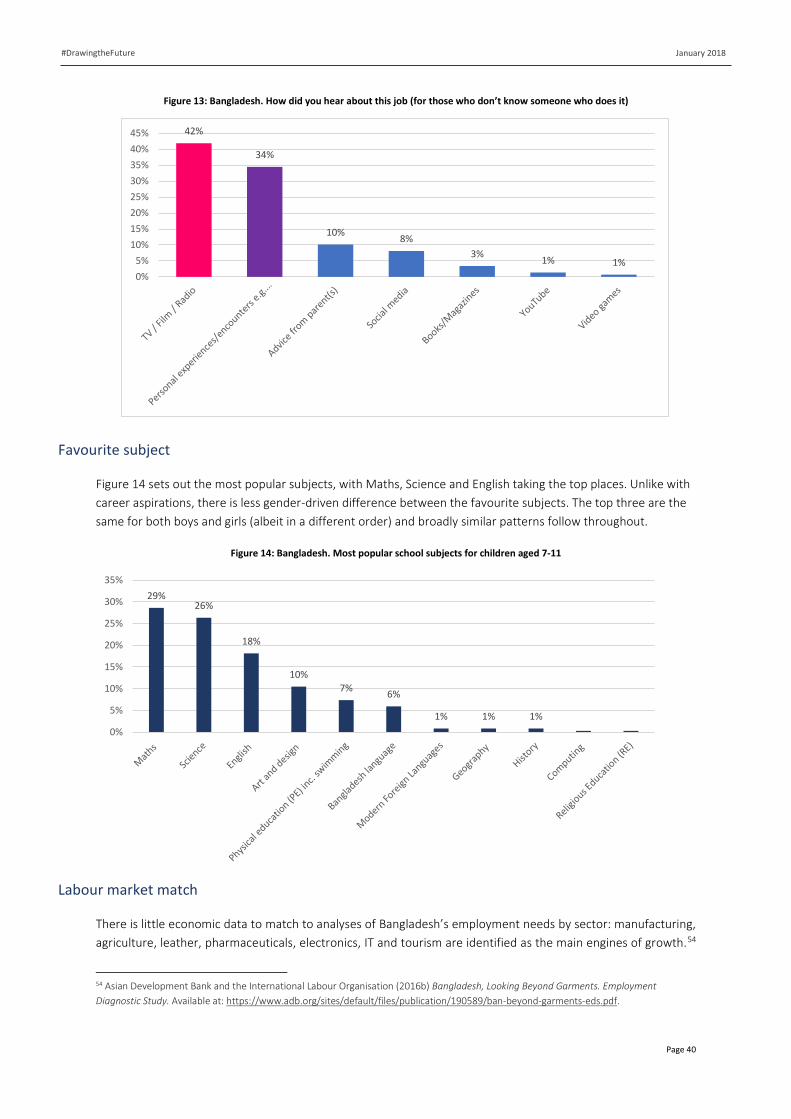
January 2018
Page 40
#DrawingtheFuture
Figure 13: Bangladesh. How did you hear about this job (for those who don’t know someone who does it)
Favourite subject
Figure 14 sets out the most popular subjects, with Maths, Science and English taking the top places. Unlike with
career aspirations, there is less gender-driven difference between the favourite subjects. The top three are the
same for both boys and girls (albeit in a different order) and broadly similar patterns follow throughout.
Figure 14: Bangladesh. Most popular school subjects for children aged 7-11
Labour market match
There is little economic data to match to analyses of Bangladesh’s employment needs by sector: manufacturing,
agriculture, leather, pharmaceuticals, electronics, IT and tourism are identified as the main engines of growth.54
54 Asian Development Bank and the International Labour Organisation (2016b) Bangladesh, Looking Beyond Garments. Employment
Diagnostic Study. Available at: https://www.adb.org/sites/default/files/publication/190589/ban-beyond-garments-eds.pdf.
42%
34%
10%8%
3%1% 1%
0%
5%
10%
15%
20%
25%
30%
35%
40%
45%
29%26%
18%
10%
7%6%
1% 1% 1%
0%
5%
10%
15%
20%
25%
30%
35%

January 2018
Page 41
#DrawingtheFuture
Engineer, mechanic and fashion (in total 5% for girls and 13% for boys) are perhaps the best fit to economic
growth drivers in the top 10 choices. Nonetheless, with scientist and doctor both being popular choices (47% for
girls and 33% for boys), it is possible that the transferable skills and underlying preferences expressed by these
could lead to satisfying employment in some of the other identified priority sectors. For instance, with appropriate
guidance and inspiration experiences it may be possible to help young people understand the alignment between
science aspirations and manufacturing or IT careers or between being a doctor and pharmaceutical careers.
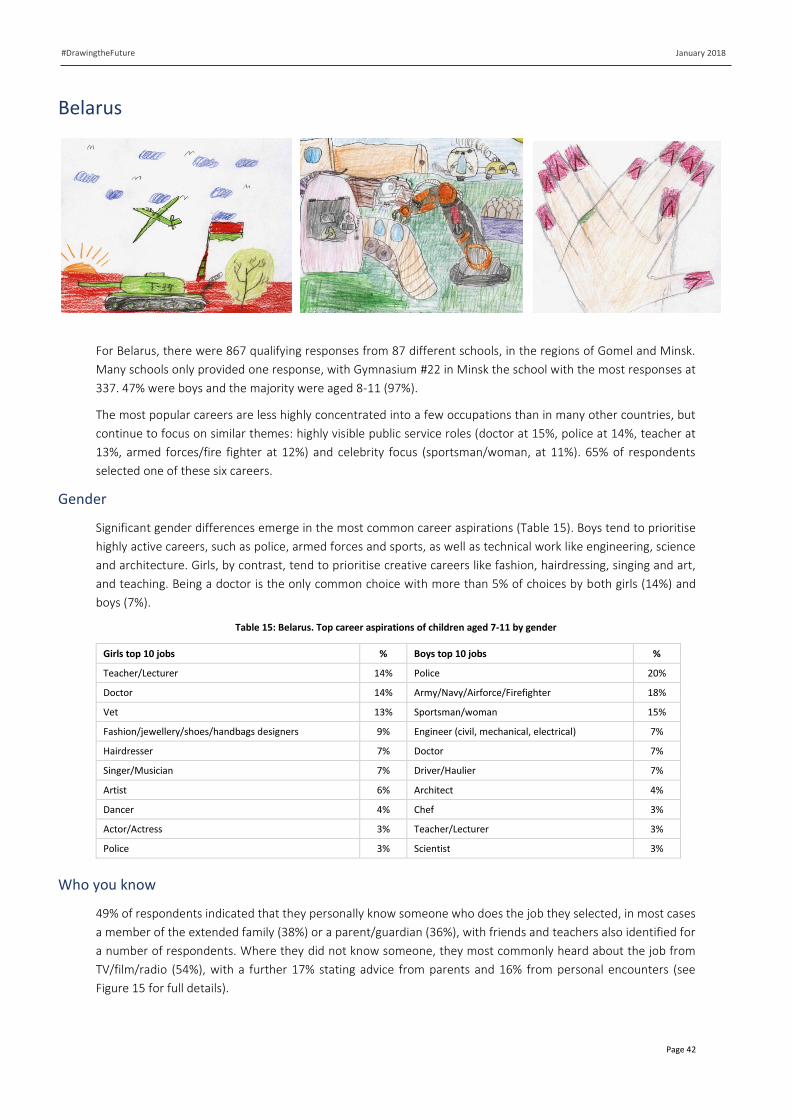
January 2018
Page 42
#DrawingtheFuture
Belarus
For Belarus, there were 867 qualifying responses from 87 different schools, in the regions of Gomel and Minsk.
Many schools only provided one response, with Gymnasium #22 in Minsk the school with the most responses at
337. 47% were boys and the majority were aged 8-11 (97%).
The most popular careers are less highly concentrated into a few occupations than in many other countries, but
continue to focus on similar themes: highly visible public service roles (doctor at 15%, police at 14%, teacher at
13%, armed forces/fire fighter at 12%) and celebrity focus (sportsman/woman, at 11%). 65% of respondents
selected one of these six careers.
Gender
Significant gender differences emerge in the most common career aspirations (Table 15). Boys tend to prioritise
highly active careers, such as police, armed forces and sports, as well as technical work like engineering, science
and architecture. Girls, by contrast, tend to prioritise creative careers like fashion, hairdressing, singing and art,
and teaching. Being a doctor is the only common choice with more than 5% of choices by both girls (14%) and
boys (7%).
Table 15: Belarus. Top career aspirations of children aged 7-11 by gender
Girls top 10 jobs % Boys top 10 jobs %
Teacher/Lecturer 14% Police 20%
Doctor 14% Army/Navy/Airforce/Firefighter 18%
Vet 13% Sportsman/woman 15%
Fashion/jewellery/shoes/handbags designers 9% Engineer (civil, mechanical, electrical) 7%
Hairdresser 7% Doctor 7%
Singer/Musician 7% Driver/Haulier 7%
Artist 6% Architect 4%
Dancer 4% Chef 3%
Actor/Actress 3% Teacher/Lecturer 3%
Police 3% Scientist 3%
Who you know
49% of respondents indicated that they personally know someone who does the job they selected, in most cases
a member of the extended family (38%) or a parent/guardian (36%), with friends and teachers also identified for
a number of respondents. Where they did not know someone, they most commonly heard about the job from
TV/film/radio (54%), with a further 17% stating advice from parents and 16% from personal encounters (see
Figure 15 for full details).
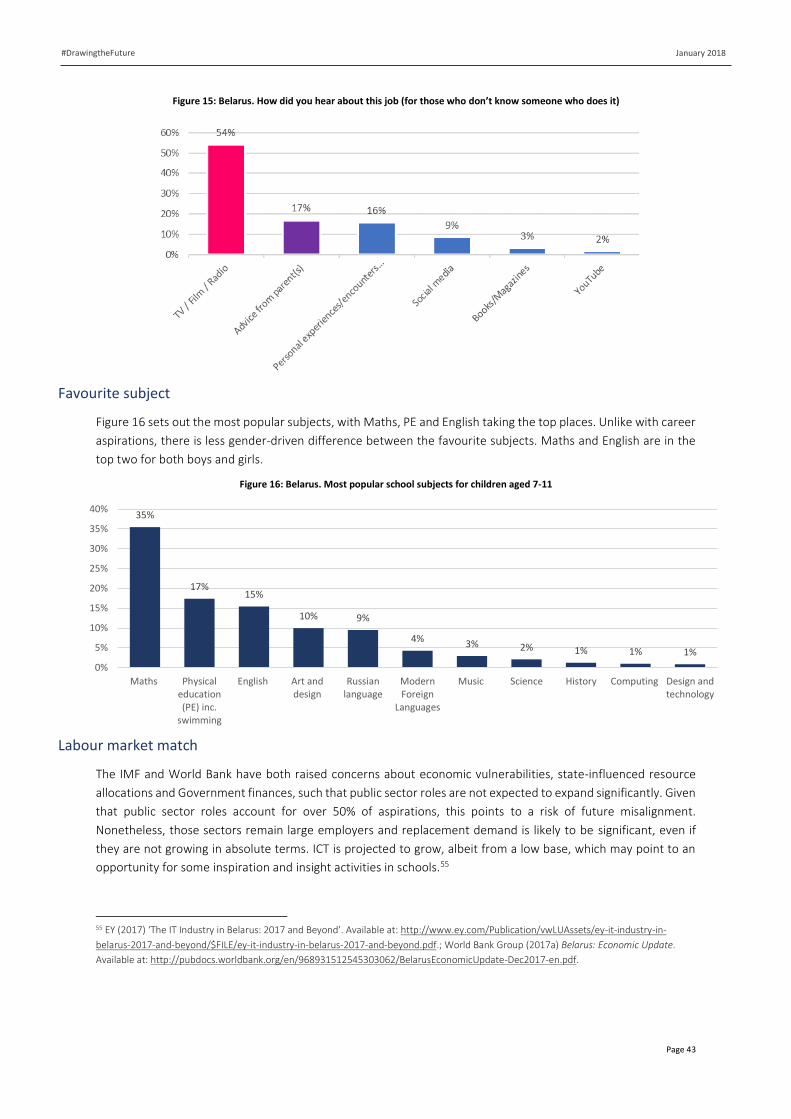
January 2018
Page 43
#DrawingtheFuture
Figure 15: Belarus. How did you hear about this job (for those who don’t know someone who does it)
Favourite subject
Figure 16 sets out the most popular subjects, with Maths, PE and English taking the top places. Unlike with career
aspirations, there is less gender-driven difference between the favourite subjects. Maths and English are in the
top two for both boys and girls.
Figure 16: Belarus. Most popular school subjects for children aged 7-11
Labour market match
The IMF and World Bank have both raised concerns about economic vulnerabilities, state-influenced resource
allocations and Government finances, such that public sector roles are not expected to expand significantly. Given
that public sector roles account for over 50% of aspirations, this points to a risk of future misalignment.
Nonetheless, those sectors remain large employers and replacement demand is likely to be significant, even if
they are not growing in absolute terms. ICT is projected to grow, albeit from a low base, which may point to an
opportunity for some inspiration and insight activities in schools.55
55 EY (2017) ‘The IT Industry in Belarus: 2017 and Beyond’. Available at: http://www.ey.com/Publication/vwLUAssets/ey-it-industry-in-
belarus-2017-and-beyond/$FILE/ey-it-industry-in-belarus-2017-and-beyond.pdf.; World Bank Group (2017a) Belarus: Economic Update.
Available at: http://pubdocs.worldbank.org/en/968931512545303062/BelarusEconomicUpdate-Dec2017-en.pdf.
35%
17%15%
10% 9%
4% 3% 2% 1% 1% 1%
0%
5%
10%
15%
20%
25%
30%
35%
40%
Maths Physicaleducation(PE) inc.
swimming
English Art anddesign
Russianlanguage
ModernForeign
Languages
Music Science History Computing Design andtechnology
January 2018
Page 44
#DrawingtheFuture
China
For China, there were 494 qualifying responses from 4 different schools, in the regions of Beijing and Yinzhou.
Dahongmen First PS in Beijing provided the most responses at 209. 29% were boys and the majority were aged
9-11 (82%), with most of the remainder aged 8.
The most popular careers are less highly concentrated into a few occupations than in many other countries, but
continue to focus on similar themes: highly visible public service roles (teacher at 28%) and a celebrity focus, in
careers where only a few achieve success but those that do typically achieve considerable acclaim and popularity
(dancer at 13%, artist at 12%, singer/musician at 9%). Technical careers, scientist and doctor, appear in places 5
and 6 with 9% and 8% respectively. 79% of respondents selected one of these six careers. Unlike many other
countries, sports only just appears in the top ten with only 3%. However, this distribution is affected by the gender
split, weighted towards girls.
Gender
Significant gender differences emerge in the most common career aspirations (Table 16). Boys tend to prioritise
highly active careers, such as police and armed forces, as well as technical work like science. Girls, by contrast,
tend to prioritise creative careers like dancing, art, fashion and music. Being a doctor and teaching are the only
common choices with more than 5% selecting them among both girls and boys.
Table 16: China. Top career aspirations of children aged 7-11 by gender
Girls top 10 jobs % Boys top 10 jobs %
Teacher/Lecturer 29% Scientist 20%
Dancer 16% Police 17%
Artist 14% Army/Navy/Airforce/Firefighter 14%
Singer/Musician 9% Teacher/Lecturer 13%
Doctor 7% Doctor 8%
Fashion/jewellery/shoes/handbags designers 7% Sportsman/woman 7%
Scientist 3% Chef 5%
Army/Navy/Airforce/Firefighter 2% Airline Pilot 4%
Nurse/Health visitor 2% Singer/Musician 4%
Actor/Actress 2% Artist 3%
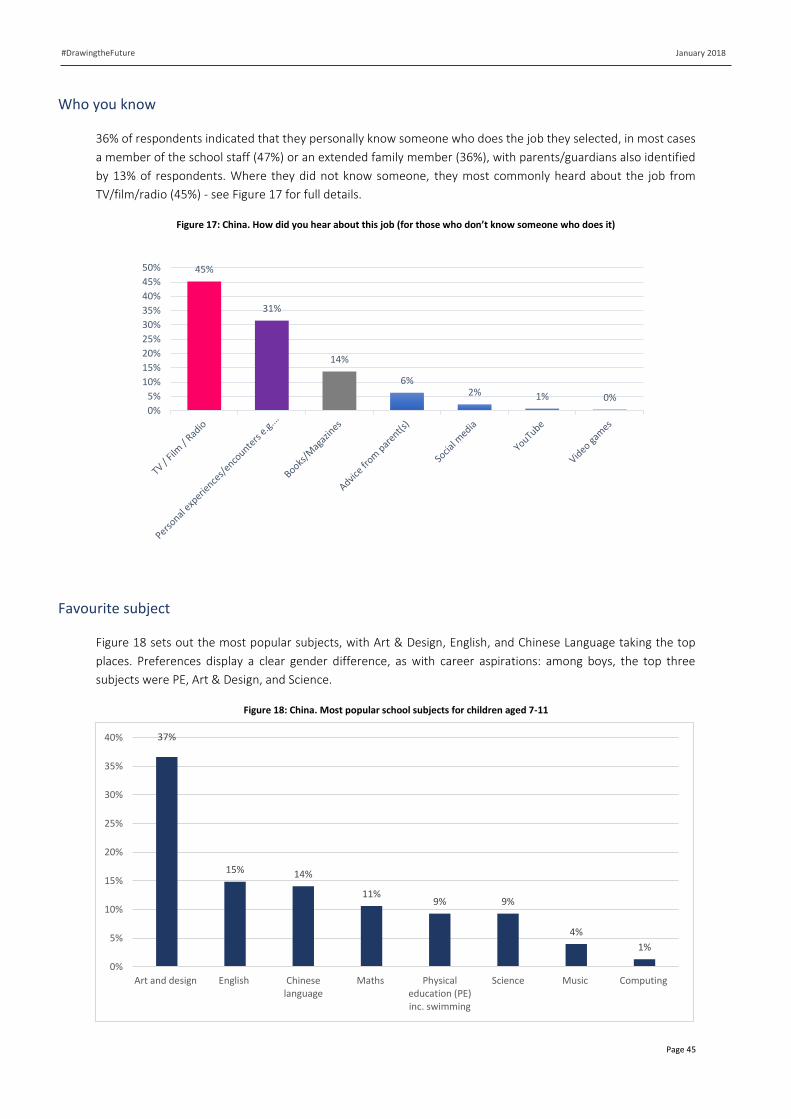
January 2018
Page 45
#DrawingtheFuture
Who you know
36% of respondents indicated that they personally know someone who does the job they selected, in most cases
a member of the school staff (47%) or an extended family member (36%), with parents/guardians also identified
by 13% of respondents. Where they did not know someone, they most commonly heard about the job from
TV/film/radio (45%) - see Figure 17 for full details.
Figure 17: China. How did you hear about this job (for those who don’t know someone who does it)
Favourite subject
Figure 18 sets out the most popular subjects, with Art & Design, English, and Chinese Language taking the top
places. Preferences display a clear gender difference, as with career aspirations: among boys, the top three
subjects were PE, Art & Design, and Science.
Figure 18: China. Most popular school subjects for children aged 7-11
45%
31%
14%
6%2% 1% 0%
0%
5%
10%
15%
20%
25%
30%
35%
40%
45%
50%
37%
15% 14%
11%9% 9%
4%
1%
0%
5%
10%
15%
20%
25%
30%
35%
40%
Art and design English Chineselanguage
Maths Physicaleducation (PE)inc. swimming
Science Music Computing
January 2018
Page 46
#DrawingtheFuture
Labour market match
The IMF estimates that employment in primary sectors, for istance agriculture and mining, will decline year on
year, while employment in services, and to a lesser extent manufacturing, will grow year on year.56 At a high level,
career aspirations are more closely aligned to the services sector, although they remain highly concentrated on a
small number of careers within the sector. Similarly, the absence of primary sectors in the top career aspirations
is broadly in line with the IMF forecasts, although primary sectors will still remain a major part of the economy,
with some replacement labour needs.
56 Lam, R., Liu, X., Schipke, A. (2015) ‘China’s Labour Market in the “New Normal”, IMF Working Paper, 1-33. Zhaopin Limited, available
at: http://zhaopin.investorroom.com/2017-07-20-China-Labor-Market-Continued-to-Improve-in-the-Second-Quarter-of-
2017#assets_43_97-3:27.
January 2018
Page 47
#DrawingtheFuture
Colombia
For Colombia, there were 266 qualifying responses from a single school, Escuela Normal Superior de Putumayo.
48% were boys and the most were aged 7-10 (81%).
The most popular careers are highly concentrated into a few occupations like in many other countries, typically
those with a celebrity focus (sportsman/woman at 22%), traditionally aspirational careers (doctor at 19% and vet
at 11%), highly visible public service roles (teacher at 12% and police at 9%). 73% of respondents selected one of
these five careers.
Gender
Significant gender differences emerge in the most common career aspirations (Table 17). Boys tend to prioritise
highly active careers, such as police, armed forces and sports, as well as technical work like engineering and
science. Girls, by contrast, tend to prioritise creative careers like fashion, hairdressing, singing and art, and
teaching. Being a doctor is the only common choice with more than 5% of choices by both girls (22%) and boys
(8%), following by police (5% and 10%).
Table 17: Colombia. Top career aspirations of children aged 7-11 by gender
Girls’ top 10 jobs % Boys’ top 10 jobs %
Doctor 22% Sportsman/woman 34%
Teacher/Lecturer 16% Army/Navy/Airforce/Firefighter 13%
Vet 15% Police 10%
Singer/Musician 8% Doctor 8%
Nurse/Health visitor 7% Scientist 6%
Police 5% Engineer (civil, mechanical, electrical) 6%
Dancer 4% Driver/Haulier 3%
Sportsman/woman 3% Artist 3%
Lawyer (barrister/solicitor) 3% Singer/Musician 3%
Engineer (civil, mechanical, electrical) 3% Vet 3%
Who you know
62% of respondents indicated that they personally know someone who does the job they selected, in most
cases a member of the extended family (42%) or a parent/guardian (21%), with friends and teachers also
identified for a number of respondents (20% and 10%). Where they did not know someone, they most
commonly heard about the job from TV/film/radio (46%) - see Figure 19 for full details.
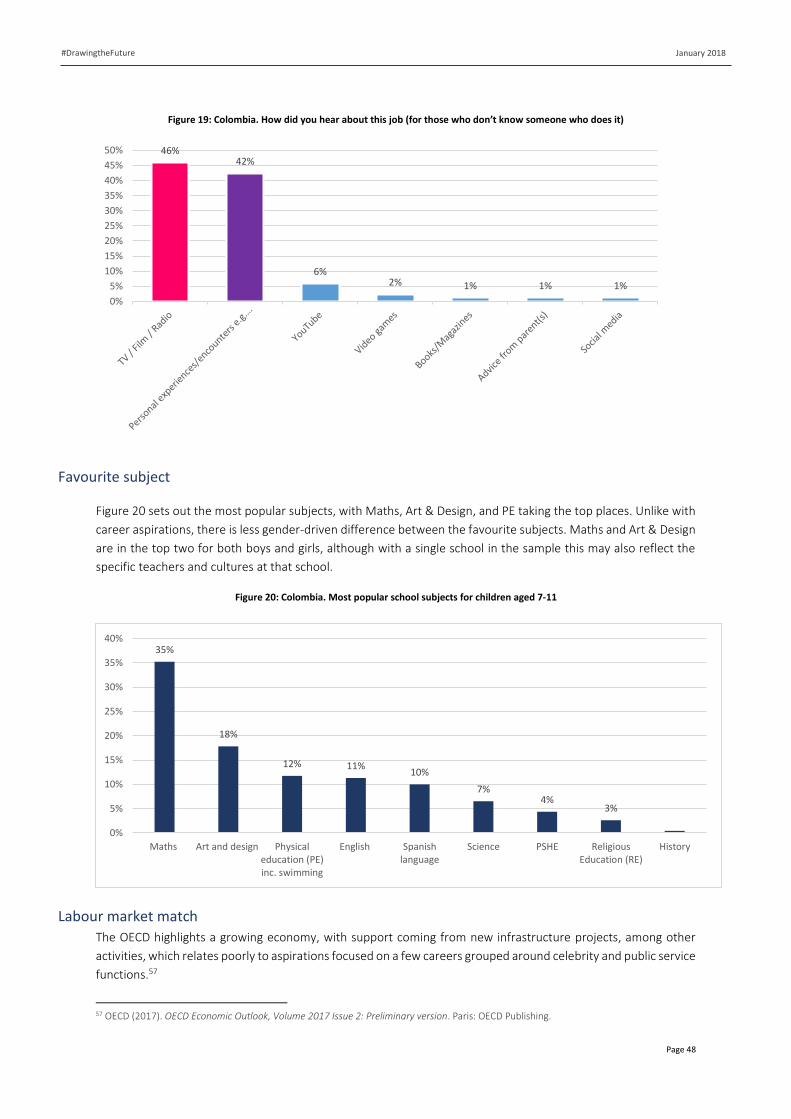
January 2018
Page 48
#DrawingtheFuture
Figure 19: Colombia. How did you hear about this job (for those who don’t know someone who does it)
Favourite subject
Figure 20 sets out the most popular subjects, with Maths, Art & Design, and PE taking the top places. Unlike with
career aspirations, there is less gender-driven difference between the favourite subjects. Maths and Art & Design
are in the top two for both boys and girls, although with a single school in the sample this may also reflect the
specific teachers and cultures at that school.
Figure 20: Colombia. Most popular school subjects for children aged 7-11
Labour market match
The OECD highlights a growing economy, with support coming from new infrastructure projects, among other
activities, which relates poorly to aspirations focused on a few careers grouped around celebrity and public service
functions.57
57 OECD (2017). OECD Economic Outlook, Volume 2017 Issue 2: Preliminary version. Paris: OECD Publishing.
46%42%
6%2% 1% 1% 1%
0%
5%
10%
15%
20%
25%
30%
35%
40%
45%
50%
35%
18%
12% 11%10%
7%4%
3%
0%
5%
10%
15%
20%
25%
30%
35%
40%
Maths Art and design Physicaleducation (PE)inc. swimming
English Spanishlanguage
Science PSHE ReligiousEducation (RE)
History
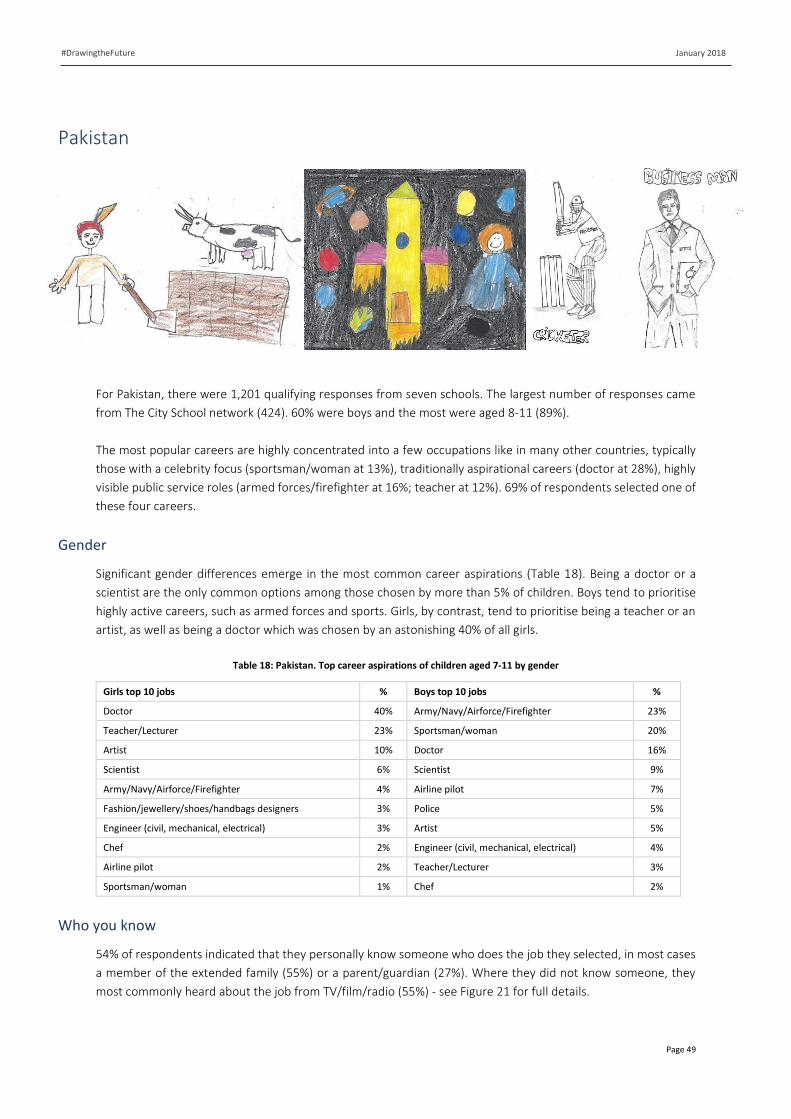
January 2018
Page 49
#DrawingtheFuture
Pakistan
For Pakistan, there were 1,201 qualifying responses from seven schools. The largest number of responses came
from The City School network (424). 60% were boys and the most were aged 8-11 (89%).
The most popular careers are highly concentrated into a few occupations like in many other countries, typically
those with a celebrity focus (sportsman/woman at 13%), traditionally aspirational careers (doctor at 28%), highly
visible public service roles (armed forces/firefighter at 16%; teacher at 12%). 69% of respondents selected one of
these four careers.
Gender
Significant gender differences emerge in the most common career aspirations (Table 18). Being a doctor or a
scientist are the only common options among those chosen by more than 5% of children. Boys tend to prioritise
highly active careers, such as armed forces and sports. Girls, by contrast, tend to prioritise being a teacher or an
artist, as well as being a doctor which was chosen by an astonishing 40% of all girls.
Table 18: Pakistan. Top career aspirations of children aged 7-11 by gender
Girls top 10 jobs % Boys top 10 jobs %
Doctor 40% Army/Navy/Airforce/Firefighter 23%
Teacher/Lecturer 23% Sportsman/woman 20%
Artist 10% Doctor 16%
Scientist 6% Scientist 9%
Army/Navy/Airforce/Firefighter 4% Airline pilot 7%
Fashion/jewellery/shoes/handbags designers 3% Police 5%
Engineer (civil, mechanical, electrical) 3% Artist 5%
Chef 2% Engineer (civil, mechanical, electrical) 4%
Airline pilot 2% Teacher/Lecturer 3%
Sportsman/woman 1% Chef 2%
Who you know
54% of respondents indicated that they personally know someone who does the job they selected, in most cases
a member of the extended family (55%) or a parent/guardian (27%). Where they did not know someone, they
most commonly heard about the job from TV/film/radio (55%) - see Figure 21 for full details.
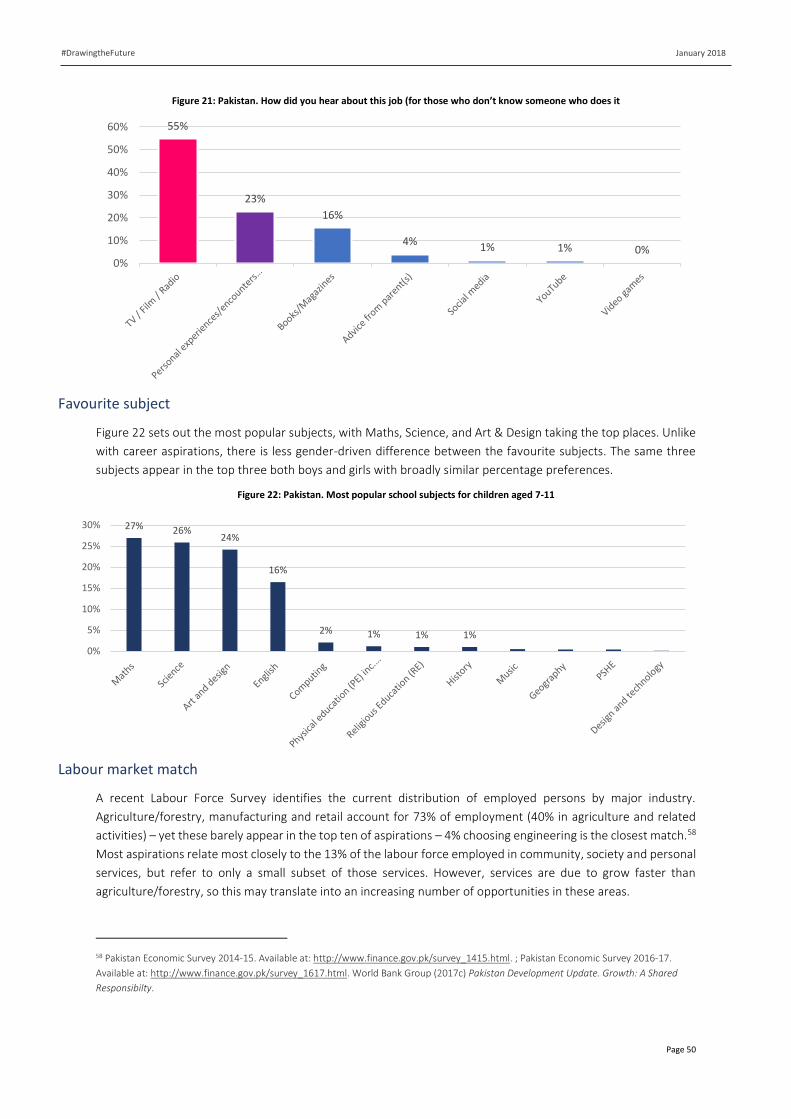
January 2018
Page 50
#DrawingtheFuture
Figure 21: Pakistan. How did you hear about this job (for those who don’t know someone who does it
Favourite subject
Figure 22 sets out the most popular subjects, with Maths, Science, and Art & Design taking the top places. Unlike
with career aspirations, there is less gender-driven difference between the favourite subjects. The same three
subjects appear in the top three both boys and girls with broadly similar percentage preferences.
Figure 22: Pakistan. Most popular school subjects for children aged 7-11
Labour market match
A recent Labour Force Survey identifies the current distribution of employed persons by major industry.
Agriculture/forestry, manufacturing and retail account for 73% of employment (40% in agriculture and related
activities) – yet these barely appear in the top ten of aspirations – 4% choosing engineering is the closest match.58
Most aspirations relate most closely to the 13% of the labour force employed in community, society and personal
services, but refer to only a small subset of those services. However, services are due to grow faster than
agriculture/forestry, so this may translate into an increasing number of opportunities in these areas.
58 Pakistan Economic Survey 2014-15. Available at: http://www.finance.gov.pk/survey_1415.html. ; Pakistan Economic Survey 2016-17.
Available at: http://www.finance.gov.pk/survey_1617.html. World Bank Group (2017c) Pakistan Development Update. Growth: A Shared
Responsibilty.
55%
23%
16%
4% 1% 1% 0%0%
10%
20%
30%
40%
50%
60%
27% 26%24%
16%
2% 1% 1% 1%
0%
5%
10%
15%
20%
25%
30%
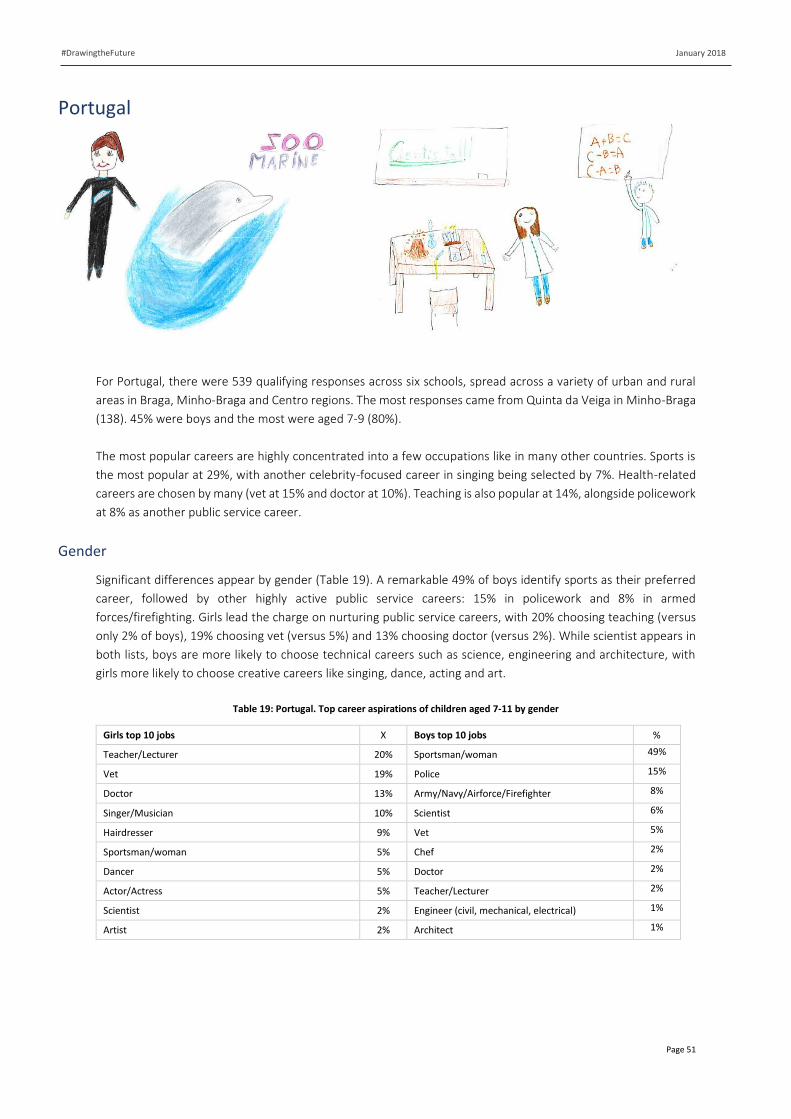
January 2018
Page 51
#DrawingtheFuture
Portugal
For Portugal, there were 539 qualifying responses across six schools, spread across a variety of urban and rural
areas in Braga, Minho-Braga and Centro regions. The most responses came from Quinta da Veiga in Minho-Braga
(138). 45% were boys and the most were aged 7-9 (80%).
The most popular careers are highly concentrated into a few occupations like in many other countries. Sports is
the most popular at 29%, with another celebrity-focused career in singing being selected by 7%. Health-related
careers are chosen by many (vet at 15% and doctor at 10%). Teaching is also popular at 14%, alongside policework
at 8% as another public service career.
Gender
Significant differences appear by gender (Table 19). A remarkable 49% of boys identify sports as their preferred
career, followed by other highly active public service careers: 15% in policework and 8% in armed
forces/firefighting. Girls lead the charge on nurturing public service careers, with 20% choosing teaching (versus
only 2% of boys), 19% choosing vet (versus 5%) and 13% choosing doctor (versus 2%). While scientist appears in
both lists, boys are more likely to choose technical careers such as science, engineering and architecture, with
girls more likely to choose creative careers like singing, dance, acting and art.
Table 19: Portugal. Top career aspirations of children aged 7-11 by gender
Girls top 10 jobs X Boys top 10 jobs %
Teacher/Lecturer 20% Sportsman/woman 49%
Vet 19% Police 15%
Doctor 13% Army/Navy/Airforce/Firefighter 8%
Singer/Musician 10% Scientist 6%
Hairdresser 9% Vet 5%
Sportsman/woman 5% Chef 2%
Dancer 5% Doctor 2%
Actor/Actress 5% Teacher/Lecturer 2%
Scientist 2% Engineer (civil, mechanical, electrical) 1%
Artist 2% Architect 1%
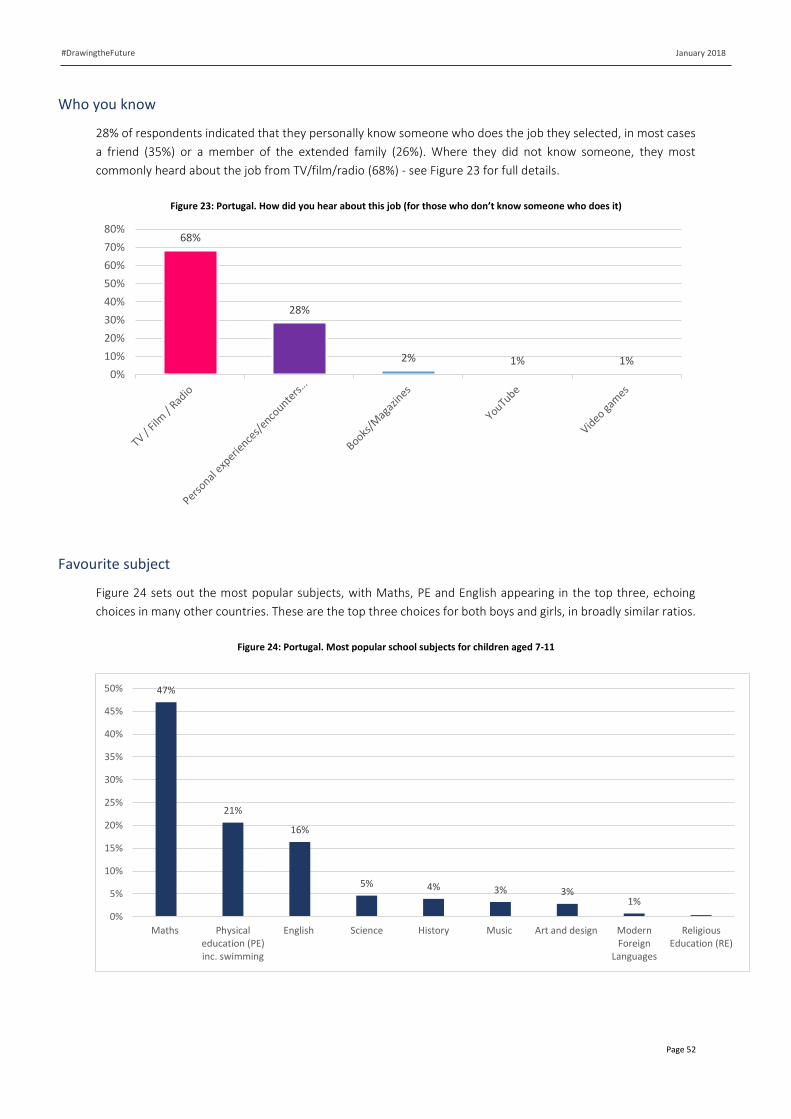
January 2018
Page 52
#DrawingtheFuture
Who you know
28% of respondents indicated that they personally know someone who does the job they selected, in most cases
a friend (35%) or a member of the extended family (26%). Where they did not know someone, they most
commonly heard about the job from TV/film/radio (68%) - see Figure 23 for full details.
Figure 23: Portugal. How did you hear about this job (for those who don’t know someone who does it)
Favourite subject
Figure 24 sets out the most popular subjects, with Maths, PE and English appearing in the top three, echoing
choices in many other countries. These are the top three choices for both boys and girls, in broadly similar ratios.
Figure 24: Portugal. Most popular school subjects for children aged 7-11
68%
28%
2% 1% 1%0%
10%
20%
30%
40%
50%
60%
70%
80%
47%
21%
16%
5% 4% 3% 3%1%
0%
5%
10%
15%
20%
25%
30%
35%
40%
45%
50%
Maths Physicaleducation (PE)inc. swimming
English Science History Music Art and design ModernForeign
Languages
ReligiousEducation (RE)
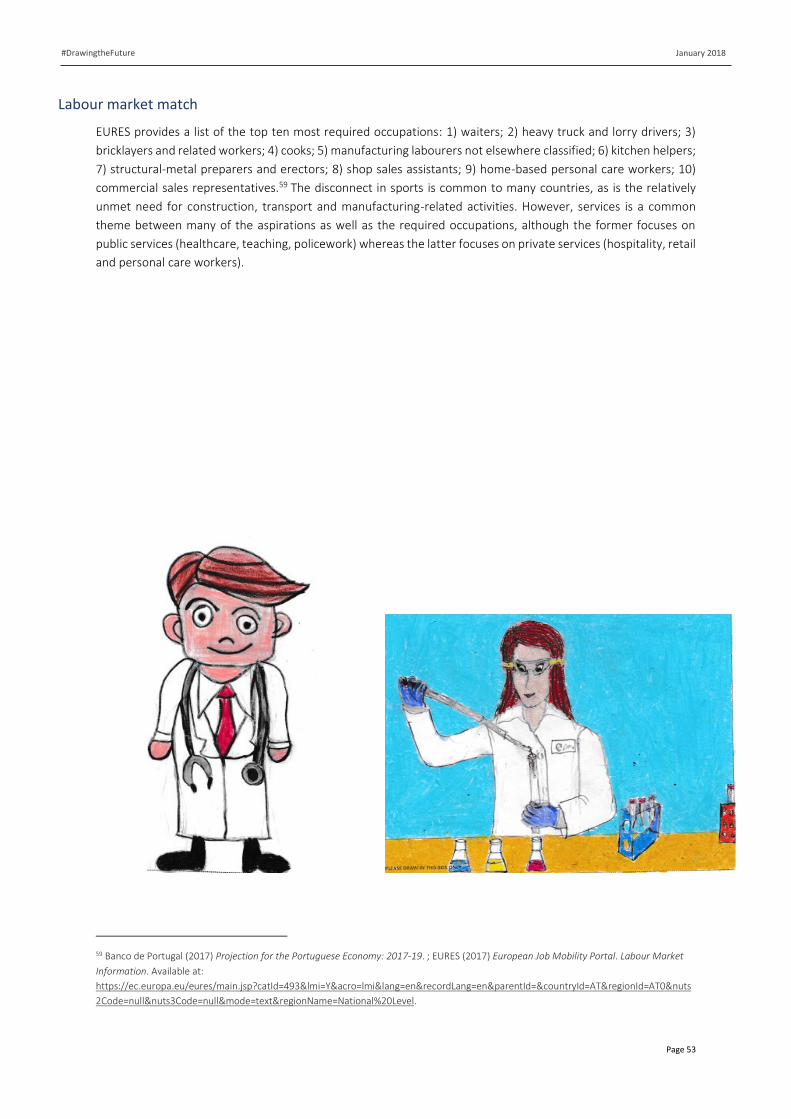
January 2018
Page 53
#DrawingtheFuture
Labour market match
EURES provides a list of the top ten most required occupations: 1) waiters; 2) heavy truck and lorry drivers; 3)
bricklayers and related workers; 4) cooks; 5) manufacturing labourers not elsewhere classified; 6) kitchen helpers;
7) structural-metal preparers and erectors; 8) shop sales assistants; 9) home-based personal care workers; 10)
commercial sales representatives.59 The disconnect in sports is common to many countries, as is the relatively
unmet need for construction, transport and manufacturing-related activities. However, services is a common
theme between many of the aspirations as well as the required occupations, although the former focuses on
public services (healthcare, teaching, policework) whereas the latter focuses on private services (hospitality, retail
and personal care workers).
59 Banco de Portugal (2017) Projection for the Portuguese Economy: 2017-19. ; EURES (2017) European Job Mobility Portal. Labour Market
Information. Available at:
https://ec.europa.eu/eures/main.jsp?catId=493&lmi=Y&acro=lmi&lang=en&recordLang=en&parentId=&countryId=AT®ionId=AT0&nuts
2Code=null&nuts3Code=null&mode=text®ionName=National%20Level.
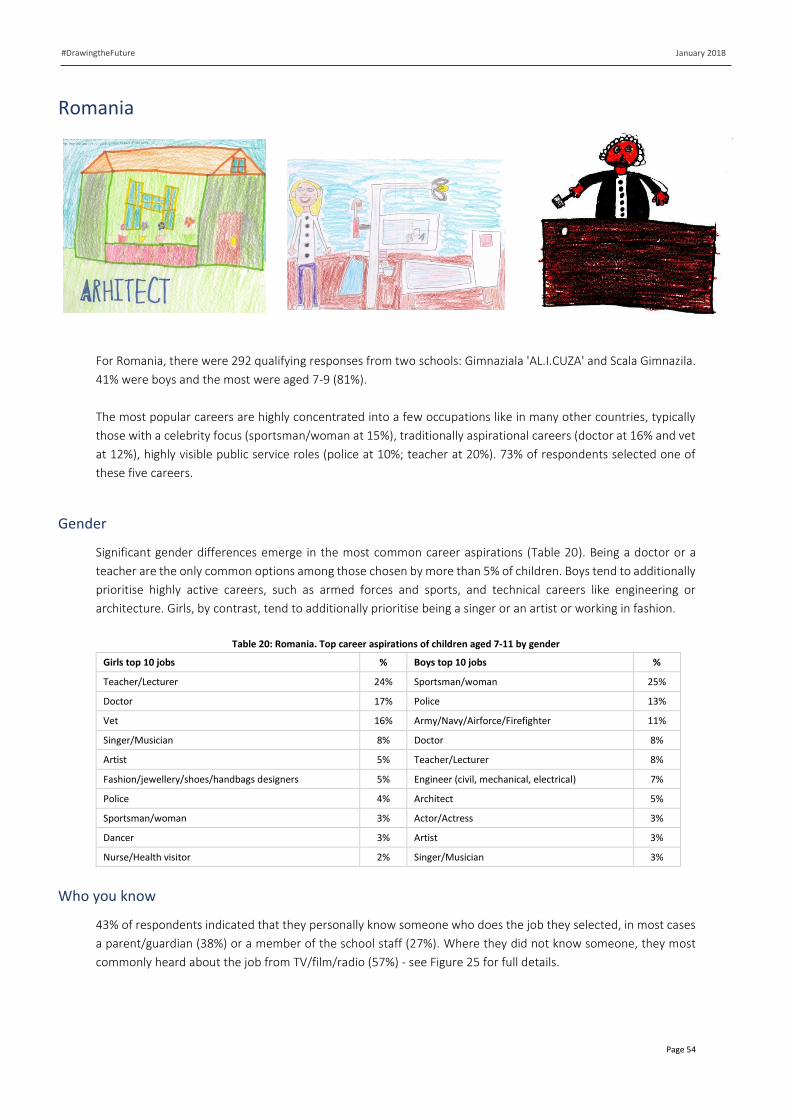
January 2018
Page 54
#DrawingtheFuture
Romania
For Romania, there were 292 qualifying responses from two schools: Gimnaziala 'AL.I.CUZA' and Scala Gimnazila.
41% were boys and the most were aged 7-9 (81%).
The most popular careers are highly concentrated into a few occupations like in many other countries, typically
those with a celebrity focus (sportsman/woman at 15%), traditionally aspirational careers (doctor at 16% and vet
at 12%), highly visible public service roles (police at 10%; teacher at 20%). 73% of respondents selected one of
these five careers.
Gender
Significant gender differences emerge in the most common career aspirations (Table 20). Being a doctor or a
teacher are the only common options among those chosen by more than 5% of children. Boys tend to additionally
prioritise highly active careers, such as armed forces and sports, and technical careers like engineering or
architecture. Girls, by contrast, tend to additionally prioritise being a singer or an artist or working in fashion.
Table 20: Romania. Top career aspirations of children aged 7-11 by gender
Girls top 10 jobs % Boys top 10 jobs %
Teacher/Lecturer 24% Sportsman/woman 25%
Doctor 17% Police 13%
Vet 16% Army/Navy/Airforce/Firefighter 11%
Singer/Musician 8% Doctor 8%
Artist 5% Teacher/Lecturer 8%
Fashion/jewellery/shoes/handbags designers 5% Engineer (civil, mechanical, electrical) 7%
Police 4% Architect 5%
Sportsman/woman 3% Actor/Actress 3%
Dancer 3% Artist 3%
Nurse/Health visitor 2% Singer/Musician 3%
Who you know
43% of respondents indicated that they personally know someone who does the job they selected, in most cases
a parent/guardian (38%) or a member of the school staff (27%). Where they did not know someone, they most
commonly heard about the job from TV/film/radio (57%) - see Figure 25 for full details.
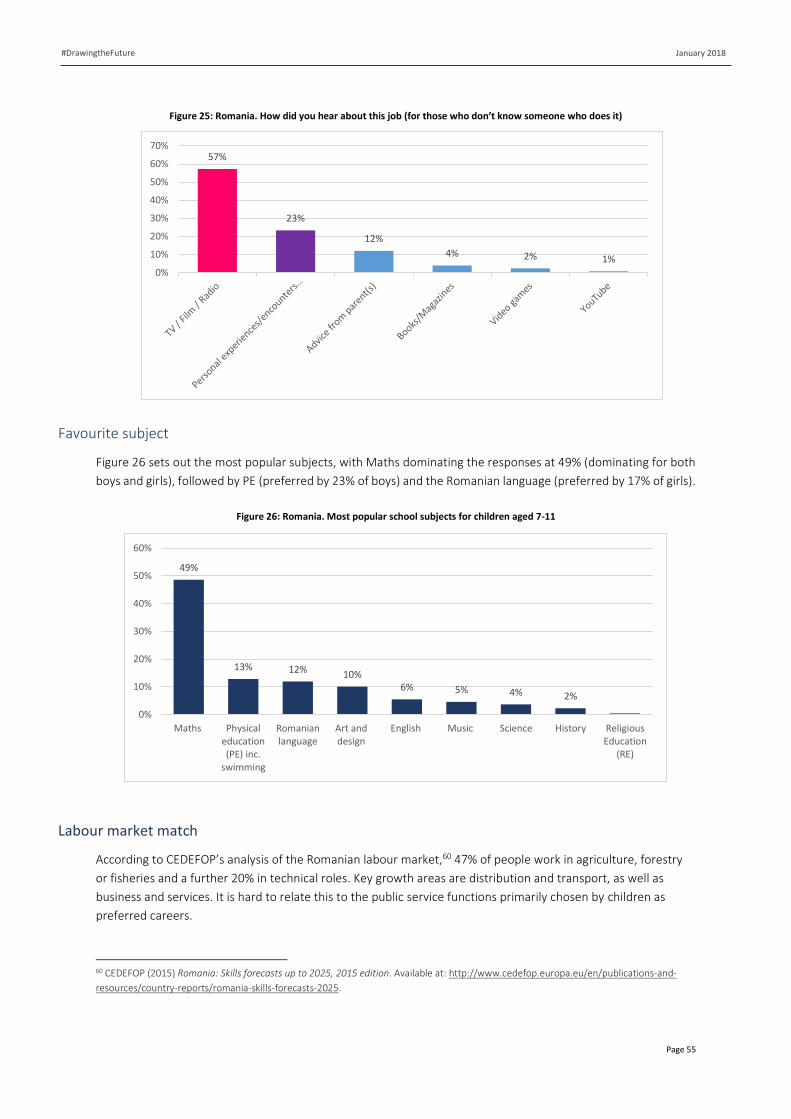
January 2018
Page 55
#DrawingtheFuture
Figure 25: Romania. How did you hear about this job (for those who don’t know someone who does it)
Favourite subject
Figure 26 sets out the most popular subjects, with Maths dominating the responses at 49% (dominating for both
boys and girls), followed by PE (preferred by 23% of boys) and the Romanian language (preferred by 17% of girls).
Figure 26: Romania. Most popular school subjects for children aged 7-11
Labour market match
According to CEDEFOP’s analysis of the Romanian labour market,60 47% of people work in agriculture, forestry
or fisheries and a further 20% in technical roles. Key growth areas are distribution and transport, as well as
business and services. It is hard to relate this to the public service functions primarily chosen by children as
preferred careers.
60 CEDEFOP (2015) Romania: Skills forecasts up to 2025, 2015 edition. Available at: http://www.cedefop.europa.eu/en/publications-and-
resources/country-reports/romania-skills-forecasts-2025.
57%
23%
12%
4% 2% 1%
0%
10%
20%
30%
40%
50%
60%
70%
49%
13% 12% 10%6% 5% 4% 2%
0%
10%
20%
30%
40%
50%
60%
Maths Physicaleducation(PE) inc.
swimming
Romanianlanguage
Art anddesign
English Music Science History ReligiousEducation
(RE)
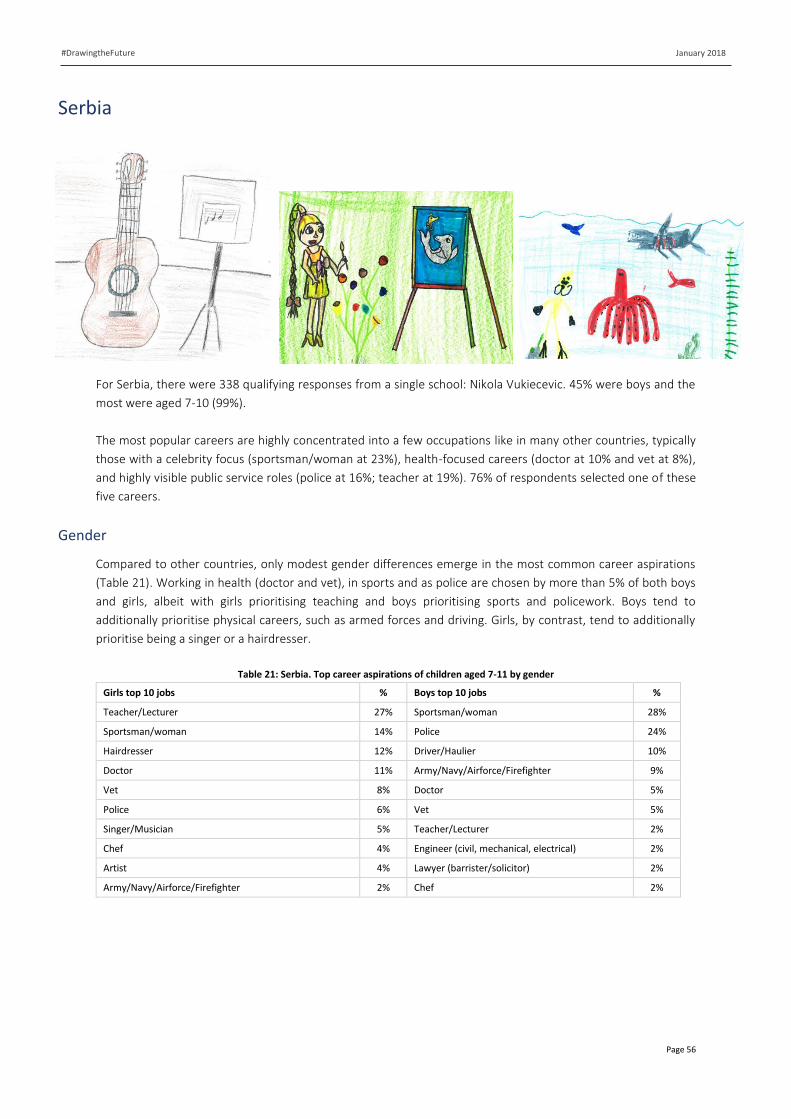
January 2018
Page 56
#DrawingtheFuture
Serbia
For Serbia, there were 338 qualifying responses from a single school: Nikola Vukiecevic. 45% were boys and the
most were aged 7-10 (99%).
The most popular careers are highly concentrated into a few occupations like in many other countries, typically
those with a celebrity focus (sportsman/woman at 23%), health-focused careers (doctor at 10% and vet at 8%),
and highly visible public service roles (police at 16%; teacher at 19%). 76% of respondents selected one of these
five careers.
Gender
Compared to other countries, only modest gender differences emerge in the most common career aspirations
(Table 21). Working in health (doctor and vet), in sports and as police are chosen by more than 5% of both boys
and girls, albeit with girls prioritising teaching and boys prioritising sports and policework. Boys tend to
additionally prioritise physical careers, such as armed forces and driving. Girls, by contrast, tend to additionally
prioritise being a singer or a hairdresser.
Table 21: Serbia. Top career aspirations of children aged 7-11 by gender
Girls top 10 jobs % Boys top 10 jobs %
Teacher/Lecturer 27% Sportsman/woman 28%
Sportsman/woman 14% Police 24%
Hairdresser 12% Driver/Haulier 10%
Doctor 11% Army/Navy/Airforce/Firefighter 9%
Vet 8% Doctor 5%
Police 6% Vet 5%
Singer/Musician 5% Teacher/Lecturer 2%
Chef 4% Engineer (civil, mechanical, electrical) 2%
Artist 4% Lawyer (barrister/solicitor) 2%
Army/Navy/Airforce/Firefighter 2% Chef 2%
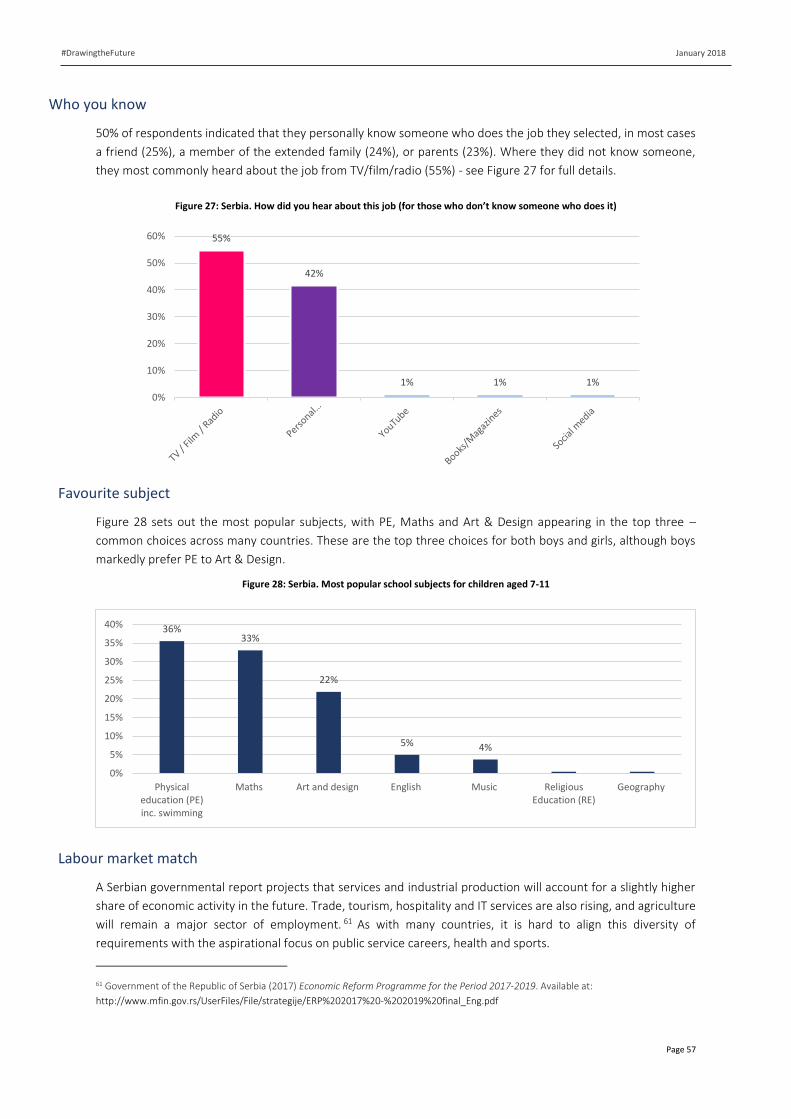
January 2018
Page 57
#DrawingtheFuture
Who you know
50% of respondents indicated that they personally know someone who does the job they selected, in most cases
a friend (25%), a member of the extended family (24%), or parents (23%). Where they did not know someone,
they most commonly heard about the job from TV/film/radio (55%) - see Figure 27 for full details.
Figure 27: Serbia. How did you hear about this job (for those who don’t know someone who does it)
Favourite subject
Figure 28 sets out the most popular subjects, with PE, Maths and Art & Design appearing in the top three –
common choices across many countries. These are the top three choices for both boys and girls, although boys
markedly prefer PE to Art & Design.
Figure 28: Serbia. Most popular school subjects for children aged 7-11
Labour market match
A Serbian governmental report projects that services and industrial production will account for a slightly higher
share of economic activity in the future. Trade, tourism, hospitality and IT services are also rising, and agriculture
will remain a major sector of employment. 61 As with many countries, it is hard to align this diversity of
requirements with the aspirational focus on public service careers, health and sports.
61 Government of the Republic of Serbia (2017) Economic Reform Programme for the Period 2017-2019. Available at:
http://www.mfin.gov.rs/UserFiles/File/strategije/ERP%202017%20-%202019%20final_Eng.pdf
55%
42%
1% 1% 1%
0%
10%
20%
30%
40%
50%
60%
36%33%
22%
5% 4%
0%
5%
10%
15%
20%
25%
30%
35%
40%
Physicaleducation (PE)inc. swimming
Maths Art and design English Music ReligiousEducation (RE)
Geography
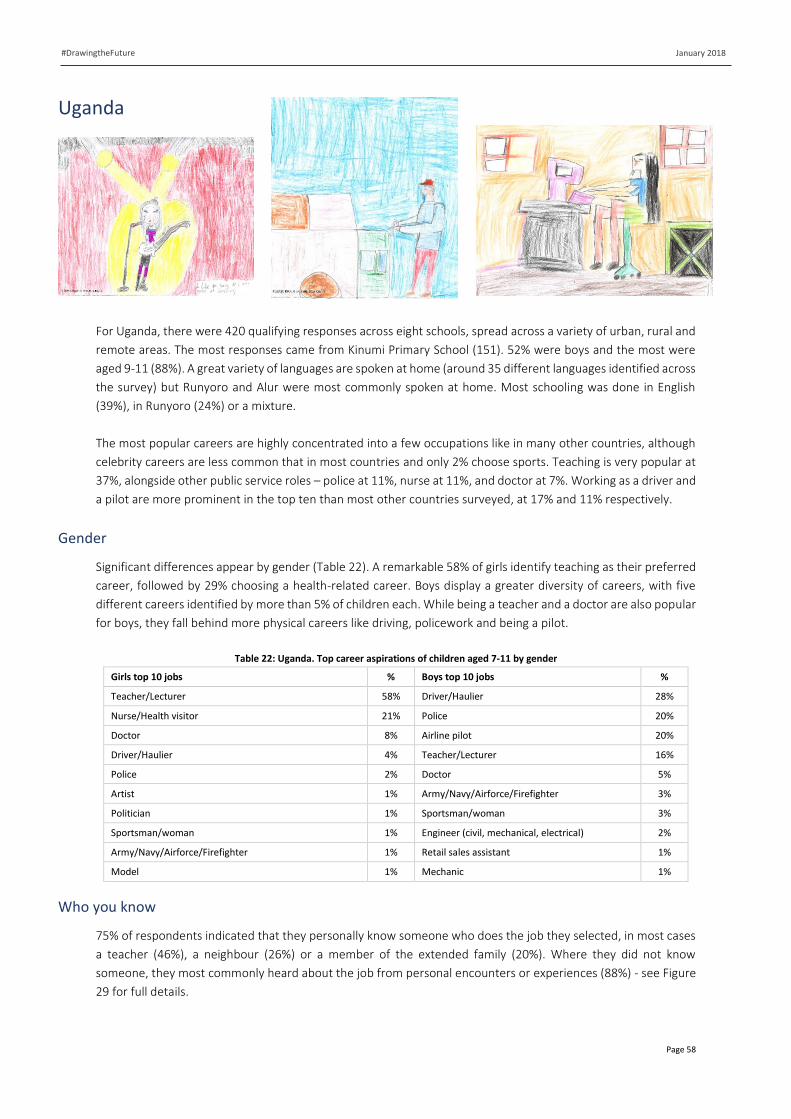
January 2018
Page 58
#DrawingtheFuture
Uganda
For Uganda, there were 420 qualifying responses across eight schools, spread across a variety of urban, rural and
remote areas. The most responses came from Kinumi Primary School (151). 52% were boys and the most were
aged 9-11 (88%). A great variety of languages are spoken at home (around 35 different languages identified across
the survey) but Runyoro and Alur were most commonly spoken at home. Most schooling was done in English
(39%), in Runyoro (24%) or a mixture.
The most popular careers are highly concentrated into a few occupations like in many other countries, although
celebrity careers are less common that in most countries and only 2% choose sports. Teaching is very popular at
37%, alongside other public service roles – police at 11%, nurse at 11%, and doctor at 7%. Working as a driver and
a pilot are more prominent in the top ten than most other countries surveyed, at 17% and 11% respectively.
Gender
Significant differences appear by gender (Table 22). A remarkable 58% of girls identify teaching as their preferred
career, followed by 29% choosing a health-related career. Boys display a greater diversity of careers, with five
different careers identified by more than 5% of children each. While being a teacher and a doctor are also popular
for boys, they fall behind more physical careers like driving, policework and being a pilot.
Table 22: Uganda. Top career aspirations of children aged 7-11 by gender
Girls top 10 jobs % Boys top 10 jobs %
Teacher/Lecturer 58% Driver/Haulier 28%
Nurse/Health visitor 21% Police 20%
Doctor 8% Airline pilot 20%
Driver/Haulier 4% Teacher/Lecturer 16%
Police 2% Doctor 5%
Artist 1% Army/Navy/Airforce/Firefighter 3%
Politician 1% Sportsman/woman 3%
Sportsman/woman 1% Engineer (civil, mechanical, electrical) 2%
Army/Navy/Airforce/Firefighter 1% Retail sales assistant 1%
Model 1% Mechanic 1%
Who you know
75% of respondents indicated that they personally know someone who does the job they selected, in most cases
a teacher (46%), a neighbour (26%) or a member of the extended family (20%). Where they did not know
someone, they most commonly heard about the job from personal encounters or experiences (88%) - see Figure
29 for full details.
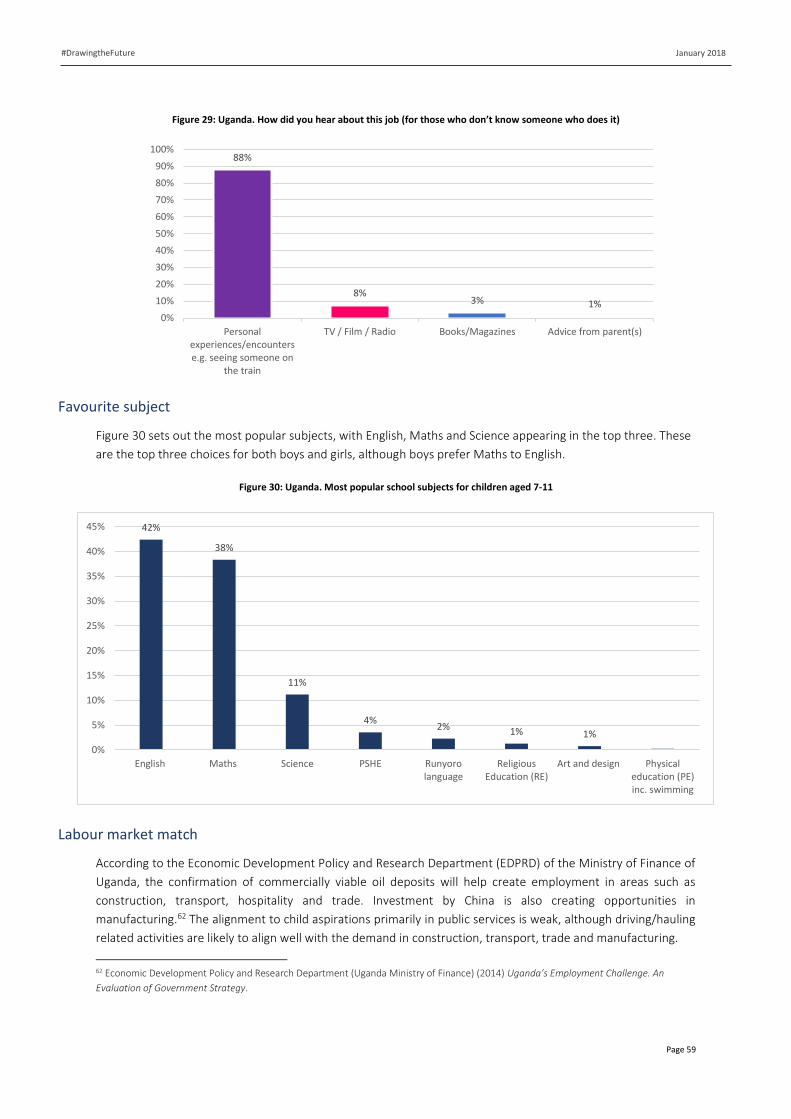
January 2018
Page 59
#DrawingtheFuture
Figure 29: Uganda. How did you hear about this job (for those who don’t know someone who does it)
Favourite subject
Figure 30 sets out the most popular subjects, with English, Maths and Science appearing in the top three. These
are the top three choices for both boys and girls, although boys prefer Maths to English.
Figure 30: Uganda. Most popular school subjects for children aged 7-11
Labour market match
According to the Economic Development Policy and Research Department (EDPRD) of the Ministry of Finance of
Uganda, the confirmation of commercially viable oil deposits will help create employment in areas such as
construction, transport, hospitality and trade. Investment by China is also creating opportunities in
manufacturing.62 The alignment to child aspirations primarily in public services is weak, although driving/hauling
related activities are likely to align well with the demand in construction, transport, trade and manufacturing.
62 Economic Development Policy and Research Department (Uganda Ministry of Finance) (2014) Uganda’s Employment Challenge. An
Evaluation of Government Strategy.
88%
8%3% 1%
0%
10%
20%
30%
40%
50%
60%
70%
80%
90%
100%
Personalexperiences/encounterse.g. seeing someone on
the train
TV / Film / Radio Books/Magazines Advice from parent(s)
42%
38%
11%
4%2% 1% 1%
0%
5%
10%
15%
20%
25%
30%
35%
40%
45%
English Maths Science PSHE Runyorolanguage
ReligiousEducation (RE)
Art and design Physicaleducation (PE)inc. swimming
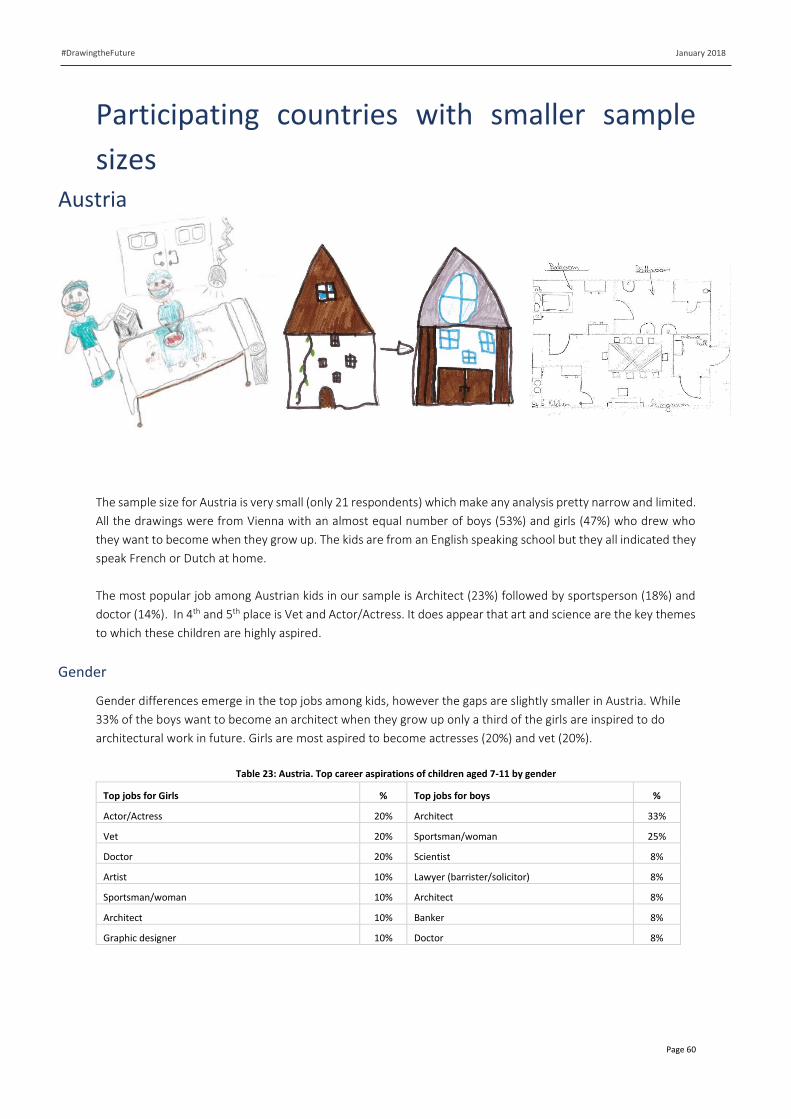
January 2018
Page 60
#DrawingtheFuture
Participating countries with smaller sample
sizes
Austria
The sample size for Austria is very small (only 21 respondents) which make any analysis pretty narrow and limited.
All the drawings were from Vienna with an almost equal number of boys (53%) and girls (47%) who drew who
they want to become when they grow up. The kids are from an English speaking school but they all indicated they
speak French or Dutch at home.
The most popular job among Austrian kids in our sample is Architect (23%) followed by sportsperson (18%) and
doctor (14%). In 4th and 5th place is Vet and Actor/Actress. It does appear that art and science are the key themes
to which these children are highly aspired.
Gender
Gender differences emerge in the top jobs among kids, however the gaps are slightly smaller in Austria. While
33% of the boys want to become an architect when they grow up only a third of the girls are inspired to do
architectural work in future. Girls are most aspired to become actresses (20%) and vet (20%).
Table 23: Austria. Top career aspirations of children aged 7-11 by gender
Top jobs for Girls % Top jobs for boys %
Actor/Actress 20% Architect 33%
Vet 20% Sportsman/woman 25%
Doctor 20% Scientist 8%
Artist 10% Lawyer (barrister/solicitor) 8%
Sportsman/woman 10% Architect 8%
Architect 10% Banker 8%
Graphic designer 10% Doctor 8%
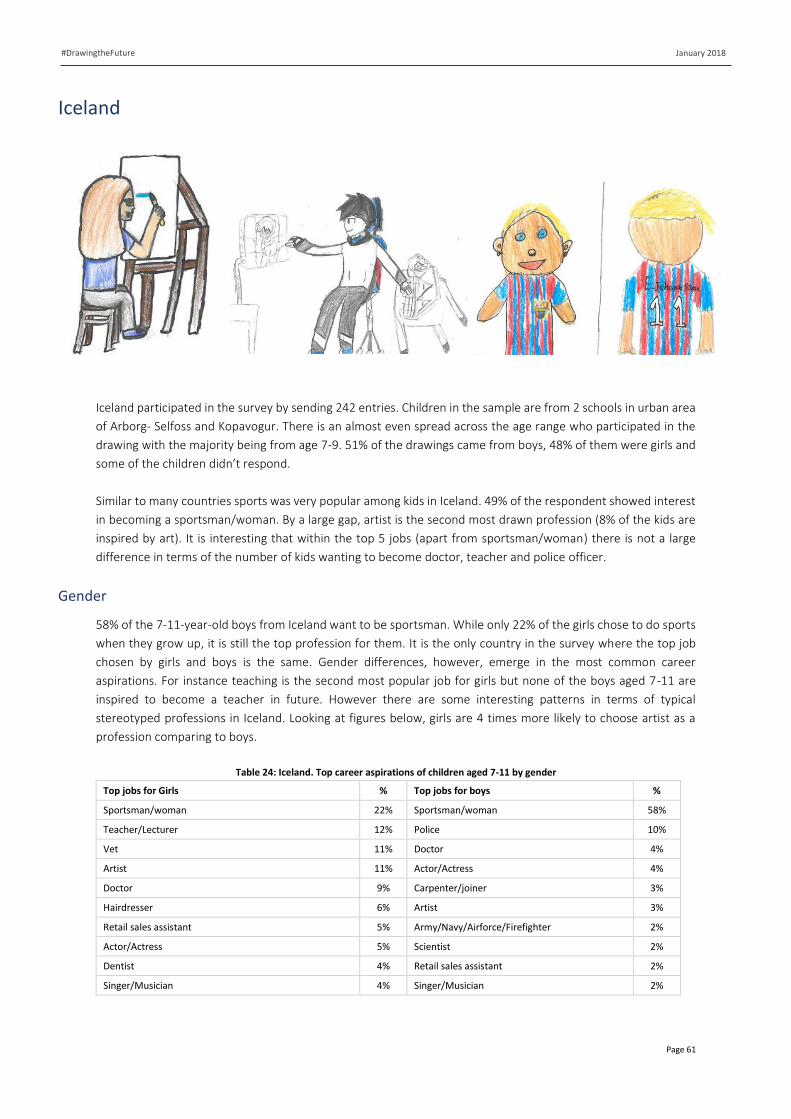
January 2018
Page 61
#DrawingtheFuture
Iceland
Iceland participated in the survey by sending 242 entries. Children in the sample are from 2 schools in urban area
of Arborg- Selfoss and Kopavogur. There is an almost even spread across the age range who participated in the
drawing with the majority being from age 7-9. 51% of the drawings came from boys, 48% of them were girls and
some of the children didn’t respond.
Similar to many countries sports was very popular among kids in Iceland. 49% of the respondent showed interest
in becoming a sportsman/woman. By a large gap, artist is the second most drawn profession (8% of the kids are
inspired by art). It is interesting that within the top 5 jobs (apart from sportsman/woman) there is not a large
difference in terms of the number of kids wanting to become doctor, teacher and police officer.
Gender
58% of the 7-11-year-old boys from Iceland want to be sportsman. While only 22% of the girls chose to do sports
when they grow up, it is still the top profession for them. It is the only country in the survey where the top job
chosen by girls and boys is the same. Gender differences, however, emerge in the most common career
aspirations. For instance teaching is the second most popular job for girls but none of the boys aged 7-11 are
inspired to become a teacher in future. However there are some interesting patterns in terms of typical
stereotyped professions in Iceland. Looking at figures below, girls are 4 times more likely to choose artist as a
profession comparing to boys.
Table 24: Iceland. Top career aspirations of children aged 7-11 by gender
Top jobs for Girls % Top jobs for boys %
Sportsman/woman 22% Sportsman/woman 58%
Teacher/Lecturer 12% Police 10%
Vet 11% Doctor 4%
Artist 11% Actor/Actress 4%
Doctor 9% Carpenter/joiner 3%
Hairdresser 6% Artist 3%
Retail sales assistant 5% Army/Navy/Airforce/Firefighter 2%
Actor/Actress 5% Scientist 2%
Dentist 4% Retail sales assistant 2%
Singer/Musician 4% Singer/Musician 2%
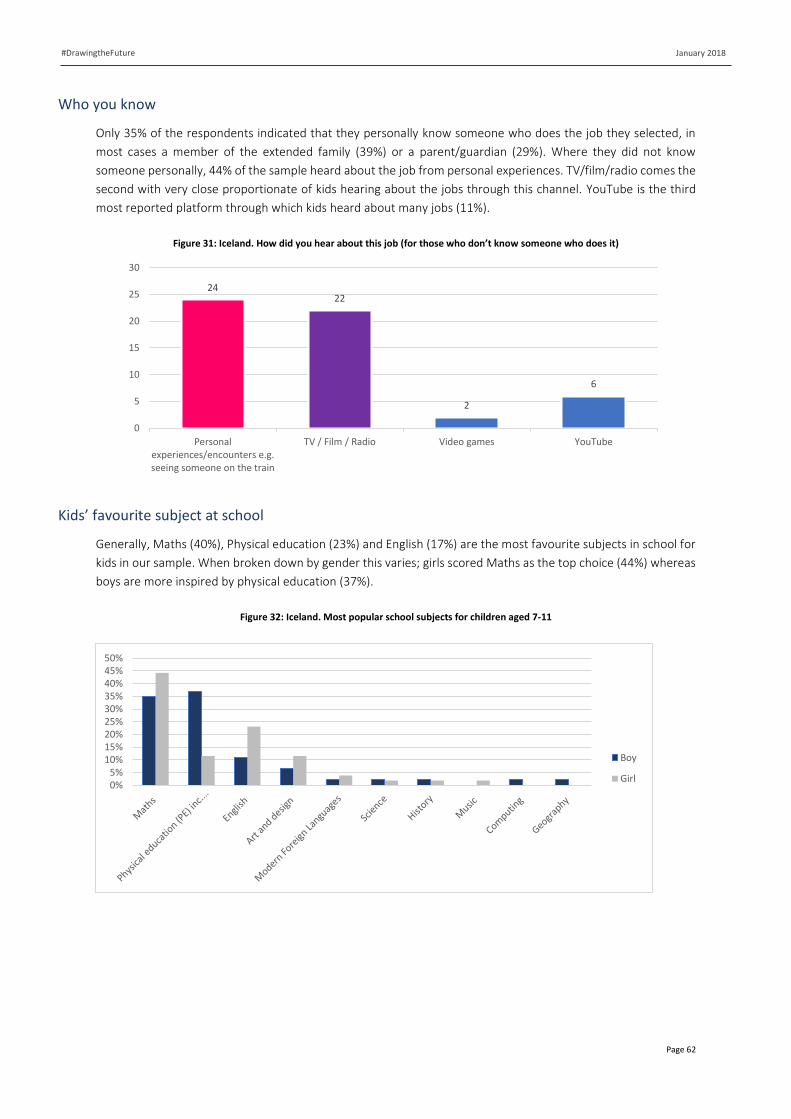
January 2018
Page 62
#DrawingtheFuture
Who you know
Only 35% of the respondents indicated that they personally know someone who does the job they selected, in
most cases a member of the extended family (39%) or a parent/guardian (29%). Where they did not know
someone personally, 44% of the sample heard about the job from personal experiences. TV/film/radio comes the
second with very close proportionate of kids hearing about the jobs through this channel. YouTube is the third
most reported platform through which kids heard about many jobs (11%).
Figure 31: Iceland. How did you hear about this job (for those who don’t know someone who does it)
Kids’ favourite subject at school
Generally, Maths (40%), Physical education (23%) and English (17%) are the most favourite subjects in school for
kids in our sample. When broken down by gender this varies; girls scored Maths as the top choice (44%) whereas
boys are more inspired by physical education (37%).
Figure 32: Iceland. Most popular school subjects for children aged 7-11
0%5%
10%15%20%25%30%35%40%45%50%
Boy
Girl
2422
2
6
0
5
10
15
20
25
30
Personalexperiences/encounters e.g.seeing someone on the train
TV / Film / Radio Video games YouTube
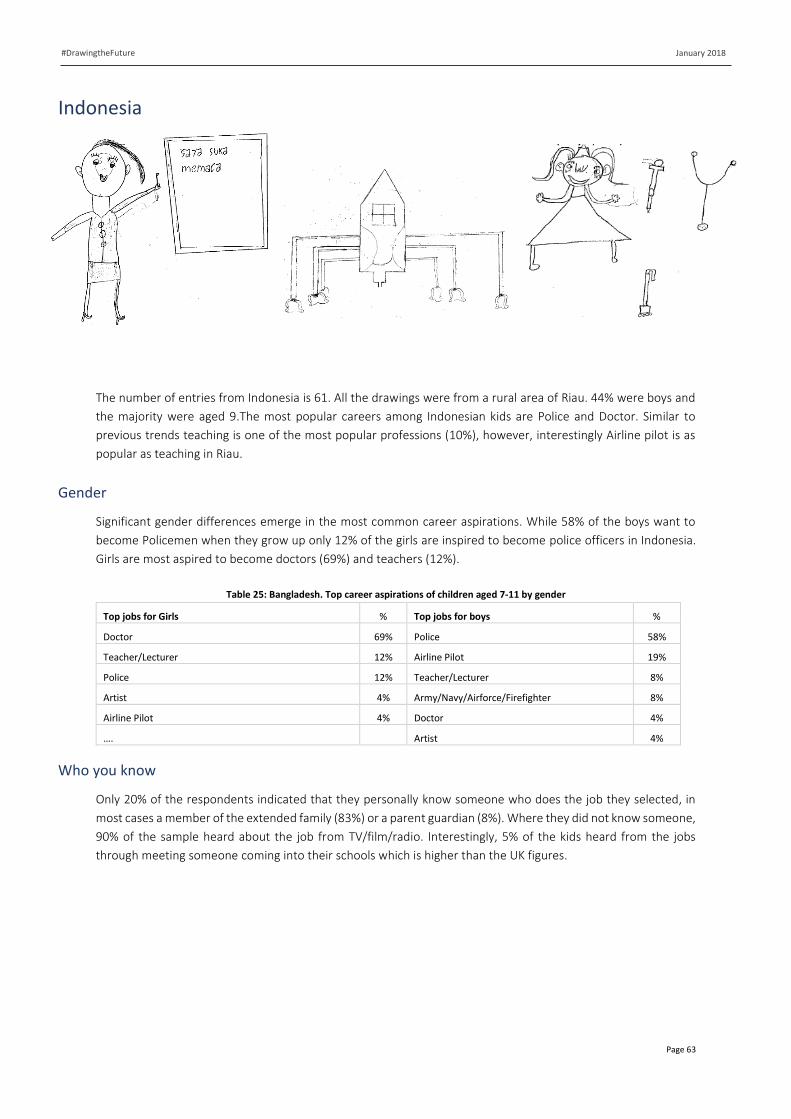
January 2018
Page 63
#DrawingtheFuture
Indonesia
The number of entries from Indonesia is 61. All the drawings were from a rural area of Riau. 44% were boys and
the majority were aged 9.The most popular careers among Indonesian kids are Police and Doctor. Similar to
previous trends teaching is one of the most popular professions (10%), however, interestingly Airline pilot is as
popular as teaching in Riau.
Gender
Significant gender differences emerge in the most common career aspirations. While 58% of the boys want to
become Policemen when they grow up only 12% of the girls are inspired to become police officers in Indonesia.
Girls are most aspired to become doctors (69%) and teachers (12%).
Table 25: Bangladesh. Top career aspirations of children aged 7-11 by gender
Top jobs for Girls % Top jobs for boys %
Doctor 69% Police 58%
Teacher/Lecturer 12% Airline Pilot 19%
Police 12% Teacher/Lecturer 8%
Artist 4% Army/Navy/Airforce/Firefighter 8%
Airline Pilot 4% Doctor 4%
…. Artist 4%
Who you know
Only 20% of the respondents indicated that they personally know someone who does the job they selected, in
most cases a member of the extended family (83%) or a parent guardian (8%). Where they did not know someone,
90% of the sample heard about the job from TV/film/radio. Interestingly, 5% of the kids heard from the jobs
through meeting someone coming into their schools which is higher than the UK figures.
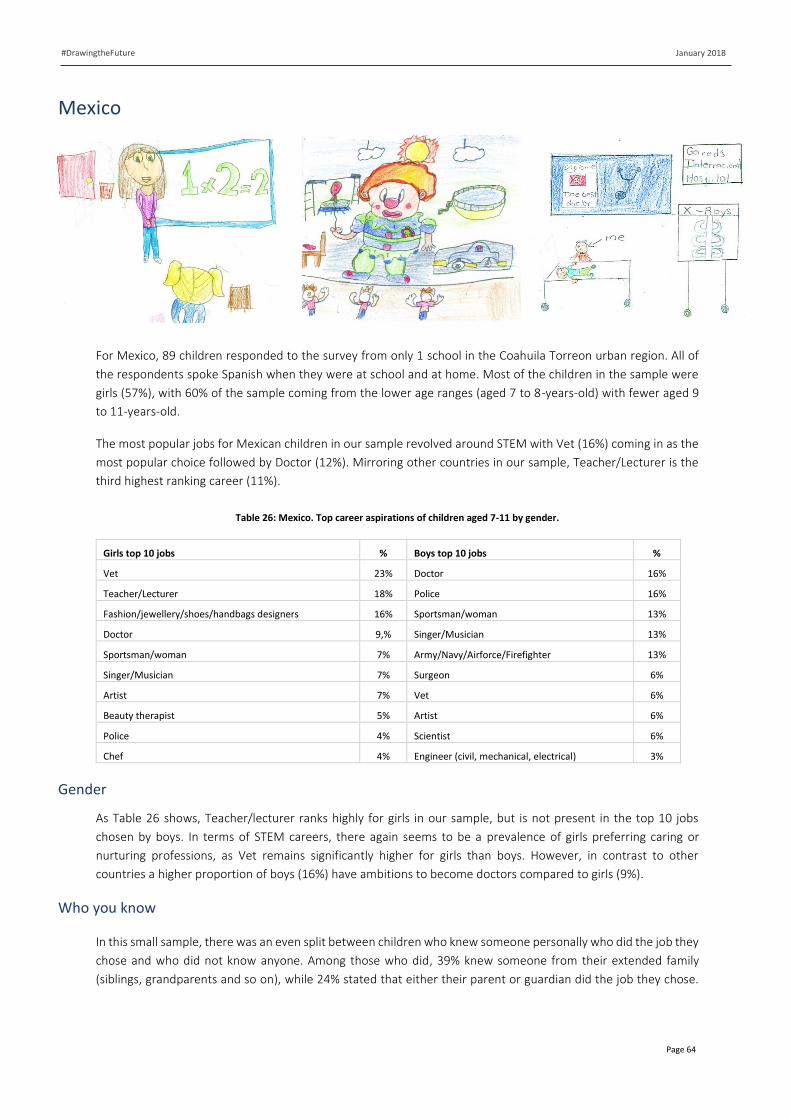
January 2018
Page 64
#DrawingtheFuture
Mexico
For Mexico, 89 children responded to the survey from only 1 school in the Coahuila Torreon urban region. All of
the respondents spoke Spanish when they were at school and at home. Most of the children in the sample were
girls (57%), with 60% of the sample coming from the lower age ranges (aged 7 to 8-years-old) with fewer aged 9
to 11-years-old.
The most popular jobs for Mexican children in our sample revolved around STEM with Vet (16%) coming in as the
most popular choice followed by Doctor (12%). Mirroring other countries in our sample, Teacher/Lecturer is the
third highest ranking career (11%).
Table 26: Mexico. Top career aspirations of children aged 7-11 by gender.
Girls top 10 jobs % Boys top 10 jobs %
Vet 23% Doctor 16%
Teacher/Lecturer 18% Police 16%
Fashion/jewellery/shoes/handbags designers 16% Sportsman/woman 13%
Doctor 9,% Singer/Musician 13%
Sportsman/woman 7% Army/Navy/Airforce/Firefighter 13%
Singer/Musician 7% Surgeon 6%
Artist 7% Vet 6%
Beauty therapist 5% Artist 6%
Police 4% Scientist 6%
Chef 4% Engineer (civil, mechanical, electrical) 3%
Gender
As Table 26 shows, Teacher/lecturer ranks highly for girls in our sample, but is not present in the top 10 jobs
chosen by boys. In terms of STEM careers, there again seems to be a prevalence of girls preferring caring or
nurturing professions, as Vet remains significantly higher for girls than boys. However, in contrast to other
countries a higher proportion of boys (16%) have ambitions to become doctors compared to girls (9%).
Who you know
In this small sample, there was an even split between children who knew someone personally who did the job they
chose and who did not know anyone. Among those who did, 39% knew someone from their extended family
(siblings, grandparents and so on), while 24% stated that either their parent or guardian did the job they chose.
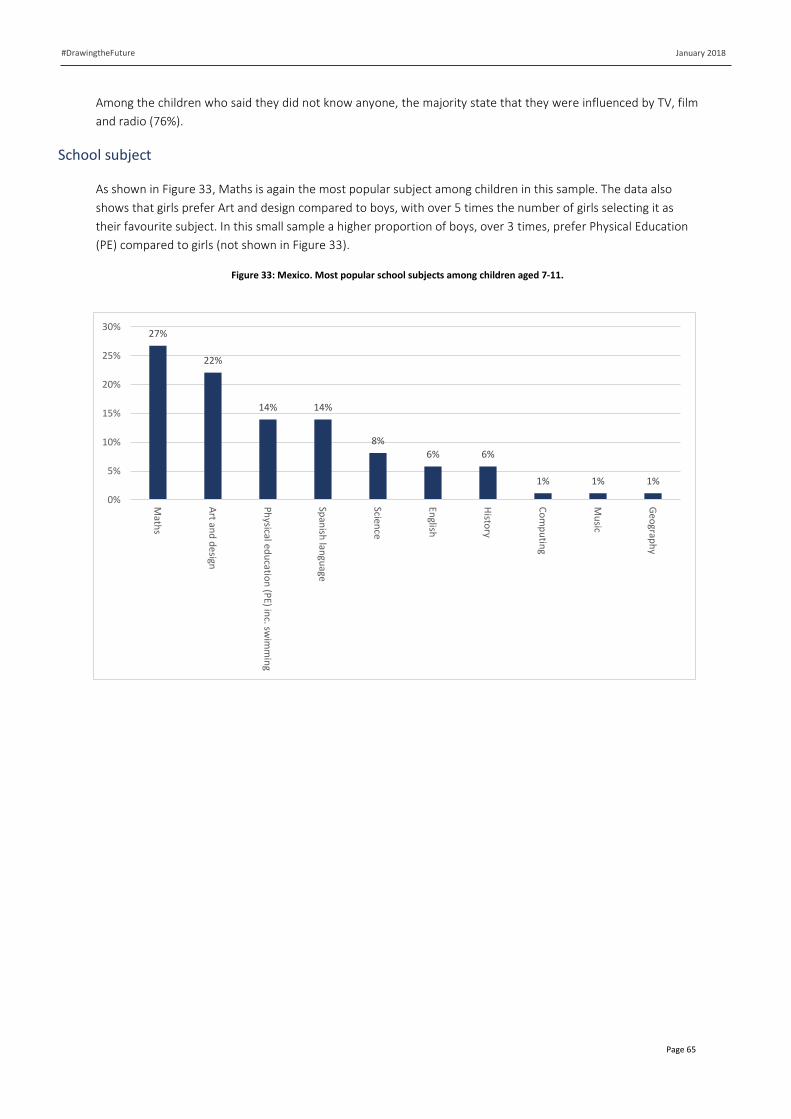
January 2018
Page 65
#DrawingtheFuture
Among the children who said they did not know anyone, the majority state that they were influenced by TV, film
and radio (76%).
School subject
As shown in Figure 33, Maths is again the most popular subject among children in this sample. The data also
shows that girls prefer Art and design compared to boys, with over 5 times the number of girls selecting it as
their favourite subject. In this small sample a higher proportion of boys, over 3 times, prefer Physical Education
(PE) compared to girls (not shown in Figure 33).
Figure 33: Mexico. Most popular school subjects among children aged 7-11.
27%
22%
14% 14%
8%
6% 6%
1% 1% 1%
0%
5%
10%
15%
20%
25%
30%
Math
s
Art an
d d
esign
Ph
ysical edu
cation
(PE) in
c. swim
min
g
Span
ish lan
guage
Science
English
Histo
ry
Co
mp
utin
g
Mu
sic
Geo
graph
y
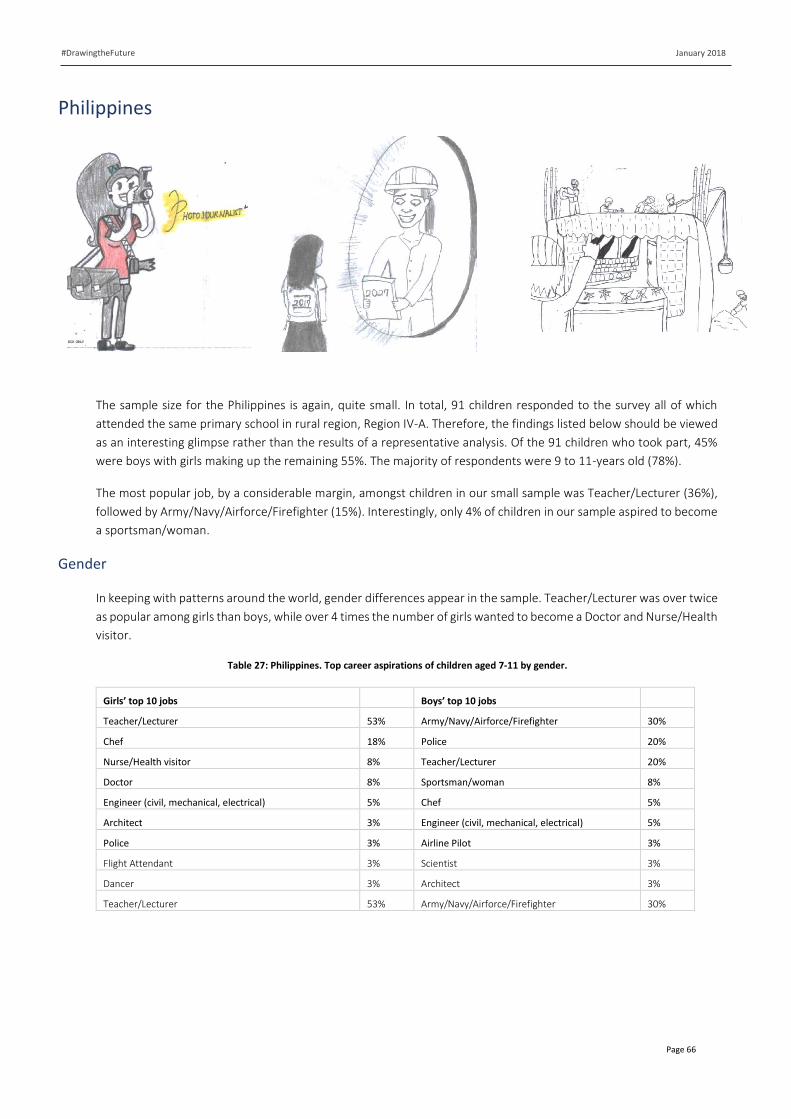
January 2018
Page 66
#DrawingtheFuture
Philippines
The sample size for the Philippines is again, quite small. In total, 91 children responded to the survey all of which
attended the same primary school in rural region, Region IV-A. Therefore, the findings listed below should be viewed
as an interesting glimpse rather than the results of a representative analysis. Of the 91 children who took part, 45%
were boys with girls making up the remaining 55%. The majority of respondents were 9 to 11-years old (78%).
The most popular job, by a considerable margin, amongst children in our small sample was Teacher/Lecturer (36%),
followed by Army/Navy/Airforce/Firefighter (15%). Interestingly, only 4% of children in our sample aspired to become
a sportsman/woman.
Gender
In keeping with patterns around the world, gender differences appear in the sample. Teacher/Lecturer was over twice
as popular among girls than boys, while over 4 times the number of girls wanted to become a Doctor and Nurse/Health
visitor.
Table 27: Philippines. Top career aspirations of children aged 7-11 by gender.
Girls’ top 10 jobs Boys’ top 10 jobs
Teacher/Lecturer 53% Army/Navy/Airforce/Firefighter 30%
Chef 18% Police 20%
Nurse/Health visitor 8% Teacher/Lecturer 20%
Doctor 8% Sportsman/woman 8%
Engineer (civil, mechanical, electrical) 5% Chef 5%
Architect 3% Engineer (civil, mechanical, electrical) 5%
Police 3% Airline Pilot 3%
Flight Attendant 3% Scientist 3%
Dancer 3% Architect 3%
Teacher/Lecturer 53% Army/Navy/Airforce/Firefighter 30%
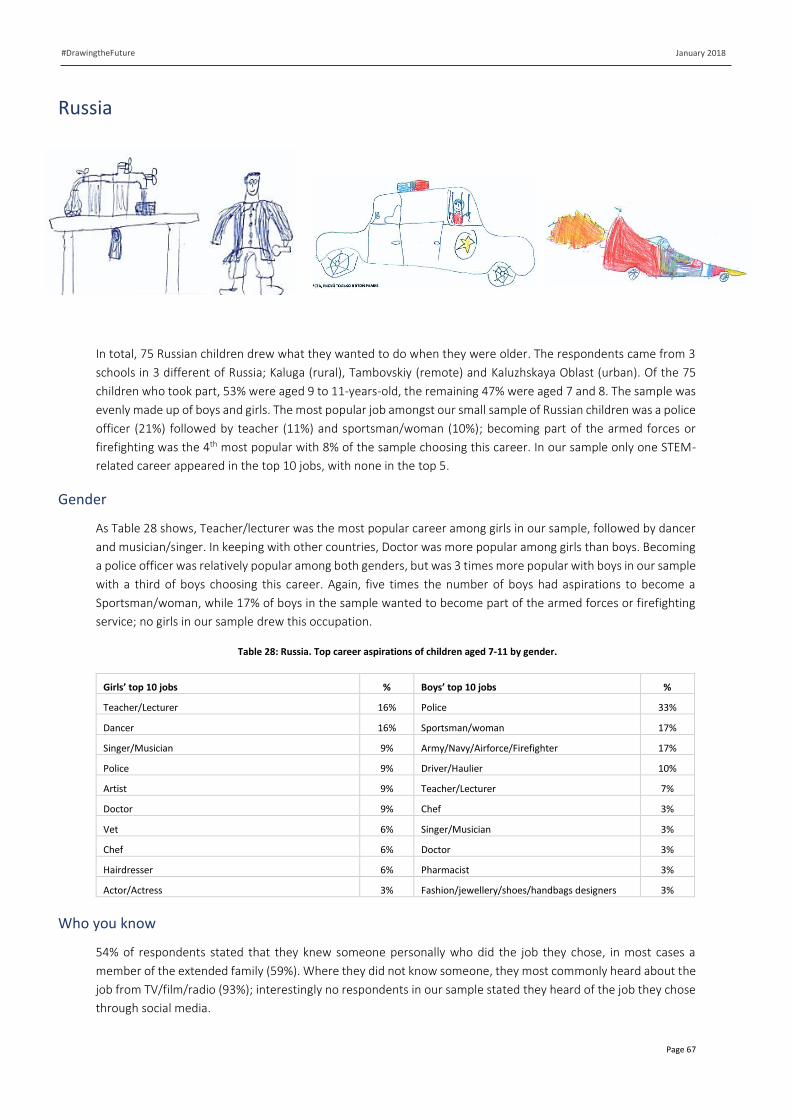
January 2018
Page 67
#DrawingtheFuture
Russia
In total, 75 Russian children drew what they wanted to do when they were older. The respondents came from 3
schools in 3 different of Russia; Kaluga (rural), Tambovskiy (remote) and Kaluzhskaya Oblast (urban). Of the 75
children who took part, 53% were aged 9 to 11-years-old, the remaining 47% were aged 7 and 8. The sample was
evenly made up of boys and girls. The most popular job amongst our small sample of Russian children was a police
officer (21%) followed by teacher (11%) and sportsman/woman (10%); becoming part of the armed forces or
firefighting was the 4th most popular with 8% of the sample choosing this career. In our sample only one STEM-
related career appeared in the top 10 jobs, with none in the top 5.
Gender
As Table 28 shows, Teacher/lecturer was the most popular career among girls in our sample, followed by dancer
and musician/singer. In keeping with other countries, Doctor was more popular among girls than boys. Becoming
a police officer was relatively popular among both genders, but was 3 times more popular with boys in our sample
with a third of boys choosing this career. Again, five times the number of boys had aspirations to become a
Sportsman/woman, while 17% of boys in the sample wanted to become part of the armed forces or firefighting
service; no girls in our sample drew this occupation.
Table 28: Russia. Top career aspirations of children aged 7-11 by gender.
Girls’ top 10 jobs % Boys’ top 10 jobs %
Teacher/Lecturer 16% Police 33%
Dancer 16% Sportsman/woman 17%
Singer/Musician 9% Army/Navy/Airforce/Firefighter 17%
Police 9% Driver/Haulier 10%
Artist 9% Teacher/Lecturer 7%
Doctor 9% Chef 3%
Vet 6% Singer/Musician 3%
Chef 6% Doctor 3%
Hairdresser 6% Pharmacist 3%
Actor/Actress 3% Fashion/jewellery/shoes/handbags designers 3%
Who you know
54% of respondents stated that they knew someone personally who did the job they chose, in most cases a
member of the extended family (59%). Where they did not know someone, they most commonly heard about the
job from TV/film/radio (93%); interestingly no respondents in our sample stated they heard of the job they chose
through social media.
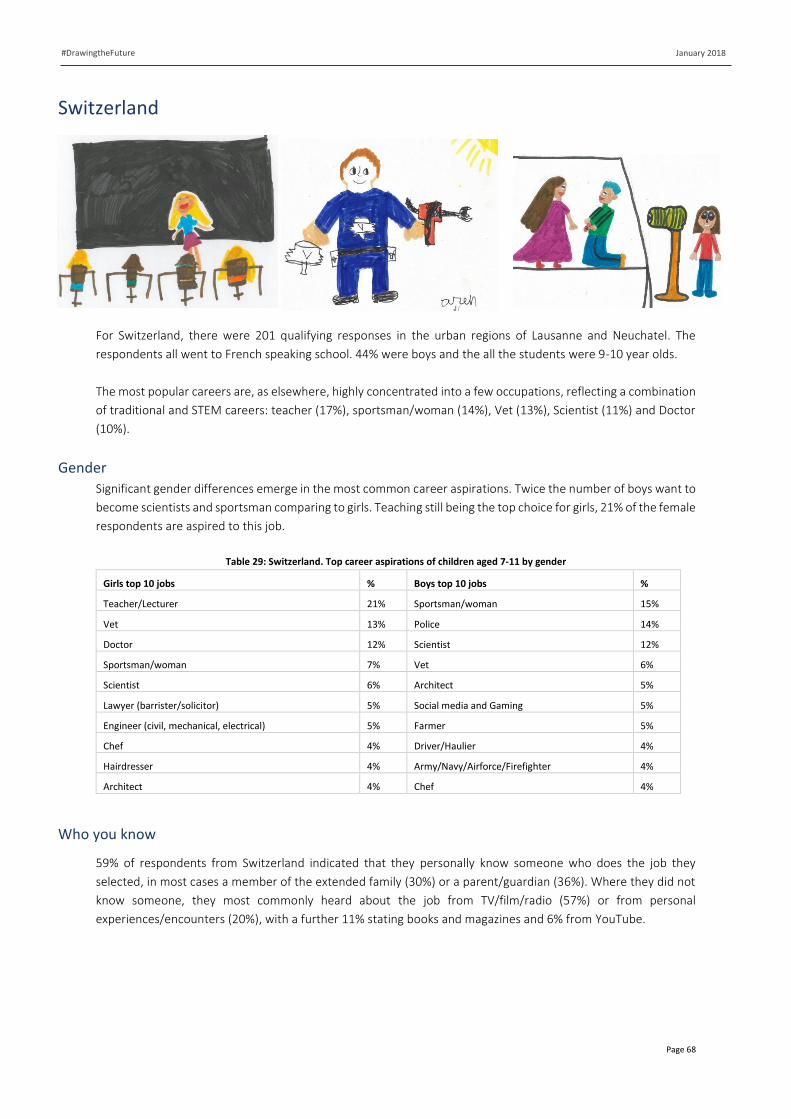
January 2018
Page 68
#DrawingtheFuture
Switzerland
For Switzerland, there were 201 qualifying responses in the urban regions of Lausanne and Neuchatel. The
respondents all went to French speaking school. 44% were boys and the all the students were 9-10 year olds.
The most popular careers are, as elsewhere, highly concentrated into a few occupations, reflecting a combination
of traditional and STEM careers: teacher (17%), sportsman/woman (14%), Vet (13%), Scientist (11%) and Doctor
(10%).
Gender
Significant gender differences emerge in the most common career aspirations. Twice the number of boys want to
become scientists and sportsman comparing to girls. Teaching still being the top choice for girls, 21% of the female
respondents are aspired to this job.
Table 29: Switzerland. Top career aspirations of children aged 7-11 by gender
Girls top 10 jobs % Boys top 10 jobs %
Teacher/Lecturer 21% Sportsman/woman 15%
Vet 13% Police 14%
Doctor 12% Scientist 12%
Sportsman/woman 7% Vet 6%
Scientist 6% Architect 5%
Lawyer (barrister/solicitor) 5% Social media and Gaming 5%
Engineer (civil, mechanical, electrical) 5% Farmer 5%
Chef 4% Driver/Haulier 4%
Hairdresser 4% Army/Navy/Airforce/Firefighter 4%
Architect 4% Chef 4%
Who you know
59% of respondents from Switzerland indicated that they personally know someone who does the job they
selected, in most cases a member of the extended family (30%) or a parent/guardian (36%). Where they did not
know someone, they most commonly heard about the job from TV/film/radio (57%) or from personal
experiences/encounters (20%), with a further 11% stating books and magazines and 6% from YouTube.
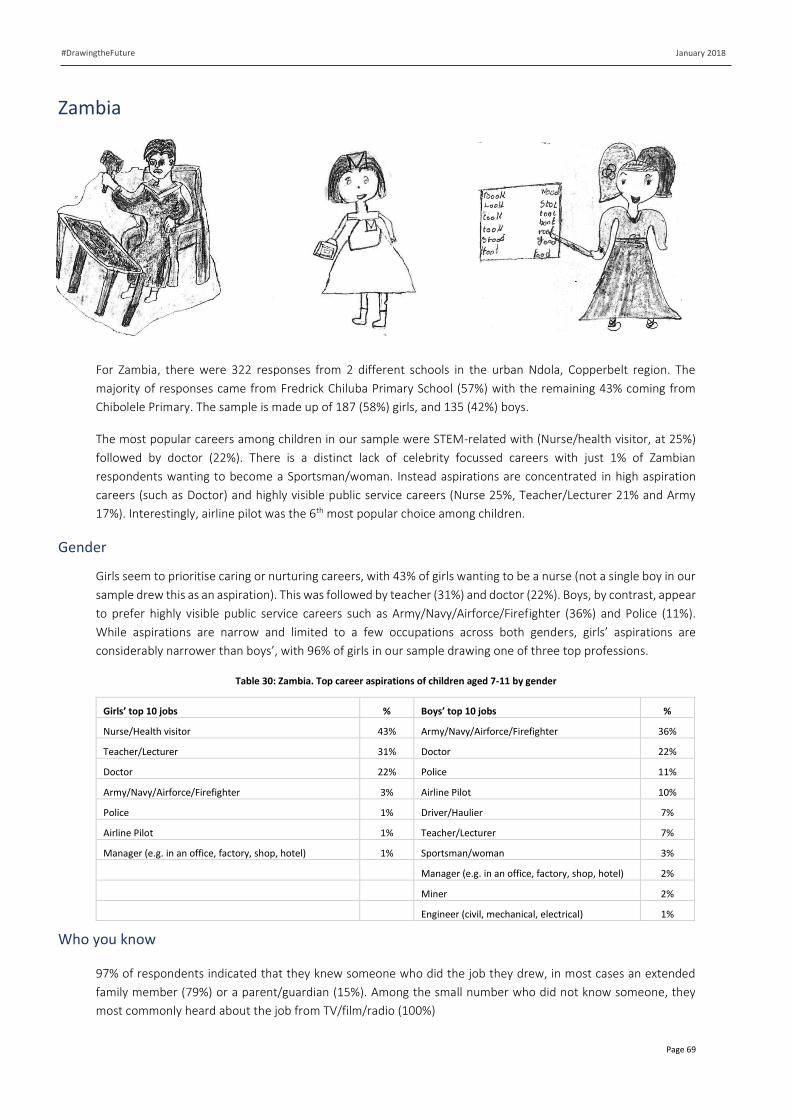
January 2018
Page 69
#DrawingtheFuture
Zambia
For Zambia, there were 322 responses from 2 different schools in the urban Ndola, Copperbelt region. The
majority of responses came from Fredrick Chiluba Primary School (57%) with the remaining 43% coming from
Chibolele Primary. The sample is made up of 187 (58%) girls, and 135 (42%) boys.
The most popular careers among children in our sample were STEM-related with (Nurse/health visitor, at 25%)
followed by doctor (22%). There is a distinct lack of celebrity focussed careers with just 1% of Zambian
respondents wanting to become a Sportsman/woman. Instead aspirations are concentrated in high aspiration
careers (such as Doctor) and highly visible public service careers (Nurse 25%, Teacher/Lecturer 21% and Army
17%). Interestingly, airline pilot was the 6th most popular choice among children.
Gender
Girls seem to prioritise caring or nurturing careers, with 43% of girls wanting to be a nurse (not a single boy in our
sample drew this as an aspiration). This was followed by teacher (31%) and doctor (22%). Boys, by contrast, appear
to prefer highly visible public service careers such as Army/Navy/Airforce/Firefighter (36%) and Police (11%).
While aspirations are narrow and limited to a few occupations across both genders, girls’ aspirations are
considerably narrower than boys’, with 96% of girls in our sample drawing one of three top professions.
Table 30: Zambia. Top career aspirations of children aged 7-11 by gender
Girls’ top 10 jobs % Boys’ top 10 jobs %
Nurse/Health visitor 43% Army/Navy/Airforce/Firefighter 36%
Teacher/Lecturer 31% Doctor 22%
Doctor 22% Police 11%
Army/Navy/Airforce/Firefighter 3% Airline Pilot 10%
Police 1% Driver/Haulier 7%
Airline Pilot 1% Teacher/Lecturer 7%
Manager (e.g. in an office, factory, shop, hotel) 1% Sportsman/woman 3%
Manager (e.g. in an office, factory, shop, hotel) 2%
Miner 2%
Engineer (civil, mechanical, electrical) 1%
Who you know
97% of respondents indicated that they knew someone who did the job they drew, in most cases an extended
family member (79%) or a parent/guardian (15%). Among the small number who did not know someone, they
most commonly heard about the job from TV/film/radio (100%)
January 2018
Page 70
#DrawingtheFuture
Discussion
January 2018
Page 71
#DrawingtheFuture
It is hoped that the new data from this survey will help inform the discussion between academics,
educationalists, policy makers, business and government and for action to be taken to address the issues
identified. To tackle these issues properly, we need to better understand what is driving these attitudes.
When we asked children what influenced their choices, the results echo concerns flagged elsewhere in
the literature we reviewed on the impact of media, schooling and personal networks.
The data collected for this report has shown that in the UK and internationally parents, guardians and extended
family members are one the biggest influences on the aspirations of a child. According to Gottfredson, children
come into schools with ideas and assumptions which have emerged out of their own day to day experiences,
experiences which are routinely shaped by ideas surrounding gender, ethnicity and social class.63 In their 2017
analysis, KidZania used the information on the 61,000 children who attended their London branch and mapped it
against deprivation and education indices for the UK. It found children from schools in less affluent areas opted
for working-class jobs, such as a hairstylist. Those from wealthier neighbourhoods chose activities such as
animation or broadcasting. One inference from the data is that deprivation influences aspirations almost into
adolescence.64 A 2008 paper by the UK Government Cabinet Office reported similar findings on the importance
of social background and deprivation in shaping aspirations. The study draws on Longitudinal Study of Young
People in England (LSYPE) and finds that young people with low aspirations often live in deprived neighbourhoods,
that is, areas with a history of economic decline and high levels of “bonding social capital” and low levels of
“bridging social capital”.65
In our sample, of the children who did not know anyone who did the job they chose, the majority indicated that
they heard about the job through TV, film or radio. The wider literature emphasises the role that advertising and
mass media can have on a child’s perceptions of themselves and their abilities. Children are considered to be
more vulnerable to messages in the media and in advertising, as they do not have the critical skills to question or
challenge. These carefully constructed messages can create an ingrained bias in children that can in turn go on to
restrict their future choices and ambitions.66 For decades, researchers have recognized children as a vulnerable
consumer group because of their budding developmental abilities. Relying on Piaget’s theory of cognitive
development, researchers in many studies have reported that until children are at least 7 years old, they do not
have the ability to detect persuasive intent in advertising.67 Research, from bodies such as the Advertising
Standards Authority (ASA), also suggests that media portrayals influence children's expectations about
appropriate gender behaviour, for example in terms of wanting to play with particular kinds of toys, which can
have long-term impacts.68 The Institution of Engineering and Technology found that boys are almost three times
more likely to receive a STEM toy for Christmas than girls, and stereotypical girl‘s toys focus on relationships,
housework, beauty and fashion.69 Pike and Jennings suggests that advertising has the potential to teach children
about gender roles and gender appropriate play from advertisements. They suggest that exposing children to the
63 Gottfredson, L. 2002 “Gottfredson’s Theory of Circumscription, Compromise and Self-Creation” in Brown, D. ed. Career Choice and Development. San Francisco: Jossey-Bass 64 Graus, G. (Forthcoming). “Children can only aspire to what they know exists.” Making role-play real play: Building a creative approach to social mobility. KidZania and Havas Helia. 65 Bonding social capital’ is characterised by strong bonds (or “social glue”) among group members such as close friends and family while ‘Bridging social capital’ is characterised by weaker, less dense but more cross-cutting ties (“social oil”). from Putnam, R.D. (1995) Bowling alone: America’s declining social capital. Journal of Democracy, 6, 65-78. 66 Davies, P. G., Spencer, S. J., Quinn, D. M., & Gerhardstein, R. (2002). Consuming images: How television commercials that elicit stereotype threat can restrain women academically and professionally. Personality and Social Psychology Bulletin, 28, 1615-1628. 67 John, D.R. (1999). Consumer socialization of children: a retrospective look at twenty-five years of research. Journal of Consumer Research. 26(3), 183–213 68 Advertising Standards Authority. (2017). Depictions, perceptions and harm: A report on gender stereotypes in advertising. London: Advertising Standards Authority. 69 Institute of Engineering and Technology. (2016). Skills and demand in industry survey 2016. London: Institute of Engineering
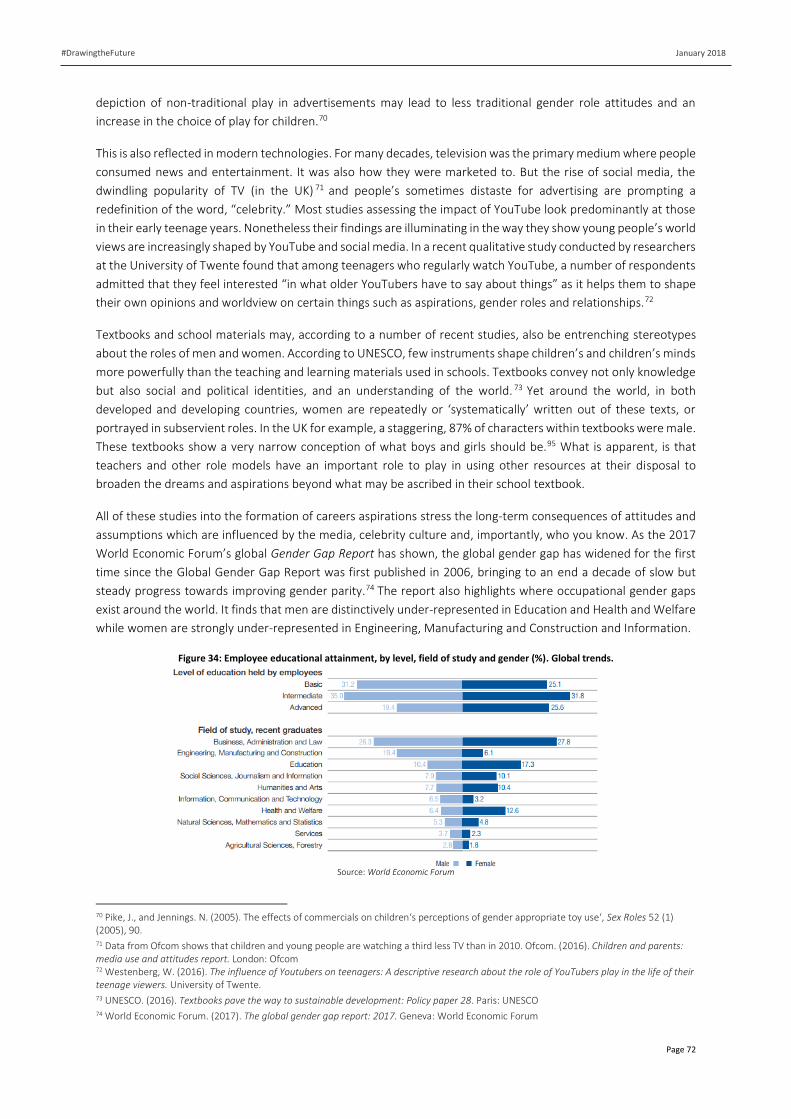
January 2018
Page 72
#DrawingtheFuture
depiction of non-traditional play in advertisements may lead to less traditional gender role attitudes and an
increase in the choice of play for children.70
This is also reflected in modern technologies. For many decades, television was the primary medium where people
consumed news and entertainment. It was also how they were marketed to. But the rise of social media, the
dwindling popularity of TV (in the UK) 71 and people’s sometimes distaste for advertising are prompting a
redefinition of the word, “celebrity.” Most studies assessing the impact of YouTube look predominantly at those
in their early teenage years. Nonetheless their findings are illuminating in the way they show young people’s world
views are increasingly shaped by YouTube and social media. In a recent qualitative study conducted by researchers
at the University of Twente found that among teenagers who regularly watch YouTube, a number of respondents
admitted that they feel interested “in what older YouTubers have to say about things” as it helps them to shape
their own opinions and worldview on certain things such as aspirations, gender roles and relationships.72
Textbooks and school materials may, according to a number of recent studies, also be entrenching stereotypes
about the roles of men and women. According to UNESCO, few instruments shape children’s and children’s minds
more powerfully than the teaching and learning materials used in schools. Textbooks convey not only knowledge
but also social and political identities, and an understanding of the world. 73 Yet around the world, in both
developed and developing countries, women are repeatedly or ‘systematically’ written out of these texts, or
portrayed in subservient roles. In the UK for example, a staggering, 87% of characters within textbooks were male.
These textbooks show a very narrow conception of what boys and girls should be.95 What is apparent, is that
teachers and other role models have an important role to play in using other resources at their disposal to
broaden the dreams and aspirations beyond what may be ascribed in their school textbook.
All of these studies into the formation of careers aspirations stress the long-term consequences of attitudes and
assumptions which are influenced by the media, celebrity culture and, importantly, who you know. As the 2017
World Economic Forum’s global Gender Gap Report has shown, the global gender gap has widened for the first
time since the Global Gender Gap Report was first published in 2006, bringing to an end a decade of slow but
steady progress towards improving gender parity.74 The report also highlights where occupational gender gaps
exist around the world. It finds that men are distinctively under-represented in Education and Health and Welfare
while women are strongly under-represented in Engineering, Manufacturing and Construction and Information.
Figure 34: Employee educational attainment, by level, field of study and gender (%). Global trends.
Source: World Economic Forum
70 Pike, J., and Jennings. N. (2005). The effects of commercials on children‘s perceptions of gender appropriate toy use‘, Sex Roles 52 (1) (2005), 90. 71 Data from Ofcom shows that children and young people are watching a third less TV than in 2010. Ofcom. (2016). Children and parents: media use and attitudes report. London: Ofcom 72 Westenberg, W. (2016). The influence of Youtubers on teenagers: A descriptive research about the role of YouTubers play in the life of their teenage viewers. University of Twente. 73 UNESCO. (2016). Textbooks pave the way to sustainable development: Policy paper 28. Paris: UNESCO 74 World Economic Forum. (2017). The global gender gap report: 2017. Geneva: World Economic Forum
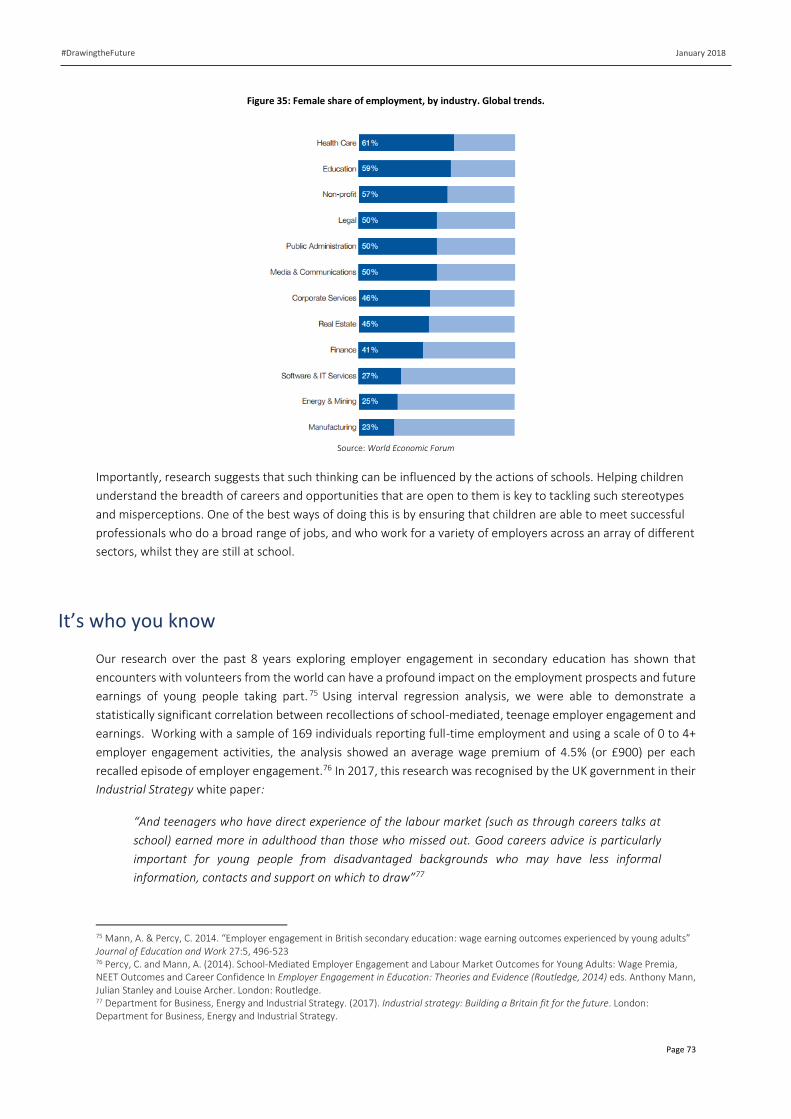
January 2018
Page 73
#DrawingtheFuture
Figure 35: Female share of employment, by industry. Global trends.
Source: World Economic Forum
Importantly, research suggests that such thinking can be influenced by the actions of schools. Helping children
understand the breadth of careers and opportunities that are open to them is key to tackling such stereotypes
and misperceptions. One of the best ways of doing this is by ensuring that children are able to meet successful
professionals who do a broad range of jobs, and who work for a variety of employers across an array of different
sectors, whilst they are still at school.
It’s who you know
Our research over the past 8 years exploring employer engagement in secondary education has shown that
encounters with volunteers from the world can have a profound impact on the employment prospects and future
earnings of young people taking part. 75 Using interval regression analysis, we were able to demonstrate a
statistically significant correlation between recollections of school-mediated, teenage employer engagement and
earnings. Working with a sample of 169 individuals reporting full-time employment and using a scale of 0 to 4+
employer engagement activities, the analysis showed an average wage premium of 4.5% (or £900) per each
recalled episode of employer engagement.76 In 2017, this research was recognised by the UK government in their
Industrial Strategy white paper:
“And teenagers who have direct experience of the labour market (such as through careers talks at
school) earned more in adulthood than those who missed out. Good careers advice is particularly
important for young people from disadvantaged backgrounds who may have less informal
information, contacts and support on which to draw”77
75 Mann, A. & Percy, C. 2014. “Employer engagement in British secondary education: wage earning outcomes experienced by young adults” Journal of Education and Work 27:5, 496-523 76 Percy, C. and Mann, A. (2014). School-Mediated Employer Engagement and Labour Market Outcomes for Young Adults: Wage Premia, NEET Outcomes and Career Confidence In Employer Engagement in Education: Theories and Evidence (Routledge, 2014) eds. Anthony Mann, Julian Stanley and Louise Archer. London: Routledge. 77 Department for Business, Energy and Industrial Strategy. (2017). Industrial strategy: Building a Britain fit for the future. London: Department for Business, Energy and Industrial Strategy.
January 2018
Page 74
#DrawingtheFuture
Early intervention can be a very cost effective targeted way of raising children’s’ aspirations and broadening their
horizons. The evidence suggests that giving children the chance to meet volunteers from the world helps them to
see the meaning and relevance of the subjects they are studying at school work. Embedding experiences of the
real-world in learning and the school curriculum can lead to increased motivation resulting in increased
educational attainment. When they engage with children, volunteers are routinely perceived as speaking from a
vantage point of real authority: who better to testify how numeracy is used outside of the classroom, after all
than someone who earns a wage to apply it in a workplace? Volunteers from the world of work can also play a
key role in providing children with role models and tackling stereotyping around gender and ethnicity and help
ensure that children at a young age don’t start ruling out options for themselves. Instead the aim is to show
children the vast range of opportunities open to them and ensure they don’t; start ruling out options for
themselves at young age. This is at the heart of Primary Futures developed by Education and Employers and the
NAHT – giving primary schools access to a vast range of volunteers from the world of work. If children see the
opportunities their learning can give them then they are more likely to have higher and broader aspirations.
Volunteers from the world of work can also play a key role in providing children with role models and tackling
stereotyping around gender and ethnicity. As Anne Lyons, president of the NAHT, a UK headteachers union,
states:
"All primary school pupils, regardless of where they live in the country, should get the same chance
to meet a wide range of people from the world of work who do a wide range of jobs. If we want to
raise and broaden aspirations and improve social mobility, this is vital."78
Andreas Schleicher, Director for Education and Skills, OECD echoed this:
“The OECD’s international work consistently shows that young children are full of enthusiasm for
learning, but as they get older, too often they struggle to see the point of what they are learning and
how it relates to their future and a result their educational attainment drops. This is particularly a
concern for children from disadvantaged backgrounds who lack successful role models from the
world of work.”
By enriching their real-life experiences, pupils can be encouraged to think about the meanings and implications
of what they are being taught in class. “Children’s career and educational choices,” as Knight argues elsewhere in
the academic literature, “are influenced by adult role models as well as by parental expectations” and schools, as
Gutman and Akerman state “can play a part in maintaining and realising ambitions, and the support they provide
becomes more important when family resources are limited”.79 Access to volunteers should be seen as a key
resource which will shape the thinking of children – about who they might become and how what they do in
classroom, even at the youngest ages, can relate to their adult lives. As such, “employer engagement”80 becomes
a resource to influence both the aspirations of children through addressing the assumptions which shape
attitudes and expectations. This is a notion that also seems to be shared by those with experience of these
activities, primary school teachers. Drawing on a survey of more than 400 primary school teachers, recent
research by Kashefpakdel and Rehill found that 79% of primary school teachers surveyed thought that volunteers
from the world of work coming into schools can help challenge the stereotypes that children have around the
jobs that people do and the subjects they study by gender.81 This can also be complemented by a tailored careers
78 Chambers, N. (2017). ‘If we’re serious about improving social mobility, the issue must be addressed at primary level’ Tes 8th August 2017 [accessed 14th December 2017] 79 Knight, J. L. (2015). “Preparing Elementary School Counselors to Promote Development: Recommendations for School Counselor Education Programs.” Journal of Career Development, 42:2, 75-85. 80 “Employer engagement” relates to the range of different ways that employers can support the learning and progression of young people in primary and secondary education. This engagement may come in the form of a careers talk, work experience or other such activities. 81 Kashefpakdel, E.T. and Rehill, J. (2017). Teachers Perception on the impact of the engagement with the world of work on students’ academic achievement in primary education. London: Education and Employers.
January 2018
Page 75
#DrawingtheFuture
education programme aimed at supporting teachers to target specific age groups starting early, e.g. London
Ambitions Careers Curriculum.82
While the focus of interest in employer engagement from a policy perspective has been largely on secondary
provision, increasingly interest has extended, if hesitantly, to primary education. Such a conceptualisation speaks
to a well-developed understanding of how teenagers react to engagements with workplace volunteers. Drawing
on the work of US sociologist Mark Granovetter, employer engagement has been conceived as providing a form
of social capital. To Granovetter, there is economic value to an individual in having a social network which is broad
because friends and acquaintances are a resource. They provide access to trustworthy information about jobs,
careers and routes into them and when numerous and wide, the information collectively available much more
likely to be deemed useful.83 For young people, access to new and useful information about the labour market
allows them to draw better links between their current and future imagined lives.84 Such a change about what is
considered reasonable, desirable or obtainable can be seen as a change in fundamental sense of personal identity
within a social context, influentially described as ‘habitus’, a form of cultural capital by French sociologist Pierre
Bourdieu.85
Primary Futures
Making a connection between what primary children learn in school and the jobs they might one day pursue has
to date not easy, particularly for those from challenging backgrounds, where local unemployment is high and
horizons may be set low. Our work with Primary Futures that there are simply ways we can change this. Primary
Futures works on the premise that there is a latent willingness in schools and places of employment to collaborate
if barriers can be removed.86 For most employer engagement activities, the key transaction cost is finding a
suitable person in a workplace and making a clear ask of them. If only schools could find the right people, on their
own terms, it is argued, we would open the way to high volume employer engagement across education, including
in primary.
In 2014, Education and Employers and the NAHT began a pilot getting volunteers into primary schools and seeing
the impact it had. It started in a single primary school in Barnsley, situated in the middle of one of Europe’s largest
council estates and a former mining community. Many primary schools have a tradition of inviting volunteers
from the world of work but typically doing a very limited number of (and other gender stereotypical) jobs:
policeman, nurse and firefighter. The pilot initially got volunteers to read with children but it quickly became
apparent that the biggest impact the volunteers were having was in raising and broadening the aspirations of
children and helping them to realise why the subjects they were studying were relevant to their futures, and in
so doing, improve their motivation and attainment. The pilot run by NAHT past-president, Steve Iredale at his
school, developed into a national scheme called Primary Futures which has already seen over 3,000 primary
schools sign up. It uses the matchmaking technology Inspiring the Future which connects volunteers with schools
for free nationally. Over 40,000 people have volunteered from all levels - apprentices to CEOs, from all sectors -
archaeology to zoology, and in all parts of the UK.
82 http://www.londoncouncils.gov.uk/londonambitionscareers 83 Granovetter, M. (1973). The strength of weak ties. American Journal of Sociology 78(6), 1360-1380. 84 Raffo, C., and M. Reeves. (2000). “Youth Transitions and Social Exclusion: Developments in Social Capital Theory.” Journal of Youth Studies 3 (2), 147–166. ; Mann, A. & Dawkins, J. (2014). Employer engagement in education: literature review. Reading CfBT Education Trust 85 Archer, L. 2014. “Conceptualising Aspiration” in Mann, A., Stanley, J. & Archer, L. eds. Understanding Employer Engagement in Education: theories and evidence. London: Routledge 86 Mann, A. & Virk, B. (2013). Profound Employer Engagement in Education: What It Is and Options for Scaling It Up. London: Edge Foundation
January 2018
Page 76
#DrawingtheFuture
Access to volunteers from the world of work is seen as a resource which will shape the thinking of children – about
who they might become and how what they do in classroom, even at the youngest ages, can relate to their adult
lives not something imposed on the school. Employers, professional bodies and numerous government bodies
have been keen and willing to promote to their staff seeing not just the benefits for young people but to those
staff who take part. Employer engagement is a resource to influence the aspirations of young people through
addressing the assumptions which shape attitudes and expectations.
At one level, the employee volunteer can be seen as simply supplementing the work of teachers: providing access
to extra resource to achieve core teaching objectives (for example by working to improve reading and number
skills). At a second, we can conceive engagement as a resource which enables access to additional objectives:
developing enterprise or employability skills, raising or broadening aspirations, challenging thinking about the
point of education. Across these areas, it makes a very significant difference that the human resource in question
is someone bringing real life, authentic experience of the workplace. 87 When they engage with children,
volunteers are routinely perceived as speaking from a vantage point of real authority: who better to testify how
numeracy is used outside of the classroom, after all than someone who earns a wage to apply it in a workplace?
However, it is important that these activities are implemented carefully. Such activities can, if they are not
carefully managed, reinforce traditional existing stereotypes about roles. Teachers can challenge stereotypical
statements made by outside volunteers afterwards with the class. These discussions about careers and jobs
should emphasise the range of options that are available, rather than forcing children into building a narrative
around a quickly-chosen job that might become a habit or limits the range of possibilities.
87 Stanley, J. & Mann, A. 2014. “Conceptualising Employer Engagement in Education” in Mann, A., Stanley, J. & Archer, L. eds. Understanding Employer Engagement in Education: theories and evidence. London: Routledge
January 2018
Page 77
#DrawingtheFuture
Conclusions
January 2018
Page 78
#DrawingtheFuture
This project sought to explore the career aspirations of primary-age children, and, in doing so, assessed
whether these aspirations were patterned (around gender and social-background) and if these ideas about
professions and industries were carried into their teenage, decision making years.
A number of academic studies suggested that there is a need to understand the aspirations which primary-age
children hold and in turn to begin engaging with these young people with the world of work earlier. Findings from
various studies suggest that stereotypes are not only embedded at a young age, they are also difficult to shift and
feed into behaviour in school, motivation and subject choices as children progress through schooling. Social
background, personal networks, celebrity and mass media also have a role to play in forming ideas about what is
reasonable and obtainable for ‘people like me’ to aspire to.
The results from this survey have confirmed that aspirations are highly gendered and show some evidence of
being influenced by socio-economic background, though the findings related socio-economic background are
somewhat limited by the broad measurements used. As mentioned in the methodology, our measurement for
disadvantage (the percentage of children in a school eligible for free school meals) only gives an indication of the
socio-economic background of children in that school. Using this method does not tell us that the child themselves
is from a disadvantaged background, merely that they attend a school where a number of children may be. Further
research is needed explore the influence of social disadvantage on children’s aspirations in greater detail. Our
research also finds that there is a major disconnect between the careers that primary aged pupils are more
interested in and those that the economy needs, and that this is a global issue. Further to this, the UK data has
highlighted that these aspirations do not majorly diversify as children reach secondary schooling and adolescence.
To tackle these issues, we need to understand and mitigate the driving forces behind these attitudes. Previous
research suggests that exposing children to more real-world examples in a way that is both exciting and embedded
in everyday school life, as well as being age appropriate, can help transform the way children view certain
professions and roles.88 We found, however, that less than 1% of children responding to this survey stated they
had heard about the job from a volunteer from the world of work coming in to school. That is not to say that
these events are not happening, there are numerous examples of teachers and schools, including schools involved
with Primary Futures, working to broaden the aspirations of primary-age children. The argument here is one of
volume, in other words, plan and organise as many activities as possible. The existing evidence on employer
engagement in secondary education suggests that the more career related activities a young person participates
in, the greater the impact on education and employment outcomes.89
Other interventions are available at the policy-making level as young people get closer to the transition into
further/higher education and work, examples that are in use today include highly promoting one set of subjects
over another (e.g. STEM), directly incentivising certain courses or qualifications (e.g. paying students to study).
Aside with often bring expensive and hard to manage, such tools are typically blunt and start to infringe on the
freedom of young people to choose.
We do, however, need to be cautious about what ‘success’ looks like for primary-aged children, and as a result
interpreting this data is not straightforward. Since it is hard to imagine a society in which over a fifth of adults
work as sportsmen or sportswomen, should we conclude that a fifth of children aspiring to such roles is, in some
way, a problem to fix? If this aspiration, translates into greater involvement in team sports, benefits in
teamworking and communication skills should be welcomed.
88 Mann, A. & Dawkins, J. (2014). Employer engagement in education: literature review. Reading CfBT Education Trust 89 Mann, A. & Percy, C. (2014). “Employer engagement in British secondary education: wage earning outcomes experienced by young adults” Journal of Education and Work 27:5, 496-523; Kashefpakdel, E. and Percy, C. 2016. “Career education that works: An economic analysis using the British Cohort Study.” Journal of Education and Work, 30:3, 217-234 ; Rehill, J., Kashefpakdel, E. T., and Mann, A. (2017). How to make the most of careers events with employers: Technical report. London: Education and Employers.
January 2018
Page 79
#DrawingtheFuture
Ambition should not be discouraged. The problem is less with the aspiration itself and more with concern over
what someone does with it. Taking football as an example (as it was the job chosen most by children in our
sample), out of all the players who enter an academy at the age of 9, less than half of 1% end up making a living
from playing football professionally.90 Therefore, for children aspiring to become sportsmen and women it is
important that they are also made aware of the array of other career options available to them, and in pursuing
their dream of being a professional sportsperson that they also accumulate transferrable employability skills.
Western societies now demand their citizens take responsibility, become increasingly self-reliant, and by
extension develop a capacity to make good career decisions in adulthood. In the absence of early exposure to the
world of work, patterns of inequality and social mobility will continue to stagnate.
90 Calvin, M. (2017). No hunger in paradise: The players. The journey. The dream. London: Random House.

January 2018
Page 80
#DrawingtheFuture
References
Advertising Standards Authority. (2017). Depictions, perceptions and harm: A report on gender stereotypes in advertising. London: Advertising Standards Authority. Akerlof, G. A. and Kranton, R. E. (2000). Economics and identity. Quarterly Journal of Economics 115(3), 715-753. Archer, L. 2014. “Conceptualising Aspiration” in Mann, A., Stanley, J. & Archer, L. eds. Understanding Employer Engagement in Education: theories and evidence. London: Routledge Archer, L., DeWitt, J., Osborne, J., Dillon, J., Willis, B. and Wong, B. (2010). “’Doing’ Science versus ‘Being’ a Scientist: Examining 10/11-Year-Old Schoolchildren’s Constructions of Science through the Lens of Identity” Science Education 94: 617-639 Archer, L., Osbourne, J., DeWitt, J., Dillon, J. and Wong, B. (2013). ASPIRES: Young People’s science and career aspirations, age 10-14. London: King’s College Asian Development Bank and the International Labour Organisation (2016b) Bangladesh, Looking Beyond
Garments. Employment Diagnostic Study. Available at:
https://www.adb.org/sites/default/files/publication/190589/ban-beyond-garments-eds.pdf.
Australian Government Department of Employment (2017) Employment Outlook to May 2022. Available at:
http://lmip.gov.au/default.aspx?LMIP/GainInsights/EmploymentProjections.
Australian Government Department of Employment (2017) Industry Employment Projections Report. Available
at: http://lmip.gov.au/default.aspx?LMIP/GainInsights/EmploymentProjections.
Banco de Portugal (2017) Projection for the Portuguese Economy: 2017-19. ; EURES (2017) European Job
Mobility Portal. Labour Market Information. Available at:
https://ec.europa.eu/eures/main.jsp?catId=493&lmi=Y&acro=lmi&lang=en&recordLang=en&parentId=&countr
yId=AT®ionId=AT0&nuts2Code=null&nuts3Code=null&mode=text®ionName=National%20Level.
Barnes, A. (2015). Economic contribution of the UK’s film, high-end TV, video game, and animation programming sectors. London: Olsberg SPI and Nordicity Belfield, C., Crawford, C., and Sibieta, L. (2017). Long-run comparisons of spending per pupil across different stages of education. London: Institute of Fiscal Studies. Benzidia, M. (2017). If I were a boy: Gender stereotypes at school. Marseille: Aix-Marseille University Bian, L., Leslie, S-J., and Cimpian, A. (2017). Gender stereotypes about intellectual ability emerge early and influence children’s interests. Science 355 (6323), 389-391. Breen, R. and Garcia-Penalosa, C. (2002). Bayesian learning and gender segregation. Journal of Labor Economics, 20(4), 899–922. Butler, S, Gross, J and Hayne, H. (1995). The effect of drawing on memory performance in young children. Developmental Psychology, 31(4): 597–608 Calvin, M. (2017). No hunger in paradise: The players. The journey. The dream. London: Random House.
January 2018
Page 81
#DrawingtheFuture
CEDEFOP (2015) Romania: Skills forecasts up to 2025, 2015 edition. Available at:
http://www.cedefop.europa.eu/en/publications-and-resources/country-reports/romania-skills-forecasts-2025.
Chambers, F., Machalepis, M., and Martinez, M. M. (2011). ‘Using drawing to explore children’s aspirations in a primary school’ in Miles, S., and Ainscow, M. (eds). Responding to diversity in schools: An inquiry-based approach. Abingdon: Routledge. Chambers, N. (2017). ‘If we’re serious about improving social mobility, the issue must be addressed at primary level’ Tes 8th August 2017 [accessed 14th December 2017] Davies, P. G., Spencer, S. J., Quinn, D. M., & Gerhardstein, R. (2002). Consuming images: How television commercials that elicit stereotype threat can restrain women academically and professionally. Personality and Social Psychology Bulletin, 28, 1615-1628. Department for Education. (2017). Careers strategy: Making the most of everyone’s skills and talents. London: Department for Education. Department for Education. (2017). School workforce in England: November 2016. London: Department for Education. Department for Education. (2017). Schools, pupils and their characteristics. London: Department for Education Department of Education. (2017). Report of Professor Sir Adrian Smith’s review of post-16 mathematics. London: Department for Education. Economic Development Policy and Research Department (Uganda Ministry of Finance) (2014) Uganda’s
Employment Challenge. An Evaluation of Government Strategy.
Einarsdottir, J., Dockett, S. and Perry, B. (2009). Making meaning: Children’s perspectives expressed through drawings Early Child Development and Care 179 (2), 217-232. ESchlossberg, H. & Goodman, J. (1972) A Woman’s Place: Children’s sex-stereotyping of occupations, Vocational Guidance Quarterly, 20(4), 266-270. EY (2017) ‘The IT Industry in Belarus: 2017 and Beyond’. Available at:
http://www.ey.com/Publication/vwLUAssets/ey-it-industry-in-belarus-2017-and-beyond/$FILE/ey-it-industry-in-
belarus-2017-and-beyond.pdf
Flouri, E. & Panourgia C. (2012). Do primary school children's career aspirations matter? The relationship between family poverty, career aspirations and emotional and behavioural problems. Francis, B. (2002). Is the future really female? The impact and implications of gender for 14-16 year olds’ career choices. Journal of Education and Work 15(1), 75-78. Francis, B. (1998). Power Plays: Primary School children’s constructions of gender, power and adult work, Stoke-on-Trent: Trentham Books. Francis, B. (2005). “Not knowing their place. Girls’ classroom behaviour”. In ‘Problem’ girls: Understanding and supporting troubled and troublesome girls, Edited by: Lloyd, G. 9–21. London: Routledge. Francis., Archer, A., Moote, J., DeWitt, J., Yeomans, L. & MacLeod, E. (2016) Perceptions of Gender Issues in Access to Physics: The Construction of Physics as a Quintessentially Masculine Subject, Sex Roles. Volume 76, Issue 3–4, pp 156–174 http://link.springer.com/article/10.1007/s11199-016-0669-z Gaskell, J. (1992) Gender Matters From School to Work. Buckingham: Open University Press. Girlguiding. (2017). Girls Attitudes Survey. London: Girlguiding
January 2018
Page 82
#DrawingtheFuture
Gore, J. et al. (2016). Unpacking the career aspirations of Australian school students: towards an evidence base for university equity initiatives in schools. Higher Education Research and Development 36(7), 1383-1400. Gottfredson, L. (2002) “Gottfredson’s Theory of Circumscription, Compromise and Self-Creation” in Brown, D. ed. Career Choice and Development. San Francisco: Jossey-Bass Government of the Republic of Serbia (2017) Economic Reform Programme for the Period 2017-2019. Available
at: http://www.mfin.gov.rs/UserFiles/File/strategije/ERP%202017%20-%202019%20final_Eng.pdf.
Granovetter, M. (1973). The strength of weak ties. American Journal of Sociology 78(6), 1360-1380. Graus, G. (Forthcoming). “Children can only aspire to what they know exists.” Making role-play real play: Building a creative approach to social mobility. KidZania and Havas Helia. Gutman, L. M. and Akerman, R. (2008). Determinants of Aspirations. London: Institute of Education Centre for Research on the Wider Benefits of Learning Health Education England. (2017). NHS workforce statistics – January 2017, provisional statistics. London: Health Education England. Holland, J. (1987). Girls and occupational choice: In search of meanings. Girls and occupational choice working paper No 10. London: University of London, Institute of Education Homer, A. ‘Share of European Union staff leaving NHS rises following Brexit.’ BBC News Online, 16 October 2017. Available at: http://www.bbc.co.uk/news/uk-england-41556997 (Accessed 03 January 2018). House of Commons: Science and Technology Committee. (2017). Industrial Strategy: Science and STEM skills. Thirteenth report of session 2016-17. London: House of Commons. http://www.londoncouncils.gov.uk/londonambitionscareers https://eraltd.org/news-events/press-releases/2018/streaming-boom-powers-entertainment-market-to-new-all-time-high-of-724bn-in-2017/ Huber, L., Sloof, R., and Van Praag, M. (2012). The effect of early entrepreneurship education: Evidence from a randomized field experiment. European Economic Review, 72, 76-97 In Hughes, D., Mann, A., Barnes, S-A., Baldauf, B., and Mc Keown, R. (2016) An International Literature Review: Careers Education. London: Education Endowment Foundation, 80. Hughes, D., Mann, A., Barnes, S-A., Baldauf, B., and Mc Keown, R. (2016) An International Literature Review: Careers Education, on behalf of the Education Endowment Foundation (EEF), London. Hutchings, M. (1993). ‘What will you do when you grow up?’: Some origins of primary school children’s ideas about work. London: Primary Schools and Industry Centre, University of North London. Independent Schools Council. (2017). Independent Schools Council: 2016/17 key figures. London: Independent Schools Council Institute of Engineering and Technology. (2016). Skills and demand in industry survey 2016. London: Institute of Engineering John, D.R. (1999). Consumer socialization of children: a retrospective look at twenty-five years of research. Journal of Consumer Research. 26(3), 183–213 Kashefpakdel, E. and Percy, C. 2016. “Career education that works: An economic analysis using the British Cohort Study.” Journal of Education and Work, 30:3, 217-234.
January 2018
Page 83
#DrawingtheFuture
Kashefpakdel, E.T. and Rehill, J. (2017). Teachers Perception on the impact of the engagement with the world of work on students’ academic achievement in primary education. London: Education and Employers. Kelly, A. (1989). “When I grow up I want to be a…”: A longitudinal study of the development of career preferences. British Journal of Guidance and Counselling 17, 179-200. Knight, J. L. (2015). “Preparing Elementary School Counselors to Promote Development: Recommendations for School Counselor Education Programs.” Journal of Career Development, 42:2, 75-85; Gutman and Akerman 2008 Lam, R., Liu, X., Schipke, A. (2015) ‘China’s Labour Market in the “New Normal”, IMF Working Paper, 1-33.
Zhaopin Limited, available at: http://zhaopin.investorroom.com/2017-07-20-China-Labor-Market-Continued-to-
Improve-in-the-Second-Quarter-of-2017#assets_43_97-3:27.
Mann, A. & Dawkins, J. (2014). Employer engagement in education: literature review. Reading CfBT Education Trust Mann, A. & Percy, C. 2014. “Employer engagement in British secondary education: wage earning outcomes experienced by young adults” Journal of Education and Work 27:5, 496-523 Mann, A. & Virk, B. (2013). Profound Employer Engagement in Education: What It Is and Options for Scaling It Up. London: Edge Foundation Mann, A., Massey, D., Glover, P., Kashefpakdel, E.T., and Dawkins, J. (2013) Nothing in Common: The career aspirations of young Britons mapped against projected labour market demand (2010-2020) McQuaid, Ronald W., and Bond, Sue. (2007) Gender stereotyping in schools - young people and career choices. In: WES Conference, 12th -14th September 2007, Aberdeen. Miller, L. and Budd, J. (1999) The development of occupational sex-role stereotypes, occupational preferences and academic preferences in children at ages 8, 12 and 16, Educational Psychology, 19(1), pp. 17–35 Nursing & Midwifery Council. (2016). Annual equality and diversity report: 2015-2016. London: Nursing & Midwifery Council. OECD. (2015). The ABC of Gender Equality in Education: Aptitude, Behaviour, Confidence. OECD: Paris. Ofcom. (2016). Children and parents: media use and attitudes report. London: Ofcom Office for National Statistics (ONS). (2011). Region and Country Profiles, Key Statistics - October 2011. London: ONS.
Pakistan Economic Survey 2014-15. Available at: http://www.finance.gov.pk/survey_1415.html.
Pakistan Economic Survey 2016-17. Available at: http://www.finance.gov.pk/survey_1617.html. World Bank
Group (2017c) Pakistan Development Update. Growth: A Shared Responsibilty.
Papamihali, P. (2017) ‘The Albanian Labour Market in 2017, “Monitor.al”’, Pedersen & Partners Executive Search.
Percy, C. and Mann, A. (2014). School-Mediated Employer Engagement and Labour Market Outcomes for Young Adults: Wage Premia, NEET Outcomes and Career Confidence In Employer Engagement in Education: Theories and Evidence (Routledge, 2014) eds. Anthony Mann, Julian Stanley and Louise Archer. London: Routledge. Pike, J., and Jennings. N. (2005). The effects of commercials on children‘s perceptions of gender appropriate toy use‘, Sex Roles 52 (1) (2005), 90. Putnam, R.D. (1995) Bowling alone: America’s declining social capital. Journal of Democracy, 6, 65-78.
January 2018
Page 84
#DrawingtheFuture
PWC. (2016). UK Economic Outlook: March 2016: Which industries will drive future jobs growth in the UK? London: PWC. Raffo, C., and M. Reeves. (2000). “Youth Transitions and Social Exclusion: Developments in Social Capital Theory.” Journal of Youth Studies 3 (2), 147–166. Rehill, J., Kashefpakdel, E. T., and Mann, A. (2017). How to make the most of careers events with employers: Technical report. London: Education and Employers. Reiss, M., Hoyles, C., Mujtaba, T., Riazi-Farzad, B., Rodd, M., Simon, S., Stylianidou, F. (2011) ‘Understanding Participation rates in post-16 Mathematics And Physics: Conceptualising and operationalising the UPMAP Project’, International Journal of Science and Mathematics Education 9 (2), 273-302. Sjøberg, S., and Schreiner, C. (2010). The ROSE project: An overview and key findings. Oslo: University of Oslo. Skelton, C., Francis, B. & Valkanova, Y. (2007) Breaking Down the Stereotypes: gender and achievement in schools (Manchester: Equal Opportunities Commission); Sport England. (2017). ‘Latest funding to keep nation active’. Sport England. October 2 2017. Available at: https://www.sportengland.org/news-and-features/news/2017/october/2/latest-funding-to-keep-nation-active/ (Accessed 03 January 2018) Stanley, J. & Mann, A. (2014). “Conceptualising Employer Engagement in Education” in Mann, A., Stanley, J. & Archer, L. eds. Understanding Employer Engagement in Education: theories and evidence. London: Routledge UNESCO. (2016). Textbooks pave the way to sustainable development: Policy paper 28. Paris: UNESCO Watson, M. and McMahon, M. (2005) ‘Children’s Career Development: A research review from a learning perspective’, Journal of Vocational Behavior, 67, 119–132. Westenberg, W. (2016). The influence of Youtubers on teenagers: A descriptive research about the role of YouTubers play in the life of their teenage viewers. University of Twente. Hughes, D., Luchinskaya, D., Lyonette, C., & Siemers, O. (2017) Gearing Up for STEM: Skills Strategy and Action
Plan, commissioned by Adviza in association with Thames Valley Berkshire Local Enterprise Partnership.
World Bank Group (2017a) Belarus: Economic Update. Available at:
http://pubdocs.worldbank.org/en/968931512545303062/BelarusEconomicUpdate-Dec2017-en.pdf.
World Economic Forum. (2017). The global gender gap report: 2017. Geneva: World Economic Forum
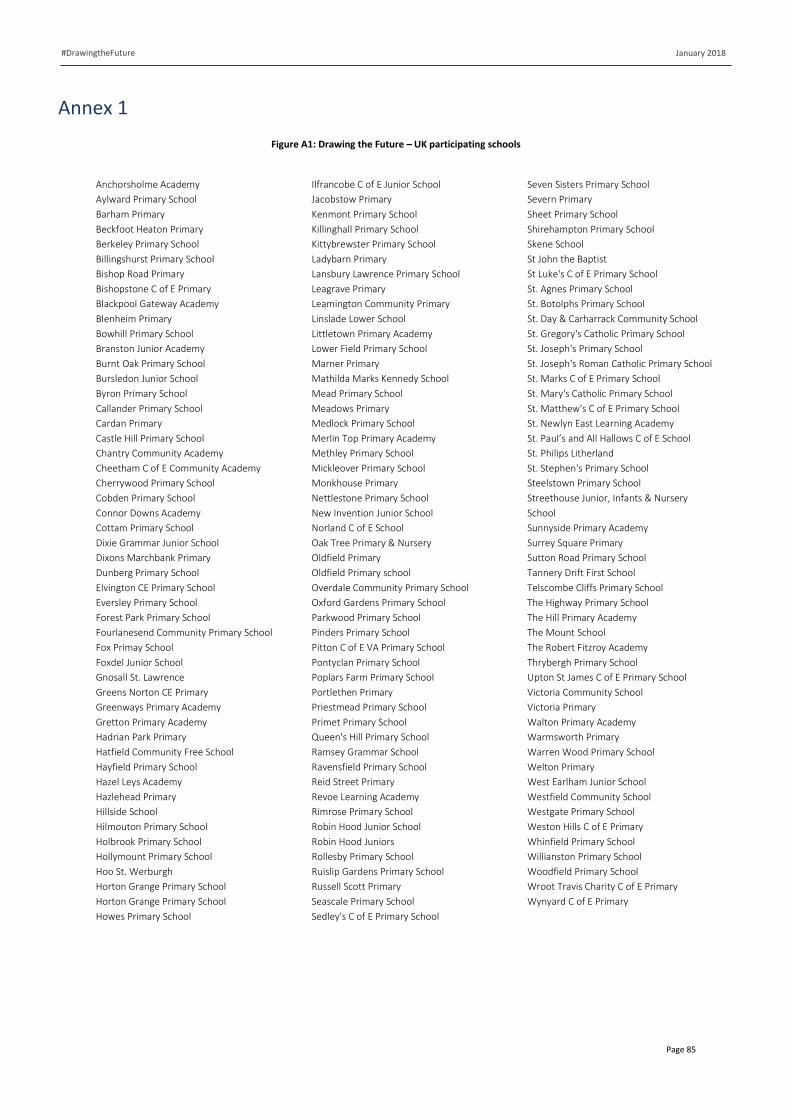
January 2018
Page 85
#DrawingtheFuture
Annex 1
Figure A1: Drawing the Future – UK participating schools
Anchorsholme Academy
Aylward Primary School
Barham Primary
Beckfoot Heaton Primary
Berkeley Primary School
Billingshurst Primary School
Bishop Road Primary
Bishopstone C of E Primary
Blackpool Gateway Academy
Blenheim Primary
Bowhill Primary School
Branston Junior Academy
Burnt Oak Primary School
Bursledon Junior School
Byron Primary School
Callander Primary School
Cardan Primary
Castle Hill Primary School
Chantry Community Academy
Cheetham C of E Community Academy
Cherrywood Primary School
Cobden Primary School
Connor Downs Academy
Cottam Primary School
Dixie Grammar Junior School
Dixons Marchbank Primary
Dunberg Primary School
Elvington CE Primary School
Eversley Primary School
Forest Park Primary School
Fourlanesend Community Primary School
Fox Primay School
Foxdel Junior School
Gnosall St. Lawrence
Greens Norton CE Primary
Greenways Primary Academy
Gretton Primary Academy
Hadrian Park Primary
Hatfield Community Free School
Hayfield Primary School
Hazel Leys Academy
Hazlehead Primary
Hillside School
Hilmouton Primary School
Holbrook Primary School
Hollymount Primary School
Hoo St. Werburgh
Horton Grange Primary School
Horton Grange Primary School
Howes Primary School
Ilfrancobe C of E Junior School
Jacobstow Primary
Kenmont Primary School
Killinghall Primary School
Kittybrewster Primary School
Ladybarn Primary
Lansbury Lawrence Primary School
Leagrave Primary
Leamington Community Primary
Linslade Lower School
Littletown Primary Academy
Lower Field Primary School
Marner Primary
Mathilda Marks Kennedy School
Mead Primary School
Meadows Primary
Medlock Primary School
Merlin Top Primary Academy
Methley Primary School
Mickleover Primary School
Monkhouse Primary
Nettlestone Primary School
New Invention Junior School
Norland C of E School
Oak Tree Primary & Nursery
Oldfield Primary
Oldfield Primary school
Overdale Community Primary School
Oxford Gardens Primary School
Parkwood Primary School
Pinders Primary School
Pitton C of E VA Primary School
Pontyclan Primary School
Poplars Farm Primary School
Portlethen Primary
Priestmead Primary School
Primet Primary School
Queen's Hill Primary School
Ramsey Grammar School
Ravensfield Primary School
Reid Street Primary
Revoe Learning Academy
Rimrose Primary School
Robin Hood Junior School
Robin Hood Juniors
Rollesby Primary School
Ruislip Gardens Primary School
Russell Scott Primary
Seascale Primary School
Sedley's C of E Primary School
Seven Sisters Primary School
Severn Primary
Sheet Primary School
Shirehampton Primary School
Skene School
St John the Baptist
St Luke's C of E Primary School
St. Agnes Primary School
St. Botolphs Primary School
St. Day & Carharrack Community School
St. Gregory's Catholic Primary School
St. Joseph's Primary School
St. Joseph's Roman Catholic Primary School
St. Marks C of E Primary School
St. Mary's Catholic Primary School
St. Matthew's C of E Primary School
St. Newlyn East Learning Academy
St. Paul’s and All Hallows C of E School
St. Philips Litherland
St. Stephen's Primary School
Steelstown Primary School
Streethouse Junior, Infants & Nursery
School
Sunnyside Primary Academy
Surrey Square Primary
Sutton Road Primary School
Tannery Drift First School
Telscombe Cliffs Primary School
The Highway Primary School
The Hill Primary Academy
The Mount School
The Robert Fitzroy Academy
Thrybergh Primary School
Upton St James C of E Primary School
Victoria Community School
Victoria Primary
Walton Primary Academy
Warmsworth Primary
Warren Wood Primary School
Welton Primary
West Earlham Junior School
Westfield Community School
Westgate Primary School
Weston Hills C of E Primary
Whinfield Primary School
Willianston Primary School
Woodfield Primary School
Wroot Travis Charity C of E Primary
Wynyard C of E Primary
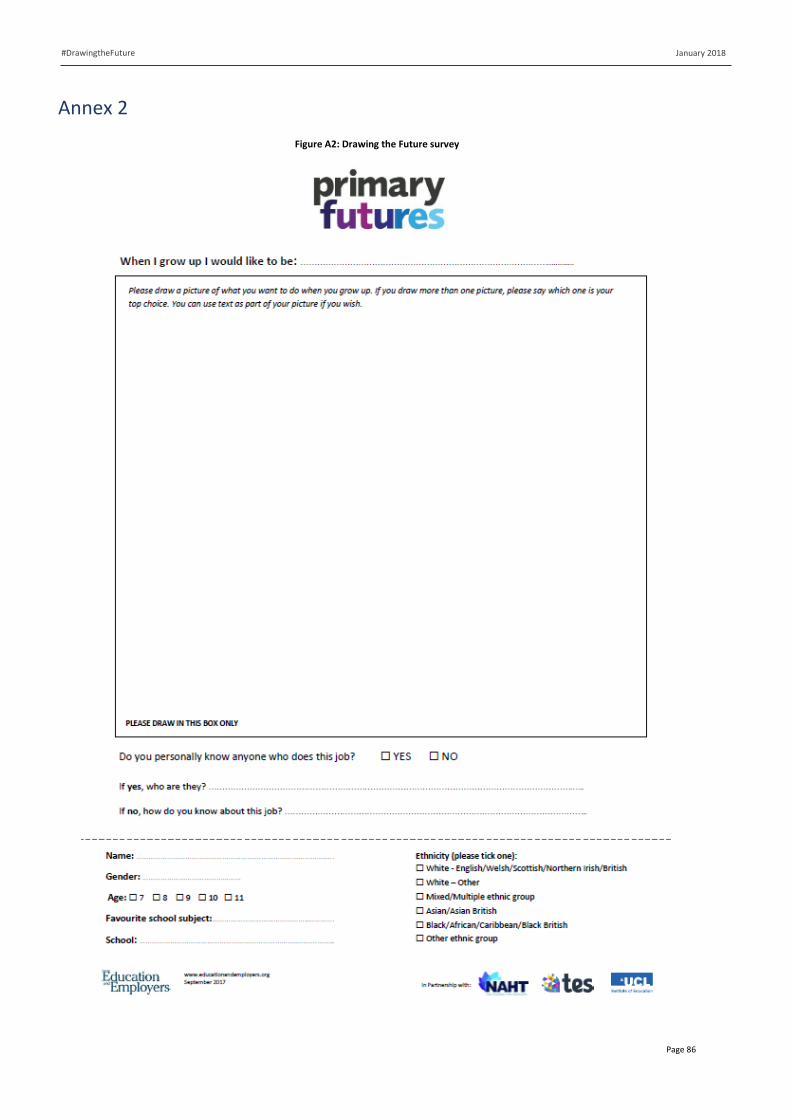
January 2018
Page 86
#DrawingtheFuture
Annex 2
Figure A2: Drawing the Future survey
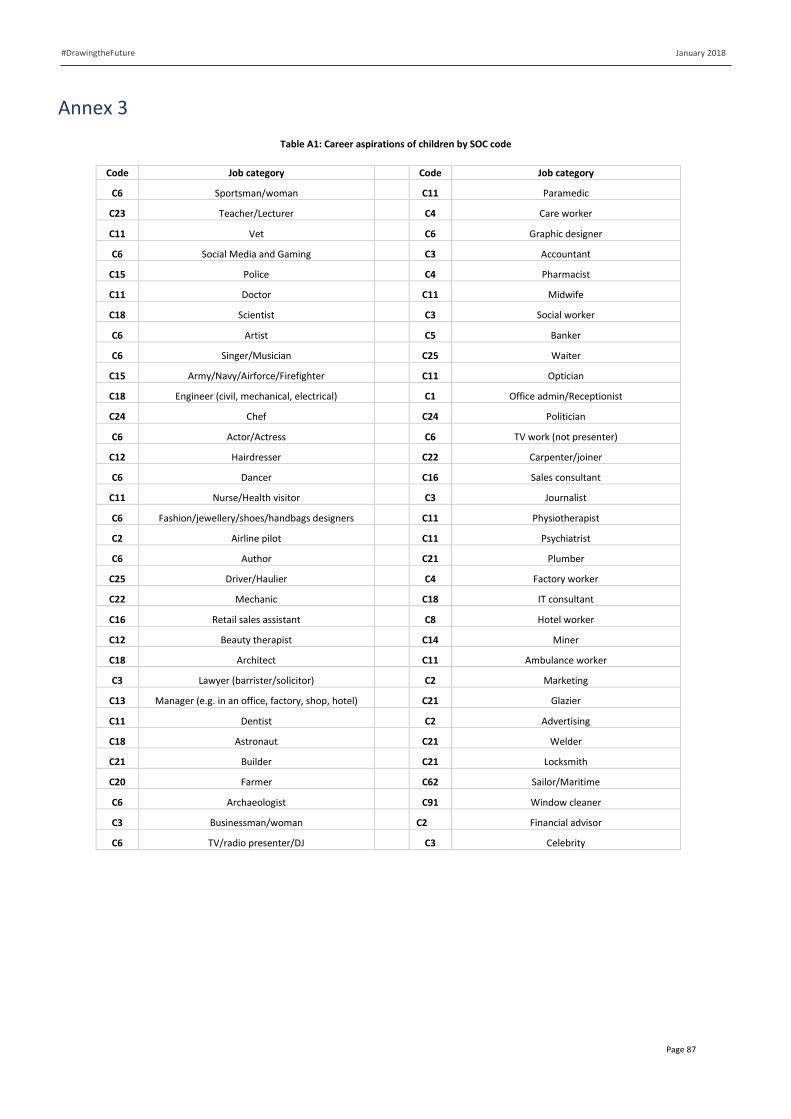
January 2018
Page 87
#DrawingtheFuture
Annex 3
Table A1: Career aspirations of children by SOC code
Code Job category Code Job category
C6 Sportsman/woman C11 Paramedic
C23 Teacher/Lecturer C4 Care worker
C11 Vet C6 Graphic designer
C6 Social Media and Gaming C3 Accountant
C15 Police C4 Pharmacist
C11 Doctor C11 Midwife
C18 Scientist C3 Social worker
C6 Artist C5 Banker
C6 Singer/Musician C25 Waiter
C15 Army/Navy/Airforce/Firefighter C11 Optician
C18 Engineer (civil, mechanical, electrical) C1 Office admin/Receptionist
C24 Chef C24 Politician
C6 Actor/Actress C6 TV work (not presenter)
C12 Hairdresser C22 Carpenter/joiner
C6 Dancer C16 Sales consultant
C11 Nurse/Health visitor C3 Journalist
C6 Fashion/jewellery/shoes/handbags designers C11 Physiotherapist
C2 Airline pilot C11 Psychiatrist
C6 Author C21 Plumber
C25 Driver/Haulier C4 Factory worker
C22 Mechanic C18 IT consultant
C16 Retail sales assistant C8 Hotel worker
C12 Beauty therapist C14 Miner
C18 Architect C11 Ambulance worker
C3 Lawyer (barrister/solicitor) C2 Marketing
C13 Manager (e.g. in an office, factory, shop, hotel) C21 Glazier
C11 Dentist C2 Advertising
C18 Astronaut C21 Welder
C21 Builder C21 Locksmith
C20 Farmer C62 Sailor/Maritime
C6 Archaeologist C91 Window cleaner
C3 Businessman/woman C2 Financial advisor
C6 TV/radio presenter/DJ C3 Celebrity

January 2018
Page 88
#DrawingtheFuture
Table A2: Top 25 aspirations by school FSM eligibility and gender (Boys)
Aspiration FSM eligibility at the school level
0-10% 11-20% 0-20% 21-35% 35-50+% 21%-50%+
All
Sportsman/woman 33.4% 35.7% 34.3% 33.4% 33.6% 33.5% 33.9%
Social Media and Gaming 9.5% 9.1% 9.4% 8.6% 10.7% 9.6% 9.5%
Police 6.6% 8.0% 7.1% 9.7% 10.5% 10.1% 8.6%
Army/Navy/Airforce/Firefighter 6.0% 5.8% 6.0% 6.0% 5.8% 5.9% 5.9%
Scientist 6.2% 3.0% 4.9% 4.9% 5.9% 5.4% 5.2%
Engineer (civil, mechanical, electrical) 5.1% 4.0% 4.7% 3.6% 4.0% 3.8% 4.2%
Teacher/Lecturer 2.9% 1.9% 2.5% 3.8% 3.0% 3.4% 2.9%
Doctor 1.5% 3.1% 2.1% 4.0% 2.5% 3.3% 2.7%
Vet 4.0% 1.9% 3.2% 1.5% 1.9% 1.7% 2.5%
Airline pilot 1.9% 2.9% 2.3% 2.3% 1.5% 1.9% 2.1%
Mechanic 0.8% 3.3% 1.8% 2.1% 2.4% 2.3% 2.0%
Driver/Haulier 1.9% 1.4% 1.7% 1.6% 3.1% 2.3% 2.0%
Singer/Musician 2.8% 1.6% 2.3% 1.2% 1.8% 1.5% 1.9%
Artist 1.9% 1.0% 1.6% 1.2% 1.8% 1.5% 1.5%
Actor/Actress 1.5% 2.4% 1.9% 1.3% 0.6% 0.9% 1.4%
Architect 1.5% 1.7% 1.6% 1.6% 0.7% 1.2% 1.4%
Chef 1.2% 1.4% 1.3% 1.7% 1.1% 1.4% 1.3%
Astronaut 1.1% 1.1% 1.1% 1.4% 0.9% 1.2% 1.1%
Builder 1.0% 1.1% 1.0% 1.0% 0.6% 0.8% 0.9%
Retail sales assistant 0.6% 0.3% 0.5% 1.2% 1.3% 1.2% 0.9%
Manager (e.g. in an office, factory, shop, hotel)
0.7% 1.4% 0.9% 0.8% 0.6% 0.7% 0.8%
Farmer 1.1% 1.1% 1.1% 0.1% 0.2% 0.1% 0.6%
Lawyer (barrister/solicitor) 0.7% 0.6% 0.7% 0.3% 0.4% 0.3% 0.5%
Author 0.9% 0.2% 0.7% 0.3% 0.3% 0.3% 0.5%
Archaeologist 0.5% 0.3% 0.4% 0.7% 0.2% 0.5% 0.4%
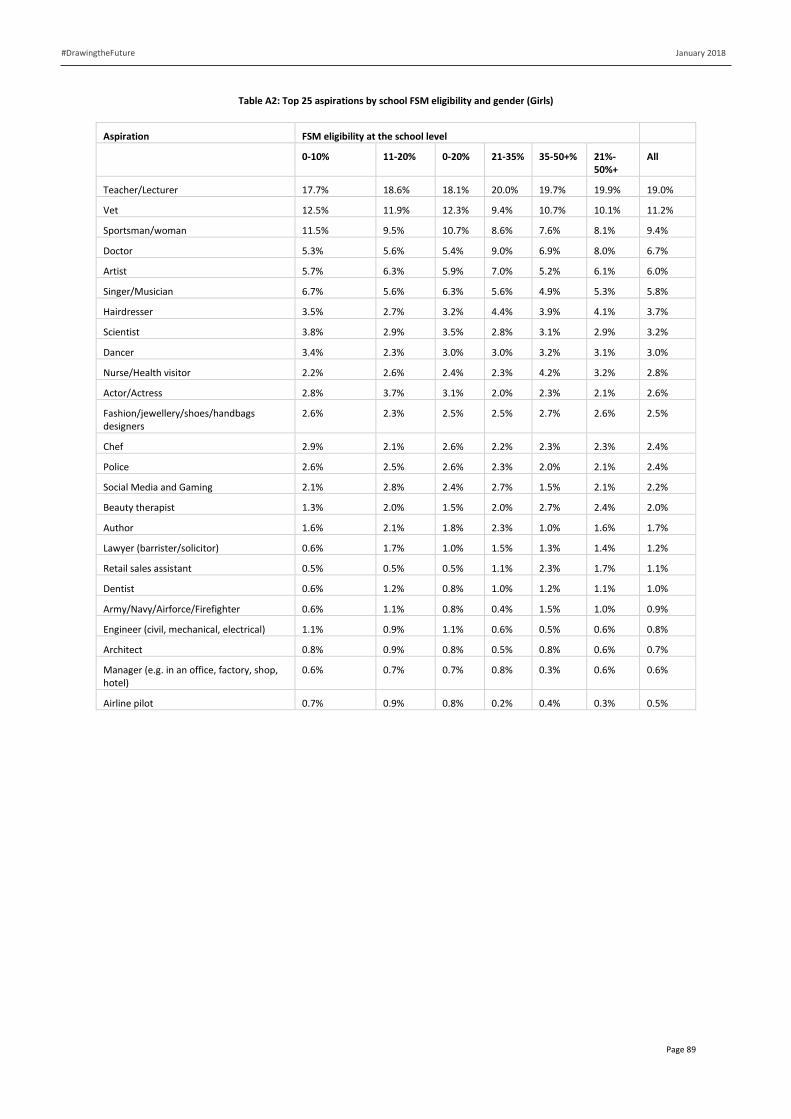
January 2018
Page 89
#DrawingtheFuture
Table A2: Top 25 aspirations by school FSM eligibility and gender (Girls)
Aspiration FSM eligibility at the school level
0-10% 11-20% 0-20% 21-35% 35-50+% 21%-50%+
All
Teacher/Lecturer 17.7% 18.6% 18.1% 20.0% 19.7% 19.9% 19.0%
Vet 12.5% 11.9% 12.3% 9.4% 10.7% 10.1% 11.2%
Sportsman/woman 11.5% 9.5% 10.7% 8.6% 7.6% 8.1% 9.4%
Doctor 5.3% 5.6% 5.4% 9.0% 6.9% 8.0% 6.7%
Artist 5.7% 6.3% 5.9% 7.0% 5.2% 6.1% 6.0%
Singer/Musician 6.7% 5.6% 6.3% 5.6% 4.9% 5.3% 5.8%
Hairdresser 3.5% 2.7% 3.2% 4.4% 3.9% 4.1% 3.7%
Scientist 3.8% 2.9% 3.5% 2.8% 3.1% 2.9% 3.2%
Dancer 3.4% 2.3% 3.0% 3.0% 3.2% 3.1% 3.0%
Nurse/Health visitor 2.2% 2.6% 2.4% 2.3% 4.2% 3.2% 2.8%
Actor/Actress 2.8% 3.7% 3.1% 2.0% 2.3% 2.1% 2.6%
Fashion/jewellery/shoes/handbags designers
2.6% 2.3% 2.5% 2.5% 2.7% 2.6% 2.5%
Chef 2.9% 2.1% 2.6% 2.2% 2.3% 2.3% 2.4%
Police 2.6% 2.5% 2.6% 2.3% 2.0% 2.1% 2.4%
Social Media and Gaming 2.1% 2.8% 2.4% 2.7% 1.5% 2.1% 2.2%
Beauty therapist 1.3% 2.0% 1.5% 2.0% 2.7% 2.4% 2.0%
Author 1.6% 2.1% 1.8% 2.3% 1.0% 1.6% 1.7%
Lawyer (barrister/solicitor) 0.6% 1.7% 1.0% 1.5% 1.3% 1.4% 1.2%
Retail sales assistant 0.5% 0.5% 0.5% 1.1% 2.3% 1.7% 1.1%
Dentist 0.6% 1.2% 0.8% 1.0% 1.2% 1.1% 1.0%
Army/Navy/Airforce/Firefighter 0.6% 1.1% 0.8% 0.4% 1.5% 1.0% 0.9%
Engineer (civil, mechanical, electrical) 1.1% 0.9% 1.1% 0.6% 0.5% 0.6% 0.8%
Architect 0.8% 0.9% 0.8% 0.5% 0.8% 0.6% 0.7%
Manager (e.g. in an office, factory, shop, hotel)
0.6% 0.7% 0.7% 0.8% 0.3% 0.6% 0.6%
Airline pilot 0.7% 0.9% 0.8% 0.2% 0.4% 0.3% 0.5%

Since 2012, Bank of America Merrill Lynch has been lead corporate supporter of Inspiring the Future and founding corporate partner of Inspiring Women, initiatives run by UK not-for-profit, Education and Employers.
Currently more than 39,000 volunteers are signed up to give career insights and inspiration to students across the UK and Ireland. This includes more than 1,000 employees from Bank of America Merrill Lynch who provide careers advice to students, and to young women in particular.
Quantum House, 22-24 Red Lion Court, Fleet Street, London EC4A 3EBTelephone 0207 566 4880www.educationandemployers.org@Edu_employers Registered Charity 1130760