exploring the nexus between oil prices and sectoral stock … · between oil price changes and...
TRANSCRIPT
Kisswani & Elian, Cogent Economics & Finance (2017), 5: 1286061http://dx.doi.org/10.1080/23322039.2017.1286061
FINANCIAL ECONOMICS | RESEARCH ARTICLE
Exploring the nexus between oil prices and sectoral stock prices: Nonlinear evidence from Kuwait stock exchangeKhalid M. Kisswani1* and Mohammad I. Elian1
Abstract: This paper investigates the relationship between oil prices (Brent and West Texas Intermediate (WTI)) and Kuwait Stock Exchange (KSE) prices at the sector level. In a nonlinear autoregressive distributed lag (NARDL) model, ten major sectors in Kuwait are studied using daily data from 3 January 2000 to 9 December 2015 for some sectors, and 14 May 2012 to 9 December 2015 for others. The findings show asymmetric long run effects between oil prices and some Kuwait sectoral stock prices. For these sectors, the empirical results offer evidence of short run asymmet-ric effect in case of WTI price measure, but no evidence of asymmetry was found in case of Brent price.
Subjects: Econometrics; International Finance; Corporate Finance
Keywords: oil price; Kuwait stock exchange; nonlinear ARDL; unit root
JEL classifications: G12; F3; Q43
1. IntroductionUnderstanding the dynamics that explain the volatility of stock prices is an important issue in the financial economics literature, since it is critical while formulating investment decisions by market
*Corresponding author: Khalid M. Kisswani, Department of Economics and Finance, Gulf University for Science and Technology, P.O. Box 7207, Hawally 32093, Kuwait E-mail: [email protected]
Reviewing editor:Robinson Kruse, Rijksuniversiteit Groningen, Netherlands
Additional information is available at the end of the article
ABOUT THE AUTHORSKhalid M. Kisswani is an associate professor of Economics at Gulf University for Science and Technology (GUST), Kuwait. He holds a PhD from the University of Connecticut (UCONN), USA. His research interests focus on Energy Economics, Applied Time Series, and Economic Development. Prof. Kisswani has published extensively in many reputable journals such as Applied Economics, Energy Economics, and Energy Policy among many others. He serves as a referee for many high tier journals within his field of research. Prof. Kisswani received several “Best Paper Award” in many international conferences for his research.
Mohammad I. Elian is an associate professor of Finance and Banking & currently is the Assistant Dean of College of Business at Gulf University for Science and Technology (GUST), Kuwait. He received his PhD in Finance & Risk Management from Australia. His research interests include corporate finance, risk management, and evaluating the performance of financial institutions.
PUBLIC INTEREST STATEMENTUnderstanding the effect of oil prices on economic variables is important for policy makers, and stock market prices are good example of such variables. Moreover, it is important to explore the effect of the increase and decrease in oil prices on the stock market prices at the sectoral level as this is important for the participants in the stock markets; buyers and sellers. This paper studies the asymmetric long-run dynamics between oil price changes and Kuwait stock prices at the sector level, using daily data. The empirical findings from testing ten major sectors show asymmetric long run effects between oil prices and some sectoral stock prices, and no evidence of asymmetry was found for the rest sectors.
Received: 26 October 2016Accepted: 19 January 2017Published: 07 February 2017
Page 1 of 17
© 2017 The Author(s). This open access article is distributed under a Creative Commons Attribution (CC-BY) 4.0 license.

Page 2 of 17
Kisswani & Elian, Cogent Economics & Finance (2017), 5: 1286061http://dx.doi.org/10.1080/23322039.2017.1286061
practitioners as well as policy makers. One of these dynamics is oil prices that have prominent role in the economy given its extensive usage whether as a final consumption product or as a production input. Meanwhile, the influence of oil price volatility on most macroeconomic indicators, including stock prices, has been documented by remarkable number of studies where the possibility of non-linearity between oil price changes and economic indicators is supported. This shows that oil price increase (negative oil price effect) tend to have wider influence on growth than do oil price decrease (positive oil price effect) (see Arouri, Jouini, & Nguyen, 2011; Lardic & Mignon, 2008; Zhang 2013).
Recently conducted literature reviews imply that more attention has been paid to the association between oil price changes and stock markets where this relation has become a recognizable field of research in energy and financial economics (see for example: Blanchard & Galí, 2007; Driesprong, Jacobsen, & Maat, 2008; Herrera & Pesavento, 2009; Park & Ratti, 2008; Sadorsky, 2001). One reason for using oil price changes as a factor affecting stock prices is that it is well documented that crude oil price changes has a critical and a noticeable impact on most economic activities, hence oil price changes are likely to have a direct influence on the behavior of stock prices, where stock markets act as the barometer of the overall economy (see Arouri & Nguyen, 2010). Likewise, oil price changes can influence firms’ future expected cash flows since oil is considered as a major input of production. Therefore, an increase in oil prices would increase production costs, leading to lower levels of profits, causing, subsequently, a depreciation in stock prices (see Apergis & Miller, 2009; Arouri & Nguyen, 2010; Moya-Martínez, Ferrer-Lapeña, & Escribano-Sotos, 2014). Additionally, changes in oil prices also influence the discount rate that is usually used while valuing equity securities. An increase in oil prices would create higher inflationary pressures, leading to higher interest rates, causing in turn negative impact on stock prices throughout the higher discount rates, according to the standard equity valuation model (see Miller & Ratti, 2009; Mohanty, Nandha, Turkistani, & Alaitani, 2011).1
In terms of the empirical findings in the literature, the relationship between oil price changes and stock prices has shown ambiguous results, reflecting the volatile dynamics between the two varia-bles over time. The effect of oil price changes on stock market prices at the sector level can be sum-marized into three scenarios. First: positive impact on oil-related and oil-substitute industries. Second: negative effect on oil-using industries, and third: no significant effect on non-oil-related in-dustries such as the financial industry. Broadstock and Filis (2014) report that there is some sort of agreement that both Oil & Gas industries along with the Mining industries tend to be positively af-fected by positive changes in oil prices, meanwhile, the opposite is true for the other industries, namely Transportation, Manufacturing, Food, Chemicals, Medical, Computer, Real Estate and General Services. Indeterminate findings are also found for industries such as Electricity, Engineering and financial industries (see for more details: Arouri & Nguyen, 2010; Arouri et al., 2011; Boyer & Filion, 2007; Broadstock, Cao, & Zhang, 2012; Broadstock & Filis, 2014; Degiannakis, Filis, & Floros, 2013; El-Sharif, Brown, Burton, Nixon, & Russell, 2005; Elyasiani, Mansur, & Odusami, 2011; Hammoudeh & Li, 2005; Kilian & Park, 2009; Nandha & Faff, 2008).
At the regional and country specific framework, few studies have looked at the effect of oil prices on stock prices in developing countries, such as the Gulf Cooperation Council (GCC thereafter) econo-mies in general and Kuwait in particular. Moreover, this influence from a sector perspective even received lesser attention.2 On country specific perception, we argue that for Kuwait, the nexus be-tween oil prices and sectoral stock prices is very important where change in oil prices would have quite ambiguous impact on the country’s economy, since oil industry companies are state-owned entities. On one hand, the consequential upsurge in oil prices would result in buildup of revenues from exports, hence fostering public expenditures and boosting growth. Such an effect would count positively toward the country’s long-term economic robustness and volatility absorption capacity towards fluctuation in many structural economic and wealth influencing factors. However, on the other hand, an increase in oil prices would have an adverse impact on private-non-oil corporations since an increase in costs is foreseeable, causing an increase in costs of production. Accordingly, although Kuwait has a stable economic lookout and it is counted as one of the world’s top exporters of oil and gas with a relatively low production costs, noticeably, the country’s high economic outlook

Page 3 of 17
Kisswani & Elian, Cogent Economics & Finance (2017), 5: 1286061http://dx.doi.org/10.1080/23322039.2017.1286061
is affected by the latest volatile oil prices. This is quite true given the fact that the country is an oil producer and has a significant reliance on oil revenues, signaling a negative influence on economic concern where low oil prices exert a significant downward pressure on its economic front.
To this end, this paper used a nonlinear cointegration methodology to test for the potential asym-metric dynamics between oil price changes and stock prices at the sector level for Kuwait, an oil exporting economy, proposing that oil price changes affect sectors differently depending on many factors.3 We argue that the nonlinear cointegration test would lead to better identification of hetero-geneity of sector sensitivities to the oil price changes, signaling better understanding for energy policy decision-makers. Additionally, the effect of oil price changes on stock market has excessive impact on most economies whether oil-importing or oil-exporting markets.4
The paper is motivated by number of attributes. First, less attention has been devoted to the as-sociation between oil price changes and the market sectoral stock prices where ambiguous infer-ences were concluded, implying the need to conduct additional tests towards the association between the two variables (Li, Zhu, & Yu, 2012). Second, most studies are devoted to the industrial or developed economies, namely the United States, Canada, Japan, and many European economies, meanwhile few studies looked at the developing or emerging economies like Kuwait. Third, examin-ing the sectoral indices is more relevant technique towards capturing the feedback relationship be-tween oil price changes and stock market disturbances, since market aggregation index may hide the characteristics of various sector reports (see Arouri, Juini, & Nguyen, 2013; Degiannakis et al., 2013; Jouini, 2013; Kilian, 2009; Kilian & Park, 2009).
Fourth, for portfolio managers and investors, a complete understanding of the reaction of sectoral indices to oil price fluctuations offers key evidence about which stock market sectors to choose dur-ing times of uncertainty as to maximize returns or minimize risk. This leads to better awareness of the oil price transmission mechanism across sectors which is important for traders to make optimal investment portfolio decisions.5 Fifth, there is a need to broaden the understanding of the associa-tion between oil price changes and Kuwait sectoral stock prices as the country is among the major oil-producers worldwide, hence its equity values may be affected by changes in oil prices. Finally, Kuwait Stock Exchange is largely segmented, reflecting its position as an alternative promising port-folio strategy for most equity investors, particularly in terms of portfolio diversification in the re-gional aspect.
The contribution of this paper to the literature can be summarized in three folds. First, in the con-text of Kuwait, the paper examines the asymmetric long run effect of oil price changes on ten secto-ral stock prices, namely Banks, Consumer Goods, Consumer Services, Industries, Real Estate, Basic Material, Financial services, Oil & Gas, Technology and Telecommunication. This provides the chance to test whether oil price changes do have alike influence on stock prices regardless of discrepancies in different sectors. Second, our data spectrum is represented by a relatively recent sample of Kuwait sectoral stock market prices, besides using two measures of oil prices: the British oil price (Brent) and the West Texas Intermediate price (WTI). Third, the notable contribution of this paper comes from testing for cointegration using the recently developed nonlinear autoregressive distributed lags (NARDL) model of Shin, Yu, and Greenwood-Nimmo (2011), which extends the autoregressive dis-tributed lags (ARDL) bounds testing approach of Pesaran, Shin, and Smith (2001) to allow for esti-mating asymmetric long run as well as short run coefficients in a cointegration framework.
The empirical results show an asymmetric long run effects between oil prices and some Kuwait sectoral stock prices. As for the short run, the findings show asymmetric effect in case of WTI price measure, but symmetric effect in case of Brent price measure. On the whole, the findings give sup-port for using nonlinear models as they contribute better to understanding the long run relation-ships, hence, serving more effectively in policy-making.

Page 4 of 17
Kisswani & Elian, Cogent Economics & Finance (2017), 5: 1286061http://dx.doi.org/10.1080/23322039.2017.1286061
The rest of this paper is structured as follows: Section 2 briefly reviews the related literature. Section 3 describes the data and methodology used. Section 4 outlines the empirical findings, while conclusions and remarks are postulated in Section 5.
2. Literature reviewThough few studies have been devoted to the impact of oil price changes on stock prices at the sec-toral or industry level, there is no consensus on the nature of the relationship between the two vari-ables where the oil price exposure differs deeply among sectors. Up to now, the positive association between stock prices of Oil & Gas companies and oil price increases has been evidenced, where this is not the case for non-Oil & Gas sectors which show a weak or negative connection to oil price changes. Indeed, sectors that generate a large share of their revenues from oil and oil-related prod-ucts would usually exhibit a positive oil price exposure; conversely, sectors where oil is a crucial input for their operations would tend to display negative sensitivity to oil price changes [see Faff and Brailsford (1999) for the Australian market, Sadorsky (2001) and Boyer and Filion (2007) as per the Canadian context, and El-Sharif et al. (2005) for the UK market].
Faff and Brailsford (1999) show that an increase in oil prices has a negative influence on industries like paper and packaging, banks and transportation, while some other industries are better off in terms of their capability in passing to customers a portion of the extra costs that is triggered by the increase in oil prices, thereby reducing the negative impact on their profitability. Nandha and Faff (2008) examine 35 global industry indices for the period between 1983 and 2005 where they dem-onstrate that increase in oil prices has negative influence on most industries, however, this is not the case for non-Oil & Gas industries, the mining industry in particular. Arouri and Nguyen (2010) find-ings suggest that the sensitivity of industries to changes in oil prices differ impressively from one sector to another in Europe, while Gogineni (2010) concludes that the stocks of heavy oil reliance industries are significantly affected by oil price changes. He shows that financial and insurance in-dustries are negatively impacted by oil price changes.
Elyasiani et al. (2011) document significant evidence in which nine out of the 13 sectors analyzed show statistically significant association between their return and oil price changes, based on the fact that industries differ in their consumption of oil and, hence, exhibit a different sensitivity to oil price changes. Mohanty et al. (2011) used both country level and industry level stock market data and provide significant positive response of industry specific prices to oil shocks where evidence is shown to only 12 out of 20 industries of the sample. Additionally, by using linear and asymmetric models, Arouri (2011) tests for short-term association in both mean and variance in the aggregate as well as sector by sector levels in Europe. The responses of European sector stock markets to oil price changes suggest that the strength of the association between the two variables fluctuate considerably across sectors. For comparison purposes, Arouri et al. (2011) used the generalized VAR-GARCH approach on a sector level data to examine the extent of volatility transmission between oil price and stock markets in Europe and the United States. Their results reveal the existence of signifi-cant volatility spillover between the two variables where the spillover is unidirectional from oil mar-kets to stock markets in Europe; however, it is bidirectional as per the case of the US.
For the G7 countries, Lee, Yang, and Huang (2012) show that information technology and con-sumer staples sectors are found to be impacted most by oil price changes, followed by financial, utilities and transportation sectors. Li et al. (2012) investigate the relationship between oil prices and China’s stock market at the sector level, where the panel cointegration relationship between the two variables is confirmed at the disaggregated sector level. Their estimates suggest that the real oil price changes have a positive impact on sectoral stocks in the long run. Based on data from 10 European sectors, Degiannakis et al. (2013) suggest that the relationship between sector indices and oil price change over time and it is industry specific, concluding that both the origin of the oil price shock and the type of industry are important determinants of the correlation level between indus-trial sectors returns and oil prices.

Page 5 of 17
Kisswani & Elian, Cogent Economics & Finance (2017), 5: 1286061http://dx.doi.org/10.1080/23322039.2017.1286061
Over the weekly period from 10 January 2007 till 28 September 2011, Jouini (2013) examines the links between oil price changes and stock sector markets in Saudi Arabia. His findings show evidence of return and volatility transmission between the two factors. Cong, Weo, and Jiao (2013) investi-gate the interactive relationship between oil price changes and Chinese stock market, concluding no statistical significant impact of the oil price changes on the real stock prices of most China’s stock market indices, except for manufacturing index and some oil firms.
Broadstock and Filis (2014) examine the time-varying association between oil prices shocks and stock market for China and the US. While considering correlations from key selected industrial sec-tors, namely Metals & Mining, Oil & Gas, Retail, Technology and Banking they conclude that the effect differs widely across industrial sectors. Moya-Martínez et al. (2014) investigate the sensitivity of the Spanish stock market at the industry level to changes in oil prices over the period 1993–2010 where they conclude that the degree of oil price exposure of Spanish industries is rather limited, although significant differences are shown across industries.
Hamma, Jarboui, and Ghorbel (2014) examine the transmission of volatility between oil and seven sector stock indices of Tunisia using a bivariate GARCH model. Their results conclude a significant shock and volatility spillovers across oil and Tunisian sector stock market, however, the intensity of volatility interaction varies from one sector to another. By using weekly data on 10 sectoral indices over the period January 1197–February 2014, Caporale, Menla Ali, and Spagnolo (2015) explore the time-varying impact of oil price changes on stock prices in China where they conclude that oil price volatility affects stock returns positively during periods characterized by demand-side changes in all sectors, except the consumer services, financials and oil & Gas sectors, in which the later sectors exhibit a negative response to oil price changes during periods with supply-side changes. Huang, An, Gao, and Huang (2015) investigate the multiscale dynamics association between oil price and stock market in China at the sector level where they conclude that the impact of oil price changes vary for different sectors over different time horizons.
The above-mentioned studies, though, have examined the relationship between oil price changes and stock market prices at the sector level; however, most are related to the developed economies (i.e., USA, UK, Europe, China and Australia). This paper extends the country-level analysis for Kuwait, as an emerging market, given the limited number of studies that have examined such relation in developing (emerging) economies, specifically in terms of sector-by-sector basis. In addition, for the GCC countries in general, most of the empirical work focused on the causal association between oil price and stock market (for example see Arouri et al., 2013; Hammoudeh & Choi, 2006; Jouini, 2013; Lescaroux & Mignon, 2008; Zarour, 2006), but less attention is devoted to the relationship between oil prices and industrial sector indices. Hence, this paper sheds light on the sectoral analysis and of-fers a comprehensive sector-by-sector analysis as per the case of Kuwait.
3. Data and methodologyTo investigate the link between Kuwait sectoral stock prices and oil prices, daily data on Brent and West Texas Intermediate nominal spot crude oil prices are taken from the website of Energy Information Administration (EIA) (www.eia.doe.gov). Data on daily Kuwait sectoral stock market pric-es is extracted from Kuwait Stock Exchange (KSE) historical data base profile. The stock prices were converted to US dollar using the daily exchange rate reported by Kuwait Central bank. Our daily data spans from 3 January 2000 to 9 December 2015 for some sectors and from 14 May 2012 to 9 December 2015 for others.6 We utilize ten sectors, namely: Banks, Consumer Goods, Consumer Services, Industries, Real Estate, Basic Material, Financial Services, Oil & Gas, Technology and Telecommunication.
The bulk of research on modeling sectoral stock market prices has been performed in a linear structure, nonetheless, many macroeconomic variables postulate nonlinear characteristics. Moreover, stock market prices are driven by the economic activities implying that its behavior could also demonstrate nonlinearity. Thus, using linear models would not be an appropriate approach in studying the relationships between sectoral stock market prices and other economic variables, as it

Page 6 of 17
Kisswani & Elian, Cogent Economics & Finance (2017), 5: 1286061http://dx.doi.org/10.1080/23322039.2017.1286061
could provide misleading evidence on such associations. Additionally, under nonlinearity structure, the reaction of stock market prices to the economy’s positive shocks may be different from the reac-tion to negative ones. Likewise, the presence of nonlinearities in the behavior of oil price, the key variable in this paper, has been documented by significant empirical literature (see Kisswani & Nusair, 2013). As such, oil price can cause asymmetric influences on sectoral stock market prices. For this reason, we investigate the potential asymmetric relationship between oil prices and Kuwait sectoral stock market prices for various sectors. This is done by employing the recently developed nonlinear autoregressive distributed lags (NARDL) model of Shin et al. (2011). This approach extends the autoregressive distributed lags (ARDL) bounds testing approach of Pesaran et al. (2001) to allow for estimating asymmetric long run as well as short run coefficients in a cointegration framework.
To start, we hypothesize the following asymmetric long run equation of sectoral stock market prices:
where (St) is sectoral stock market price, (Ot) is nominal spot oil price (hereafter oil price),7 α = (�
0, �
1, �
2) is a cointegration vector or a vector of long run parameters to be estimated, and the
disturbance (et) follows iid process with zero mean and finite variance, and it is independently dis-tributed. All variables are measured in logarithms. In Equation (1), O+
t and O−
t are partial sums of positive and negative changes in (Ot):
and
The NARDL setting is a cointegration test that employs positive and negative partial sum decomposi-tions, enabling for the detection of asymmetric effects in both the long and the short run. Indeed, the description of the NARDL allows for joint investigation of the issues of nonstationarity and non-linearity in the setting of an unrestricted error correction model. From Equation (1), the long run rela-tion between sectoral stock market prices and oil price increases is captured by α1, which is anticipated to be negative. Meanwhile, α2 captures the long run relation between sectoral stock market prices and oil price decreases, and is, also, expected to be negative, as they are believed to move in the opposite direction. We further expect that the decreases in oil price will cause different long run variations in the sectoral stock market prices as compared to oil price increases of the same magnitude, i.e. α2 ≠ α1. Hence, the long run association as characterized by Equation (1) indicates asymmetric long run oil price pass through to the sectoral stock market prices.
Following Shin et al. (2011), Equation (1) can be outlined in an ARDL context along the line of Pesaran et al. (2001) as:
where all the variables are as described in Equation (1), beside p and q are lag orders. The long run coefficients (�
1= −
�1
�0
and �2= −
�2
�0
) will represent the long run effects of oil price increases and
decreases, respectively, on the sectoral stock market prices. q∑
i=0
�+
i captures the short run effect of oil price
increases on sectoral stock market prices, while q∑
i=0
�−
i shows the short run effect of oil price decreases. The
specification of Equation (4) shows that the model captures the asymmetric short run impact of oil price variations on the sectoral stock market prices as well as the asymmetric long run effect.
(1)St = �0+ �
1O+
t + �2O−
t + et
(2)O+
t =
t∑
i=1
ΔO+
i=
t∑
i=1
max(ΔOi , 0)
(3)O−
t =
t∑
i=1
ΔO−
i =
t∑
i=1
min(ΔOi , 0)
(4)ΔSt = � + �0St−1 + �
1O+
t−1 + �2O−
t−1 +
p∑
i=1
�iΔSt−i +
q∑
i=0
(�+
iΔO+
t−i+ �
−
i ΔO−
t−i) + ut
Page 7 of 17
Kisswani & Elian, Cogent Economics & Finance (2017), 5: 1286061http://dx.doi.org/10.1080/23322039.2017.1286061
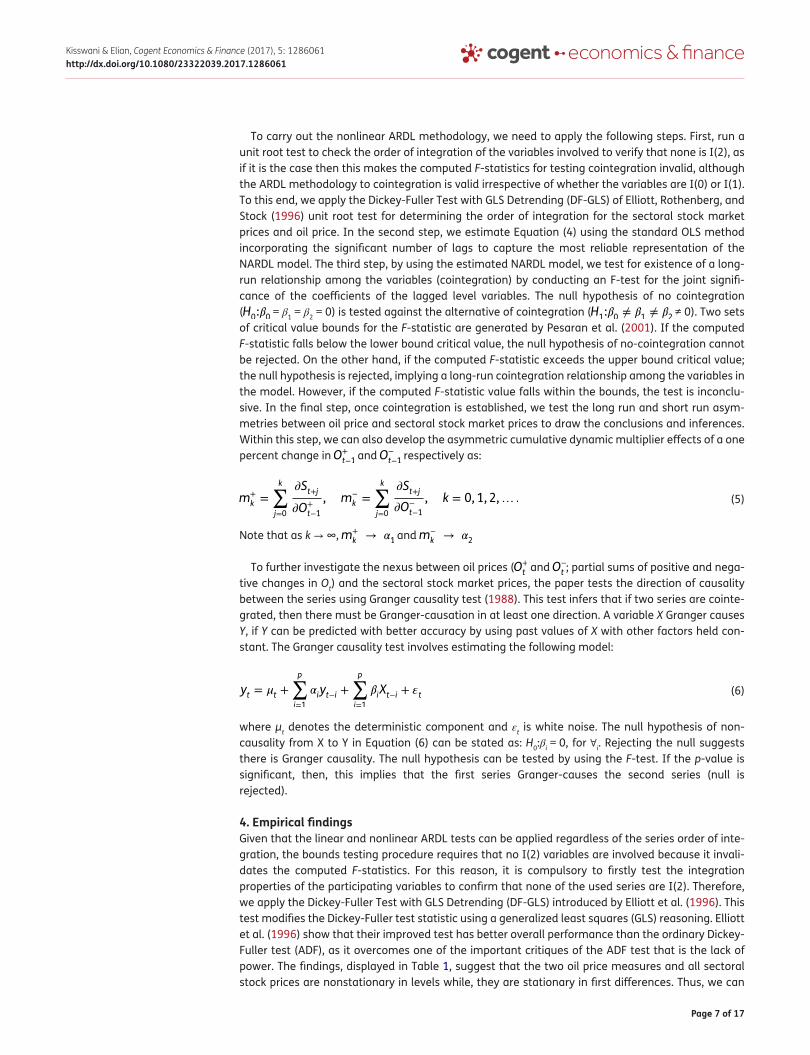
To carry out the nonlinear ARDL methodology, we need to apply the following steps. First, run a unit root test to check the order of integration of the variables involved to verify that none is I(2), as if it is the case then this makes the computed F-statistics for testing cointegration invalid, although the ARDL methodology to cointegration is valid irrespective of whether the variables are I(0) or I(1). To this end, we apply the Dickey-Fuller Test with GLS Detrending (DF-GLS) of Elliott, Rothenberg, and Stock (1996) unit root test for determining the order of integration for the sectoral stock market prices and oil price. In the second step, we estimate Equation (4) using the standard OLS method incorporating the significant number of lags to capture the most reliable representation of the NARDL model. The third step, by using the estimated NARDL model, we test for existence of a long-run relationship among the variables (cointegration) by conducting an F-test for the joint signifi-cance of the coefficients of the lagged level variables. The null hypothesis of no cointegration (H
0:�0 = β1 = β2 = 0) is tested against the alternative of cointegration (H
1:�0≠ �
1≠ �
2 ≠ 0). Two sets
of critical value bounds for the F-statistic are generated by Pesaran et al. (2001). If the computed F-statistic falls below the lower bound critical value, the null hypothesis of no-cointegration cannot be rejected. On the other hand, if the computed F-statistic exceeds the upper bound critical value; the null hypothesis is rejected, implying a long-run cointegration relationship among the variables in the model. However, if the computed F-statistic value falls within the bounds, the test is inconclu-sive. In the final step, once cointegration is established, we test the long run and short run asym-metries between oil price and sectoral stock market prices to draw the conclusions and inferences. Within this step, we can also develop the asymmetric cumulative dynamic multiplier effects of a one percent change in O+
t−1 and O−
t−1 respectively as:
Note that as k → ∞, m+
k→ �
1 and m−
k → �2
To further investigate the nexus between oil prices (O+
t and O−
t ; partial sums of positive and nega-tive changes in Ot) and the sectoral stock market prices, the paper tests the direction of causality between the series using Granger causality test (1988). This test infers that if two series are cointe-grated, then there must be Granger-causation in at least one direction. A variable X Granger causes Y, if Y can be predicted with better accuracy by using past values of X with other factors held con-stant. The Granger causality test involves estimating the following model:
where μt denotes the deterministic component and εt is white noise. The null hypothesis of non-causality from X to Y in Equation (6) can be stated as: H0:βi = 0, for ∀i. Rejecting the null suggests there is Granger causality. The null hypothesis can be tested by using the F-test. If the p-value is significant, then, this implies that the first series Granger-causes the second series (null is rejected).
4. Empirical findingsGiven that the linear and nonlinear ARDL tests can be applied regardless of the series order of inte-gration, the bounds testing procedure requires that no I(2) variables are involved because it invali-dates the computed F-statistics. For this reason, it is compulsory to firstly test the integration properties of the participating variables to confirm that none of the used series are I(2). Therefore, we apply the Dickey-Fuller Test with GLS Detrending (DF-GLS) introduced by Elliott et al. (1996). This test modifies the Dickey-Fuller test statistic using a generalized least squares (GLS) reasoning. Elliott et al. (1996) show that their improved test has better overall performance than the ordinary Dickey-Fuller test (ADF), as it overcomes one of the important critiques of the ADF test that is the lack of power. The findings, displayed in Table 1, suggest that the two oil price measures and all sectoral stock prices are nonstationary in levels while, they are stationary in first differences. Thus, we can
(5)m+
k=
k∑
j=0
�St+j
�O+
t−1
, m−
k =
k∑
j=0
�St+j
�O−
t−1
, k = 0, 1, 2,… .
(6)yt = �t +
p∑
i=1
�iyt−i +
p∑
i=1
�iXt−i + �t

Page 8 of 17
Kisswani & Elian, Cogent Economics & Finance (2017), 5: 1286061http://dx.doi.org/10.1080/23322039.2017.1286061
proceed with the bounds testing procedure (testing for cointegration in the nonlinear ARDL frame-work) since the tests indicate none of the variables is I(2).
In testing for cointegration, we estimate Equation (4) using the appropriate lag order. The bounds F-statistics of the nonlinear ARDL models are reported in Table 2. The findings document a long run relationship (cointegration) between Brent oil price and the following stock prices: Banks (at the 10%
Table 1. DF-GLS unit root test
Notes: The null hypothesis: has a unit root. The constant and trend terms are included in the test equations and the AIC is used to select the optimal lag order. Numbers in [ ] denote optimal lags. Critical values are: −3.48, −2.89, −2.57 at the 1, 5, and 10% levels respectively from Elliott et al. (1996, Table 1).
***Significance at the 1% level.
Variable Level First differenceWTI −1.58, [0] −3.64***, [18]
Brent −1.82, [0] −11.26***, [13]
Banks −0.95, [25] −6.8***, [23]
Basic materials −0.8, [1] −11.58***, [3]
Consumer goods −012, [12] −15.13***, [15]
Consumer services 0.19, [24] −4.84***, [23]
Financial services −0.45, [1] −24.54***, [0]
Industrials −0.24, [25] −8.15***, [24]
Oil & gas −0.52, [0] −3.59***, [9]
Real estate −0.46, [12] −5.69***, [23]
Technology −2.03, [2] −31.47***, [0]
Telecommunications −2.13, [0] −18.08***, [1]
Table 2. Bounds test for nonlinear cointegration
Notes: The bounds test includes a linear trend. The bounds test critical values are from Pesaran et al. (2001).*Significance at 10% level.**Significance at 5% level.***Significance at 1% level.
F-statistic Conclusion F-statistic ConclusionDependent variable Brent WTI
Banks 4.42* Cointegration 3.44 No cointegration
Basic materials 1.75 No cointegration 0.73 No cointegration
Consumer goods 4.3* Cointegration 2.74 No cointegration
Consumer services 6.69*** Cointegration 6.28*** Cointegration
Financial services 1.25 No cointegration 0.66 No cointegration
Industrials 5.48** Cointegration 4.02* Cointegration
Oil & gas 1.78 No cointegration 0.88 No cointegration
Real estate 5.57** Cointegration 2.23 No cointegration
Technology 1.49 No cointegration 1.4 No cointegration
Telecommunications 2.53 No cointegration 2.53 No cointegration
Critical values
Significance I0 Bound I1 Bound
10% 3.38 4.02
5% 3.88 4.61
1% 4.99 5.85

Page 9 of 17
Kisswani & Elian, Cogent Economics & Finance (2017), 5: 1286061http://dx.doi.org/10.1080/23322039.2017.1286061
Tabl
e 3.
Non
linea
r ARD
L es
timat
ion
resu
lts (B
rent
oil
pric
e)
*Sig
nific
ance
at 1
0% le
vel.
**Si
gnifi
canc
e at
5%
leve
l.**
*Sig
nific
ance
at 1
% le
vel.
Inde
pend
ent
varia
ble
Bank
sCo
nsum
er g
oods
Cons
umer
ser
vice
sIn
dust
rials
Real
est
ate
Coeffi
cien
tp-
valu
eCo
effici
ent
Coeffi
cien
tp-
valu
eCo
effici
ent
Coeffi
cien
tp-
valu
eCo
effici
ent
p-va
lue
Cons
tant
0.00
1084
**0.
0172
0.00
0763
0.15
290.
0012
04**
*0.
0029
0.00
0807
**0.
0457
0.00
0537
0.28
41
S(−1
)−0
.000
328
0.17
35−0
.000
520
0.16
09−0
.000
147
0.37
24−0
.000
174
0.48
62−0
.000
156
0.61
83
O+(−
1)−0
.000
679
0.29
16−0
.001
636*
*0.
0232
−0.0
0184
1**
0.00
14−0
.001
708*
**0.
0024
−0.0
0205
9***
0.00
18
O−(−
1)−0
.001
329*
*0.
0387
−0.0
0227
5***
0.00
21−0
.002
300*
**0.
0001
−0.0
0203
0***
0.00
04−0
.002
564*
**0.
0002
∆S(−
1)0.
0873
46**
*0.
0000
0.06
4437
***
0.00
010.
1679
16**
*0.
0000
0.19
4531
***
0.00
000.
1911
17**
*0.
0000
∆S(−
2)−0
.035
765*
*0.
0253
0.01
8199
0.25
610.
0208
910.
1976
∆S(−
3)0.
0335
93**
0.03
570.
0273
31*
0.08
75
∆ O+
0.00
0669
0.96
22
∆ O+(−
1)0.
0246
82*
0.07
85
∆ O+(−
2)−0
.024
426*
0.08
21
∆ O−
0.01
4534
0.22
76
Diag
nost
ics t
ests
ECM
t−1
−0.0
0033
4***
−0.0
0054
3***
−0.0
0015
3***
−0.0
0018
2***
− 0.
0001
1***
Adju
sted
R2
0.01
1805
0.01
0554
0.04
3663
0.04
4515
0.04
3347
LM(2
) 1.
6267
184.
5757
690.
3927
292.
3177
464.
6603
80
JB
2,63
6.45
***
1,18
6.49
***
1,44
7.81
***
1,40
8.27
***
1,64
0.86
***
Page 10 of 17
Kisswani & Elian, Cogent Economics & Finance (2017), 5: 1286061http://dx.doi.org/10.1080/23322039.2017.1286061
level), Consumer Goods (at the 10% level), Consumer Services (at the 1% level), Industrials (at the 5% level) and Real Estate (at the 5% level), meanwhile; WTI oil price is cointegrated with the follow-ing stock prices: Consumer Services (at the 1% level) and Industrials (at the 10% level).8 As for the rest of the sectors, no cointegration evidence was found.
The findings from Table 2 of the NARDL model reveal the following conclusions. First, the impact of oil price changes on stock prices show heterogeneity among sectors, meaning that the degree of oil price exposure is varying considerably across sectors. This is supported by the analysis where oil price changes do have a significant long-run effect on some sectors such as banks, consumer goods, consumer services, industrials and real estate; however, this is not the case for other sectors, name-ly: basic materials, financial services, oil & gas, technology and telecommunication. Second, since the association between oil price changes and stock market prices is sector specific in which stock prices tend to respond differently to oil price changes, differences in response across sectors desig-nate the importance of using the sectoral indices, rather than considering aggregate stock price in-dices to understand better the relationship between the two variables, confirming that an analysis using aggregate market level may lead to underestimate important sectoral effects.
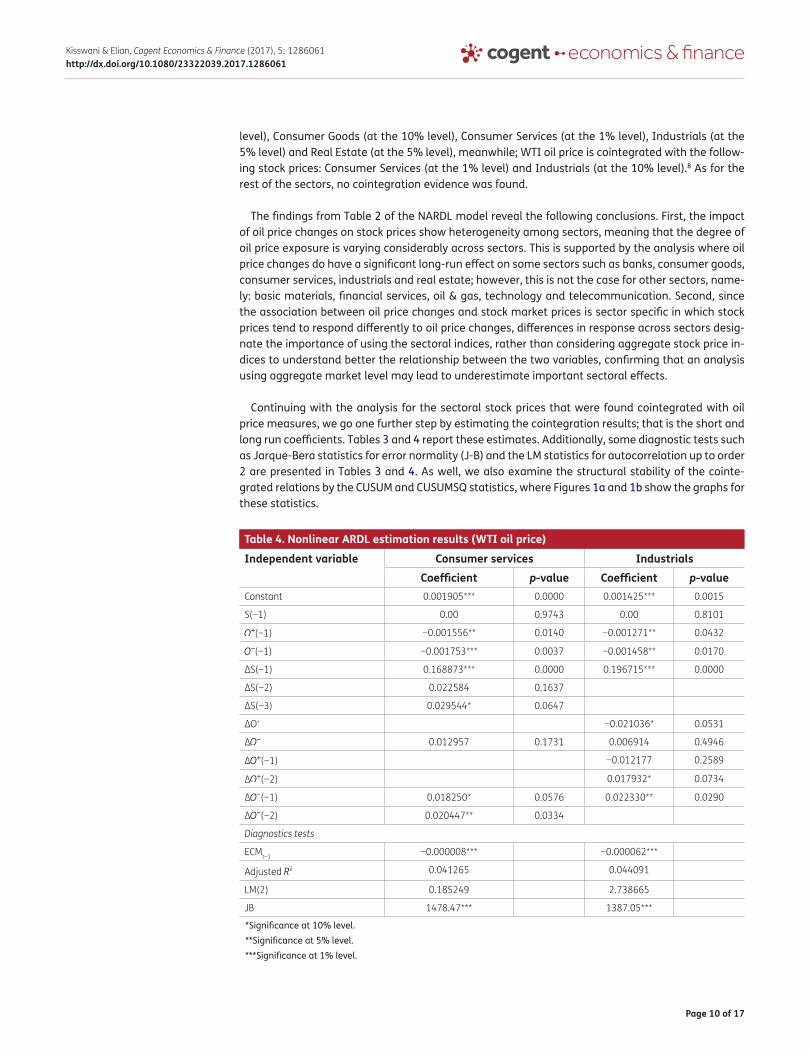
Continuing with the analysis for the sectoral stock prices that were found cointegrated with oil price measures, we go one further step by estimating the cointegration results; that is the short and long run coefficients. Tables 3 and 4 report these estimates. Additionally, some diagnostic tests such as Jarque-Bera statistics for error normality (J-B) and the LM statistics for autocorrelation up to order 2 are presented in Tables 3 and 4. As well, we also examine the structural stability of the cointe-grated relations by the CUSUM and CUSUMSQ statistics, where Figures 1a and 1b show the graphs for these statistics.
Table 4. Nonlinear ARDL estimation results (WTI oil price)
*Significance at 10% level.**Significance at 5% level.***Significance at 1% level.
Independent variable Consumer services IndustrialsCoefficient p-value Coefficient p-value
Constant 0.001905*** 0.0000 0.001425*** 0.0015
S(−1) 0.00 0.9743 0.00 0.8101
O+(−1) −0.001556** 0.0140 −0.001271** 0.0432
O−(−1) −0.001753*** 0.0037 −0.001458** 0.0170
∆S(−1) 0.168873*** 0.0000 0.196715*** 0.0000
∆S(−2) 0.022584 0.1637
∆S(−3) 0.029544* 0.0647
∆O+ −0.021036* 0.0531
∆O− 0.012957 0.1731 0.006914 0.4946
∆O+(−1) −0.012177 0.2589
∆O+(−2) 0.017932* 0.0734
∆O−(−1) 0.018250* 0.0576 0.022330** 0.0290
∆O−(−2) 0.020447** 0.0334
Diagnostics tests
ECMt−1 −0.000008*** −0.000062***
Adjusted R2 0.041265 0.044091
LM(2) 0.185249 2.738665
JB 1478.47*** 1387.05***

Page 11 of 17
Kisswani & Elian, Cogent Economics & Finance (2017), 5: 1286061http://dx.doi.org/10.1080/23322039.2017.1286061
Figure 1a. Brent oil price. (a)
-200
-150
-100
-50
0
50
100
150
200
00 02 04 06 08 10 12 14
CUSUM5% Significance
Banks
-0.2
0.0
0.2
0.4
0.6
0.8
1.0
1.2
04 06 08 10 12 14
CUSUM of Squares5% Significance
Banks
-200
-150
-100
-50
0
50
100
150
200
00 02 04 06 08 10 12 14
CUSUM5% Significance
Consumer Goods
-0.2
0.0
0.2
0.4
0.6
0.8
1.0
1.2
04 06 08 10 12 14
CUSUM of Squares5% Significance
Consumer Goods
-200
-150
-100
-50
0
50
100
150
200
04 06 08 10 12 14
CUSUM5% Significance
Consumer Services
-0.2
0.0
0.2
0.4
0.6
0.8
1.0
1.2
04 06 08 10 12 14
CUSUM of Squares5% Significance
Consumer Services
-200
-150
-100
-50
0
50
100
150
200
04 06 08 10 12 14
CUSUM5% Significance
Industrials
-0.2
0.0
0.2
0.4
0.6
0.8
1.0
1.2
04 06 08 10 12 14
CUSUM of Squares5% Significance
Industrials
-200
-150
-100
-50
0
50
100
150
200
00 02
00 02
00 02 04 06 08 10 12 14
CUSUM5% Significance
Real Estate
-0.2
0.0
0.2
0.4
0.6
0.8
1.0
1.2
00 02
00 02
00 02
00 02
00 02 04 06 08 10 12 14
CUSUM of Squares5% Significance
Real Estate

Page 12 of 17
Kisswani & Elian, Cogent Economics & Finance (2017), 5: 1286061http://dx.doi.org/10.1080/23322039.2017.1286061
The results of the diagnostic tests of both models (in Tables 3 and 4) suggest adequate specifica-tions as the models pass normality tests, and show free autocorrelation errors. Beside all error cor-rection coefficients (ECM) are negative, as required, and are highly significant. However, the ECMs show low rate of convergence to equilibrium, that is any deviation from the long run equilibrium between variables is adjusted and corrected in less than 1% for each period and takes at least more than 33 periods to return to the long-run equilibrium level. Additionally, the CUSUM statistics show that the long run equilibrium is stable, but that is not the case using the CUSUMSQ statistics.
Turning now to the short run estimates, the results, reported in Table 3, show that Brent oil price has symmetric effect on the stock prices of Banks, Consumer Services, Industrials and Real Estate sectors, where the coefficients on the partial sums of positive and negative changes in Ot (O
+
t and O−
t ) are not significant. However, the effect is asymmetric regarding Consumer Goods sector, where the oil price increase is significant at the 10% level while oil price decrease has no effect. As for WTI measure, the short run coefficients, reported in Table 4, show asymmetric effect for both sectors; Industrials and Real Estate.
Now we turn to the long-run coefficients, that are calculated using the estimated outcomes in Tables 3 and 4 and summarized in Table 5. By examining the results of Table 5, it appears that all the long run coefficients are negative as expected, but both variables, the partial sums of positive and
Table 5. Long-run relations
Note: Numbers in () are p-values.
Sector Brent oil price WTI oil price
O+
O−
O+
O−
Banks −2.072 (0.49) −4.05 (0.302)
Consumer goods −3.15 (0.308) −4.38 (0.23)
Consumer services −12.52 (0.44) −15.64 (0.40) −289.22 (0.97) −325.83 (0.97)
Industrials −9.8 (0.54) −11.65 (0.51) −20.38 (0.82) −23.37 (0.82)
Real estate −13.35 (0.65) −16.63 (0.64)
Figure 1b. WTI oil price. (b)
-200
-150
-100
-50
0
50
100
150
200
04 06 08 10 12 14
CUSUM5% Significance
Consumer Services
-0.2
0.0
0.2
0.4
0.6
0.8
1.0
1.2
04 06 08 10 12 14
CUSUM of Squares5% Significance
Consumer Services
-200
-150
-100
-50
0
50
100
150
200
04 06 08 10 12 14
CUSUM5% Significance
Industrials
-0.2
0.0
0.2
0.4
0.6
0.8
1.0
1.2
00 02 00 02
00 02 00 02 04 06 08 10 12 14
CUSUM of Squares5% Significance
Industrials

Page 13 of 17
Kisswani & Elian, Cogent Economics & Finance (2017), 5: 1286061http://dx.doi.org/10.1080/23322039.2017.1286061
negative changes in Ot (O+
t and O−
t ) carry coefficients that are different in size. This outcome provides evidence of asymmetric effects in the long run.
The former analysis points out to the following indications. First, the negative statistically signifi-cant cointegrating coefficients between oil prices and sectoral stock prices, intuitively, means stock market prices increase as the oil price decreases or decrease as the oil price increases, over the long run, implying sectoral reliance on oil at all levels of economic activity. Second, the negatively cointe-grated relationship between the two variables signifies that oil price changes affects stock prices negatively during periods differentiated by demand-side shocks in banks, consumer goods, con-sumer services, industrials and real estate sectors, however, this is not the case for other sectors, namely basic materials, financial services, oil & gas, technology and telecommunication where the cointegrated relationship between the two variables is not supported. Third, as for the type of oil price, sectoral stock prices responded differently to Brent and WIT oil price changes; where there is strong evidence showing that Brent oil price changes have more persistent effects on sectoral stock prices in Kuwait compared to WIT oil price changes.9
Turning our comments to the short-run dynamics, the results were substantially different as oil price changes were found to be insignificantly affect stock prices in some sectors, namely Banks, Consumer Services, Industrials and Real Estate. The negative response may be attributed to stock-holders cautionary reaction towards future demand shocks of oil supply shortfalls. The results where financial services and Oil & Gas stock prices respond negatively to oil price changes implies an over-reaction of these sectoral stock prices to such shocks. The asymmetric effects of oil price changes on stock prices implies that investors should hold oil sector stocks to diversify their investment portfo-lios. As such, we agree with Zhu, Su, Guo, and Ren (2016) where paying closer attention to the asym-metric effects between the two variables would be crucial to consider long and short run position in a bearish and bullish stock market.
Finally, we look at the Granger Causality test between oil prices (O+
t and O−
t ; partial sums of positive and negative changes in Ot) and the sectoral stock market prices that demonstrated long run rela-tion. The causality results, reported in Table 6, show that there is bidirectional causality between Brent positive oil price shock and stock prices of the following sectors: Banks, Consumer goods,
Table 6. Pairwise Granger causality tests
Notes: St is sectoral stock market price. O+
t and O−
t are the partial sums of positive and negative changes in oil price.
Lags included in the test are 2.*Significance at 10% level.**Significance at 5% level.***Significance at 1% level.
O+
t does not
Granger cause St
St does not
Granger cause O+
t
O−
t does not
Granger cause St
St does not
Granger cause O−
t
F-Statistic Prob. F-Statistic Prob. F-Statistic Prob. F-Statistic Prob.Brent oil price
Banks 3.64** 0.03 5.72*** 0.00 3.53** 0.03 1.59 0.20
Consumer goods
3.93** 0.02 4.97*** 0.01 4.53** 0.03 0.02 0.89
Consumer services
6.81*** 0.00 7.03*** 0.00 6.29*** 0.00 1.64 0.19
Industrials 3.45** 0.03 6.04*** 0.00 3.26** 0.04 0.21 0.81
Real Estate 2.58* 0.08 2.39* 0.09 2.57* 0.08 1.37 0.25
WTI oil price
Consumer services
7.27*** 0.00 5.92*** 0.00 7.93*** 0.00 0.63 0.53
Industrials 3.58** 0.03 3.87** 0.02 4.75*** 0.01 0.37 0.69

Page 14 of 17
Kisswani & Elian, Cogent Economics & Finance (2017), 5: 1286061http://dx.doi.org/10.1080/23322039.2017.1286061
Consumer services, Industrials and Real Estate. On the other hand, a unidirectional causality running from Brent negative oil price shock to stock prices of Banks, Consumer goods, Consumer services, Industrials and Real Estate is reported in Table 6. As for WTI price measure, we find bidirectional causality between WTI positive oil price shock and stock prices of Consumer services and Industrials, and unidirectional causality from WTI negative oil price shock to stock prices of Consumer services and Industrials.
5. ConclusionsIn this paper we investigated the dynamics between sectoral stock prices and selected oil prices, namely Brent and WTI measures, using Kuwait daily data. The paper contributes to the literature by using a nonlinear cointegration methodology; the nonlinear Autoregressive Distributed Lag cointe-gration technique, which allows for testing the asymmetric effects in both the long and short run time horizons. We employed daily data from 3 January 2000 to 9 December 2015 for some sectors and from 14 May 2012 to 9 December 2015 for others.
The cointegration results show that we can reject the null hypothesis of no cointegration for some sectors, revealing the presence of asymmetric long run effect between the two variables. As for the short run, we found asymmetric effect in case of WTI price measure, but symmetric effect in case of Brent price measure. On the whole, we conclude that using nonlinear models contribute better to understanding the long run relationships, thus helping more in policy-making. Our conclusion on non-linearity between oil price changes and stock market go in line with Lardic and Mignon (2008); Arouri et al. (2011) and Zhang (2013). The results on the long run cointegration relationship between the two variables and varying impact of oil price changes on stock prices is supported by Park and Ratti (2008) for Norway, Arouri (2011) for Europe, Li et al. (2012) for the Chinese stock market at the sector level, Degiannakis et al. (2013) for the European sectors, Hamma et al. (2014) for Tunisia, Caporale et al. (2015) and Huang et al. (2015) for China.
Our findings indicate, while in most cases financial assets are traded based on sector stock price, it is crucial for market traders to understand the oil price transmission mechanism across sectors in order to form their optimal portfolio decisions. Having said this, by using sectoral stock prices of an exporting economy, this paper provides useful information for market participants to build their speculation and arbitrage strategies and diversify their optimal portfolio across sectors. The findings also indicate the possibility to predict sectors stock prices movement as it is cointegrated with oil prices, which can be anticipated based on the expectation of oil demand and supply dynamics.
This paper proposes the following policy implications. First, the cointegration tendency between the two variables implies that investors need to be aware of the different behavior of sectoral stock prices towards oil price changes. Second, discrepancies in response of the sectoral stock prices to Brent and WIT oil price changes implies that investors and policymakers should consider altered benchmark information to maintain their decisions in different sectors over dissimilar time horizons. Third, the asymmetric effects implies that market participants should take up diverse strategies to hedge the risk of oil price changes, hence shrinking disturbance in the financial market caused by a significant oil price shocks. Fourth, the bidirectional causality between the two variables implies that by utilizing the information of one market, an investor can speculate in the other market in the long-run. This result may highlight the possibility of considering Kuwait stock exchange as an attractive destination for portfolio hedging and diversification strategies to hedge against oil price changes.
The findings of this paper may be of great interest to different economic parties. For portfolio managers, heterogeneity of the impact of oil price changes on sectoral stock prices may be applied to recognize possible sector-based investment and/or hedging opportunities. In addition, the chance of developing an optimal portfolio asset allocation decisions will enable investors to develop hedg-ing strategies which can reduce portfolio risk considerably. As for investors, the cointegration be-tween the two variables provide some degree of predictability towards stock prices, future-wise, where portfolio diversification, speculation, arbitrage and hedging strategies have to be developed

Page 15 of 17
Kisswani & Elian, Cogent Economics & Finance (2017), 5: 1286061http://dx.doi.org/10.1080/23322039.2017.1286061
when one expects change in oil prices. Likewise, for risk management purposes, firms’ managers would have the chance to recognize that oil price changes constitute crucial portion of the overall market or systematic risk factor of their sectoral stock price. Finally, for policy makers, identifying the conduction between oil price changes and the sectoral stock price is very much helpful to enhance developing superior energy investment and consumption polices.
To this end, an extension of this paper can be examining the effect of oil price shocks on sectoral stock prices by considering the presence of structural breaks that have directly affected oil prices. The structural breaks could be a reason for not finding a long run relationship or could be a reason to cause the long-run relationship to change. Considering the structural breaks in the model could add value to the analysis, and this will be the objective of our future work.
AcknowledgmentsSpecial thanks go to the editor and anonymous referees for their helpful and constructive suggestions on previous version of this paper that greatly assisted this research. All remaining errors and omissions are our own.
FundingThe authors received no direct funding for this research.
Author detailsKhalid M. Kisswani1
E-mail: [email protected] I. Elian1
E-mail: [email protected] Department of Economics and Finance, Gulf University for
Science and Technology, P.O. Box 7207, Hawally 32093, Kuwait.
Citation informationCite this article as: Exploring the nexus between oil prices and sectoral stock prices: Nonlinear evidence from Kuwait stock exchange, Khalid M. Kisswani & Mohammad I. Elian, Cogent Economics & Finance (2017), 5: 1286061.
Notes1. For example, higher oil prices would result in an increase
in cost of inputs, upsurge in imports, leading to a pro-liferation in the inflation rate. In the market place, this leads to an increase in market interest rate, signaling higher cost of capital for most corporations, leading to lower stock returns. Furthermore, since oil price upsurge increases production costs for non-oil industries, this expected to trigger an increase in the cost of imported capital commodities, hence reversely affecting the possibilities of profits for the market listed corpora-tions. Inclusive, it is quite crucial for market listed firms, given the stock valuation theory in which the fair value of a stock is simply equal to the sum of its discounted future cash flows at different time horizons where an appropriate discount rate is applied. So, ascertaining the persuasive influences impacting these cash flows and its related discount rate is pertinent, considering oil price is one of those foremost inducing factors that cause volatility in the estimated corporate cash flows, hence causing volatility in firm’s stock price.
2. Bearing in mind that the stock markets of the GCC coun-tries (including Kuwait) experienced significant growth both in terms of market size and trading activity during much of 2000s, stimulated by the flow of large amounts of petro-dollars into these economies, forming an envi-ronment that can be characterized by the phenomenon “too much money chasing too few stocks”, (Balcilar & Ozdemir, 2013; Demirer, Jategaonkar, & Khalifa, 2015).
3. Of these factors; whether the sector is a net producer or net consumer of oil, the extent of the market compe-
tiveness, and the capability of transferring the increase in oil prices to consumers, finally, the capability and availability of the hedging instrument in the market place.
4. As for the oil-importing markets, an increase in oil prices would mean more expensive energy cost, causing a negative impact on the stock market via its negative ef-fect on firms’ expected earnings, whereas, the opposite is correct for the oil-exporting markets in which higher income and wealth can be attained, see Moya-Martínez et al. (2014).
5. More precisely, the feedback between crude oil price changes and sectoral stock market returns would provide an opportunity to explore speculators as well as regular investors’ trading behavioral sentiments while buying and selling stocks on daily basis. Those who are anticipating fast return will closely track movement in numerous stocks in order to capitalize on any relation-ship that might exist (see Louis & Balli, 2014). For in-stance, in case of inverse association between oil prices and industry sector returns, predictions of an increase in the price of oil may prompt investors to buy oil company stocks while selling industrial company stocks. Further-more, from portfolio management concern, identifying the heterogeneity of market sector sensitivities to oil price changes would validate the fact where there are sectors that are still show a diversification means dur-ing wide swings in oil prices, (see Arouri, 2011). For an economy teetering into recession, Hammoudeh, Yuan, and McAleer (2009) identify that investors may invest in defensive stocks, specifically those on the non-cyclical consumer goods sector, while they may invest in high tech sectors’ stocks in terms of a booming economy.
6. Daily data was adjusted to match the sequence of the differences between the working days between Kuwait Stock Market and oil markets.
7. In this paper, we use nominal oil prices as consumer price index at daily basis is not available. Narayan, Na-rayan, and Smyth (2007) illustrate that using daily data does not require identifying real values. This approach was also adopted by Ghosh and Kanjilal (2014).
8. The noticeable result was not finding cointegration be-tween oil price measures and Oil & Gas stock prices. At this point we don’t have any clear explanation for why this could be the case.
9. We believe, following Bernanke (2016) that providing an alternative clarifications of the tendency between the two variables to be positively cointegrated is reasonable. One reasonable explanation is that both are responding to underlying shifts in aggregate demand on the global level. Meaning both are reacting to one common influ-ential factor, namely unstiffening of global aggregate demand which affects both of firms’ profits and de-mand for oil, regardless whether we have net imports or net export economy. As such, the cointegration between

Page 16 of 17
Kisswani & Elian, Cogent Economics & Finance (2017), 5: 1286061http://dx.doi.org/10.1080/23322039.2017.1286061
the two variables may be justified by the idea that when stock prices respond positively to change in oil prices, such response may not be certainly because the oil change is momentous in itself, but because changes in oil prices acts as indicators for global demand and economic development. Two, the positive association between the two variables can be justified by additional factor, namely uncertainty and risk aversion. Three, for oil-producing economies, a reduction in oil prices may affect a country’s financial and economic performance by destructing the creditworthiness and the overall soundness of firms or sectors, hence reduction in firms’ stock prices. Finally, the association between the two variables may be significantly influenced by the origin of the oil price shock, in particular, the aggregate demand oil price changes generate significant changes (either upwards or downwards) in the association levels.
ReferencesApergis, N., & Miller, S. (2009). Do structural oil - market shocks
affect stock prices? Energy Economics, 31, 569–575. http://dx.doi.org/10.1016/j.eneco.2009.03.001
Arouri, M. (2011). Does crude oil move stock markets in Europe? A sector investigation. Economic Modelling, 28, 1716–1725. http://dx.doi.org/10.1016/j.econmod.2011.02.039
Arouri, M., & Nguyen, D. (2010). Oil prices, stock markets and portfolio investment: Evidence from sector analysis in Europe over the last decade. Energy Policy, 38, 4528–4539. http://dx.doi.org/10.1016/j.enpol.2010.04.007
Arouri, M., Jouini, J., & Nguyen, D. (2011). Volatility spillovers between oil prices and stock sector returns: Implications for portfolio management. Journal of International Money and Finance, 30, 1387–1405. http://dx.doi.org/10.1016/j.jimonfin.2011.07.008
Arouri, M., Juini, J., & Nguyen, D. (2013). On the relationship between world oil prices and GCC stock markets. Journal of Quantitative Economics, 10, 98–120.
Balcilar, M., & Ozdemir, Z. A. (2013). The causal nexus between oil prices and equity market in the U.S.: A regime switching model. Energy Economics, 39, 271–282. http://dx.doi.org/10.1016/j.eneco.2013.04.014
Bernanke, B. (2016). The relationship between stocks and oil prices. Brookings. Retrieved from https://www.brookings.edu/blog/ben-bernanke/2016/02/19/the-relationship-between-stocks-and-oil-prices/
Blanchard, O., & Galí, J. (2007). Real wage rigidities and the new Keynesian model. Journal of Money, Credit, and Banking, 39, 35–65. http://dx.doi.org/10.1111/jmcb.2007.39.issue-s1
Boyer, M., & Filion, D. (2007). Common and fundamental factors in stock returns of Canadian oil and gas companies. Energy Economics, 29, 428–453. http://dx.doi.org/10.1016/j.eneco.2005.12.003
Broadstock, D., Cao, H., & Zhang, D. (2012). Oil shocks and their impact on energy related stocks in China. Energy Economics, 34, 1888–1895. http://dx.doi.org/10.1016/j.eneco.2012.08.008
Broadstock, D., & Filis, G. (2014). Oil price shocks and stock market returns: New evidence from the United States and China. Journal of International Financial Markets, Institutions and Money, 33, 417–433. http://dx.doi.org/10.1016/j.intfin.2014.09.007
Caporale, G., Menla Ali, F., & Spagnolo, N. (2015). Oil price uncertainty and sectoral stock returns in China: A time-varying approach. China Economic Review, 34, 311–321. http://dx.doi.org/10.1016/j.chieco.2014.09.008
Cong, R., Weo, Y., & Jiao, J. (2013). Relationship between oil price shocks and stock market. An empirical analysis from China. Energy Policy, 36, 3544–3553.
Degiannakis, S., Filis, G., & Floros, C. (2013). Oil and stock returns: Evidence from European industrial sector indices in a time-varying environment. Journal of International Financial Markets, Institutions & Money, 26, 175–191. http://dx.doi.org/10.1016/j.intfin.2013.05.007
Demirer, R., Jategaonkar, S., & Khalifa, A. (2015). Oil price risk exposure and the cross-section of stock returns: The case of net exporting countries. Energy Economics, 49, 132–140. http://dx.doi.org/10.1016/j.eneco.2015.02.010
Driesprong, G., Jacobsen, B., & Maat, B. (2008). Striking oil: Another puzzle? Journal of Financial Economics, 89, 307–327.
Elliott, G., Rothenberg, T. J., & Stock, J. H. (1996). Efficient tests for an autoregressive unit root. Econometrica, 64, 813–836. http://dx.doi.org/10.2307/2171846
El-Sharif, I., Brown, D., Burton, B., Nixon, B., & Russell, A. (2005). Evidence on the nature and extent of the relationship between oil prices and equity values in the UK. Energy Economics, 27, 819–830. http://dx.doi.org/10.1016/j.eneco.2005.09.002
Elyasiani, E., Mansur, I., & Odusami, B. (2011). Oil price shocks and industry stock returns. Energy Economics, 33, 966–974. http://dx.doi.org/10.1016/j.eneco.2011.03.013
Faff, R., & Brailsford, T. (1999). Oil price risk and the Australian stock market. Journal of Energy Finance and Development, 4, 69–87. http://dx.doi.org/10.1016/S1085-7443(99)00005-8
Ghosh, S., & Kanjilal, K. (2014). Oil price shocks on Indian economy: Evidence from Toda Yamamoto and Markov regime-switching VAR. Macroeconomics and Finance in Emerging Market Economies, 7, 122–139. http://dx.doi.org/10.1080/17520843.2013.856333
Gogineni, S. (2010). Oil and the stock market: An industry level analysis. Financial Review, 45, 995–1010. http://dx.doi.org/10.1111/fire.2010.45.issue-4
Granger, C. (1988). Some recent development in a concept of causality. Journal of Econometrics, 39, 199–211. http://dx.doi.org/10.1016/0304-4076(88)90045-0
Hamma, W., Jarboui, A., & Ghorbel, A. (2014). Effect of oil price volatility on Tunisian stock market at sector-level and effectiveness of hedging strategy. Procedia Economics and Finance, 13, 109–127. http://dx.doi.org/10.1016/S2212-5671(14)00434-1
Hammoudeh, S., & Choi, K. (2006). Behavior of GCC stock markets and impacts of US oil and financial markets. Research in International Business and Finance, 20, 22–44. http://dx.doi.org/10.1016/j.ribaf.2005.05.008
Hammoudeh, S., & Li, H. (2005). Oil sensitivity and systematic risk in oil-sensitive stock indices. Journal of Economics and Business, 57, 1–21. http://dx.doi.org/10.1016/j.jeconbus.2004.08.002
Hammoudeh, S., Yuan, Y., & McAleer, M. (2009). Shock and volatility spillovers among equity sectors of the Gulf Arab stock markets. The Quarterly Review of Economics and Finance, 49, 829–842. http://dx.doi.org/10.1016/j.qref.2009.04.004
Herrera, A., & Pesavento, E. (2009). Oil price shocks, systematic monetary policy, and the “great moderation”. Macroeconomic Dynamics, 13, 107–137. http://dx.doi.org/10.1017/S1365100508070454
Huang, S., An, H., Gao, X., & Huang, X. (2015). Identifying the multiscale impacts of crude oil price shocks on the stock market in China at the sector level. Physica A: Statistical Mechanics and its Applications, 434, 13–24. http://dx.doi.org/10.1016/j.physa.2015.03.059
Jouini, J. (2013). Return and volatility interaction between oil prices and stock markets in Saudi Arabia. Journal of Policy Modeling, 35, 1124–1144. http://dx.doi.org/10.1016/j.jpolmod.2013.08.003

Page 17 of 17
Kisswani & Elian, Cogent Economics & Finance (2017), 5: 1286061http://dx.doi.org/10.1080/23322039.2017.1286061
© 2017 The Author(s). This open access article is distributed under a Creative Commons Attribution (CC-BY) 4.0 license.You are free to: Share — copy and redistribute the material in any medium or format Adapt — remix, transform, and build upon the material for any purpose, even commercially.The licensor cannot revoke these freedoms as long as you follow the license terms.
Under the following terms:Attribution — You must give appropriate credit, provide a link to the license, and indicate if changes were made. You may do so in any reasonable manner, but not in any way that suggests the licensor endorses you or your use. No additional restrictions You may not apply legal terms or technological measures that legally restrict others from doing anything the license permits.
Cogent Economics & Finance (ISSN: 2332-2039) is published by Cogent OA, part of Taylor & Francis Group. Publishing with Cogent OA ensures:• Immediate, universal access to your article on publication• High visibility and discoverability via the Cogent OA website as well as Taylor & Francis Online• Download and citation statistics for your article• Rapid online publication• Input from, and dialog with, expert editors and editorial boards• Retention of full copyright of your article• Guaranteed legacy preservation of your article• Discounts and waivers for authors in developing regionsSubmit your manuscript to a Cogent OA journal at www.CogentOA.com
Kilian, L. (2009). Not all oil price shocks are alike: Disentangling demand and supply shocks in the crude oil market. American Economic Review, 99, 1053–1069. http://dx.doi.org/10.1257/aer.99.3.1053
Kilian, L., & Park, C. (2009). The impact of oil price shocks on the u.s. stock market. International Economic Review, 50, 1267–1287. http://dx.doi.org/10.1111/iere.2009.50.issue-4
Kisswani, K., & Nusair, S. A. (2013). Non-linearities in the dynamics of oil prices. Energy Economics, 36, 341–353. http://dx.doi.org/10.1016/j.eneco.2012.09.007
Lardic, S., & Mignon, V. (2008). Oil prices and economic activity: An asymmetric cointegration approach. Energy Economics, 30, 847–855. http://dx.doi.org/10.1016/j.eneco.2006.10.010
Lee, B., Yang, C., & Huang, B. (2012). Oil price movements and stock markets revisited: A case of sector stock price indexes in the G-7 countries. Energy Economics, 34, 1284–1300. http://dx.doi.org/10.1016/j.eneco.2012.06.004
Lescaroux, F., & Mignon, V. (2008). On the influence of oil prices on economic activity and other macroeconomic and financial variables. OPEC Energy Review, 32, 343–380. http://dx.doi.org/10.1111/opec.2008.32.issue-4
Li, S., Zhu, H., & Yu, K. (2012). Oil prices and stock market in China: A sector analysis using panel cointegration with multiple breaks. Energy Economics, 34, 1951–1958. http://dx.doi.org/10.1016/j.eneco.2012.08.027
Louis, R., & Balli, F. (2014). Oil price and stock market synchronization in Gulf cooperation council countries. Emerging Markets Finance and Trade, 50, 22–51. http://dx.doi.org/10.2753/REE1540-496X500102
Miller, J., & Ratti, R. A. (2009). Crude oil and stock markets: Stability, instability, and bubbles. Energy Economics, 31, 559–568. http://dx.doi.org/10.1016/j.eneco.2009.01.009
Mohanty, S., Nandha, M., Turkistani, A., & Alaitani, M. (2011). Oil price movements and stock market returns; Evidence from Gulf cooperation council (GCC) countries. Global
Finance Journal, 22, 42–55. http://dx.doi.org/10.1016/j.gfj.2011.05.004
Moya-Martínez, P., Ferrer-Lapeña, R., & Escribano-Sotos, F. (2014). Oil price risk in the Spanish stock market: An industry perspective. Economic Modelling, 37, 280–290. http://dx.doi.org/10.1016/j.econmod.2013.11.014
Nandha, M., & Faff, R. (2008). Does oil move equity prices? A global view. Energy Economics, 30, 986–997. http://dx.doi.org/10.1016/j.eneco.2007.09.003
Narayan, P., Narayan, S., & Smyth, R. (2007). Are oil shocks permanent or temporary? Panel data evidence from crude oil and NGL production in 60 countries. Energy Economics, 30, 919–936.
Park, J., & Ratti, R. (2008). Oil price shocks and stock markets in the U.S. and 13 European countries. Energy Economics, 30, 2587–2608. http://dx.doi.org/10.1016/j.eneco.2008.04.003
Pesaran, M., Shin, Y., & Smith, R. (2001). Bounds testing approaches to the analysis of level relationships. Journal of Applied Econometrics, 16, 289–326. http://dx.doi.org/10.1002/(ISSN)1099-1255
Sadorsky, P. (2001). Risk factors in stock returns of Canadian oil and gas companies. Energy Economics, 23, 17–28. http://dx.doi.org/10.1016/S0140-9883(00)00072-4
Shin, Y., Yu, B., & Greenwood-Nimmo, M. (2011). Modelling asymmetric cointegration and dynamic multiplier in a nonlinear ARDL framework. New York, NY: Mimeo.
Zarour, B. (2006). Wild oil prices, but brave stock markets! The case of GCC stock markets. Operational Research, 6, 145–162. http://dx.doi.org/10.1007/BF02941229
Zhang, Y. (2013). The Links between the price of oil and the value of US dollar. International Journal of Energy Economics and Policy, 3, 341–351.
Zhu, H., Su, X., Guo, Y., & Ren, Y. (2016). The asymmetric effect of oil price shocks on the Chinese stock market: Evidence from a Quantile Impulse response perspective. Sustainability, 8, 1–19.