exploring the response of net primary productivity ... 2015 - exploring the response of net... ·...
TRANSCRIPT

lable at ScienceDirect
Journal of Environmental Management 150 (2015) 92e102
Contents lists avai
Journal of Environmental Management
journal homepage: www.elsevier .com/locate/ jenvman
Exploring the response of net primary productivity variations to urbanexpansion and climate change: A scenario analysis for GuangdongProvince in China
Fengsong Pei a, Xia Li b, *, Xiaoping Liu b, **, Chunhua Lao b, Gengrui Xia a
a School of Urban and Environmental Sciences, Jiangsu Normal University, Xuzhou, 221116, PR Chinab Guangdong Key Laboratory for Urbanization and Geo-simulation, School of Geography and Planning, Sun Yat-sen University, 135 West Xingang RD.,Guangzhou, 510275, PR China
a r t i c l e i n f o
Article history:Received 11 May 2014Received in revised form25 October 2014Accepted 4 November 2014Available online
Keywords:Urban expansionClimate changeNet primary productivityScenario analysis
* Corresponding author. Tel.: þ86 13924203023; fa** Corresponding author. Tel.: þ86 15802012393; fa
E-mail addresses: [email protected], [email protected] (X. Liu).
URL: http://www.geosimulation.cn/
http://dx.doi.org/10.1016/j.jenvman.2014.11.0020301-4797/© 2014 Elsevier Ltd. All rights reserved.
a b s t r a c t
Urban land development alters landscapes and carbon cycle, especially net primary productivity (NPP).Despite projections that NPP is often reduced by urbanization, little is known about NPP changes underfuture urban expansion and climate change conditions. In this paper, terrestrial NPP was calculated byusing Biome-BGC model. However, this model does not explicitly address urban lands. Hence, we pro-posed a method of NPP-fraction to detect future urban NPP, assuming that the ratio of real NPP to po-tential NPP for urban cells remains constant for decades. Furthermore, NPP dynamics were explored byintegrating the Biome-BGC and the cellular automata (CA), a widely used method for modeling urbangrowth. Consequently, urban expansion, climate change and their associated effects on the NPP wereanalyzed for the period of 2010e2039 using Guangdong Province in China as a case study. In addition,four scenarios were designed to reflect future conditions, namely baseline, climate change, urbanexpansion and comprehensive scenarios. Our analyses indicate that vegetation NPP in urban cells mayincrease (17.63 gC m�2 year�1e23.35 gC m�2 year�1) in the climate change scenario. However, futureurban expansion may cause some NPP losses of 241.61 gC m�2 year�1, decupling the NPP increase of theclimate change factor. Taking into account both climate change and urban expansion, vegetation NPP inurban area may decrease, minimally at a rate of 228.54 gC m�2 year�1 to 231.74 gC m�2 year�1.Nevertheless, they may account for an overall NPP increase of 0.78 TgC year�1 to 1.28 TgC year�1 in thewhole province. All these show that the provincial NPP increase from climate change may offset the NPPdecrease from urban expansion. Despite these results, it is of great significance to regulate reasonableexpansion of urban lands to maintain carbon balance.
© 2014 Elsevier Ltd. All rights reserved.
1. Introduction
Northern terrestrial ecosystem' acted as a carbon sink, asinferred from some inventory-based analyses and atmosphericinversion models (Fan et al., 1998; Gielen et al., 2013). However, theecosystem could become a carbon source owing to some distur-bances, such as climatic droughts (Ciais et al., 2005), insect out-breaks (Kurz et al., 2008) and urban expansion (Seto et al., 2012). It
x: þ86 (0) 20 84115833.x: þ86 (0) 20 84115833.duate.hku.hk (X. Li), liuxp3@
is crucial to explore the consequences of various ecological dis-turbances for elucidating carbon cycling and other ecosystemprocesses.
Climate change frequently occurs on a large extent, and has acritical impact on carbon cycling. By contrast, urban expansionoccurs on a local scale. However, it has a greater impact on theecosystem because of severe human interruption. Particularly,global urban area has expanded dramatically over the past decades.It is expected to experience more urban land expansion by 2030,nearly tripling the urban lands in 2000 (Angel et al., 2011; Setoet al., 2012). As a typical land use/cover change, urban expansionalters the compositions, structures and functions of terrestrialecosystem (Alberti, 2008; Seto et al., 2012). Many studies investi-gated the process of urban expansion (Liu et al., 2010; Li et al.,

F. Pei et al. / Journal of Environmental Management 150 (2015) 92e102 93
2011), climate change, and the impacts of climate change on carboncycle (Mu et al., 2008; Zhao and Running, 2010; Wu et al., 2012;Piao et al., 2013). However, researchers paid less attention to thecoupling effects of urban expansion and climate change on carboncycle, especially net primary productivity (NPP). Understanding therelationship among urban expansion, climate change and carboncycle is crucial for regulating urban development by city managers.
NPP refers to production of organic compounds, principallythrough the photosynthesis. It reflects not only the productioncapability of vegetation but also the ecological processes directly(e.g., carbon source/sink). Terrestrial NPP is dominated by climatechange, nitrogen limits, and some human-induced factors (e.g.,urban expansion) (Cramer et al., 1999; Wang and Houlton, 2009;Wu et al., 2014). In terms of climate change, Mu et al. (2008)assessed the contributions of increasing CO2 and climate changeto the carbon cycle by taking China as a case study. They found thatthe climate change reduced carbon storage of China's ecosystemswithout incorporating CO2 fertilization effects. Zhao and Running(2010) found a reduction of the global NPP (about 0.55 PgC) inthe period of 2000e2009. This reduction was mainly induced bydroughts that occurred during this time. As to urban expansion, Xuet al. (2007) assessed the impacts of urbanization on the NPP inJiangyin County in China. Yu et al. (2009) estimated the effects ofurban sprawl on the regional NPP of Shenzhen, China. They pointedout that NPP is often decreased by urban land transformation in theprocess of rapid urbanization. Seto et al. (2012) estimated the lossesof vegetation biomass to be 1.38 PgC (0.05 PgC year�1) based on theareas with high probability of urban expansion within the pan-tropics. However, Imhoff et al. (2004) and Pei et al. (2013) founda small increase of NPP concerning urbanization in some areas. Inaddition, Wu et al. (2014) assessed the contributions of urbaniza-tion and climate change to the NPP variations in the Yangtze RiverDelta in China over the last decade based on the DMSP/OLS (De-fense Meteorological Satellite Program Operational Linescan Sys-tem) nighttime light imagery data. Earlier studies frequentlyfocused on spatial consequences of NPP to urban land develop-ment, either at present or in the past, by using diagnostic analysis.Little is known about the locations, magnitudes, and frequencies ofNPP changes under future urban expansion and climate change. Itremains uncertain what is the relative contributions of climatechange and urban expansion to the global carbon cycle.
In the past decades, many ecosystem models were developedwhile modeling the NPP. These models can be categorized intothree major groups: statistical models, parametric models, andprocess models (Ruimy et al., 1994). The statistical models aresimple but lack of generality (Matsushita et al., 2004). Given theadvantage of remote sensing for direct observation, the parametricmodels can reliably assess vegetation productivity. This has beenconfirmed in several prior studies (Veroustraete et al., 2004;Maselli et al., 2013). However, parametric models have difficultyin evaluating future NPP for the lack of corresponding satelliteobservation in future periods. The process models describe thebiogeochemical cycling process (e.g., photosynthesis, respiration,assimilation and allocation) for natural vegetation. This type ofmodel is commonly limited by the high complexity, difficult cali-bration, and high computational cost when it is applied on aregional scale (Ruimy et al., 1994; Chiesi et al., 2007). For reflectingthe climate change over the next few decades, the vegetation NPPwas modeled by using one of the process models, Biome-BGC.Despite the predictive capability of Biome-BGC, the model haslimited effects on the simulation of non-natural vegetation in urbanlands. Urban NPP are frequently modeled by using: (1) top-downmodels; (2) bottom-up models; (3) hybrid models (Grimm et al.,2008; Trusilova and Churkina, 2008; Chen et al., 2014). In this pa-per, future urban NPPwasmodeled by using cellular automata (CA),
Biome-BGC, Carnegie-Ames-Stanford approach (CASA) and NPP-fraction method (Potter et al., 1993; Running and Hunt, 1993). Interms of land use/cover change, many methods were developed tocapture their dynamics. These methods can be categorized as twokinds: non-spatial and spatial models (Huang and Cai, 2007). Asone of the temporalespatial modeling approaches, CA has beenwidely employed in simulating land cover/use change. This isparticularly effective in the simulation of urban expansion, from asingle city to megalopolitan cluster area (Li et al., 2011; Kuang,2011; He et al., 2013). In this paper, the effects of urban expan-sion and climate change on NPP were investigated by using severalmodel simulations. The urban expansions in Guangdong Provincein China were simulated and predicted by using the CA model.Future climate change was projected by using downscalingmethods based on outputs from general circulation models (GCM).Terrestrial NPP was modeled based on Biome-BGC. A method ofNPP-fraction was designed for modeling future urban NPP. Conse-quently, the relative contributions of urban expansion and climatechange to future NPP were evaluated by using scenario analysis.
2. Materials and methods
2.1. Study area
The study area, which covers approximately 179,800 km2, islocated in Guangdong Province in southern China (Fig. 1). Thepredominant climate in this region is subtropical, with an annualrainfall of 1700 mm and average annual temperature of 19 �C. Theprovince mostly belongs to the monsoon climate region, withrainfall and heat energy in the same seasons, which provide afavorable environment for plant growth. The main ecosystem typesencompass evergreen broadleaf forest (EBF), evergreen needleleafforest (ENF), mixed forest, alpine shrub and so on. Since the eco-nomic reform in 1978, Guangdong has witnessed rapid and un-precedented urbanization, accompanied by massive urban landdevelopment. In 2010, Guangdong became one of the largest urbanareas at the provincial level in China, with urban areas five timeslarger than in 1990 (Wang et al., 2012).
2.2. Data preparation and preprocessing
Daily meteorological data (e.g., maximum temperature, mini-mum temperature, precipitation and solar radiation), which coversthe period of 1961e2009, were obtained from the Chinese NationalMeteorological Information Center. Data continuity and consis-tency were validated by screening and eliminating suspicious andmissing records. Vapor pressure deficit (VPD) and day length weresimulated by using the MTCLIM (Hungerford et al., 1989). In addi-tion, spatial distributions of various vegetation were obtained froma digitized map of China at a scale of 1:1,000,000 (Editorial Board ofVegetation Map of China, 2001). To fit the Biome-BGC modelproperly, original categories of the vegetation types in GuangdongProvince were reclassified into several classes: evergreen needle-leaf forest (ENF), evergreen broadleaf forest (EBF), shrub and grass.In terms of urban areas, urban lands were extracted by usinggeographic information system (GIS) from three land use/coverdatasets across China, which cover the years 2000, 2005 and 2008.The land use/cover dataset in 2000 was obtained from a digitizedmap at a 1: 100,000 scale, which was interpreted and producedbased on 512 scenes of Landsat TM/ETMþ images in 1999/2000 (Liuet al., 2005). In addition, the land use/cover data in 2005 and 2008were derived from the updated survey of land use/cover by eachprovince in China (Jing, 2009; Liu et al., 2005). For improving thecomputational efficiency and capturing the dynamics of urbanlandscape, all the land use data were aggregated to a cell size of

Fig. 1. Location of Guangdong Province in China.
F. Pei et al. / Journal of Environmental Management 150 (2015) 92e10294
500 m (1548 columns, 1176 rows). As to the soil-related data (e.g.,percent of sand, silt and clay, soil depth), they were obtained fromthe Harmonized World Soil Database (Freddy et al., 2008). A digitalelevation data with a 90 m resolution from the shuttle radartopography mission (SRTM) was used to derive the elevation andslope map. For validating and checking the NPP simulation, somefield-based biomass/NPP records, which were widely used in pre-vious studies (Ni, 2004; Feng et al., 2007), were collected from Luo's(1996) study. The data were primarily compiled based on the na-tional forest inventories from 1989 to 1993, and other publishedliterature (Ni, 2004; Jin et al., 2007).
2.3. CA model for simulation of urban expansion
Recent years have witnessed a growing trend of using CA toinvestigate complex urban dynamics (Batty and Xie, 1994; Li andYeh, 2002; Li et al., 2011). In this paper, urban land developmentprobability P(sij) of location (i,j) was simulated by using a logistic-CA model (Wu, 2002; Li et al., 2008):
P�stij�¼
�1þ ð � ln gÞa
�$
11þ exp
�� zij�$CONij$Uij (1)
zij ¼ aþXk
bkxk (2)
where g is a stochastic factor within the range (0, 1); a is aparameter to control the stochastic degree; zij is the suitabilityscore for urban land development; a is a constant from the logisticregression model, bk is coefficients of the kth spatial variable
concerning accessibility or proximity (e.g., distances to urbancenters, transport lines). a and bk are calibrated by using a logisticregressionmodel based on several spatial variables (Wu, 2002). Theterm CONij is a combined physical constraint, and Uij refers to thedevelopment density of developed cell (i,j).
The function CONij is defined as a conditional function, whichconverts the state of all land cells into a binary variable. This termreflects the combined physical constraint for urban land develop-ment. For instance, the value of zero will be assigned to all un-available cells for urban development (e.g., water, protected areas).
The neighborhood function Uij is calculated as:
Uij ¼
P3�3
con�stij ¼ urban
�
3� 3� 1(3)
where conðstij ¼ urbanÞ is a conditional function that returns true ifthe state sij is urban area. The neighborhood of a cell (i,j) is definedas eight neighboring cells.
Stþ1ij ¼
8<:
Converted; P�stij�� Pthreshold
Noncoverted; P�stij�< Pthreshold
(4)
At each iteration of the CA simulation, the development prob-ability PðstijÞ is compared with a threshold value (Pthreshold) to decideif a non-urban cell is to convert into an urbanized cell according toequation (4). In this study, urban expansionwas simulated by usingthe logistic-CA model components of geographical simulation andoptimization system (GeoSOS) (Li et al., 2011).

F. Pei et al. / Journal of Environmental Management 150 (2015) 92e102 95
2.4. Downscaling methods for projecting climate change
GCM model is one of the important tools used to assess globalclimate change. However, their resolution are too coarse to resolvesub-grid-scale features, such as topography, hydrology, and urbanexpansion (Salath�e, 2005). In past decades, many downscalingtechniques have been developed for adapting the fine-scale appli-cation of GCM. To reduce the uncertainty of downscaling methods,an ensemble of simulations was executed with two independentrealizations of downscaling, as discussed below.
2.4.1. Change factor (CF)In the core algorithm of CF, daily temperature (precipitation) is
calculated by combining the monthly difference (ratio) of temper-ature (precipitation) from climate model with the observed values.As to maximum and minimum temperature, a difference ofmonthly temperature is calculated between the future horizon
(Thadcm;2020s;mmax and T
hadcm;2020s;mmin , �C) and reference period
(Thadcm;ref ;mmax and T
hadcm;ref ;mmin ,�C) of the climate model outputs. Daily
maximum and minimum temperature at the future horizon
(T2020s;dmax and T
2020s;dmin ,�C) is then retrieved by adding this difference
to the observed daily temperature (Tobs;dmax and T
obs;dmin ,�C) (Chen et al.,
2011).
T2020s;dmax ¼ Tobs;dmax þ�Thadcm;2020s;mmax � T
hadcm;ref ;mmax
�(5)
T2020s;dmin ¼ Tobs;dmin þ�Thadcm;2020s;mmin � T
hadcm;ref ;mmin
�(6)
As to precipitation, a ratio is calculated based on GCM output forthe future horizon (Phadcm;ref ;m) and reference period (Phadcm;ref ;m).Daily precipitation for future horizon (P2020s,d) is obtained bymultiplying this ratio with the observed daily precipitation (Pobs,d)(Chen et al., 2011).
P2020s;d ¼ Pobs;d �Phadcm;2020s;m
Phadcm;ref ;m(7)
2.4.2. Statistical downscaling model (SDSM)The SDSM, which was developed by Wilby et al. (2002), is a
useful tool to downscale climate change. This algorithm is bestcategorized as a hybrid of stochastic weather generator andregression-based downscaling methods (Wilby and Wigley, 1997).The downscaling process is either unconditional (e.g., wet-dayoccurrence and temperature), or conditional (as with rainfallamount) on an event.
In terms of precipitation, the downscaled process can be per-formed in two steps: (1) estimating wet-day occurrence; (2)simulating total precipitation. For wet-day occurrence (Wi), a lineardependency is employed based on some predictor variables (Xij):
Wi ¼ b0 þXnj¼1
bjXij 0 � Wi � 1 (8)
By generating a random number, precipitation is supposed tooccur if the uniform random number r � Wi. If a wet-day occur-rence is obtained, total precipitation Pki is given by:
Pki ¼ g0 þXnj¼1
gjXij þ ei (9)
With regard to temperature, a direct linear relationship wasassumed between the predictand (Ui) and the chosen predictors(Xij):
Ui ¼ a0 þXn
ajXij þ ei (10)
j¼1where ei represents the model error. This parameter, which isassumed to follow a Gaussian distribution, is stochastically gener-ated from normally distributed random numbers.
No matter precipitation or temperature (Xij), all predictors (vij)are standardized based on their climatological mean (Vj) andstandard deviation (sj) calculated from the 40-year climatic data(1961e1990):
Xij ¼vij � Vj
sj(11)
In this paper, least squares calibration was performed to obtainthe downscaled parameters (a, b and g) by using the re-analysisdata for the period of 1961e1990 from the National Center forEnvironmental Prediction (NCEP) (Kalnay et al., 1996). A detaileddescription of SDSM can be found in Wilby et al. (1999), Wilby andDawson (2012).
2.5. Simulation of NPP using Biome-BGC
2.5.1. Model descriptionBiome-BGC is a process-based model designed to simulate the
energy and material cycle within terrestrial ecosystems (Runningand Hunt, 1993; White et al., 2000). This model requires input ofdaily meteorological data, eco-physiological parameters and gen-eral environmental information (e.g., soil and vegetation). Manybiogeochemical and hydrologic processes, including evapotranspi-ration, soil evaporation, photosynthesis and respiration by plant,can be simulated for various biomes.
For water vapor flux, PenmaneMonteith equation is used tocalculate the evaporation of soil water, the evaporation of canopy-intercepted water, and the transpiration of water from leaves:
e ¼s*RADþ
�r*cp*VPD
rHR
��
r*cp*rvAirPa*ε*rHR
�þ s
(12)
where e is the evaporation rate (W m�2 s); RAD is the incidentradiant flux density (W m�2); ε is the ratio of molecular weights ofwater vapor and air; rv is the resistance to water vapor flux (s m�1);rHR defines the combined resistances to convective and radiativeheat (s m�1); r is the density of air as a function of temperature; cpis the specific heat of air (J kg�1 �C�1); AirPa is the air pressure (Pa).
Photosynthesis is a process in which CO2, water molecules andsolar energy are combined to generate simple sugars by vegetation.In Biome-BGC, this reaction is characterized by using three equa-tions, which represent different controls on photosynthesis rate,respectively. First, diffusion constraint of CO2 on photosyntheticrate is represented as:
Avorj ¼ gmTc*�Ca � Ci
�(13)
where Ca represents the atmospheric concentration of CO2 (Pa); Ciis the intercellular concentration of CO2 (Pa); gmTc is the CO2
conductance converted from stomatal conductance to water vapor.In addition, photosynthesis rate is constrained by regulation of thecarboxylation rate of photosynthesis reaction in equation (14).
Av ¼Vcmax
�Ci � G*
�Ci þ Kc*
�1þ O2
Ko
��MRleafday (14)

F. Pei et al. / Journal of Environmental Management 150 (2015) 92e10296
Aj ¼J*�Ci � G*
�4:5*Ci þ 10:5*G* �MRleafday (15)
where Vcmax is the maximum rate of carboxylation; G* is the CO2
compensation point; Kc and Ko are the kinetic constants for rubiscocarboxylation and oxygenation (Pa); MRleafday is the daytime leafmaintenance respiration; J is the maximum rate of electron trans-port. Moreover, the photosynthesis rate is manipulated through theelectron transport limitation of RuBP regeneration as in equation(15). The smaller of the two results is then used as the rate of carbonassimilation.
As to the respiration, Biome-BGC simulates all the processes ofautotrophic (growth and maintenance) and heterotrophic(decomposition). For the growth respiration, it is assumed to be aconstant proportion for all new tissues. In addition, maximum ratefor decomposition and biomass loss are defined as constants. Therate is adjusted based on temperature and water availability. Thereis no decomposition if temperature is below �10 �C. As to themaintenance respiration (MR), a Q10 relationship with temperature(T) as well as nitrogen content (N) of tissues is used to determinethe rate as follows:
MR ¼ 0:218*N*Q ðT�20Þ=1010 (16)
The details of the Biome-BGC model can be found in the Biome-BGC project page: http://www.ntsg.umt.edu/project/biome-bgc.
2.5.2. Model run and parameterizationAn equilibrium of initial state is often required by Biome-BGC to
ensure the balance between input and output fluxes. Firstly, a spin-up run was performed to bring state variables in this model intodynamic equilibrium by usingmeteorology data during 1980e2009and a CO2 concentration of 372 ppm (Houghton et al., 2001). Byusing the spin-up endpoint as an initial condition, vegetation NPPwas simulated for the period of 1980e2039.
With the use of prescribed parameters concerning site condi-tions, meteorology, and eco-physiological values, Biome-BGC sim-ulates the flux and storage of energy, water, carbon, and nitrogen.For distinguishing different biomes, 42 parameters are required inthe core algorithm of Biome-BGC. It is a difficult task to determinethese generalized biome parameterizations in regional and globalmodeling. In this paper, these parameters were assigned in thefollowing way: (1) For each parameter, we conducted a literaturesearch of published studies for each biome; (2) A sensitivity anal-ysis was performed by varying all the parameters to theirmaximum andminimumvalues in published research (White et al.,2000; Ichii et al., 2005; Wang et al., 2005; Turner et al., 2007; ChuaFang et al., 2009); (3) A calibration was performed to obtain theparameters in Biome-BGC based on the NPP outputs from CASA,which relies on the assumption that remote sensing-based modelcan faithfully describing the NPP of existing ecosystems, at least ona regional scale. The key parameters are given in Table S1 (in sup-plementary material).
Table 1Scenario setup for simulating the contributions of urban expansion and climatechange to NPP.
Categories CO2 concentration Temperature/precipitation Urban lands(year)
Historical Future
Baseline scenario 372 ppm 1980e2009 1980e2009 2006Climate change
scenarioJohns et al. (2003) 1980e2009 Downscaled
HADCM32006
Urban expansionscenario
372 ppm 1980e2009 1980e2009 2020
Comprehensivescenario
Johns et al. (2003) 1980e2009 DownscaledHADCM3
2020
2.6. Simulation strategies for effects of urban expansion and climatechange on the NPP
2.6.1. NPP-fraction method for urban NPPVegetation NPP in urban lands are difficult to model because of
the uncertainty of plant fractions and the absence of ecologicalparameters towards artificial ecosystems. Thus, we proposed anNPP-fraction method to assess the urban NPP. It calculates the ur-ban NPP on the premise that the ratio of the real NPP in urban areasto their potential NPP of natural vegetation remains constant in
future decades. Considering the simulating capability of ecologicalprocesses, Biome-BGCwas selected tomodel future NPP. Despite itspredictive capability, Biome-BGC has limited effects on the simu-lation of artificial vegetation in urban lands (Zhao et al., 2006).Thus, one of remote sensing-based models, CASA, was also used tocalculate the vegetation NPP of non-natural vegetation, assumingthat the CASA can faithfully estimate vegetation productivity, atleast on a regional scale (Imhoff et al., 2004; Pei et al., 2013; Maselliet al., 2013).
The NPP-fractionwas calculated in two steps. First, the NPP afterurbanization (NPPurb,2000e2009) in recent years (2000e2009) wasevaluated by using CASA based on satellite data (Pei et al., 2013).Second, the potential NPP in urban lands (NPPpotential,2000e2009)during this periodwas calculated using Biome-BGC. Finally, an NPP-fraction (NPPurb,2000e2009/NPPpotential,2000e2009) was calculated byperforming a division of the potential NPP by the NPP after ur-banization. Consequently, urban NPP (NPPurb,2010�2039) could becalculated through a combination of the NPP-fraction and the po-tential NPP calculated by Biome-BGC (NPPpotential,2010�2039). Thedetailed expression can be shown as follows:
NPPurb;2010�2039 ¼ NPPpotential;2010�2039 �NPPurb;2000�2009
NPPpotential;2000�2009
(17)
2.6.2. Scenario design for future conditionsA scenario analysis technique was applied for future periods
(2010e2039) to elucidate the relative contributions of urbanexpansion and climate change to the NPP variations. Four scenarioswere designed and simulated according to the drivers they repre-sented (Table 1), namely, baseline scenario, climate change sce-nario, urban expansion scenario, and comprehensive scenario.
2.6.2.1. Baseline scenario. The baseline scenario was designed as areference scenario. It was established to describe future conditionswithout any climate change and urban expansion. In other words,this scenario reflects a continuation of present climatic conditionsand urban areas in future decades. In detail, the temperature andprecipitation data were recycled by using the historical climate(1980e2009). CO2 concentrationwas fixed at the level of 2000 (i.e.,372 ppm) (Houghton et al., 2001). In addition, urban area was set inaccordancewith the urban lands in 2006 in both present and futureperiods.
2.6.2.2. Climate change scenario. When representing future climatechange in Guangdong Province, one of the medium-emission sce-narios from the fourth assessment report (AR4) of IPCC (Intergov-ernmental Panel on Climate Change), SRES (special report onemissions scenarios) B2 was used, assuming a local solution toeconomic, social, and environmental sustainability in future de-cades (Bernstein et al., 2007). The climate change scenario

F. Pei et al. / Journal of Environmental Management 150 (2015) 92e102 97
addresses only conditions of climate change, but no urban landdevelopment. This scenario projects a fluctuation of temperature,precipitation and CO2 concentration, according to the IPCC SRES B2emission. In this paper, the temperature and precipitation datawere downscaled by using CF/SDSM based on the IPCC GCM output.The CO2 concentration was linearly interpolated based on Johnset al. (2003). However, no urban expansion was identified in thisscenario. That is, the urban area in 2006 was applied in futureperiods.
2.6.2.3. Urban expansion scenario. In the urban expansion scenario,we assumed a future climate stability in the coming decades. As forurban areas, future urban lands were supposed to increase at a ratesame as that of the past several years (2000e2005). Similar to thereference scenario, future meteorological data (e.g., temperature,precipitation) were replaced with the historical climatic data(1980e2009). In addition, CO2 concentration was set as constant(372 ppm) throughout the simulation.
2.6.2.4. Comprehensive scenario. The comprehensive scenario por-trays a future condition with changed temperature, precipitation,and CO2 concentration, along with urban expansion. This scenariotackled the impacts of both climate change and urban expansion.Meteorological data, CO2 concentration and urban lands were allassumed to be dynamic in future decades. The climatic conditionand CO2 concentration were set in line with the IPCC SRES B2scenario (Johns et al., 2003). Future urban patterns were simulatedby using the CA model. The drivers for each scenario, which con-cerns meteorological data, CO2 concentration, and urban expan-sion, were set up as shown in Table 1.
2.6.3. Scenario analyses for the relative contributions of futureurban expansion and climate change to NPP variations
To isolate the contribution of a single factor to future NPP var-iations, NPP differences between urban expansion scenario, climatechange scenario, comprehensive scenario and baseline period werecalculated by using the NPP results fromvarious scenarios (Table 3).The factor of climate change was accounted by calculating thedifference between model outputs of climate change scenario andbaseline scenario. In addition, the factor of urban expansion wascalculated by subtracting the results of baseline scenario from theurban expansion scenario. To account for both urban expansion andclimate change, the difference was also calculated between thecomprehensive scenario and baseline scenario. All these resultswere then analyzed at the cell level in urban area and at theregional scale in the whole Guangdong Province, respectively.
Table 2Confusion matrix between actual and simulated land use.
2005 2008
Simulatedurban
Simulatednon-urban
Accuracy(%)
Simulatedurban
Simulatednon-urban
Accuracy(%)
Actual urban 13,862 3881 78.13 16,088 9227 72.22Actual
non-urban4124 688,734 99.40 4282 680,031 99.37
Kappa 0.77 0.78
Note: number in each category refers to number of pixels in that category.
3. Results and discussions
3.1. Simulated urban expansion
3.1.1. Calibration of the CA modelSeveral spatial variables were retrieved by calculating distances
to urban centers, roads, expressways, and railways with GIS. Suit-ability of urban land development was computed by using logisticregression (i.e., the CAmodel is calibrated) (Wu andWebster,1998).By using this calibration method, zij in equation (2) was thusspecified as follows:
zij ¼ 2:744� 5:229xDIStown � 0:995xDISroad � 2:336xDISrailway
� 2:179xDISexpressway � 14:796xslope(18)
where xDIStown, xDISroad, xDISrailway and xDISexpressway represent thedistances to town centers, main roads, railways, and expressways,respectively; xslope is the slope.
In the CA simulation, numerous iterations are required to obtainsubtle patterns of urban expansion. Despite no accordance on howmany iterations should be used, 100e200 iterations are quitenormal (Li and Yeh, 2004). When calibrating the CA model, weperformed 200 iterations for producing a realistic pattern.
3.1.2. Validation and simulation of the CA modelThe CA model requires a validation when applied to the simu-
lation of a real city. Its accuracy, which is measured from land useconfusion matrix, is shown in Table 2. The predictions of urbandevelopment simulations are 78.13% and 72.22% correct for theyears 2005 and 2008. In addition, the kappa coefficients are 0.77and 0.78, respectively. These results show conformity between thesimulated and actual patterns of land use.
Fig. 2a shows the actual spatial distribution of urban lands in2000. Future land use patterns in 2020 were simulated, assumingthe continuation of current trends and dynamics of urban landdevelopment. Consequently, the urban lands of Guangdong Prov-ince may increase by about 126% in 2020, compared with the initialurban lands in 2000 (Fig. 2b). The urban expansions are mainlydistributed around the urban centers because of their high transi-tion suitability.
3.2. Projected climate change
Future climate conditions were projected based on the outputsof HADCM3 by using two downscaling techniques (SDSM and CF).To understand future climatic trends, we examined the climatechange for two periods (baseline vs. future). First, a baseline period(1961e1990) was defined in line with the recommendations of theWorld Meteorological Organization. Second, a 30-year average(2010e2039) of the projected climatic factors was calculated fromthe model outputs of two downscaling techniques (Diaz-Nieto andWilby, 2005). Seasonal and spatial dynamics were investigated forthese two periods.
3.2.1. Seasonal dynamicsTo elucidate the trends of future climate change, the difference
between future and reference period was calculated by month. Asshown in Fig. 3, both maximum and minimum temperatures infuture climate projection exhibit an increase in comparison withthe reference period in most months. For the maximum tempera-ture, the amount of increase varies between 0.97 (± 0.35) �C (forSDSM) and 0.96 (± 0.50) �C (for CF). When it concerns the mini-mum temperature, the variation shows a slight increase, from 1.09(± 0.32) �C (for SDSM) to 0.83 (± 0.46) �C (for CF). These resultsindicate an increase of future temperature, and are approximate tothe findings of Leung et al. (2006).
Precipitation is the most complex aspect of the downscalingproblem (Wilks, 2010). Fig. 4 shows the seasonal variations of
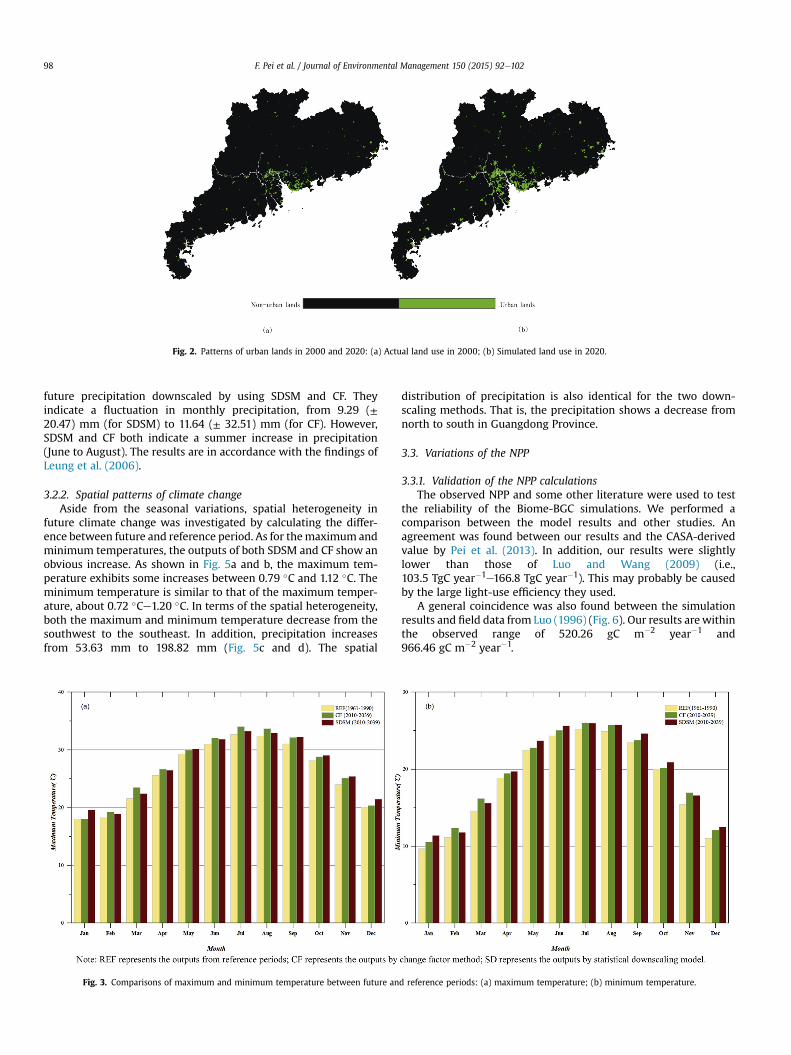
Fig. 2. Patterns of urban lands in 2000 and 2020: (a) Actual land use in 2000; (b) Simulated land use in 2020.
F. Pei et al. / Journal of Environmental Management 150 (2015) 92e10298
future precipitation downscaled by using SDSM and CF. Theyindicate a fluctuation in monthly precipitation, from 9.29 (±20.47) mm (for SDSM) to 11.64 (± 32.51) mm (for CF). However,SDSM and CF both indicate a summer increase in precipitation(June to August). The results are in accordance with the findings ofLeung et al. (2006).
3.2.2. Spatial patterns of climate changeAside from the seasonal variations, spatial heterogeneity in
future climate change was investigated by calculating the differ-ence between future and reference period. As for themaximum andminimum temperatures, the outputs of both SDSM and CF show anobvious increase. As shown in Fig. 5a and b, the maximum tem-perature exhibits some increases between 0.79 �C and 1.12 �C. Theminimum temperature is similar to that of the maximum temper-ature, about 0.72 �Ce1.20 �C. In terms of the spatial heterogeneity,both the maximum and minimum temperature decrease from thesouthwest to the southeast. In addition, precipitation increasesfrom 53.63 mm to 198.82 mm (Fig. 5c and d). The spatial
Fig. 3. Comparisons of maximum and minimum temperature between future an
distribution of precipitation is also identical for the two down-scaling methods. That is, the precipitation shows a decrease fromnorth to south in Guangdong Province.
3.3. Variations of the NPP
3.3.1. Validation of the NPP calculationsThe observed NPP and some other literature were used to test
the reliability of the Biome-BGC simulations. We performed acomparison between the model results and other studies. Anagreement was found between our results and the CASA-derivedvalue by Pei et al. (2013). In addition, our results were slightlylower than those of Luo and Wang (2009) (i.e.,103.5 TgC year�1e166.8 TgC year�1). This may probably be causedby the large light-use efficiency they used.
A general coincidence was also found between the simulationresults and field data from Luo (1996) (Fig. 6). Our results arewithinthe observed range of 520.26 gC m�2 year�1 and966.46 gC m�2 year�1.
d reference periods: (a) maximum temperature; (b) minimum temperature.

Fig. 4. Comparison of precipitation variations between future and reference periods.
Fig. 5. Spatial patterns of future temperature and precipitation, which downscaled by: (a) CFtemperature; (d) SDSM for minimum temperature; (e) CF for precipitation; (f) SDSM for pr
F. Pei et al. / Journal of Environmental Management 150 (2015) 92e102 99
3.3.2. Interannual variations of the NPPFig. 7 shows the anomalies of annual NPP in Guangdong Prov-
ince from 1981 to 2009. It exhibited some NPP fluctuation of about100 gC m�2 year�1 in this period. Particularly, it was decreasedto �158 gC m�2 year�1 in 2004. This could be mainly caused by thedroughts in this period (Zheng et al., 2010).
3.3.3. Scenario simulations of future NPPFor each scenario, we calculated the distributions and amounts
of average NPP in Guangdong Province during 2010e2039.Fig. 8aef illustrate the spatial distribution of vegetation NPP underthe following scenarios: reference, climate change, urban expan-sion and comprehensive scenarios. In the reference scenario, thetotal NPP is 97.71 TgC year�1. This exhibits a slight increase of3.00 TgC year�1 in comparison with current carbon uptake during2000e2009. This can be explained by the forest age of less than 40years in Guangdong Province (Wang et al., 2011).
In the climate change scenario, two simulations were performedby using the outputs from SDSM and CF, respectively. However,future NPP show a spatial accordance between the two simulations(Fig. 8b and c). It exhibits a slight increase, with total NPP of100.28 PgC year�1 to 100.80 PgC year�1. This is probably correlated
for maximum temperature; (b) SDSM for maximum temperature; (c) CF for minimumecipitation.

Fig. 6. Comparisons of simulated NPP with field study (r ¼ 0.905; P ¼ 0.013; n ¼ 6).
Fig. 8. Spatial distributions of vegetation NPP under different scenarios: (a) baselinescenario; (b) climate change scenario by CF; (c) climate change scenario by SDSM; (d)urban expansion scenario; (e) comprehensive scenario by CF; (f) comprehensive sce-nario by SDSM.
F. Pei et al. / Journal of Environmental Management 150 (2015) 92e102100
with CO2 fertilization, climate change, and forest age (Mu et al.,2008; Wang et al., 2011). As shown in Fig. 8d, urban expansionsreduce the NPP in Guangdong Province in comparison with thebaseline scenario, about 175 PgC year�1 (1.79% of total NPP). Thismay be caused by the growing urban expansion in GuangdongProvince by replacing vegetation with an impervious surface.
Both urban expansion and climate change are addressed in thecomprehensive scenario. The average NPP in this scenario variesbetween 98.49 TgC year�1 and 98.99 TgC year�1 during 2010e2039(Fig. 8e and f). This shows a slight increase compared with the valuein the reference scenario.
Except for the total NPP, relative contributions of urban expan-sion and climate change were also analyzed at the cell level and atthe provincial scale for future decades. As to urban cells influencedby urban land use and climate change, future NPP exhibits somedecrease by the former in urban expansion scenario, and someincrease by the latter in climate change scenario (Table 3).Concretely, climate change may cause an NPP increase of17.63 gCm�2 year�1 to 23.35 gCm�2 year�1, in comparisonwith thedecrease of 241.61 gCm�2 year�1 for urban expansion. The decreasefrom urban expansion is more than ten times greater than the in-crease from climate change. Take the two factors as a whole, they
Fig. 7. Interannual variations of the NPP anomalies from 1981 to 2009.
may account for an NPP decrease of 228.54 gC m�2 year�1 to231.74 gC m�2 year�1 in comprehensive scenario. As to the regionalconsequence at the provincial scale, NPP increases(2.57e3.09 TgC year�1), which are caused by the climate changefactor, may be found in climate change scenario. However, urbanexpansion may reduce the NPP of 1.75 TgC year�1 in urbanexpansion scenario. While integrating the two factors in thecomprehensive scenario, theymay account for a slight NPP increaseof 0.78 TgC year�1 to 1.28 TgC year�1, in contrast to the NPPdecrease at the cell level for urban area. This can be correlated withthe dominant roles of accumulative effects of NPP increase inducedby climate change for the whole province. For the non-linear
Table 3Scenario analyses of the vegetation NPP in future decades.
Climatechangefactor
Urbanexpansionfactor
Climate change/urbanexpansion
CF SDSM Historical data CF SDSM
Vegetation NPPfor urban cells(gC m�2 year�1)
17.63 23.35 �241.61 �231.74 �228.54
Total NPP at provincialscale (TgC year�1)
2.57 3.09 �1.75 0.78 1.28
Note: CF represents the outputs by change factor method; SDSM represents theoutputs by statistical downscaling model.

F. Pei et al. / Journal of Environmental Management 150 (2015) 92e102 101
relationship among urban expansion, climate change and carbonuptake by vegetation, the total effects of urban expansion andclimate change on NPP variations are not equal to the sum of theindividual effects from single factors.
Our results show that the NPP increase from climate changemay offset the NPP decrease from urban expansion in GuangdongProvince. However, appropriate policy guidance of urban expansionis in urgent need for reducing the negative impacts on carbonsequestration at local, regional and even global scales.
4. Conclusions
In this paper, the probable impacts of climate change and urbanexpansion on NPP in future decades were explored by using acombination of CA, downscaling GCM, and Biome-BGC models. Formodeling future urban NPP, an NPP-proportion method was pro-posed, assuming the ratio of real NPP in urban areas to their po-tential NPP will be constant in future decades. The relativecontributions of urban expansion and climate change to the NPPwere investigated by using scenario analysis. Four scenarios weredesigned according to whether or not they represent the drivers ofclimate change and urban expansion.
Consequently, urban lands in Guangdong Province were pro-jected as some increases in 2020 (about 126% greater than the ur-ban lands in 2000), based on the trends of urban expansion from2000 to 2005. In addition, both maximum and minimum temper-atures in this region reveal a slight increase than in the referenceperiod. As to precipitation, it may exhibit a fluctuation in mostmonths in future decades. Moreover, an obvious increase of pre-cipitation could be found in summer. According to scenario ana-lyses, both urban expansion and climate change exhibit noticeableeffects on the NPP. At the cell levels, urban expansion may reducethe NPP of 241.61 gC m�2 year�1, decupling the NPP increase fromclimate change (17.63 gC m�2 year�1e23.35 gC m�2 year�1). At theprovincial scale, urban expansion may reduce the NPP of1.75 PgC year�1. However, the factor of climate change may pro-mote the NPP, which varies between 2.57 PgC year�1 and3.09 PgC year�1. Colligating the two factors upward, theymay causean NPP increase of 0.78 PgC year�1 to 1.28 PgC year�1. This indicatesthat the NPP increase induced by climate changemay offset the NPPdecrease from urban expansion in the whole province. Despitethose results, a regulation of urban expansion is necessary in futureperiods.
The objectives of this paper are to explore the relative contri-butions of climate change and urban expansion to NPP variations.However, this study addresses only the IPCC SRES B2 emissionscenario concerning climate change. Future work will involveextending the study to a wide range of emission scenarios whilerepresenting the probable climate change in future decades. Thisincludes some other scenarios used in IPCC AR4 (e.g., SRES A1, A2,B1 and B2). In addition, this study used Guangdong Province, oneof the earliest economic reform regions in China, as a case study. Itis essential to extend the exploration to a broad spatial scale, suchas continental or global scale. As to the calculation of urban NPP,the processes of urban expansion on carbon cycling are complex,and not well simulated by many ecological models. In this study,urban expansion was modeled by using CA model, one of thebottom-up methods. Particularly, we assumed that future urbanexpansionwill follow an inertial trend, which was calibrated usinghistorical data (Li et al., 2011). It is uncertain how well these pa-rameters represent future urban development. In addition, a loosecoupling was conducted between CA and Biome-BGC. In ourfuture work, one of the challenging aspects is to develop a methodfor better representing the process between land use and carboncycle.
Acknowledgments
This study was supported by the National Natural ScienceFoundation of China (Grant No. 41371376 and 41401438) and theNational Science Fund for Excellent Young Scholars (Grant No.41322009).
Appendix A. Supplementary data
Supplementary data related to this article can be found at http://dx.doi.org/10.1016/j.jenvman.2014.11.002.
References
Alberti, M. (Ed.), 2008. Advances in Urban Ecology: Integrating Humans andEcological Processes in Urban Ecosystems. Springer, New York.
Angel, S., Parent, J., Civco, D.L., Blei, A., Potere, D., 2011. The dimensions of globalurban expansion: estimates and projections for all countries, 2000e2050. Prog.Plan. 75 (2), 53e107.
Batty, M., Xie, Y., 1994. From cells to cities. Environ. Plan. B 21, 31.Bernstein, L., Bosch, P., Canziani, O., Chen, Z., Christ, R., Davidson, O., Hare, W.,
Huq, S., Karoly, D., Kattsov, V. (Eds.), 2007. Climate Change 2007: SynthesisReport. Contribution of Working Groups I, II and III to the Fourth AssessmentReport of the Intergovernmental Panel on Climate Change. IPCC, Geneva,Switzerland.
Chen, J., Brissette, F.P., Leconte, R., 2011. Uncertainty of downscaling method inquantifying the impact of climate change on hydrology. J. Hydrol. 401, 190e202.
Chen, S., Chen, B., Fath, B.D., 2014. Urban ecosystem modeling and global change:potential for rational urban management and emissions mitigation. Environ.Pollut. 190, 139e149.
Chiesi, M., Maselli, F., Moriondo, M., Fibbi, L., Bindi, M., Running, S.W., 2007.Application of BIOME-BGC to simulate Mediterranean forest processes. Ecol.Model. 206 (1e2), 179e190.
Chua Fang, L., Suzuki, M., Ohte, N., Hotta, N., Kume, T., 2009. Evapotranspirationpatterns for tropical rainforests in Southeast Asia: a model performance ex-amination of the biome-BGC model. Bull. Tokyo Univ. For. 120, 29e44.
Ciais, P., Reichstein, M., Viovy, N., Granier, A., Ogee, J., Allard, V., Aubinet, M.,Buchmann, N., Bernhofer, C., Carrara, A., 2005. Europe-wide reduction in pri-mary productivity caused by the heat and drought in 2003. Nature 437 (7058),529e533.
Cramer, W., Kicklighter, D.W., Bondeau, A., Iii, B.M., Churkina, G., Nemry, B.,Ruimy, A., Schloss, A.L., 1999. Comparing global models of terrestrial net pri-mary productivity (NPP): overview and key results. Glob. Change Biol. 5 (S1),1e15.
Diaz-Nieto, J., Wilby, R.L., 2005. A comparison of statistical downscaling and climatechange factor methods: impacts on low flows in the River Thames, UnitedKingdom. Clim. Change 69 (2), 245e268.
Editorial Board of Vegetation Map of China, 2001. Vegetation Atlas of China (1:1000000). Science Press, Beijing, China.
Fan, S., Gloor, M., Mahlman, J., Pacala, S., Sarmiento, J., Takahashi, T., Tans, P., 1998.A large terrestrial carbon sink in North America implied by atmospheric andoceanic carbon dioxide data and models. Science 282 (5388), 442e446.
Feng, X., et al., 2007. Net primary productivity of China's terrestrial ecosystems froma process model driven by remote sensing. J. Environ. Manag. 85 (3), 563e573.
Freddy, N., van Harrij, V., Luc, V., 2008. Harmonized World Soil Database. Food andAgriculture Organization of the United Nations.
Gielen, B., De Vos, B., Campioli, M., Neirynck, J., Papale, D., Verstraeten, A.,Ceulemans, R., Janssens, I.A., 2013. Biometric and eddy covariance-basedassessment of decadal carbon sequestration of a temperate Scots pine forest.Agric. For. Meteorol. 174, 135e143.
Grimm, N.B., Faeth, S.H., Golubiewski, N.E., Redman, C.L., Wu, J., Bai, X., Briggs, J.M.,2008. Global change and the ecology of cities. Science 319 (5864), 756.
He, C., Zhao, Y., Tian, J., Shi, P., 2013. Modeling the urban landscape dynamics in amegalopolitan cluster area by incorporating a gravitational field model withcellular automata. Landsc. Urban Plan. 113, 78e89.
Houghton, J.T., Ding, Y., Griggs, D.J., Noguer, M., Van Der Linden, P.J., Dai, X.,Maskell, K., Johnson, C.A. (Eds.), 2001. Climate Change 2001: the Scientific Basis.Contribution of Working Group I to the Third Assessment Report of the Inter-national Panel on Climate Change. Cambridge University Press Cambridge,England.
Huang, Q., Cai, Y., 2007. Simulation of land use change using GIS-based stochasticmodel: the case study of Shiqian County, Southwestern China. Stoch. Environ.Res. Risk Assess. 21 (4), 419e426.
Hungerford, R.D., Nemani, R.R., Running, S.W., Coughlan, J.C., 1989. MTCLIM: aMountain Microclimate Simulation Model. US Department of Agriculture, For-est Service, Intermountain Research Station Ogden, Utah, USA, 27 pp.
Ichii, K., Hashimoto, H., Nemani, R., White, M., 2005. Modeling the interannualvariability and trends in gross and net primary productivity of tropical forestsfrom 1982 to 1999. Glob. Planet. Change 48 (4), 274e286.

F. Pei et al. / Journal of Environmental Management 150 (2015) 92e102102
Imhoff, M.L., Bounoua, L., DeFries, R., Lawrence, W.T., Stutzer, D., Tucker, C.J.,Ricketts, T., 2004. The consequences of urban land transformation on net pri-mary productivity in the United States. Remote Sens. Environ. 89 (4), 434e443.
Jin, Z., Qi, Y.C., Dong, Y.S., 2007. Storage of biomass and net primary productivity indesert shrubland of Artemisia ordosica on Ordos Plateau of Inner Mongolia,-China. J. For. Res. 18 (04), 298e300.
Jing, F., 2009. Application of 3S technology to the updating survey of land. In: 2009International Conference on Environmental Science and Information Applica-tion Technology. IEEE, vol. 1, pp. 604e607.
Johns, T.C., Gregory, J.M., Ingram, W.J., Johnson, C.E., Jones, A., Lowe, J.A., Mitchell, J.,Roberts, D.L., Sexton, D., Stevenson, D.S., 2003. Anthropogenic climate changefor 1860 to 2100 simulated with the HadCM3 model under updated emissionsscenarios. Clim. Dyn. 20 (6), 583e612.
Kalnay, E., Kanamitsu, M., Kistler, R., Collins, W., Deaven, D., Gandin, L., Iredell, M.,Saha, S., White, G., Woollen, J., 1996. The NCEP/NCAR 40-year reanalysis project.Bull. Am. Meteorol. Soc. 77 (3), 437e471.
Kuang, W., 2011. Simulating dynamic urban expansion at regional scale in Beijing-Tianjin-Tangshan Metropolitan Area. J. Geogr. Sci. 21 (2), 317e330.
Kurz, W.A., Stinson, G., Rampley, G.J., Dymond, C.C., Neilson, E.T., 2008. Risk ofnatural disturbances makes future contribution of Canada's forests to the globalcarbon cycle highly uncertain. Proc. Natl. Acad. Sci. 105 (5), 1551e1555.
Leung, Y.K., Wu, M.C., Yeung, K.H., 2006. Climate Forecasting-What the Temperatureand Rainfall in Hong Kong are Going to be like in 100 Years. Symposium ofScience in Public Service, Science Museum, Hong Kong, 1, pp. 1e14.
Li, X., Shi, X., He, J., Liu, X., 2011. Coupling simulation and optimization to solveplanning problems in a fast-developing area. Ann. Assoc. Am. Geogr. 101 (5),1032e1041.
Li, X., Yang, Q., Liu, X., 2008. Discovering and evaluating urban signatures forsimulating compact development using cellular automata. Landsc. Urban Plan.86 (2), 177e186.
Li, X., Yeh, A.G.O., 2002. Neural-network-based cellular automata for simulatingmultiple land use changes using GIS. Int. J. Geogr. Inf. Sci. 16 (4), 323e343.
Li, X., Yeh, A.G.O., 2004. Data mining of cellular automata's transition rules. Int. J.Geogr. Inf. Sci. 18 (8), 723e744.
Liu, J., Liu, M., Tian, H., Zhuang, D., Zhang, Z., Zhang, W., Tang, X., Deng, X., 2005.Spatial and temporal patterns of China's cropland during 1990-2000: an anal-ysis based on Landsat TM data. Remote Sens. Environ. 98 (4), 442e456.
Liu, X., Li, X., Shi, X., Zhang, X., Chen, Y., 2010. Simulating land-use dynamics underplanning policies by integrating artificial immune systems with cellularautomata. Int. J. Geogr. Inf. Sci. 24 (5), 783e802.
Luo, T.X., 1996. Patterns of Net Primary Productivity for Chinese Major Forest Typesand Its Mathematical Models (Ph.D. dissertation). Chinese Academy of Sciences,Beijing.
Luo, Y., Wang, C., 2009. Valuation of the net primary production of terrestrialecosystems in Guangdong Province based on remote sensing. Ecol. Environ. Sci.18 (4), 1467e1471.
Maselli, F., Argenti, G., Chiesi, M., Angeli, L., Papale, D., 2013. Simulation of grasslandproductivity by the combination of ground and satellite data. Agric. Ecosyst.Environ. 165, 163e172.
Matsushita, B., Xu, M., Chen, J., Kameyama, S., Tamura, M., 2004. Estimation ofregional net primary productivity (NPP) using a process-based ecosystemmodel: how important is the accuracy of climate data? Ecol. Model. 178 (3),371e388.
Mu, Q., Zhao, M., Running, S.W., Liu, M., Tian, H., 2008. Contribution of increasingCO2 and climate change to the carbon cycle in China's ecosystems. J. Geophys.Res. 113 (G01018), 1e15.
Ni, J., 2004. Estimating net primary productivity of grasslands from field biomassmeasurements in temperate northern China. Plant Ecol. 174 (2), 217e234.
Pei, F., Li, X., Liu, X., Wang, S., He, Z., 2013. Assessing the differences in net primaryproductivity between pre- and post-urban land development in China. Agric.For. Meteorol. 171e172 (0), 174e186.
Piao, S., Sitch, S., Ciais, P., Friedlingstein, P., Peylin, P., Wang, X., Ahlstr€om, A.,Anav, A., Canadell, J.G., Cong, N., 2013. Evaluation of terrestrial carbon cyclemodels for their response to climate variability and to CO2 trends. Glob. ChangeBiol. 19 (7), 2117e2132.
Potter, C.S., Randerson, J.T., Field, C.B., Matson, P.A., Vitousek, P.M., Mooney, H.A.,Klooster, S.A., 1993. Terrestrial ecosystem production: a process model based onglobal satellite and surface data. Glob. Biogeochem. Cycles 7 (4), 811e841.
Ruimy, A., Saugier, B., Dedieu, G., 1994. Methodology for the estimation of terrestrialnet primary production from remotely sensed data. J. Geophys. Res. 99 (D3),5263e5283.
Running, S.W., Hunt, E.R., 1993. Generalization of a forest ecosystem process modelfor other biomes, BIOME-BGC, and an application for global-scale models.Scaling Physiol. Process. Leaf Globe 141e158.
Salath�e, E.P., 2005. Downscaling simulations of future global climate with appli-cation to hydrologic modelling. Int. J. Climatol. 25 (4), 419e436.
Seto, K.C., Güneralp, B., Hutyra, L.R., 2012. Global forecasts of urban expansion to2030 and direct impacts on biodiversity and carbon pools. Proc. Natl. Acad. Sci.109 (40), 16083e16088.
Trusilova, K., Churkina, G., 2008. The response of the terrestrial biosphere to ur-banization: land cover conversion, climate, and urban pollution. Biogeosciences5 (6), 1505e1515.
Turner, D.P., Ritts, W.D., Law, B.E., Cohen, W.B., Yang, Z., Hudiburg, T., Campbell, J.L.,Duane, M., 2007. Scaling net ecosystem production and net biome productionover a heterogeneous region in the western United States. Biogeosci. Discuss. 4(2), 1093e1135.
Veroustraete, F., Sabbe, H., Rasse, D.P., Bertels, L., 2004. Carbon mass fluxes of forestsin Belgium determined with low resolution optical sensors. Int. J. Remote Sens.25 (4), 769e792.
Wang, L., Li, C.C., Ying, Q., Cheng, X., Wang, X.Y., Li, X.Y., Hu, L.Y., Liang, L., Yu, L.,Huang, H.B., 2012. China's urban expansion from 1990 to 2010 determined withsatellite remote sensing. Chin. Sci. Bull. 57 (22), 2802e2812.
Wang, S., Zhou, L., Chen, J., Ju, W., Feng, X., Wu, W., 2011. Relationships between netprimary productivity and stand age for several forest types and their influenceon China's carbon balance. J. Environ. Manag. 92, 1651e1662.
Wang, Q., Watanabe, M., Ouyang, Z., 2005. Simulation of water and carbon fluxesusing BIOME-BGC model over crops in China. Agric. For. Meteorol. 131 (3e4),209e224.
Wang, Y.P., Houlton, B.Z., 2009. Nitrogen constraints on terrestrial carbon uptake:implications for the global carbon-climate feedback. Geophys. Res. Lett. 36,L24403.
White, M.A., Thornton, P.E., Running, S.W., Nemani, R.R., 2000. Parameterizationand sensitivity analysis of the BIOME-BGC terrestrial ecosystem model: netprimary production controls. Earth Interact. 4 (3), 1e85.
Wilby, R.L., Dawson, C.W., 2012. The Statistical DownScaling Model: insights fromone decade of application. Int. J. Climatol. 33 (7), 1e13.
Wilby, R.L., Dawson, C.W., Barrow, E.M., 2002. SDSMda decision support tool forthe assessment of regional climate change impacts. Environ. Model. Softw. 17(2), 145e157.
Wilby, R.L., Hay, L.E., Leavesley, G.H., 1999. A comparison of downscaled and rawGCM output: implications for climate change scenarios in the San Juan Riverbasin, Colorado. J. Hydrol. 225 (1), 67e91.
Wilby, R.L., Wigley, T., 1997. Downscaling general circulation model output: a re-view of methods and limitations. Prog. Phys. Geogr. 21 (4), 530.
Wilks, D.S., 2010. Use of stochastic weather generators for precipitation down-scaling. Wiley Interdiscip. Rev. Clim. Change 1 (6), 898e907.
Wu, F., Webster, C.J., 1998. Simulation of land development through the integrationof cellular automata and multicriteria evaluation. Environ. Plan. B 25, 103e126.
Wu, F., 2002. Calibration of stochastic cellular automata: the application to rural-urban land conversions. Int. J. Geogr. Inf. Sci. 16 (8), 795e818.
Wu, S., Zhou, S., Chen, D., Wei, Z., Dai, L., Li, X., 2014. Determining the contributionsof urbanisation and climate change to NPP variations over the last decade in theYangtze River Delta, China. Sci. Total Environ. 472 (0), 397e406.
Wu, Z., Dijkstra, P., Koch, G.W., Hungate, B.A., 2012. Biogeochemical and ecologicalfeedbacks in grassland responses to warming. Nat. Clim. Change 458e461.
Xu, C., Liu, M., An, S., Chen, J.M., Yan, P., 2007. Assessing the impact of urbanizationon regional net primary productivity in Jiangyln County, China. J. Environ.Manag. 85 (3), 597e606.
Yu, D., Shao, H.B., Shi, P.J., Zhu, W.Q., Pan, Y.Z., 2009. How does the conversion ofland cover to urban use affect net primary productivity? A case study inShenzhen city, China. Agric. For. Meteorol. 149 (11), 2054e2060.
Zhao, M., Running, S.W., 2010. Drought-induced reduction in global terrestrial netprimary production from 2000 through 2009. Science 329 (5994), 940e943.
Zhao, M., Running, S.W., Nemani, R.R., 2006. Sensitivity of Moderate ResolutionImaging Spectroradiometer (MODIS) terrestrial primary production to the ac-curacy of meteorological reanalyses. J. Geophys. Res. Biogeosci. (2005e2012)111 (G1).
Zheng, Z., Fan, J., Liu, H., Zeng, D., 2010. The analysis and predictions of agriculturaldrought trend in Guangdong Province based on empirical mode decomposition.J. Agric. Sci. 2 (4), 170e179.