export news 09/2012 - tdap - trade development ...tdap.gov.pk/pdf/vol_09_2012.pdflist of korean...
TRANSCRIPT
EXPORT NEWS 09/2012
1

EXPORT NEWS 09/2012
2
In this Issue
NEWS UPDATE 02 – 05
Press Clippings
Mr. Tahir Raza Naqvi gets additional charge of TDAP & NICL 2
Pakistan can earn millions of dollars from rice oil exports’ 2-3
Rice exports cross $2bn mark yet again 3-4
REAP hopeful of increased rice export to Ch-6ina 4
Rules & Regulation
New Decree regarding foreign ownership in Libyan companies 4
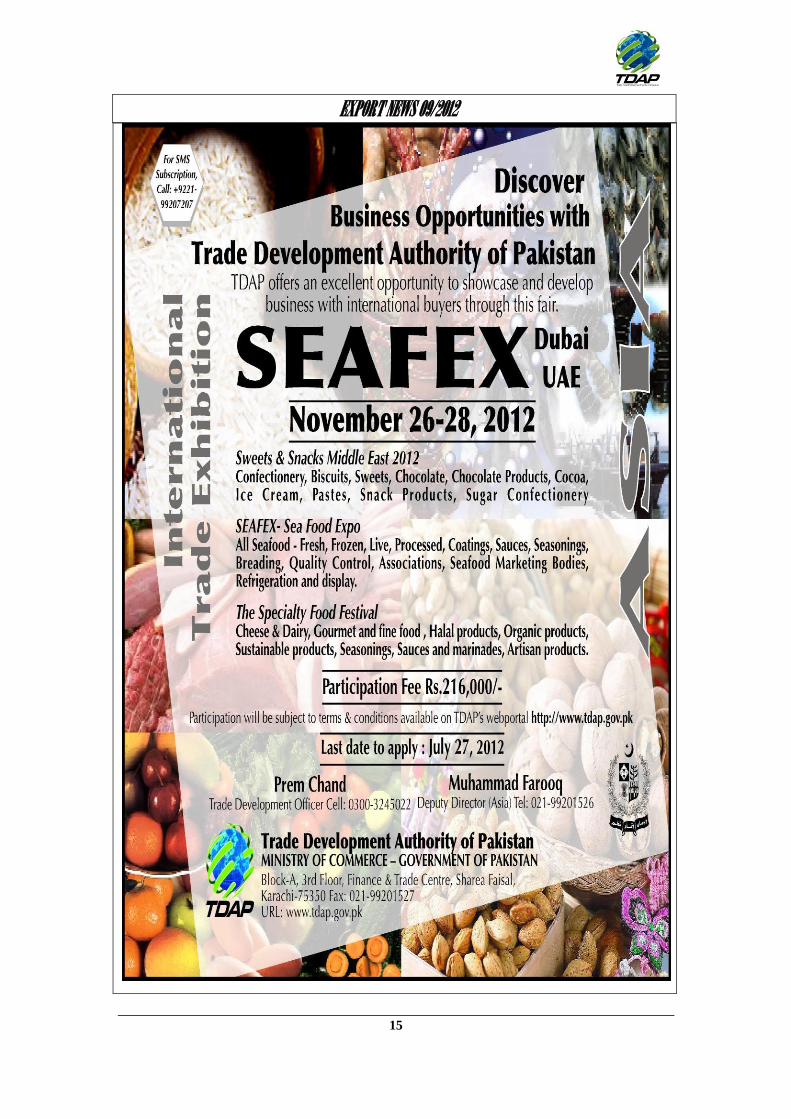
Fairs & Exhibitions
List of Korean exhibitions 5
Statistics
Trade Statistics Summary July–June 2011-12 5
EXPORT GUIDE 06 – 10
Promising EU Export Markets for Fresh Off Season Fruits
LIST OF IMPORTERS 11 – 13
Importers of Sports Goods in Chile 11-12
List of Sri Lankan Importers 13
ADVERTISEMENTS 14 - 15
FEEDBACK FORM 16
Readers may p rovide Feedback on the fo rm
ava i lab le on the back page fo r fur ther improvement
o f the bu l le t in
Vol. No. 09 23rd July, 2012

EXPORT NEWS 09/2012
2
PRESS CLIPPINGS
Mr. Tahir Raza Naqvi gets
additional charge of Trade
Development Authority of
Pakistan & National Insurance
Company Limited
Syed Tahir Raza Naqvi, Chairman Trading Corporation of Pakistan (TCP) has been given additional charge of Trade Development Authority of Pakistan (TDAP) and National Insurance Company Limited (NICL).
The government through a notification issued on Monday, gave these additional responsibilities to Mr. Naqvi, a BS-21 Officer of District Management Group (DMG), after termination of services of Mr. Tariq Puri, who was heading TDAP and NICL till July 6.
Talking to Business Recorder, Mr. Naqvi said he would assume the additional responsibilities of Chief Executive TDAP and Chairman NICL.
Mr. Naqvi has been serving TCP as its chairman since Oct 27, 2011.
He joined Government service in 1983 and served on various important positions in federal and provincial governments, including assignments like Secretary to Govt. of Punjab in Industries, Commerce and Investment and Food Departments, Member (Admn) Federal Board of Revenue, Islamabad besides being posted as Commercial Counselor, Embassy of Pakistan, in Bangkok.
The sources said Commerce Ministry was considering recommending the name of Fazal-ur-Rehman, a retired bureaucrat, for the slot of Chief Executive TDAP.
Ref: Business Recorder July 10, 2012
Pakistan can earn millions of
dollars from rice oil exports’
Rice oil is one of the important byproducts of rice, which Pakistan can excel in and earn millions of dollars annually. This is because it fetches high prices and it has a low fat content.
India and Japan are already exporting billions of dollars worth of rice oil annually. Pakistan has not tapped this
market, despite its potential, with the rich quality of rice that it produces and production capacity. If Pakistan begins to export rice oil, it could easily export 0.2 million dollars worth of oil, which would grow gradually as Pakistani products take the share of Indian and Japanese rice oil brands.
However, to achieve this, concerted efforts were needed to enhance the export and value addition of rice in the international markets. This would enable the sector to contribute to the economy.
These were the views of various rice sector stakeholders, including the exporters, growers, mill owners, food technologists, the Trade Development Authority of Pakistan (TDAP) officials in the workshops held here. “To tap the huge potential for the export of Pakistani rice in the international markets, Pakistan needs to ensure better quality management of rice and proper utilization of its by-products,” the experts and exporters of rice stated, addressing a workshop arranged by the Trade Development Authority of Pakistan (TDAP).
In his opening remarks, Director TDAP, Lahore Shahzad Hussain Rana highlighted the endeavors of the TDAP to encourage rice exporters. “The TDAP is committed to increasing exports and the government has given a free hand to exporters and is now promoting value added products of rice, which would fetch more foreign exchange for Pakistan”, he said.
Shahid Abdullah from the Plant Protection Department spoke about the quarantine issues and the certification of rice. He highlighted that careful handling was vital for the export of value-added products in the global market. “Pakistan can tap into the value-added rice products market through proper planning,” he said, adding “With better use of the latest modern technology, quality control issues can be reduced and the quality of rice, which varies in different bags of the same consignment, can be addressed through technology and machinery.” He revealed that the extruded rice products (slanty) were already being sold in the local market with value addition and these products could be exported as well.
Officials from the Rice Research Institute shed light on the rice exportable varieties and the quality management of rice. They mentioned that the myriad varieties of
EXPORT NEWS 09/2012
3
rice produced in Pakistan had the potential for value addition.
Fahad Amjad, a Food Technologist from the Kalashah Kaku Rice Research Institute, said, “The husk, one of the by-products of rice, used to be wasted before the production of parboiled rice.
Now this husk is used as a source of generating energy in the parboiling rice unit. Similarly, broken rice, the result of substandard machinery, has also become a value-added product. It is being used in multiple ways as in animal feed, beverages, rice flour, rice milk and rice starch.” He said that rice flour and rice milk were one of the high-end edible items used by people allergic to gluten, or those who couldn’t digest natural milk produced by cows or buffalos.
Javed Islam Agha of Reem Rice Mills discussed how the government could intervene for increasing rice exports.
During the panel discussion, the participants expressed their views regarding various problems they confronted during rice export consignments. They also presented different suggestions to overcome rice-related issues.
Ref: The News June 29, 2012.
Rice exports cross $2bn mark
yet again
The country's rice exports crossed the $2 billion mark yet again for the fourth consecutive year despite all odds.
"We thank all our members for providing a befitting tangible reply to some self appointed unelected armchair leaders who predicted the opposite", the Rice Exporters Association of Pakistan (REAP) said in a press release issued here.
"The REAP also thanks the government for not interfering unnecessarily in our affairs and for allowing a free market environment in rice", it added.
It said that 100 percent REAP members pay taxes and don't get any subsidies while exporting rice. REAP opposes subsidies that waste state funds and promote corruptions. REAP also opposes manipulative artificial interventions that distort the free market. "We humbly pursue earning of an honourable living for
ourselves and foreign exchange for our motherland", REAP said.
The rice exports witnessed tremendous growth during the last decade, as the total rice exports increased from $387 million in the fiscal year 2001-02 to $2.044 billion in 2008-09. The rice exports hit all time high level of $2.265 billion in the year 2009-10, and in the fiscal year 2010-11, total rice exports stood at $2.091 billion.
"It is tremendous achievement and no other sector can show such an achievement", REAP said.
"In the current year we faced a debilitating energy crises compounded by a discouraging law and order situation", it said. India entered the market with huge surplus stocks and a massive 20 percent devaluation of the Indian Rupee. Vietnam and Myanmar posed stiff competitive challenges. SBP silently honored sanctions resulting in a drastic drop in Basmati exports to Iran. "Our hard earned market share was given on a platter to the Indians", it said. "Even then our exporters unbelievably managed to retain a respectable share",.
Some other facts were also bedrock reasons for achieving over $2 billion of rice exports, REAP said.
It said the Quality Review Committee (QRC) system was conceptualized and developed by REAP, as a unique Public Private Partnership, way ahead of its time. It has proven its worth time and again by providing unsurpassed tangible results. REAP acted as managers under supervision of TDAP as facilitators. The QRC has remained a ubiquitous quality watchdog presence behind rice exports. Thus QRC has played a crucial role in our success story.
The extremely mature, unbiased and democratic management of Mandatory Membership of REAP, found only in similar bodies in highly developed countries such as Japan, ensured favorable governance conditions in the rice community where large exporters and small exporters are treated equally. One member means one vote irrespective of size. Collection of resources and dissemination of information under one flag allowed our exporters to quickly understand challenges and successfully manage them on timely basis with fewer hassles and with tangible success to show.
EXPORT NEWS 09/2012
4
REAP unconditionally assures TDAP, Ministry of Commerce and all government departments of close cooperation and collaboration under free market principles.
"The REAP's Mandatory Membership and QRC managed by Rice Exporters Association of Pakistan (REAP) under Trade Development Authority of Pakistan (TDAP) supervision are basic requirements to further our rice exports to unprecedented heights", it said. "Let us not undo our success by accepting advice of unelected quacks", it added.
"We earnestly appeal to the government to please help us continue the good work without unnecessary distractions and please help us remain democratic and please help Pakistan remain a rice free market example for the world", REAP said.
Ref: Business Recorder June 28, 2012.
REAP hopeful of increased
rice export to China
Agriculture sector can play a vital role in increasing trade between Pakistan and China.
This was stated by Rafique Suleman, former vice-chairman of Rice Exporters Association of Pakistan (REAP) after his return from China along with an 8-member REAP delegation.
He said that Pakistan exported 332,500 metric tons of rice worth $149 million to China during July 2011 to June 21, 2012. "We are hopeful that up to June 30, 2012 we will be able to export approximately 350,000 metric tons rice to China," he added.
Suleman appreciated the services of Trade Development Authority of Pakistan (TDAP) for arranging a stall for Rice Exporters Association of Pakistan at the 5th South Asian Countries Fair during 6-10 June, 2012 in China. A Biryani Festival was also organized by Rice Exporters Association of Pakistan (REAP)
According to him Chinese people appreciated the quality of Pakistani rice and expressed willingness to import Pakistani rice. "We are hopeful that Pakistani rice exporters will get huge orders from China,"
Ref: Business Recorder June 27, 2012.
RULES AND REGULATION
New Decree regarding foreign
ownership in Libyan
companies
A new decree released by the Minister of Economy regarding the participation of foreigners in partnership companies and the opening of branch and representative office for foreign companies in Libya.
The decree allows for both foreign individuals and companies to be partners with Libyan individuals and Libyan companies. The partnership companies can either be shareholding (musahama) companies or limited (mahduda) companies for the shareholding companies, the capital must be a minimum of one million dinars (US$ 800,000/- approx) of which 300,000 must be paid up at the stage of establishment. The smaller limited companies must have a minimum capital of 50,000 dinars US$ 40,000/- approx). The maximum shareholding allowed for non-Libyans is 65 percent, but in exceptional situations the Ministry of Economy can raise this limit to a maximum of 80 percent.
There are 12 areas of activity where foreign partnerships are prohibited from operating, including retail and wholesaling, importation, catering, agencies / distributorships, auditing and legal firm, quarrying and construction for contracts less than 30 million Libyan dinars.
This decree excludes companies which already have legally set up branches in Libya at the time of the passing of this decree and which are contracted to implement projects - until the expiry of their contracts. These companies must thereafter renew their documentation upon expiry. Companies with no branches or partnership agreements can apply for branch offices for market research etc, without the right to sign contracts. Branch offices can be opened for 2 years and are renewable for another 2 years only once. Branch offices discovered to be transacting commercial activities would be closed.
Finally the decree in its ultimate article No. (21), stipulates that this decree is in force as of its date of publication (12 May 2012) and that Libyan foreign partnership companies must legalize their status within one year of the passing of this decree.
EXPORT NEWS 09/2012
5
FAIR & EXHIBITIONS
List of Korean exhibitions
Pakistan and Republic of Korea (South Korea) have excellent bilateral relations in the political, economic, trade, cultural and educational fields, their volume of trade, which was in the region of US$ 94 million in the 1980s has reached an all-time high of US$ 1.556 billion in 2011 their and exports increased by 84.4 percent in this period as compared to 2010. Korean exports to Pakistan also increased by 5 percent in this period. Most of the prominent South Korean conglomerates are now investing in mega Hydel power, chemicals, thermal, power generation, roads, bridges, infrastructure projects in Pakistan. One of the Pakistani Companies is now participating in Expo-2012 at Yeosu city, Seoul.
List of few exhibition to be held in South Korea
(i) Seoul Gift show 2012 from 20-23 September at C0EX Hall-A in Seoul.
(ii) Busan International Footwear & Textile Fashion Week 2012 from 11-14 October in Busan.
(iii) Busan International food Expo 2012 with Tea & Craft Fair from 25-28 October at BEXCO in Busan.
(iv) Busan International Seafood & Fisheries 2012 from 15-17 November at BEXCO in Busan.
(v) 2012 International Agricultural Exhibition from 5-29 October in 2012 at Jeonnam Agricultural Research and Extension Service, Jeonnam, Korea.
STATISTICS
Trade Statistics Summary July–
June 2011-12
Exports:
Exports from Pakistan during JUNE, 2012 amounted to US$ 2.141 billion as against US$ 2.422 billion during corresponding month of the last year, showing a decrease of (-11.60 )%. Exports during JULY-JUNE, 2011-12 totalled US$
23.641 billion as against US$ 24.810 billion during the corresponding period of last year which showed a decrease of (-4.71%).
TDAP Target achievement:
Exports target set by the TDAP for the month of JUNE, 2012 was US$ 2.536 billion while actual exports are US$ 2.141 billion, which is only 84.42% of the target. Target for JULY-JUNE 2011-12 was US$ 26.000 billion and actual exports are US$ 23.641 billion, which was 90.93% of the target.
Imports:
Imports into Pakistan during JUNE, 2012 amounted to US$ 3.979 billion as against US$ 3.863 billion during the corresponding month of the last year, showing an increase of 3.00%, Imports during JULY-JUNE, 2011-12 totalled US$ 44.912 billion as against US$ 40.414 billion during the corresponding period of last year, showing an increase of 11.13%.
Balance of Trade:
Balance of trade in JUNE, 2012 was US$ (-1.838) billion as against of US$ (-1.441) billion during the corresponding month of the last year, showing an increase of 27.55%, while balance of trade for the period JULY-JUNE 2011-12 was US$ (-21.271) billion as against US$ (-15.604) billion during the year 2010-11, showing an increase of 36.32%.
NOTE:- FIGURES ARE PROVISIONAL
Source: - Trade Development Authority of Pakistan

EXPORT NEWS 09/2012
6
PROMISING EU EXPORT MARKETS FOR FRESH OFF SEASON FRUIT
This module explores the developments in EU markets and assists suppliers from developing countries (DCs) in identifying market opportunities for fresh off-season fruit (OSF), in particular citrus fruit, melons, grapes, stone fruits, apples, pears, quinces and berries. The most interesting markets for these products are the Western EU member states. However the member states in the East also provide market potential for suppliers from DCs.
Opportunities and threats in the EU market
+ The EU market is the largest market for OSF in the world. It will remain a net importer of OSF.
+ Imports of OSF from DCs are growing faster than overall imports. Most imported OSF from DCs are citrus, grapes, melons and apples. The imports of berries are growing fastest at the moment.
+ Consumption of OSF in the Eastern member states of the EU is expected to grow fastest. Overall EU growth will depend on positive economic developments and favourable trends
1 which may vary by region
or member state.
+ Innovations allow for storing products until the right price, exporting products (over longer distances) by ship at lower costs and access to new markets.
± Weather conditions in the EU show larger annual fluctuations. Weather conditions affect seasonality and the length of the off-season. Generally spoken, bad seasons result in more demand for imports, a longer off-season and enhanced prospects for DCs.
± Suppliers from DCs that can offer added value products such as certified organic or sustainable OSF2 have enhanced opportunities and may enjoy premiums. To be able to offer these will however
require time and costs and may not always be the best choice.
- Quality, health and safety demands and assurances in the Northern and Western member states of the EU are growing, which results in higher standards to be met.
- Consolidation of the market as a result of the growing share of large supermarket chains leads to more stringent quality and supply demands and less bargaining power for producers and exporters from DCs.
1For insight in the trends refer to the CBI module 'Trends
and segments for fresh off-season fruit'. 2For insight in how organic and sustainable exotics
could enhance value refer to the CBI module 'Developing a product strategy for fresh fruit & vegetables'. 3Industry experts note that consumption in The
Netherlands is decreasing and that this figure may be incorrect due to unregistered re-exports or trade within the EU. 4Please note that at the time of writing not all data for
2010 were available. When data for 2010 were not
available, the data from 2009 have been used.
Consumption
In 2009, consumption accounted for 19 million tonnes. Since 2005, consumption has decreased by an average of 2.2 % per year (see table 1). This decrease however has shown fluctuations in time and space. Most notably has been the decrease during the economic crisis which most member states are now recovering from.
The largest consumers in terms of volume were Italy (27%) and Spain (17%) followed by France (16%), Germany (8.6%) and Greece (5.2%). As such, the decline in consumption can be largely accounted for by the decrease in consumption in the largest member states (Spain -3.7% per year, Greece -4.0%, UK -2.7%, France -2.6% and Germany 2.4%) the largest growth was recorded in The Netherlands (+22%), Denmark (+7.1%) and Hungary (+3.1%) followed by Luxembourg, Ireland, Finland, Poland and Bulgaria with growth rates between 1.0% and 3.0%.
EXPORT NEWS 09/2012
7
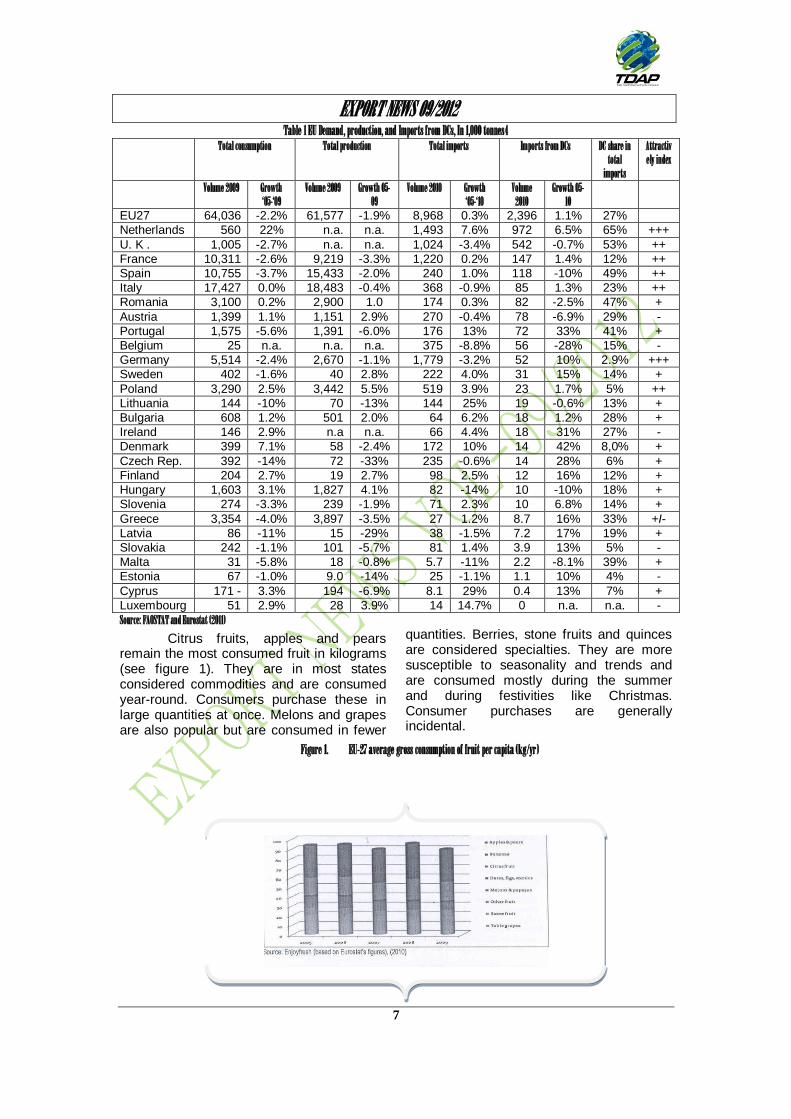
Table 1 EU Demand, production, and Imports from DCs, In 1,000 tonnes4 Total consumption Total production Total imports Imports from DCs DC share in
total imports
Attractively index
Volume 2009 Growth ‘05-‘09
Volume 2009 Growth 05-09
Volume 2010 Growth ‘05-‘10
Volume 2010
Growth 05-10
EU27 64,036 -2.2% 61,577 -1.9% 8,968 0.3% 2,396 1.1% 27%
Netherlands 560 22% n.a. n.a. 1,493 7.6% 972 6.5% 65% +++
U. K . 1,005 -2.7% n.a. n.a. 1,024 -3.4% 542 -0.7% 53% ++
France 10,311 -2.6% 9,219 -3.3% 1,220 0.2% 147 1.4% 12% ++
Spain 10,755 -3.7% 15,433 -2.0% 240 1.0% 118 -10% 49% ++
Italy 17,427 0.0% 18,483 -0.4% 368 -0.9% 85 1.3% 23% ++
Romania 3,100 0.2% 2,900 1.0 174 0.3% 82 -2.5% 47% +
Austria 1,399 1.1% 1,151 2.9% 270 -0.4% 78 -6.9% 29% -
Portugal 1,575 -5.6% 1,391 -6.0% 176 13% 72 33% 41% +
Belgium 25 n.a. n.a. n.a. 375 -8.8% 56 -28% 15% -
Germany 5,514 -2.4% 2,670 -1.1% 1,779 -3.2% 52 10% 2.9% +++
Sweden 402 -1.6% 40 2.8% 222 4.0% 31 15% 14% +
Poland 3,290 2.5% 3,442 5.5% 519 3.9% 23 1.7% 5% ++
Lithuania 144 -10% 70 -13% 144 25% 19 -0.6% 13% +
Bulgaria 608 1.2% 501 2.0% 64 6.2% 18 1.2% 28% +
Ireland 146 2.9% n.a n.a. 66 4.4% 18 31% 27% -
Denmark 399 7.1% 58 -2.4% 172 10% 14 42% 8,0% +
Czech Rep. 392 -14% 72 -33% 235 -0.6% 14 28% 6% +
Finland 204 2.7% 19 2.7% 98 2.5% 12 16% 12% +
Hungary 1,603 3.1% 1,827 4.1% 82 -14% 10 -10% 18% +
Slovenia 274 -3.3% 239 -1.9% 71 2.3% 10 6.8% 14% +
Greece 3,354 -4.0% 3,897 -3.5% 27 1.2% 8.7 16% 33% +I-
Latvia 86 -11% 15 -29% 38 -1.5% 7.2 17% 19% +
Slovakia 242 -1.1% 101 -5.7% 81 1.4% 3.9 13% 5% -
Malta 31 -5.8% 18 -0.8% 5.7 -11% 2.2 -8.1% 39% +
Estonia 67 -1.0% 9.0 -14% 25 -1.1% 1.1 10% 4% -
Cyprus 171 - 3.3% 194 -6.9% 8.1 29% 0.4 13% 7% +
Luxembourg 51 2.9% 28 3.9% 14 14.7% 0 n.a. n.a. -
Source: FAOSTAT and Eurostat (2011)
Citrus fruits, apples and pears remain the most consumed fruit in kilograms (see figure 1). They are in most states considered commodities and are consumed year-round. Consumers purchase these in large quantities at once. Melons and grapes are also popular but are consumed in fewer
quantities. Berries, stone fruits and quinces are considered specialties. They are more susceptible to seasonality and trends and are consumed mostly during the summer and during festivities like Christmas. Consumer purchases are generally incidental.
Figure 1. EU-27 average gross consumption of fruit per capita (kg/yr)

EXPORT NEWS 09/2012
8
Competition may come from fruit drinks and yoghurts that also meet the current health and convenience trends. Competition between fruits is also fierce. Oranges for example are loosing market share to mandarins which meet the trend for easy-to use fruit better.
The off-season fruit market in the EU is largely saturated. Growth is therefore slow. However, as shown by the recent economic crisis, it is influenced by economic deterioration. The economic forecasts are only moderately positive for 2012 (010.6%)
and 2013 (+1.5%). This will have an effect on the market conditions and consumer expenditure. Growth is expected to be slow in most of the Northern and Western and Eastern member states of the EU. In the Mediterranean (excluding France) and Ireland demand is expected to remain low due to the enduring difficult economic situation there.
≥ For more information on trends and segments refer to the CBI module 'Trends and segments for fresh off-season fruit in the EU'.
Production and seasonality
In 2009, EU production was 62 million tones. Between 2005 and 2009 production decreased by an average of 1.9% per year. EU production does not meet demand. The EU will therefore remain dependent on imports and a net importer. The largest producing states are Italy and Spain with a share of 30% and 25%. Other large producers are France (15%), Greece (6.3%) and Poland (5.6%). Together they account for 86% of the EU production (53 million tones). Of the large producers only the production of Poland grew (+5.5%).
Production in the other states was cut by 0.4 to 3.5%.
Over the past years, the weather on which the success of the EU season largely depends has varied considerably. When weather conditions are unfavourable this will result in a short season with lower quality fruits. This is the time when dependence on imports will be at its highest. This is when prospects for suppliers from DCs are particularly good and the best prices can be negotiated. For insight in the seasons refer to table 2 or the websites of large importers such as De Groot International http://www.drootinternational.nl/nl/roducten/assortiment
≥ By monitoring the weather and
production in the main producing EU member states, you may be able to anticipate on the demand and decide to
compete on price during the season or try to hold on to your stock until the off-season. Usually, prices are best during the off-season.
Box 1. The pre-packed fresh-cut market In the UK Sales of pre-packed fresh-cut fruits and vegetables are expected to grow at a rate of 4% to 6% per year, despite the broad availability of often cheaper substitutes. The UK is the largest fresh-
cut market with an average annual consumption of 12 kg and accounting for around a third of total EU consumption. In comparison the EU average is only 3 kg. Other interesting markets are Germany, The Netherlands, Belgium and France. But also in Spain, growth was high regardless
the adverse economic situation.
According to the Rabobank, companies that are in full control of the supply chain (sourcing, planning
and logistics) and that tailor their products to customers' needs will be best placed to capitalise on the potential. To keep volumes up and safeguard profits, companies increase energy efficiency,
reduce labour costs and cut down on waste. In the UK, for example companies already use cheaper basic products and smaller package sizes. This streamlining and rationalisation process may lead to a stronger industry and an even more attractive product category in the future.
Source: Rabobank (2011)
Box 2. Forecast In the future it is expected that DCs as well as other countries that enjoy preferential trade
agreements5 will continue to gain market share. EU producers are in tum likely to increase their control and influence on the supply chain. Also the EU share of added value products to supply consumers with convenience and certified organic or sustainable products is likely to grow. As a
protective measure, EU producers will continue to lobby for minimum prices for EU products and more stringent policies to hamper imports. In addition health and safety standards will become even stricter. These measures however are controversially as these will affect small scale
producers from DCs as they are hard to meet

EXPORT NEWS 09/2012
9
Table 2 Harvesting seasons of selected fruits In the northern hemisphere (red), the southern hemisphere (blue) and both hemispheres (yellow)
Imports
In 2010, imports totaled 9.0 million tones or €9.4 billion. Imports from DCs accounted for 2.4 million tones worth € 2.5 billion. Most notably, imports from DCs have grown faster (+1.1% per year) than the average annual growth (+0.3%) between 2005 and 2010 and continued to gain market.
The largest importers of the EU are Germany and The Netherlands with import quantities of respectively 1.8 and 1.5 million tones. These member states also have a stable economy and a high and growing market share of OSF from DCs. Together with Spain, The Netherlands is an important supplier of OSF to other member states. Other interesting markets based upon size and DC market share are the UK, Spain, Italy and France. An interesting emerging market is Poland.
Emerging OSF from DCs are cranberries, bilberries and other fruits of the genus vaccinium (+42%) raspberries, blackberries, mulberries, loganberries (+12%) and watermelons (+11 %). Also the markets for convenience products such as pre-packed fresh cut fruit (See box 1) as well as the markets for certified sustainable and organic OSF have grown. Main markets for these added value products in the EU are Western member states and wealthy urban areas. 5Preferential trade agreements with the EU may
enhance trade and often include reduced import duties (see http://ec.eurooaeu/agriculture/lindex_en.htm)
The Netherlands and Spain have a large processing industry for intra-EU trade and re-exports of added value OSF. When
considering
supplying added value products, do take into account that these must meet the EU and importers' standards. Especially delivery on time of quality products may be challenging as the added value products may deteriorate faster, although new innovations may provide for solutions. Also, standards may change over time whilst investing in meeting standards may be costly and time consuming. To overcome barriers and reduce risks it may be advisable to work together. :> For more information and tips on working
together and forming co-operatives, please refer to the CBI's module on 'Developing a product strategy for fresh fruit & vegetables'.
Attractive markets Interesting exports markets can be
chosen based on their size, growth and import levels from DCs. At the moment, the best market opportunities for OSF can still be found in the Western member states of the EU. Based on a statistical analysis the most interesting countries in order of attractiveness are:
o The Netherlands: although not a
large country, it is the 2nd largest
importer of OSF in the EU and the
largest importer of OSF from DCs.
Most popular OSF from DCs are
citrus fruits and grapes (42% and
22% of the imported EU value).
o Germany: the largest member state
of the EU is mainly supplied by local
producers and other EU members.
However, the market share of OSF
EXPORT NEWS 09/2012
10
from DCs is increasing. Most popular
OSF from DCs are grapes (47%)
and citrus fruits (19%).
o The UK: the high level of OSF-
consumption and the high share of
DCs in total imports (53%) make the
UK interesting. Most imported from
DCs are citrus fruits (43%), pears
and quinces (32%).
o Spain: a large producer, importer
and supplier to other member states.
DCs account for 49% of total
imported volume. Though imports
from DCs are decreasing Spain is an
attractive market. Most popular OSF
from DCs are citrus fruits (43%) and
melons (28%).
o Italy: the largest producer of the EU
and a large importer of OSF from
DCs (account for 23% of Italian
imports). Most popular OSF from
DCs are oranges (60%), grapes
(18%) and melons (14%).
o France: one of the largest member
states and producers of the EU.
Although consumption and
production have decreased, imports
have increased. Most popular
imported products from DCs are
citrus fruits (40%) and melons
(24%).
o Poland: one of the fastest emerging
economies of the EU. However,
Poland is at the moment largely
dependable on OSF from other
member states. It however has a lot
of potential for DCs. Most popular
OSF from DCs are citrus fruit (58%),
grapes (23%) and melons (16%).
Other countries should not be ruled out as possible trading partners, depending on your product, network, experience and location. Besides, there are also ethnical groups in the EU that may be worth targeting. Ethnic groups often purchase their food from specific shops that use their own community to source product (often different or non-branded products) directly from their country of origin. Although this market is smaller, it may be an easier trade channel.
This Survey complied for CBI by CREM B.V. In cooperation with Piet Schotel
Disclaimer CBI market information tool: http://www.cbi.eu/disclaimer
1 Preferential trade agreements with the EU may enhanced trade and often include reduced import duty (see http://ec.europa.eu/agriculture/index_en.htm
Source: -
CBI Market information Data base *URL:www.cbi.eu
*Contact: [email protected]
* http://www.cbi.eu/disclaimer
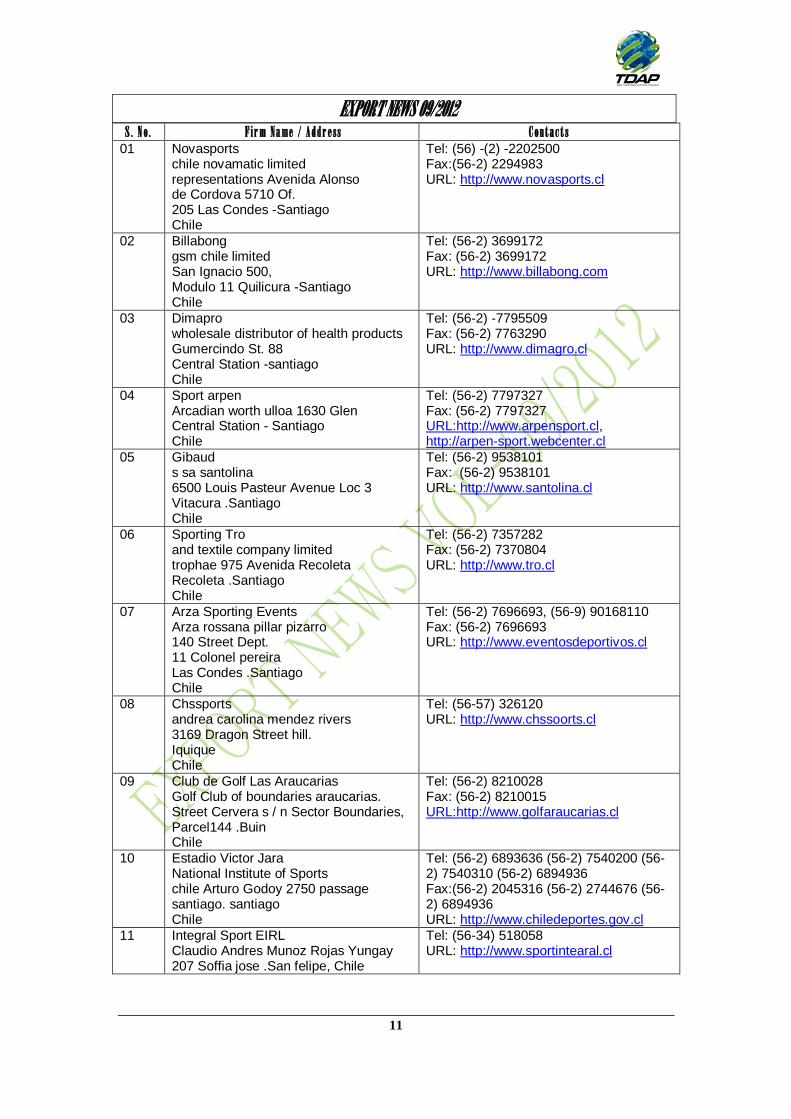
I M P O R T E R S O F S P O R TS G O O D S I N C H I L E
PROCEDURE FOR ‘EXPORT NEWS’ SUBSCRIPTION FOR NEW SUBSCRIBERS
The Export News as you may have noticed is now not only promptly and regularly issued, its
contents are updated and are relevant to the needs of our exporting stakeholders.
The Export News is available on TDAP’s Webportal www.tdap.gov.pk, a hard copy can be
obtained on annual subscription.
A request for 24 issues of EN can be made on company letter head, addressed to Director
Communication, along with a pay order / bank draft of Rs. 500/- (Rupees Five Hundred only) in
favour of Account Officer EMDF, Trade Development Authority of Pakistan, Karachi.
EXPORT NEWS 09/2012
11
S . N o . F i r m N a me / A d d r e s s C o n t a c t s 01 Novasports
chile novamatic limited representations Avenida Alonso de Cordova 5710 Of. 205 Las Condes -Santiago Chile
Tel: (56) -(2) -2202500 Fax:(56-2) 2294983 URL: http://www.novasports.cl
02 Billabong gsm chile limited San Ignacio 500, Modulo 11 Quilicura -Santiago Chile
Tel: (56-2) 3699172 Fax: (56-2) 3699172 URL: http://www.billabong.com
03 Dimapro wholesale distributor of health products Gumercindo St. 88 Central Station -santiago Chile
Tel: (56-2) -7795509 Fax: (56-2) 7763290 URL: http://www.dimagro.cl
04 Sport arpen Arcadian worth ulloa 1630 Glen Central Station - Santiago Chile
Tel: (56-2) 7797327 Fax: (56-2) 7797327 URL:http://www.arpensport.cl, http://arpen-sport.webcenter.cl
05 Gibaud s sa santolina 6500 Louis Pasteur Avenue Loc 3 Vitacura .Santiago Chile
Tel: (56-2) 9538101 Fax: (56-2) 9538101 URL: http://www.santolina.cl
06 Sporting Tro and textile company limited trophae 975 Avenida Recoleta Recoleta .Santiago Chile
Tel: (56-2) 7357282 Fax: (56-2) 7370804 URL: http://www.tro.cl
07 Arza Sporting Events Arza rossana pillar pizarro 140 Street Dept. 11 Colonel pereira Las Condes .Santiago Chile
Tel: (56-2) 7696693, (56-9) 90168110 Fax: (56-2) 7696693 URL: http://www.eventosdeportivos.cl
08 Chssports andrea carolina mendez rivers 3169 Dragon Street hill. Iquique Chile
Tel: (56-57) 326120 URL: http://www.chssoorts.cl
09 Club de Golf Las Araucarias Golf Club of boundaries araucarias. Street Cervera s / n Sector Boundaries, Parcel144 .Buin Chile
Tel: (56-2) 8210028 Fax: (56-2) 8210015 URL:http://www.golfaraucarias.cl
10 Estadio Victor Jara National Institute of Sports chile Arturo Godoy 2750 passage santiago. santiago Chile
Tel: (56-2) 6893636 (56-2) 7540200 (56-2) 7540310 (56-2) 6894936 Fax:(56-2) 2045316 (56-2) 2744676 (56-2) 6894936 URL: http://www.chiledeportes.gov.cl
11 Integral Sport EIRL Claudio Andres Munoz Rojas Yungay 207 Soffia jose .San felipe, Chile
Tel: (56-34) 518058 URL: http://www.sportintearal.cl

EXPORT NEWS 09/2012
12
12 Mountaineering and Trekking Andesgear img limited commercial ebro Street 2794 Las Condes .Santiago Chile
Tel: (56-2) 3356113 (56-2) 2457076 Fax: (56-2) 3356185 URL: http://www.andesgear.cl
13 Anfa National Soccer Assn mamateur Buin Sazio Street 2351 santiago. santiago Chile
Tel: (56-2) 4331800 Fax:(56-2) 6990155 URL: http://www.anfa.cl
14 Golf Comercializadora Chile Limitada chile golf marketing limited Avenida Vitacura 3568 Of. 302, Building EurOffice Vitacura .Santiago Chile
Tel: (56-2) 9535104
15 Paintball warlike francisco garcia Fanor andrade 0259 Agnes Street rivas the tank - santiago Chile
Tel:(56-2) 8237789 URL: http://www.warlikepaintball.cl
16 Playsafe soc ode deptv and aesthetic dentistry Itda Of 10373 Avenida Las Condes. 56 Las Condes -Santiago Chile
Tel: (56-2) 2430755 URL: http://www.plasafe.cl
17 Recreating Club sa re 1561 Avenue Quilin Macul- Santiago Chile
Tel: (56-2) 4247111 (56-800) 371200 Fax: (56-2) 4247111 URL: http://www.recrear.cl
18 Greenland Club & Fitness Greenland sa sports schools 0390 Laguna del Maule Central Station -Santiago Chile
Tel: (56-2) 9535104 URL: http://www.qolfchile.cl
19 Natural-Alternative Maxtriner Training natural-alternative maxtrainer limited training Vicuna Mackenna 532 Of. 11 Providencia -Santiago Chile
Tel: (56-9) 84353178 URL: http://www.maxtrainer.orq
20 Ciudad Deportivalvan Zamorano Ivan Zamorano limited sports city 2650 Avenida Padre Hurtado Las Condes -Santiago Chile
Tel: (56-2) 3406300 URL: http://www.ivanzamorano.cl
21 New-York importer SACI soc limited dvorquez 2551 heroes of conception Loc 151 -Iquique Chile
Tel: (56-57) 574220 (56-57) 574577 Fax56-57) 574577 URL: http://www.tatanka.cl, http://www.newvorktires.cl
Source: -
Commercial Section, Pakistan Embassy Chile

EXPORT NEWS 09/2012
13
I M P O R T E R S O F S R I L A N K A
S . N o . F ir m N a me T e l / F a x / E - ma i l / U R L D e s c r i p t i o n 01 Mr. Vimal Devasiriratne
M/s P.D. Romanis & Sons, 99 Street , Sebastian Street, Colombo Sri Lanka
Tel: 9411 2324453, 2473048 Fax: 9411 2388205 Email: [email protected] URL: www.pdrexporters.com
Cross Border Imports/Exports
02 Mr. Maithri Bandaranaike M/s Markss Hlc (Pvt.) Ltd., 153/3 Nawala Road, Narahenpitiya, Colombo, Sri Lanka
Tel: 9411 5338539 Fax: 9411 5338538 Email: [email protected] URL: www.marksshealthcare.lk
Pharmaceuticals HS Code-3004.90-.90 Nutraceuticals HS Code- 2106.90.90 Medical Devices/Equpts HS Code-1918-90
03 Ms. Hemanie Keerhishnhe M/s International Foodstuff Co. Pvt. Ltd., 139 8c Dharshana Mawatha, Battramulla, Sri Lanaka.
Tel: 9411 4852272 Fax: 9411 2884082 Email: [email protected], [email protected] URL: www.sarath-ifco.com
Potatoes and onions 10-12 40 Ft containers a month 10 to 12 Containers of Potatoes and Big Onions per month
04 Mr. A. Buddhika Silva M/s U.S. Motor Spare Parts Company, No.223, Hill Street, Dehiwela Sri Lanka
Tel: 9411 2715726 Fax: 9411 2734953 Email: [email protected] URL: www.usmotor1.com
Used/New vehicle motor spare pares and accessories
05 Mr. Sagara Gunawardena M/s Venora International Projects (Pvt) Ltd, No. 10/32 Deniya Road, Suwaraola, Piliyandala, Sri Lanka
Tel: 94115528800 Fax:9411 5528811 Email: [email protected] URL: www.venoragroup.com
Electrical Power Panels Telecommunication services, Electrical total solutions lighting protection and earthing systems HS Code: 853810
EXPORT NEWS 09/2012
14
EXPORT NEWS 09/2012
15
EXPORT NEWS 09/2012
16
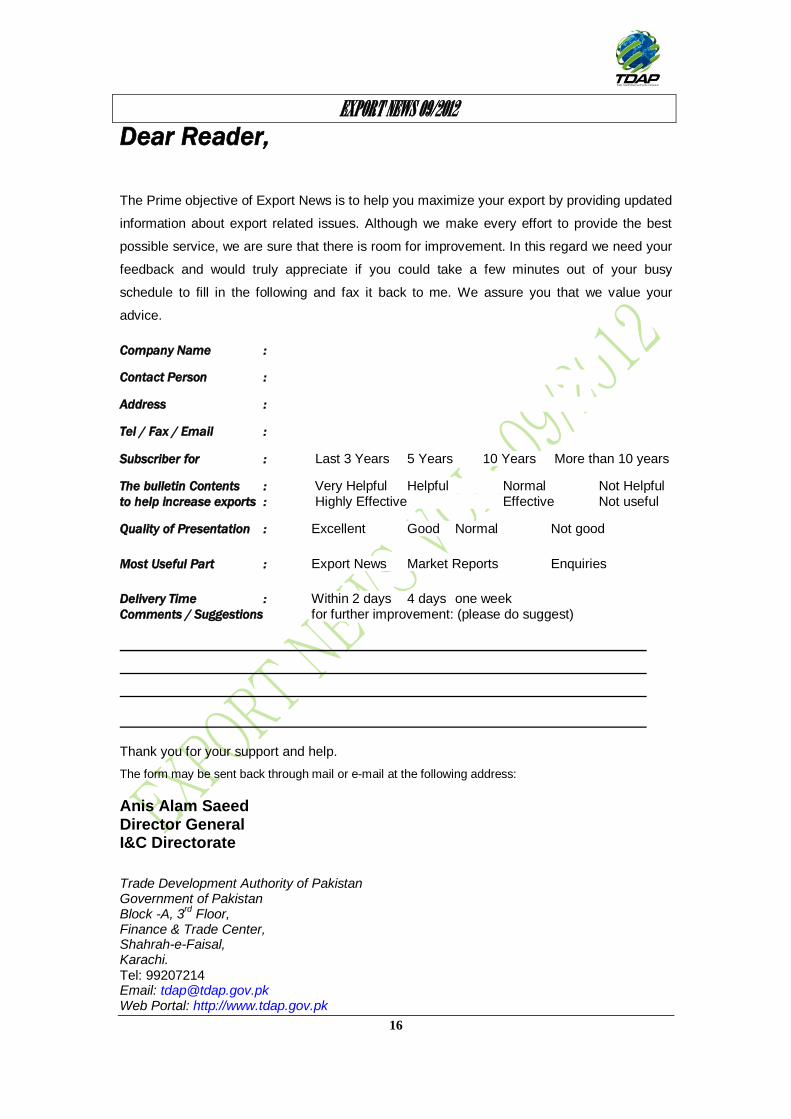
Dear Reader,
The Prime objective of Export News is to help you maximize your export by providing updated
information about export related issues. Although we make every effort to provide the best
possible service, we are sure that there is room for improvement. In this regard we need your
feedback and would truly appreciate if you could take a few minutes out of your busy
schedule to fill in the following and fax it back to me. We assure you that we value your
advice.
Company Name :
Contact Person :
Address :
Tel / Fax / Email :
Subscriber for : Last 3 Years 5 Years 10 Years More than 10 years
The bulletin Contents : Very Helpful Helpful Normal Not Helpful to help increase exports : Highly Effective Effective Not useful
Quality of Presentation : Excellent Good Normal Not good
Most Useful Part : Export News Market Reports Enquiries
Delivery Time : Within 2 days 4 days one week Comments / Suggestions for further improvement: (please do suggest)
Thank you for your support and help.
The form may be sent back through mail or e-mail at the following address:
Anis Alam Saeed Director General I&C Directorate
Trade Development Authority of Pakistan Government of Pakistan Block -A, 3
rd Floor,
Finance & Trade Center, Shahrah-e-Faisal, Karachi. Tel: 99207214 Email: [email protected] Web Portal: http://www.tdap.gov.pk
EXPORT NEWS 09/2012
17