exports, imports, and plant efficiency in indonesia’s ... imports, and plant efficiency in...
TRANSCRIPT

Exports, Imports, and Plant Efficiency In Indonesia’s Automotive Industry
Sadayuki Takii
Research Assistant Professor, ICSEAD
ASEAN-Auto Project No. 04-7 Working Paper Series Vol. 2004-22
September 2004
The views expressed in this publication are those of the author(s) and
do not necessarily reflect those of the Institute.
No part of this book may be used reproduced in any manner whatsoever
without written permission except in the case of brief quotations
embodied in articles and reviews. For information, please write to the
Centre.
The International Centre for the Study of East Asian Development, Kitakyushu

Exports, Imports, and Plant Efficiency
in Indonesia’s Automotive Industry ?
Sadayuki Takii ∗Research Assistant Professor,
The International Centre for the Study of East Asian Development, Kitakyushu
Abstract
The Indonesian automotive industry has been characterized as a classic case ofan infant industry that has failed to grow despite the government’s attempts tostimulate the industry’s growth through various protective measures. Under therecently liberalized trade regime, the industry is facing increasing pressure frominternational competition. The purpose of this paper is to examine the recent trendsin exports, imports and plant efficiency in the automotive industry. One of the mainfindings of the analysis is that the recently liberalized trade regime has positivelyaffected the exports of Indonesia’s automotive industry. The study also finds thatimports from the ASEAN region are increasing and this has positively affectedproductivity in some groups of plants including locally and foreign-owned plants.
Keywords: Automotive industry, Indonesia, Trade, Efficiency
? This paper was written when the author was a visiting research fellow at the Eco-nomic Research Center (ERC), Nagoya University, Japan (April–September 2004).The author would like to thank participants at the 162th ERC Workshop (held on16 September 2004) for helpful comments. The earlier stages of this study were sup-ported by the Ministry of Finance, Japan under the Kaihatsu Keizaigaku KenkyuHaken Seido [dispatch program for research in development economics]. Any re-maining errors are the authors’ responsibility.∗ Research Assistant Professor,
The International Centre for the Study of East Asian Development.Address: 11-4 Otemachi, Kokurakita, Kitakyushu, 803-0814, Japan.Tel: +81-93-583-6202; Fax: +81-93-583-4602.Email address: [email protected] (Sadayuki Takii).

1 Introduction
In Indonesia, the government has made various attempts to stimulate
growth of its automobile industry through various protective measures. How-
ever, development of the industry is characterized as being a classic case of
an infant industry that has failed to grow because Indonesia is inefficient in
the production of vehicles, with the exception of some commercial vehicles
(Aswicahyono et al., 2000). The industry is currently receiving a great deal of
attention in terms of the recent trend of trade liberalization and its effect on
development of the industry as well as on how the industry can be integrated
into the regional production system of East Asia. As a member of the ASEAN
Free Trade Area (AFTA), Indonesia is bound by the AFTA commitment to
reduce tariffs on imports that have at least a 40-percent ASEAN content to
0–5 percent by 2002 under the Common Effective Preferential Tariff (CEPT)
scheme. The preferential tariff would partially fill in the cost gaps between
domestic production and imports. In addition, it would affect the trend of
foreign direct investment (FDI) which has played an important role in the de-
velopment of the automotive industry within the ASEAN region. For example,
a reduction in tariffs within the region gives potential foreign investors that
would not have invested due to the small scale of the market in one country
an opportunity to exploit scale economies by exporting from one country to
other countries in the region. Therefore, FDI may concentrate in one country
that has relatively favorable economic conditions for foreign investors, in or-
der to benefit from not only scale economies but also from an agglomeration
economy. In this respect, Indonesia has lagged in the development of support-
ing industry and infrastructure from other countries in the region, such as
Thailand.
This paper examines trends in Indonesia’s automotive industry and fo-
cuses on changes in exports, imports and plant efficiency as a result of the
changing environment surrounding the industry. Section 2 summarizes the
characteristics of the Indonesian automotive industry and the government’s
industrial policies, and describes recent trends in Japanese-affiliated compa-
nies. Section 3 investigates the trends in exports and imports, and Section 4
examines the effects of foreign trade on productivity and efficiency over the
period 1990–2000 by estimating a latent class stochastic frontier model using
a plant-level panel dataset. Finally, Section 5 offers some concluding remarks.
2

2 The development of Indonesia’s automotive industry
2.1 Characteristics of Indonesia’s automotive industry
The increase in the number of studies on the Indonesian automotive in-
dustry is evidence of the rising interest in this industry. In these papers, several
important factors that have hampered growth of the industry were identified
(Aswicahyono et al., 2000; Imai, 1999; Ito, 2002; Okamoto and Sjoholm, 2000;
Radhi, 2002).
An important factor is the small scale of the market. Although Indonesia
is the fourth most populous country in the world, the proportion of households
that are in the high-income bracket (i.e., those households that can purchase a
car) remains very limited. Furthermore, neighboring countries have protected
their own automotive industries, and as a result, the Indonesian automotive
industry has had no choice but to rely heavily upon its own domestic market.
This meant that the Indonesian auto manufacturers could not exploit scale
economies, and under such circumstances, it is difficult to decrease the cost of
production, resulting in inefficient operation.
In addition, pronounced product differentiation is an important charac-
teristic of the automotive industry. It has been argued that the Indonesian
automotive markets are segmented by a relatively large number of brands
compared to total demand for vehicles. This feature also forced auto mak-
ers, including parts makers, to operate inefficiently due to the lack of scale
economies. Evidence of this can be found in the study by Ito (2002) where
production functions were estimated using a plant-level dataset for the 1990s.
The results of the study suggest that the scale effect is an important determi-
nant of productivity levels in the automotive industry.
A second important characteristic of Indonesia’s automotive industry is
its heavy reliance on production for the domestic market, and in particular,
its production bias towards commercial vehicles. Commercial vehicles that are
better-suited to Indonesian market conditions (that is, given the poor roads
and the flexible carrying capacity of the vehicles) accounted for more than 80
percent of total annual car production (Aswicahyono et al., 2000). 1 However,
as pointed out in Imai (1999), this heavy reliance on commercial vehicles is
1 According to the chairman of GAIKINDO, this figure exaggerates the dependenceof the Indonesian automotive industry on commercial vehicles because some typesof vehicles that should be classified as passenger vehicles are classified as commercialvehicles.
3

Table 1Local procurement ratios for the Indonesian automotive industry by category
Year 1994 1995 1998
Commercial car
Category I (up to 5 tons) 12.20–51.00 5.39–48.14 40–50
Category II (5–10 tons) 21.60–37.50 23.40–33.67 30–40
Category III (10–24 tons) 24.87–36.30 29.27–35.06
Category IV (Cat. I-4x4) 1.00–31.90 2.20–30.79
Passenger car 5.00–42.90 5.02–42.24
Sources) Japan International Cooperation Agency (1997) for 1994, 1995 and Surjadipradja (2003)for 1998.
not a problem in and of itself; rather, the problem is that it is difficult to
export these cars and the parts for these vehicles since they are designed for
specific market conditions.
A third factor is the dominance of foreign manufacturers and the slow
progress of localization. As in many developing countries, the automotive in-
dustry is dominated by foreign multinational corporations (MNCs). In par-
ticular, Japanese MNCs are a significant factor in the automotive industry,
including the parts and components industry, accounting for more than 90
percent of annual car production in 1996–2000. However, the slow progress
of localization by Japanese firms has often been blamed as a factor behind
the slow development of the automotive industry in Indonesia. According to
a survey by the Japan Auto Parts Industries Association (JAPIA), the local
procurement ratio in Japanese automotive parts and components manufac-
turers in the ASEAN region was 56.4 percent in 1997 (Imai, 1999), while
the average localization point for the production of commercial vehicles in
Indonesia was about 40–50 percent in 1998 (Table 1). This indicates that lo-
calization of car production in Indonesia is far behind that of other ASEAN
countries, and this in turn implies a high dependence on imported materials,
parts and components; hence the production cost of vehicles is relatively high
in Indonesia.
A fourth characteristic is the lack of competition due to government in-
tervention. As mentioned above, the government supported the automotive
industry through various protective measures. However, these highly protec-
tive measures resulted in a lack of competition and made it possible for firms to
survive even if they could not improve their efficiency. Okamoto and Sjoholm
4

(2000) examined the performance of the automotive industry in 1990–95, and
the results suggest that the industry failed to achieve positive productivity
growth (in fact, it even registered negative growth), and that the industry’s
performance was poor despite the government’s support. Ito (2002) also esti-
mated various measures of competition and productivity. She concludes that
there was little competition in the Indonesian automotive industry and that
the important determinants of productivity growth are the scale of production
and capital utilization, not technological change.
2.2 Industrial policy and localization of production
The government played an important role in the development of the
Indonesian automotive industry. In the period after independence, economic
policy was characterized by a strong sense of nationalism (Pangestu, 1996,
p. 152). In the 1950s, the government implemented the Banteng program to
support participation of pribumi (indigenous people) in business. In 1957, as
a part of the program, the government tried to restrict the importation of
completely built-up (CBU) vehicles by charging higher tariffs as compared to
the tariffs for semi-knockdown and completely knockdown kits. This policy was
aimed at encouraging pribumi businesses to establish assembly plants locally,
and in fact, several local firms did set up assembly plants in cooperation with
foreign firms from Europe, the former Soviet Union, and Australia (Radhi,
2002). However, the number of vehicles that were assembled locally did not
increase, while imports of CBU vehicles increased during the period. After
1969, the government issued several decrees that reflected a plan to establish
full capacity for assembly of cars locally by 1984.
Aswicahyono et al. (2000) attributes the current fragmented and un-
economic structure of the automotive industry to these plans and policies.
Subsequent policy measures included an issuance of a decree that prohibited
the importation of CBU vehicles (in 1974). Furthermore, the “deletion pro-
gram” was introduced in 1976 to develop the parts and components sectors.
This program specified that certain components had to be produced locally,
and commercial vehicles were required to be assembled with local components.
Under this program, if local assemblers could not change their procurement
process by the target date so that the targeted components were locally pro-
cured, they were penalized by a 100-percent import duty on imported compo-
nents. The group of components that were initially targeted in this program
included replacement parts such as paint, tires and batteries that had to be
5

locally procured by 1977; the list of parts was further extended to functional
components that used more sophisticated technology for production such as
transmissions, brake systems and engines. Although several functional com-
ponents companies were established in the 1980s (Sato, 1996), these targets
were generally not met, partly because they were too ambitious (Aswicahyono
et al., 2000) and partly because the cost to locally procure functional com-
ponents was not low enough compared to the import cost even if an import
duty penalty was imposed (Japan International Cooperation Agency, 1997). In
June 1993, the government replaced the mandatory deletion program with the
“incentive program.” Under this new program, a local content point system
was adopted and assemblers were allowed to choose which components would
be locally procured or manufactured in-house. According to the level of local
contents point, the import duty on remaining components varied between 0
and 65 percent. This program was abolished in 1999.
The government tried to encourage supporting industries by restricting
imports, and by promoting foreign direct investment and technology transfer
from foreign firms. However, as indicated in Table 1, the local procurement
ratio was still low at 40–50 percent for commercial vehicles in 1998, suggest-
ing that there was no significant progress in the localization of production in
Indonesia. Japan International Cooperation Agency (1997) investigated local
content points for each component and part in 1995. According to the results,
most subcomponents that were produced with higher local content points
were subcomponents such as cylinder blocks and heads that are thought to
be mainly manufactured in-house by assemblers and subcomponents such as
radiators and sparkplugs that were already produced by Japanese-affiliates
in the 1980s. Nomura (1997) investigated the procurement of parts and raw
materials for some Japanese-affiliated assemblers in 1995. He characterized
the procurement process as (i) manufacturing in-house or imports of main
components, (ii) outsourcing of other main components to foreign-owned sup-
pliers, and (iii) outsourcing of other universal components to local suppliers.
According to the survey results, most foreign-owned suppliers of investigated
assemblers were Japanese-affiliated makers that began production locally in
the 1970s, and most of the local suppliers were provided technical assistance by
Japanese companies. These facts imply that Japanese companies contributed
to development of the industry through direct investment and technical assis-
tance, but technology transfer was limited to production technology for certain
parts and components.
6

Figure 1 The number of plants in Indonesia’s automotive industry
0
50
100
150
200
250
300
350
400
1975 1977 1979 1981 1983 1985 1987 1989 1991 1993 1995 1997 1999
0
5
10
15
20
25
30
35
40
45
Japanese-affiliates Other foreign-affiliates Locally-owned plants
Original Total Share of Japanese (%)
Sources) Author’s estimation from the raw datasets underlying Statistics Indonesia (variousyears a), and Toyo Keizai (various years) and Fourin (2000).
Note) “Original Total” is the number of plants classified into automotive industry in theraw datasets underlying Statistics Indonesia (various years a).
2.3 Foreign affiliates in the automotive industry
As mentioned above, Indonesia’s automotive industry has been domi-
nated by foreign-affiliated companies, especially Japanese. Commercial pro-
duction of vehicles by Japanese-affiliates in Indonesia started in the early
1970s after the importation of CBU vehicles was banned. Several Japanese
auto-parts and components makers, that were mainly producing replacement
parts such as batteries and sparkplugs, also began production in Indonesia in
the 1970s. Figure 1 shows the estimated number of plants that were involved
in the manufacture of vehicles and parts. 2 As can be seen in the figure, the
2 The number of plants was estimated using information from datasets underlyingStatistics Indonesia (various years a), and Toyo Keizai (various years) and Fourin(2000). Plants include (i) plants reported in the raw datasets for 1975–2000 un-derlying industrial surveys (Statistics Indonesia, various years a) and classified intovehicles (38431 or 34100 at Indonesian Standard Industrial Classification, ISIC, re-vision 2 or 3, respectively) or parts sector (38433 or 34300); and (ii) other plants, asreported in Toyo Keizai(various years) and Fourin (2000) that were involved in theproduction of vehicles or parts. This group of plants includes manufacture of tires,wire harnesses, car batteries and other parts which are not classified into vehiclesand parts sectors at the ISIC level.
7

number of foreign-owned plants remained at 20–30 plants through the mid-
1980s, while the number of total plants (mainly local plants) was gradually
increasing. In the late 1980s, when Japanese foreign direct investment to Asian
countries was increasing, the number of Japanese affiliates also increased in
Indonesia and the pace accelerated after 1995. Reflecting this trend, the share
of foreign-owned plants increased after 1995 and has reached 30 percent in
recent years. In 2000, there were more than 350 plants in Indonesia’s automo-
tive industry, and one-third of these plants were foreign-owned, primarily by
Japanese affiliates.
Although the number of Japanese affiliates continued to increase up to
2000, the pace has slowed since 1998. This partly reflects the sluggish In-
donesian economy and the slowdown in demand for vehicles due to the Asian
economic crisis. The Indonesian economy, which was hit hard by the 1997
crisis, registered economic growth of -13 percent in 1998 with the automotive
industry being one of the most damaged industries. New vehicle sales dropped
from 386,691 units in 1997 to 58,303 units in 1998. Furthermore, during the
crisis, the value of the rupiah declined against the U.S. dollar from Rp. 2,342
per U.S. dollar in 1996 to Rp. 10,014 in 1998. This depreciation of the rupiah
also hurt the profitability of the automotive industry because most interme-
diate goods were imported.
However, sale of vehicles recovered to 300,000 units in 2000 and con-
tinued to increase to 354,333 units in 2003. While the current level remains
lower than the peak of 386,691 in 1997, growth in sales has been faster than
projected by GAIKINDO in mid-2003 (at 340,000 units). According to the
chairman of GAIKINDO, Ir. Bambang Trisulo, total fixed investment in the
automotive industry amounts to the level at which about 750,000 vehicles can
be produced, and at the moment, the industry can produce about 400,000
units when plants operate at full capacity. This implies that the utilization
rate for the automotive industry was about 90 percent in 2003. Furthermore,
the sale of vehicles in Indonesia is projected to reach 500,000 in 2008, or in
One of the problems in the usage of raw datasets from industrial surveys involvescoverage; this is especially true for datasets from earlier years. Therefore, the start-ing year of operation for each Japanese affiliate was confirmed using informationfrom Toyo Keizai (various years) and Fourin (2000). Unfortunately, there is no com-prehensive source for the starting year of each locally owned plant; thus the numberof locally owned plants may be underestimated, particularly in earlier years. SeeSection 4.2 for more detail about the raw datasets for Indonesia’s industrial sur-veys.
8

2007 in the case of optimistic projections. These trends suggest that the perfor-
mance of the automotive industry has been better than most other industries
in Indonesia in recent years.
Another indicator of the relatively good performance of the automotive
industry is seen in exports. As noted in the next section, exports of vehicles
and parts increased during and after the economic crisis. In conjunction with
the depreciation of the rupiah, this increase partly reflects the fact that sev-
eral Japanese parent companies cooperated in handling the serious drop in de-
mand due to the economic crisis. For example, a Japanese assembler increased
exports of engines to its parent company in Japan (Yamashita, 2000). In ad-
dition, JAPIA promised the Indonesian government that Japanese-affiliated
members of GIAMM would increase exports (Fourin, 2000). As a result, to-
tal exports by GIAMM members increased from US$334 million in 1999 to
US$613 million in 2000. These data not only indicate that foreign-affiliated
companies supported the automotive industry after the economic crisis, but
it also suggests the importance of the international production network.
In more recent years, several Japanese companies have been considering
Indonesia as one of the important bases for its international production net-
work. In the process of global restructuring of the automotive industry and
the progress of the AICO and CEPT schemes, Japanese assemblers have been
planning regional strategies in the ASEAN region. Under the liberalizing trade
regime, assemblers and parts makers could concentrate their production bases
in one country (for example, Thailand) and export to other countries. However,
some major Japanese assemblers and parts makers have chosen to utilize exist-
ing facilities in each country, perhaps in order to minimize new investment. For
example, Toyota Motor Corporation announced a plan to establish a global
vehicle-and-parts supply network, referred to as the “IMV (innovative inter-
national multipurpose vehicle) project.” In the plan, affiliates in Indonesia are
to produce 70,000 units of multipurpose vehicles annually (mainly minivans,
while 200,000 units are to be produced in Thailand, mainly pickup trucks),
and production of gasoline engines is expected to rise to 180,000 units, 130,000
of which is designed for export within and beyond the region (Toyota Motors
Corporation, 2003). 3 Furthermore, Toyota and Daihatsu Motor Corporation
announced that it will produce and sell a new small car in Indonesia, that
was developed jointly and is called “U-IMV (Under IMV; Daihatsu ZENIA
3 The plan also proposes 240,000 diesel engines to be produced in Thailand, 130,000of which will be designed for export.
9

Figure 2 Shares of foreign-onwed plants with high foreign ownership share
0%
10%
20%
30%
40%
50%
60%
70%
1990 1991 1992 1993 1994 1995 1996 1997 1998 1999 2000
Foreign onwership share>=75 Foreign onwership share>=51
Sources) Author’s estimation from raw data underlying Statistics Indonesia (various years a),and Toyo Keizai (various years) and Fourin (2000).
and Toyota Avanza).” These cars will be priced under Rp. 100 million (about
US$12,000). The Japanese companies and their local partner, P.T. Astra In-
ternational, expect to sell 2,400 units of Avanza and 1,200 units of Xenia each
month starting in January 2004 (Laksamana.net, 2003). In addition to these
two assemblers, other Japanese assemblers, including Honda Motor Corpo-
ration and Hino Motors, have established new plants in Indonesia in recent
years.
An important change related to the trend in foreign-affiliated companies
is the increase in the share of foreign ownership. This is important for for-
eign companies because it sometimes takes a long time to negotiate with local
partners on crucial matters. If a foreign company has a relatively high owner-
ship share, it becomes easier to formulate and execute medium- and long-run
regional strategies to utilize international production networks. Deregulation
of foreign direct investment since the mid-1990s is also a factor behind the
increase in the share of foreign ownership. Indonesia’s investment law was
introduced in 1967, and thereafter various decrees regulated foreign direct
investment. However, since 1986 there has been gradual liberalization on all
aspects in the area of foreign investment policy (Pangestu, 1996). In particular,
regulations on investment issued in 1994 brought about drastic liberalization
of foreign direct investment. For example, after the issue of the regulations,
foreign companies were allowed to establish a company in Indonesia with a 100-
percent foreign ownership share. In addition, the rule that foreign companies
had to transfer foreign shareholdings of their affiliates so that Indonesian eq-
10

Figure 3 Exports and imports of vehicles and parts
0
500
1,000
1,500
2,000
2,500
3,000
3,500
4,000
1989 1990 1991 1992 1993 1994 1995 1996 1997 1998 1999 2000 2001 2002 20030
50
100
150
200
250
300
350
400
Production-Vehicles (thousand unit) ExportsVehicleExports-Parts Imports-VehicleImports -Parts
Sources) Author’s calculation from United Nations Statistics Division (2004) and Fourin (2000,2004).
uity would be increased to a majority shareholding of 51 percent was dropped
after 1994. The deterioration of the financial condition of local partners af-
ter the economic crisis contributed to this trend of rising foreign ownership,
and several Japanese companies acquired a majority share of equity in their
affiliates. The Japanese assemblers that increased ownership share in affili-
ates or plan to increase their shares include: Honda (49–51 percent in 2002),
Nissan (35–75 percent in September 2001), Daihatsu (40–61.75 percent, an-
nounced in August 2002), Suzuki (49–90 percent, announced in November
2002), Hino (60.15–90 percent of its manufacturing firm, announced in Jan-
uary 2003) and Toyota (49–95 percent of its manufacturing firm, announced
in February 2003. 4 Similarly with assemblers, the number of majority-foreign
parts makers has increased. Figure 2 shows the share of foreign-owned plants
that had foreign ownership shares of 51 percent or more and 75 percent or
more during 1990–2000. Both shares increased in the mid-1990s, and in par-
ticular, the ratio of plants with more than a 75-percent foreign ownership share
increased in 1997–99.
11
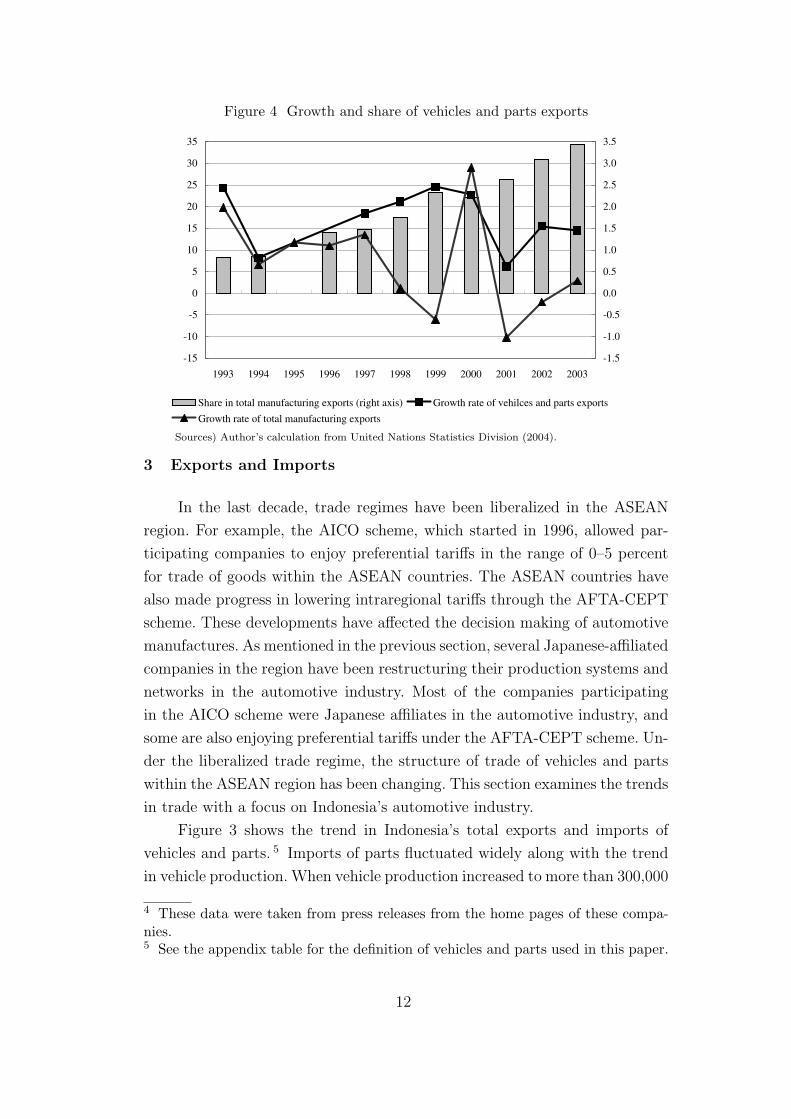
Figure 4 Growth and share of vehicles and parts exports
-15
-10
-5
0
5
10
15
20
25
30
35
1993 1994 1995 1996 1997 1998 1999 2000 2001 2002 2003-1.5
-1.0
-0.5
0.0
0.5
1.0
1.5
2.0
2.5
3.0
3.5
Share in total manufacturing exports (right axis) Growth rate of vehilces and parts exportsGrowth rate of total manufacturing exports
Sources) Author’s calculation from United Nations Statistics Division (2004).
3 Exports and Imports
In the last decade, trade regimes have been liberalized in the ASEAN
region. For example, the AICO scheme, which started in 1996, allowed par-
ticipating companies to enjoy preferential tariffs in the range of 0–5 percent
for trade of goods within the ASEAN countries. The ASEAN countries have
also made progress in lowering intraregional tariffs through the AFTA-CEPT
scheme. These developments have affected the decision making of automotive
manufactures. As mentioned in the previous section, several Japanese-affiliated
companies in the region have been restructuring their production systems and
networks in the automotive industry. Most of the companies participating
in the AICO scheme were Japanese affiliates in the automotive industry, and
some are also enjoying preferential tariffs under the AFTA-CEPT scheme. Un-
der the liberalized trade regime, the structure of trade of vehicles and parts
within the ASEAN region has been changing. This section examines the trends
in trade with a focus on Indonesia’s automotive industry.
Figure 3 shows the trend in Indonesia’s total exports and imports of
vehicles and parts. 5 Imports of parts fluctuated widely along with the trend
in vehicle production. When vehicle production increased to more than 300,000
4 These data were taken from press releases from the home pages of these compa-nies.5 See the appendix table for the definition of vehicles and parts used in this paper.
12

Figure 5 Export structure of vehicles and parts2003
Pneumatic tyres Parts, others Engines, sp-ig (gt 1000cc)Wheels Wiring sets Electric accumulatorsParts for diesel engines Radiators Auto, sp-ig engine (1000-3000cc)Radio receivers, etc Oil/petrol filters others
1993 2003
Sources) Author’s calculation from United Nations Statistics Division (2004).
units in the mid-1990s, imports of parts also increased significantly. However,
as a result of the economic crisis, vehicle production decreased drastically in
1998. At the same time, imports of parts decreased by 61 percent. Although the
decline can be partly explained by the depreciation of the rupiah, these facts
indicate that vehicle production was heavily dependent on imported parts and
components. On the other hand, exports of parts continued to increase during
the period, reaching US$1.1 billion in 2003. Total exports of vehicles and parts
grew at a very high rate in the late 1990s (Figure 4) registering growth of 25
percent in 1999 and 23 percent in 2000. The growth rate was more remarkable
when we compare it to the growth rate of total manufactured exports. While
total manufactured exports registered very low or negative growth after the
economic crisis (except in 2000), total exports of vehicles and parts continued
to grow at a relatively high rate. Although the share of vehicles and parts
in total manufacturing exports is low, the share increased from less than 1
percent in the first half of the 1990s to 3.4 percent in 2003, reflecting the
relatively high growth of this sector.
The structure of Indonesia’s exports of vehicles and parts has also changed
drastically in the last decade (Figure 5). In 1993, major export commodities
included radio receivers (HS852729), electric accumulators (HS850710) and
pneumatic tires (HS401110). While the share of radio receivers and electric
accumulators decreased drastically, the share of pneumatic tires has increased
in the last decade, accounting for one-fourth of total exports of vehicles and
parts in 2003. The second-largest category was Other parts (HS870899) which
13

Figure 6 Import structure of vehicles and parts
2003
Parts, others Parts for sp-ig engines Auto, sp-ig engine (1000-1500cc)Diesel powered trucks (gt 20 ton) Parts for diesel engines Auto, sp-ig engine (1500-3000cc)Dump trucks Transmission shafts, etc Engines, sp-ig engine (gt 1000 cc)Fuel, lubricating Clutches, etc Others
1993 2003
Sources) Author’s calculation from United Nations Statistics Division (2004).
saw its share increase from about 1 percent in 1993 to 18 percent in 2003.
The third-largest category is spark ignition engines (HS840734). As of 1993,
Indonesia’s automotive industry had already exported this engine, and as a
share of total exports of vehicles and parts, exports of spark ignition engines
increased from 4.6 percent in 1993 to 7.6 percent in 2003. It is very likely
that this increase in exports of these types of engines, as well as radiators
(HS870891), reflects the strategies of Japanese-affiliated companies (as ex-
plained in the previous section).
The change in import structure was not as large as that of exports (Figure
5). However, there are two important changes that are worthy of mention: (i)
the increasing share of Other parts and (ii) the increasing share of parts for
spark ignition engines (HS840991). Most of these parts had been imported
from outside of the ASEAN region (more than 99.5 percent), an in particular
were largely from Japan (more than 80 percent) in 1993 (Figure 7). However,
imports from the ASEAN countries have increased in recent years and in
2003, they accounted for more than 10 percent in both categories. Figure 7
also suggests that Indonesia increased not only imports but also exports of
Other parts in its trade with other ASEAN countries, and that Indonesia
increased its imports of engine parts from the region and relatively increased
the exports of engines to Asian countries other than ASEAN and Japan.
Figure 8 and figure 9 compare the level of trade (in terms of value) and the
partners in the automotive industry among the ASEAN4 countries, namely,
14

Figure 7 Trading partners of engine, its parts, and others
0%
20%
40%
60%
80%
100%
1993 2003 1993 2003 1993 2003 1993 2003
Export other parts Import other parts Export sp-ig engine Import part, sp-ig eng.
ASEAN Other Asia Other Japan
Sources) United Nations Statistics Division (2004)
Indonesia, Thailand, Malaysia and the Philippines in 1996 and 2002. The
Philippines was the largest exporter of parts among the ASEAN4 countries in
1996, followed by Thailand. A striking characteristic of these countries is the
relatively high share of exports to the Americas and Europe. However, as a
result of the sharp increase in the value of exports over the 1996–2000 period,
except for Malaysia, the direction of trade has gradually changed. A common
trend for all four countries is the increase in the share of exports to other
ASEAN countries, especially to the other ASEAN3 countries. In particular,
the share of Indonesia’s total exports of parts to Thailand, Malaysia and the
Philippines increased from 8 percent in 1996 to 22 percent in 2002. Another
important trend is the increasing share of exports to Japan for Indonesia
and Thailand, while the corresponding share for Malaysia and the Philippines
did not increase. On the import side, the value of imports was higher for
Thailand and Indonesia in 1996 than for other countries. However, imports
for the two countries decreased significantly over the 1996–2002 period. In
particular, for these countries, the share of imports from Japan declined. On
the other hand, the share of imports from other ASEAN3 countries was very
low for all four countries in 1996 but increased, especially for Malaysia. The
share for Indonesia increased from 3 percent in 1996 to 14 percent in 2002.
These facts suggest that since the end of the 1990s, the ASEAN4 countries
have increased both exports and imports within the region and that some of
these countries have also increased exports to Japan while decreasing their
15

Figure 8 Comparison of export direction for ASEAN4 countries
0%
10%
20%
30%
40%
50%
60%
70%
80%
90%
100%
IN '96 IN '02 TH '96 TH '02 ML '96 ML '02 PH '96 PH '020
200
400
600
800
1,000
1,200
1,400
1,600
1,800
2,000
Indonesia Thailand Malaysia PhilippinesOther ASEAN Other Asia America EuropeOther Japan ASEAN share Exports (r)
Sources) Author’s calculation from United Nations Statistics Division (2004) and Thai CustomsDepartment (2004).
Figure 9 Comparison of import direction for ASEAN4 countries
0%
10%
20%
30%
40%
50%
60%
70%
80%
90%
100%
IN '96 IN '02 TH '96 TH '02 ML '96 ML '02 PH '96 PH '020
500
1,000
1,500
2,000
2,500
3,000
3,500
4,000
4,500
5,000
Indonesia Thailand Malaysia PhilippinesOther ASEAN Other Asia America EuropeOther Japan ASEAN share Imports (r)
Sources) Author’s calculation from United Nations Statistics Division (2004) and Thai CustomsDepartment (2004).
imports from Japan.
The trends discussed above indicate the progress of complementary pro-
duction systems and networks in the region. The remainder of this section
measures and examines the revealed comparative advantage index (RCA) for
Indonesia as compared to other countries. In order to focus on the automo-
tive industry in the ASEAN region, the regional RCA (RRCA) is defined as
16

follows:
RRCAi =
(Exports of category i to ASEAN
Total exports of vehicles and parts to ASEAN
)
(World exports of category i to ASEAN
Total world exports of vehicles and parts to ASEAN
) . (1)
It should be noted that the RRCA is different from the usual RCA in two re-
spects. First, the market is limited to the ASEAN region instead of the world
market. Second, commodities are limited to vehicles and parts. Therefore,
when the RRCA is greater than 1, the results should be interpreted to mean
that Indonesia is a relatively heavy exporter of commodity i compared to other
exporters in the region and compared to other vehicles or parts exported from
Indonesia. Table 2 shows the RRCA for some commodities. Commodities 1–
15 are the top 15 commodities exported from the ASEAN4 countries in 2002,
and commodities 21–30 are the other commodities for which the RRCA for
Indonesia is relatively high. The largest category of exports from the ASEAN4
countries was Other parts in 2002, amounting to US$372 million. The RRCA
of this category for Indonesia was less than 1 in 1996, but it exceeded 1 in
2002 and 2003. In addition, Indonesia’s exports accounted for 30 and 44 per-
cent of the sum of exports of this category from the ASEAN4 countries in
2002 and 2003, respectively. These data suggest that in these categories, In-
donesia became a relatively heavy exporter to the ASEAN region. Another
important change is the increase in the RRCA for parts for diesel engines
(HS840999) and spark ignition engines (HS840734). Indonesia accounted for
a relatively large share in the total sum of ASEAN4’s exports in these cate-
gories. These changes suggest that Indonesia is one of the important players
in the regional production system under the liberalized trade regime. More-
over, Indonesia is a relatively heavy exporter of pneumatic tires (HS401110),
wiring sets (HS854439) and electric accumulators (HS850710). In addition,
the RRCA for air condensers (HS841520) was relatively high in 2003.
Table 3 shows the RRCA in world markets other than the ASEAN region.
The largest category of exports from the ASEAN4 countries is diesel-powered
trucks (HS870421) that are mainly exported from Thailand, followed by wiring
sets (HS854430) and other parts (HS870899). While Indonesia has revealed
comparative disadvantages in export of diesel-powered trucks and other parts,
the RRCA of wiring sets for Indonesia is greater than 1 indicating that Indone-
sia is a relatively heavy exporter in this category. Indonesia also has revealed
comparative advantages in export of pneumatic tires, wheels (HS870332), elec-
tric accumulators, radiators and inner tubes (HS401310). Most of the products
17

Tab
le2
Reg
iona
lR
CA
inde
xfo
rth
eA
SEA
Nau
tom
otiv
em
arke
tsR
RC
A-I
ndon
esia
RR
CA
-ASE
AN
3Tot
alex
port
s-A
SEA
N4
(Wor
ld=
1)(W
orld
=1)
(US$
mill
ion)
No
HS
Com
mod
ity
1996
2002
2003
1996
2002
2003
1996
2002
2003
187
0899
Mot
orve
hicl
epa
rts
nes
0.56
2.78
3.26
0.97
1.68
1.15
49(1
4)37
2(30
)36
6(44
)2
8708
40Tra
nsm
issi
ons
for
mot
orve
hicl
es0.
000.
020.
0211
.31
2.26
0.02
74(
0)10
9(0)
1(23
)3
8409
91Par
tsfo
rsp
ark-
igni
tion
engi
nes
0.02
0.10
0.10
1.20
1.33
1.13
19(
0)10
2(2)
97(
3)4
8704
21D
iese
lpo
wer
edtr
ucks
(lt
5to
n)0.
000.
000.
001.
022.
852.
3616
(0)
88(
0)96
(0)
587
0323
Aut
o,sp
-ig
engi
ne(1
500-
3000
cc)
0.00
0.19
0.48
0.17
0.40
0.69
11(
0)68
(11)
162(
17)
640
1110
Pne
umat
icty
res,
new
7.90
7.49
7.00
4.04
2.32
1.82
25(3
5)63
(46)
72(5
2)7
8408
20E
ngin
es,di
esel
0.01
0.07
0.00
2.12
2.01
1.38
25(
0)50
(1)
52(
0)8
8544
30Ig
niti
on/o
ther
wir
ing
sets
5.17
3.34
0.44
2.49
1.80
0.33
10(3
6)41
(33)
5(27
)9
8708
29Par
tsan
dac
cess
orie
sof
bodi
es0.
000.
690.
140.
480.
560.
488(
0)36
(24)
31(
8)10
8409
99Par
tsfo
rdi
esel
engi
nes
1.02
1.50
1.96
0.43
0.18
0.19
12(3
9)35
(68)
47(7
5)11
8507
10Lea
d-ac
idel
ectr
icac
cum
ulat
ors
18.2
29.
926.
1715
.69
9.52
5.46
15(2
4)31
(21)
28(2
4)12
8708
94St
eeri
ngw
heel
s,co
lum
ns&
boxe
s0.
080.
540.
252.
353.
774.
146(
1)27
(4)
36(
2)13
8512
20Lig
htin
g/vi
sual
sign
allin
geq
uip.
nes
0.92
0.14
0.39
5.62
3.99
2.47
12(
4)25
(1)
25(
4)14
8407
34E
ngin
es,sp
ark-
igni
tion
,ov
er10
00cc
1.34
6.57
4.81
0.04
0.08
0.68
2(91
)23
(96)
39(6
7)15
8708
10B
umpe
rsan
dpa
rts
0.28
2.07
0.99
9.72
5.13
3.82
8(1)
21(1
0)26
(7)
2187
0710
Bod
ies
for
pass
enge
rve
hicl
es1.
8830
.78
4.82
0.01
2.67
3.67
2(98
)6(
75)
3(27
)22
8527
29R
adio
rece
iver
s11
2.78
25.6
35.
0514
.94
2.07
7.46
46(6
7)8(
76)
13(1
6)23
9401
20Se
ats
2.31
7.89
0.13
2.04
2.18
2.23
0(23
)3(
49)
3(2)
2487
0891
Rad
iato
rs2.
326.
494.
716.
271.
451.
114(
9)5(
54)
7(55
)25
8421
23O
il/pe
trol
filte
rs5.
514.
123.
063.
560.
460.
697(
29)
10(7
0)13
(56)
2685
1230
Soun
dsi
gnal
ling
equi
pmen
t0.
023.
134.
868.
192.
601.
563(
0)3(
24)
3(47
)27
8415
20A
irco
ndus
edin
vehi
cle
-2.
715.
34-
1.75
2.11
0(2(
29)
3(42
)28
8421
31In
take
air
filte
rs5.
822.
633.
002.
781.
231.
083(
36)
5(36
)5(
44)
2987
0331
Aut
omob
iles,
dies
elen
gine
(lt
1500
cc)
0.00
2.39
7.29
0.00
1.88
0.05
0(0(
25)
0(98
)30
8703
21A
utom
obile
s,sp
-ig
engi
ne(l
t10
00cc
)0.
002.
310.
271.
280.
530.
501(
0)6(
53)
1(13
)
Sour
ces)
Aut
hor’
sca
lcul
atio
nfr
omU
nite
dN
atio
nsSt
atis
tics
Div
isio
n(2
004)
,T
haiC
usto
ms
Dep
artm
ent
(200
4)N
otes
)A
SEA
N3=
(Tha
iland
,M
alay
sia,
Phi
lippi
nes)
,A
SEA
N4=
ASE
AN
3+In
done
sia,
Fig
ures
inpa
rent
his
are
Indo
nesi
a’s
shar
e(%
)in
tota
lex
port
sof
ASE
AN
4co
untr
ies.
Fig
ures
for
ASE
AN
3or
ASE
AN
4in
2003
does
n’t
incl
ude
Phi
lippi
nes
beca
use
ofda
taco
nstr
aint
.
18

for which Indonesia has a revealed comparative advantage in world markets are
resource-intensive or labor-intensive products. With regard to parts for diesel
engines and spark ignition engines, which are relatively capital-intensive, In-
donesia has shown revealed comparative advantages in the ASEAN markets
in recent years. However, the RRCAs are not shown in the table because the
sum of exports from the ASEAN4 countries is relatively small. Nevertheless,
Indonesia’s RRCA for spark ignition engines increased from 1.82 in 1996 to
2.28 and 2.67 in 2002 and 2003, respectively. The RRCA of parts for diesel
engines also increased from 0.30 to 0.62 and 1.27 over the same period.
4 An econometric analysis on plants’ efficiency
4.1 Econometric method
This section examines the productivity and efficiency of plants in the
automotive industry. As mentioned in the previous section, Indonesia’s total
exports of parts have increased in recent years. This increase in exports would
affect plant productivity or efficiency not only because of the increase in de-
mand, but also because firms would be forced to upgrade technology in order
to improve the quality of products and to produce at cheaper cost. In addi-
tion, an increase in the share of imports from the ASEAN region would also
affect plant productivity and efficiency through import of cheaper intermedi-
ate goods or increased competitive pressure. However, these effects on each
plant are different depending on the transactional relationship. For example,
the increase in a firm’s exports would also affect the productivity or efficiency
of its suppliers, as well as itself. However, other suppliers without transactional
relationships with exporters could not benefit through this channel. Account-
ing for these effects, this section estimates production functions and measures
the technical efficiency of plants using an econometric method.
Technical inefficiency is in general defined as the distance from a produc-
tion frontier, 6 and there are several methodologies to measure the technical
(in)efficiency of plants (or firms). Of these methodologies, this study applies a
latent class stochastic frontier model to a plant-level panel dataset for the In-
donesian auto parts industry during 1990–2000. 7 One of the main advantages
of using this model is that the latent class model does not assume the same
6 See, for example, Coelli et al. (1998).7 See, for example, William H. Greene (2002); Econometric Software, Inc. (2002);Hagenaars and McCutcheon (2002).
19
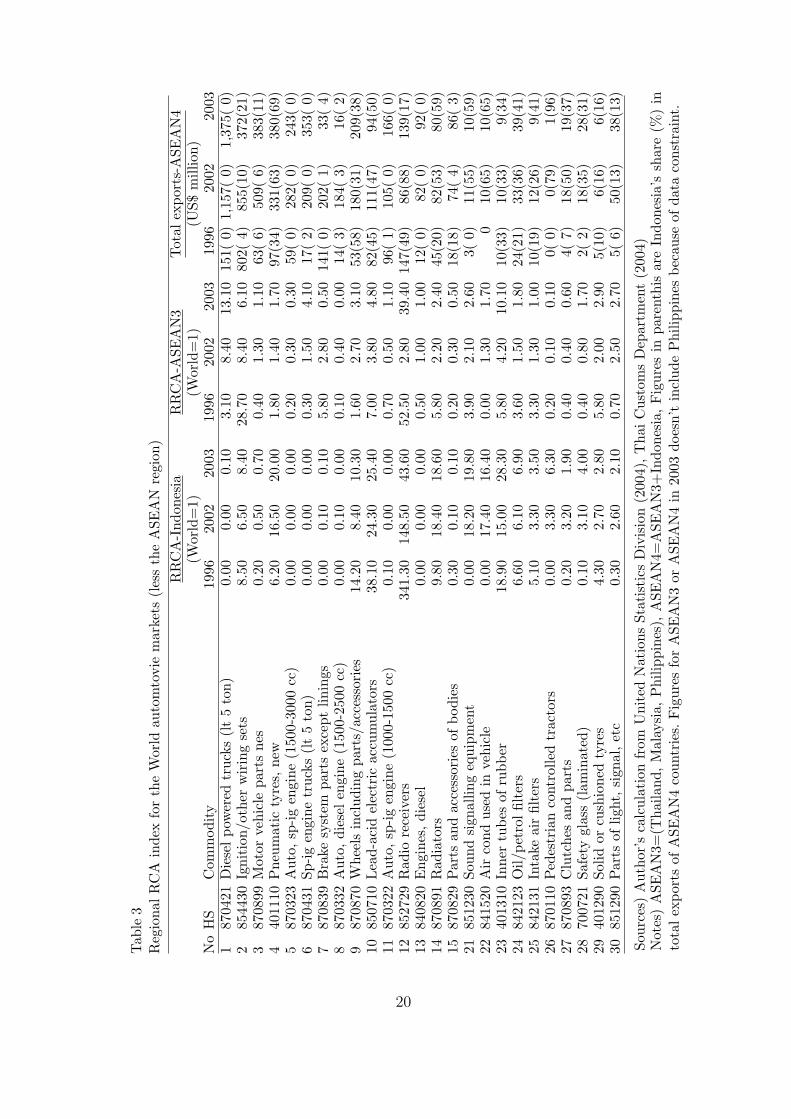
Tab
le3
Reg
iona
lR
CA
inde
xfo
rth
eW
orld
auto
mto
vie
mar
kets
(les
sth
eA
SEA
Nre
gion
)R
RC
A-I
ndon
esia
RR
CA
-ASE
AN
3Tot
alex
port
s-A
SEA
N4
(Wor
ld=
1)(W
orld
=1)
(US$
mill
ion)
No
HS
Com
mod
ity
1996
2002
2003
1996
2002
2003
1996
2002
2003
187
0421
Die
selpo
wer
edtr
ucks
(lt
5to
n)0.
000.
000.
103.
108.
4013
.10
151(
0)1,
157(
0)1,
375(
0)2
8544
30Ig
niti
on/o
ther
wir
ing
sets
8.50
6.50
8.40
28.7
08.
406.
1080
2(4)
855(
10)
372(
21)
387
0899
Mot
orve
hicl
epa
rts
nes
0.20
0.50
0.70
0.40
1.30
1.10
63(
6)50
9(6)
383(
11)
440
1110
Pne
umat
icty
res,
new
6.20
16.5
020
.00
1.80
1.40
1.70
97(3
4)33
1(63
)38
0(69
)5
8703
23A
uto,
sp-ig
engi
ne(1
500-
3000
cc)
0.00
0.00
0.00
0.20
0.30
0.30
59(
0)28
2(0)
243(
0)6
8704
31Sp
-ig
engi
netr
ucks
(lt
5to
n)0.
000.
000.
000.
301.
504.
1017
(2)
209(
0)35
3(0)
787
0839
Bra
kesy
stem
part
sex
cept
linin
gs0.
000.
100.
105.
802.
800.
5014
1(0)
202(
1)33
(4)
887
0332
Aut
o,di
esel
engi
ne(1
500-
2500
cc)
0.00
0.10
0.00
0.10
0.40
0.00
14(
3)18
4(3)
16(
2)9
8708
70W
heel
sin
clud
ing
part
s/ac
cess
orie
s14
.20
8.40
10.3
01.
602.
703.
1053
(58)
180(
31)
209(
38)
1085
0710
Lea
d-ac
idel
ectr
icac
cum
ulat
ors
38.1
024
.30
25.4
07.
003.
804.
8082
(45)
111(
47)
94(5
0)11
8703
22A
uto,
sp-ig
engi
ne(1
000-
1500
cc)
0.10
0.00
0.00
0.70
0.50
1.10
96(
1)10
5(0)
166(
0)12
8527
29R
adio
rece
iver
s34
1.30
148.
5043
.60
52.5
02.
8039
.40
147(
49)
86(8
8)13
9(17
)13
8408
20E
ngin
es,di
esel
0.00
0.00
0.00
0.50
1.00
1.00
12(
0)82
(0)
92(
0)14
8708
91R
adia
tors
9.80
18.4
018
.60
5.80
2.20
2.40
45(2
0)82
(53)
80(5
9)15
8708
29Par
tsan
dac
cess
orie
sof
bodi
es0.
300.
100.
100.
200.
300.
5018
(18)
74(
4)86
(3)
2185
1230
Soun
dsi
gnal
ling
equi
pmen
t0.
0018
.20
19.8
03.
902.
102.
603(
0)11
(55)
10(5
9)22
8415
20A
irco
ndus
edin
vehi
cle
0.00
17.4
016
.40
0.00
1.30
1.70
010
(65)
10(6
5)23
4013
10In
ner
tube
sof
rubb
er18
.90
15.0
028
.30
5.80
4.20
10.1
010
(33)
10(3
3)9(
34)
2484
2123
Oil/
petr
olfil
ters
6.60
6.10
6.90
3.60
1.50
1.80
24(2
1)33
(36)
39(4
1)25
8421
31In
take
air
filte
rs5.
103.
303.
503.
301.
301.
0010
(19)
12(2
6)9(
41)
2687
0110
Ped
estr
ian
cont
rolle
dtr
acto
rs0.
003.
306.
300.
200.
100.
100(
0)0(
79)
1(96
)27
8708
93C
lutc
hes
and
part
s0.
203.
201.
900.
400.
400.
604(
7)18
(50)
19(3
7)28
7007
21Sa
fety
glas
s(l
amin
ated
)0.
103.
104.
000.
400.
801.
702(
2)18
(35)
28(3
1)29
4012
90So
lidor
cush
ione
dty
res
4.30
2.70
2.80
5.80
2.00
2.90
5(10
)6(
16)
6(16
)30
8512
90Par
tsof
light
,si
gnal
,et
c0.
302.
602.
100.
702.
502.
705(
6)50
(13)
38(1
3)
Sour
ces)
Aut
hor’
sca
lcul
atio
nfr
omU
nite
dN
atio
nsSt
atis
tics
Div
isio
n(2
004)
,T
haiC
usto
ms
Dep
artm
ent
(200
4)N
otes
)A
SEA
N3=
(Tha
iland
,M
alay
sia,
Phi
lippi
nes)
,A
SEA
N4=
ASE
AN
3+In
done
sia,
Fig
ures
inpa
rent
his
are
Indo
nesi
a’s
shar
e(%
)in
tota
lex
port
sof
ASE
AN
4co
untr
ies.
Fig
ures
for
ASE
AN
3or
ASE
AN
4in
2003
does
n’t
incl
ude
Phi
lippi
nes
beca
use
ofda
taco
nstr
aint
.
20

production function for all sample individuals. 8 This advantage is important
because there exists various types of plant heterogeneity in the automotive
industry, and thus the assumption of a common production function is too
restrictive. The latent class model latently sorts sample individuals into J
classes. Then, parameters in a production function are estimated for each
class. A latent class stochastic frontier model can be written as follows:
yit|j = f(xit|βj) + νit − uit,
Pri[class = j] = Fij = MLOGIT (θjzi),
i = 1, 2, ..., n; t = 1, 2, ..., T ; j = 1, 2, ..., J,
(2)
where yit and xit refer to output and a set of inputs for plant i in year t, re-
spectively. The form of the production function f(·) is common for all classes,
but the parameters βj are different among classes. Thus, production fron-
tiers f(x|β) for class j are different among classes. Other two terms, ν and
u are a pure disturbance term and an inefficiency term, respectively. These
are assumed to be independently and identically distributed according to the
normal distribution (ν ∼ N [0, σ2ν ]) and according to the half-normal distribu-
tion (u ∼ |N(0, σ2u)|)), respectively. The structure for choice of class is based
on a multinomial logit model (MLOGIT ), and class probabilities for each in-
dividual (Fij) are allowed to vary with the nature of the individual (zi). The
model is estimated by maximizing the likelihood function derived from the
model (maximum likelihood estimation). Once the model is estimated, we can
estimate the inefficiency term u and calculate the efficiency index, exp(−uit),
in the case where the dependent variable is in the form of a natural logarithm.
In this study, the estimated model is specified as follows:
ln∗(Vit) = βj.0 + βj.l ln∗(Lit) + βj.k ln∗(Kit)
+ βj.ll[ln∗(Lit)]
2 + 2βj.lk ln∗(Lit) ln∗(Kit) + βj.kk[ln∗(Kit)]
2
+ δj.ds ln∗(V ehprot) + δj.ex ln∗(Exportt) + δj.im ln∗(Rimaset)(3)
+ ζj.exDex + ζj.imDim + νit − uit,
θjzi = θj.0 + θj.oldDFold + θj.newDFnew
where V , L, and K are value added, the number of workers and capital stock
(proxied by the volume of electric power used), respectively. The function
ln∗(·) is a logarithmic function subtracted by the sample average (ln ∗(·) =
ln(·) − ln(·)). Thus, the first part of the equation, which is composed of the
8 Random parameter modeling also does not require this assumption; however, itneeds distributional assumptions on parameters in the model.
21

first six terms on the right-hand side of equation (2) is a translog production
function. In order to examine the effect of a change in domestic demand for cars
and foreign trade of auto parts on plant productivity, five variables are added
to the model: V ehpro is the number of cars produced in Indonesia during year
t, Export is the total exports of parts during year t, Rimase is the imports
from the ASEAN region as a share of total imports of parts, Dex and Dim are
dummy variables that take a value of one if plant i was respectively exporting
or importing during year t. The class probability is assumed to depend on the
type of ownership. The dummy variable DFold has a value of one if a plant
began operation with a positive foreign ownership share before 1990, while
another dummy variable DFnew has a value of one if a plant began operation
with positive foreign ownership share in the 1990s or 2000.
4.2 Sample and data for the automotive industry
For estimation of the model explained above, raw data underlying In-
donesia’s industrial surveys were used. The surveys have been conducted on
an annual basis by Statistics Indonesia (formerly the Central Bureau of Statis-
tics) since 1975 and the raw datasets include information on each plant em-
ploying 20 workers or more. The datasets are basically cross-sectional for each
year, but it is possible to create a panel dataset for 1975–2000 using plant
identification codes. Although the datasets are relatively rich compared to
similar datasets for other developing countries, the datasets include inconsis-
tent data entries for some variables. One of these is a variable on the starting
year of commercial production, and another variable is ownership variables
(e.g., foreign ownership variable). In order to check for, and if necessary mod-
ify, inconsistent entries, information from Statistics Indonesia (various years
b), Toyo Keizai (various years), Fourin (2000) and various internet sources
were used. In addition, the datasets contain information on capital stock for
1988–95 and 1997–2000, but data for 1996 are not available. Furthermore,
there are a relatively large number of plants that did not report the value of
capital stock. Therefore, the analysis uses the volume of electric power (Kw)
as a proxy for the capital stock variable. The sample of plants for this anal-
ysis includes plants that were classified in the parts sector (38433) during
1990–2000, but plants that did not report on some variables that are needed
for this analysis were dropped. As a result, an unbalanced panel dataset was
constructed, which includes 702 observations for 105 plants during the period
1990–2000.
22

Tab
le4
The
esti
mat
ion
resu
lts
ofa
late
nt-
clas
sst
och
asti
cfr
onti
erm
odel
Cla
ssC
lass
One
Cla
ssT
wo
Cla
ssT
hre
eV
aria
ble
Coef
.t-
valu
eC
oef
.t-
valu
eC
oef
.t-
valu
eP
roduct
ion
funct
ion
Inte
rcep
t-5
.091
2.34
8**
-1.8
381.
66*
-1.6
441.
791*
ln(L
)0.
383
2.75
4**
*1.
182
10.5
98**
*0.
749
11.4
81**
*ln
(K)
0.19
02.
415
**0.
158
2.59
2***
0.50
112
.165
***
[ln(L
)]2
0.87
46.
821
***
0.36
16.
672*
**0.
260
5.16
6***
[ln(L
)][ln(K
)]-0
.117
2.20
3**
-0.1
215.
561*
**-0
.081
3.51
7***
[ln(K
)]2
0.04
61.
498
0.07
03.
861*
**0.
085
5.17
8***
ln(V
ehpr
o)0.
390
2.43
7**
0.13
71.
584
0.10
51.
615
ln(E
xpo
rt)
0.30
41.
942
*-0
.100
1.25
40.
186
2.37
6**
ln(R
imase
)0.
096
3.33
9**
*0.
046
3.24
9***
0.01
41.
020
Dex
-0.1
290.
531
-0.0
240.
126
-0.1
431.
200
Dim
-0.0
830.
440
-0.1
911.
951*
0.18
71.
819*
Cla
ssfa
ctor
sIn
terc
ept
-0.9
952.
453
**-0
.151
0.50
2D
Fold
1.46
11.
663
*-0
.457
0.45
2D
Fnew
0.36
10.
633
-2.6
402.
096*
*V
aria
nce
com
pon
ents
σ1.
744
10.6
72**
*1.
191
14.9
12**
*1.
487
18.2
07**
*λ
2.28
43.
246
***
6.83
72.
611*
**5.
862
3.57
8***
The
num
ber
ofpla
nts
2527
53For
eign
-ow
ned
pla
nts
153
26Sta
rted
bef
ore
1990
52
4A
vera
gesc
ale
elas
tici
ty0.
931.
241.
26
23

Figure 10 The efficiency index
Foreign (Total)
0.10.20.30.40.50.60.70.80.9
90 92 94 96 98 100
Local (Total)
0.10.20.30.40.50.60.70.80.9
90 92 94 96 98 100
Foreign (Class 1)
0.10.20.30.40.50.60.70.80.9
90 92 94 96 98 100
Local (Class 1)
0.10.20.30.40.50.60.70.80.9
90 92 94 96 98 100
Local (Class 2)
0.10.20.30.40.50.60.70.80.9
90 92 94 96 98 100
Local (Class 3)
0.10.20.30.40.50.60.70.80.9
90 92 94 96 98 100
Foreign (Class 3)
0.10.20.30.40.50.60.70.80.9
90 92 94 96 98 100
Sources) Author’s estimation.
4.3 Estimation results
The model explained above was estimated three times assuming that the
number of latent classes is two to four, respectively. Based on the Bayesian
Information Criterion for the estimated results, a model with three classes
was chosen. Table 4 shows the regression results of the latent class stochastic
frontier model. Based on the estimated class probability for 105 sample plants,
there were 25 plants whose probability of being classified in class 1 was highest
among the three classes, and 27 plants and 53 plants have highest probability of
being classified in class 2 and class 3, respectively. The estimate of class factor
24

parameter on DFold for class 1 was significantly positive at the 10 percent
significance level. This indicates that relatively old foreign-owned plants tend
to be classified in class 1. The significantly negative parameter estimate on
DFnew for class 2 indicates that relatively new foreign-owned plants tend to
be classified in class 1 or class 3. In addition, these results also indicate that
the group in class 2 is characterized as a group of locally owned plants.
There are some differences in parameters of production function among
classes. First, the parameter on vehicle production was significantly positive
for class 1 but insignificant for other classes. This suggests that productivity for
class 1 is positively affected by the increase in domestic vehicle production,
and indicates that plants in this class have transactional relationships with
assemblers. Second, the parameter on total exports was significantly positive
for class 1 and class 3, but was insignificant for class 2. This suggests that
the increase in total exports of parts positively affects the productivity of
plants in classes 1 and 3. As explained above, there are a relatively large
number of foreign-owned plants in these classes. Third, the parameter on the
share of imports from ASEAN was significantly positive for class 1 and class
2, but insignificant for class 3. This indicates that plants related to vehicle
production could also benefit from the increase in imports from ASEAN. One
possible interpretation of the significantly positive parameter for class 2 is
that productivity is affected by the increase in imports from ASEAN through
increasing competitive pressures. The insignificant parameter on the export
dummy for all classes indicates that productivity does not depend on whether
the plants themselves are exporting. On the other hand, the effect of imports
is different among classes. It is negative for class 2 and positive for class 3.
Figure 10 shows the efficiency index by class and ownership (upper line
= upper quartile, middle line = median, lower line = lower quartile). The effi-
ciency indices were calculated from the estimation results. Higher values indi-
cate more efficient plants and lower values indicate less efficient plants. Several
characteristics of plant efficiency for the automotive industry can be seen in
the figure. First, the level of efficiency, as measured by the median value, is
relatively low for both locally and foreign-owned plants. Efficiency does not
appear to have increased during the period, fluctuating around 0.5. Second,
the level of efficiency is almost identical between foreign and local plants, but
is slightly greater in foreign-owned plants than locally owned plants. Third,
the range from the lower quartile to the upper quartile appears wider for lo-
cally owned plants than foreign-owned plants, particularly for class 1 during
25

the mid-1990s and class 3. This indicates that some locally owned plants were
relatively efficient, but there were a relatively large number of inefficient lo-
cally owned plants compared to foreign-owned plants. The lower quartile for
class 3 of the foreign group is rising after 1998 but the corresponding line for
locally owned plants remains at a low level.
5 Concluding remarks
Indonesia’s automotive industry has been characterized as an infant in-
dustry that failed to grow; yet, the performance of this sector was relatively
good compared to other industries in Indonesia following the economic crisis.
There are some factors behind this relatively good performance of the indus-
try. The progress that has been made in lowering the intraregional tariff rate
is one of the factors. A related factor is the restructuring of multinational
corporations’ production networks in the ASEAN region.
This paper has examined recent trends in Indonesia’s exports, imports
and plant efficiency. One of the findings that emerges from the analysis is that
Indonesia’s exports have steadily increased under a liberalized trade regime.
This is also an important factor that contributed to the relatively good per-
formance of the automotive industry. Second, vehicle production depended
heavily on imports, mainly from Japan. However, in recent years, the share of
imports from the ASEAN countries is increasing while the corresponding share
from Japan is gradually decreasing. This trend probably reflects the restruc-
turing of Japanese major assemblers and parts makers’ production networks
in the region. Third, the results of the econometric analysis suggest that there
are three groups of plants in the automotive industry and that some groups, in
which there are a relatively large number of foreign-owned plants, can benefit
from the increase in exports and the increase in the share of imports from
ASEAN countries. In addition, the results suggest that the increase in the
share of imports from ASEAN also affected productivity for a group in which
a relatively large number of locally owned plants were classified. Fourth, the
level of plant efficiency fluctuated at a relatively low level and did not appear
to increase during 1990–2000. In addition, some locally owned plants have rel-
atively high efficiency, but there are a relatively large number of locally owned
plants that have low efficiency.
These findings suggest that the environment surrounding Indonesia’s au-
tomotive industry is changing and that the industry is gradually growing.
26

However, some challenges remain. One issue is the low efficiency level of some
locally owned plants, as noted above. Another issue involves the inefficiency
of the infrastructure. For instance, Tanjung Priok is one of Indonesia’s largest
and better-performing ports located in Jakarta. Yet, it is less productive than
most other major ports in Southeast Asia and its unit cost is higher than oth-
ers (Ray, 2003). The inefficiency of Indonesia’s infrastructure including its port
facilities is capable of hampering exports and imports, and thus development
of the industry.
References
Aswicahyono, H., M. C. Basri, and H. Hill (2000). How not to industrialise?
Indonesia’s automotive industry. Bulletin of Indonesian Economic Stud-
ies 36(1): 209–241.
Coelli, T., D. S. P. Rao, and G. E. Battese (1998). An Introduction to Effi-
ciency and Productivity Analysis. Boston: Kluwer Academic Publishers.
Econometric Software, Inc. (2002). LIMDEP Version 8.0, Econometric Mod-
eling Guide. Plainview: Econometric Software, Inc.
Fourin (2000). 2000 Asean-Taiwan Jidousha Buhin Sangyou [2000 Auto Com-
ponent Indsutry in ASEAN and Taiwan]. Nagoya: FOURIN.
Fourin (2004). Sekai Jidousha Toukei hakusho 2004 [White paper and statistics
on automotive industry in the world]. Nagoya: FOURIN.
Greene, W. H. (2002). Econometric Analysis (5 ed.). Upper Saddle River,
NJ: Prentice Hall.
Hagenaars, J. A. and A. L. McCutcheon (eds.) (2002). Applied Latent Class
Analysis. Cambridge, UK: Cambridge University Press.
Imai, H. (1999). Indonesian automotive parts and components industry. Asian
Economic Review, 1999Q2. Tokyo: The Japan Research Institute.
Ito, K. (2002). Foreign ownership and productivity in the Indonesian automo-
bile industry: Evidence from establishment data for 1990–1999. ICSEAD
Working Paper Series 2002-25.
Japan International Cooperation Agency (1997). Indonesia, Kougyou Bunya
Shinkou Kaihatsu Keikaku (Susono Sangyou) Chousa [Republic of Indone-
sia, The Investigation for the growth and development program in manufac-
turing sector (Supporting industry)]. Tokyo: JICA.
Laksamana.net (2003). Review: Private Enterprise. downloaded from the
website (http://www.laksamana.net/).
27

Nomura, T. (1997). Indonesia no jisousha meekaa to buhin-zairyou choutatsu
[Auto makers in Indonesia and the procurement of components and mate-
rials]. Shokei Ronso 47: 23–69.
Okamoto, Y. and F. Sjoholm (2000). Productivity in the Indonesian automo-
tive industry. ASEAN Economic Bulletin 17(1): 60–73.
Pangestu, M. (1996). Economic Reform, Deregulation and Privatization, The
Indonesian Experience. Jakarta: Centre for Strategic and International
Studies.
Radhi, F. (2002). Technology Transfer and Industrial Development: A Case
Study of the Indonesian Automotive Industry. Ph. D. thesis, the University
of Newcastle, Newcastle, Australia.
Ray, D. J. (2003). Survey of recent developments. Bulletin of Indonesian
Economic Studies 39(3): 245–270.
Sato, Y. (1996). The Astra group: A pioneer of management modernization
in Indonesia. The Developing Economy 34(3): 247–280.
Statistics Indonesia (various years a). Large and Medium Manufacturing
Statistics. Jakarta: Statistics Indonesia.
Statistics Indonesia (various years b). Manufacturing Industry Directory.
Jakarta: Statistics Indonesia. (Electric version).
Surjadipradja, H. (2003). Perkembangan Industri Komponen [The develop-
ment of Component Industry]. Jakarta: GIAMM. material provided by the
GIAMM (Indonesian Automotive Parts & Components Industries Associa-
tion).
Thai Customs Department (2004). Trade Statistics. Data downloaded in Au-
gust (http://www.customs.go.th/Customs-Eng/Statistic/Statistic
Index.jsp?menuNme=Statistic). Bang Kok: Thai Customs Department
Toyo Keizai (various years). Kaigai Shinshutsu Kigyou Souran -Kuni Betsu
[Japanese Oversea Investment - by country]. Tokyo: Toyo Keizai Inc.
Toyota Motors Corporation (2003). Press releases 2003-2004. downloaded
from the website (http://www.toyota.co.jp/en/news/).
United Nations Statistics Division (2004). UN Commodity Trade
Statistics Database (UN Comtrade). Data downloaded in August
(http://unstats.un.org/unsd/comtrade/). New York: United Nations.
Yamashita, S. (2000). The role of Japanese affiliated enterprises and technol-
ogy transfer: Implication for Indonesia. In V. Blechinger and J. Kegewie
(eds.), Facing Asia - Japan’s Role in the Political and Economic Dynamism
of Regional Cooperation, pp. 247–261. Munchen: Iudicium-Verl..
28

Appen
dix
A.
Tab
le1
Cla
ssifi
cati
onof
vehi
cles
and
part
sH
Sco
de
Des
crip
tion
HS
code
Des
crip
tion
401110
Pneu
mati
cty
res
new
ofru
bber
for
moto
rca
rs870310
Snow
mobiles
,golf
cars
,si
milar
veh
icle
s401210
Ret
readed
tyre
s870321
Auto
mobiles
,sp
ark
ignit
ion
engin
eof<
1000
cc401220
Pneu
mati
cty
res
use
d870322
Auto
mobiles
,sp
ark
ignit
ion
engin
eof1000–1500
cc401290
Solid
or
cush
ioned
tyre
s,in
terc
hangea
ble
trea
ds
870323
Auto
mobiles
,sp
ark
ignit
ion
engin
eof1500–3000
cc401310
Inner
tubes
ofru
bber
for
moto
rveh
icle
s870324
Auto
mobiles
,sp
ark
ignit
ion
engin
eof>
3000
cc700711
Safe
tygla
ss(t
emper
ed)
for
veh
icle
s,air
craft
,et
c870331
Auto
mobiles
,die
selen
gin
eof<
1500
cc700721
Safe
tygla
ss(l
am
inate
d)
for
veh
icle
s,air
craft
,et
c870332
Auto
mobiles
,die
selen
gin
eof1500–2500
cc700910
Rea
r-vie
wm
irro
rsfo
rveh
icle
s870333
Auto
mobiles
,die
selen
gin
eof>
2500
cc830120
Lock
sofa
kin
duse
dfo
rm
oto
rveh
icle
sofbase
met
al
870390
Auto
mobiles
nes
incl
udin
ggas
turb
ine
pow
ered
830230
Moto
rveh
icle
mounti
ngs,
fitt
ings,
ofbase
met
al,
nes
870410
Dum
ptr
uck
sdes
igned
for
off-h
ighw
ay
use
840734
Engin
es,sp
ark
-ignit
ion
reci
pro
cati
ng,over
1000
cc870421
Die
selpow
ered
truck
sw
eighin
g<
5to
nnes
840820
Engin
es,die
sel,
for
moto
rveh
icle
s870422
Die
selpow
ered
truck
sw
eighin
g5–20
tonnes
840991
Part
sfo
rsp
ark
-ignit
ion
engin
esex
cept
air
craft
870423
Die
selpow
ered
truck
sw
eighin
g>
20
tonnes
840999
Part
sfo
rdie
seland
sem
i-die
selen
gin
es870431
Spark
ignit
ion
engin
etr
uck
sw
eighin
g<
5to
nnes
841330
Fuel
,lu
bri
cati
ng
and
cooling
pum
ps
for
moto
ren
gin
es870432
Spark
ignit
ion
engin
etr
uck
sw
eighin
g>
5to
nnes
841520
Air
cond
use
din
veh
icle
870490
Tru
cks
nes
842123
Oil/pet
rolfilt
ers
for
inte
rnalco
mbust
ion
engin
es870510
Mobile
cranes
842131
Inta
ke
air
filt
ers
for
inte
rnalco
mbust
ion
engin
es870520
Mobile
dri
llin
gder
rick
s848310
Tra
nsm
issi
on
shaft
sand
cranks,
cam
and
crank
shaft
s870530
Fir
efighti
ng
veh
icle
s848320
Bea
ring
housi
ngs
etc
inco
rpora
ting
ball/ro
ller
bea
ring
870540
Mobile
concr
ete
mix
ers
848330
Bea
ring
housi
ngs,
shaft
s,w
ithout
ball/ro
ller
bea
rings
870590
Spec
ialpurp
ose
moto
rveh
icle
snes
848340
Gea
ring,ball
scre
ws,
spee
dch
anger
s,to
rque
conver
ter
870600
Moto
rveh
icle
chass
isfitt
edw
ith
engin
e848350
Fly
whee
lsand
pulley
sin
cludin
gpulley
blo
cks
870710
Bodie
sfo
rpass
enger
carr
yin
gveh
icle
s848360
Clu
tches
,sh
aft
couplings,
univ
ersa
ljo
ints
870790
Bodie
sfo
rtr
act
ors
,buse
s,tr
uck
set
c848390
Part
sofpow
ertr
ansm
issi
on
etc
equip
men
t870810
Bum
per
sand
part
sth
ereo
ffo
rm
oto
rveh
icle
s850710
Lea
d-a
cid
elec
tric
acc
um
ula
tors
(veh
icle
)870821
Safe
tyse
at
bel
tsfo
rm
oto
rveh
icle
s851220
Lig
hti
ng/vis
ualsi
gnallin
geq
uip
men
tnes
870829
Part
sand
acc
esso
ries
ofbodie
snes
for
moto
rveh
icle
s851230
Sound
signallin
geq
uip
men
t870831
Mounte
dbra
ke
linin
gs
for
moto
rveh
icle
s851240
Win
dsc
reen
wip
ers/
def
rost
ers/
dem
iste
rs870839
Bra
ke
syst
empart
sex
cept
linin
gs
for
moto
rveh
icle
s851290
Part
sofcy
cle
&veh
icle
light,
signal,
etc
equip
men
t870840
Tra
nsm
issi
ons
for
moto
rveh
icle
s852729
Radio
rece
iver
s,ex
tern
alpow
er,not
sound
repro
duce
r870850
Dri
ve
axle
sw
ith
diff
eren
tialfo
rm
oto
rveh
icle
s854430
Ignit
ion/oth
erw
irin
gse
tsfo
rveh
icle
s/air
craft
/sh
ip870860
Non-d
rivin
gaxle
s/part
sfo
rm
oto
rveh
icle
s910400
Inst
rum
ent
panel
clock
set
cfo
rveh
icle
s/air
craft
etc
870870
Whee
lsin
cludin
gpart
s/acc
esso
ries
for
moto
rveh
icle
s940120
Sea
ts,m
oto
rveh
icle
s870880
Shock
abso
rber
sfo
rm
oto
rveh
icle
s870110
Ped
estr
ian
contr
olled
tract
ors
870891
Radia
tors
for
moto
rveh
icle
s870120
Road
tract
ors
for
sem
i-tr
ailer
s(t
ruck
tract
ors
)870892
Muffl
ers
and
exhaust
pip
esfo
rm
oto
rveh
icle
s870130
Tra
ck-layin
gtr
act
ors
(cra
wle
rs)
870893
Clu
tches
and
part
sth
ereo
ffo
rm
oto
rveh
icle
s870190
Whee
led
tract
ors
nes
870894
Ste
erin
gw
hee
ls,co
lum
ns
&boxes
for
moto
rveh
icle
s870210
Die
selpow
ered
buse
s870899
Moto
rveh
icle
part
snes
870290
Buse
sex
cept
die
selpow
ered
29