in indonesia’s steel industry
TRANSCRIPT

energies
Article
Linking of Barriers to Energy Efficiency Improvementin Indonesia’s Steel Industry
Apriani Soepardi 1,2,* ID , Pratikto Pratikto 2, Purnomo Budi Santoso 3, Ishardita Pambudi Tama 3
and Patrik Thollander 4
1 Department of Industrial Engineering, University of National Development “Veteran”,Yogyakarta 55584, Indonesia
2 Department of Mechanical Engineering, Brawijaya University, Malang 65145, Indonesia;[email protected]
3 Department of Industrial Engineering, Brawijaya University, Malang 65145, Indonesia;[email protected] (P.B.S.); [email protected] (I.P.T.)
4 Department of Management and Engineering, Division of Energy System, Linköping University,Linköping SE-581 83, Sweden; [email protected]
* Correspondence: [email protected]; Tel.: +62-858-681-820-90
Received: 16 November 2017; Accepted: 28 December 2017; Published: 18 January 2018
Abstract: Energy use in Indonesia’s steel industry accounts for about 20–35% of total productioncosts. Consequently, energy end-use efficiency is a crucial measure that is used to reduce energyintensity and decrease production costs. This article aims to investigate the relationships amongdifferent barriers to energy efficiency improvement (EEI), using a framework with the following sixconstructs: government policy, the financial–economic factor, the managerial–organizational factor,the technological factor, workforce, and quality and type of feedstock and fuel used. The data werecollected from steel firm practitioners in Indonesia, using a questionnaire to test our framework.The results demonstrate that the applied framework was applicable. We find that EEI is moderatelyinfluenced by all constructs but that the managerial–organizational factor has the greatest direct effecton improvements and is the most significant factor.
Keywords: energy efficiency; conceptual framework; barriers; steel industry; Indonesia
1. Introduction
As industrial energy use accounts for about 36–37% or one-third of the world’s final energydemand [1], the industrial sector has a large impact on greenhouse gas (GHG) mitigation and is, thus,an important sector in terms of improved energy efficiency [2]. For energy-intensive industries, it isknown that energy costs may account for up to and over 30% of total production costs [3], so at thefirm level, improving energy efficiency is intended to generate direct economic benefits by decreasingthe amount of energy used in production [4,5]. This global industrial sector share consists of 42%, 75%,44% and 20% of the global electricity generated, coal, natural gas, and oil consumption, respectively [6].According to [7], there has been increasing concern about energy efficiency improvement (EEI) toovercome issues related to limited energy supply and rising energy demand.
EEI has been acknowledged as an important tool for obtaining competitive advantage andensuring industrial sustainability [5]. Furthermore, it is estimated that the world manufacturingindustry emits 43% of anthropogenic carbon dioxide emissions and specifically accounts for about25% of global GHG emissions [8,9]. Hence, energy saving is also considered the most cost-effectivemethod of mitigating GHG emissions [10]. Whereas according to [11], there are still requirements toconduct researches that addressed to energy efficiency agility, both in technological aspects and energyefficiency measures, related with combining agile and sustainable manufacturing concepts.
Energies 2018, 11, 234; doi:10.3390/en11010234 www.mdpi.com/journal/energies
Energies 2018, 11, 234 2 of 22
However, even though improved energy efficiency measures have become crucial formanufacturing industries, a number of obstacles still exist, hindering industry involvement in reducingenergy enduse [12]. The existence of these barriers leads to differencesbetween the optimal and actualimplementation of the potential for improved energy efficiency [13]. This discrepancy is referredto as “the energy efficiency gap” or “energy paradox”, which was first defined by [14]. Accordingto [15], the barrier model enables better comprehension of the industrial sector’sefforts to tackle theobstacles for achieving improvedenergy efficiency. To achieve the most effective and successful strategydevelopment and promotion, it is imperative to recognize these barriers to detecting, minimizing, andresolving obstacles [1].
In most countries, the iron and steel industry is one of the basic industrial sectors contributing tonational economic development [16]. It is well known that the amount of steel consumption is a keyindicator of national economic growth [17]. According to a report by the Agency for the Assessmentand Application of Technology [18], the Indonesia’s steel industry used energy in the form of electricity(60%), natural gas (38%), and petroleum fuels (2%). Together with the cement, petrochemical, and pulpand paper industries, the steel industry is categorized as one of the most energy-intensive end-usingsectors in Indonesia. The steel industry consumes approximately 38% of the total energy end-use ofIndonesian industries. The energy end-use in the national steel industry absorbs about 20–35% of totalproduction costs. Because of this situation, these industries can hardly achieve competitive advantagesin the international market.
Although some national industries have focused their efforts on improving energy efficiency byimplementing energy-saving technologies, the results have not significantly improved energy end-useefficiency [18]. This may be an indication that there are still a number of obstacles hindering theimplementation of improved energy efficiency. These difficulties show the existence of barriers toenergy use efficiency.
Minimizing existing barriers and creating an advantageous environment for the implementationof cleaner production [19]; obtaining and understanding suitable policies and know-how related tothe energy-efficient technologies and practices adopted by the firm [20]; devising cost-efficient policytactics [21], and designing, assimilating, and enforcing appropriate and effective policies [22] maybe possible only through a thorough examination and understanding of these barriers. Numerousstudies and reviews have revealed the existence of a wide variety of barriers to the implementationof cost-effective EEI measures, but there are still opportunities for improved energy efficiency [23].Most of the literature on barriers and the various frameworks for barriers have so far focused solelyon the type and importance of each of these barriers, while the interconnections among barriers inlinkages perspectives are rarely revealed. Only a few studies review and explain connections andrelationships between barriers [24]. There are a few exceptions. Thus, a new framework, that includedthe most relevant barriers and involved implicit interactions between barriers, is proposed by [25].
Therefore, there is a trend to explore how all barriers are interconnected. Furthermore, there isstill very much a need to develop extended conceptual barrier models that explain the relationshipsbetween barriers. Meanwhile, the characteristics of these barriers widely, depending on the levelof technology or the process being used, the type of industrial sectors, and the regional conditionswhere the industry is located [26]. For the reasons indicated above, we have conducted a preliminaryinvestigation to identify and analyze the interactions of the barriers to EEI regardingenergy endusein Indonesia’s steel industry. To date, no comprehensive studies have reviewed these barriers to EEIin the steel industry in Indonesia. The uniqueness of this study is in the stipulation of significantknowledge of factors and mechanisms that link, directly or indirectly, the barriers to improved energyefficiency in Indonesia’s steel industry.
The remainder of this article is structured as follows: Section 2 presents the research methodused in the case study. Section 3 deals with the development of the conceptual frameworks regardingthe barriers to adopting industrial energy-saving improvement measures. In Section 4, we propose aconceptual framework model and research hypothesis. In Section 5, an empirical data analysis based
Energies 2018, 11, 234 3 of 22
on a case study of Indonesia’s steel industry is carried out. This analysis is followed by the presentationand discussion of the results. In the final section, the conclusion, limitations, and suggestions forfurther research are given.
2. Methods
The approach applied in this study was descriptive and exploratory. The descriptive part wasused to obtain a systematic depiction of the phenomenon and characteristics of energy end-use inIndonesia’s steel industry. The explorative part was motivated as the study explores a novel area,i.e., barriers to energy efficiency in the Indonesia’s steel industry. In the regarded study, the paperconcerns a case, the steel industry in Indonesia, with a few selected firms, which makes the study suita case study research design. As outlined by [27], a case study is particularly suitable when studying acontemporary phenomenon. Due to the descriptive and exploratory nature of the study, the initialpart of the research was carried out as a multiple-case study inspired by [27], for which the individualcases studied consisted of Indonesian steel mills. Due to the limited number of steel mills in Indonesia,a case study was considered the most suitable methodological approach to the study. The statisticalmethod—structural equation modeling (SEM)—was used to analyze the collected data, in the laterpart of the research being carried out.
The SEM approach was used to test the hypotheses model. In this research, all SEM analyseswere conducted employing the partial least squares (PLS) method. PLS can deal with small samplesizes (20 samples) and does not mandate a normal distributional assumption [28]. The SEM approachto identify the interconnection among key factors related to the diffusion of the Radio FrequencyIdentification System in the health-care industry, whereas, by integrating SEM and quality functiondeployment is adopted by [29]. Whilst, the SEM method to develop a systematic framework for servicequality improvement is applied by [30]. The SEM applies a two-step procedure that simultaneouslyexamines and constructs the measurement model and then develops and tests the structural model [31].The two models of SEM should be evaluated separately, even though these models can be interpretedjointly [32]. In SEM-PLS, the measurement model is usually called the outer model, while the structuralmodel is called the inner model. In this study, we used the WarpPLS Version 5.0 software (ScriptWarpSystems, Laredo, TX, USA) program.
This choice of combining case study methodology and statistical analysis was inspired by [13],who also applied a limited statistical analysis in his study of barriers to EEI in the Swedish steelindustry, where a limited number of steel mills were also studied. The barrier models that wereapplied and analyzed were found using a literature study on barriers. It should be noted, as wasalready outlined in 1994 by [33], that the barrier field is characterized by both a variation in themagnitude of the potential improvement, as well as a variety of definitions of what may or may not beconsidered a barrier. In our study, we tried to delimit ourselves by these and apply the various outlinedbarriers of importance that were derived from the review of the scientific literature. This implies thatsome of the barriers identified as such by previous researchers may not be considered barriers.
The sorting of the firms was based on the industrial company directory that is maintained by theMinistry of Industry, Republic of Indonesia. In order to preserve the homogeneity of the surveyedfirms, we selected only the companies in the steel industry that have an EAF or blast furnace. Anotherreason for choosing this type of steel industry is that the primary production routes in steel makingare the BF route and the scrap-based EAF route. Furthermore, because, in some cases, the company’sinternal conditionsdid not permit access to the site and the undertaking of data collection, from a totalof 18 companies, only 12 gave approval for taking part in the case study. In Table 1, we have indicateda few characteristics of the firm respondents involved in the sample.
According to [34], a limitation is the biases of the respondents—that is, participants’ tendencies toprovide answers even if they have little knowledge about the subject. Furthermore, in many industrialcompanies, the official energy manager is not completely in charge of energy issues and their relatedinvestment costs. For these reasons, we took two to four respondents from each company to minimize
Energies 2018, 11, 234 4 of 22
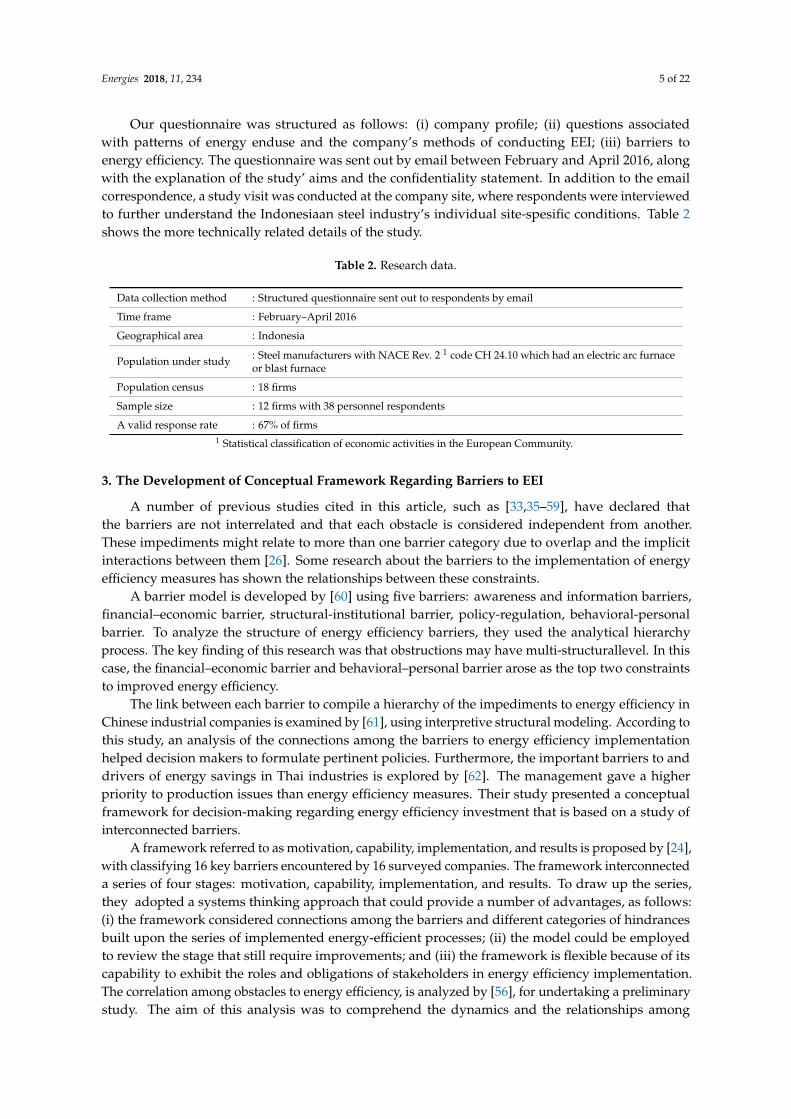
this bias. Finally, the total number of respondents who agreed to participate was 38 practitionersfrom 12 steel firms. The selected respondents were preferred because of their positions on the shopfloor, who had responsibility for the energy use issue [20]. Therefore, the questionnaires were mainlydirected toward the energy manager, if this position existed. If there was no an energy manager,the questionnaires were pointed to the plant managers (or operation managers or someone in anothersimilar position), the technical director (or middle managers), and the senior engineer who dealt withenergy issues. Figure 1 reflects the distribution of therespondents’ positions.
Table 1. Company profile.
Company Age oftheFirm (Years)
Firm Size (Numberof Employees)
Asset(Million $)
OwnershipPattern (Investment) Type of Final Product Number of
Respondents 1
A 47 >1000 5–10 Domestic Billet, semi finished 4
B 30 >1000 >50 Foreign Bloom, semi finished,flat & long product 3
C 42 100–500 >50 Domestic Crude steel, long product 3
D 45 100–500 5–10 Domestic Billet, long product 3
E 2 46 >1000 >50 Domestic Slab, billet, semi finished 4
F 3 6 >1000 >50 Joint venture Slab, semi finished 3
G 27 500–1000 >50 Domestic Billet, long product 3
H 11 100–500 >50 Foreign Long product 4
I 44 >1000 >50 Domestic Billet, semi finished,long product 2
J 43 100–500 >50 Joint venture Billet, long product 4
K 40 100–500 >50 Foreign Billet, semi finished 3
L 46 100–500 >50 Joint venture Crude steel 21 The total number of respondents = 38 practitioners; 2 The field-survey site; 3 Using the integrated BFproduction routing.
Figure 1. The respondent profiles (in total 38 respondents from Indonesian steel mills participated).
The categories of the selected barriers were developed on the basis of barrier category mapping.The questionnaire design was inspired by [27], and the questions’ items related to the barriers’importance were modified from the taxonomy of [26]. In accordance with [35], the survey sought toascertain perceptions, rather than real impediments, and it may have varied from the real conditions,but it was assumed to be able to clarify behavioral patterns. The design of the questionnairewas verified by three academics in industrial management engineering to strengthen the study’svalidity. In the questionnaire, we collected data from six categories of barriers—namely policy, themanagerial–organizational factor, the financial–economic factor, the technological factor, workforce,and used raw feedstock and fuel. The last category—used raw feedstock and fuel—is a newly proposedconstruct. Respondents gave scores based on a five-point Likert scale (1—very unimportant/veryirrelevant, 2—not important/not relevant, 3—quite important/quite relevant, 4—important/relevant,and 5—very important/very relevant) to assess the level of importance or relevance of the barriers.
Energies 2018, 11, 234 5 of 22
Our questionnaire was structured as follows: (i) company profile; (ii) questions associatedwith patterns of energy enduse and the company’s methods of conducting EEI; (iii) barriers toenergy efficiency. The questionnaire was sent out by email between February and April 2016, alongwith the explanation of the study’ aims and the confidentiality statement. In addition to the emailcorrespondence, a study visit was conducted at the company site, where respondents were interviewedto further understand the Indonesiaan steel industry’s individual site-spesific conditions. Table 2shows the more technically related details of the study.
Table 2. Research data.
Data collection method : Structured questionnaire sent out to respondents by email
Time frame : February–April 2016
Geographical area : Indonesia
Population under study : Steel manufacturers with NACE Rev. 2 1 code CH 24.10 which had an electric arc furnaceor blast furnace
Population census : 18 firms
Sample size : 12 firms with 38 personnel respondents
A valid response rate : 67% of firms1 Statistical classification of economic activities in the European Community.
3. The Development of Conceptual Framework Regarding Barriers to EEI
A number of previous studies cited in this article, such as [33,35–59], have declared thatthe barriers are not interrelated and that each obstacle is considered independent from another.These impediments might relate to more than one barrier category due to overlap and the implicitinteractions between them [26]. Some research about the barriers to the implementation of energyefficiency measures has shown the relationships between these constraints.
A barrier model is developed by [60] using five barriers: awareness and information barriers,financial–economic barrier, structural-institutional barrier, policy-regulation, behavioral-personalbarrier. To analyze the structure of energy efficiency barriers, they used the analytical hierarchyprocess. The key finding of this research was that obstructions may have multi-structurallevel. In thiscase, the financial–economic barrier and behavioral–personal barrier arose as the top two constraintsto improved energy efficiency.
The link between each barrier to compile a hierarchy of the impediments to energy efficiency inChinese industrial companies is examined by [61], using interpretive structural modeling. According tothis study, an analysis of the connections among the barriers to energy efficiency implementationhelped decision makers to formulate pertinent policies. Furthermore, the important barriers to anddrivers of energy savings in Thai industries is explored by [62]. The management gave a higherpriority to production issues than energy efficiency measures. Their study presented a conceptualframework for decision-making regarding energy efficiency investment that is based on a study ofinterconnected barriers.
A framework referred to as motivation, capability, implementation, and results is proposed by [24],with classifying 16 key barriers encountered by 16 surveyed companies. The framework interconnecteda series of four stages: motivation, capability, implementation, and results. To draw up the series,they adopted a systems thinking approach that could provide a number of advantages, as follows:(i) the framework considered connections among the barriers and different categories of hindrancesbuilt upon the series of implemented energy-efficient processes; (ii) the model could be employedto review the stage that still require improvements; and (iii) the framework is flexible because of itscapability to exhibit the roles and obligations of stakeholders in energy efficiency implementation.The correlation among obstacles to energy efficiency, is analyzed by [56], for undertaking a preliminarystudy. The aim of this analysis was to comprehend the dynamics and the relationships among
Energies 2018, 11, 234 6 of 22
categories of barriers and to provide statistical evidence of the connection level through a correlationcoefficient value that might portray the linkages among them.
To emphasize the linkages among obstacles to EEI, a barrier map based on the categorizationof the barriers is developed by [57]. This category dealt with barriers such as structural, marketinteraction, and performance barriers. The mapping could be used to identify the strategic barriersand obtain the potential measures for saving energy. The results of their study showed that among thebarriers, the lack of pipes or infrastructure, lack of investment returns, and capital cost were consideredthe most highly connected hindrances.
According to [25], there were three types of interconnection dynamics among the impediments—namely, causal relationship, composite effect, and hidden effect. By involving all the relevantcontributions, they proposed a novel approach related to relationships between barriers. The issuesof the research are as follows: (i) in the existing barriers framework, all the factors related to theidentified barriers in the literature have not been incorporated; (ii) the emergence of the barrieroverlap phenomenon renders an inapposite and disconcerting categorization; (iii) the spectrum ofhow the barriers’ impact affects on the decision-making of the firms; and (iv) the comprehension of themechanisms and dynamic connections among the barriers have not been fully elaborated.
4. Theory Development
4.1. Proposed Conceptual Framework
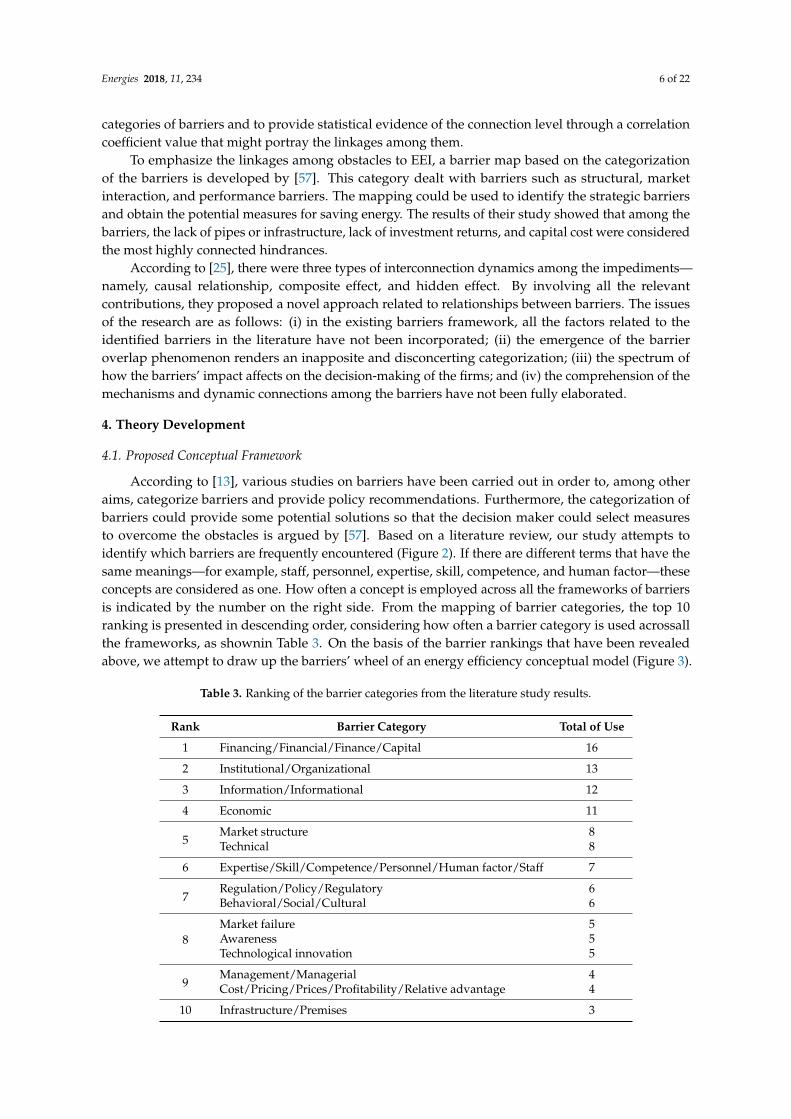
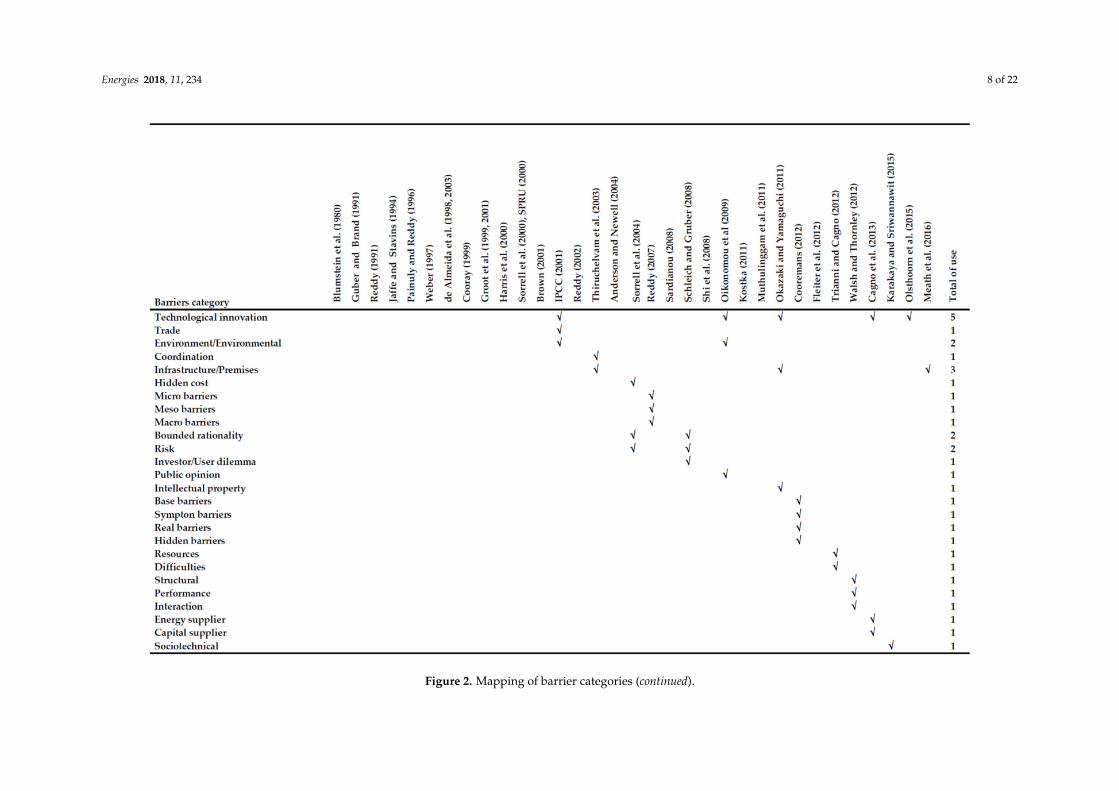
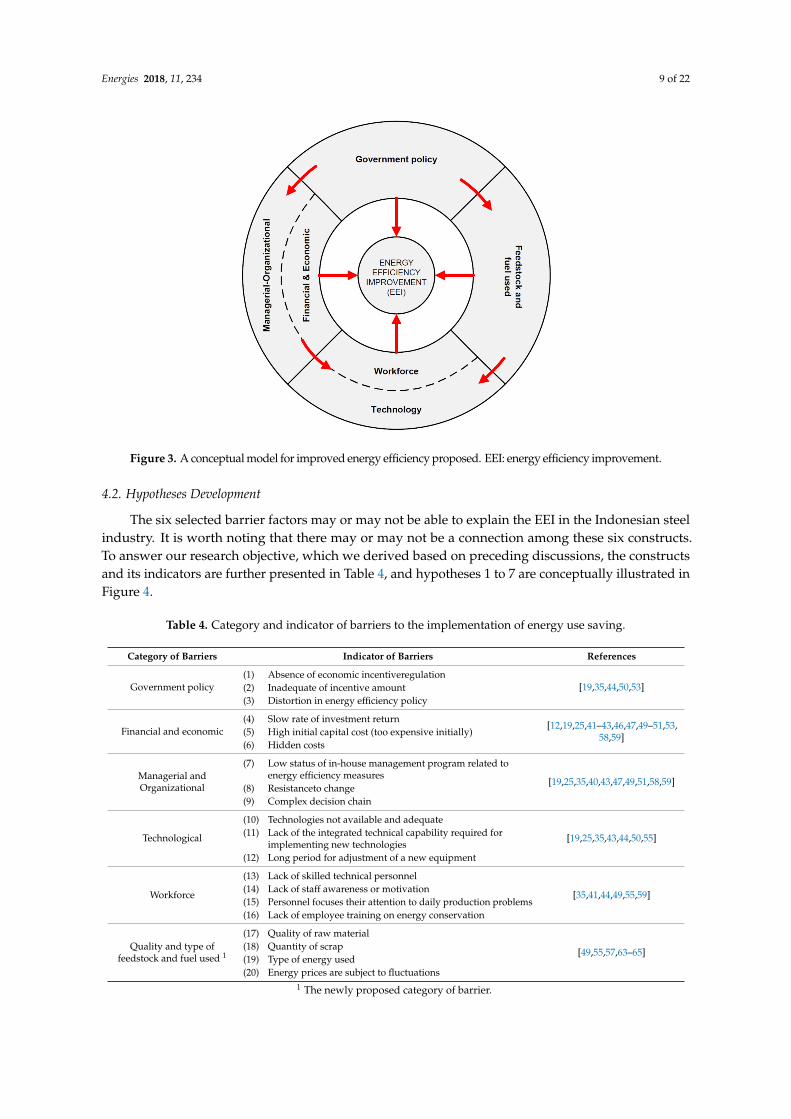
According to [13], various studies on barriers have been carried out in order to, among otheraims, categorize barriers and provide policy recommendations. Furthermore, the categorization ofbarriers could provide some potential solutions so that the decision maker could select measuresto overcome the obstacles is argued by [57]. Based on a literature review, our study attempts toidentify which barriers are frequently encountered (Figure 2). If there are different terms that have thesame meanings—for example, staff, personnel, expertise, skill, competence, and human factor—theseconcepts are considered as one. How often a concept is employed across all the frameworks of barriersis indicated by the number on the right side. From the mapping of barrier categories, the top 10ranking is presented in descending order, considering how often a barrier category is used acrossallthe frameworks, as shownin Table 3. On the basis of the barrier rankings that have been revealedabove, we attempt to draw up the barriers’ wheel of an energy efficiency conceptual model (Figure 3).
Table 3. Ranking of the barrier categories from the literature study results.
Rank Barrier Category Total of Use
1 Financing/Financial/Finance/Capital 16
2 Institutional/Organizational 13
3 Information/Informational 12
4 Economic 11
5Market structure 8Technical 8
6 Expertise/Skill/Competence/Personnel/Human factor/Staff 7
7Regulation/Policy/Regulatory 6Behavioral/Social/Cultural 6
8Market failure 5Awareness 5Technological innovation 5
9Management/Managerial 4Cost/Pricing/Prices/Profitability/Relative advantage 4
10 Infrastructure/Premises 3

Energies 2018, 11, 234 7 of 22
Figure 2. Mapping of barrier categories.
Energies 2018, 11, 234 8 of 22
Figure 2. Mapping of barrier categories (continued).
Energies 2018, 11, 234 9 of 22
Figure 3. A conceptual model for improved energy efficiency proposed. EEI: energy efficiency improvement.
4.2. Hypotheses Development
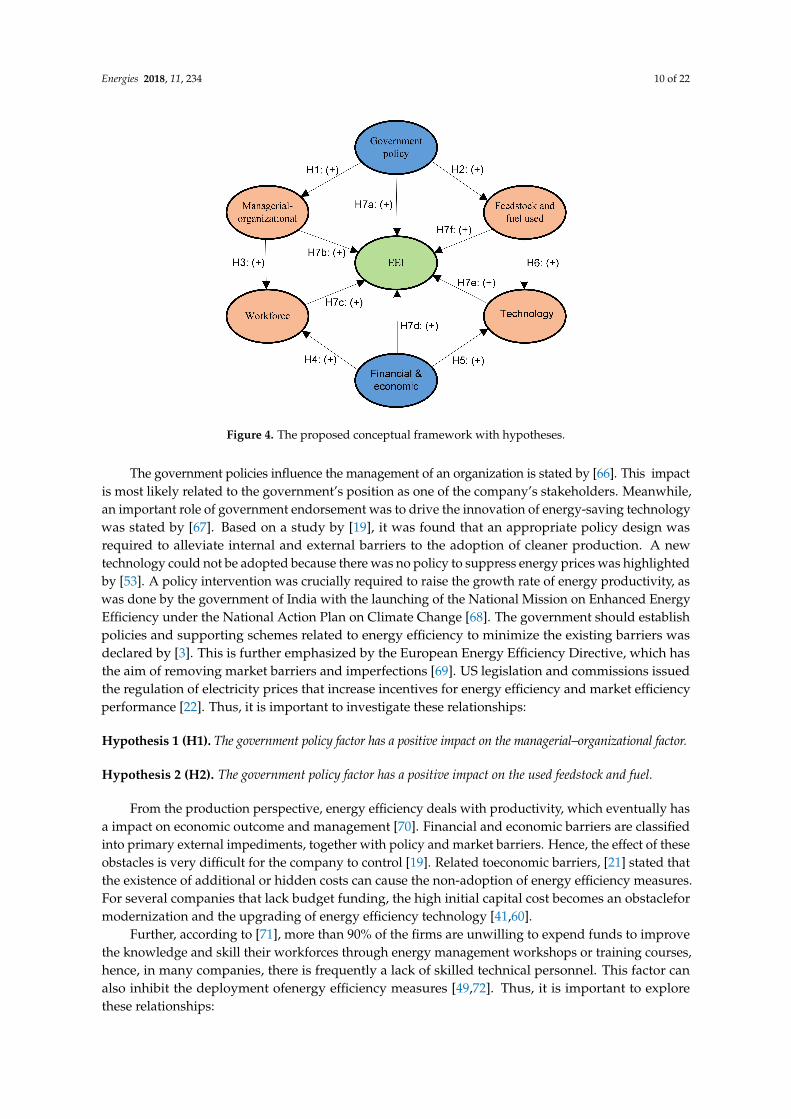
The six selected barrier factors may or may not be able to explain the EEI in the Indonesian steelindustry. It is worth noting that there may or may not be a connection among these six constructs.To answer our research objective, which we derived based on preceding discussions, the constructsand its indicators are further presented in Table 4, and hypotheses 1 to 7 are conceptually illustrated inFigure 4.
Table 4. Category and indicator of barriers to the implementation of energy use saving.
Category of Barriers Indicator of Barriers References
Government policy(1) Absence of economic incentiveregulation(2) Inadequate of incentive amount(3) Distortion in energy efficiency policy
[19,35,44,50,53]
Financial and economic(4) Slow rate of investment return(5) High initial capital cost (too expensive initially)(6) Hidden costs
[12,19,25,41–43,46,47,49–51,53,58,59]
Managerial andOrganizational
(7) Low status of in-house management program related toenergy efficiency measures
(8) Resistanceto change(9) Complex decision chain
[19,25,35,40,43,47,49,51,58,59]
Technological
(10) Technologies not available and adequate(11) Lack of the integrated technical capability required for
implementing new technologies(12) Long period for adjustment of a new equipment
[19,25,35,43,44,50,55]
Workforce
(13) Lack of skilled technical personnel(14) Lack of staff awareness or motivation(15) Personnel focuses their attention to daily production problems(16) Lack of employee training on energy conservation
[35,41,44,49,55,59]
Quality and type offeedstock and fuel used 1
(17) Quality of raw material(18) Quantity of scrap(19) Type of energy used(20) Energy prices are subject to fluctuations
[49,55,57,63–65]
1 The newly proposed category of barrier.
Energies 2018, 11, 234 10 of 22
Figure 4. The proposed conceptual framework with hypotheses.
The government policies influence the management of an organization is stated by [66]. This impactis most likely related to the government’s position as one of the company’s stakeholders. Meanwhile,an important role of government endorsement was to drive the innovation of energy-saving technologywas stated by [67]. Based on a study by [19], it was found that an appropriate policy design wasrequired to alleviate internal and external barriers to the adoption of cleaner production. A newtechnology could not be adopted because there was no policy to suppress energy prices was highlightedby [53]. A policy intervention was crucially required to raise the growth rate of energy productivity, aswas done by the government of India with the launching of the National Mission on Enhanced EnergyEfficiency under the National Action Plan on Climate Change [68]. The government should establishpolicies and supporting schemes related to energy efficiency to minimize the existing barriers wasdeclared by [3]. This is further emphasized by the European Energy Efficiency Directive, which hasthe aim of removing market barriers and imperfections [69]. US legislation and commissions issuedthe regulation of electricity prices that increase incentives for energy efficiency and market efficiencyperformance [22]. Thus, it is important to investigate these relationships:
Hypothesis 1 (H1). The government policy factor has a positive impact on the managerial–organizational factor.
Hypothesis 2 (H2). The government policy factor has a positive impact on the used feedstock and fuel.
From the production perspective, energy efficiency deals with productivity, which eventually hasa impact on economic outcome and management [70]. Financial and economic barriers are classifiedinto primary external impediments, together with policy and market barriers. Hence, the effect of theseobstacles is very difficult for the company to control [19]. Related toeconomic barriers, [21] stated thatthe existence of additional or hidden costs can cause the non-adoption of energy efficiency measures.For several companies that lack budget funding, the high initial capital cost becomes an obstacleformodernization and the upgrading of energy efficiency technology [41,60].
Further, according to [71], more than 90% of the firms are unwilling to expend funds to improvethe knowledge and skill their workforces through energy management workshops or training courses,hence, in many companies, there is frequently a lack of skilled technical personnel. This factor canalso inhibit the deployment ofenergy efficiency measures [49,72]. Thus, it is important to explorethese relationships:
Energies 2018, 11, 234 11 of 22
Hypothesis 3 (H3). The financial–economic factor has a positive impact on the technological factor.
Hypothesis 4 (H4). The financial–economic factor has a positive impact on the workforce factor.
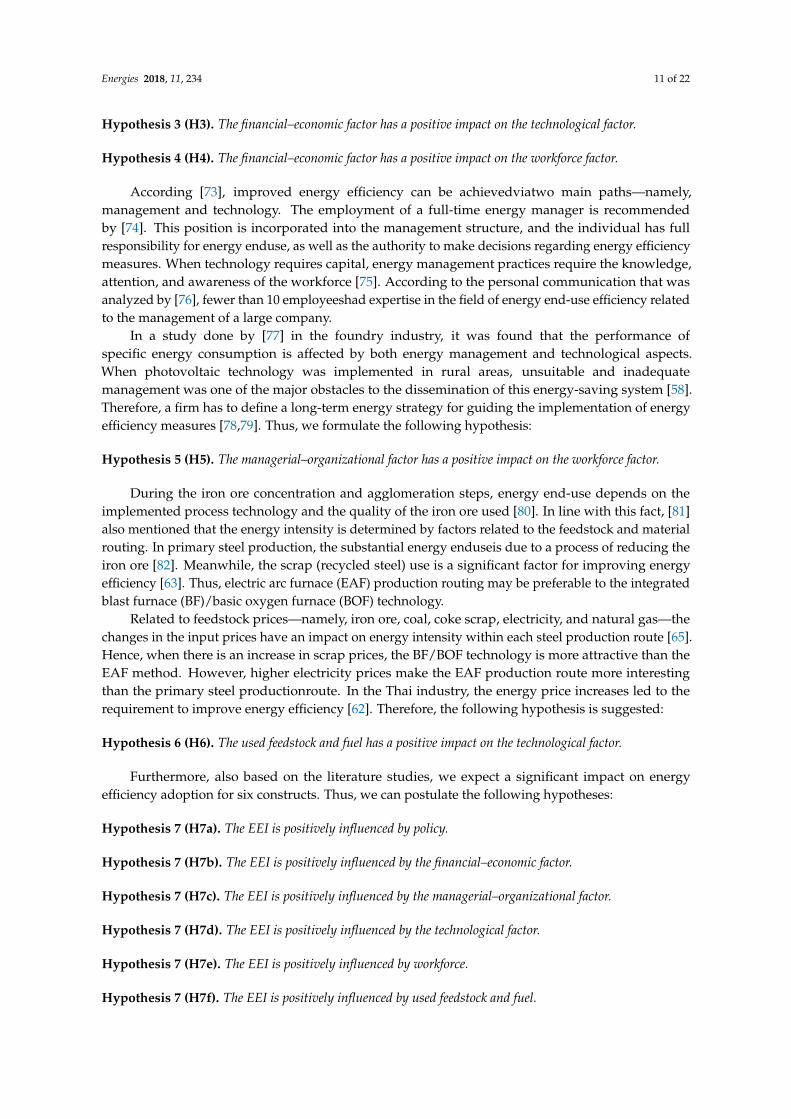
According [73], improved energy efficiency can be achievedviatwo main paths—namely,management and technology. The employment of a full-time energy manager is recommendedby [74]. This position is incorporated into the management structure, and the individual has fullresponsibility for energy enduse, as well as the authority to make decisions regarding energy efficiencymeasures. When technology requires capital, energy management practices require the knowledge,attention, and awareness of the workforce [75]. According to the personal communication that wasanalyzed by [76], fewer than 10 employeeshad expertise in the field of energy end-use efficiency relatedto the management of a large company.
In a study done by [77] in the foundry industry, it was found that the performance ofspecific energy consumption is affected by both energy management and technological aspects.When photovoltaic technology was implemented in rural areas, unsuitable and inadequatemanagement was one of the major obstacles to the dissemination of this energy-saving system [58].Therefore, a firm has to define a long-term energy strategy for guiding the implementation of energyefficiency measures [78,79]. Thus, we formulate the following hypothesis:
Hypothesis 5 (H5). The managerial–organizational factor has a positive impact on the workforce factor.
During the iron ore concentration and agglomeration steps, energy end-use depends on theimplemented process technology and the quality of the iron ore used [80]. In line with this fact, [81]also mentioned that the energy intensity is determined by factors related to the feedstock and materialrouting. In primary steel production, the substantial energy enduseis due to a process of reducing theiron ore [82]. Meanwhile, the scrap (recycled steel) use is a significant factor for improving energyefficiency [63]. Thus, electric arc furnace (EAF) production routing may be preferable to the integratedblast furnace (BF)/basic oxygen furnace (BOF) technology.
Related to feedstock prices—namely, iron ore, coal, coke scrap, electricity, and natural gas—thechanges in the input prices have an impact on energy intensity within each steel production route [65].Hence, when there is an increase in scrap prices, the BF/BOF technology is more attractive than theEAF method. However, higher electricity prices make the EAF production route more interestingthan the primary steel productionroute. In the Thai industry, the energy price increases led to therequirement to improve energy efficiency [62]. Therefore, the following hypothesis is suggested:
Hypothesis 6 (H6). The used feedstock and fuel has a positive impact on the technological factor.
Furthermore, also based on the literature studies, we expect a significant impact on energyefficiency adoption for six constructs. Thus, we can postulate the following hypotheses:
Hypothesis 7 (H7a). The EEI is positively influenced by policy.
Hypothesis 7 (H7b). The EEI is positively influenced by the financial–economic factor.
Hypothesis 7 (H7c). The EEI is positively influenced by the managerial–organizational factor.
Hypothesis 7 (H7d). The EEI is positively influenced by the technological factor.
Hypothesis 7 (H7e). The EEI is positively influenced by workforce.
Hypothesis 7 (H7f). The EEI is positively influenced by used feedstock and fuel.

Energies 2018, 11, 234 12 of 22
5. Results
5.1. The Measurement Model Evaluation
In order to test the scale validity or reliability of the observed variables, composite reliability andCronbach’s alpha (α) were calculated (Table 5). These indexes reflect the degree of internal consistencyof the indicators that represent the common construct. Our results show that composite reliabilityand Cronbach’s alpha coefficients of constructs exceed the value of 0.60, which confirms the degree ofinternal consistency of the measurement variables. The value is still recommended in an exploratorystudy [83]. The value of the composite reliability was above the minimum level of 0.60 in all cases [84].
Table 5. Overview of measurement and their criteria.
Construct Variable CompositeReliability
CronbachAlpha AVE Indicator/Observed Variable Factor
Loadings 2
Government policy (X1) 0.861 0.751 0.678Incentive regulation (X11) 0.944
Incentive amount (X12) 0.650Distortion in policy (X13) 0.848
Financial–economic (X2) 0.821 0.673 0.606Slow rate of return (X21) 0.842
High initial capital cost (X22) 0.731Hidden costs (X23) 0.758
Managerial–organizational (Y1) 0.793 0.608 0.565Low status (Y11) 0.781Resistance (Y12) 0.833
Complex decision chain (Y13) 0.626
Technological (Y2) 0.896 0.825 0.743Technologies (Y21) 0.864
Technical capability (Y22) 0.926Long period (Y23) 0.792
Workforce (Y3) 0.773 0.607 0.469
Skilled technical personnel (Y31) 0.729Staff awareness (Y32) 0.471Personnel focus (Y33) 0.821
Employee training (Y34) 0.670
Used feedstock and fuel (Y4) 0.892 0.833 0.679
Quality of feedstock (Y41) 0.890Quantity of scrap (Y42) 0.911
Type of energy used (Y43) 0.868Energy prices (Y44) 0.583
EEI (Y5) 0.738 0.470 0.492High priority to EEM 1 (Y51) 0.524
Management capability in EEM 1 (Y52) 0.750Supervision of EEM 1 (Y53) 0.798
1 EEM: Energy Efficiency Measures; 2 p-value < 0.001 for all factor loadings.
Furthermore, to establish the convergent validity and divergent (discriminant) validity,confirmatory factor analysis was conducted. The value is examined by three indices: compositereliability is greater 0.6; all standardized factor loadings are more than 0.7 with a significance ofp-value; and average variance extracted (AVE) is more than 0.5 [83]. In some cases, the standardizedloadings between 0.40 and 0.70 could still be viewed as maintained, mainly for a new questionnaire [85].In our empirical results (see Table 5), all the constructs meet the three criteria suggested by [83], withthe exception of Cronbach’s alpha and the AVE value for the EEI factor, which is not fulfilled.
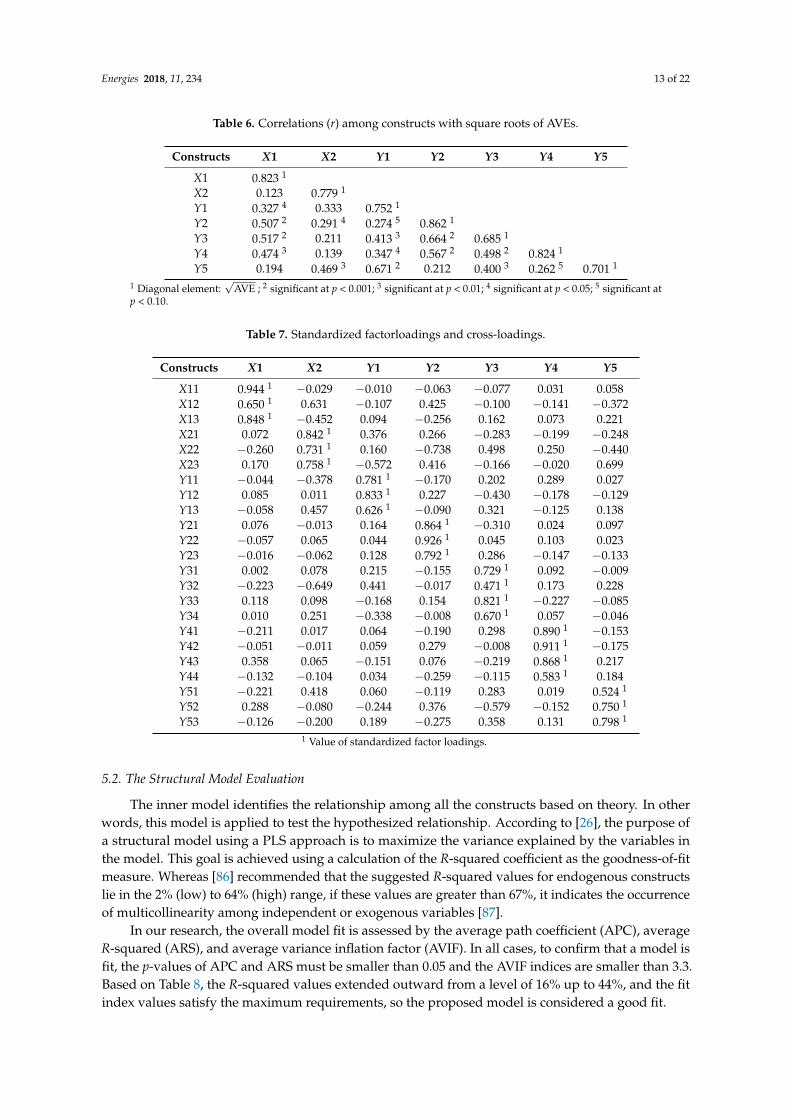
Discriminant validity assesses whether each construct is different from the others [31].This validity exists if the square root of the AVE for each individual construct is greater than thecorrelation between each pair of constructs. As shown in Table 6, the square roots of AVEs are denotedon the diagonal. In addition, we have also verified the cross-loading value to evaluate the discriminantvalidity. If all the cross-loading values of the other constructs are smaller than the construct itself, themeasurement of each indicator has demonstrated the divergent validity (see Table 7).
The outer model encounters the relationship between the measurement variables (indicators)and the latent variables (constructs). This model is used to estimate the reliability and validity of theindicators related to its construct. Overall, for this study, the outer analysis confirms that all measuresare reliable and valid. Therefore, we can conclude that our barriers to the EEI framework, as presentedin Figure 3, are reliable and valid.
Energies 2018, 11, 234 13 of 22
Table 6. Correlations (r) among constructs with square roots of AVEs.
Constructs X1 X2 Y1 Y2 Y3 Y4 Y5
X1 0.823 1
X2 0.123 0.779 1
Y1 0.327 4 0.333 0.752 1
Y2 0.507 2 0.291 4 0.274 5 0.862 1
Y3 0.517 2 0.211 0.413 3 0.664 2 0.685 1
Y4 0.474 3 0.139 0.347 4 0.567 2 0.498 2 0.824 1
Y5 0.194 0.469 3 0.671 2 0.212 0.400 3 0.262 5 0.701 1
1 Diagonal element:√
AVE ; 2 significant at p < 0.001; 3 significant at p < 0.01; 4 significant at p < 0.05; 5 significant atp < 0.10.
Table 7. Standardized factorloadings and cross-loadings.
Constructs X1 X2 Y1 Y2 Y3 Y4 Y5
X11 0.944 1 −0.029 −0.010 −0.063 −0.077 0.031 0.058X12 0.650 1 0.631 −0.107 0.425 −0.100 −0.141 −0.372X13 0.848 1 −0.452 0.094 −0.256 0.162 0.073 0.221X21 0.072 0.842 1 0.376 0.266 −0.283 −0.199 −0.248X22 −0.260 0.731 1 0.160 −0.738 0.498 0.250 −0.440X23 0.170 0.758 1 −0.572 0.416 −0.166 −0.020 0.699Y11 −0.044 −0.378 0.781 1 −0.170 0.202 0.289 0.027Y12 0.085 0.011 0.833 1 0.227 −0.430 −0.178 −0.129Y13 −0.058 0.457 0.626 1 −0.090 0.321 −0.125 0.138Y21 0.076 −0.013 0.164 0.864 1 −0.310 0.024 0.097Y22 −0.057 0.065 0.044 0.926 1 0.045 0.103 0.023Y23 −0.016 −0.062 0.128 0.792 1 0.286 −0.147 −0.133Y31 0.002 0.078 0.215 −0.155 0.729 1 0.092 −0.009Y32 −0.223 −0.649 0.441 −0.017 0.471 1 0.173 0.228Y33 0.118 0.098 −0.168 0.154 0.821 1 −0.227 −0.085Y34 0.010 0.251 −0.338 −0.008 0.670 1 0.057 −0.046Y41 −0.211 0.017 0.064 −0.190 0.298 0.890 1 −0.153Y42 −0.051 −0.011 0.059 0.279 −0.008 0.911 1 −0.175Y43 0.358 0.065 −0.151 0.076 −0.219 0.868 1 0.217Y44 −0.132 −0.104 0.034 −0.259 −0.115 0.583 1 0.184Y51 −0.221 0.418 0.060 −0.119 0.283 0.019 0.524 1
Y52 0.288 −0.080 −0.244 0.376 −0.579 −0.152 0.750 1
Y53 −0.126 −0.200 0.189 −0.275 0.358 0.131 0.798 1
1 Value of standardized factor loadings.
5.2. The Structural Model Evaluation
The inner model identifies the relationship among all the constructs based on theory. In otherwords, this model is applied to test the hypothesized relationship. According to [26], the purpose ofa structural model using a PLS approach is to maximize the variance explained by the variables inthe model. This goal is achieved using a calculation of the R-squared coefficient as the goodness-of-fitmeasure. Whereas [86] recommended that the suggested R-squared values for endogenous constructslie in the 2% (low) to 64% (high) range, if these values are greater than 67%, it indicates the occurrenceof multicollinearity among independent or exogenous variables [87].
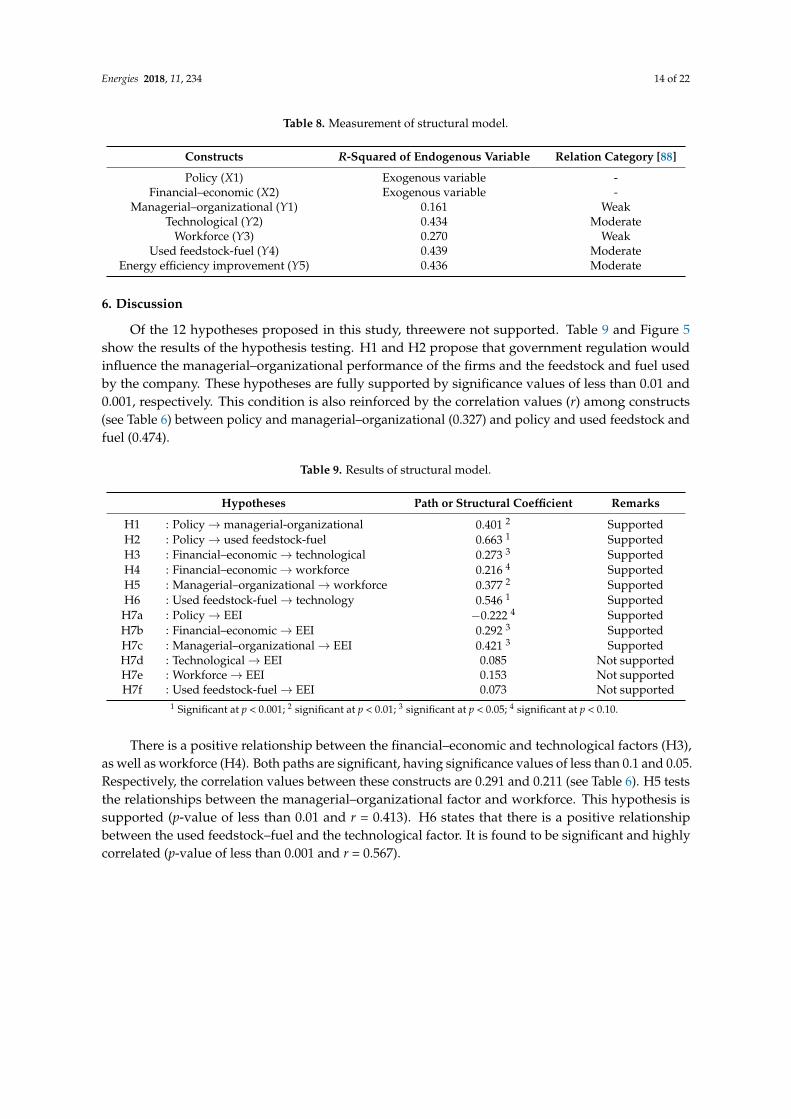
In our research, the overall model fit is assessed by the average path coefficient (APC), averageR-squared (ARS), and average variance inflation factor (AVIF). In all cases, to confirm that a model isfit, the p-values of APC and ARS must be smaller than 0.05 and the AVIF indices are smaller than 3.3.Based on Table 8, the R-squared values extended outward from a level of 16% up to 44%, and the fitindex values satisfy the maximum requirements, so the proposed model is considered a good fit.
Energies 2018, 11, 234 14 of 22
Table 8. Measurement of structural model.
Constructs R-Squared of Endogenous Variable Relation Category [88]
Policy (X1) Exogenous variable -Financial–economic (X2) Exogenous variable -
Managerial–organizational (Y1) 0.161 WeakTechnological (Y2) 0.434 Moderate
Workforce (Y3) 0.270 WeakUsed feedstock-fuel (Y4) 0.439 Moderate
Energy efficiency improvement (Y5) 0.436 Moderate
6. Discussion
Of the 12 hypotheses proposed in this study, threewere not supported. Table 9 and Figure 5show the results of the hypothesis testing. H1 and H2 propose that government regulation wouldinfluence the managerial–organizational performance of the firms and the feedstock and fuel usedby the company. These hypotheses are fully supported by significance values of less than 0.01 and0.001, respectively. This condition is also reinforced by the correlation values (r) among constructs(see Table 6) between policy and managerial–organizational (0.327) and policy and used feedstock andfuel (0.474).
Table 9. Results of structural model.
Hypotheses Path or Structural Coefficient Remarks
H1 : Policy→managerial-organizational 0.401 2 SupportedH2 : Policy→ used feedstock-fuel 0.663 1 SupportedH3 : Financial–economic→ technological 0.273 3 SupportedH4 : Financial–economic→ workforce 0.216 4 SupportedH5 : Managerial–organizational→ workforce 0.377 2 SupportedH6 : Used feedstock-fuel→ technology 0.546 1 Supported
H7a : Policy→ EEI −0.222 4 SupportedH7b : Financial–economic→ EEI 0.292 3 SupportedH7c : Managerial–organizational→ EEI 0.421 3 SupportedH7d : Technological→ EEI 0.085 Not supportedH7e : Workforce→ EEI 0.153 Not supportedH7f : Used feedstock-fuel→ EEI 0.073 Not supported
1 Significant at p < 0.001; 2 significant at p < 0.01; 3 significant at p < 0.05; 4 significant at p < 0.10.
There is a positive relationship between the financial–economic and technological factors (H3),as well as workforce (H4). Both paths are significant, having significance values of less than 0.1 and 0.05.Respectively, the correlation values between these constructs are 0.291 and 0.211 (see Table 6). H5 teststhe relationships between the managerial–organizational factor and workforce. This hypothesis issupported (p-value of less than 0.01 and r = 0.413). H6 states that there is a positive relationshipbetween the used feedstock–fuel and the technological factor. It is found to be significant and highlycorrelated (p-value of less than 0.001 and r = 0.567).

Energies 2018, 11, 234 15 of 22
Figure 5. The proposed conceptual framework with result.
H7 concerns all constructs related to the EEI factor. It is interesting to note that there are significant(p-value of less than 0.1) and negative (−0.222) relationships between policy and the EEI factor. Thus,government policy is negatively associated with EEI programs, implying that governmental regulationregarding improved energy efficiency is not directly affected (weak correlation r = 0.194 and nosignificance). This finding is supported by [14], who stated that lack of policy does not directly affectthe energy efficiency gap. If the government policy factor is observed through the correlation value ofpolicy against other constructs—that is, the managerial–organizational system (r = 0.327), workforce(r = 0.517), the technological factor (r = 0.507), and feedstock–fuel used in production (r = 0.474)—thisindicates that the government has to establish and issue a policy regarding EEI for each aspect. In otherwords, the government previously had to provide regulations related to the energy management offirms, availability guarantee and price of the feedstock and fuels consumed by steel industry, incentiveand subsidy for energy-saving technology and process implementation, and support to upgrade theknowledge and skill of employees. In accordance with [72], assessing the impacts of energy efficiencypolicies on EEI is a complex task. Furthermore, they found that policies could not be executed inisolation, where the feedback effects of a policy could either strengthen or weaken the effectiveness ofother policies. The energyefficiency regulations shouldbe designed by adjusting the barriers to theenergy-efficient technology adoption to make the policy’s execution more effective [89].
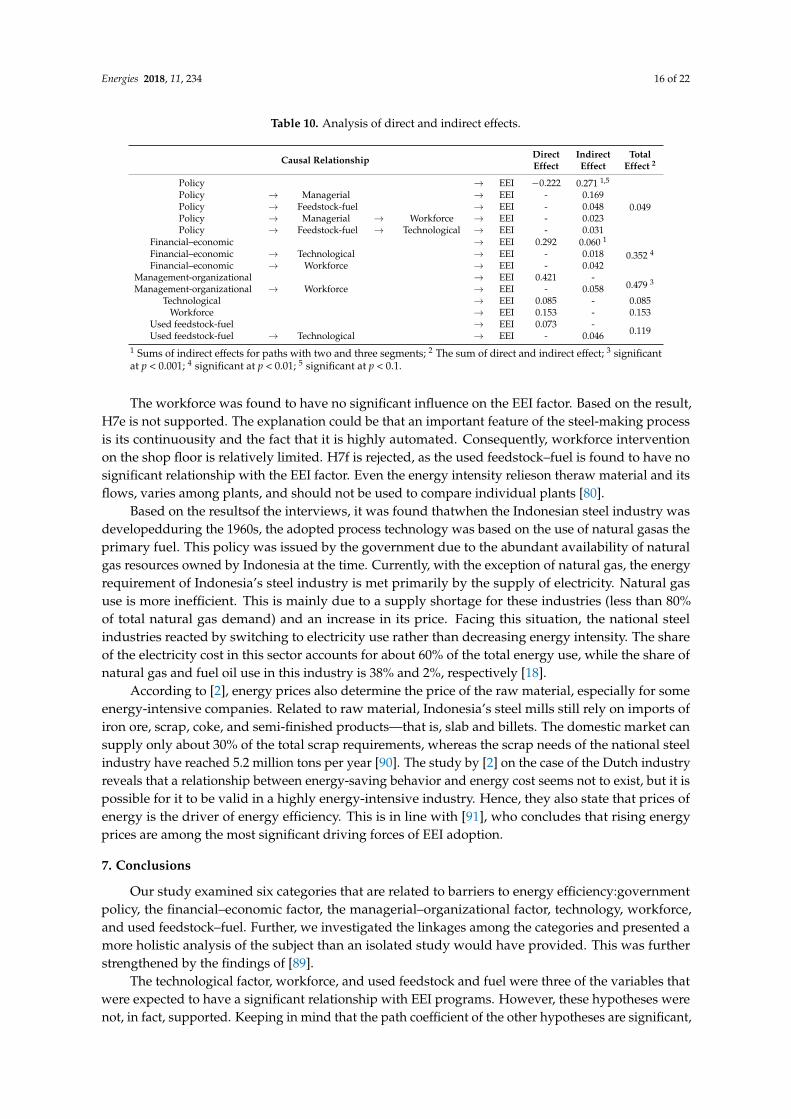
Our study also clarifies the conditions stated above with regard to involving indirect effects.Indirect effects are connectionsbetween one construct and another that is mediated through otherconstructs. As shown in Table 10, the total indirect effects of policy have the greatest value (0.271) andsignificant at a p-value of less than 0.1. It reveals that the mediating variables are found between thegovernment policy and EEI factors. In this case, with the exception of the financial–economic factor,the other factors mediate the relationship between policy and the EEI variable.
The hypotheses related to the technological factor (H7d) do not have a significant influence on theEEI factor or are not supported. This result is surprising, and one possible reason for it could be that,of the 12 firms, 11 firms adopted the EAF steel-making method for the first time, and companies have,thus, never replaced that technology. Thus, the respondents do not have comparable data or evidencerelated to the energy-saving effects of the other steel production technologies. Additionally, the EAF inIndonesia’s steel mills have an average age of 38 years (see Table 1), whereas a firm respondent thatadopted the integrated BF production route had been using it for only six years.
Energies 2018, 11, 234 16 of 22
Table 10. Analysis of direct and indirect effects.
Causal Relationship DirectEffect
IndirectEffect
TotalEffect 2
Policy → EEI −0.222 0.271 1,5
0.049Policy → Managerial → EEI - 0.169Policy → Feedstock-fuel → EEI - 0.048Policy → Managerial → Workforce → EEI - 0.023Policy → Feedstock-fuel → Technological → EEI - 0.031
Financial–economic → EEI 0.292 0.060 1
0.352 4Financial–economic → Technological → EEI - 0.018Financial–economic → Workforce → EEI - 0.042
Management-organizational → EEI 0.421 -0.479 3
Management-organizational → Workforce → EEI - 0.058Technological → EEI 0.085 - 0.085
Workforce → EEI 0.153 - 0.153Used feedstock-fuel → EEI 0.073 -
0.119Used feedstock-fuel → Technological → EEI - 0.0461 Sums of indirect effects for paths with two and three segments; 2 The sum of direct and indirect effect; 3 significantat p < 0.001; 4 significant at p < 0.01; 5 significant at p < 0.1.
The workforce was found to have no significant influence on the EEI factor. Based on the result,H7e is not supported. The explanation could be that an important feature of the steel-making processis its continuousity and the fact that it is highly automated. Consequently, workforce interventionon the shop floor is relatively limited. H7f is rejected, as the used feedstock–fuel is found to have nosignificant relationship with the EEI factor. Even the energy intensity relieson theraw material and itsflows, varies among plants, and should not be used to compare individual plants [80].
Based on the resultsof the interviews, it was found thatwhen the Indonesian steel industry wasdevelopedduring the 1960s, the adopted process technology was based on the use of natural gasas theprimary fuel. This policy was issued by the government due to the abundant availability of naturalgas resources owned by Indonesia at the time. Currently, with the exception of natural gas, the energyrequirement of Indonesia’s steel industry is met primarily by the supply of electricity. Natural gasuse is more inefficient. This is mainly due to a supply shortage for these industries (less than 80%of total natural gas demand) and an increase in its price. Facing this situation, the national steelindustries reacted by switching to electricity use rather than decreasing energy intensity. The shareof the electricity cost in this sector accounts for about 60% of the total energy use, while the share ofnatural gas and fuel oil use in this industry is 38% and 2%, respectively [18].
According to [2], energy prices also determine the price of the raw material, especially for someenergy-intensive companies. Related to raw material, Indonesia’s steel mills still rely on imports ofiron ore, scrap, coke, and semi-finished products—that is, slab and billets. The domestic market cansupply only about 30% of the total scrap requirements, whereas the scrap needs of the national steelindustry have reached 5.2 million tons per year [90]. The study by [2] on the case of the Dutch industryreveals that a relationship between energy-saving behavior and energy cost seems not to exist, but it ispossible for it to be valid in a highly energy-intensive industry. Hence, they also state that prices ofenergy is the driver of energy efficiency. This is in line with [91], who concludes that rising energyprices are among the most significant driving forces of EEI adoption.
7. Conclusions
Our study examined six categories that are related to barriers to energy efficiency:governmentpolicy, the financial–economic factor, the managerial–organizational factor, technology, workforce,and used feedstock–fuel. Further, we investigated the linkages among the categories and presented amore holistic analysis of the subject than an isolated study would have provided. This was furtherstrengthened by the findings of [89].
The technological factor, workforce, and used feedstock and fuel were three of the variables thatwere expected to have a significant relationship with EEI programs. However, these hypotheses werenot, in fact, supported. Keeping in mind that the path coefficient of the other hypotheses are significant,
Energies 2018, 11, 234 17 of 22
these factors have to be associated with the other factors—that is, policy, managerial–organizationalfactor, and financial–economic factor, so that technology, workforce, used feedstock and fuel couldcontribute to implementation of EEI measures.
The government regulation or policy must be mediated by factors in order to contribute toimproved energy efficiency. In other words, this category had a negative path coefficient or couldnot directly influence energy end-use efficiency action. According to [92], government policyinstruments related to setting standards for industrial energy efficiency were required to boost EEI.Whereas the individual category that had the highest direct effect on this energy-saving activitywas managerial–organizational.
We expect these research results to provide preliminary insightsinto Indonesia’s steel industryand inputs to be considered by decision makers with regard to establishingnew and revised policies,regulations, and interventions by the government related to EEI. The two major policy concepts forindustry related to improved energy efficiency are energy audit programs and voluntary agreementprograms (VAPs), also known as Long-Term Agreements (LTAs). In Indonesia, energy auditprograms have primarily been used. Based on the findings of this paper, we suggest that futurepolicy-makers may also consider more advancedpolicy programs also involving energy management,e.g., VAPs/LTAs. As noted by [93], “There is no universal approach to implement energy managementpractices and they can differ from company to company. These practices may involve visualization,group learning, knowledge, and exchange of experiences.” Therefore, such new policy design issuggested to take into account the specific country’s culture and industrial structure in order to be ascost-effective as possible.
As regards energy managers, the findings from this paper indicate a potential for further energyefficiency improvements in Indonesian steel mills. Such further improvement lies in enhanced energymanagement practices, but also awareness raising activities among employees, and capacity building.
The respondents ranged from technical personnel to energy managers. The researchers did notnotice any differences in responses depending on the positions of the respondents in the company.However, as shown by [62,91], future research could be extended to also include other sources ofinformation, e.g., trade associations, financial organizations, local government, and many more,to further strenghten the study’s validity.
Despite the limited number of studies on mills, weconsiderthese findings to be ofinterest asaninitial analysisofthebarriers to the implementation of energy use efficiency programs in Indonesia’ssteel mills. If referring to rules of thumb for robust SEM-PLS modeling related to the sample sizethat was suggested by [94], then the number of respondents in our research design was still not fullysufficient. As the study was aimed at evaluating the analytical or theoretical generalization ratherthan statistical generalization [27,95], thus the number of respondents were considered to be sufficient.Conducting solely a qualitative data evaluation leaves more room for fallacy and confusion, as statedby [96]. As regards potential risk of social desirability bias, the data collection did not percieve that tooccur. However, the results of this paper, should be viewed in light of the fact that such may happen.In addition, previous research in other countries supports both the methodological approach usedin our study, as well as the findings in the research being conducted [13,49,62,79,91]. This study issuggested to be continued, extending the approach, using both qualitative and quantitative researchdesign, and also involving more respondents.
Moreover, although these research results could not be statistically generalized for the steel industryin another country norfor all energy-intensive manufacturing sectors, they still make an importantcontribution to the area of improved industrial energy efficiency and barriers to the deployment of EEI.Furthermore, this preliminary framework investigation provides an indication of a foundation for, andnew insight into, future studies on Indonesia’s steel industry, as well as other industrial sectors.
We suggest that further research should be conducted to deepen the study of each barrier categoryin order to promote a more comprehensive understanding of EEI deployment. In addition, furtherresearch could also be broadened to other energy-intensive manufacturing sectors. Finally, a study
Energies 2018, 11, 234 18 of 22
of the effective drivers or driving forces ofenergy efficiency is needed and could shed more light ondecreasing and overcoming the obstacles that have been discussed.
Acknowledgments: The research work has been supported by the Ministry of Research, Technology, andHigher Education, Republic of Indonesia under the programme of Graduate Education Scholarship andPKPI/Sandwich-Like Scholarship. The authors would like to thank Akvile Lawrence for her constructiveinputs on the statistical part and also the kindly respondents and warmly personnel at the studied industries forproviding their time to be interviewed and answer our questions.
Author Contributions: Apriani Soepardi performed the data collecting in the field and analyzed the data;Pratikto Pratikto, Purnomo Budi Santoso, and Ishardita Pambudi Tama designed the questionnaires and verifiedthe results, Patrik Thollander clarified the concepts regarding barriers to EEI and method design. All authorsinvolved in preparing and writing the manuscript.
Conflicts of Interest: The authors declare no conflict of interest.
Appendix A. Summary of Questionnaire
On a scale of 1–5, indicate whether you 1 (very unimportant/very irrelevant)–5 (very important/very relevant).
Appendix A.1. Government Policy
1. Absence of economic incentiveregulation for industry that implements the EEI.2. Lack of incentive amount.3. Distortion in energy efficiency policies.
Appendix A.2. Financial and Economic
4. Slow rate of return on the investment.5. High initial capital cost.6. Hidden cost of production disruption/inconvenience.
Appendix A.3. Managerial and Organizational
7. Low priority given to energy management.8. Management resistance to change.9. Long decision-making process.
Appendix A.4. Technological
10. Inadequate energy-efficient technologies.11. Lack of the integrated technical skill.12. Long period for adjustment of energy-efficient technologies.
Appendix A.5. Workforce
13. Lack of skilled technical personnel.14. Lack of staff awareness.15. Focus on the daily production problems.16. Lack of employee training on energy conservation.
Appendix A.6. Quality and Type of Feedstock and Fuel Used
17. Quality of raw material or feedstock used.18. Quantity of scrap used.19. Type of energy or fuel used20. Energy prices.
Energies 2018, 11, 234 19 of 22
References
1. Fleiter, T.; Worrell, E.; Eichhammer, W. Barriers to energy efficiency in industrial bottom-up energy demandmodels—A review. Renew. Sustain. Energy Rev. 2011, 15, 3099–3111. [CrossRef]
2. Abeelen, C.; Harmsen, R.; Worrell, E. Implementation of energy efficiency projects by Dutch industry. EnergyPolicy 2013, 63, 408–418. [CrossRef]
3. Paramonova, S.; Thollander, P.; Ottosson, M. Quantifying the extended energy efficiency gap-evidence fromSwedish electricity-intensive industries. Renew. Sustain. Energy Rev. 2015, 51, 472–483. [CrossRef]
4. Karbuz, S. Achieving accurate international comparisons of manufacturing energy use data. Energy Policy1998, 26, 973–979. [CrossRef]
5. Farla, J.C.; Blok, K. The quality of energy intensity indicators for international comparison in the iron andsteel industry. Energy Policy 2001, 29, 523–543. [CrossRef]
6. International Energy Agency (IEA). Key World Energy Statistics; International Energy Agency (IEA): Paris,France, 2014.
7. Reddy, A.K. Barriers to improvements in energy efficiency. Energy Policy 1991, 19, 953–961. [CrossRef]8. Price, L.; Worrell, E.; Phylipsen, D. Energy Use and Carbon Dioxide Emissions in Energy-Intensive Industries in
Key Developing Countries; Lawrence Berkeley National Laboratory: Berkeley, CA, USA, 1999.9. Intergovernmental Panel on Climate Change (IPCC) Working Group 3. Climate Change 2007: Mitigation
Contribution of Working Group III to the Fourth Assessment Report of the Intergovernmental Panel on ClimateChange: Summary for Policymakers and Technical Summary; Cambridge University Press: Cambridge, UK, 2007.
10. Worrell, E.; Bernstein, L.; Roy, J.; Price, L.; Harnisch, J. Industrial energy efficiency and climate changemitigation. Energy Effic. 2009, 2, 109–123. [CrossRef]
11. Soepardi, A.; Pratikto, P.; Santosa, P.B.; Tama, I.P. An updated literature review of agile manufacturing:Classification and trends. Int. J. Ind. Syst. Eng. 2018, in press.
12. Schleich, J.; Gruber, E. Beyond case studies: Barriers to energy efficiency in commerce and the services sector.Energy Econ. 2008, 30, 449–464. [CrossRef]
13. Brunke, J.C.; Johansson, M.; Thollander, P. Empirical investigation of barriers and drivers to the adoption ofenergy conservation measures, energy management practices and energy services in the Swedish iron andsteel industry. J. Clean. Prod. 2014, 84, 509–525. [CrossRef]
14. Hirst, E.; Brown, M. Closing the efficiency gap: Barriers to the efficient use of energy. Resour. Conserv. Recycl.1990, 3, 267–281. [CrossRef]
15. Weber, L. Some reflections on barriers to the efficient use of energy. Energy Policy 1997, 25, 833–835. [CrossRef]16. Liu, Z.; Liu, J.; Wang, Y. Energy consumption in the iron and steel industry in PR China. Energy Sustain. Dev.
1996, 3, 18–24. [CrossRef]17. World Steel Association (WSA). Global Economics Outlook and Steel Demand Trends. Available online:
https://www.worldsteel.org/dms/internetDocumentList/downloads/media-centre/Alacero-speech-Oct-2012-FINAL/ (accessed on 12 January 2016).
18. Agency for The Assessment and Application of Technology (AAAT). Planning of Energy Efficiency andElasticity; AAAT: Banten, Indonesia, 2013.
19. Shi, H.; Peng, S.Z.; Liu, Y.; Zhong, P. Barriers to the implementation of cleaner production in Chinese SMEs:Government, industry and expert stakeholders’ perspectives. J. Clean. Prod. 2008, 16, 842–852. [CrossRef]
20. Rohdin, P.; Thollander, P. Barriers to and driving forces for energy efficiency in the non-energy intensivemanufacturing industry in Sweden. Energy 2006, 31, 1836–1844. [CrossRef]
21. Schleich, J. Barriers to energy efficiency: A comparison across the German commercial and services sector.Ecol. Econ. 2009, 68, 2150–2159. [CrossRef]
22. Brown, M.A. Market failures and barriers as a basis for clean energy policies. Energy Policy 2001, 29, 1197–1207.[CrossRef]
23. Worrell, E.; Angelini, T.; Masanet, E. Managing Your Energy; An Energy Star Guide for Identifying Energy Savingsin Manufacturing Plants; Lawrence Berkeley National Laboratory: Berkeley, CA, USA, 2010.
24. Chai, K.H.; Yeo, C. Overcoming energy efficiency barriers through systems approach—A conceptualframework. Energy Policy 2012, 46, 460–472. [CrossRef]
25. Cagno, E.; Worrell, E.; Trianni, A.; Pugliese, G. A novel approach for barriers to industrial energy efficiency.Renew. Sustain. Energy Rev. 2013, 19, 290–308. [CrossRef]
Energies 2018, 11, 234 20 of 22
26. Sorrell, S.; O’Malley, E.; Schleich, J.; Scott, S. The Economics of Energy Efficiency-Barriers to Cost EffectiveInvestment; Edward Elgar Publishing: Cheltenham, UK, 2004.
27. Yin, R.K. Case Study Research: Design and Methods, 3th ed.; SAGE Publication: Thousand Oaks, CA, USA, 2003.28. Chin, W.W.; Newsted, P.R. Structural equation modeling analysis with small samples using partial least
squares. In Statistical Strategies for Small Sample Research, 2nd ed.; Hoyle, R.H., Ed.; SAGE Publication:Thousand Oaks, CA, USA, 1999; pp. 307–341, ISBN 9780761908869.
29. Chong, A.Y.-L.; Chan, F.T.S. Structural equation modeling for multi-stage analysis on Radio FrequencyIdentification (RFID) diffusion in the health care industry. Expert Syst. Appl. 2012, 39, 8645–8654. [CrossRef]
30. Kim, K.-J.; Cho, H.-W.; Jeong, I.-J.; Park, J.-C.; Park, Y.-J.; Kim, C.-G.; Kim, T.-H. Service quality analysis andimprovement: Development of a systematic framework. Int. J. Ind. Eng. Theory Appl. Pract. 2006, 13, 177–187.
31. Anderson, J.C.; Gerbing, D.W. Structural equation modeling in practice: A review and recommendedtwo-step approach. Psychol. Bull. 1988, 103, 411. [CrossRef]
32. Hulland, J. Use of partial least squares (PLS) in strategic management research: A review of four recentstudies. Strat. Manag. J. 1999, 20, 195–204. [CrossRef]
33. Jaffe, A.B.; Stavins, R.N. The energy-efficiency gap. What does it mean? Energy Policy 1994, 22, 804–810. [CrossRef]34. Foddy, W. Constructing Questions for Interviews and Questionnaires: Theory and Practice in Social Research;
Cambridge University Press: Cambridge, UK, 1994.35. Olsthoorn, M.; Schleich, J.; Klobasa, M. Barriers to electricity load shift in companies: A survey-based
exploration of the end-user perspective. Energy Policy 2015, 76, 32–42. [CrossRef]36. Blumstein, C.; Krieg, B.; Schipper, L.; York, C. Overcoming social and institutional barriers to energy
conservation. Energy 1980, 5, 355–371. [CrossRef]37. Gruber, E.; Brand, M. Promoting energy conservation in small-and medium-sized companies. Energy Policy
1991, 19, 279–287. [CrossRef]38. Painuly, J.P.; Reddy, B.S. Electricity conservation programs: Barriers to their implementation. Energy Sources
1996, 18, 257–267. [CrossRef]39. Cooray, N. Cleaner Production Assessment in Small and Medium Industries of Sri Lanka. In Global
Competitiveness through Cleaner Production, Proceedings of the Second Asia Pacific Cleaner Production Roundtable,Roundtable, 21–23 April 1999; Brisbane Convention & Exhibition Centre: Brisbane, Australia, 1999.
40. Sorrell, S.; Schleich, J.; Scott, S.; O’Malley, E.; Trace, F.; Boede, E.; Ostertag, K.; Radgen, P. Reducing Barriers toEnergy Efficiency in Public and Private Organizations; Science and Technology Police Research (SPRU): Brighton,UK, 2000.
41. Harris, J.; Anderson, J.; Shafron, W. Investment in energy efficiency: A survey of Australian firms.Energy Policy 2000, 28, 867–876. [CrossRef]
42. De Groot, H.L.; Verhoef, E.T.; Nijkamp, P. Energy saving by firms: Decision-making, barriers and policies.Energy Econ. 2001, 23, 717–740. [CrossRef]
43. Intergovernmental Panel on Climate Change (IPPC). Barriers, Opportunities, and Market Potential of Technologiesand Practices (Chapter 5) in Climate Change 2001: Mitigation Contribution of Working Group III to the Third AssessmentReport of the Intergovernmental Panel on Climate Change; Cambridge University Press: Cambridge, UK, 2001.
44. Reddy, B.S. Barriers to the Diffusion of Renewable Energy Technologies—A Case Study of the State of Maharashtra,India; UNEP Collaborating Centre on Energy and Environment Riso National Laboratory: Roskilde, Denmark,2001; pp. 68–72, ISBN 87-550-3039-4.
45. De Almeida, A.T.; Fonseca, P.; Bertoldi, P. Energy-efficient motor systems in the industrial and in the services sectorsin the European Union: Characterisation, potentials, barriers and policies. Energy 2003, 28, 673–690. [CrossRef]
46. Thiruchelvam, M.; Kumar, S.; Visvanathan, C. Policy options to promote energy efficient and environmentallysound technologies in small-and medium-scale industries. Energy Policy 2003, 31, 977–987. [CrossRef]
47. Anderson, S.T.; Newell, R.G. Information programs for technology adoption: The case of energy-efficiencyaudits. Resour. Energy Econ. 2004, 26, 27–50. [CrossRef]
48. Reddy, B.S.; Assenza, G. Barriers and Drivers to Energy Efficiency; WP-2007-003; IGIDR Working Paper Series;Indira Gandhi Institute of Development Research: Mumbai, India, 2007.
49. Sardianou, E. Barriers to industrial energy efficiency investments in Greece. J. Clean. Prod. 2008, 16, 1416–1423.[CrossRef]
Energies 2018, 11, 234 21 of 22
50. Oikonomou, E.K.; Kilias, V.; Goumas, A.; Rigopoulos, A.; Karakatsani, E.; Damasiotis, M.; Papastefanakis, D.;Marini, N. Renewable energy sources (RES) projects and their barriers on a regional scale: The case study ofwind parks in the Dodecanese islands, Greece. Energy Policy 2009, 37, 4874–4883. [CrossRef]
51. Kostka, G.; Moslener, U.; Andreas, J.G. Barriers to Energy Efficiency Improvement: Empirical Evidence from Small-and Medium-Sized Enterprises in China; Working Paper Series, No. 178; Frankfurt School of Finance andManagement: Frankfurt, Germany, 2011.
52. Muthulingam, S.; Corbett, C.J.; Benartzi, S.; Oppenheim, B. Investment in Energy Efficiency by Small- and Medium-SizedFirms: An Empirical Analysis of the Adoption of Process Improvement Recommendations; Anderson Graduate School ofManagement–Decisions, Operations, and Technology Management; UCLA: Los Angeles, CA, USA, 2011.
53. Okazaki, T.; Yamaguchi, M. Accelerating the transfer and diffusion of energy saving technologies steel sectorexperience—Lessons learned. Energy Policy 2011, 39, 1296–1304. [CrossRef]
54. Cooremans, C. Investment in energy efficiency: Do the characteristics of investments matter? Energy Effic.2012, 5, 497–518. [CrossRef]
55. Fleiter, T.; Schleich, J.; Ravivanpong, P. Adoption of energy-efficiency measures in SMEs—An empiricalanalysis based on energy audit data from Germany. Energy Policy 2012, 51, 863–875. [CrossRef]
56. Trianni, A.; Cagno, E. Dealing with barriers to energy efficiency and SMEs: Some empirical evidences. Energy2012, 37, 494–504. [CrossRef]
57. Walsh, C.; Thornley, P. Barriers to improving energy efficiency within the process industries with a focus onlow grade heat utilisation. J. Clean. Prod. 2012, 23, 138–146. [CrossRef]
58. Karakaya, E.; Sriwannawit, P. Barriers to the adoption of photovoltaic systems: The state of the art.Renew. Sustain. Energy Rev. 2015, 49, 60–66. [CrossRef]
59. Meath, C.; Linnenluecke, M.; Griffiths, A. Barriers and motivators to the adoption of energy savings measuresfor small-and medium-sized enterprises (SMEs): The case of the Climate Smart Business Cluster program.J. Clean. Prod. 2016, 112, 3597–3604. [CrossRef]
60. Nagesha, N.; Balachandra, P. Barriers to energy efficiency in small industry clusters: Multi-criteria-basedprioritization using the analytic hierarchy process. Energy 2006, 31, 1969–1983. [CrossRef]
61. Wang, G.; Wang, Y.; Zhao, T. Analysis of interactions among the barriers to energy saving in China.Energy Policy 2008, 36, 1879–1889. [CrossRef]
62. Hasanbeigi, A.; Menke, C.; Du Pont, P. Barriers to energy efficiency improvement and decision-makingbehavior in Thai industry. Energy Effic. 2010, 3, 33–52. [CrossRef]
63. Siitonen, S.; Tuomaala, M.; Ahtila, P. Variables affecting energy efficiency and CO2 emissions in the steelindustry. Energy Policy 2010, 38, 2477–2485. [CrossRef]
64. Sarzynski, A.; Larrieu, J.; Shrimali, G. The impact of state financial incentives on market deployment of solartechnology. Energy Policy 2012, 46, 550–557. [CrossRef]
65. Flues, F.; Rübbelke, D.; Vögele, S. An analysis of the economic determinants of energy efficiency in theEuropean iron and steel industry. J. Clean. Prod. 2015, 104, 250–263. [CrossRef]
66. Henriques, I.; Sadorsky, P. The relationship between environmental commitment and managerial perceptionsof stakeholder importance. Acad. Manag. J. 1999, 42, 87–99. [CrossRef]
67. Luiten, E.; Van Lente, H.; Blok, K. Slow technologies and government intervention: Energy efficiency inindustrial process technologies. Technovation 2006, 26, 1029–1044. [CrossRef]
68. Dasgupta, S.; Roy, J. Understanding technological progress and input price as drivers of energy demand inmanufacturing industries in India. Energy Policy 2015, 83, 1–13. [CrossRef]
69. European Commisions (EC). Directive of The European Parliament and of The Council Amending 2012/27/EU onEnergy Efficiency; EC: Brussels, Belgium, 2012.
70. Melo, M.O.; da Silva, L.B.; Campello, S. Industry energy efficiency analysis in Northeast Brazil: Proposal ofmethodology and case studies. Int. J. Ind. Eng. 2012, 19, 428–443.
71. Akash, B.A.; Mohsen, M.S. Current situation of energy consumption in the Jordanian industry. EnergyConvers. Manag. 2003, 44, 1501–1510. [CrossRef]
72. Worrell, E.; Price, L. Policy scenarios for energy efficiency improvement in industry. Energy Policy 2001,29, 1223–1241. [CrossRef]
73. Caffal, C. Energy Management in Industry; Analysis Series; Centre for the Analysis and Dissemination ofDemonstrated Energy Technologies (CADDET): Sittard, The Netherlands, 1995.
Energies 2018, 11, 234 22 of 22
74. Sandberg, P.; Söderström, M. Industrial energy efficiency: The need for investment decision support from amanager perspective. Energy Policy 2003, 31, 1623–1634. [CrossRef]
75. Backlund, S.; Thollander, P.; Palm, J.; Ottosson, M. Extending the energy efficiency gap. Energy Policy 2012,51, 392–396. [CrossRef]
76. Ren, T. Barriers and drivers for process innovation in the petrochemical industry: A case study. J. Eng.Technol. Manag. 2009, 26, 285–304. [CrossRef]
77. Cagno, E.; Ramirez-Portilla, A.; Trianni, A. Linking energy efficiency and innovation practices: Empiricalevidence from the foundry sector. Energy Policy 2015, 83, 240–256. [CrossRef]
78. Rohdin, P.; Thollander, P.; Solding, P. Barriers to and drivers for energy efficiency in the Swedish foundryindustry. Energy Policy 2007, 35, 672–677. [CrossRef]
79. Thollander, P.; Ottosson, M. An energy efficient Swedish pulp and paper industry–exploring barriers to anddriving forces for cost-effective energy efficiency investments. Energy Effic. 2008, 1, 21–34. [CrossRef]
80. World Energy Council (WEC). Energy Efficiency Improvement Using High Technology, An Assessment of NergyUse in Industry and Buildings; World Energy Council (WEC): London, UK, 1995.
81. Worrell, E.; Neelis, M.; Price, L.; Galitsky, C.; Zhou, N. World Best Practice Energy Intensity Values for SelectedIndustrial Sectors; Lawrence Berkeley National Laboratory: Berkeley, CA, USA, 2008.
82. Price, L.; Sinton, J.; Worrell, E.; Phylipsen, D.; Xiulian, H.; Ji, L. Energy use and carbon dioxide emissionsfrom steel production in China. Energy 2002, 27, 429–446. [CrossRef]
83. Hair, J.F.; Black, W.C.; Babin, B.J.; Anderson, R.E.; Tatham, R.L. Multivariate Data Analysis, 6th ed.; PearsonEducation: Cranbury, NJ, USA, 2006.
84. Bagozzi, R.P.; Yi, Y. On the evaluation of structural equation models. J. Acad. Mark. Sci. 1988, 16, 74–94. [CrossRef]85. Hair, J.F.; Ringle, C.M.; Sarstedt, M. Editorial-partial least squares structural equation modeling: Rigorous
applications, better results and higher acceptance. Long Range Plan. 2013, 46, 1–12. [CrossRef]86. Birkinshaw, J.; Morrison, A.; Hulland, J. Structural and competitive determinants of a global integration
strategy. Strat. Manag. J. 1995, 16, 637–655. [CrossRef]87. Kock, N.; Lynn, G. Lateral collinearity and misleading results in variance-based SEM: An illustration and
recommendations. J. Assoc. Inf. Syst. 2012, 13, 546–580.88. Chin, W.W. The partial leat squares approach to structural equation modeling. In Modern Methods for Business
Research; Marcoulides, G.A., Ed.; Lawrence Erlbaum Associates: London, UK, 1998.89. Trianni, A.; Cagno, E.; Worrell, E. Innovation and adoption of energy efficient technologies: An exploratory
analysis of Italian primary metal manufacturing SMEs. Energy Policy 2013, 61, 430–440. [CrossRef]90. Indonesia Iron Steel Industry Association (IISIA). Role and Prospect of National Steel Industry; IISIA: Jakarta,
Indonesia, 2015.91. Apeaning, R.W.; Thollander, P. Barriers to and driving forces for industrial energy efficiency improvements in
African industries—A case study of Ghana’s largest industrial area. J. Clean. Prod. 2013, 53, 204–213. [CrossRef]92. McKane, A.; Williams, R.; Perry, W.; Li, T. Setting the Standard for Industrial Energy Efficiency; Lawrence
Berkeley National Laboratory: Berkeley, CA, USA, 2008.93. Thollander, P.; Palm, J. Improving Energy Efficiency in Industrial Energy Systems: An Interdisciplinary Perspective
on Barriers, Energy Audits, Energy Management, Policies, and Programs; Springer Science & Business Media:London, UK, 2012; pp. 85–104, ISBN 978-1-4471-4161-7.
94. Barclay, D.W.; Higgins, C.; Thompson, R. The partial least least squares approach to causal modeling:Personal computer adoption and use illustration. Technol. Stud. 1995, 2, 285–309.
95. Eisenhardt, K.M.; Graebner, M.E. Theory building from cases: opportunities and challenges. Acad. Manag. Rev.2007, 50, 25–32. [CrossRef]
96. Pratt, M.G. Fitting oval pegs into round holes: Tensions in evaluating and publishing qualitative research intop-tier North American Journals. Organ. Res. Meth. 2008, 11, 481–509. [CrossRef]
© 2018 by the authors. Licensee MDPI, Basel, Switzerland. This article is an open accessarticle distributed under the terms and conditions of the Creative Commons Attribution(CC BY) license (http://creativecommons.org/licenses/by/4.0/).