expression studies in peanut dumbala srinivas reddy...
TRANSCRIPT
Evaluation and Validation of Reference Genes forNormalization of Quantitative Real-Time PCR Based GeneExpression Studies in PeanutDumbala Srinivas Reddy☯, Pooja Bhatnagar-Mathur*☯, Katamreddy Sri Cindhuri, Kiran K. Sharma
International Crops Research Institute for the Semi-Arid Tropics (ICRISAT), Patancheru, Andhra Pradesh, India
Abstract
The quantitative real-time PCR (qPCR) based techniques have become essential for gene expression studies andhigh-throughput molecular characterization of transgenic events. Normalizing to reference gene in relativequantification make results from qPCR more reliable when compared to absolute quantification, but requires robustreference genes. Since, ideal reference gene should be species specific, no single internal control gene is universalfor use as a reference gene across various plant developmental stages and diverse growth conditions. Here, wepresent validation studies of multiple stably expressed reference genes in cultivated peanut with minimal variations intemporal and spatial expression when subjected to various biotic and abiotic stresses. Stability in the expression ofeight candidate reference genes including ADH3, ACT11, ATPsyn, CYP2, ELF1B, G6PD, LEC and UBC1 wascompared in diverse peanut plant samples. The samples were categorized into distinct experimental sets to checkthe suitability of candidate genes for accurate and reliable normalization of gene expression using qPCR. Stability inexpression of the references genes in eight sets of samples was determined by geNorm and NormFinder methods.While three candidate reference genes including ADH3, G6PD and ELF1B were identified to be stably expressedacross experiments, LEC was observed to be the least stable, and hence must be avoided for gene expressionstudies in peanut. Inclusion of the former two genes gave sufficiently reliable results; nonetheless, the addition of thethird reference gene ELF1B may be potentially better in a diverse set of tissue samples of peanut.
Citation: Reddy DS, Bhatnagar-Mathur P, Cindhuri KS, Sharma KK (2013) Evaluation and Validation of Reference Genes for Normalization of QuantitativeReal-Time PCR Based Gene Expression Studies in Peanut. PLoS ONE 8(10): e78555. doi:10.1371/journal.pone.0078555
Editor: Shyamal D Peddada, National Institute of Environmental and Health Sciences, United States of America
Received June 6, 2013; Accepted September 20, 2013; Published October 22, 2013
Copyright: © 2013 Reddy et al. This is an open-access article distributed under the terms of the Creative Commons Attribution License, which permitsunrestricted use, distribution, and reproduction in any medium, provided the original author and source are credited.
Funding: This work was undertaken as part of the CGIAR Research Program on Grain Legumes and partly supported by a grant from the Department ofBiotechnology, Government of India. The funders had no role in study design, data collection and analysis, decision to publish, or preparation of themanuscript.No additional external funding received for this study.
Competing interests: The authors have declared that no competing interests exist.
* E-mail: [email protected]
☯ These authors contributed equally to this work.
Introduction
Gene expression studies have become increasinglyimportant to understand the molecular mechanisms in animal,human, microorganism, and plant systems [1-4]. Geneexpression levels have been determined by techniquesincluding Northern blotting, RNase protection assay, semi-quantitative reverse-transcription PCR, and quantitative real-time PCR (qPCR) [4]. However, qPCR has gained importanceover the rest owing to its high sensitivity, accuracy, speed, andhigh-throughput analysis. The main advantages with the qPCRanalysis are ability to detect low-abundance mRNAs [5],quantify mRNA copy number [6], and need for relatively loweramount of test materials and no post-PCR gel analysis, etc.[7,8].
Nevertheless, a substantial technical variability associatedwith qPCR may exist due to inherent differences in samples,sample collection, quantity and quality of input RNA, reversetranscription and PCR efficiency, and pipetting errors [9]. Inorder to minimize these, the most common practice is tonormalize the gene of interest with the reference gene (aninternal control gene), which is also subjected to the similarerrors in cDNA preparation, thereby, making results from qPCRmore reliable than absolute quantification. The ideal referencegene should notably express stably across the developmentalstages and under variable experimental conditions. However,selection of an unstable reference gene can add largeunpredictable error to the analysis and result in incorrectevaluations [10]. Several studies have shown that no singleinternal control gene is universal for use as a reference genefor all experiments [11-13]. Different samples or treatments
PLOS ONE | www.plosone.org 1 October 2013 | Volume 8 | Issue 10 | e78555
may require the re-evaluation of a suitable reference gene,since changing experimental conditions can sometimes causea suitable reference gene to become unstable [14]. Hence, thereference genes that do not show variable expression levels indifferent cells and tissues under different conditions must bethe choice so as to reduce measurement errors.
Cellular homeostasis genes, more commonly known ashousekeeping genes that are involved in basic and ubiquitouscellular processes such as components of the cytoskeleton,glycolytic pathway, protein folding, protein degradation, andsynthesis of ribosome subunits are mostly used as referencegenes [9]. The most frequently used housekeeping genes thathave been validated as suitable reference genes in manyplants include β-actin (ACT), α-tubulin (TUA), ubiquitin (UBQ),glyceraldehde-3-phosphate dehydrogense (GAPDH), 18S or26S ribosomal RNA and elongation factors (EF) etc. [15-19].However, transcript levels of housekeeping genes too varyconsiderably across the developmental stages and undervariable conditions [20], thereby, necessitating the selection ofother multiple stably expressed reference genes to beconsidered for accurate normalization of gene expressionstudies [21]. Reference gene validation have been reported ina number of crop plants such as Oryza sativa L. [22], Triticumaestivum L. [23], Zea mays L. [24], Solanum tuberosum L. [15],Solanum lycopersicum L. [25], Chrysanthemum [19], Vitisvinifera L. [26], Brassica rapa L. [27], Brassica napus L. [28],Brassica juncea L. [9] Arabidopsis [12] Glycine max L.[16,29-33], and Cicer arietinum L. [17]. However, except forsoybean and chickpea, very few studies have been conductedto validate reference genes for qPCR in legume crops, thusnecessitating a need to validate experiment-specific referencegenes from legumes, including peanut where a major emphasisis on the development of transgenic peanuts for various bioticand abiotic constraints and nutritional enhancement.
Peanut (Arachis hypogaea L.) is the second-most importantgrain legume crop cultivated in over 100 tropical andsubtropical countries of the world [34] and is an importantoilseed cash crop containing 48–50% oil and 20–25% protein.The major abiotic factors affecting peanut production includedrought, high temperature, low soil fertility, low soil pH and ironchlorosis. Among the biotic factors, diseases caused by fungi,viruses, bacteria, nematodes, and foliar and soil insect pestssignificantly affect peanut productivity [35]. However, most ofthese agronomical traits are difficult to breed by conventionalselection techniques due to little genetic variation withincultivated peanut. Modern biotechnology approaches includingmarker-assisted selection, tissue culture, embryo rescue andgenetic transformation have been employed in cropimprovement programs worldwide including peanut [36]. Theuse of transgenic technology potentially offers a targeted gene-based approach for the genetic enhancement of field crops.Moreover, with the advent of genetic transformation technologyfor crop improvement, molecular characterization of transgenicevents need to be carried out at various stages fromidentification of the transgenic event to transgene integration,copy number detection and gene expression.
High-throughput molecular characterization of transgenicevents is now possible with the introduction of qPCR based
techniques. While, the qPCR based gene expression studiesrequires reference gene identification, only a limited number ofreference gene validation studies have been carried out inpeanut [37-39]. Hence, in recognition of the importance ofreference genes for the normalization of qPCR data and aneed to identify species-specific and experimental conditions-specific reference genes, the present study was conducted tovalidate suitable reference genes with minimal variations intemporal and spatial expression in cultivated peanut subjectedto various biotic (fungal and viral) and abiotic (salt and drought)stresses. Here, we have selected eight candidate referencegenes including alcohol dehydrogenase (ADH3), actin(ACT11), ATP synthase (ATPsyn), cyclophilin (CYP2),elongation factor 1B (ELF1B), glucose-6-phospahate 1-dehydrogenase (G6PD), lectin (LEC) and ubiquitin-conjugatingenzyme (UBC1) through bibliographic reviews of studies incrop plants such as peanut, soybean and cotton followed by anin silico analysis. We have compared the expression stability ofthese candidate reference genes in diverse samples of peanutcategorized into distinct experimental sets to check theirsuitability as stable reference genes for accurate and reliablenormalization of gene expression using qPCR.
Materials and Methods
Plant MaterialPeanut (Arachis hypogaea L.) varieties including JL24,
TAG24, CS39, ICGV 86699, ICGV 06040, ICGV 91114, ICGV00350 and ICGV 05155 were obtained from the GroundnutBreeding Unit of ICRISAT. Peanut plants were grown in 6 inchpots containing 3.5 kg of alfisol:sand:compost mixture (3:2:1;20 % water holding capacity) under greenhouse conditions with28/20 °C day/night temperature. Leaf samples were collected 3days after shoot emergence (DAE) from all peanut varietiesgrown in the greenhouse. Different tissue samples fromvarieties JL24 and ICGV 86699 including leaf sample of earlystage (LES), cotyledons, stems and roots were collected 3days after shoot emergence (DAE), whereas leaf sample offlowering stage (LFS), immature pods and immature seedswere collected from plants at the pegging stage. The collectedtissue samples were immediately frozen in liquid nitrogen andstored in -80 °C until RNA extraction.
Biotic and abiotic stress treatmentsFor stress treatments, 7 day-old seedlings of cultivars JL24
and ICGV 86699 were used for virus challenging experimentsusing the Tobacco streak virus (TSV) and Peanut bud necrosisvirus (PBNV), while Late Leaf Spot (LLS) caused byPhaeoisariopsis personata, rust caused by Puccinia arachidisand abiotic stress treatments (salinity and drought) wereimposed at early flowering stage. For TSV and PBNV infection,the virus inoculum was prepared from the infected plant leafsamples, (TSV from French bean (Phaseolus vulgaris) andPBNV from peanut) and infected to peanut plants bymechanical sap transmission method as described by Kumarand Waliyar [40]. Viral infection symptoms (necrotic lesions)were observed after 3-4 days of inoculation (DOI) on theinoculated mature leaves, and infection was confirmed by
Reference Genes for Peanut Gene Expression Studies
PLOS ONE | www.plosone.org 2 October 2013 | Volume 8 | Issue 10 | e78555
DAC-ELISA as described by Kumar and Waliyar [40]. Youngleaf samples were collected in triplicates from the infectedpeanut plants after 5 DOI.
Spores of LLS and rust were used for fungal infections.Spore collection, inoculum preparation, and inoculationmethods for LLS and rust were conducted as described bySubrahmanyam et al. [41]. The spore suspension (30000spores /mL) was sprayed onto peanut plants at early floweringstage, maintained under controlled conditions at 23 °C with 95% relative humidity and 12 h photoperiod. Symptoms wereevaluated 10 DOI, and leaf samples from control andinoculated peanut plants showing symptoms were collectedseparately.
Drought and salinity stress was imposed on peanut plantsunder greenhouse conditions. Plants were given regularirrigation before abiotic stress treatments and irrigated controlplants were maintained as such. For drought stress, the watersupply was withheld for 5 d followed by leaf sample collection,while the salinity stress was imposed by completely saturatingthe pots containing plants with 40 mM NaCl, followed by leafsampling after 24 h.
RNA isolationTotal RNA was extracted from peanut plants using 50 mg of
tissue using NucleoSpin RNA plant kit (Macherey-Nagel,Duren, Germany) following the recommended proceduresincluding in-column DNAse1 treatment. The isolated total RNAwas tested for DNA contamination in PCR using ELF1B andADH3 primer pairs. The DNA contaminated samples wereretreated with DNAseI (Macherey-Nagel, Duren, Germany) intubes and re-purified using NucleoSpin RNA clean-up kit(Macherey-Nagel, Duren, Germany). The concentration andpurity of RNA was determined using NanoVue plusspectrophotometer (GE health care, USA) and the absorbanceat 260/280 nm ranging from 1.8 to 2.0 were selected for furtheranalysis. Integrity of the RNA was further checked byelectrophoresis through 1.4 % agarose gel. The total RNAisolated was diluted to 100 ng/µl concentration and aliquotedfor use in PCR.
Selection of reference genes and primer designThe candidate reference genes were selected through
bibliographic reviews of studies in crop plants such as peanut(LEC [42]; ADH3 [37]), soybean (ATPsyn [43]; ACT11, ELF1B,CYP2 and G6PD [29]), and cotton (UBC1) [44]) followed by anin silico analysis using the BLAST tools of the NCBI database[45]. For instance, a previously selected EST in soybean wassubmitted to the BLASTN tool to obtain EST orthologous inpeanut (Table 1). Subsequently, NCBI non-redundant proteinsequence database (nr) was used to confirm the sequencefunction using BLASTX tool (http://blast.ncbi.nlm.nih.gov/Blast).Since the genome sequence of peanut is not known,alignments were made with relevant gene orthologous inArabidopsis using BLASTN with optimization to ‘somewhatsimilar sequences’ before primer design to ensure the primerpairs span at least one intron. Primers were designed usingprimer analysis software PRIMER 3.0 (http://frodo.wi.mit.edu/primer3/) by considering the following parameters: (a) product
size range: 100-160 bp; (b) primer size: 20-22 bp; (3) GCcontent 50 %. The EST GenBank accession number, primersequence, amplicon length and primer locations are listed inTable 1.
PCR analysis for specificity and efficiency of primersIn order to test the specificity of the primers and suitable
reaction conditions, the primer sets were initially tested bystandard PCR reaction with Mastercycler Gradient (Eppendorf,Germany) with temperature gradient (56 °C to 66 °C) usingboth DNA and cDNA templates. Genomic DNA was isolatedfrom leaf samples of peanut variety JL24 using NucleoSpinplant II midi kit (Macherey-Nagel, Duren, Germany) followingthe manufacture’s protocol. The cDNA synthesis was carriedout using the Thermoscript® RT-PCR system (Invitrogen-lifetechnologies, USA) with total RNA samples according to themanufacturer’s instructions. Primer titrations were carried out tocheck the effect of primer concentrations in PCR. Templategradient PCR was carried out with different concentrations ofcDNA to check the efficiency of the primers by constructingstandard curves for each set of primers. All these qPCRs werecarried out in Realplex (Eppendorf, Germany), Real Time PCRsystem using 2X SensiMixTM SYBR No-ROX (Bioline, UK) kitand 400 nM of each primer was used in template gradientPCRs. The reaction conditions were set as 10 min at 95 °C(polymerase activation); 45 cycles of 15 s at 95 °C, 15 s at 62°C with fluorescent signal recording and 15 s at 72 °C. At theend, a final step of 15 s at 95 °C, 30 s at 58 °C andfluorescence measurement at each 0.5 °C variation from 58 °Cto 95 °C in 20 min was included to obtain the melting curve. Foreach sample, three technical replicates were performed and Cqvalues were taken for analysis after drift correction. All the PCRamplified products were verified by 2 % agarose gelelectrophoresis with SYBR safe DNA gel stain (Invitrogen-lifetechnologies, USA) prior to sequencing the amplified productsto check the PCR product specificity.
Real Time qPCR analysisOne step quantitative reverse transcriptase PCR (qRT-PCR)
reactions were carried out in Realplex PCR system (Eppendorf,Germany) using 100 ng of total RNA, 2X SensiFASTTM SYBRNo-ROX one-Step kit (Bioline, UK), and 400 nM of each primer.The reaction conditions were set as: 10 min at 45 °C (Reversetranscription), 2 min at 95 °C (polymerase activation), 40 cyclesof 10 s at 95 °C, and 20 s at 60 °C with fluorescent signalrecording for amplification. At the end, a final step of 15 s at 95°C, 30 s at 58 °C followed by fluorescence measurement ateach 0.5 °C variation from 58 °C to 95 °C in 20 min wasincluded to obtain the melting curve. Each sample was testedin three technical replicates.
Data analysisExpression levels of the eight candidate reference genes in
all the sample pools were determined by the number of cyclesneeded for the amplification-related fluorescence to reach aspecific threshold level of detection (quantification cycle Cq).The efficiency (E) of each primer pair was calculated based on
Reference Genes for Peanut Gene Expression Studies
PLOS ONE | www.plosone.org 3 October 2013 | Volume 8 | Issue 10 | e78555
slope of the line (E = 10-1/slope) considering an ideal value rangeof 0.95 to 1.0.
To carry out an in-depth data analysis, 31 diverse sampleswere categorized under eight experimental sets comprising ofcondition-specific samplings (Table 2). While the firstexperimental set included all 31 diverse peanut tissue samples,the second experimental set comprised of tissue samples ofvarieties JL24 and ICGV 86699 at vegetative stages[cotyledon, early young leaf (LES), stem and root], whereas thethird set included tissue samples at reproductive stages (leaf,pods and immature seeds). The fourth set included totalsamples of both vegetative and reproductive stages. Thepeanut leaf samples from virus (TSV and PBNV) infected anduninfected controls were included in fifth experimental set,while the LLS and rust infected/non-infected leaf samples atflowering stage were included in sixth experimental set as foliardiseases. The seventh set comprised of leaf samples from saltand drought stressed treatments (abiotic stress), whereas theeighth experimental set included leaf samples from eightdiverse peanut cultivars as described in the plant materialsection (Table 2).
Expression stability of the candidate reference genes wasevaluated using two different methods, including geNorm andNormFinder. Firstly, the expression stability of each referencegene and the best combination of normalizer genes for eachset of samples were obtained using a pair-wise method bygeNorm [20] which is based on the fact that expression ratio oftwo ideal control genes is identical in all samples and thevariation of the expression ratios of two real housekeepinggenes reflecting the fact that one (or both) are not constantlyexpressed, with increasing variation in the ratio correspondingto decreasing expression stability [37]. The raw Cq values wereconverted into relative quantities after correcting the Cq valuesaccording to respective PCR efficiencies for each gene usinggenEX Professional software (MultiD Analyses AB, Sweden) asthe requirement of geNorm analysis to calculate geneexpression stability (M). To define the optimal number of genesrequired for normalization, geNorm platform estimates anormalization factor (NFn) by geometric average of the n bestreference genes and performs a stepwise analysis (morestable to less stable genes) to calculate the pair-wise variation(Vn/Vn+1) between two sequential normalization factors, NFn
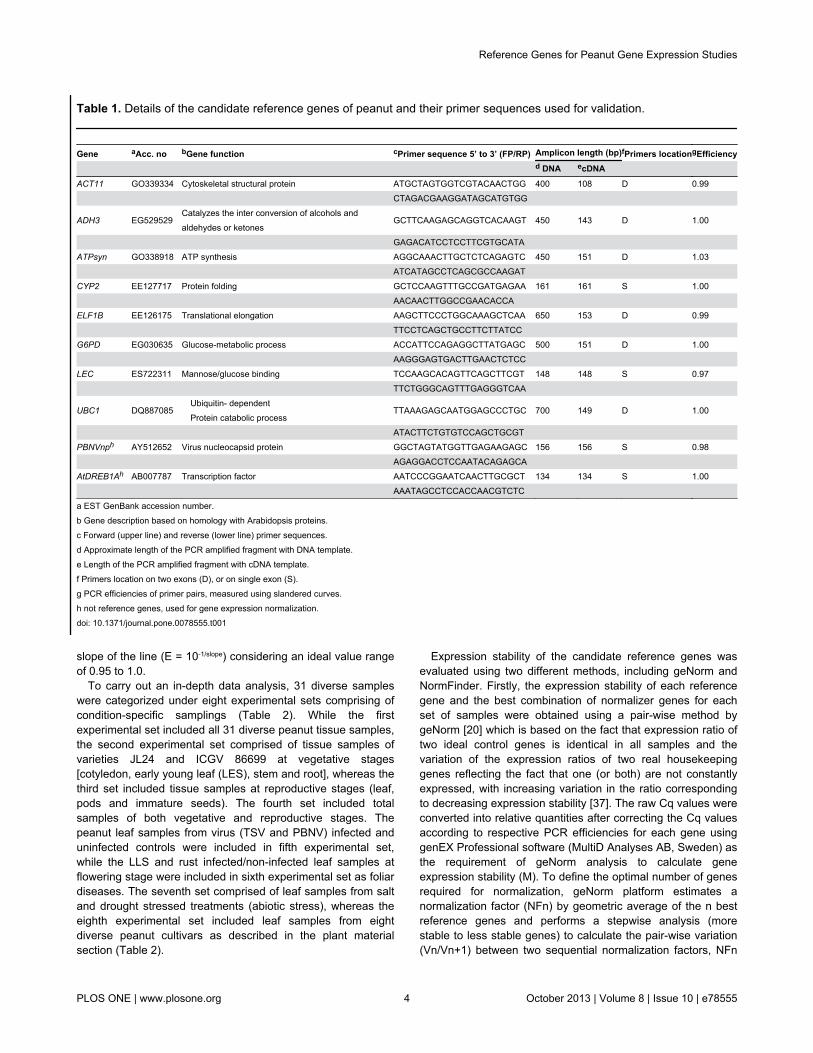
Table 1. Details of the candidate reference genes of peanut and their primer sequences used for validation.
Gene aAcc. no bGene function cPrimer sequence 5’ to 3’ (FP/RP) Amplicon length (bp)fPrimers locationgEfficiency d DNA ecDNA ACT11 GO339334 Cytoskeletal structural protein ATGCTAGTGGTCGTACAACTGG 400 108 D 0.99 CTAGACGAAGGATAGCATGTGG
ADH3 EG529529Catalyzes the inter conversion of alcohols andaldehydes or ketones
GCTTCAAGAGCAGGTCACAAGT 450 143 D 1.00
GAGACATCCTCCTTCGTGCATA ATPsyn GO338918 ATP synthesis AGGCAAACTTGCTCTCAGAGTC 450 151 D 1.03 ATCATAGCCTCAGCGCCAAGAT CYP2 EE127717 Protein folding GCTCCAAGTTTGCCGATGAGAA 161 161 S 1.00 AACAACTTGGCCGAACACCA ELF1B EE126175 Translational elongation AAGCTTCCCTGGCAAAGCTCAA 650 153 D 0.99 TTCCTCAGCTGCCTTCTTATCC G6PD EG030635 Glucose-metabolic process ACCATTCCAGAGGCTTATGAGC 500 151 D 1.00 AAGGGAGTGACTTGAACTCTCC LEC ES722311 Mannose/glucose binding TCCAAGCACAGTTCAGCTTCGT 148 148 S 0.97 TTCTGGGCAGTTTGAGGGTCAA
UBC1 DQ887085Ubiquitin- dependentProtein catabolic process
TTAAAGAGCAATGGAGCCCTGC 700 149 D 1.00
ATACTTCTGTGTCCAGCTGCGT PBNVnph AY512652 Virus nucleocapsid protein GGCTAGTATGGTTGAGAAGAGC 156 156 S 0.98 AGAGGACCTCCAATACAGAGCA AtDREB1Ah AB007787 Transcription factor AATCCCGGAATCAACTTGCGCT 134 134 S 1.00 AAATAGCCTCCACCAACGTCTC
a EST GenBank accession number.b Gene description based on homology with Arabidopsis proteins.c Forward (upper line) and reverse (lower line) primer sequences.d Approximate length of the PCR amplified fragment with DNA template.e Length of the PCR amplified fragment with cDNA template.f Primers location on two exons (D), or on single exon (S).g PCR efficiencies of primer pairs, measured using slandered curves.h not reference genes, used for gene expression normalization.doi: 10.1371/journal.pone.0078555.t001
Reference Genes for Peanut Gene Expression Studies
PLOS ONE | www.plosone.org 4 October 2013 | Volume 8 | Issue 10 | e78555
and NFn+1, including more genes in each comparison [46].The pair-wise variation, to define the optimal number of genesrequired for normalization was carried out using geNorm ofqBase plus software (Biogazelle, Belgium).
The expression stability of the eight candidate referencegenes was also determined by a model-based varianceestimation application called NormFinder [47] to rank thecandidate reference genes expression stability for all sampleswith no subgroup determination according to their stabilityunder given set of experimental conditions. The Cq values ofeach set of samples were converted to relative quantities afterefficiency correction for each gene and expression stabilities
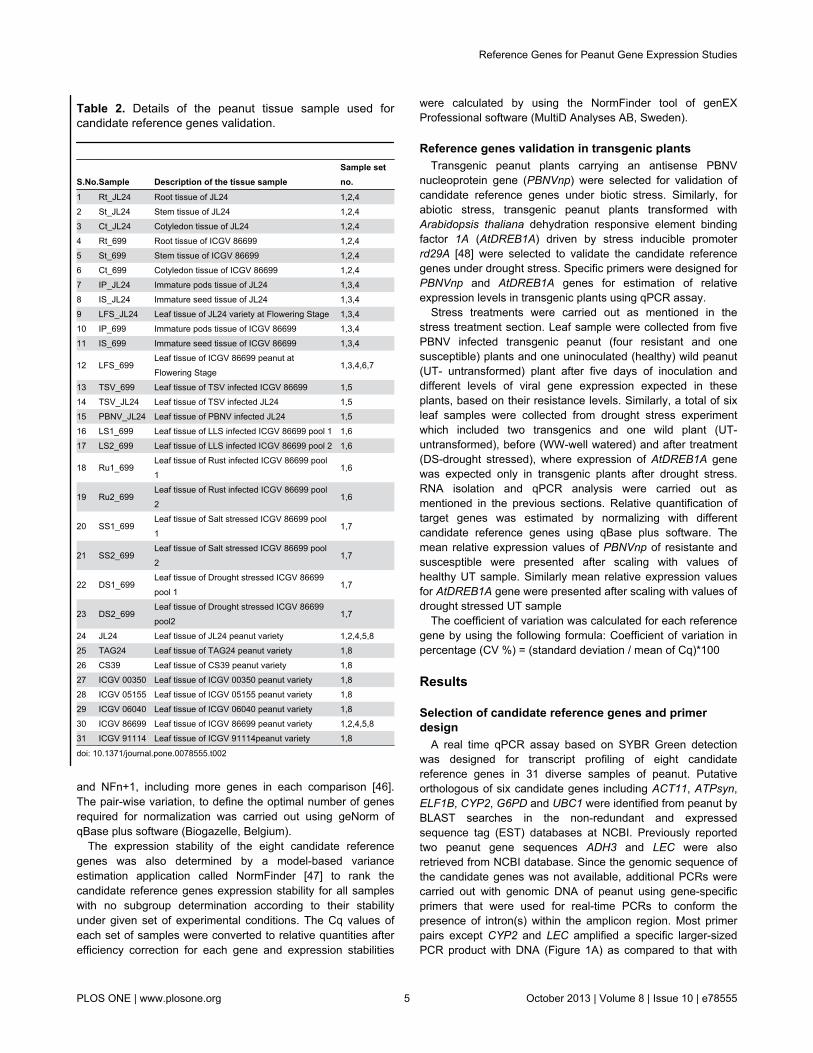
Table 2. Details of the peanut tissue sample used forcandidate reference genes validation.
S.No.Sample Description of the tissue sampleSample setno.
1 Rt_JL24 Root tissue of JL24 1,2,42 St_JL24 Stem tissue of JL24 1,2,43 Ct_JL24 Cotyledon tissue of JL24 1,2,44 Rt_699 Root tissue of ICGV 86699 1,2,45 St_699 Stem tissue of ICGV 86699 1,2,46 Ct_699 Cotyledon tissue of ICGV 86699 1,2,47 IP_JL24 Immature pods tissue of JL24 1,3,48 IS_JL24 Immature seed tissue of JL24 1,3,49 LFS_JL24 Leaf tissue of JL24 variety at Flowering Stage 1,3,410 IP_699 Immature pods tissue of ICGV 86699 1,3,411 IS_699 Immature seed tissue of ICGV 86699 1,3,4
12 LFS_699Leaf tissue of ICGV 86699 peanut atFlowering Stage
1,3,4,6,7
13 TSV_699 Leaf tissue of TSV infected ICGV 86699 1,514 TSV_JL24 Leaf tissue of TSV infected JL24 1,515 PBNV_JL24 Leaf tissue of PBNV infected JL24 1,516 LS1_699 Leaf tissue of LLS infected ICGV 86699 pool 1 1,617 LS2_699 Leaf tissue of LLS infected ICGV 86699 pool 2 1,6
18 Ru1_699Leaf tissue of Rust infected ICGV 86699 pool1
1,6
19 Ru2_699Leaf tissue of Rust infected ICGV 86699 pool2
1,6
20 SS1_699Leaf tissue of Salt stressed ICGV 86699 pool1
1,7
21 SS2_699Leaf tissue of Salt stressed ICGV 86699 pool2
1,7
22 DS1_699Leaf tissue of Drought stressed ICGV 86699pool 1
1,7
23 DS2_699Leaf tissue of Drought stressed ICGV 86699pool2
1,7
24 JL24 Leaf tissue of JL24 peanut variety 1,2,4,5,825 TAG24 Leaf tissue of TAG24 peanut variety 1,826 CS39 Leaf tissue of CS39 peanut variety 1,827 ICGV 00350 Leaf tissue of ICGV 00350 peanut variety 1,828 ICGV 05155 Leaf tissue of ICGV 05155 peanut variety 1,829 ICGV 06040 Leaf tissue of ICGV 06040 peanut variety 1,830 ICGV 86699 Leaf tissue of ICGV 86699 peanut variety 1,2,4,5,831 ICGV 91114 Leaf tissue of ICGV 91114peanut variety 1,8
doi: 10.1371/journal.pone.0078555.t002
were calculated by using the NormFinder tool of genEXProfessional software (MultiD Analyses AB, Sweden).
Reference genes validation in transgenic plantsTransgenic peanut plants carrying an antisense PBNV
nucleoprotein gene (PBNVnp) were selected for validation ofcandidate reference genes under biotic stress. Similarly, forabiotic stress, transgenic peanut plants transformed withArabidopsis thaliana dehydration responsive element bindingfactor 1A (AtDREB1A) driven by stress inducible promoterrd29A [48] were selected to validate the candidate referencegenes under drought stress. Specific primers were designed forPBNVnp and AtDREB1A genes for estimation of relativeexpression levels in transgenic plants using qPCR assay.
Stress treatments were carried out as mentioned in thestress treatment section. Leaf sample were collected from fivePBNV infected transgenic peanut (four resistant and onesusceptible) plants and one uninoculated (healthy) wild peanut(UT- untransformed) plant after five days of inoculation anddifferent levels of viral gene expression expected in theseplants, based on their resistance levels. Similarly, a total of sixleaf samples were collected from drought stress experimentwhich included two transgenics and one wild plant (UT-untransformed), before (WW-well watered) and after treatment(DS-drought stressed), where expression of AtDREB1A genewas expected only in transgenic plants after drought stress.RNA isolation and qPCR analysis were carried out asmentioned in the previous sections. Relative quantification oftarget genes was estimated by normalizing with differentcandidate reference genes using qBase plus software. Themean relative expression values of PBNVnp of resistante andsuscesptible were presented after scaling with values ofhealthy UT sample. Similarly mean relative expression valuesfor AtDREB1A gene were presented after scaling with values ofdrought stressed UT sample
The coefficient of variation was calculated for each referencegene by using the following formula: Coefficient of variation inpercentage (CV %) = (standard deviation / mean of Cq)*100
Results
Selection of candidate reference genes and primerdesign
A real time qPCR assay based on SYBR Green detectionwas designed for transcript profiling of eight candidatereference genes in 31 diverse samples of peanut. Putativeorthologous of six candidate genes including ACT11, ATPsyn,ELF1B, CYP2, G6PD and UBC1 were identified from peanut byBLAST searches in the non-redundant and expressedsequence tag (EST) databases at NCBI. Previously reportedtwo peanut gene sequences ADH3 and LEC were alsoretrieved from NCBI database. Since the genomic sequence ofthe candidate genes was not available, additional PCRs werecarried out with genomic DNA of peanut using gene-specificprimers that were used for real-time PCRs to conform thepresence of intron(s) within the amplicon region. Most primerpairs except CYP2 and LEC amplified a specific larger-sizedPCR product with DNA (Figure 1A) as compared to that with
Reference Genes for Peanut Gene Expression Studies
PLOS ONE | www.plosone.org 5 October 2013 | Volume 8 | Issue 10 | e78555
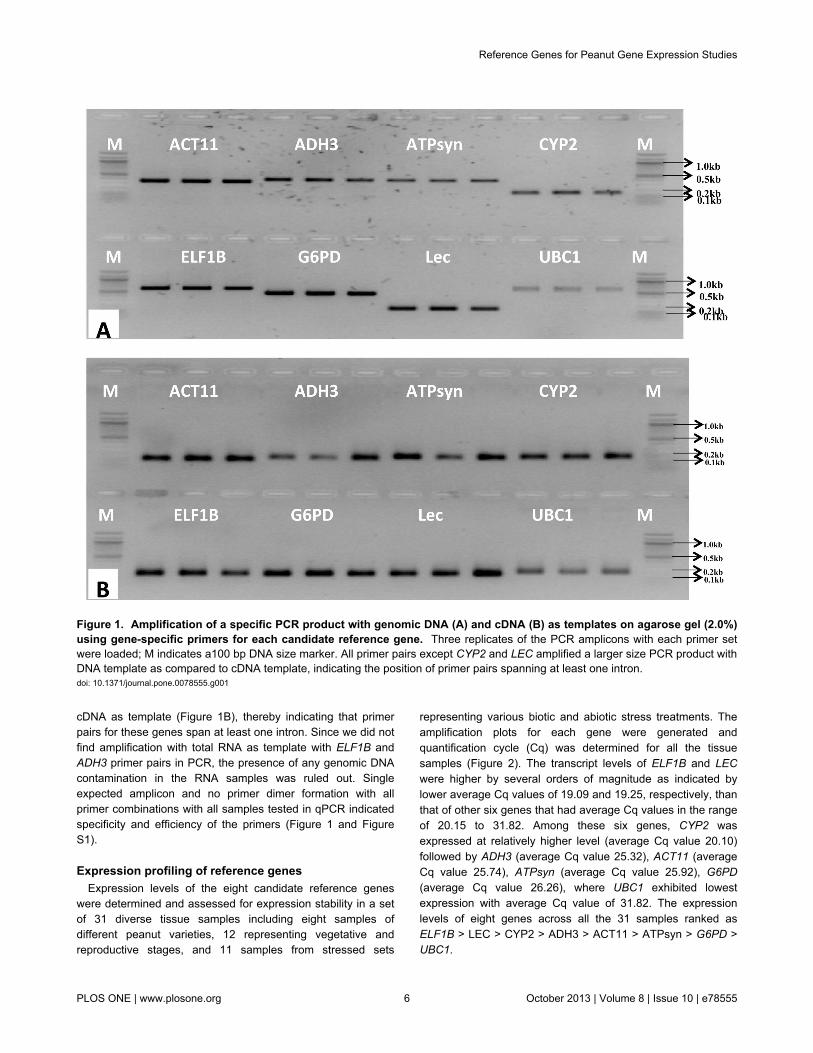
cDNA as template (Figure 1B), thereby indicating that primerpairs for these genes span at least one intron. Since we did notfind amplification with total RNA as template with ELF1B andADH3 primer pairs in PCR, the presence of any genomic DNAcontamination in the RNA samples was ruled out. Singleexpected amplicon and no primer dimer formation with allprimer combinations with all samples tested in qPCR indicatedspecificity and efficiency of the primers (Figure 1 and FigureS1).
Expression profiling of reference genesExpression levels of the eight candidate reference genes
were determined and assessed for expression stability in a setof 31 diverse tissue samples including eight samples ofdifferent peanut varieties, 12 representing vegetative andreproductive stages, and 11 samples from stressed sets
representing various biotic and abiotic stress treatments. Theamplification plots for each gene were generated andquantification cycle (Cq) was determined for all the tissuesamples (Figure 2). The transcript levels of ELF1B and LECwere higher by several orders of magnitude as indicated bylower average Cq values of 19.09 and 19.25, respectively, thanthat of other six genes that had average Cq values in the rangeof 20.15 to 31.82. Among these six genes, CYP2 wasexpressed at relatively higher level (average Cq value 20.10)followed by ADH3 (average Cq value 25.32), ACT11 (averageCq value 25.74), ATPsyn (average Cq value 25.92), G6PD(average Cq value 26.26), where UBC1 exhibited lowestexpression with average Cq value of 31.82. The expressionlevels of eight genes across all the 31 samples ranked asELF1B > LEC > CYP2 > ADH3 > ACT11 > ATPsyn > G6PD >UBC1.
Figure 1. Amplification of a specific PCR product with genomic DNA (A) and cDNA (B) as templates on agarose gel (2.0%)using gene-specific primers for each candidate reference gene. Three replicates of the PCR amplicons with each primer setwere loaded; M indicates a100 bp DNA size marker. All primer pairs except CYP2 and LEC amplified a larger size PCR product withDNA template as compared to cDNA template, indicating the position of primer pairs spanning at least one intron.doi: 10.1371/journal.pone.0078555.g001
Reference Genes for Peanut Gene Expression Studies
PLOS ONE | www.plosone.org 6 October 2013 | Volume 8 | Issue 10 | e78555
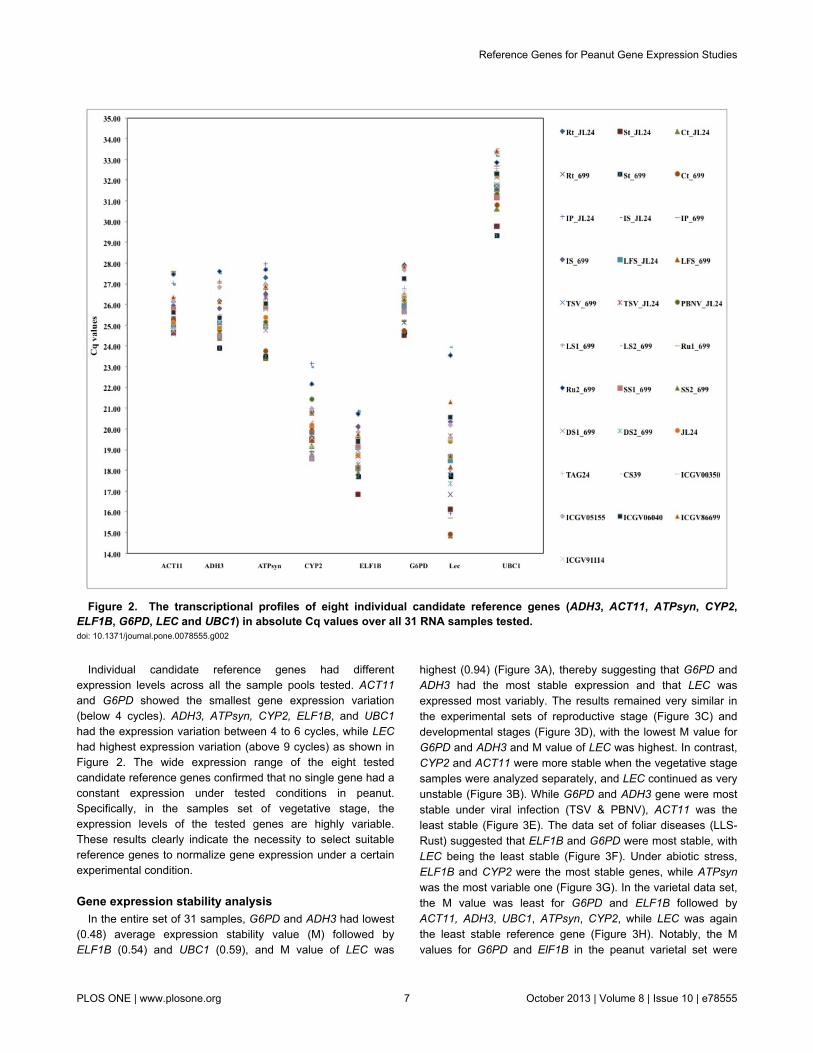
Individual candidate reference genes had differentexpression levels across all the sample pools tested. ACT11and G6PD showed the smallest gene expression variation(below 4 cycles). ADH3, ATPsyn, CYP2, ELF1B, and UBC1had the expression variation between 4 to 6 cycles, while LEChad highest expression variation (above 9 cycles) as shown inFigure 2. The wide expression range of the eight testedcandidate reference genes confirmed that no single gene had aconstant expression under tested conditions in peanut.Specifically, in the samples set of vegetative stage, theexpression levels of the tested genes are highly variable.These results clearly indicate the necessity to select suitablereference genes to normalize gene expression under a certainexperimental condition.
Gene expression stability analysisIn the entire set of 31 samples, G6PD and ADH3 had lowest
(0.48) average expression stability value (M) followed byELF1B (0.54) and UBC1 (0.59), and M value of LEC was
highest (0.94) (Figure 3A), thereby suggesting that G6PD andADH3 had the most stable expression and that LEC wasexpressed most variably. The results remained very similar inthe experimental sets of reproductive stage (Figure 3C) anddevelopmental stages (Figure 3D), with the lowest M value forG6PD and ADH3 and M value of LEC was highest. In contrast,CYP2 and ACT11 were more stable when the vegetative stagesamples were analyzed separately, and LEC continued as veryunstable (Figure 3B). While G6PD and ADH3 gene were moststable under viral infection (TSV & PBNV), ACT11 was theleast stable (Figure 3E). The data set of foliar diseases (LLS-Rust) suggested that ELF1B and G6PD were most stable, withLEC being the least stable (Figure 3F). Under abiotic stress,ELF1B and CYP2 were the most stable genes, while ATPsynwas the most variable one (Figure 3G). In the varietal data set,the M value was least for G6PD and ELF1B followed byACT11, ADH3, UBC1, ATPsyn, CYP2, while LEC was againthe least stable reference gene (Figure 3H). Notably, the Mvalues for G6PD and ElF1B in the peanut varietal set were
Figure 2. The transcriptional profiles of eight individual candidate reference genes (ADH3, ACT11, ATPsyn, CYP2,ELF1B, G6PD, LEC and UBC1) in absolute Cq values over all 31 RNA samples tested. doi: 10.1371/journal.pone.0078555.g002
Reference Genes for Peanut Gene Expression Studies
PLOS ONE | www.plosone.org 7 October 2013 | Volume 8 | Issue 10 | e78555
lower (0.16) than those of all other experimental sets, therebyindicating their high expression stability (Figure 3A-H).
The expression stability rankings of candidate referencegene using NormFinder revealed similar results as of geNormanalysis, where the G6PD was most stable and LEC was leaststable genes in the entire sample set, including thereproductive, developmental, and abiotic stress stage sets(Table 3). The stability ranks of the candidate reference geneschanged with method (geNorm or NormFinder) used foranalysis in the experimental sets of vegetative stage, viraldiseases, foliar diseases and in different cultivars sample set.The NormFinder analysis indicated LEC gene to be the leaststable in all experimental sets except viral diseases, abioticstress and peanut cultivars. The NormFinder analysis alsoindicated ATPsyn to be the least stable in experimental set ofabiotic stress and peanut cultivars, while ACT11 to be the oneleast stable under viral disease set (Table 3).
Optimal number of internal candidate genes fornormalization
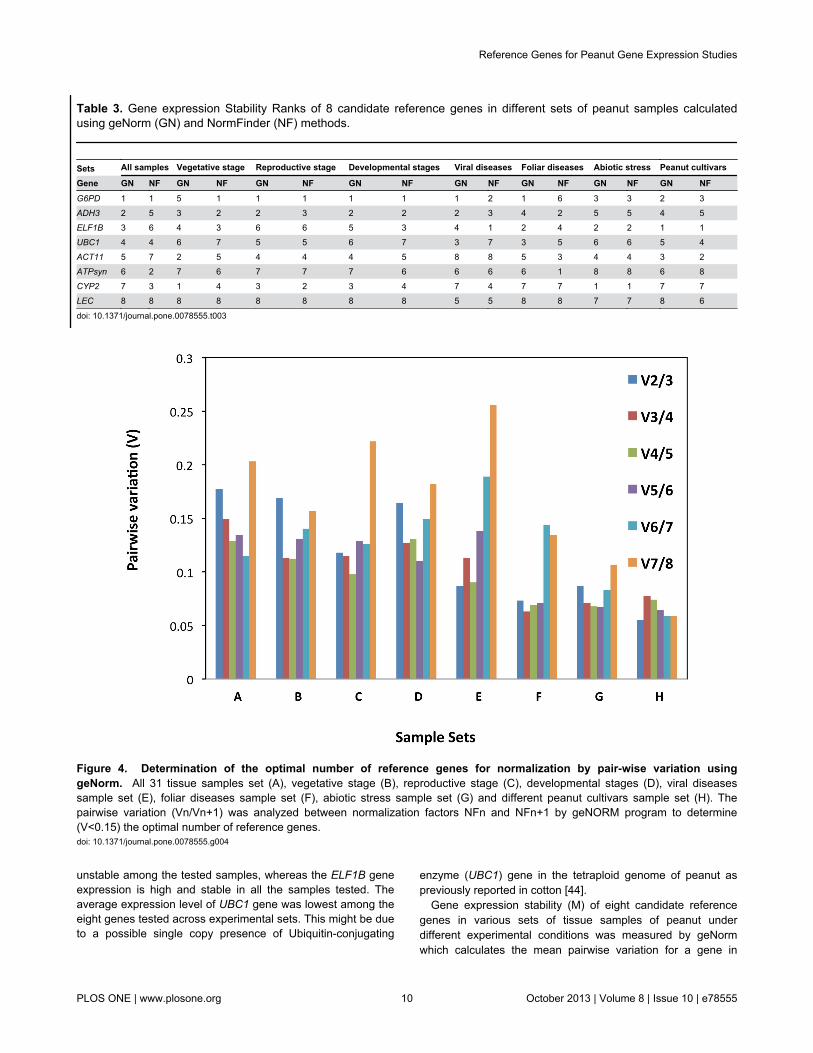
We used geNorm to determine the pairwise variation in eightexperimental sets of the samples. When all 31 samples weretaken together, the pairwise variation V2/3 was higher than0.15 (0.176) whereas V3/4 was 0.149 (Figure 4), indicating thatADH3 and G6PD genes together are not sufficient fornormalization, and hence need a third gene ELF1B. Similarlythe vegetative stage and developmental stages sets toorequired three genes for normalization viz., CYP2, ACT11 andADH3 for vegetative stage, ADH3, G6PD and CYP2 fordevelopmental stages, as indicated by their pairwise variationvalue V2/3 were higher than 0.15 and V3/4 were less than0.150 (Figure 4).
In the other five experimental sets, addition of the thirdreference gene for normalization of gene expression showedno significant effect as indicated in pairwise variation (Figure4). However, different experimental sets required a differentpair of genes for normalization of gene expression, as indicatedby pairwise variation analysis of G6PD and ADH3 genes forsets of reproductive stage and viral diseases, ELF1B andG6PD genes for foliar diseases (LLS and Rust), and thevarietal set, whereas CYP2 and ELF1B genes for abiotic stress(drought and salinity) were sufficient for normalization of geneexpression in peanut. When evaluating all the pairwisevariations, the least stable reference gene was found to beLEC followed by ATPsyn (Figure 4).
Reference genes validationTransgenic peanut samples from biotic and abiotic stress
treatments were used for validation of candidate referencegenes. PBNV infected transgenic peanut plants carryingantisense nucleoprotein gene of PBNV (PBNVnp) were usedfor validation under biotic stress. The relative expression levelsof the target PBNVnp gene were presented after scaling withuninoculated UT control in each normalization analysis. Therelative expression levels of PBNVnp gene in infected peanutsamples were similar when normalized with candidatereference genes G6PD or ADH3 individually and incombination, while normalization with CYP2 or ACT11 genes
showed a different pattern and a very high relative expressionof PBNVnp gene in both the infected samples includingresistant and susceptible (Figure 5A). The results were inaccordance with the obtained phenotypic data (data notincluded), when normalized with G6PD and ADH3 referencegenes, whereas normalization with CYP2 or ACT11 did notcorrelate with the phenotypic data.
Similarly, the AtDREB1A gene expression levels intransgenic peanut under drought stress were estimated bynormalizing with the candidate reference genes. Theexpression levels of the target gene AtDREB1A werepresented after scaling with drought stressed UT sample ineach normalization analysis. The AtDREB1A gene expressionlevels increased several fold when normalized with ATPsynand LEC individually or in combination, compared with thevalues obtained after normalization with CYP2 and ELF1Bgenes (Figure 5B).
The percentage of coefficient of variation (CV %) calculatedfor each reference gene in PBNVnp gene expression validationstudies indicated high CV with CYP2 (13.8 %) and ACT11(17.2 %) genes, while G6PD (3.7 %) and ADH3 (5.4 %)showed a lower CV. Similarly, the CV was lower for CYP2 (2.7%) and ELF1B (4.7 %) reference genes and higher for ATPsyn(11.7 %) and LEC (14.0 %) genes under AtDREB1A geneexpression studies. This data is in accordance with stabilityrankings of the candidate reference gene under biotic andabiotic stress conditions.
Discussion
Real-time PCR (qPCR) is a very powerful technique toquantify the expression levels of target genes and stablyexpressing reference genes required for data normalization tominimize the experimental errors in relative quantification.Nevertheless, no genes are stably expressed universally in anyorganism, and are regulated to only a certain extent [49].Several studies on reference gene validation have insisted thatmultiple internal genes must be evaluated in order to improvethe accuracy of a qPCR analysis and interpretation of geneexpression [20,50,51]. The present study describes acomprehensive analysis on the validation of eight candidatereference genes in 31 diverse samples of peanut, dividedbroadly into eight experimental sets. Our analysis based ongeNorm and NormFinder algorithms indicate that the choice ofreference genes for normalization should be experimentalcondition-specific. In the present study, we tested theexpression stability of commonly used housekeeping geneslike ACT11, ELF1B, CYP2, and ADH3 that have beenpreviously described as the most stable genes in various plantstudies. Some of these housekeeping genes like ADH3 [37]and ACT [38] that qualify among the best reference genesunder specific experimental sets of peanut were not found tobe suitable reference gene across all the eight experimentalsets.
The average expression levels of ELF1B and LEC geneswere higher by several orders of magnitude than that of othersix genes. The expression levels of LEC gene were very highin immature seeds and pods compared to other samples and
Reference Genes for Peanut Gene Expression Studies
PLOS ONE | www.plosone.org 8 October 2013 | Volume 8 | Issue 10 | e78555
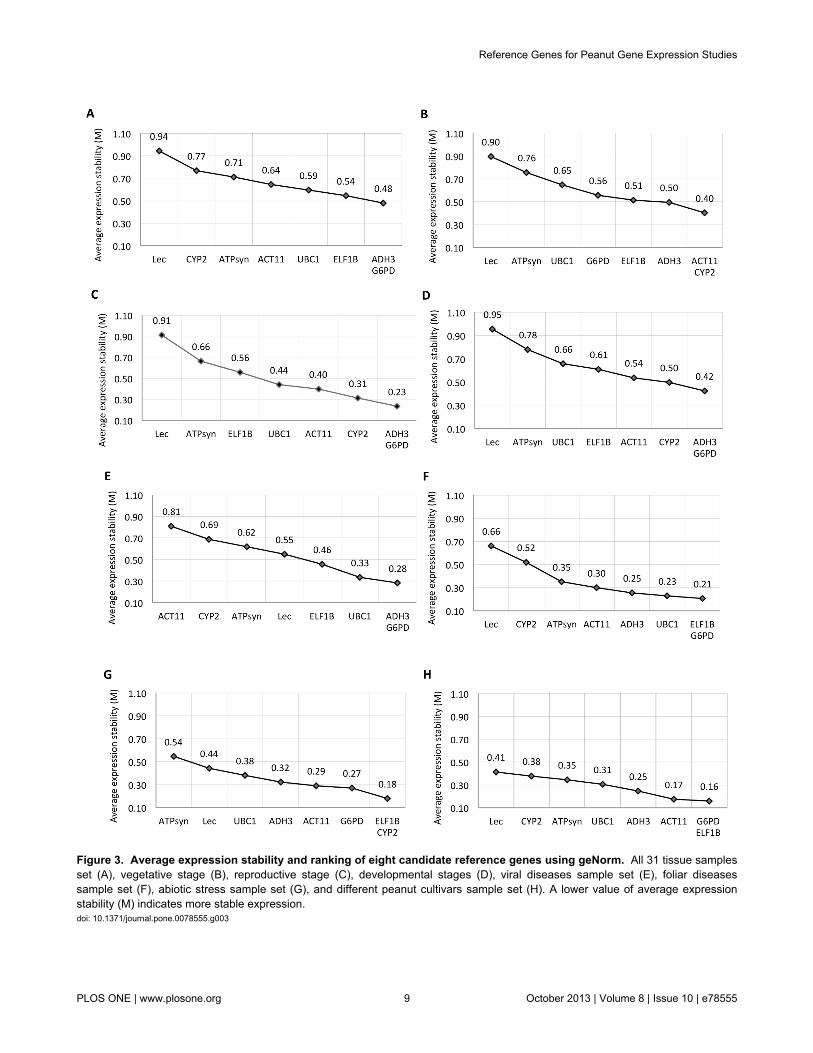
Figure 3. Average expression stability and ranking of eight candidate reference genes using geNorm. All 31 tissue samplesset (A), vegetative stage (B), reproductive stage (C), developmental stages (D), viral diseases sample set (E), foliar diseasessample set (F), abiotic stress sample set (G), and different peanut cultivars sample set (H). A lower value of average expressionstability (M) indicates more stable expression.doi: 10.1371/journal.pone.0078555.g003
Reference Genes for Peanut Gene Expression Studies
PLOS ONE | www.plosone.org 9 October 2013 | Volume 8 | Issue 10 | e78555
unstable among the tested samples, whereas the ELF1B geneexpression is high and stable in all the samples tested. Theaverage expression level of UBC1 gene was lowest among theeight genes tested across experimental sets. This might be dueto a possible single copy presence of Ubiquitin-conjugating
enzyme (UBC1) gene in the tetraploid genome of peanut aspreviously reported in cotton [44].
Gene expression stability (M) of eight candidate referencegenes in various sets of tissue samples of peanut underdifferent experimental conditions was measured by geNormwhich calculates the mean pairwise variation for a gene in
Table 3. Gene expression Stability Ranks of 8 candidate reference genes in different sets of peanut samples calculatedusing geNorm (GN) and NormFinder (NF) methods.
Sets All samples Vegetative stage Reproductive stage Developmental stages Viral diseases Foliar diseases Abiotic stress Peanut cultivars
Gene GN NF GN NF GN NF GN NF GN NF GN NF GN NF GN NFG6PD 1 1 5 1 1 1 1 1 1 2 1 6 3 3 2 3ADH3 2 5 3 2 2 3 2 2 2 3 4 2 5 5 4 5ELF1B 3 6 4 3 6 6 5 3 4 1 2 4 2 2 1 1UBC1 4 4 6 7 5 5 6 7 3 7 3 5 6 6 5 4ACT11 5 7 2 5 4 4 4 5 8 8 5 3 4 4 3 2ATPsyn 6 2 7 6 7 7 7 6 6 6 6 1 8 8 6 8CYP2 7 3 1 4 3 2 3 4 7 4 7 7 1 1 7 7LEC 8 8 8 8 8 8 8 8 5 5 8 8 7 7 8 6
doi: 10.1371/journal.pone.0078555.t003
Figure 4. Determination of the optimal number of reference genes for normalization by pair-wise variation usinggeNorm. All 31 tissue samples set (A), vegetative stage (B), reproductive stage (C), developmental stages (D), viral diseasessample set (E), foliar diseases sample set (F), abiotic stress sample set (G) and different peanut cultivars sample set (H). Thepairwise variation (Vn/Vn+1) was analyzed between normalization factors NFn and NFn+1 by geNORM program to determine(V<0.15) the optimal number of reference genes.doi: 10.1371/journal.pone.0078555.g004
Reference Genes for Peanut Gene Expression Studies
PLOS ONE | www.plosone.org 10 October 2013 | Volume 8 | Issue 10 | e78555

comparison to all other genes being tested and reports theaverage expression stability (M) of all the genes in a given setof samples [20]. Genes with the lowest M value have the moststable expression, while the highest M value indicates the leaststable expression. In the present study, the candidatereference genes displayed high expression stability in all eightexperimental data sets indicated by low (<1.0) M values. TheG6PD (glucose-6-phosphate 1-dehydrogenase) gene was moststable among the eight genes tested across the sixexperimental sets, except during the vegetative stage andabiotic stress sets. This is in contrast to the previous report insoybean where G6PD gene expression was least stable underdifferent photoperiodic treatments and developmental stages[29] and under cadmium stress [33]. The G6PD gene has been
involved in the glycolytic pathway similar to GAPDH(glyceraldehyde-3-phosphate dehydrogenase) that has beenthe most commonly reported reference gene [17,38]. UnlikeG6PD, GAPDH was recently reported as stably expressingreference gene in two legumes including chickpea [17] andpeanut [38]. These results indicate that stability of geneexpression is purely based on experimental condition and notonly on the species tested.
The second most stably expressing gene in this study wasADH3 that was most stable in the entire sample set includingthe reproductive stage, developmental stages and in viraldiseases experimental sets. The ADH3 encoding for alcoholdehydrogenase class III enzyme that catalyzes the inter-conversion of alcohols and aldehydes or ketones with the
Figure 5. Relative quantification of PBNVnp and AtDREB1A genes to validate candidate reference genes of peanut underbiotic and abiotic stress conditions. (A) Expression of PBNVnp gene in infected transgenic peanut leaf sample relativelyquantified with candidate reference genes. (B) AtDREB1A gene expression in leaf sample of transgenic (rd29a:AtDREB1A) peanutrelatively quantified with candidate reference genes. The relative quantity values were presented after scaling to control samples inboth the (PBNVnp and AtDREB1A) cases.doi: 10.1371/journal.pone.0078555.g005
Reference Genes for Peanut Gene Expression Studies
PLOS ONE | www.plosone.org 11 October 2013 | Volume 8 | Issue 10 | e78555
reduction of NAD+ to NADH plays an important role in loweringthe toxicity of the cell [52]. Although the ADH3 has not beenused frequently as a qPCR reference gene, previous reportsshowed its stable expression in coffea arabica [53] and peanut[37]. While in the previous study with peanut, ADH3 wasrestricted to kernel developmental stages [37], our studyincluded different experimental sets from developmentalstages, biotic stress, abiotic stress and a range of peanutvarieties.
The ELF1B (Elongation factor 1-beta) and CYP2(Cyclophilin) genes were found to be next in ranking in terms oftheir stable expression after G6PD and ADH3. While theELF1B was most stable under foliar diseases and acrosspeanut varieties, CYP2 was most stable in vegetative stages,and both ELF1B and CYP2 were most stable under abioticstress. These observations are in accordance with otherstudies where ELF1B gene under cold stress in peanut [39]and under abiotic stress [32] and cadmium stress [33] insoybean was reported as most stably expressed. Similarly,CYP2 was reported as most stably expressed gene in differentexperimental sets of Vicia faba [54]. ELF1B and CYP2 alsoshowed stable expression in different tissues under variousdevelopmental stages of soybean [29]. ACT1, a member ofActin gene family has so far been considered to be the moststable across different species of peanut [38], whereas ACT11has been considered to be the most stable in all the samplestested in peanut [39]. Nevertheless, in the present studyACT11 gene was found to be stable only during the vegetativestages of peanut, indicating that its expression might havebeen influenced by the experimental conditions in this study.
Our data clearly demonstrates the unsuitability of LEC(lectin) gene as a reference gene for gene expression studiesin peanut where it showed the least stable expression acrossdifferent experimental sets analyzed. Similarly, ATPsyn (ATPsynthase) gene that is involved in the synthesis of adenosinetriphosphate (ATP) has so far not been reported as stablyexpressing internal gene, with only one report where it wasused as an endogenous gene in soybean [43]. Since ATPsynwas not stable across the experimental conditions, it is notrecommended as a reference gene for gene expression studiesin peanut.
Although, a single reference gene with high expressionstability may be appropriate for normalization of geneexpression data in some experimental conditions, in most ofthe experimental conditions, there may be no single genesuitable as a reliable reference gene and two or more internalreference genes are required for accurate and reliable results[20]. The pairwise variation results in our study indicated thatthe different pairs of most stable reference genes were found tobe optimal for the accurate normalization across the fiveexperimental sets, viz., reproductive stage, viral diseases, foliardiseases, abiotic stresses and different peanut varieties, wherepairwise variation values (V2/3) were lower than the cut-offvalue of 0.15 [20]. Addition of the third candidate referencegene was necessary only to normalize gene expression in setsof all samples, developmental stages and vegetative stage.
The results of these three sets indicated unstable expression ofgenes in the vegetative stage samples.
Candidate reference genes of peanut were validated withtransgenic peanut plants under biotic and abiotic stresses withPBNVnp and AtDREB1A genes, respectively. Normalization ofPBNVnp gene expression in infected transgenic peanut plantsshowed variable expression levels with CYP2 and ACT11genes as compared to those obtained by normalizing withG6PD and ADH3 reference genes indicating lower stability ofCYP2 and ACT11 genes. Similarly, normalization of stressinducible AtDREB1A gene expression in transgenic peanutwith CYP2 and ELF1B reference genes indicated its stabilityunder abiotic stress when compared to LEC and ATPsyngenes that had shown extreme expression levels, indicatingtheir instability under the tested experimental conditions. Thesevalidation results indicated that stability ranks of the testedcandidate reference genes are accurate and more than onestably expressed reference gene should improve the accuracyof normalization.
Conclusion
In the present study, we validated eight candidate referencegenes by extending the study to diverse samples including arange of biotic and abiotic stresses, different developmentalstages and cultivars. While the ADH3 and G6PD exhibited themost stable expression in all the tissue samples, the ELF1Bexpression was stable across different varieties, foliar diseasesand abiotic stress conditions. Although, two genes like ADH3and G6PD should be sufficient to give reliable results, theaddition of a third gene ELF1B as reference gene may produceeven better results in a diverse set of tissue samples of peanut.
Supporting Information
Figure S1. Melting curves of the 8 candidate referencegenes of peanut: A-ACT11, B-ADH3, C-ATPsyn, D-CYP2, E-ELF1B, F-G6PD, G-LEC, H-UBC1.(TIF)
Acknowledgements
The authors acknowledge the support technical assistancefrom Kanaka Reddy, G. Kalyani, A. Krithika, Ch. SridharKumar, C. Lakshminarayana and D. Pandary. This work wasundertaken as part of the CGIAR Research Program on GrainLegumes.
Author Contributions
Conceived and designed the experiments: Dumbala and Poojaand Kiran. Performed the experiments: Dumbala andKatamreddy. Analyzed the data: Dumbala and Pooja.Contributed reagents/materials/analysis tools: Dumbala, Poojaand Kiran. Wrote the manuscript: Dumbala and Pooja.
Reference Genes for Peanut Gene Expression Studies
PLOS ONE | www.plosone.org 12 October 2013 | Volume 8 | Issue 10 | e78555
References
1. Tsai HF, Sammons LR, Zhang X, Suffis SD, Su Q et al. (2010)Microarray and molecular analyses of the azole resistance mechanismin Candida glabrata oropharyngeal isolates. Antimicrob AgentsChemother 54: 3308-3317. doi:10.1128/AAC.00535-10. PubMed:20547810.
2. Bustin SA, Benes V, Nolan T, Pfaffl MW (2005) Quantitative real-timeRT-PCR-a perspective. J Mol Endocrinol 34: 597-601. doi:10.1677/jme.1.01755. PubMed: 15956331.
3. Kubista M, Andrade JM, Bengtsson M, Forootan A, Jonák J et al.(2006) The real-time polymerase chain reaction. Mol Aspects Med 27:95-125. doi:10.1016/j.mam.2005.12.007. PubMed: 16460794.
4. VanGuilder HD, Vrana KE, Freeman WM (2008) Twenty-five years ofquantitative PCR for gene expression analysis. BioTechniques 44:619-626. PubMed: 18474036.
5. Bustin SA (2000) Absolute quantification of mRNA using real-timereverse transcription polymerase chain reaction assays. J MolEndocrinol 25: 169-193. doi:10.1677/jme.0.0250169. PubMed:11013345.
6. Giulietti A, Overbergh L, Valckx D, Decallonne B, Bouillon R et al.(2001) An overview of real-time quantitative PCR: applications toquantify cytokine gene expression. Methods 25: 386-401. doi:10.1006/meth.2001.1261. PubMed: 11846608.
7. Mason G, Provero P, Vaira AM, Accotto GP (2002) Estimating thenumber of integrations in transformed plants by quantitative real-timePCR. BMC Biotechnol 2: 20-30. doi:10.1186/1472-6750-2-20. PubMed:12398792.
8. Weng H, Pan A, Yang L, Zhang C, Liu Z, Zhang D (2004) Estimatingnumber of transgene copies in transgenic rapeseed by real-time PCRassay with HMG I/Y as an endogenous reference gene. Plant Mol BiolRep 22: 289-300. doi:10.1007/BF02773139.
9. Chandna R, Augustine R, Bisht NC (2012) Evaluation of candidatereference genes for gene expression normalization in Brassica junceausing real time quantitative RT-PCR. PLOS ONE 7: e36918. doi:10.1371/journal.pone.0036918. PubMed: 22606308.
10. Radonić A, Thulke S, Mackay IM, Landt O, Siegert W et al. (2004)Guideline to reference gene selection for quantitative real-time PCR.Biochem Biophys Res Commun 313: 856-862. doi:10.1016/j.bbrc.2003.11.177. PubMed: 14706621.
11. Thellin O, Zorzi W, Lakaye B, De Borman B, Coumans B et al. (1999)Housekeeping genes as internal standards: use and limits. J Biotechnol75: 291–295. doi:10.1016/S0168-1656(99)00163-7. PubMed:10617337.
12. Czechowski T, Stitt M, Altmann T, Udvardi MK, Scheible WR (2005)Genome wide identification and testing of superior reference genes fortranscript normalization in Arabidopsis. Plant Physiol 139: 5–17. doi:10.1104/pp.105.063743. PubMed: 16166256.
13. Artico S, Nardeli SM, Brilhante O, Grossi-de-Sa MF, Alves-Ferreira M(2010) Identification and evaluation of new reference genes inGossypium hirsutum for accurate normalization of real-time quantitativeRT-PCR data. BMC Plant Biol 10: 49. PubMed: 20302670.
14. Remans T, Smeets K, Opdenakker K, Mathijsen D, Vangronsveld J etal. (2008) Normalisation of real-time RT-PCR gene expressionmeasurements in Arabidopsis thaliana exposed to increased metalconcentrations. Planta 227: 1343-1349. doi:10.1007/s00425-008-0706-4. PubMed: 18273637.
15. Nicot N, Hausman JF, Hoffmann L, Evers D (2005) Housekeeping geneselection for real-time RT-PCR normalization in potato during biotic andabiotic stress. J Exp Bot 56: 2907-2914. doi:10.1093/jxb/eri285.PubMed: 16188960.
16. Hu R, Fan C, Li H, Zhang Q, Fu Y-F (2009) Evaluation of putativereference genes for gene expression normalization in soybean byquantitative real-time RT-PCR. BMC Mol Biol 10: 93-104. doi:10.1186/1471-2199-10-93. PubMed: 19785741.
17. Garg R, Sahoo A, Tyagi AK, Jain M (2010) Validation of internal controlgenes for quantitative gene expression studies in chickpea. BiochemBiophys Res Commun 396: 283-288. doi:10.1016/j.bbrc.2010.04.079.PubMed: 20399753.
18. Maroufi A, Bockstaele EV, Loose MD (2010) Validation of referencegenes for gene expression analysis in chicory (Cichorium intybus)using quantitative real-time PCR. BMC Mol Biol 11: 15-27. doi:10.1186/1471-2199-11-15. PubMed: 20156357.
19. Gu C, Chen S, Liu Z, Shan H, Luo H et al. (2011) Reference geneselection for quantitative real-time PCR in Chrysanthemum subjected tobiotic and abiotic stress. Mol Biotechnol 49: 192-197. doi:10.1007/s12033-011-9394-6. PubMed: 21416201.
20. Vandesompele J, De Preter K, Pattyn F, Poppe B, Van Roy N et al.(2002) Accurate normalization of real-time quantitative RT-PCR data by
geometric averaging of multiple internal control genes. Genome Biol 3:1-11. PubMed: 12184808.
21. Hellemans J, Mortier G, De Paepe A, Speleman F, Vandesompele J(2007) qBase relative quantification framework and software formanagement and automated analysis of real-time quantitative PCRdata. Genome Biol 8: R23. doi:10.1186/gb-2007-8-2-r23. PubMed:17316440.
22. Jain M, Nijhawan A, Tyagi AK, Khurana JP (2006) Validation ofhousekeeping genes as internal control for studying gene expression inrice by quantitative real-time PCR. Biochem Biophys Res Commun345: 646-651. doi:10.1016/j.bbrc.2006.04.140. PubMed: 16690022.
23. Long XY, Wang JR, Ouellet T, Rocheleau L, Wei YM et al. (2010)Genome-wide identification and evaluation of novel internal controlgenes for Q-PCR based transcript normalization in wheat. Plant MolBiol 74: 307-311. doi:10.1007/s11103-010-9666-8. PubMed: 20658259.
24. Manoli A, Sturaro A, Trevisan S, Quaggiotti S, Nonis A (2012)Evaluation of candidate reference genes for qPCR in maize. J PlantPhysiol 169(8): 807-815. doi:10.1016/j.jplph.2012.01.019. PubMed:22459324.
25. Expósito-Rodríguez M, Borges AA, Borges-Pérez A, Pérez J (2008)Selection of internal control genes for quantitative real-time RT-PCRstudies during tomato development process. BMC Plant Biol 8:131-142. doi:10.1186/1471-2229-8-131. PubMed: 19102748.
26. Reid KE, Olsson N, Schlosser J, Peng F, Lund ST (2006) An optimizedgrapevine RNA isolation procedure and statistical determination ofreference genes for real-time RT-PCR during berry development. BMCPlant Biol 6: 27-37. doi:10.1186/1471-2229-6-27. PubMed: 17105665.
27. Qi J, Yu S, Zhang F, Shen X, Zhao X et al. (2010) Reference geneselection for real-time quantitative polymerase chain reaction of mRNAtranscript levels in chinese cabbage(Brassica rapa L. ssp. pekinensis).Plant Mol Biol Rep 28: 597-604.
28. Chen X, Truksa M, Shah S, Weselake RJ (2010) A survey ofquantitative realtime polymerase chain reaction internal referencegenes for expression studies in Brassica napus. Anal Biochem 405:138-140. doi:10.1016/j.ab.2010.05.032. PubMed: 20522329.
29. Jian B, Liu B, Bi Y, Hou W, Wu C et al. (2008) Validation of internalcontrol for gene expression study in soybean by quantitative real-timePCR. BMC Mol Biol 9: 59-72. doi:10.1186/1471-2199-9-59. PubMed:18573215.
30. Libault M, Thibivilliers S, Bilgin DD, Radwan O, Benitez M et al. (2008)Identification of four soybean reference genes for gene expressionnormalization. Plants Genome 1: 44-54. doi:10.3835/plantgenome2008.02.0091.
31. Li Q, Fan CM, Zhang XM, Fu YF (2012) Validation of reference genesfor real-time quantitative PCR normalization in soybean developmentaland germinating seeds. Plant Cell Rep 31: 1789-1798. doi:10.1007/s00299-012-1282-4. PubMed: 22588479.
32. Le DT, Aldrich DL, Valliyodan B, Watanabe Y, Ha CV et al. (2012)Evaluation of candidate reference genes for normalization ofquantitative RT-PCR in soybean tissues under various abiotic stressconditions. PLOS ONE 7(9): e46487. doi:10.1371/journal.pone.0046487. PubMed: 23029532.
33. Wang Y, Yu K, Poysa V, Shi C, Zhou Y (2012) Selection of referencegenes for normalization of qRT-PCR analysis of differentially expressedgenes in soybean exposed to cadmium. Mol Biol Rep 39: 1585-1594.doi:10.1007/s11033-011-0897-9. PubMed: 21625860.
34. FAO (2009) Food and Agricultural Organization of the United Nation.FAO statistical database. Available: http://faostat.fao.org/ faostat/collections?Subset= agriculture
35. Sharma KK, Ortiz R (2000) Program for the application of genetictransformation for crop improvement in the semi-arid tropics. In VitroCell Dev Biol-Plant 36: 83-92. doi:10.1007/s11627-000-0019-1.
36. Sharma HC, Crouch JH, Sharma KK, Seetharama N, Hash CT (2002)Applications of biotechnology for crop improvement: prospects andconstraints. Plant Sci 163: 381-395. doi:10.1016/S0168-9452(02)00133-4.
37. Brand Y, Hovav R (2010) Identification of suitable internal controlgenes for quantitative real-time PCR expression analyses in peanut(Arachis hypogaea). Peanut Sci 37: 12-19. doi:10.3146/PS09-014.1.
38. Morgante CV, Guimarães PM, Martins ACQ, Araújo ACG, Leal-BertioliSCM et al. (2011) Reference genes for quantitative reversetranscription-polymerase chain reaction expression studies in wild andcultivated peanut. BMC Res Notes 4: 339-350. doi:10.1186/1756-0500-4-339. PubMed: 21906295.
39. Chi X, Hu R, Yang Q, Zhang X, Pan L et al. (2012) Validation ofreference genes for gene expression studies in peanut by quantitative
Reference Genes for Peanut Gene Expression Studies
PLOS ONE | www.plosone.org 13 October 2013 | Volume 8 | Issue 10 | e78555
real-time RT-PCR. Mol Genet Genomics 287: 167-176. doi:10.1007/s00438-011-0665-5. PubMed: 22203160.
40. Kumar PL, Waliyar F (2007) iagnosis and detection of viruses infectingICRISAT mandate crops: methods manual. Patancheru 502 324,Andhra Pradesh, India, International Crops Research Institute for theSemi-Arid Tropics.
41. Subrahmanyam P, Moss JP, McDonald D, Subba Rao PV, Rao VR(1985) Resistance to leaf spot caused by Cercosporidium personatumin wild Arachis species. Plant Dis 69: 951-954. doi:10.1094/PD-69-951.
42. Schmidt MA, Parrott WA (2001) Quantitative detection of transgenes insoybean [Glycine max (L.) Merrill] and peanut (Arachis hypogaea L.) byreal-time polymerase chain reaction. Plant Cell Rep 20: 422-428. doi:10.1007/s002990100326.
43. Peterhansel C, Hahnen S, Kalamajka R, Offermann S, Miedl B et al.(2004) Quantitative detection of transgenic and endogenous DNAsequences in seeds after automated DNA preparation. Biomed EngAppl Basis Comm 16: 1-6.
44. Yi CX, Zhang J, Chan KM, Liu XK, Hong Y (2008) Quantitative real-time PCR assay to detect transgene copy number in cotton(Gossypium hirsutum). Anal Biochem 375: 150-152. doi:10.1016/j.ab.2007.11.022. PubMed: 18078801.
45. Altschul SF, Gish W, Miller W, Myers EW, Lipman DJ (1990) Basiclocal alignment search tool. J Mol Biol 215: 403-410. doi:10.1016/S0022-2836(05)80360-2. PubMed: 2231712.
46. Tunbridge EM, Eastwood SL, Harrison PJ (2011) Changed relative towhat? House-keeping genes and normalization strategies in humanbrain gene expression studies. Biol Psychiatry 69: 173-179. doi:10.1016/j.biopsych.2010.05.023. PubMed: 20673871.
47. Andersen CL, Jensen JL, Ørntoft TF (2004) Normalization of real-timequantitative reverse transcription-PCR data: A modelbased varianceestimation approach to identify genes suited for normalization, applied
to bladder and colon cancer data sets. Cancer Res 64: 5245-5250. doi:10.1158/0008-5472.CAN-04-0496. PubMed: 15289330.
48. Bhatnagar-Mathur P, Devi MJ, Srinivas Reddy D, Lavanya M, Vadez Vet al. (2007) Stress-inducible expression of AtDREB1A in transgenicpeanut (Arachis hypogaea L.) increases transpiration efficiency underwater limiting conditions. Plant Cell Rep 26: 2071-2082. doi:10.1007/s00299-007-0406-8. PubMed: 17653723.
49. Hruz T, Wyss M, Docquier M, Pfaffl MW, Masanetz S et al. (2011)RefGenes: identification of reliable and condition specific referencegenes for RT-qPCR data normalization. BMC Genomics 12: 156. doi:10.1186/1471-2164-12-156. PubMed: 21418615.
50. Caldana C, Scheible W-R, Mueller-Roeber B, Ruzicic S (2007) Aquantitative RT-PCR platform for high-throughput expression profilingof 2500 rice transcription factors. Plants Methods 3: 7. doi:10.1186/1746-4811-3-7.
51. Boava LP, Laia ML, Jacob TR, Dabbas KM, Gonçalves J et al. (2010)Selection of endogenous genes for gene expression studies inEucalyptus under biotic (Puccinia psidii) and abiotic (acibenzolar-Smethyl) stresses using RT-qPCR. BMC Res Notes 3: 43. doi:10.1186/1756-0500-3-43. PubMed: 20181283.
52. Yokoyama S, Harry DE (1993) Molecular phylogeny and evolutionaryrates of alcohol dehydrogenases in vertebrates and plants. Mol BiolEvol 10: 1215-1226. PubMed: 8277852.
53. Barsalobres-Cavallari CF, Severino FE, Maluf MP, Maia IG (2009)Identification of suitable internal control genes for expression studies inCoffea arabica under different experimental conditions. BMC Mol Biol6: 1. PubMed: 19126214.
54. Gutierrez N, Gimenez MJ, Palomino C, Avila CM (2011) Assessment ofcandidate reference genes for expression studies in Vicia faba L. byreal-time quantitative PCR. Mol Breed 28: 13-24.
Reference Genes for Peanut Gene Expression Studies
PLOS ONE | www.plosone.org 14 October 2013 | Volume 8 | Issue 10 | e78555