extended orbitally forced palaeoclimatic records from the equatorial atlantic ceara rise
DESCRIPTION
We extend existing high-resolution Oligocene–Miocene proxy records from Ocean Drilling Program (ODP) Leg 154. The extendedrecord spans the time interval from $17:86 to 26.5 Ma. The data are age calibrated against a new astronomical solution that affords a re-evaluation of the intricate interaction between orbital (‘‘Milankovitch’’) forcing of the climate and ocean system, and the fidelity withwhich this forcing is recorded in oxygen and carbon stable isotope measurements from benthic foraminifera, and associated lithologicalproxy records of magnetic susceptibility, colour reflectance, and the measured sand fraction. Our records show a very strong continualimprint of the Earth’s obliquity cycle, modulate in amplitude every $41 ka, a very strong eccentricity signal in the carbon isotope records,and a strong, but probably local, imprint of climatic precession on the coarse fraction and magnetic susceptibility records. Our dataallowed us to evaluate how the interaction of long, multi-million year beats in the Earth’s eccentricity and obliquity are implicated in thewaxing and waning of ice-sheets, presumably on Antarctica. Our refined age model confirms the revised age of the Oligocene–Mioceneboundary, previously established by analysis of the lithological data, and allows a strong correlation with the geomagnetic time scale bycomparison with data from ODP Site 1090, Southern Ocean.TRANSCRIPT

ARTICLE IN PRESS
0277-3791/$ - se
doi:10.1016/j.qu
�CorrespondE-mail addr
Quaternary Science Reviews ] (]]]]) ]]]–]]]
Extended orbitally forced palaeoclimatic records from the equatorialAtlantic Ceara Rise
Heiko Palikea,�, Julia Frazierb, James C. Zachosb
aNational Oceanography Centre, Southampton, School of Ocean and Earth Science, European Way, Southampton SO14 3ZH, UKbEarth Sciences Department, University of California, Santa Cruz, CA 95064, USA
Accepted 20 February 2006
Abstract
We extend existing high-resolution Oligocene–Miocene proxy records from Ocean Drilling Program (ODP) Leg 154. The extended
record spans the time interval from �17:86 to 26.5Ma. The data are age calibrated against a new astronomical solution that affords a re-
evaluation of the intricate interaction between orbital (‘‘Milankovitch’’) forcing of the climate and ocean system, and the fidelity with
which this forcing is recorded in oxygen and carbon stable isotope measurements from benthic foraminifera, and associated lithological
proxy records of magnetic susceptibility, colour reflectance, and the measured sand fraction. Our records show a very strong continual
imprint of the Earth’s obliquity cycle, modulate in amplitude every�41ka, a very strong eccentricity signal in the carbon isotope records,
and a strong, but probably local, imprint of climatic precession on the coarse fraction and magnetic susceptibility records. Our data
allowed us to evaluate how the interaction of long, multi-million year beats in the Earth’s eccentricity and obliquity are implicated in the
waxing and waning of ice-sheets, presumably on Antarctica. Our refined age model confirms the revised age of the Oligocene–Miocene
boundary, previously established by analysis of the lithological data, and allows a strong correlation with the geomagnetic time scale by
comparison with data from ODP Site 1090, Southern Ocean.
r 2006 Elsevier Ltd. All rights reserved.
1. Introduction
Ocean Drilling Program (ODP) Leg 154 data (Curryet al., 1995; Shackleton et al., 1997) so far provide the bestdeveloped set of demonstrably astronomically forcedlithological and climatic proxy data cycles spanning theNeogene, and extending as far back as the late Eocene(Shackleton et al., 1999). A main strength of palaeo-climateseries derived from ODP Leg 154 sediments is thatastronomically calibrated age models have been developedbased on lithological (Shackleton and Crowhurst, 1997;Weedon et al., 1997; Shackleton et al., 1999) andgeochemical (Flower et al., 1997; Pearson et al., 1997)variations, that allow independent geochemical proxies tobe placed on a time scale of high accuracy, potentially atthe climatic precession period ð�21 kaÞ. Multiple studieshave exploited the data sets generated from ODP Leg 154for palaeoceanographic (Shackleton and Crowhurst, 1997;
e front matter r 2006 Elsevier Ltd. All rights reserved.
ascirev.2006.02.011
ing author. Tel.: +442380 593638; fax: +44 2380 593052.
ess: [email protected] (H. Palike).
Zachos et al., 1997, 2001a,b; Paul et al., 2000; Flower et al.,2006), biostratigraphic (Raffi, 1999; Shackleton et al.,2000) and cyclostratigraphic (Shackleton et al., 1999;Palike and Shackleton, 2000; Billups et al., 2004; Palikeet al., 2004; Lourens et al., 2005) purposes, and are nowbeing exploited for the interpretation of data from morerecent drilling expeditions (Flower and Chisholm, 2006).ODP Leg 154 sediments offered the opportunity to studypalaeoceanographic processes at a resolution and fidelitypreviously limited to the Plio- and Pleistocene, over severalmillion years. Some of these studies investigated the closerelationship between the cyclostratigraphic record andmacroscopic (multi-million year) features of astronomicalcalculations, made possible by the extended calculations ofLaskar et al. (1993). These astronomical calculations haverecently been evaluated (Neron de Surgy and Laskar, 1997;Laskar, 1999) and improved (Varadi et al., 2003; Laskaret al., 2004). The age models from ODP Leg 154 wereadjusted to these new calculations (Palike et al., 2004),demonstrating a better fit with these newer solutionscompared to the originally used one of Laskar et al.

ARTICLE IN PRESSH. Palike et al. / Quaternary Science Reviews ] (]]]]) ]]]–]]]2
(1993), and make it opportune to re-visit the impact of thisre-tuning on palaeoclimatic proxy series, as well asformally establishing the basis for the re-calibration bypublishing the full data series (see supplementary material).In addition, here we extend the original stable isotoperecord that was established across the Oligocene/Mioceneboundary (Paul et al., 2000; Zachos et al., 2001b) both up-and down-core, and focus in more depth on the implica-tions of the associated percent sand fraction ð465mmÞrecord, with a series of significant results.
2. Methods
The data sets presented here will be made available inelectronic form at a designated data repository.1 Thegeneration of new benthic stable isotope data ðd18O; d13CÞand percent sand fraction ð465mmÞ follows the methodsdescribed by Paul et al. (2000), and were also measured inSanta Cruz. The initial study by Paul et al. (2000)generated data from two holes: 926B (3�430N, 42�540W,3.6 km water depth) and 929A (5�580N, 43�440W, 4.36 kmwater depth), which were used to generate a spliced recordfrom these two Holes, covering core gaps and identifiedlocal slumped horizons. Here, we focused on extendingupward and downward the record from ODP Site 926B,the shallower of the two localities, and the one with thehigher sedimentation rates. The new record extendingdownward is based on analyses of a mixture of Cibici-doides species including C. mundulus and C. cresbi, whilethe new record extending upward is based entirely onanalyses of C. mundulus. The complete data we present herewere sampled from Core 926B-35X downwards to Core926B-59X, excluding intervals that were identified as localslumps (Shackleton et al., 1999), and sampled every 10 cm.The data set also comprised previously generated datafrom a sub-interval (Paul et al., 2000; Zachos et al., 2001b).Sedimentation rates for this interval were previouslyestimated by Weedon et al. (1997) and astronomicallycalibrated by Shackleton et al. (1999): they range between�25 and 35m/Ma in the younger time interval, andbetween �20 and 30m/Ma in the older time interval ofthe record, resulting in a median sample step of �3:5 ka.On our new time scale, this entire record now spans theinterval �17:86226:5Ma (�17:77226:24Ma on the timescales of Shackleton et al., 1999, 2000). The ODP 926Brecord contains short core breaks, and the data are linkedinto a composite section by comparison with a splicedcombined record of susceptibility and reflectance obtainedfrom several ODP 154 Sites (Shackleton et al., 1999),normalised to zero mean and unit standard deviation asdescribed and used by Palike et al. (2004). The extendeddata set used in this study is presented in Fig. 1 againstHole 926B core depth in metres composite depth (mcd)(Curry et al., 1995; Shackleton et al., 1999). The stackedsusceptibility and colour reflectance record was obtained
1http://www.ncdc.noaa.gov/oa/ncdc.html.
from multiple Sites, but re-adjusted to the 926B depthscale. It was generated such that positive excursions in thisrecord coincide with positive excursions in the suscept-ibility record obtained directly from Hole 926B. The coarsefraction data for ODP Hole 926B shown in Fig. 1supplement those published previously from ODP Site929 (Zachos et al., 1997; Paul et al., 2000), which had adeeper palaeo-depth. Prior to further analysis, we preparedthe percent coarse fraction record by using the transforma-tion arcsinð
ffiffiffiffiffiffiffiffiffiffiffiffiffiffiffiffiffiffiffiffiffiffiffiffiffiffiffiffiffiffiffiffiffiffiffiffiffiffiffiffiffiffiffiffiffiffi%coarse fraction=100
pÞ. This transformation
was applied before further time series analysis in order toachieve more normally distributed values from data thatare clipped at zero percent (Weedon, 2003, p. 54).
2.1. Tuning strategies
Significant previous work was undertaken to combinegeological data from ODP Leg 154 with calculatedvariations of the Earth’s orbit in order to achieve anorbitally calibrated age model. This work comprisedseveral important steps. First, sequences from differentODP Leg 154 sites and holes were cross-correlated in orderto obtain a continuous record from individual cores, and inorder to evaluate the continuity of this ‘‘spliced’’ data set.The correlation was accomplished on the basis of high-resolution lithological data (chiefly, magnetic susceptibil-ity, colour reflectance, down-hole logging data, as well ashigh-resolution biostratigraphic data). This extensive work,and an evaluation of the stratigraphic continuity of thecombined records, was achieved by Weedon et al. (1997)and Shackleton et al. (1999). From these composite splicedrecords, the next step consisted of analysing the characterof any possible astronomical cyclicity on the basis ofexisting bio-stratigraphic age assignments. Shackleton et al.(1999) used the observation of a dominating obliquitysignal and a weaker but discernible climatic precessionsignal to generate an appropriate astronomical targetcurve, and used the longer-term amplitude modulation ofobliquity (�1:2 million year long amplitude envelope) andclimatic precession (�400 ka envelope) to evaluate thefidelity of the generated age model within ‘‘hierarchies’’ oforbital cycle time scales.The resulting age model, generated on the basis of
lithological variations, allowed other proxy data to beplaced on this time scale, permitting the calculation ofsedimentary fluxes and evaluation of rates of evolutionarychange with a resolution and accuracy that is far betterthan can be achieved by traditional geological means.Shackleton et al. (1999) found that the 1.2 million year longamplitude modulation cycle of obliquity indicated that theage of the Oligocene/Miocene boundary be moved from itsprevious age of 23.8Ma (Cande and Kent, 1995) to22.9Ma (Shackleton et al., 2000), and that the amplitudevariation of climatic precession would place a furtherconstraint on any alternative age model (allowing shiftingby �405 ka multiples). A different view for the correct ageof the Oligocene/Miocene boundary was proposed by

ARTICLE IN PRESS
0 10 20 30
Coarse fraction (%)
012
δ18O
(‰)
-1012
δ13C
(‰)051015
SUS
(SI x 10-6
)-202
SusRef
(normalised)
350
400
450
500
550
Hol
e 92
6B D
epth
(m
cd)
20 40 60
Lightness (%)
Mi-1
(a) (b) (c) (d) (e) (f)
Fig. 1. ODP Leg 154 data used in this study plotted versus ODP 926B core depth. The ODP 926B record contains short core breaks, and the data are
linked into a composite section by comparison with a spliced combined record (a) of susceptibility and reflectance (‘‘SusRef’’), normalised to zero mean
and unit standard deviation as described and used by (Palike et al., 2004). Also plotted are (b) the colour reflectance parameter L* (lightness) and (c)
magnetic susceptibility (‘‘SUS’’), calculated by gaussian interpolation at stable isotope sample points. Previously published benthic foraminifer data from
ODP Site 926B (Paul et al., 2000; Zachos et al., 2001b) were extended and are plotted with (d) the 463mm coarse fraction data. Benthic d13C (e) and d18O(f) are plotted referenced against VPDB. Mi–1 denotes the position of a prominent glacial event previously discussed (Miller et al., 1991; Zachos et al.,
2001b).
H. Palike et al. / Quaternary Science Reviews ] (]]]]) ]]]–]]] 3
Wilson et al. (2002). However, the findings of this studyhave been questioned (Channell and Martin, 2003), andadditional studies confirmed the new correlation ofShackleton et al. (2000) for sediments from other localities(Billups et al., 2004; Palike et al., 2004), subject to re-adjustment to the new astronomical solution of Laskaret al. (2004).
Importantly, the time scale from Shackleton et al. (1999)was developed using an extension of the calculations thatwere done by Laskar et al. (1993), which were found tohave an inherent limit for the duration over which they canbe considered valid into the past (Laskar, 1999). Veryrecently, an updated and much improved calculation ofEarth’s orbital variations was published (Laskar et al.,2004). Palike et al. (2004) demonstrated using thelithological data from ODP Legs 154 and 199 that thisnew calculation fits better with the geological data. Here,we report the results of re-adjusting the astronomical agecalibration of ODP Leg 154 data to the new astronomicalsolution, which moves the age of Oligocene/Miocene
boundary back in time by �100 ka, to a new age of23.03Ma (Lourens et al., 2005), chiefly controlled by thedifference in �100 ka eccentricity cycle amplitudes.The re-tuning of magnetic susceptibility data to the new
Laskar et al. (2004) solution was done by aligning data andtarget at the climatic precession frequency, constrained bythe �100 ka amplitude modulation of precession byeccentricity. This assumption of a zero-phase differenceat the precession frequency between astronomical solutionand geological data results in a phase lag at the obliquityfrequency of 6–7 ka during the late Oligocene (Billupset al., 2004). We note here that the new astronomicalsolution of Laskar et al. (2004) uses current day values fortidal dissipation and dynamical ellipticity (Palike andShackleton, 2000), the established phase relationships forobliquity and climatic precession would be altered whendifferent histories for the tidal dissipation and dynamicalellipticity terms were used. A subsequent iteration appliedthis phase lag at the obliquity frequency for the calculatedETP curve, generating the overall best-fitting target curve.

ARTICLE IN PRESSH. Palike et al. / Quaternary Science Reviews ] (]]]]) ]]]–]]]4
The zero-phase assumption at precession stems from theevidence that the strong precession signal arises from localclimatic processes on the adjacent continent whichmodulate the terrigenous input, and possibly local pro-ductivity and the preserved sediment coarse fraction. Thelag at the obliquity frequency presumably arises from theslow response of the varying Antarctic continental icesheet, and for d13C on the long residence time of carbonand nutrients in the ocean. The phase relationship usedfollows that of Shackleton and Crowhurst (1997). Theyinterpreted magnetic susceptibility values as a proxy for theterrigenous supply and correlated maxima in susceptibilitywith maxima in Southern Hemisphere summer insolation(minima in Northern Hemisphere insolation), based on theobservations that otherwise positive d18O values wouldcorrespond to Northern Hemisphere insolation minima,and the obliquity response would be out of phase. In thisscenario, increased terrigenous input through the Amazonsystem would be driven by maxima in Southern Hemi-sphere insolation. They also argued, though, that in the
02
SusRe
(normali
17
18
19
20
21
22
23
24
25
26
Age
(M
a)
-3 0 3
ETP
22 24
Obliquity (deg)
-1 0 1
400 kyr ecc
0
400 kyr ecc
58Ol-
C6Cn
61Ol-C7n
54Ol-
C8n
55Mi-C6Bn
52Mi-C6An
49Mi-C6n
46Mi-C5En
(e)(f)(g)(h)
Fig. 2. ODP Leg 154 data plotted versus revised astronomical age (Laskar et a
Sites 926 and 929, age calibrated using a previous astronomical solution (Zacho
(c) data, using a revised astronomical solution and time scale (Laskar et al., 2
coarse fraction percentage data. This transformation was applied before furthe
from data that are clipped at zero percent (Weedon, 2003, p. 54). (e) Shows ag
obliquity and�1:2Ma obliquity amplitude modulation from Laskar et al. (2004
(‘‘ETP’’), using Laskar et al. (2004), with relative amplitudes reflecting those of
400 ka bandpass filters (�0:5Ma�1 gaussian bandwidth) applied on ETP (blac
position, count and identification of the absolute number of�400ka cycles as fi
of obliquity amplitude minima, thick green cross-lines mark the position of lo
Oligocene the uncertainties in the orbital calculations arestill at an order (Palike and Shackleton, 2000; Lourenset al., 2000) where age errors that arise from such phaseassumptions are smaller than the error that arises from ourincomplete knowledge of the dissipative effects (tidaldissipation) in the orbital solutions. The data sets areplotted against our new time scale in Fig. 2, together withthe astronomical templates from Laskar et al. (2004), aswell as a comparison of the previous time scale ofShackleton et al. (1999) that was generated with theastronomical solution by Laskar et al. (1993) and appliedby Zachos et al. (2001b) to a sub-set of the stable isotopedata. ‘‘ETP’’ refers to an artificial mix of eccentricity,obliquity (tilt) and climatic precession, that are combinedby normalising these three components (subtracting theirmean and dividing by their standard deviation), and thenadding these with a set of weightings determined by thegeological data. In this case the eccentricity component wasaccentuated as the stable isotope data have a largeeccentricity imprint. We note that ETP resembles Northern
0.0 0.2 0.4 0.6
Coarse fraction
sin-1(%/100)
0.5
012
δ18O
(‰)
-1012
δ13C
(‰)-2
f
sed)012
δ18O(‰)
(Zachos et al. 2001b)
(a)(b)(c)(d)
Mi-1
l., 2004). Shown are (a) the previously published spliced d18O dataset from
s et al., 2001b; Laskar et al., 1993), against new extended d18O (b) and d12C004). (d) Shows an arcsinð
ffiffiffiffiffiffiffiffiffiffiffiffiffiffiffi%=100
pÞ transformation of the age-calibrated
r time series analysis in order to achieve more normally distributed values
e-calibrated combined susceptibility and lightness data. (f) Shows Earth’s
). (g) Calculated mix of eccentricity, obliquity (tilt), and climatic precession
the data, and �6:4ka lagged obliquity component (Billups et al., 2004). (h)
k), �d18O (blue) and �d13C (green). Red tick marks and codes mark the
rst proposed by Wade and Palike (2004). Thin cross-lines mark the position
ng-term eccentricity amplitude minima.
ARTICLE IN PRESSH. Palike et al. / Quaternary Science Reviews ] (]]]]) ]]]–]]] 5
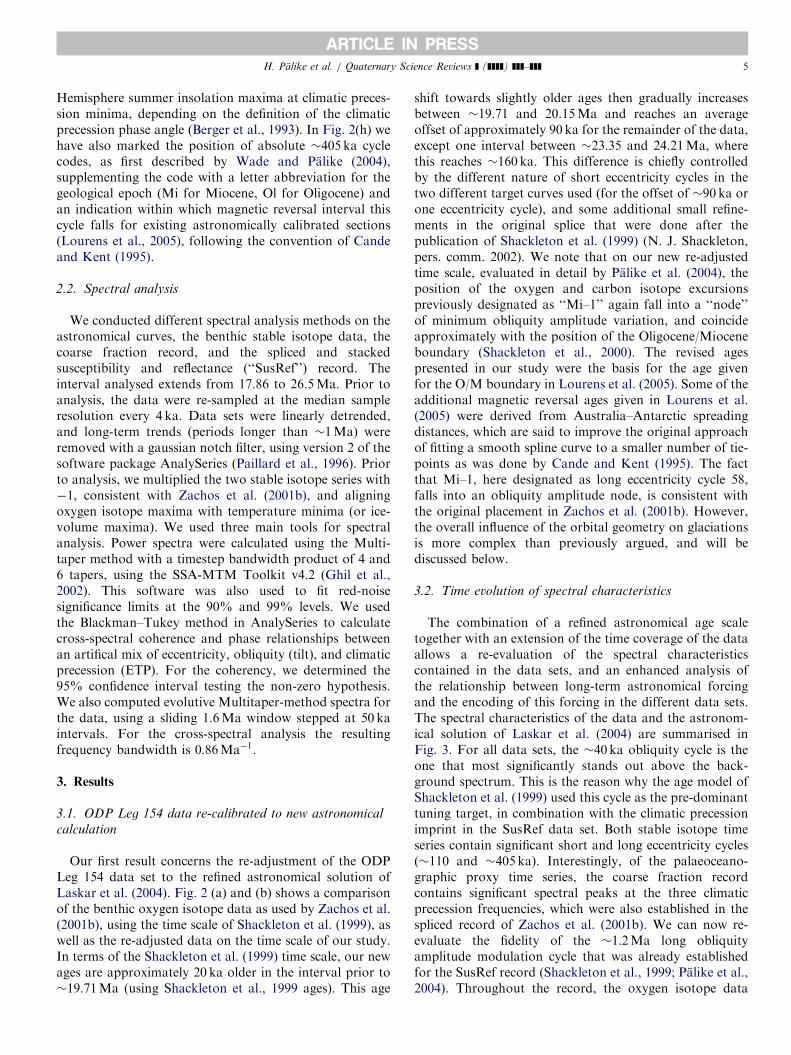
Hemisphere summer insolation maxima at climatic preces-sion minima, depending on the definition of the climaticprecession phase angle (Berger et al., 1993). In Fig. 2(h) wehave also marked the position of absolute �405 ka cyclecodes, as first described by Wade and Palike (2004),supplementing the code with a letter abbreviation for thegeological epoch (Mi for Miocene, Ol for Oligocene) andan indication within which magnetic reversal interval thiscycle falls for existing astronomically calibrated sections(Lourens et al., 2005), following the convention of Candeand Kent (1995).
2.2. Spectral analysis
We conducted different spectral analysis methods on theastronomical curves, the benthic stable isotope data, thecoarse fraction record, and the spliced and stackedsusceptibility and reflectance (‘‘SusRef’’) record. Theinterval analysed extends from 17.86 to 26.5Ma. Prior toanalysis, the data were re-sampled at the median sampleresolution every 4 ka. Data sets were linearly detrended,and long-term trends (periods longer than �1Ma) wereremoved with a gaussian notch filter, using version 2 of thesoftware package AnalySeries (Paillard et al., 1996). Priorto analysis, we multiplied the two stable isotope series with�1, consistent with Zachos et al. (2001b), and aligningoxygen isotope maxima with temperature minima (or ice-volume maxima). We used three main tools for spectralanalysis. Power spectra were calculated using the Multi-taper method with a timestep bandwidth product of 4 and6 tapers, using the SSA-MTM Toolkit v4.2 (Ghil et al.,2002). This software was also used to fit red-noisesignificance limits at the 90% and 99% levels. We usedthe Blackman–Tukey method in AnalySeries to calculatecross-spectral coherence and phase relationships betweenan artifical mix of eccentricity, obliquity (tilt), and climaticprecession (ETP). For the coherency, we determined the95% confidence interval testing the non-zero hypothesis.We also computed evolutive Multitaper-method spectra forthe data, using a sliding 1.6Ma window stepped at 50 kaintervals. For the cross-spectral analysis the resultingfrequency bandwidth is 0:86Ma�1.
3. Results
3.1. ODP Leg 154 data re-calibrated to new astronomical
calculation
Our first result concerns the re-adjustment of the ODPLeg 154 data set to the refined astronomical solution ofLaskar et al. (2004). Fig. 2 (a) and (b) shows a comparisonof the benthic oxygen isotope data as used by Zachos et al.(2001b), using the time scale of Shackleton et al. (1999), aswell as the re-adjusted data on the time scale of our study.In terms of the Shackleton et al. (1999) time scale, our newages are approximately 20 ka older in the interval prior to�19:71Ma (using Shackleton et al., 1999 ages). This age
shift towards slightly older ages then gradually increasesbetween �19:71 and 20.15Ma and reaches an averageoffset of approximately 90 ka for the remainder of the data,except one interval between �23:35 and 24.21Ma, wherethis reaches �160 ka. This difference is chiefly controlledby the different nature of short eccentricity cycles in thetwo different target curves used (for the offset of �90 ka orone eccentricity cycle), and some additional small refine-ments in the original splice that were done after thepublication of Shackleton et al. (1999) (N. J. Shackleton,pers. comm. 2002). We note that on our new re-adjustedtime scale, evaluated in detail by Palike et al. (2004), theposition of the oxygen and carbon isotope excursionspreviously designated as ‘‘Mi–1’’ again fall into a ‘‘node’’of minimum obliquity amplitude variation, and coincideapproximately with the position of the Oligocene/Mioceneboundary (Shackleton et al., 2000). The revised agespresented in our study were the basis for the age givenfor the O/M boundary in Lourens et al. (2005). Some of theadditional magnetic reversal ages given in Lourens et al.(2005) were derived from Australia–Antarctic spreadingdistances, which are said to improve the original approachof fitting a smooth spline curve to a smaller number of tie-points as was done by Cande and Kent (1995). The factthat Mi–1, here designated as long eccentricity cycle 58,falls into an obliquity amplitude node, is consistent withthe original placement in Zachos et al. (2001b). However,the overall influence of the orbital geometry on glaciationsis more complex than previously argued, and will bediscussed below.
3.2. Time evolution of spectral characteristics
The combination of a refined astronomical age scaletogether with an extension of the time coverage of the dataallows a re-evaluation of the spectral characteristicscontained in the data sets, and an enhanced analysis ofthe relationship between long-term astronomical forcingand the encoding of this forcing in the different data sets.The spectral characteristics of the data and the astronom-ical solution of Laskar et al. (2004) are summarised inFig. 3. For all data sets, the �40 ka obliquity cycle is theone that most significantly stands out above the back-ground spectrum. This is the reason why the age model ofShackleton et al. (1999) used this cycle as the pre-dominanttuning target, in combination with the climatic precessionimprint in the SusRef data set. Both stable isotope timeseries contain significant short and long eccentricity cycles(�110 and �405 ka). Interestingly, of the palaeoceano-graphic proxy time series, the coarse fraction recordcontains significant spectral peaks at the three climaticprecession frequencies, which were also established in thespliced record of Zachos et al. (2001b). We can now re-evaluate the fidelity of the �1:2Ma long obliquityamplitude modulation cycle that was already establishedfor the SusRef record (Shackleton et al., 1999; Palike et al.,2004). Throughout the record, the oxygen isotope data

ARTICLE IN PRESS
19 20 21 22 23 24 25
Age (Ma)Lag (kyr)
0.010.11 0.9 0.4
90% 99%
90% 99%
010 -1020304050
0
10
20
30
40
50
60
Freq
uenc
y (M
yr-1)
0
10
20
30
40
50
60
Freq
uenc
y (M
yr-1)
0
10
20
30
40
50
60
Freq
uenc
y (M
yr-1)
405
12696
41
2322
19
405
12696
41(54)
(29)
(54)
2322
19
405405
1261269696
4141
2323
(29)(29)
(54)(54)
2222
1919
BandwidthConfidence
90% 99%
Bandwidth
Confidence
ConfidenceBandwidth
90% 99%
ConfidenceBandwidth
Power PowerCoherency Coherency
ODP 926B δ18O
ODP 926B δ13C
Astronomy (La2004)
(a)
(b)
(c)
(d)
(e)
(f)
“1.2 Myr” obliquity
“2.4 Myr” eccentricity
ODP 926B asin coarse%/100
19 20 21 22 23 24 25
Age (Ma)
19 20 21 22 23 24 25
Age (Ma)
ODP 926B SusRef
10.10.4 0.9 0.01
Per
iod
(kyr
)P
erio
d (k
yr)
Period (kyr)Period (kyr)
180° 90° 0° -90° -180°
-δ18O−δ13Ccoarse(%)-SusRef
Phase (°) relative to ETPlag lead
−δ13C −δ18O
“1.2 Myr” obliquity
“2.4 Myr” eccentricity
Fig. 3. (a) and (b) log-power spectrum of benthic �d13C and �d18O time series, determined by the multi-taper method with robust red-noise background
for significance testing (Ghil et al., 2002). Prior to analysis the record was linearly detrended, and a Gaussian notch filter removed periods longer than
�1Ma. The time series was interpolated at equal time steps, using the average sample resolution ð�4 kaÞ. Also shown are coherency estimates between
data and astronomical eccentricity, tilt and precession mix (ETP), using the Blackman–Tukey method, with 437 lags (20% of series from 17.86 to 26.5Ma).
Confidence levels are shown for the spectra (solid 99%, dashed 90%), and the coherency estimates (95%). All Milankovitch frequencies are represented
and significant. Oxygen isotope data show a relatively stronger signal at the climatic precession frequencies in the younger half of the record. Also shown
are evolutive multi-taper method log-power spectra for �d13C, �d18O on the same frequency scale. (c) Blackman–Tukey cross-spectral phase estimates
between stable isotopes and astronomical ETP curve, converted from phase angles to lag times in ka, and shown with 95% confidence intervals (Paillard et
al., 1996). Both isotope series were inverted prior to analysis, following convention (Zachos et al., 2001b). The carbon and oxygen isotope data are exactly
out of phase at the obliquity frequency only. For precession the phase angles are essentially zero. For long eccentricity (405 ka) periods, there is a relative
lag of �d13C compared to �d18O of �25 ka, similar to previous results from the late Oligocene, including an apparently increasing lag of d13C compared
to �d18O going from the shorter (96 ka) to the long (405 ka) eccentricity period (Zachos et al., 2001b; Billups et al., 2004). Also shown is the evolutive
spectrum of ETP, re-sampled at the resolution of the data. (d) and (e) Evolutive multi-taper method log-power spectra for transformed percent coarse
fraction and combined magnetic susceptibility and lightness data (Palike et al., 2004), as in (a) and (b). (f) Cross-phase estimates for all data sets as phase
angles (within their 95% confidence envelopes).
H. Palike et al. / Quaternary Science Reviews ] (]]]]) ]]]–]]]6
display obliquity cycle amplitude variations co-varyingwith the astronomical target curve. Minima in theamplitude of the �41 ka cycle of the astronomical dataare indicated by dark shaded lines in Fig. 3. This patternalso fits for the benthic carbon isotope record. Theevolutive spectrum of the coarse fraction record alsodisplays the �2:4Ma long amplitude modulation of
eccentricity at the climatic precession frequency bands.This feature is also apparent in the amplitude variation ofthe �405 ka long eccentricity cycle for the benthic carbonisotope data. Phase relationships between astronomicaland geological data are similar to previous results (Zachoset al., 2001b), as shown in Fig. 3(c) and (f). The climaticprecession component of the tuning data set SusRef is in

ARTICLE IN PRESS
123
771,451PDO81
)46.0+‰(O
1-012
771,451PDO31
)‰(C
C5DnC5Dr.1nC5En
C6n
C6An.1n2n
2n
2n
2n
2n
C6AanC6Aar.1nC6Bn.1nC6Cn.1n3n
C7n.1n
71
81
91
02
12
22
32
42
52
62
Age
(M
a)
gaMP771PDO
1-01231
)‰(C
)b,a1002.latesohcaZ(
123
81)46δ
δ
δδ
.0+‰(O
)b,a1002.latesohcaZ(
(a) (b) (c) (d) (e)
Fig. 4. Comparison of equatorial Atlantic ODP 154 data set with previous
global multi-site compilations (that include ODP 154 data) and previously
published data from the Southern Ocean: (a) magnetic reversal data from
ODP Site 1090 (Billups et al., 2004). (b) Previous d13C data from ODP 154
as published in Zachos et al. (2001b), compared with a multi-site
compilation (Zachos et al., 2001a) that was age adjusted to new reversal
ages. The data from Zachos et al. (2001b) use an older astronomical
solution (Laskar et al., 1993; Shackleton et al., 1999). (c) d13C data from
ODP 1090 (Billups et al., 2004) and independently age calibrated data
from this study, using the more recent astronomical solution Laskar et al.
(2004). (d) As in (c) but for d18O. (e) As in (b) but for d18O.
H. Palike et al. / Quaternary Science Reviews ] (]]]]) ]]]–]]] 7
phase with the astronomical target. The obliquity is inphase between the lithological data set and the coarsefraction record with respect to lagged obliquity. Thebenthic oxygen isotope data show a further lag of about3–4 ka at the obliquity frequency, while carbon isotopedata are almost 1801out of phase with the oxygen isotopedata. This is in contrast to the eccentricity periods, whereoxygen and carbon isotopes co-vary, and also to observa-tions from other localities spanning the same time interval(Billups et al., 2004). In terms of absolute phase lags (inka), it is interesting to note that the lag of the carbonisotopes in particular increases with increasing cycleperiods, an observation that is compatible with thepredictions of box models of the carbon cycle if forcedby astronomy, specifically with respect to the size of thecarbon reservoir and its preferential filtering of longerperiods due to the residence time of carbon in the oceans(Palike, unpublished results, using a modified version of theWalker and Kasting, 1992 model).
3.3. Comparison with Southern Ocean record and global
compilation
We can now compare our extended tuned records withone that was recently developed for a benthic stable isotopedata set from ODP Leg 177, Site 1090, Southern Ocean,Atlantic sector (Billups et al., 2002, 2004), which also usedthe new astronomical solution of Laskar et al. (2004) as atuning target. The comparison of our data set with thatfrom the Southern Ocean is shown in Fig. 4. The recordfrom ODP Leg 177 contained a well-defined data set ofmagnetic polarity measurements (Channell et al., 2003),and the ages obtained for ODP Leg 154 can be used torefine the geomagnetic polarity time scale (Cande andKent, 1995). The age models for our present study and thatof Billups et al. (2004) were obtained independently, yetshow a close match, particularly of the carbon isotoperecord (Fig. 4). As discussed by Billups et al. (2004), acrossthe Oligocene/Miocene interval the basin-to-basin offset ofcarbon isotope values is virtually absent, even 5 millionyears into the Miocene. The Southern Ocean oxygenisotope values show a consistent heavy offset of �0:5%with respect to the equatorial Atlantic values. Fig. 4 alsoshows a comparison of our extended data set with theglobal multi-site compilation of Zachos et al. (2001a). Theoriginal data set from Zachos et al. (2001b) made up a largeportion of the global compilation curve back to �25Ma onour new time scale. As shown by Lear et al. (2004) using anew data set from the equatorial Pacific, the apparent ‘‘lateOligocene warming’’ that is suggested by the globalcompilation is largely artefact of using ODP Leg 154 datafor ages younger than �25Ma, and sub-Antarctic data forthe older part of the Oligocene. The stable isotope datapresented here show a much more gradual and smallerdecrease towards lighter values over more than 4 millionyears before the onset of Mi–1. We provide a close-up ofthe isotope data sets in Fig. 5, which compares the
independently age-calibrated data sets from ODP Site1090 (Billups et al., 2004), ODP Hole 929A (Zachos et al.,2001b) and our study that uses data from ODP Hole 926B.In most cases the oxygen and carbon isotope data showthat the three records agree down to the obliquity scalelevel of variations. The new astronomical solution La2004(Laskar et al., 2004) does still exhibit a node in theobliquity amplitude variation, but this is not as pro-nounced during the Mi–1 event as previous astronomicalsolutions. Thus, in order to explain the magnitude of Mi–1compared to previous and following obliquity nodes afurther pre-conditioning, for example through a decline ofatmospheric pCO2 concentrations at this time is required(Deconto and Pollard, 2003).

ARTICLE IN PRESS
1
2
3
OD
P 1
77, H
oles
109
0D,E
δ18
O (
‰+
0.64
)ODP 1090D,E
Hole 926B
0
1
2
OD
P 1
77, H
oles
109
0D,E
δ13
C (
‰)
C6C
n.1n
2n
Sphenolithus delphixS. disbelemnos S. ciperoensis
3n C7n
.1n
2n
23 24Age (Ma)O
DP
177
P
Mag
1
2
3
OD
P 1
54, H
ole
926B
δ
18O
(‰
+0.
64) ODP 926B
0
1
2 O
DP
154
Hol
es 9
26B
,929
A
δ13
C (
‰)
ODP 1090D,EODP 929AODP 926B
020
Hol
e 92
9A%
Sph
enol
iths
22
24
Obl
iqui
ty (
deg)
6420
8
Ecc
entr
icity
(%
)
Mi-1 “Event”
Miocene Oligocene
(a)
(b)
(c)
(d)
(e)
(f)
Fig. 5. Close-up of data around Oligocene–Miocene boundary data between 22.4 and 243Ma on our revised time scale. (a) Eccentricity (b) obliquity
calculations from Laskar et al. (2004), including the �1:2Ma obliquity amplitude envelope. (c) d18O data from ODP Site 1090 (Billups et al., 2004), and
the data of this study from Hole 926B. (d) Nannofossil biostratigraphy from Holes 929A (Raffi, 1999; Shackleton et al., 2000) and 926B (Fornaciari,
1996). (e) d13C data from ODP Site 1090 (Billups et al., 2004), and the data of this study from Hole 926B, compared against previously published data
from Hole 929A (Zachos et al., 2001b). (f) Magnetic reversal data from ODP Site 1090 (Channell et al., 2003; Billups et al., 2004). The time scales for ODP
Legs 177 and 154 were obtained independently. The O/M boundary position can be determined by the oxygen isotope excursion, the older end of
magnetochron C6Cn.2n (found at ODP 1090, and correlated to Leg 154 via isotope stratigraphy), and the nannofossil biostratigraphy (just above the last
appearance of S. delphix). The older end of C6Cn.2n has been assigned an age of 23.03Ma. The shaded area corresponds to the extent of the Mi–1 event,
as plotted in Zachos et al. (2001b). The vertical grey line marks the position of the Oligocene/Miocene boundary based on the base of the magnetochron
C6Cn.2n from ODP Site 1090, which correlates well to ODP Site 926 through the isotope stratigraphy.
H. Palike et al. / Quaternary Science Reviews ] (]]]]) ]]]–]]]8
3.4. Evaluation of amplitude modulations
Our new age model suggests a re-evaluation of theastronomical signature in the geological data as encoded bythe amplitude modulation terms of obliquity and eccen-tricity (Laskar, 1999; Shackleton et al., 1999; Palike et al.,2004). The results of complex demodulation at theobliquity frequency are presented in Fig. 6(a). This analysisshows that the �1:2Ma amplitude modulation of the�41 ka obliquity signal is present, and approximately inphase with the astronomical solution, for all four timeseries analysed. The results here also confirm the analysisby Palike et al. (2004). We also computed the amplitudevariation at the climatic precession frequency, which ismodulated by the short and long eccentricity, as well as alonger �2:4Ma long term (Laskar, 1999). Here, weextracted the �405 ka amplitude modulation term, aspresented in Fig. 6(b). Apart from an interval around20Ma the data modulation is again in phase with theastronomical modulation, and the data sets also suggest thepresence of the longer multi-million year modulationbetween �21:4 and 23.8Ma. We did not analyse the
climatic precession frequency for the stable carbon isotopedata as this signal is not significantly above the noisebackground (Fig. 3(a)), presumably due to the low-passfiltering nature of the oceanic carbon reservoir.
3.5. Enhanced variability of carbon isotope data prior to ca.
25.75 Ma
The carbon isotope data show enhanced variabilitybefore around 25.75Ma (Figs. 2 and 4). At first sight, thesedata look like a larger noise contribution, and their localnature is suggested by the absence of this larger variabilityin records from the Pacific (Palike et al., unpublished data).However, on closer inspection the variability cannot simplybe explained by individual data point outliers. Instead, theenhanced variability appears to closely follow an astro-nomical forcing (Fig. 7). The analysis shows a strongobliquity imprint in the 41% d13C variations. In contrastto the remainder of the data set, here the phase relationshipbetween carbon isotopes and astronomical obliquity isreversed, such that light carbon isotope values correspondto low obliquity and insolation. There are two possible

ARTICLE IN PRESS
-3
-2
-1
0
1
2
3
Obl
iqui
ty d
emod
ulat
ion
Ast
rono
my
(sta
ndar
dise
d)
-3
-2
-1
0
1
2
3
Obl
iqui
ty d
emod
ulat
ion
D
ata
(sta
ndar
dise
d)
SusRefAstronomy (ETP) coarse fraction δ13C δ18O
-3
-2
-1
0
1
2
3
Pre
cess
ion
dem
odul
atio
n
Ast
rono
my
(sta
ndar
dise
d)
19 20 21 22 23 24 25 26
Age (Ma)
-3
-2
-1
0
1
2
3
Pre
cess
ion
dem
odul
atio
n
Dat
a (s
tand
ardi
sed)
19 20 21 22 23 24 25 26
(a)
(b)
Fig. 6. Comparison of amplitude modulation between astronomical
solution and ODP 154 data: (a) obliquity amplitude complex demodula-
tion (Bloomfield, 1976) implemented using the software ‘‘TRIP’’
(Gastineau and Laskar, 2005). The data and astronomical solution were
demodulated at a period of �40:17 ka, and from the demodulation the
�1:2Ma amplitude modulation was extracted, and normalised to standard
deviation and zero mean. (b) Climatic precession/eccentricity amplitude
complex demodulation. The data and astronomical solution were
demodulated at a period of �18:8 ka, and from the demodulation the
�400ka amplitude modulation was extracted, and normalised to standard
deviation and zero mean.
-3-2-10123
ET
P
-0.4
-0.2
0
0.2
0.4
25.6 25.8 26
Age (M
-2
-1
0
1
2
ET
P
obliq
uity
filte
r
E
TP
clim
. pre
c. fi
lter
Fig. 7. Close-up view of benthic d13C between 25.5 and 26.5Ma. Top panel sho
the interval that shows unusually strong carbon isotope fluctuations (see Figs. 1
bandpass filter centred around the climatic precession frequencies ð47� 9Ma
bandpass filter centred on the main obliquity frequency ð25� 5Ma�1Þ. Results
local process.
H. Palike et al. / Quaternary Science Reviews ] (]]]]) ]]]–]]] 9
explanations for the low values: (1) a ‘‘Mackensen’’(Mackensen et al., 1993) effect possibly associated withmore frequent algal blooms, or (2) systematic shifts inCibicidoides species abundances towards those with moredepleted values. In this interval, because of the lack of C.mundulus, species were mixed to generate sufficientcarbonate for isotope analysis. Either of these artefactscould be related to local responses to changes inastronomical forcing (i.e., the strength of the trade winds).In addition, d13C minima coincide with coarse fractionminima over this interval, indicating the possibility of anenhanced influx of corrosive water.
4. Discussion
4.1. Glaciation events and orbital confluences
We previously suggested that the Mi–1 glaciation eventat 23Ma was related to a rare confluence of reducedobliquity amplitude variations (a obliquity ‘‘node’’) incombination with low eccentricity (Zachos et al., 2001b).The new data presented here as well as the newastronomical solution used allow us to refine our previousfindings. First, in the new astronomical solution, there isstill an obliquity node at 23Ma, however, it is not aspronounced as it was in the previous astronomicalcalculation of Laskar et al. (1993). In the new solution ofLaskar et al. (2004), the most extreme obliquity nodesoccur at around 19.7, 20.7, 24.4 and 25.4Ma (Fig. 2). Ourage model is sufficiently robust to exclude the possibilitythat the age for Mi–1 has to be re-assigned to either 24.4 or20.7Ma. At most obliquity nodes (but not all) we doindeed observe isotope excursions toward more heaviervalues in d13C and d18O, however, our data suggest that the
δ13C
clim
. pre
c. fi
lter
26.2 26.4
a)
δ13C
obliq
uity
filte
r
-1.0
-0.5
0.0
0.5
δ13 C
ws carbon isotope data (dashed green) and astronomical ‘‘ETP’’ curve for
and 2). Middle panel shows these two time series after applying a gaussian�1Þ. Bottom panel shows these two time series after applying a gaussian
suggest that strong local d13C fluctuations are at least partly driven by a
ARTICLE IN PRESSH. Palike et al. / Quaternary Science Reviews ] (]]]]) ]]]–]]]10
link between astronomy and climatic excursions is moreintricate than previously suggested, and agrees well withthe finding by Wade and Palike (2004) from an earlier partof the Oligocene that glacial conditions are most readilyobserved when the climate system is pre-conditioned bylow obliquity amplitude variations, and then triggered byindividual �110 and 405 ka eccentricity extremes. Thisrelationship is now also found for the main mid-MioceneMi–3b cooling event (Abels et al., 2005; Holbourn et al.,2005). Existing and new data from the Pacific suggest thatthe entire Oligocene was globally dominated by a strong�405 ka cycle, particularly in the benthic isotope record,and that glaciations are typically enhanced during mostobliquity nodes. For example, the extreme glaciation eventOi–1, during long 405 ka eccentricity cycle 84 OlC13n, wasalso pre-conditioned by an obliquity node (Coxall et al.,2005). Further modeling studies are in progress that willelucidate the link between astronomical forcing of theoceanic carbon cycle and the carbon and oxygen benthicisotope records. Support for the view that the long-termobliquity amplitude variations have a profound influenceon the climate system is provided by the observation thatthe strength of coarse fraction variations co-evolves withthe obliquity amplitude(Paul et al., 2000, our Fig. 6(a)).
4.2. Evolution of coarse fraction record and astronomical
forcing
An interesting observation is that our coarse fractionrecord from Hole 926B shows a much stronger response atthe climatic precession frequencies than any of the otherdata sets (Fig. 3(d)), although the signal at eccentricityfrequencies, which should modulate the strength of theprecession cycle, is much weaker. We interpret the strengthof the climatic precession cycle in the coarse fraction record
0
5
10
15
20
Site
926
>65
µm(%
)
-10
0
10
20
926-
929
>65
µ m
(%)
21 22 23
Age (M
∆
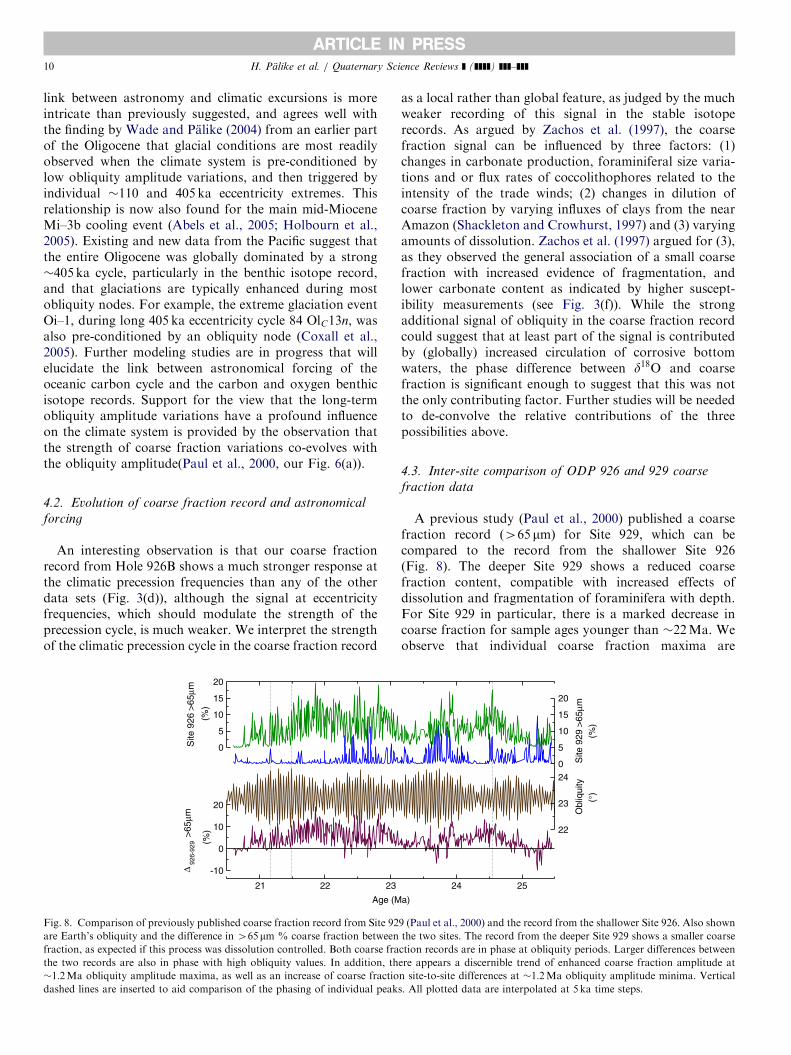
Fig. 8. Comparison of previously published coarse fraction record from Site 92
are Earth’s obliquity and the difference in 465mm % coarse fraction between
fraction, as expected if this process was dissolution controlled. Both coarse fra
the two records are also in phase with high obliquity values. In addition, th
�1:2Ma obliquity amplitude maxima, as well as an increase of coarse fractio
dashed lines are inserted to aid comparison of the phasing of individual peak
as a local rather than global feature, as judged by the muchweaker recording of this signal in the stable isotoperecords. As argued by Zachos et al. (1997), the coarsefraction signal can be influenced by three factors: (1)changes in carbonate production, foraminiferal size varia-tions and or flux rates of coccolithophores related to theintensity of the trade winds; (2) changes in dilution ofcoarse fraction by varying influxes of clays from the nearAmazon (Shackleton and Crowhurst, 1997) and (3) varyingamounts of dissolution. Zachos et al. (1997) argued for (3),as they observed the general association of a small coarsefraction with increased evidence of fragmentation, andlower carbonate content as indicated by higher suscept-ibility measurements (see Fig. 3(f)). While the strongadditional signal of obliquity in the coarse fraction recordcould suggest that at least part of the signal is contributedby (globally) increased circulation of corrosive bottomwaters, the phase difference between d18O and coarsefraction is significant enough to suggest that this was notthe only contributing factor. Further studies will be neededto de-convolve the relative contributions of the threepossibilities above.
4.3. Inter-site comparison of ODP 926 and 929 coarse
fraction data
A previous study (Paul et al., 2000) published a coarsefraction record ð465 mmÞ for Site 929, which can becompared to the record from the shallower Site 926(Fig. 8). The deeper Site 929 shows a reduced coarsefraction content, compatible with increased effects ofdissolution and fragmentation of foraminifera with depth.For Site 929 in particular, there is a marked decrease incoarse fraction for sample ages younger than �22Ma. Weobserve that individual coarse fraction maxima are
0
5
10
15
20
Site
929
>65
µm(%
)
24 25
a)
22
23
24
Obl
iqui
ty(°
)
9 (Paul et al., 2000) and the record from the shallower Site 926. Also shown
the two sites. The record from the deeper Site 929 shows a smaller coarse
ction records are in phase at obliquity periods. Larger differences between
ere appears a discernible trend of enhanced coarse fraction amplitude at
n site-to-site differences at �1:2Ma obliquity amplitude minima. Vertical
s. All plotted data are interpolated at 5 ka time steps.

ARTICLE IN PRESSH. Palike et al. / Quaternary Science Reviews ] (]]]]) ]]]–]]] 11
approximately in phase with obliquity maxima, consistentwith the observation that glacial maxima are correlatedwith obliquity maxima, and with a higher carbonate ionconcentration and deeper lysocline. We also calculated thedifference between the age interpolated records (Site 926minus Site 929 coarse fraction). As a general trend, weobserve that this indicator of depth-dependent dissolution(i.e., a deeper lysocline) decreases during maxima of the�1:2Ma long obliquity amplitude modulation. In theupper half of the record, we also observe that the obliquitycycles manifested in the coarse fraction records from thetwo sites have not cancelled out after taking the difference,partly due to coarse fraction that is close to zero forSite 929.
5. Summary
The extension of the original data set from Zachos et al.(1997) presented here, in combination with a refinedastronomically calibrated age model, provides a standardreference section for a time during Earth’s history whereperiodic glacial advances and retreats on Antarctica wereextremely sensitive to variations in the boundary condi-tions, such as astronomical insolation forcing. The recordspresented here provide a degree of chronostratigraphiccontrol around the Oligocene/Miocene transition that waspreviously exclusive to the Quaternary. Pioneering thecombination of astronomical age models by N. J.Shackleton with very high-resolution stable isotope mea-surements is one of the strongest contributions and turningpoints in the Earth System Science that only now are webeginning to exploit to its full extent.
Acknowledgements
This paper is dedicated to Professor Sir Nicholas J.Shackleton, FRS, for his pioneering and seminal work indeveloping an astronomically calibrated geological timescale, and for his continuous enthusiastic support to ourwork. We thank Brandon Murphy, Appy Sluijs, JasonNewton and Robert Becker (deceased) for technicalsupport. This research used samples and data providedby the Ocean Drilling Program (ODP). ODP (now IODP)is sponsored by the US National Science Foundation(NSF) and participating countries under the managementof Joint Oceanographic Institutions (JOI), Inc. Supportedby the National Science Foundation (EAR-9725789,OCE-0117532). We thank B. Flower and an anonymousreviewer for improving a previous version of this manu-script. We thank Isabella Raffi for suplying biostrati-graphic data.
References
Abels, H.A., Hilgen, F.J., Krijgsman, W., Kruk, R.W., Raffi, I., Turco,
E., Zachariasse, W.J., 2005. Long-period orbital control on middle
Miocene global cooling: integrated stratigraphy and astronomical
tuning of the Blue Clay Formation on Malta. Paleoceanography 20,
PA4012.
Berger, A., Loutre, M.F., Tricot, C., 1993. Insolation and Earth’s orbital
periods. Journal of Geophysical Research 98 (D6), 10341–10362.
Billups, K., Channell, J.E.T., Zachos, J.C., 2002. Late Oligocene to Early
Miocene geochronology and paleoceanography from the subantarctic
South Atlantic. Paleoceanography 17 (1).
Billups, K., Palike, H., Channell, J.E.T., Zachos, J.C., Shackleton, N.J.,
2004. Astronomical calibration of the Late Oligocene through Early
Miocene geomagnetic polarity time scale. Earth Planetary Science
Letters 224 (1–2), 33–44.
Bloomfield, P., 1976. Fourier Analysis of Time Series: An Introduction,
second ed. Wiley, New York.
Cande, S.C., Kent, D.V., 1995. Revised calibration of the geomagnetic
polarity timescale for the Late Cretaceous and Cenozoic. Journal of
Geophysical Research 100 (B4), 6093–6095.
Channell, J.E.T., Martin, E.E., 2003. Integrated chronostratigraphic
calibration of the Oligocene–Miocene boundary at 24:0� 0:1Ma from
CRP-2A drill core, Ross Sea, Antarctica: Comment. Geology (Online
Forum), e11. URL hhttp://www.gsajournals.org/i0091-7613-31-6-
e11.htmli.
Channell, J.E.T., Galeotti, S., Martin, E.E., Billups, K., Scher, H.D.,
Stoner, J.S., 2003. Eocene to Miocene magnetostratigraphy, biostrati-
graphy and chemostratigraphy at ODP Site 1090 (sub-Antarctic South
Atlantic). Geological Society American Bulletin 115, 607–623.
Coxall, H.K., Wilson, P.A., Palike, H., Lear, C.H., Backman, J., January
2005. Rapid stepwise onset of Antarctic glaciation and deeper calcite
compensation in the Pacific Ocean. Nature 433 (7021), 53–57.
Curry, W.B., Shackleton, N.J., Richter, C., et al., 1995. Proceedings of the
ODP, Init. Repts. vol. 154. Ocean Drilling Program, College Station,
TX.
DeConto, R.M., Pollard, D., 2003. Rapid Cenozoic glaciation of
Antarctica triggered by declining atmospheric CO2. Nature 421
(6920), 245–249.
Flower, B.P., Chisholm, K.E., 2006. Magnetostratigraphic calibration of
the Late Oligocene climate transition in Hole 1237B. In: Tiedemann,
R., Mix, A., Richter, C., Ruddiman, W. (Eds.), Science Research,
Proceedings of Ocean Drilling Progress, vol. 202. Ocean Drilling
Program, College Station, TX, in press. URL hhttp://www-odp.
tamu.edu/publications/202_SR/204/204.htmi.
Flower, B.P., Zachos, J.C., Paul, H., 1997. Milankovitch-scale variability
recorded near the Oligocene/Miocene Boundary: Hole 929A. In:
Shackleton, N.J., Curry, W.B., Richter, C., Bralower, T.J. (Eds.),
Proceedings of ODP Science Research. vol. 154. Ocean Drilling
Program, College Station, TX, pp. 433–439.
Flower, B.P., Zachos, J.C., Pearson, P.N., 2006. Astronomic and
oceanographic influences on global carbon cycling across the
Oligocene/Miocene boundary. Commemoration Volume in honor of
Professor M.S. Srinivasan, Oceanic Micropaleontology and Paleocea-
nography, in press.
Fornaciari, E., 1996. Biocronologia a nannofossil calcarei e stratigrafia ad
eventi nel Miocene italiano. Ph.D. thesis, University of Padova, Italy.
Gastineau, M., Laskar, J., 2005. TRIP 0.98. Manuel de reference TRIP,
IMCCE, Paris Observatory, hhttp://www.imcce.fr/Equipes/ASD/trip/
trip.htmli.
Ghil, M., Allen, R.M., Dettinger, M.D., Ide, K., Kondrashov, D., Mann,
M.E., Robertson, A., Saunders, A., Tian, Y., Varadi, F., Yiou, P.,
2002. Advanced spectral methods for climatic time series. Reviews in
Geophysics 40 (1), 3.1–3.41 URL hhttp://www.atmos.ucla.edu/tcd/ssa/i.
Holbourn, A., Kuhnt, W., Schulz, M., Erlenkeuser, H., 2005. Impacts of
orbital forcing and atmospheric carbon dioxide on Miocene ice-sheet
expansion. Nature 438, 483–487.
Laskar, J., 1999. The limits of Earth orbital calculations for geological
time-scale use. Royal Society of London Philosophical Transactions,
Series A 357 (1757), 1735–1759.
Laskar, J., Joutel, F., Boudin, F., 1993. Orbital precessional and
insolation quantities for the Earth from �20Ma to þ10Ma.
Astronomy and Astrophysics 270 (1–2), 522–533.

ARTICLE IN PRESSH. Palike et al. / Quaternary Science Reviews ] (]]]]) ]]]–]]]12
Laskar, J., Robutel, P., Joutel, F., Gastineau, M., Correia, A., Levrard,
B., 2004. A long term numerical solution for the insolation quantities
of the Earth. Astronomy and Astrophysics 428, 261–285.
Lear, C.H., Rosenthal, Y., Coxall, H.K., Wilson, P.A., 2004. Late Eocene
to early Miocene ice sheet dynamics and the global carbon cycle.
Paleoceanography 19, PA4015.
Lourens, L.J., Wehausen, R., Brumsack, H.J., 2000. Geological con-
straints on tidal dissipation and dynamical ellipticity of the Earth over
the past three million years. Nature 409, 1029–1033.
Lourens, L.J., Hilgen, F.J., Shackleton, N.J., Laskar, J., Wilson, D., 2005.
The Neogene Period. In: Gradstein, F., Ogg, J., Smith, A. (Eds.), A
Geological Time Scale 2004. Cambridge University Press, Cambridge,
pp. 409–440.
Mackensen, A., Hubberten, H.-W., Bickert, T., Fischer, G., Futterer,
D.K., 1993. The d13C in benthic foraminiferal tests of Fontbotia
wuellerstorfi (Schwager) relative to the d13C of dissolved inorganic
carbon in southern ocean deep water: implications for glacial ocean
circulation models. Paleoceanography 8 (5), 587–610.
Miller, K.G., Wright, J.D., Fairbanks, R.G., 1991. Unlocking the Ice
House—Oligocene–Miocene oxygen isotopes, eustasy, and margin
erosion. Journal of Geophysics Research Sol. Earth & Planets 96 (B4),
6829–6848.
Neron de Surgy, O., Laskar, J., 1997. On the long term evolution of the
spin of the Earth. Astronomy and Astrophysics 318, 975–989.
Paillard, D., Labeyrie, L., Yiou, P., 1996. Macintosh program performs
time-series analysis. EOS Transactions AGU 77, 379 URL hhttp://
www-lsce.cea.fr/soft-lsce/index-en.htmli.
Palike, H., Shackleton, N.J., 2000. Constraints on astronomical para-
meters from the geological record for the last 25Ma. Earth Planetary
Science Letters 182 (1), 1–14.
Palike, H., Laskar, J., Shackleton, N.J., 2004. Geologic constraints on the
chaotic diffusion of the solar system. Geology 32 (11), 929–932.
Paul, H.A., Zachos, J.C., Flower, B.P., Tripati, A., 2000. Orbitally
induced climate and geochemical variability across the oligocene/
miocene boundary. Paleoceanography 15 (5), 471–485.
Pearson, P.N., Shackleton, N.J., Weedon, G.P., Hall, M.A., 1997.
Multispecies planktonic foraminifer stable isotope stratigraphy
through Oligocene/Miocene boundary climatic cycles, Site 926. In:
Shackleton, N.J., Curry, W.B., Richter, C., Bralower, T.J. (Eds.),
Proceedings of ODP Science Research, vol. 154. Ocean Drilling
Program, College Station, TX, pp. 441–449.
Raffi, I., 1999. Precision and accuracy of nannofossil biostratigraphic
correlation. Philosophical Transactions of Royal Society of London,
Series A 357 (1757), 1975–1993.
Shackleton, N.J., Crowhurst, S.J., 1997. Sediment fluxes based on an
orbitally tuned time scale 5Ma to 14Ma, Site 926. In: Shackleton, N.,
Curry, W., Richter, C., Bralower, T. (Eds.), Scientific Results, Ocean
Drilling Program, Leg 154. Ocean Drilling Program, College Station,
TX, pp. 69–82.
Shackleton, N.J., Curry, W.B., Richter, C., Bralower, T.J., (Eds.), 1997.
Proceedings of ODP, Science Results. vol. 154. Ocean Drilling
Program, College Station, TX.
Shackleton, N.J., Crowhurst, S.J., Weedon, G.P., Laskar, J., 1999.
Astronomical calibration of Oligocene–Miocene time. Philosophical
Transactions of Royal Society of London Series A 357 (1757),
1907–1929.
Shackleton, N.J., Hall, M.A., Raffi, I., Tauxe, L., Zachos, J., 2000.
Astronomical calibration age for the Oligocene/Miocene boundary.
Geology 28 (5), 447–450.
Varadi, F., Runnegar, B., Ghil, M., 2003. Successive refinements in long-
term integrations of planetary orbits. Astrophysical Journal 592,
620–630.
Wade, B.S., Palike, H., 2004. Oligocene climate dynamics. Paleoceano-
graphy 19 (4), PA4019.
Walker, J.C.G., Kasting, J.F., 1992. Effects of fuel and forest conservation
on future levels of atmospheric carbon dioxide. Palaeogeography
Palaeoclimatology Palaeoecology 97 (3), 151–189.
Weedon, G.P., 2003. Time-Series Analysis and Cyclostratigraphy. Cam-
bridge University Press, Cambridge.
Weedon, G.P., Shackleton, N.J., Pearson, P.N., 1997. The Oligocene time
scale and cyclostratigraphy on the Ceara Rise, Western Equatorial
Atlantic. In: Proceedings of ODP, Science Research, vol. 154. Ocean
Drilling Program, College Station, TX, pp. 101–114.
Wilson, G.S., Lavelle, M., McIntosh, W.C., Roberts, A.P., Harwood,
D.M., Watkins, D.K., Villa, G., Bohaty, S.M., Fielding, C.R.,
Florindo, F., Sagnotti, L., Naish, T.R., Sherer, R.P., Verosub, K.L.,
2002. Integrated chronostratigraphic calibration of the Oligocene–
Miocene boundary at 24:0� 0:1Ma from CRP-2A drill core, Ross
Sea, Antarctica. Geology 30 (11), 1043–1046.
Zachos, J.C., Flower, B.P., Paul, H.A., 1997. Orbitally paced climate
oscillations across the Oligocene/Miocene boundary. Nature 388,
567–570.
Zachos, J.C., Pagani, M., Sloan, L., Thomas, E., Billups, K., 2001a.
Trends, rhythms, and aberrations in global climate 65Ma to present.
Science 292 (5517), 686–693.
Zachos, J.C., Shackleton, N.J., Revenaugh, J.S., Palike, H., Flower, B.P.,
2001b. Climate response to orbital forcing across the Oligocene–Mio-
cene boundary. Science 292 (5515), 274–278.