extending optical methane leak detection to mobile platforms
TRANSCRIPT

PSI-SR-1203
Extending Optical Methane Leak Detection to Mobile Platforms
B.D. Green M.B. Frish
M.C. Laderer G. Midgley
B.D. Green, M.B. Frish, M.C. Laderer, G. Midgley, "Extending Optical Methane Leak Detection to Mobile Platforms ," presented at Natural Gas Technologies 2005 (Orlando, FL), (30 January - 2 February2005).
Copyright © 2005 Physical Sciences Inc.
All rights reserved
Downloaded from the Physical Sciences Inc. Library. Abstract available at http://www.psicorp.com/publications/sr-1203.shtml

1
EXTENDING OPTICAL METHANE LEAK DETECTION TO MOBILE PLATFORMS
B.D. Green, M.B. Frish, and M.C. Laderer
Physical Sciences Inc. 20 New England Business Center
Andover, MA 01810-1077 U.S.A.
G. Midgley
Heath Consultants Inc. ABSTRACT We have developed a handheld natural gas leak survey tool and the experimental model or an urban mobile survey tool as previously reported at this conference. We report here data from demonstrations of natural gas leak detection from a mobile platform in support of transmission pipeline monitoring. Data from a wide rate of leak sizes, illumination conditions, and viewing geometries (as collected at the RMOTC facility) will be used to demonstrate technique sensitivity and robustness. We will also present our concept for extending this technology to a high altitude aerial platform that will permit wide area survey. This effort is supported by the DoE NETL at Morgantown, WV.
2
1. INTRODUCTION The US natural gas transmission system comprises approximately 250,000 miles of pipeline, 1700 transmission stations and 17,000 compressors. This transmission system serves local distribution companies that operate some 500-1000 gate stations supplying roughly 132,000 surface metering and pressure regulation sites stationed along 1,000,000 miles of distribution pipeline terminating at 61,000,000 end-user customer meters. Maintaining the security and integrity of this system is a continual process of searching for, locating, and repairing leaks.
Leak surveying is very labor intensive, in part because all currently available natural gas
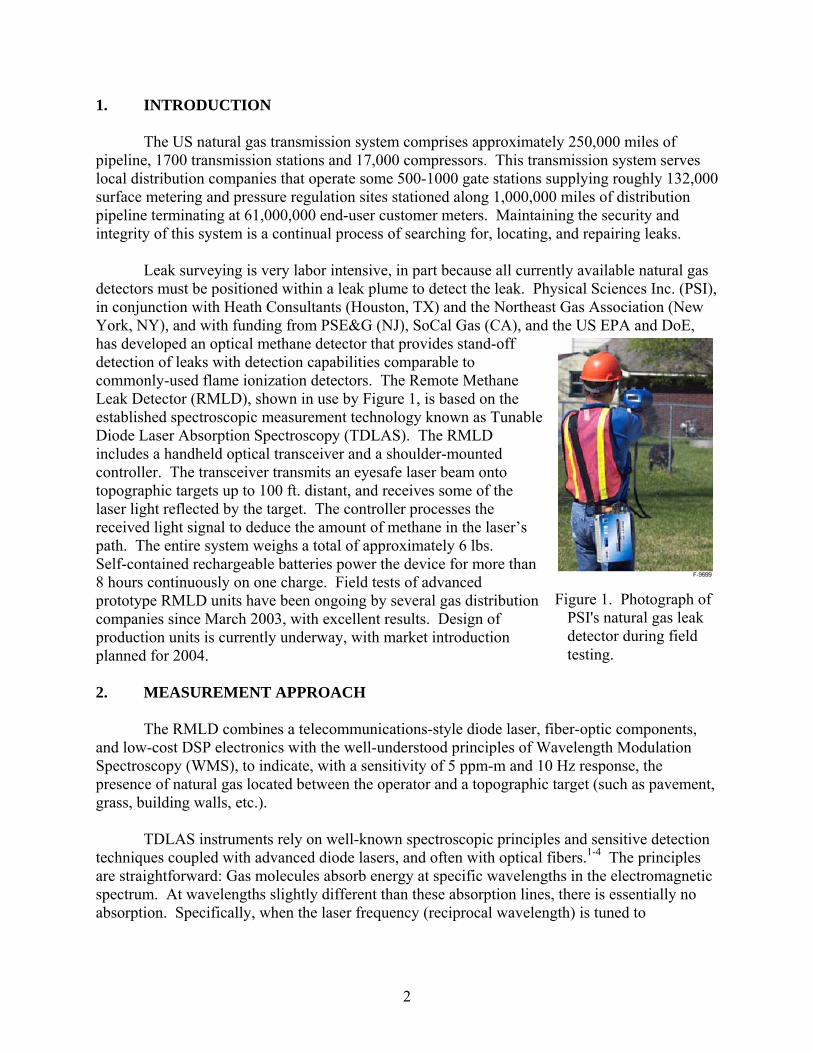
detectors must be positioned within a leak plume to detect the leak. Physical Sciences Inc. (PSI), in conjunction with Heath Consultants (Houston, TX) and the Northeast Gas Association (New York, NY), and with funding from PSE&G (NJ), SoCal Gas (CA), and the US EPA and DoE, has developed an optical methane detector that provides stand-off detection of leaks with detection capabilities comparable to commonly-used flame ionization detectors. The Remote Methane Leak Detector (RMLD), shown in use by Figure 1, is based on the established spectroscopic measurement technology known as Tunable Diode Laser Absorption Spectroscopy (TDLAS). The RMLD includes a handheld optical transceiver and a shoulder-mounted controller. The transceiver transmits an eyesafe laser beam onto topographic targets up to 100 ft. distant, and receives some of the laser light reflected by the target. The controller processes the received light signal to deduce the amount of methane in the laser’s path. The entire system weighs a total of approximately 6 lbs. Self-contained rechargeable batteries power the device for more than 8 hours continuously on one charge. Field tests of advanced prototype RMLD units have been ongoing by several gas distribution companies since March 2003, with excellent results. Design of production units is currently underway, with market introduction planned for 2004. 2. MEASUREMENT APPROACH The RMLD combines a telecommunications-style diode laser, fiber-optic components, and low-cost DSP electronics with the well-understood principles of Wavelength Modulation Spectroscopy (WMS), to indicate, with a sensitivity of 5 ppm-m and 10 Hz response, the presence of natural gas located between the operator and a topographic target (such as pavement, grass, building walls, etc.). TDLAS instruments rely on well-known spectroscopic principles and sensitive detection techniques coupled with advanced diode lasers, and often with optical fibers.1-4 The principles are straightforward: Gas molecules absorb energy at specific wavelengths in the electromagnetic spectrum. At wavelengths slightly different than these absorption lines, there is essentially no absorption. Specifically, when the laser frequency (reciprocal wavelength) is tuned to
Figure 1. Photograph of PSI's natural gas leak detector during field testing.

3
correspond to a particular absorption transition of the target gas molecule, the transmitted light is attenuated according to the Beer-Lambert relation: [ ]lNS(T)gII )(exp 00, νννν −−= (1) where Iv is the transmitted intensity at frequency ν after propagating through a gas path l , Iν,0 is the initial laser intensity, S(T) is the temperature-dependent absorption line-strength (a funda-mental spectroscopic property of the molecule), N is the target species number density, and g(ν - ν0) is the absorption lineshape (describing the spread in frequency of the transition strength). The argument of the exponential function is the fractional change in the laser intensity across the measurement path and is conventionally known as the absorbance. By (1) transmitting a beam of light through a gas mixture sample containing a quantity of the target gas, (2) tuning the beam’s wavelength to one of the target gas’s absorption lines, and (3) accurately measuring the absorption of that beam, one can deduce the concentration of target gas molecules integrated over the beam's path length. This measurement is often expressed in units of ppm-m. Practical and robust commercial TDLAS instrumentation came into existence during the 1990's, made possible by the advent of reliable monochromatic near-infrared (NIR, 1.2 to 2.5 µm, or 4000 to 8500 cm-1) diode lasers that operate continuously and unattended near room temperature. These lasers (specifically the distributed feedback, or DFB, variety that include a grating-like optical element which forces each laser to emit light at a specified NIR wavelength) offer linewidths less than 0.003 cm-1, which is considerably narrower than molecular absorption linewidths that are typically 0.1 cm-1 at atmospheric pressure. Furthermore, by accurately controlling the laser temperature and the electrical current that powers the laser (the "injection current"), the laser wavelength may be tuned rapidly and precisely over a range of about ± 2 nm around its specified wavelength. Typically, each TDL system is built using a laser having a specific design wavelength chosen to optimize the sensitivity to a particular target gas. The wavelength is selected to correspond to a specific absorption line of the target analyte gas that is free of interfering absorption from other molecules.
Fast, sensitive detection of methane is accomplished using the technique of Wavelength Modulation Spectroscopy (WMS), wherein the laser's fast tuning capability is exploited to rapidly and repeatedly scan the wavelength across the selected gas absorption line. While this periodic wavelength modulation occurs, the fraction of emitted laser power that is transmitted through the atmosphere is monitored with a photodetector. When the wavelength is tuned to be off of the methane absorption line, the transmitted power is higher than when it is on the line. Because each cycle of the modulation causes the wavelength to cross the absorption feature twice, the resulting amplitude modulated signal is periodic with a fundamental frequency of twice the wavelength modulation frequency. In the literature, the fundamental component is called the 2f signal. Phase sensitive (lock-in) detection accurately measures the amplitude of the 2f signal, which depends on both the power of the transmitted beam and the path-integrated concentration of methane. 2f signals representing absorption of 1/100,000 of the average received laser power are detected routinely by this technique. The average value of the received laser power, PDC, is measured separately and utilized to normalize the 2f signal. The resulting ratio depends only on path-integrated concentration.

4
All of the circuitry and processing hardware required to operate the laser and implement WMS is, in the RMLD, contained on a single 6 inch square printed circuit board. All of the laser control, thermal control, signal processing, and data reporting functions are performed on this board, which draws only 1.5 W of power. The handheld RMLD was designed for a maximum range to the topographic target of 100 ft to accommodate several operational requirements, including weight, size, and power consumption. With this design, laser power collected from targets beyond 100 ft (30 m) is insufficient to provide a signal-to-noise ratio useful for detecting low-grade leaks. Furthermore, because the RMLD is designed to be comparable in sensitivity to FID, it is also sensitive to the natural methane in the ambient atmosphere, which is typically present at concentrations of about 2 ppm. Since the RMLD measures path-integrated concentration, the ambient methane can contribute up to 60 ppm-m (2 ppm x 30 m) of signal, which is comparable to the signal due to a small leak. With support from the US Department of Energy’s National Energy Technology Laboratory, PSI has built and demonstrated an enhanced RMLD intended for surveying streets curb-to-curb from a mobile vehicle. We report here the extension of this technology to the transmission pipeline survey application. 3. SIMULATED TRANSMISSION PIPELINE SURVEY TEST PARTICIPATION 3.1 Sensor System Physical Sciences Inc. (PSI) and our partner Heath Consultants Incorporated participated in the tests conducted under DoE National Energy Technology Laboratory sponsorship at the Rocky Mountain Oilfield Testing Center (RMOTC) during the week of September 13, 2004. The NETL recognized the potential to extend this technology to mobile detection so as to enable its application to transmission pipeline surveys. RMLD participated as a ground-based instrument during the tests at RMOTC. A photograph of the RMLD unit that participated in the RMOTC tests is shown in Figure 2. The control unit is connected to the optical transceiver via a single umbilical. Different surfaces reflect different amounts of light and so the maximum range will depend on the viewed surface. We have found the effective range to be at least 100 feet (30 meters) for most natural terrain and even paved surfaces, although often detection to 150 feet (45 meters) is possible. For walking survey applications, the proven sensitivity is at 10 ppm-m level. If insufficient signal is returned – a not valid indicator prohibits a survey area to be missed
Figure 2. Remote methane leak detector alpha prototype unit.

5
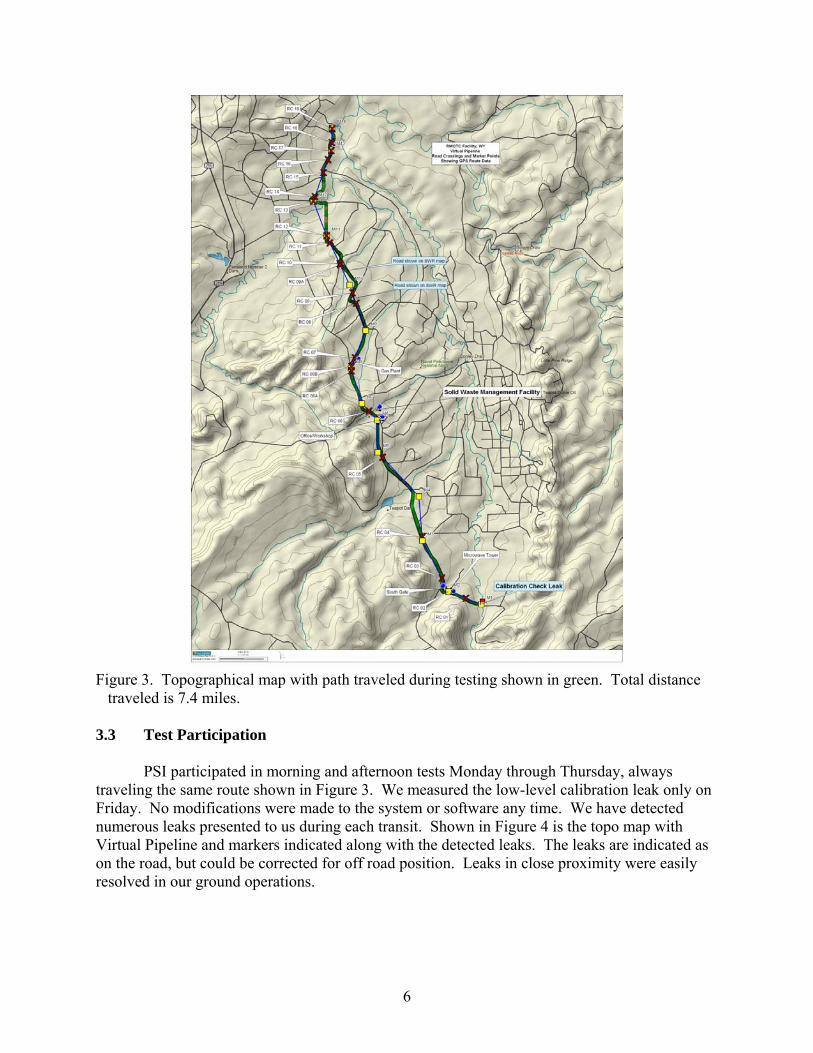
by accident. The RMLD is self-contained, operates an entire day on a battery charge. It has had extensive testing by researchers and LDC surveyors. One of the objectives of this test was to determine the effective range for a mobile survey application. Once you turn on RMLD power, all self checks are performed in 5 seconds, and you are ready to begin measurements. Each day we performed a performance verification test by viewing a methane containing enclosure. We performed the survey from the rear seat of a car (Chevy Suburban) rented for occasion. Little special preparation was required. The RMLD technology is well advanced. 3.2 Data Collection And Reduction Scheme For the development of a unit for mobile testing we transformed the electronics to permit more rapid sample collection and improved the user interface to permit more rapid and sensitive leak detection. In particular, we made use of an audio tone as a column concentration indicator. Our objective during the RMOTC tests was to determine the effectiveness of these changes in permitting detection at speeds far in excess of walking. However, because this was the first time we had participated in a testing of the mobile version of this unit, we chose to travel slowly in an attempt to optimize the detection of leaks, rather than test the maximum speed where the sensor would work. As a result we traveled at 8 to 10 miles per hour (13 to 16 kilometer per hour), and stopped to investigate and characterize each leak. For these tests we typically averaged 5 mph for the entire 7.4 mile course, but we believe that operating at 35 mph would produce the same level of detection. We had hoped to investigate the effect of viewing height (on the roof of the vehicle vs. inside), but this was not permitted due to safety constraints. All data were acquired with the surveyor sitting in the rear set of the vehicle looking sideward, viewing the terrain at the limit of RMLD range (about 100 feet) through the open rear windows. We used the audio tone as a rapid indicator of methane cloud detection. We also recorded numerous instrument performance indicators, returned signal levels and the detected concentration on a laptop computer in the front seat of the vehicle. Also operational in the vehicle was a GPS unit (Garmin Etrex, WAAS enabled) connected to a second laptop running a DeLorme topographical mapping software program. The Virtual Pipeline route, markers and road crossings were inserted into this display prior to the RMOTC testing. An example of a map created for the RMOTC tests is shown in Figure 3. These tools permitted the survey vehicle location to be instantaneously displayed with respect to the pipeline and a track of the entire driven route to be shown. When a leak was detected, a compact laser rangefinder (Bushnell Yardage Pro Sport Rangefinder) was used to estimate the range to the leak. The location of the survey vehicle when a leak was observed was entered onto the GPS map. We entered the detected leaks onto the test form provided each day, making note of the relative wind direction, magnitude of leak and other salient characteristics. Each test was a single traverse of the pipeline route.
6
Figure 3. Topographical map with path traveled during testing shown in green. Total distance
traveled is 7.4 miles. 3.3 Test Participation
PSI participated in morning and afternoon tests Monday through Thursday, always traveling the same route shown in Figure 3. We measured the low-level calibration leak only on Friday. No modifications were made to the system or software any time. We have detected numerous leaks presented to us during each transit. Shown in Figure 4 is the topo map with Virtual Pipeline and markers indicated along with the detected leaks. The leaks are indicated as on the road, but could be corrected for off road position. Leaks in close proximity were easily resolved in our ground operations.

7
Figure 4. Positions of survey vehicle when enhanced methane was observed on Monday,
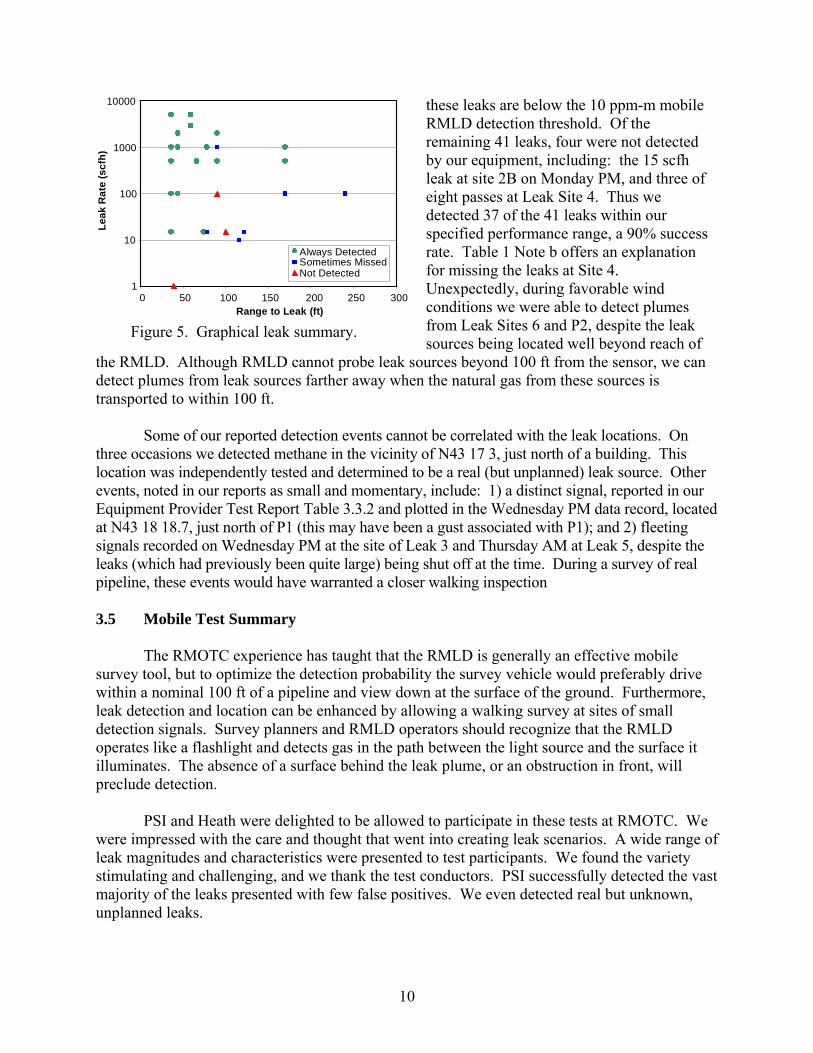
September 13, AM, ▲ PM. 3.4 Test Results Our findings are summarized in tabular form by Table 1 and its notes. Figure 5 displays the data graphically. There are 88 leaks identified in Table 1 that were active during our testing period. Nine of the 88 were at the calibration site. Thirty leaks (at Leak Sites 2C, 2D/1F, P2, 6, and P3) were located 100 ft or more from the road, beyond the RMLD’s specified detection range. 14 of those 30 were at or just beyond the 100 ft range and had small leak rates, 15 scfh or less. The data plotted in Figure 5 indicate that detection of these smaller leaks becomes increasingly challenging as distance increases beyond 70 ft. Eight leaks (at Leak Site P5) had flow rates of only 1 scfh, yielding gas concentrations of less than 3 ppm at 10 ft from the source. Plumes from

8
Table 1. Leak Detection Table
Site Range 9/13 9/14 9/15 9/16 9/17 Fraction Found
Rate am pm Rate am pm Rate am pm Rate am pm Rate am cal 36 5000 Y Y 1000 Y Y 500 Y Y 100 Y Y 15 Y 9/9 P5 39 1 N N 1 N N 1 N N 1 N N --- --- 0/8 3 44 1000 Y Y 2000 Y Y 100 Y ?f 2000 Y Y --- --- 7/7 5 59 2900 Y Y 5000 Y Y 5000 Y Y --- ?f --- --- --- 6/6 P4 66 500 Y Y 500 Y Y 500 Y Y 500 Y Y --- --- 8/8 2E 74 --- --- --- --- --- --- --- --- --- 15 Y Ya --- --- 2/2 2A 76 --- --- --- --- --- --- --- --- --- --- --- --- --- --- --- P1 78 1000 Y Y 1000 Y Y 1000 Y Y 1000 Y Y --- --- 8/8 2B 78 15 Ya N --- --- --- --- --- --- --- --- --- --- --- 1/2 4 90 100 Nb Nb 500 Y Y 2000 Y Y 1000 Nb Y --- --- 5/8 1Fc 100 --- --- --- --- --- --- 15 N N --- --- --- --- --- 0/2 2Dc 100 --- --- --- 15 N N --- --- --- --- --- --- --- --- 0/2 P3c 116 10 N N 10 N N 10 N Y 10 N Y --- --- 2/8 2Cc 122 --- --- --- --- --- --- 15 N N --- --- --- --- --- 0/2 6c,d 170 500 Y Y 100 N Y 1000 Y Y 500 Y Y --- --- 7/8 P2c 240 100 N N 100 N N 100 N Y 100 N Y --- --- 2/8
Notes to Table 1:
a) The PSI team recognized and noted brief intermittent very small gas detection signals at Leak Sites 2B and 2E during survey. The surveyors subjectively chose to not report these signals as positively-identified leaks. Subsequent data review shows a distinct rise in signal above the background at these sites. With knowledge that these were actual leaks, we now record them as successfully identified. In actual practice, when a questionable signal of this sort is detected, the surveyor would leave the vehicle and perform a more detailed investigation on foot.

9
Notes to Table 1 (Continued):
b) Our data show no indication of gas at Leak Site 4 on Monday AM, Monday PM, and Thursday AM. We readily identified Leak Site 4 at other times. On Monday, the combination of relatively small leak rate, location on a ridge above the road limiting opportunities for laser backscatter, and wind blowing from SW (perpendicularly away from the road), may have precluded detection of the leak plume. On Thursday, wind was again SW in the morning by NW, parallel to the road, in the evening. The NW wind facilitated detection.
c) Leak Sites 2C, 2D/1F, P2, 6, and P3 were too far from the road for normal detection with PSI equipment which has a nominal range of 100 ft. It appears that the NW wind Wednesday PM and Thursday PM enabled detection of P2 and P3. Photographs of 2D and P3 suggest that optical access to the leak site may have been obstructed by brush.
d) The very high rate of Leak 6 and favorable winds made its plume generally detectable despite the leak source distance from the road.
e) Photos of P5 appear to place the leak on a ridge above the road surrounded by brush. The very small leak rate and possible obstruction of the laser beam precluded detection of this leak.
f) Although these leak sites are listed as inactive, we detected and our data files recorded small but distinct and momentary signals at or near them.
10
these leaks are below the 10 ppm-m mobile RMLD detection threshold. Of the remaining 41 leaks, four were not detected by our equipment, including: the 15 scfh leak at site 2B on Monday PM, and three of eight passes at Leak Site 4. Thus we detected 37 of the 41 leaks within our specified performance range, a 90% success rate. Table 1 Note b offers an explanation for missing the leaks at Site 4. Unexpectedly, during favorable wind conditions we were able to detect plumes from Leak Sites 6 and P2, despite the leak sources being located well beyond reach of
the RMLD. Although RMLD cannot probe leak sources beyond 100 ft from the sensor, we can detect plumes from leak sources farther away when the natural gas from these sources is transported to within 100 ft. Some of our reported detection events cannot be correlated with the leak locations. On three occasions we detected methane in the vicinity of N43 17 3, just north of a building. This location was independently tested and determined to be a real (but unplanned) leak source. Other events, noted in our reports as small and momentary, include: 1) a distinct signal, reported in our Equipment Provider Test Report Table 3.3.2 and plotted in the Wednesday PM data record, located at N43 18 18.7, just north of P1 (this may have been a gust associated with P1); and 2) fleeting signals recorded on Wednesday PM at the site of Leak 3 and Thursday AM at Leak 5, despite the leaks (which had previously been quite large) being shut off at the time. During a survey of real pipeline, these events would have warranted a closer walking inspection 3.5 Mobile Test Summary The RMOTC experience has taught that the RMLD is generally an effective mobile survey tool, but to optimize the detection probability the survey vehicle would preferably drive within a nominal 100 ft of a pipeline and view down at the surface of the ground. Furthermore, leak detection and location can be enhanced by allowing a walking survey at sites of small detection signals. Survey planners and RMLD operators should recognize that the RMLD operates like a flashlight and detects gas in the path between the light source and the surface it illuminates. The absence of a surface behind the leak plume, or an obstruction in front, will preclude detection. PSI and Heath were delighted to be allowed to participate in these tests at RMOTC. We were impressed with the care and thought that went into creating leak scenarios. A wide range of leak magnitudes and characteristics were presented to test participants. We found the variety stimulating and challenging, and we thank the test conductors. PSI successfully detected the vast majority of the leaks presented with few false positives. We even detected real but unknown, unplanned leaks.
1
10
100
1000
10000
0 50 100 150 200 250 300Range to Leak (ft)
Always DetectedSometimes MissedNot Detected
Leak
Rat
e(s
cfh)
G-8430
Figure 5. Graphical leak summary.
11
However, as in any simulated test there were artificial constraints that potentially limited the effectiveness of our detection approach. We had no opportunity to optimize the height of viewing. The slant angle to the ground is less well defined at passenger eye level, and thus more sensitive to road vibration moving the viewed volume. As our technique needs a surface to reflect light back to the receiver, we may have missed leaks located at (or just over) a ridge. There were a number of locations where the road passed between embankments, effectively blocking our view and preventing surveying. In a real survey, we would have either traveled the ridge or moved to another position (road) to view the obscured area. We understand that for these structured tests this could not be possible. During real world surveys, the vehicle would travel on the pipeline right-of-way viewing both sides of the pipeline at the maximum uncertain distance and keep the full field in view – stopping and maneuvering to access all areas, walking if necessary. We feel there are many advantages to ground-based surveys. Leaks can be located and marked immediately. They can be investigated to find obvious sources. They can be assessed in the context of their surrounding (desert vs. grammar school). We did not try to optimize survey speed, but plan to do this in future efforts. We were urged to treat this test as if it were a real survey. We showed up the morning the test began, participated in every test run on schedule, packed up and left moving to the next survey. 4. EXTENSION OF TECHNOLOGY TO AIRBORNE APPLICATION Physical Sciences Inc. has recently been awarded a program under DoE/NETL sponsorship. Herein, PSI proposes to utilize and extend the technology embedded within the RMLD to build and demonstrate a system for standoff sensing, from high altitudes, of natural gas distribution/transmission pipeline leaks. The solid-state, near-IR lasers within RMLD will be enhanced with scalable, high-power optical fiber amplifiers to provide a compact, power-efficient sensor to be flown in a piloted aircraft. PSI will assemble and flight test a prototype sensor having an operational ceiling of 10,000 ft. This demonstration will prove the concept and lay the foundation for scaling the device to achieve leak detection from altitudes in excess of 50,000 ft. Operating over longer ranges RMLD must have the ability to discriminate small leaks from ambient methane. The airborne RMLD will be designed to avoid or overcome these limitations. The prototype version to be demonstrated will operate at altitudes up to 10,000 ft and sense leak plumes having minimum path-integrated methane concentrations of 1000 ppm-m. This detection scenario should be sufficient to detect the presence of a leak from a high capacity transmission line. The system will be designed to provide a signal-to-noise ratio of unity corresponding to about 100 ppm-m, the so-called minimum detection limit.
To adapt the RMLD for high altitude use in the airborne platform, three aspects of it will be modified: 1) The transmitted laser power will be increased by use of an optical fiber amplifier; 2) The size of the optical receiver will be increased; and 3) The laser wavelength will be changed. Equation (1), which relates the received laser power to the transmitted power, optical receiver size, and operating distance, provides the rationale for the first two changes:

12
out2optdifcol
DC PR
RAP ⎟⎟
⎠
⎞⎜⎜⎝
⎛ η= (2)
where: Acol = effective area of optical receiver in m2 Rdif = differential reflectance of topographic targets ηopt = optical efficiency R = distance to topographic target in m Pout = laser output power in W The RMLD currently achieves a 5 ppm-m detection limit at 30 m using absorption from one of the strongest near-IR transitions of methane, a 4-in. diameter receiver optic, and Pout = 10 mW. Equation (1) shows that the collected power scales as the inverse of distance squared, so to achieve a comparable detected photocurrent at 50,000 ft (~ 15,000 m), we would require 2.5 kW of laser power with the same 4-in. receiver, but would need only 125 W with an 18-in. diameter receiver. This laser power and mirror diameter is achievable with scalable fiber amplifier technology and a compact sensor payload consistent with anticipated future flight vehicles. In the current program we will demonstrate the laser power of 5 W and an effective mirror diameter to 10 in., sufficient to demonstrate leak detection from 10,000 ft. The noise-floor of the sensor will correspond to a path-integrated detection limit of 1000 ppm-m. Thus, the sensor will be able to identify leaks of 0.1% methane in a 1 m plume. This is 40 times lower than the explosive limit threshold. A summary of the expected sensor performance specifications is given in Table 2.
Table 2. Summary of Airborne Sensor Target Specifications
Prototype – This Program High-Altitude – Scaled Version Operational Ceiling 10,000 ft 50,000 ft
Eye-Safe Laser Power 5 W 125 W Target Diameter 10 m 50 m
Response Bandwidth 10 Hz 10 Hz Detection Limit 1000 ppm-m 1000 ppm-m
Ground Survey Speed 50 m/s 50 m/s Payload Weight < 100 lbs < 100 lbs
Power Requirement < 300 W < 8 kW REFERENCES 1. Allen, M.G., Carleton, K.L., Davis, S.J., Kessler, W.J., Otis, C.E., Palombo, D., and
Sonnenfroh, D.M., "Ultra-Sensitive Dual-Beam Absorption and Gain Spectroscopy: Applications for Near-IR and Visible Diode Laser Sensors," Applied Optics 34(18), p. 3240-3249, 1995.
2. Allen, M.G. and Kessler, W.J., "Simultaneous Water Vapor Concentration and Temper-ature Measurements Using 1.31 µm Diode Lasers," AIAA J. 34(3), pp. 483-488, 1996.
13
3. Allen, M.G., "Diode Laser Absorption Sensing of Gas Dynamic and Combustion Flows," an invited review for Measurement Science and Technology 9(4), pp. 545-562, 1998.
4. Wainner, R.T., Green, B.D., Allen, M.G., White, M.A., Stafford-Evans, J., and Naper, R., "Handheld, batter-powered near-IR TDL sensor for stand-off detection of gas and vapor plumes," Appl. Phys. B, 75(2-3), pp. 249-254, 2002.
ACKNOWLEDGEMENTS The authors acknowledge the support and encouragement of many sponsors in the development and testing of RMLD including Angelo Fabiano of NGA. Dan Driscoll and Rodney Anderson of DoE/NETL sponsored our participation in the RMOTC tests and the development of an airborne version of RMLD. PSI acknowledges the unwavering commitment of our partner Heath Consultant Incorporated in the RMLD development, in particular Jim Rutherford and Steve Chancey. We acknowledge the careful planning and implementation of the pipeline testing by the staff at RMOTC, Chris Buckingham of SwRI and their sponsorship by the DoT OPS.