extensive excitatory network interactions shape temporal...
TRANSCRIPT

Extensive excitatory network interactions shape temporal processing ofcommunication signals in a model sensory system
Xiaofeng Ma,1 Tsunehiko Kohashi,1,2 and Bruce A. Carlson1
1Department of Biology, Washington University in St. Louis, St. Louis, Missouri; and 2Division of Biological Science,Graduate School of Science, Nagoya University, Nagoya, Japan
Submitted 28 February 2013; accepted in final form 24 April 2013
Ma X, Kohashi T, Carlson BA. Extensive excitatory networkinteractions shape temporal processing of communication signals in amodel sensory system. J Neurophysiol 110: 456–469, 2013. Firstpublished April 24, 2013; doi:10.1152/jn.00145.2013.—Many sen-sory brain regions are characterized by extensive local networkinteractions. However, we know relatively little about the contributionof this microcircuitry to sensory coding. Detailed analyses of neuronalmicrocircuitry are usually performed in vitro, whereas sensory pro-cessing is typically studied by recording from individual neurons invivo. The electrosensory pathway of mormyrid fish provides a uniqueopportunity to link in vitro studies of synaptic physiology with in vivostudies of sensory processing. These fish communicate by activelyvarying the intervals between pulses of electricity. Within the mid-brain posterior exterolateral nucleus (ELp), the temporal filtering ofafferent spike trains establishes interval tuning by single neurons. Wecharacterized pairwise neuronal connectivity among ELp neuronswith dual whole cell recording in an in vitro whole brain preparation.We found a densely connected network in which single neuronsinfluenced the responses of other neurons throughout the network.Similarly tuned neurons were more likely to share an excitatorysynaptic connection than differently tuned neurons, and synapticconnections between similarly tuned neurons were stronger thanconnections between differently tuned neurons. We propose a generalmodel for excitatory network interactions in which strong excitatoryconnections both reinforce and adjust tuning and weak excitatoryconnections make smaller modifications to tuning. The diversity ofinterval tuning observed among this population of neurons can beexplained, in part, by each individual neuron receiving a differentcomplement of local excitatory inputs.
microcircuit; paired recording; sensory processing; temporal coding;electric fish
THE CENTRAL PROCESSING of sensory information involves bothextrinsic inputs to a network and local interactions amongneurons in that network. The neuronal basis of sensory pro-cessing is typically studied either at the single-neuron level,through intracellular or extracellular recordings, or at the levelof brain regions, through brain imaging. A better understandingof local network dynamics is necessary for understanding howthe cellular and molecular properties of individual neurons giverise to emergent global patterns of activity that underlie per-ception and behavioral control (Grillner et al. 2005). However,it is technically challenging to relate neuronal microcircuitry tobehaviorally relevant information processing. Synaptic con-nectivity in sensory microcircuits is often studied throughsimultaneous intracellular recordings from multiple neurons invitro (Brown and Hestrin 2009; Fino and Yuste 2011; Kampa
et al. 2006; Perin et al. 2011; Song et al. 2005). However, it isdifficult to determine the functional specificity of those con-nections because responses to sensory stimuli usually cannotbe determined in vitro. Paired intracellular recordings in vivocan reveal correlated activity during sensory processing (Pouletand Petersen 2008), but these experiments are challenging toperform and allow for only limited experimental control. Im-aging and multichannel extracellular recordings can be used tomonitor correlated activity across large populations of neuronsin vivo (Ahrens and Keller 2013; Kwan and Dan 2012; Szutset al. 2011), but subthreshold network interactions are gener-ally not detectable. Here we describe an in vitro whole brainpreparation that allowed us to obtain paired intracellular re-cordings from neurons in an intact sensory microcircuit whilecontrolling the timing of synaptic input to the circuit in behav-iorally relevant ways.
Mormyrid fish generate an electric organ discharge (EOD)used for active sensing (von der Emde 1999) and communica-tion (Carlson 2006). The relative timing of each EOD is highlyvariable, with interpulse intervals (IPIs) ranging from tens ofmilliseconds to seconds. Mormyrids actively vary IPIs duringsocial interactions, with distinct IPI sequences associated withbehavioral contexts such as aggression, submission, schooling,courtship, and territoriality (Arnegard and Carlson 2005; Carl-son 2002a; Wong and Hopkins 2007). These signals are ana-lyzed in a sensory pathway that is dedicated to electric com-munication behavior (Baker et al. 2013; Xu-Friedman andHopkins 1999). The timing of each EOD is precisely encodedinto the spike times of peripheral electroreceptors called knol-lenorgans, thereby encoding IPIs into sequences of interspikeintervals (Hopkins and Bass 1981; Lyons-Warren et al. 2012).This information is relayed to the midbrain posterior extero-lateral nucleus (ELp), where temporal filtering of afferent spiketrains establishes single-neuron IPI tuning (Carlson 2009). ELpneurons are diverse in their tuning (Carlson 2009), suggestingthat each particular IPI is represented by the firing of a distinctpopulation of cells. Thus temporal filtering in ELp converts atemporal code for electric communication signals into a pop-ulation code (Baker et al. 2013).
Studying a sensory pathway that is specialized for a specificfunction makes it relatively straightforward to relate the phys-iology of cells and circuits to their role in information process-ing. Furthermore, the encoding of stimuli into precisely timedspike sequences makes it easy to recreate the synaptic inputpatterns that occur in an intact animal and study the processingof behaviorally relevant information in a reduced in vitropreparation (George et al. 2011). The whole brain preparationwe describe here allowed us to obtain simultaneous recordings
Address for reprint requests and other correspondence: B. A. Carlson, Dept.of Biology, Campus Box 1137, Washington Univ., St. Louis, MO 63130-4899(e-mail: [email protected]).
J Neurophysiol 110: 456–469, 2013.First published April 24, 2013; doi:10.1152/jn.00145.2013.
456 0022-3077/13 Copyright © 2013 the American Physiological Society www.jn.org
at Washington U
niv on July 16, 2013http://jn.physiology.org/
Dow
nloaded from
from ELp neuron pairs, characterize their IPI tuning, determinetheir synaptic connectivity, and elucidate the role of microcir-cuitry in determining the IPI tuning of individual neurons. Ourresults reveal high degrees of excitatory network connectivitythat shape the temporal filtering of sensory input and suggestthat neuronal microcircuitry can contribute to the populationcoding of stimulus variation by establishing diverse responseproperties among a population of neurons.
MATERIALS AND METHODS
Animals. We used both sexes of the mormyrid Brienomyrusbrachyistius (Gill 1862), ranging from 1.2 to 9.0 g in body mass andfrom 5.0 to 9.5 cm in standard length. The fish were obtained throughcommercial vendors and housed in community tanks with a 12:12-hlight-dark cycle, temperature of 25–28°C, pH of 6–7, and waterconductivity of 200–400 �S/cm. Fish were fed live black worms fourtimes per week. All procedures were in accordance with guidelinesestablished by the National Institutes of Health and were approved bythe Animal Care and Use Committee at Washington University in St.Louis.
Whole brain preparation. We anesthetized fish in 100 mg/l MS-222and then submerged fish in ice-cold, oxygenated artificial cerebrospi-nal fluid (ACSF; composition in mM: 124 NaCl, 2.0 KCl, 1.25KH2PO4, 24 NaHCO3, 2.6 CaCl2, 1.6 MgSO4·7H2O, and 20 glucose,pH 7.2–7.4; osmolarity 300–305 mosM) before performing a crani-otomy to fully expose the brain. While the brain remained submerged,all cranial nerves were cut, the connection to the spinal cord wassevered, and the valvula cerebellum was removed by suction, leavingthe remaining hindbrain, midbrain, and forebrain intact (Fig. 1A). Thebrain was then removed and placed in an incubating chamber containingoxygenated ACSF at 29°C for 1 h. The brain was then transferred to arecording chamber (Warner Instruments RC-26GLP) that was continu-ously perfused with oxygenated ACSF at room temperature (flow rate � 1ml/min), where it was placed on an elevated slice hold-down with a1.0-mm mesh size (Warner Instruments SHD-26GH/10). A secondslice hold-down with a 1.5-mm mesh size (Warner InstrumentsSHD-26GH/15) was placed on top of the brain, and it was heldsecurely in place with cured silicone placed at the top of thechamber. Some of the threads of the upper hold-down were cut toimprove access to the anterior and posterior exterolateral nuclei(ELa and ELp, respectively). This configuration helped keep thepreparation stable while also maximizing tissue survival by allow-ing a constant flow of oxygenated ACSF both beneath and abovethe preparation.
Paired whole cell recording. We visualized ELp neurons withtransmitted light in an upright fixed-stage microscope (BX51WI;Olympus) in combination with a Newvicon tube camera (Dage-MTI).We obtained whole cell intracellular recordings with filamented boro-silicate patch pipettes (1.00-mm outer diameter; 0.58-mm inner diam-eter) with tip resistances of 6.2–10.2 M� as described previously(George et al. 2011). The electrode internal solution contained thefollowing (in mM): 130 K gluconate, 5 EGTA, 10 HEPES, 3 KCl, 2MgCl2, 4 Na2ATP, 5 Na2 phosphocreatine, and 0.4 Na2GTP, pH7.3–7.4 (osmolarity: 285–290 mosM). Two electrodes were mountedin separate headstages (Molecular Devices CV-7B), both connected toa multichannel amplifier (Molecular Devices MultiClamp 700B) fortwo-channel current- or voltage-clamp recording (Fig. 1B). Data weredigitized at a sampling rate of 50 kHz (Molecular Devices Digidata1440A) and saved to disk (Molecular Devices Clampex v10.2). Theposition of each electrode was controlled by separate manipulators(Sutter Instruments MP-285), both connected to a single controller(Sutter Instruments MPC-200 and ROE-200). Healthy ELp neuronswere identified on the basis of location and a relatively low-contrast,round somatic boundary. We targeted somas of all possible sizes andlocations throughout ELp, but we were only able to see neuronslocated within �20–50 �m of the surface, depending on tissue
thickness. After both electrodes were placed near different somas,suction was applied to form a seal before breaking through themembrane, one neuron at a time. Seal resistance varied from 1.3 to 4.8G�, and input resistance varied from 230 to 290 M�. We only useddata from neurons that had stable access and input resistances and astable resting potential of at least �40 mV. We measured the inter-somatic distance between each recorded pair of neurons.
Responses to afferent stimulation. We placed an array of stimuluselectrodes in ELa, just anterior to the ELp border (Fig. 1B). The arrayconsisted of four channels of bipolar stimulation (8 electrodes total),in the form of either a “cluster” electrode (FHC model CE) or a“matrix” electrode (FHC model MX). We delivered simultaneous,isolated, biphasic, square current pulses with a total duration of 100�s and amplitudes ranging from 50 to 200 �A through four separateisolated pulse generators (A-M Systems model 2100), each triggeredby a single digital output (Molecular Devices Digidata 1440A).Stimulation on each channel was turned on or off, and stimulusamplitude was adjusted to yield reliable synaptic potentials from bothrecorded neurons. After setting the stimulus parameters, we stimu-lated ELa with single pulses as well as stimulus trains of 10 pulseswith constant IPIs ranging from 10 to 100 ms while recording incurrent clamp, as described previously (George et al. 2011). Synapticpotentials were averaged across five repetitions of each stimulus. Ifthere was any spiking, we applied a median filter to remove spikesbefore averaging (Carlson 2009; George et al. 2011).
We determined IPI tuning in response to constant-interval stimulustrains as described previously (Carlson 2009; George et al. 2011). Wedetermined the resting potential as the average membrane potentialwithin a 50-ms window during the prestimulus period. We measuredthe maximum depolarization in response to each stimulus pulserelative to rest and then averaged the maximum depolarizations inresponse to the 2nd through 10th pulses to quantify the response toeach IPI; finally, we normalized these responses to the strongestresponse across IPIs. IPI tuning was categorized as all-pass, low-pass,high-pass, band-pass, band-stop, or complex with an 85% responsecriterion as described previously (Carlson 2009; George et al. 2011).In some cases in which one of the two cells spiked in response to ELastimulation, we repeated this procedure while hyperpolarizing thespiking cell to approximately �90 mV to prevent it from spiking. Thisallowed us to determine the effects of silencing the spiking cell on theIPI tuning of the second cell. Unless otherwise stated, all values arepresented as means � SE.
Characterization of synaptic connections. We injected brief (2–3ms) depolarizing current pulses (600 pA) in current clamp to elicitsingle, time-locked action potentials in one neuron while makingcurrent-clamp recordings from a second neuron. This was repeated 15times to determine whether any postsynaptic potentials (PSPs) werepresent in the second neuron, and then we repeated the same proce-dure in reverse by stimulating the second cell while recording fromthe first. Chemical excitatory synaptic connections were identified asdepolarizing voltage changes beginning within 10 ms of the presyn-aptic action potential peak, with a consistent latency (within �250 �s)across all 15 repetitions, and in which the peak of the averagedpotential occurred �1 ms after the presynaptic action potential peakand with an amplitude � 2 standard deviations of the baselinepotential. We also looked for inhibitory synaptic connections, usingthe same criteria to detect consistent hyperpolarizing voltage changes;however, we only detected two inhibitory connections, so we focusedon excitatory synaptic connections in this study. Electrical synapticconnections were identified as changes in voltage that closely fol-lowed presynaptic action potential waveforms with no detectablelatency (“spikelets”). In one case, a strong electrical synaptic connec-tion was also evident as step changes in voltage in response to stepcurrent injection into the other neuron. In all other cases, however, theelectrical synaptic connections were much weaker and were onlydetectable as spikelets after averaging.
457EXCITATORY NETWORKS AND TEMPORAL PROCESSING
J Neurophysiol • doi:10.1152/jn.00145.2013 • www.jn.org
at Washington U
niv on July 16, 2013http://jn.physiology.org/
Dow
nloaded from
If a synaptic connection was present, we sometimes deliveredstimulus trains of 10 presynaptic spikes with constant intervals of 10,50, and 100 ms. In each case, we delivered 15 repetitions of eachstimulus and averaged across repetitions. We then measured theamplitude of excitatory postsynaptic potentials (EPSPs) or excitatorypostsynaptic currents (EPSCs) relative to baseline, defined as theaverage membrane potential or holding current within a 50-ms win-dow during the prestimulus period. We also measured the latencyfrom presynaptic action potential peak to EPSP/EPSC peak (peak-to-peak latency) as well as the latency from presynaptic action potentialpeak to EPSP/EPSC onset, defined as the time at which the EPSP/EPSC reached 10% of the peak. Unless otherwise stated, all values arepresented as means � SE.
Pharmacology. To assess the role of NMDA versus non-NMDAreceptors in mediating glutamatergic EPSPs, we bath applied theNMDA receptor antagonist DL-2-amino-5-phosphonopentanoic acid(APV; Tocris 0105) and/or the non-NMDA receptor antagonist 6,7-dinitroquinoxaline-2,3-dione (DNQX; Tocris 2312). Both drugs weredelivered at a concentration of 50 �M in ACSF. Full washouttypically took 15–20 min.
Imaging physiologically identified neurons. For visualizing synap-tically connected neurons, we first identified a pair of connectedneurons physiologically. We then applied slight positive pressure andslowly backed the recording electrodes away from the recordedneurons to minimize damage to the membranes. We then filled oneelectrode with 100 �M Alexa Fluor 488 hydrazide (Life Technologies
CLow-pass neurons High-pass neuronsBand-pass neurons Band-stop neurons
ELa
ELp
nELL
A B
00.20.40.60.8
1
20 40 60 80 100Interpulse interval (ms)
Nor
m. m
ax.
depo
lariz
atio
n
00.20.40.60.8
1
20 40 60 80 100Interpulse interval (ms)
Nor
m. m
ax.
depo
lariz
atio
n
00.20.40.60.8
1
20 40 60 80 100Interpulse interval (ms)
Nor
m. m
ax.
depo
lariz
atio
n
00.20.40.60.8
1
20 40 60 80 100Interpulse interval (ms)
Nor
m. m
ax.
depo
lariz
atio
n
0 0 0 0
ELa
ELp
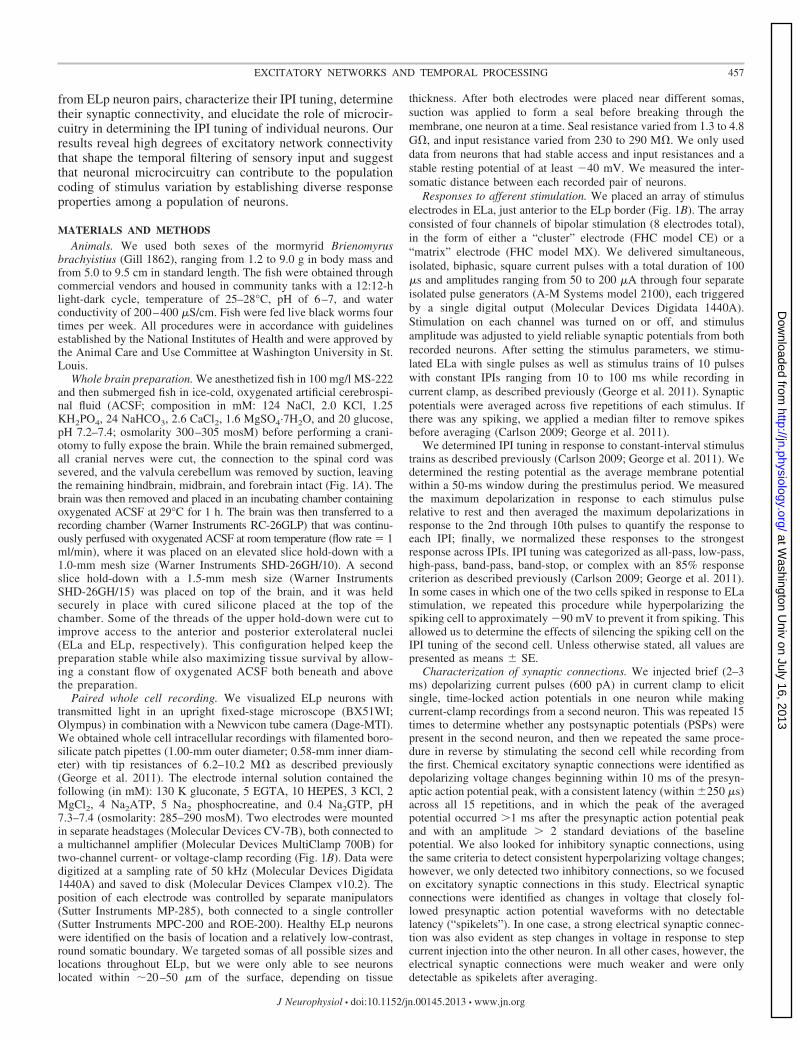
Fig. 1. Whole brain preparation and interpulse interval (IPI) tuning in posterior exterolateral nucleus (ELp) neurons. A: dorsal view of the whole brain preparation,which consists of the entire brain except for the valvula cerebellum, which was removed by suction to expose the underlying hindbrain and midbrain. Primaryafferents from knollenorgan electroreceptors terminate ipsilaterally in the hindbrain nucleus of the electrosensory lateral line lobe (nELL). Axons from nELLneurons project bilaterally to the midbrain anterior exterolateral nucleus (ELa), which then projects to the adjacent ELp. Scale bar, 1 mm. B: close-up view ofELa and ELp during recording and stimulation. Electric stimuli are applied to ELa with a 4-bipolar-channel matrix electrode, which can be seen originating fromthe top right. Two patch pipettes are used for simultaneous whole cell recordings from pairs of ELp neurons. Scale bar, 200 �m. C: tuning curves from 5representative low-pass, band-pass, band-stop, and high-pass neurons. Curves show the average maximum depolarization in response to stimulation of ELa atIPIs ranging from 10 to 100 ms, normalized to the largest maximum depolarization of each unit.
458 EXCITATORY NETWORKS AND TEMPORAL PROCESSING
J Neurophysiol • doi:10.1152/jn.00145.2013 • www.jn.org
at Washington U
niv on July 16, 2013http://jn.physiology.org/
Dow
nloaded from

A-10436) in internal solution and a second electrode with 100 �MAlexa Fluor 568 hydrazide (Life Technologies A-10437) in internalsolution. We then obtained patch recordings from the previouslyidentified neurons with the dye-filled electrodes. After verifying thesynaptic connection and holding the two cells at a stable restingpotential for �20 min, we injected both cells with �20 pA ofhyperpolarizing current for 10–15 min to iontophoretically improvethe label. We then applied slight positive pressure and slowly backedthe recording electrodes away from the recorded neurons to minimizedamage to the membranes. The tissue was then transported in oxy-genated ACSF to a confocal fluorescence imaging setup consisting ofan Olympus BX61 upright microscope and an FV1000 scanner. Thetissue was continuously perfused with oxygenated ACSF during liveimaging. Putative synaptic contacts were identified as close apposi-tions between axonal boutons or axonal swellings of one neuron andthe soma or dendrites of the second neuron in individual opticalsections. Although this does not definitively identify functional syn-apses, electron microscopy has shown that a majority (�80%) of suchputative synapses represent actual functional synapses (Feldmeyer etal. 2002, 2006; Lübke et al. 1996; Markram et al. 1997; Mishchenkoet al. 2010; Wang et al. 2002).
We also viewed neurons filled with biocytin obtained during invivo recordings from ELp neurons in previous studies (see Carlson2009; George et al. 2011). Briefly, we iontophoretically injectedbiocytin, using a 1-Hz sinusoidal current varying from 0 to �1 nA for2–10 min, anesthetized fish in MS-222, and then perfused fish throughthe heart with ice-cold heparinized Hickman’s Ringer solution fol-lowed by ice-cold 4% paraformaldehyde. After 3 h of postfixation, weembedded brains in gelatin, followed by an additional 3 h of postfix-ation. We cut 50-�m horizontal sections with a vibratome, mountedthe sections, and then used standard histological procedures to stainlabeled cells (Carlson 2002b).
RESULTS
Electrosensory input to ELp arises from the adjacent ELa(Fig. 1A). We classified the tuning of ELp neurons to IPI bydelivering stimulus trains to ELa (Fig. 1B) and measuring theamplitude of PSP responses, as described previously (Carlson2009; George et al. 2011). We recorded from all types of neuronsencountered previously: “all-pass” neurons responded equallywell to all IPIs between 10 and 100 ms; “low-pass” neuronsresponded preferentially to long IPIs; “high-pass” neurons re-sponded preferentially to short IPIs; “band-pass” neurons re-sponded preferentially to intermediate IPIs; “band-stop” neu-rons responded preferentially to both long and short, but notintermediate, IPIs; and “complex” neurons responded prefer-entially to multiple IPI ranges (Fig. 1C). The tuning of thesecells to afferent stimulation patterns directly reflects the sen-sory coding of behaviorally relevant communication signals:individual ELp neurons respond similarly to sensory stimula-tion patterns and ELa microstimulation patterns in vivo (Carl-son 2009), and for similarly tuned neurons the synaptic re-sponses to sensory stimulation in vivo are similar to synapticresponses to afferent stimulation in vitro (George et al. 2011).
Excitatory and electrical synaptic connections are wide-spread. To identify and characterize synaptic connectionsamong ELp neurons, we obtained dual whole cell recordingsfrom a total of 407 neuron pairs. To test for synaptic connec-tions, we injected brief (2–3 ms) depolarizing current pulses ofsufficient amplitude (600 pA) to reliably elicit single spikeswith high temporal precision in one neuron while recordingunder current clamp in the second neuron. Depolarizing EPSPswere clearly visible in 62 (15.2%) of these pairs (e.g., Fig. 2),
9 of which had a bidirectional excitatory connection, resultingin a total of 71 excitatory connections.
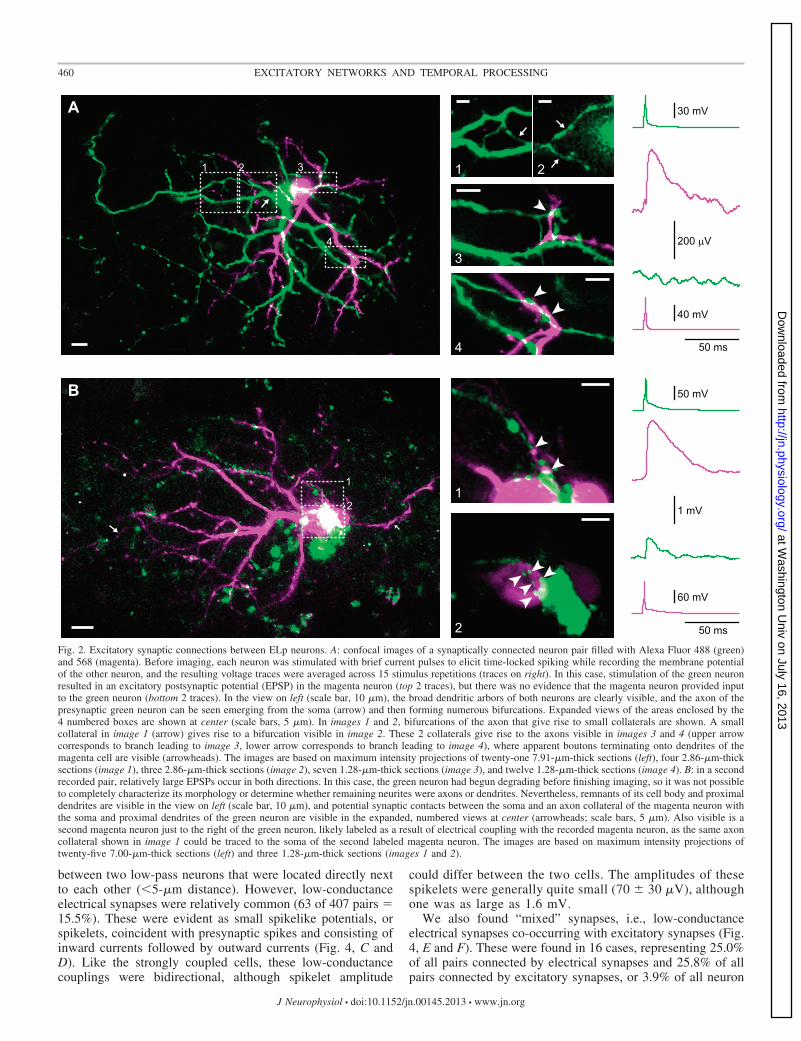
These EPSPs varied widely in amplitude from as small as 50�V to as large as 6.30 mV. Inward synaptic currents recordedwhile voltage-clamping postsynaptic cells at a holding poten-tial of �60 mV ranged from 2.47 to 61.05 pA (n � 15). Thedistribution of synaptic strengths (EPSP amplitudes) washighly skewed [Lilliefors test: KS(71) � 0.23, P � 0.001],with the majority being relatively weak and a small numberbeing relatively strong (Fig. 3A). A log10-transformation re-vealed that variation in synaptic strength followed a log-normaldistribution (Fig. 3B) [KS(71) � 0.08, P � 0.3], as describedfor the distribution of synaptic strengths in cortical microcir-cuits (Song et al. 2005). The synaptic strengths of bidirection-ally connected pairs were significantly larger than the synapticstrengths of unidirectionally connected pairs (Fig. 3C) [Mann-Whitney U-test: z(53,18) � 2.63, P � 0.01]. In addition, thesynaptic strengths of bidirectionally connected pairs werestrongly correlated with each other (Fig. 3D) (Spearman rankR � 0.85; P � 0.01). In only 1 of the 71 identified connectionswas the EPSP large enough to elicit spiking, and this onlyhappened in 1 of the 15 stimulus repetitions. This stronglysuggests that all observed postsynaptic responses were due tomonosynaptic connections.
EPSP onset latencies averaged 1.62 � 0.11 ms (range:0.41–5.47 ms), and peak-to-peak latencies averaged 8.20 �0.46 ms (range: 1.30–25.20 ms). EPSC onset latencies aver-aged 0.82 � 0.08 ms (range: 0.33–1.57 ms), and peak-to-peaklatencies averaged 2.31 � 0.26 ms (range: 1.34–4.90 ms).EPSP amplitude did not correlate with peak-to-peak latency(Spearman rank R � 0.02; P � 0.8), but it did negativelycorrelate with onset latency (Spearman rank R � �0.40; P �0.001). Likewise, EPSC amplitude was negatively correlatedwith onset latency (Spearman rank R � �0.54; P � 0.05) butnot peak-to-peak latency (Spearman rank R � �0.25; P �0.3). This suggests that some of the variation in synapticstrength was due to the location of presynaptic terminals ondendritic arbors, with proximal inputs resulting in larger syn-aptic responses and shorter latencies at the soma comparedwith distal inputs.
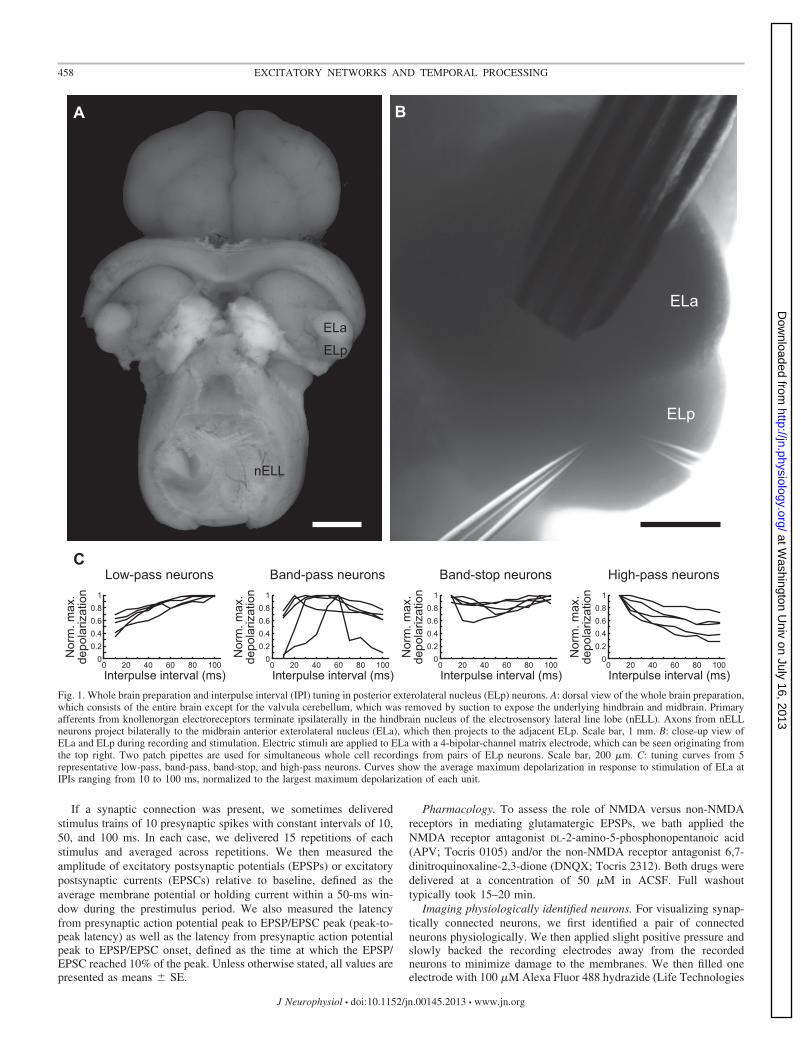
We were able to visualize two pairs of synaptically con-nected neurons and identify potential synaptic contacts byfilling recorded cells with Alexa Fluor dyes followed byconfocal imaging of live tissue (Fig. 2). The morphology of thelabeled cells was consistent with previous descriptions of ELpneuron morphology based on fixed tissue (George et al. 2011;Xu-Friedman and Hopkins 1999), including extensive den-dritic arbors with visible spines as well as widely projectingaxons giving rise to numerous collaterals. The excitatory syn-aptic connection of one of these pairs was relatively weak(349-�V EPSP) and unidirectional (Fig. 2A). Putative synapticcontacts between axon collaterals of the presynaptic neuronand dendrites of the postsynaptic neuron were visible at twodistinct locations (Fig. 2A). The other pair had a stronger,bidirectional connection (2.2-mV and 820-�V EPSPs), and thiswas associated with putative synaptic contacts between anaxon collateral and soma of one cell and a proximal dendriteand soma of the second cell (Fig. 2B).
Electrical synapses were also found among ELp neuronpairs. In only one case (�1%) did we find strong (i.e., highconductance) electrical coupling (Fig. 4, A and B); this was
459EXCITATORY NETWORKS AND TEMPORAL PROCESSING
J Neurophysiol • doi:10.1152/jn.00145.2013 • www.jn.org
at Washington U
niv on July 16, 2013http://jn.physiology.org/
Dow
nloaded from
between two low-pass neurons that were located directly nextto each other (�5-�m distance). However, low-conductanceelectrical synapses were relatively common (63 of 407 pairs �15.5%). These were evident as small spikelike potentials, orspikelets, coincident with presynaptic spikes and consisting ofinward currents followed by outward currents (Fig. 4, C andD). Like the strongly coupled cells, these low-conductancecouplings were bidirectional, although spikelet amplitude
could differ between the two cells. The amplitudes of thesespikelets were generally quite small (70 � 30 �V), althoughone was as large as 1.6 mV.
We also found “mixed” synapses, i.e., low-conductanceelectrical synapses co-occurring with excitatory synapses (Fig.4, E and F). These were found in 16 cases, representing 25.0%of all pairs connected by electrical synapses and 25.8% of allpairs connected by excitatory synapses, or 3.9% of all neuron
A
B
50 ms
50 mV
1 mV
60 mV
30 mV
40 mV
200 µV
50 ms
1 2 3
4
1
2
1 2
3
4
1
2Fig. 2. Excitatory synaptic connections between ELp neurons. A: confocal images of a synaptically connected neuron pair filled with Alexa Fluor 488 (green)and 568 (magenta). Before imaging, each neuron was stimulated with brief current pulses to elicit time-locked spiking while recording the membrane potentialof the other neuron, and the resulting voltage traces were averaged across 15 stimulus repetitions (traces on right). In this case, stimulation of the green neuronresulted in an excitatory postsynaptic potential (EPSP) in the magenta neuron (top 2 traces), but there was no evidence that the magenta neuron provided inputto the green neuron (bottom 2 traces). In the view on left (scale bar, 10 �m), the broad dendritic arbors of both neurons are clearly visible, and the axon of thepresynaptic green neuron can be seen emerging from the soma (arrow) and then forming numerous bifurcations. Expanded views of the areas enclosed by the4 numbered boxes are shown at center (scale bars, 5 �m). In images 1 and 2, bifurcations of the axon that give rise to small collaterals are shown. A smallcollateral in image 1 (arrow) gives rise to a bifurcation visible in image 2. These 2 collaterals give rise to the axons visible in images 3 and 4 (upper arrowcorresponds to branch leading to image 3, lower arrow corresponds to branch leading to image 4), where apparent boutons terminating onto dendrites of themagenta cell are visible (arrowheads). The images are based on maximum intensity projections of twenty-one 7.91-�m-thick sections (left), four 2.86-�m-thicksections (image 1), three 2.86-�m-thick sections (image 2), seven 1.28-�m-thick sections (image 3), and twelve 1.28-�m-thick sections (image 4). B: in a secondrecorded pair, relatively large EPSPs occur in both directions. In this case, the green neuron had begun degrading before finishing imaging, so it was not possibleto completely characterize its morphology or determine whether remaining neurites were axons or dendrites. Nevertheless, remnants of its cell body and proximaldendrites are visible in the view on left (scale bar, 10 �m), and potential synaptic contacts between the soma and an axon collateral of the magenta neuron withthe soma and proximal dendrites of the green neuron are visible in the expanded, numbered views at center (arrowheads; scale bars, 5 �m). Also visible is asecond magenta neuron just to the right of the green neuron, likely labeled as a result of electrical coupling with the recorded magenta neuron, as the same axoncollateral shown in image 1 could be traced to the soma of the second labeled magenta neuron. The images are based on maximum intensity projections oftwenty-five 7.00-�m-thick sections (left) and three 1.28-�m-thick sections (images 1 and 2).
460 EXCITATORY NETWORKS AND TEMPORAL PROCESSING
J Neurophysiol • doi:10.1152/jn.00145.2013 • www.jn.org
at Washington U
niv on July 16, 2013http://jn.physiology.org/
Dow
nloaded from
pairs. Three of the neuron pairs with mixed synapses hadbidirectional excitatory synapses (18.8%), whereas the remain-ing 13 had unidirectional excitatory synapses (81.2%). Intra-cellular fills of ELp neurons with biocytin during in vivo wholecell recording revealed both strong and weak dye coupling inseveral cases (Fig. 4G; see also Fig. 2B), providing furthersupport for extensive gap junctional coupling among ELpneurons.
We found only two inhibitory synaptic connections (�1%),despite a concerted effort to record from somas of all sizes andlocations along the surface of ELp, and to identify smalloutward currents by voltage-clamping cells at depolarizedholding potentials (not shown). This is somewhat surprisinggiven the hyperpolarizing synaptic potentials observed in vivoand in vitro (Carlson 2009; George et al. 2011), large numbersof GABAergic neurons throughout ELp (George et al. 2011),and strong effects of blocking GABAA receptors on the syn-aptic responses of ELp neurons (George et al. 2011). It ispossible that inhibitory interactions occur along a superficial-deep axis, such that superficial neurons inhibit deep neuronsand vice versa. We would have missed such connectionsbecause we were only able to visualize and record fromneurons within �20–50 �m of the surface. Another possibilityis that GABA release may be influenced by glutamate receptorson presynaptic terminals (Duguid and Smart 2004; Liu and
Lachamp 2006; Mathew and Hablitz 2011). If this is true,spiking of the inhibitory neuron itself may be insufficient totrigger inhibition in the absence of presynaptic excitation froma second neuron. Finally, individual inhibitory inputs maysimply be too weak to detect, even at depolarized holdingpotentials. Future studies will test these hypotheses, but be-cause of the lack of recordings from inhibitory connectedneurons we focused on excitatory and electrical synaptic con-nections in this study.
Excitatory connection probability and strength is greatestbetween neurons with similar IPI tuning. A major advantage ofour in vitro whole brain preparation is the ability to relatesynaptic interactions between neurons to the function of thoseneurons in sensory coding. To determine how synaptic con-nectivity relates to IPI tuning, we analyzed the probability ofexcitatory synaptic connections, as well as synaptic strengthand latency, as a function of the IPI tuning of recorded neuronpairs. Excitatory synapses were most common between neu-rons with similar tuning, e.g., high-pass/high-pass and low-pass/low-pass (Fig. 5A). High-pass neurons were significantlymore likely to provide excitatory input to other high-passneurons (26 of 107 pairs � 24.3%) than to neurons in the othertuning classes (11 of 120 pairs � 9.2%) [t(225) � 3.08, P �0.01]. Similarly, low-pass neurons were significantly morelikely to provide excitatory input to other low-pass neurons (9of 47 pairs � 19.1%) than to neurons in the other tuningclasses (4 of 85 pairs � 4.7%) [t(130) � 2.67, P � 0.01].Band-pass neurons generally had a lower probability of pro-viding excitatory input to other neurons, but they too weremore likely to provide excitatory input to other band-passneurons (2 of 24 pairs � 8.3%) than to neurons in the othertuning classes (2 of 82 pairs � 2.4%), although this differencewas not significant [t(104) � 1.33, P � 0.15]. Because band-stop neurons were relatively rare, we did not obtain anysimultaneous recordings from pairs of band-stop neurons, sowe could not formally compare their connection probabilitieswith respect to IPI tuning. Bidirectional excitatory connectionswere more likely between neurons with similar tuning (7 of195 pairs � 3.6%) than with different tuning (2 of 212 pairs �0.9%), although the difference was not quite significant [t(405) �1.81, P � 0.07].
Synaptic strength, as measured by EPSP amplitude, wassignificantly larger for connected pairs of neurons with similarIPI tuning compared with connected pairs with different IPItuning (Fig. 5B) [Mann-Whitney U-test: z(41,30) � 2.72, P �0.01]. The peak-to-peak and onset latencies of EPSPs did not,however, differ between similarly and differently tunedneurons (Fig. 5B) [z(41,30) � 0.42, P � 0.6; z(41,30) �1.11, P � 0.2].
We also analyzed the probability of electrical synaptic con-nections as a function of the IPI tuning of recorded neuronpairs. Electrical synapses were generally less selective in theirpattern of connectivity (Fig. 5A). High-pass neurons were morelikely to have an electrical synaptic connection with otherhigh-pass neurons (23 of 107 pairs � 21.5%) than withneurons in the other tuning classes (17 of 120 pairs � 14.2%),but this difference was not significant [t(224) � 1.48, P � 0.1].Low-pass neurons were about equally likely to have an elec-trical synaptic connection with other low-pass neurons (6 of 47pairs � 12.8%) as with neurons in the other tuning classes (12of 85 pairs � 14.1%) [t(130) � 0.22, P � 0.8]. Band-pass
A B
C D
0 1 2 3 4 5 6 70
10
20
30
EPSP amplitude (mV)
Num
ber
−1 0 10.5-0.5−1.50
3
6
9
log10[EPSP amplitude (mV)]
Num
ber
Syn
aptic
stre
ngth
(mV
)
Bid
irect
iona
l( n
= 1
8)
Uni
dire
ctio
nal
(n =
53)
0
0.5
1
2
1.5
Syn
aptic
stre
ngth
of
stro
nger
con
nect
ion
(mV
)
Synaptic strength ofweaker connection (mV)
0
1
2
3
4
5
6
7
0 0.5 1 1.5 2 2.5 3 3.5
n = 9 bidirectionallyconnected pairs
Fig. 3. Distribution of excitatory synaptic connection strengths is heavilyskewed, and bidirectional connections are stronger than unidirectional connec-tions. A: histogram of EPSP amplitudes resulting from spiking in a singlepresynaptic neuron reveals a distribution that is heavily skewed toward smallvalues with a long tail at large values [Lilliefors test: KS(71) � 0.23, P �0.001]. B: histogram of log10-transformed EPSP amplitudes reveals thatsynaptic strengths followed a log-normal distribution. Black line shows thebest-fit normal distribution. [KS(71) � 0.08, P � 0.3]. C: bidirectionalexcitatory synaptic connections were characterized by significantly strongersynaptic strengths than unidirectional connections [Mann-Whitney U-test:z(53,18) � 2.63, P � 0.01]. D: the synaptic strengths of bidirectionallyconnected pairs were highly correlated, as seen in a plot of the strongersynaptic connection strength within a pair against the weaker synaptic con-nection strength within the pair (Spearman rank R � 0.85; P � 0.01).
461EXCITATORY NETWORKS AND TEMPORAL PROCESSING
J Neurophysiol • doi:10.1152/jn.00145.2013 • www.jn.org
at Washington U
niv on July 16, 2013http://jn.physiology.org/
Dow
nloaded from

neurons were also about equally likely to have an electricalsynaptic connection with other band-pass neurons (4 of 24pairs � 16.7%) as with neurons in the other tuning classes (15of 82 pairs � 18.3%) [t(104) � 0.18, P � 0.8].
Excitatory and electrical connection probabilities decreasewith distance. In cortical microcircuits, excitatory connectionprobabilities decrease with distance (Perin et al. 2011). Todetermine how synaptic connectivity relates to the distancebetween neurons, we analyzed the probability of excitatorysynaptic connections, as well as synaptic strength and latency,as a function of the intersomatic distance between recorded
neuron pairs. Excitatory synapses were most common whenthe distance between recorded somas was relatively small (Fig.5C). No excitatory synaptic connections were detected atdistances � 54 �m, despite recording from 53 pairs of neuronsat distances ranging from 50 to 381 �m. Thus there was astrong negative correlation between distance and probability ofexcitatory synaptic connection (Spearman rank R � �0.86;P � 0.0001). However, the distance between pre- and post-synaptic somas did not correlate with synaptic strength (EPSPamplitude) (Spearman rank R � �0.04; P � 0.7), peak-to-peak latency (Spearman rank R � 0.07; P � 0.5), or onset
G
20mV
10mV
100 ms
50 ms
20mV
10mV 1
mV
20mV
200µV
40mV
4pA
50 ms
20 ms
40mV
200µV
20mV
1mV
20 ms
50 ms
3pA
A C EHigh-conductance electrical Low-conductance electrical Mixed electrical-chemical
B D F
Fig. 4. Electrical coupling between ELp neurons. A: a high-conductance electrical synapse between 2 ELp neurons. Current steps applied to neuron shown intop trace led to clear voltage changes in both neurons; when these steps were above threshold, both neurons fired action potentials. B: responses of the same 2neurons to trains of short depolarizing current pulses applied only to neuron in top trace (50-ms IPI). Both cells spiked in response to each stimulus pulse.C: example of a low-conductance electrical synapse between 2 ELp neurons. Current steps applied to neuron shown in top trace did not cause clear voltagechanges in neuron shown in bottom trace. D: responses of same 2 neurons to trains of short depolarizing current pulses applied only to neuron in top trace (10-msIPI). The stimulated neuron spikes in response to each stimulus pulse (top), and small spikelets in the second cell that are coincident with these spikes can beseen under current clamp (middle) and inward/outward currents can be seen under voltage clamp (bottom). E: example of a mixed chemical-electrical synapticconnection between 2 ELp neurons. Current steps applied to neuron shown in top trace did not cause clear voltage changes in neuron shown in bottom trace.F: responses of same 2 neurons to trains of short depolarizing current pulses applied only to neuron in top trace (10-ms IPI). The stimulated neuron spikes inresponse to each stimulus pulse (top). In the second cell, small spikelets that are coincident with these spikes can be seen under current clamp, and these arefollowed by slower depolarizing potentials (middle). Inward/outward currents that are coincident with these spikes can be seen under voltage clamp, and theseare followed by slower inward currents (bottom). G: examples of dye coupling among ELp neurons (scale bars, 50 �m). Individual cells were filled with biocytinduring in vivo recordings. After processing the tissue, multiple stained cells were often visible. Left: strong dye coupling between 2 neurons, along with apparentpoints of synaptic contact (arrowheads). Center: strong dye coupling between 2 neurons located directly adjacent to each other, along with weak dye couplingwith several neurons (e.g., arrowheads). Right: strong dye coupling between 3 neurons, along with weak dye coupling with several neurons (e.g., arrowheads).
462 EXCITATORY NETWORKS AND TEMPORAL PROCESSING
J Neurophysiol • doi:10.1152/jn.00145.2013 • www.jn.org
at Washington U
niv on July 16, 2013http://jn.physiology.org/
Dow
nloaded from

latency (Spearman rank R � 0.03; P � 0.7). Electrical syn-apses were even more limited in their spatial extent, with nonedetected at distances � 30 �m. Thus there was also a strongnegative correlation between distance and probability of elec-trical synaptic connection (Spearman rank R � �0.90; P �0.00001).
Rate-dependent depression is ubiquitous at excitatory syn-apses between neurons. Short-term synaptic plasticity and tem-poral summation have both been identified as mechanisms fortemporal filtering at synapses (Fortune and Rose 2001; George etal. 2011). To characterize short-term plasticity and temporalsummation at the excitatory synapses between ELp neurons, weexamined synaptic responses to presynaptic spike trains of 10pulses with IPIs of 10, 50, or 100 ms (e.g., Fig. 6A). We did notobserve synaptic facilitation in any of these recordings; instead weobserved clear synaptic depression of both EPSPs and EPSCs at
every excitatory synapse tested at all three IPIs (Fig. 6). Analyzingthe change in normalized peak synaptic current as a function ofpulse number under voltage clamp revealed a significant decreasein synaptic currents [repeated-measures ANOVA: F(8,136) �14.89, P � 0.000001]. There was also a significant interactioneffect between IPI and pulse number [F(16,272) � 5.17, P �0.000001], reflecting a greater decrease in synaptic current duringthe 10- and 50-ms IPI trains compared with the 100-ms IPI train(Fig. 6B). At the shortest IPI tested (10 ms), temporal summationcounteracted the effects of depression (Fig. 6A), causing the totalsynaptic current in response to the second pulse to remain rela-tively high, and leading to a similar overall decrease in synapticcurrent compared with 50-ms IPIs (Fig. 6B).
To test whether synaptic depression at the excitatorysynapses between ELp neurons varies with respect to IPItuning, we performed additional statistical tests. First, we
B
C
Excitatory
Electrical
0-5
(n =
34)
5-10
(n =
61)
10-1
5 (n
= 9
5)
15-2
0 (n
= 2
2)
20-2
5 (n
= 6
3)
25-3
0 (n
= 2
8)
30-3
5 (n
= 2
9)
35-4
0 (n
= 1
0)
40-4
5 (n
= 8
)
45-5
0 (n
= 4
)
50-5
5 (n
= 1
6)
55-7
5 (n
= 8
)
75-1
00 (n
= 5
)
100-
200
(n =
16)
>200
(n =
8)
Distance between somas (µm)
0
10
20
30
40
50
60
Pro
babi
lity
of s
ynap
tic c
onne
ctio
n (%
)
A
Syn
aptic
stre
ngth
(mV
)
Sim
ilar
tuni
ng( n
= 4
1)
Diff
eren
ttu
ning
(n =
30)
0
0.3
0.6
1.2
0.9
Ons
et la
tenc
y (m
s)
0
0.5
1
2
1.5
Sim
ilar
tuni
ng(n
= 4
1)
Diff
eren
ttu
ning
(n =
30)
Pea
k la
tenc
y (m
s)
0
2.5
5
10
7.5
Sim
ilar
tuni
ng(n
= 4
1)
Diff
eren
ttu
ning
(n =
30)
Low-pass
Band-pass
High-pass
Low-pass
Band-pass
High-pass
Excitatory SynapticConnection Probabilities
Electrical SynapticConnection Probabilities
24.3%
19.1%
8.3%
14.0%2.3%
11.1%
3.7%
21.5%
12.8%
16.7%
23.3%
11.1%
9.5%
Fig. 5. Synaptic connection probability varieswith IPI tuning and distance, and synapticstrength varies with IPI tuning. A: connectiondiagrams illustrating excitatory synaptic con-nection probabilities (top) and electrical syn-aptic connection probabilities (bottom) amonglow-, band-, and high-pass neurons. Arrowsindicate directionality of the connections, andline thickness indicates relative differences inconnection probabilities, with text labels in-dicating the actual probability of a synapticconnection. All electrical synaptic connec-tions were bidirectional. B: for excitatory syn-aptic connections, synaptic strength (EPSPamplitude) was significantly larger for con-nected neurons with similar IPI tuning thanconnected neurons with different IPI tuning[Mann-Whitney U-test: z(41,30) � 2.72, P �0.01]. There was no significant difference inlatencies to EPSP onset [z(41,30) � 1.11, P �0.2] or peak [z(41,30) � 0.42, P � 0.6].C: probability of excitatory and electrical syn-aptic connections with respect to distance be-tween recorded somas. Sample sizes show thenumbers of neuron pairs recorded at each rangeof distances.
20mV
3mV
Presynaptic
Postsynaptic
10 ms IPI 50 ms IPI 100 ms IPI
40pA
Single pulse
100 ms10 ms
1
0.4
0.6
0.8
1 2 3 4 5 6 7 8 9 10Pulse number
Nor
m. s
ynap
tic c
urre
nt
n = 18
10 ms IPI
100 ms IPI50 ms IPI
A B
Fig. 6. Excitatory synaptic connections among ELp neurons are characterized by rate-dependent depression. A: synaptic potentials and synaptic currents inresponse to stimulating neuron in top trace with short depolarizing current pulses delivered singly or in 10-ms, 50-ms, or 100-ms IPI trains, after averaging across15 repetitions. B: change in normalized synaptic current as a function of pulse number and IPI among 18 postsynaptic neurons.
463EXCITATORY NETWORKS AND TEMPORAL PROCESSING
J Neurophysiol • doi:10.1152/jn.00145.2013 • www.jn.org
at Washington U
niv on July 16, 2013http://jn.physiology.org/
Dow
nloaded from

added an independent variable to our repeated-measuresANOVA to compare the amount of depression at synapsesbetween similarly tuned neurons (e.g., high-pass and high-pass, n � 10) to the amount of depression at differentlytuned neurons (e.g., high-pass and low-pass, n � 8). How-ever, there was no significant interaction effect betweenpulse number and similar versus different tuning [F(8,128) �1.19, P � 0.3] or between pulse number, IPI, and similarversus different tuning [F(16,256) � 0.73, P � 0.7]. Thenwe performed two similar analyses, first comparing presyn-aptic high-pass (n � 10) versus low-pass (n � 3) neuronsand then comparing postsynaptic high-pass (n � 8) versuslow-pass (n � 5) neurons. Again, there was no significantinteraction effect between pulse number and tuning type[presynaptic: F(8,88) � 1.42, P � 0.1; postsynaptic:F(8,88) � 0.43, P � 0.8] or between pulse number, IPI, andtuning type [presynaptic: F(16,176) � 0.90, P � 0.5;postsynaptic: F(16,176) � 1.45, P � 0.1]. Thus rate-depen-dent depression appears to be ubiquitous at excitatory syn-apses between ELp neurons, and there is no evidence that itskinetics are adapted to the IPI tuning of pre- or postsynapticneurons.
Excitatory synaptic transmission involves both NMDA andnon-NMDA glutamate receptors. Fast glutamatergic synaptictransmission is typically mediated by non-NMDA receptors,whereas synaptic potentials mediated by NMDA receptorsgenerally have a slower onset and a longer duration as well asvoltage dependence (Andreasen et al. 1988, 1989; Forsythe andWestbrook 1988; McBain and Mayer 1994). To determinewhether both types of receptors contribute to excitatory syn-aptic transmission in ELp, we bath applied the NMDA receptorantagonist APV and the non-NMDA receptor antagonistDNQX. Application of either drug reduced depolarizing syn-aptic responses (EPSPs) to ELa stimulation (e.g., Fig. 7A).Blocking NMDA receptors with APV led to a significantreduction in EPSP amplitude [Wilcoxon matched-pairs test:z(47) � 4.62, P � 0.00001] as well as a significant decrease inlatency to the peak [z(47) � 4.15, P � 0.0001], suggesting aselective effect on slow EPSP components (Fig. 7B). Blockingnon-NMDA receptors with DNQX also led to a significantreduction in EPSP amplitude [z(56) � 6.25, P � 0.000001] buta significant increase in latency to the peak [z(56) � 5.16, P �0.000001], suggesting a selective effect on fast EPSP compo-nents (Fig. 7B). Blocking both receptors eliminated synaptic
B D
A
C
Control APV DNQXWash-out Wash-outEnlarged APV and DNQX
100 ms
20 mV 1 mV
100 ms
APVDNQX
APV
DNQX
20 ms
500 µV
50 mV
Control
APV
DNQX
Wash-out
Wash-out
Presynaptic
Contro
l
Wash-i
n
Wash-o
ut
1
1.2
0.8
0.6
0.4
0.2
0
Rel
ativ
e m
axim
um d
epol
ariz
atio
n
Contro
l
Wash-i
n
Wash-o
ut
Contro
l
Wash-i
n
Wash-o
ut
1
1.2
0.8
0.6
0.4
0.2
0
3
3.5
2.5
2
1.5
1
0.5
Rel
ativ
e m
axim
um d
epol
ariz
atio
n
Rel
ativ
e la
tenc
y to
max
imum
dep
olar
izat
ion
APV (n = 47, 39 washout)DNQX (n = 56, 49 washout)APV+DNQX (n = 8, 3 washout)
APV (n = 5, 4 washout)DNQX (n = 10, 4 washout)
ELa stim.
Fig. 7. Excitatory synaptic transmission relies on both slow NMDA and fast non-NMDA glutamate receptors. A: average synaptic potentials of 2 simultaneouslyrecorded ELp neurons in response to ELa stimulation before, during, and after application of the NMDA receptor antagonist DL-2-amino-5-phosphonopentanoicacid (APV) and the non-NMDA receptor antagonist 6,7-dinitroquinoxaline-2,3-dione (DNQX). B: effects of APV and DNQX on maximum synapticdepolarization and latency to maximum synaptic depolarization in response to ELa stimulation, normalized to predrug control values (means � SE). C: averagesynaptic potentials of a single ELp neuron in response to stimulation of a presynaptic ELp neuron before, during, and after application of the NMDA receptorantagonist APV and the non-NMDA receptor antagonist DNQX. D: effects of APV and DNQX on maximum synaptic depolarization in response to stimulationof a single presynaptic neuron, normalized to predrug control values (means � SE).
464 EXCITATORY NETWORKS AND TEMPORAL PROCESSING
J Neurophysiol • doi:10.1152/jn.00145.2013 • www.jn.org
at Washington U
niv on July 16, 2013http://jn.physiology.org/
Dow
nloaded from

responses to within recording noise levels [z(8) � 2.52, P �0.05] (Fig. 7B). For the cells that we were able to test with bothdrugs, DNQX caused a significantly larger decrease in synapticresponse compared with APV [z(40) � 3.34, P � 0.001].
In other sensory circuits, slow NMDA receptors and fastnon-NMDA receptors have been shown to play distinct roles intemporal filtering (Daw et al. 1993). However, the effects ofAPV and DNQX on single-pulse responses did not differ withrespect to IPI tuning [APV: F(5,41) � 1.58, P � 0.1; DNQX:F(5,50) � 1.17, P � 0.3]. Interestingly, application of eitherdrug resulted in a shift toward high-pass tuning. Of 24 neurons,application of DNQX caused the number of high-pass neuronsto increase from 10 (41.7%) to 19 (79.2%) [t(46) � 2.66, P �0.05] and the number of low-pass neurons to decrease from 4(16.7%) to 0 (0.0%) [t(46) � 2.09, P � 0.05]. Of 32 neurons,application of APV caused the number of high-pass neurons toincrease from 9 (28.1%) to 18 (56.2%) [t(62) � 2.28, P �0.05] and the number of low-pass neurons to decrease from9 (28.1%) to 4 (12.5%) [t(62) � 1.55, P � 0.1]. Thus theinterplay between both receptor types may be importantin establishing variation in temporal filtering among ELpneurons.
To directly examine whether NMDA and non-NMDA re-ceptors contribute to excitation between ELp neurons, we bathapplied APV and DNQX during paired recordings from neu-rons having excitatory synaptic connections (e.g., Fig. 7C). Inevery pair tested, application of APV led to a decrease in EPSPamplitude [z(5) � 2.02, P � 0.05] and application of DNQXalso led to a decrease in EPSP amplitude [z(10) � 2.70, P �0.01] (Fig. 7D). The synaptic responses under these conditionswere too small to reliably measure synaptic latencies. In fiveconnected neuron pairs, we were able to test DNQX and APVseparately, and in every case both drugs reduced EPSP ampli-tudes (e.g., Fig. 7C). Thus individual excitatory synaptic con-nections between ELp neurons appear to be mediated by bothNMDA and non-NMDA glutamate receptors.
Direct and indirect synaptic connections contribute to tem-poral selectivity. To investigate the contribution of individualneurons to the IPI tuning of other neurons in the circuit, wesilenced neurons that normally spiked in response to ELastimulation by hyperpolarizing the membrane potential to��90 mV. First, we determined the IPI tuning of both neuronsunder control conditions. Then, we silenced the spiking neuronand determined the IPI tuning of the other neuron. Synapticresponses were affected in every pair of neurons having anexcitatory (e.g., Fig. 8A) or electrical (e.g., Fig. 8B) synaptic
connection. In neuron pairs having an excitatory synapticconnection, three of five (60%) postsynaptic neurons changedtheir tuning categorization after silencing the presynaptic cell.Similarly, three of four (75%) neurons having an electricalsynaptic connection changed their tuning categorization aftersilencing the spiking cell.
Given the high connectivity of this circuit, it is unlikely thatthe observed changes in response were due solely to the directconnection between the two cells. To determine the degree towhich indirect synaptic connections could affect responses, wesilenced spiking cells while determining the IPI tuning of asecond neuron that did not have any apparent synaptic connec-tion with the spiking neuron. In several cases, this also had astrong effect on synaptic responses to ELa stimulation (Fig.8C). Twelve of twenty-two (54.5%) nonconnected neuronschanged their tuning categorization after the spiking neuronwas silenced, indicating indirect effects mediated by interneu-rons and further suggesting dense connectivity among ELpneurons that contributes to IPI tuning.
To quantify the effects of silencing neurons on the responsesof other neurons, we measured the absolute values of thedifferences in maximum synaptic potentials before and duringsilencing across all IPI stimuli and then averaged across stim-uli. Neurons receiving a chemical excitatory input from thespiking cell were affected the most, followed by neurons withan electrical synaptic connection, and finally neurons with noapparent synaptic connection (Fig. 8D) [ANOVA: F(2,28) �4.33, P � 0.01].
DISCUSSION
We found high levels of excitatory connectivity, consistentwith the extensive dendritic arbors and intrinsic axonal projec-tions of ELp neurons (George et al. 2011; Xu-Friedman andHopkins 1999). Excitatory connection probabilities were great-est among similarly tuned neurons located within 50 �m ofeach other, and excitatory connection strengths were greatestamong similarly tuned neurons (Fig. 9A). These excitatoryinteractions were mediated by both NMDA and non-NMDAglutamatergic signaling, and they contributed to the temporalselectivity of individual neurons.
We hypothesize that the relatively large number of stronginputs from similarly tuned neurons reinforce the general IPItuning pattern (e.g., high-pass vs. low-pass) and contribute tovariation in tuning curve shape, whereas the relatively smallnumber of weak inputs from differently tuned neurons alter IPI
BA C
ControlSpiking cell silenced
0
3
4
5
7
Avg.
cha
nge
in re
spon
se (m
V)
6
Non
. (n
= 22
)
Ele
c. (n
= 4
)
Che
m. (
n =
5)
1
2
0 20 40 60 80 1005
15
25
Max
imum
depo
l. (m
V)
Interpulse interval (ms)
0
10
20
5
15
Interpulse interval (ms)
Max
imum
depo
l. (m
V)
0 20 40 60 80 100
Max
imum
depo
l. (m
V)
0 20 40 60 80 100Interpulse interval (ms)
0 20 40 60 80 1005
15
25
35
Max
imum
depo
l. (m
V)
Interpulse interval (ms)
0
10
5
15
Interpulse interval (ms)
Max
imum
depo
l. (m
V)
0 20 40 60 80 10014
20
26
32
Max
imum
depo
l. (m
V)
0 20 40 60 80 100Interpulse interval (ms)
Spiking cell
Other cell
D
26
32
28
30
Fig. 8. Single neurons contribute to the IPItuning of other neurons. A–C: examples ofchanges in response when a spiking cell thatprovided excitatory synaptic input (A), elec-trical synaptic input (B), or no direct synapticinput (C) to the other recorded cell wassilenced by hyperpolarization. The IPI tun-ing of the spiking cell is shown at top, andthe IPI tuning of the other cell, before andduring silencing of the spiking cell, is shownat bottom. D: average change in responseacross all IPIs was largest for excitatorysynaptic connections (Chem) and smallestfor nonconnected neurons (Non).
465EXCITATORY NETWORKS AND TEMPORAL PROCESSING
J Neurophysiol • doi:10.1152/jn.00145.2013 • www.jn.org
at Washington U
niv on July 16, 2013http://jn.physiology.org/
Dow
nloaded from

tuning in more subtle ways (Fig. 9B). The shapes of IPI tuningcurves vary among the population of ELp neurons, both in vivo(Carlson 2009) and in vitro (George et al. 2011). Because ofthis diversity, changes in IPI will be represented by changes inthe population of responsive ELp neurons, thereby convertinga temporal code into a population code (Baker et al. 2013). Wesuggest that IPI tuning diversity is established, in part, by eachindividual neuron receiving a unique complement of localexcitatory inputs (Fig. 9B). Population codes are common incentral sensory pathways, as they are an efficient means ofaccurately representing a large number of stimuli (Averbeck et
al. 2006). By contributing to variation in stimulus tuningamong neurons, the types of network interactions we describehere may prove to be a fundamental mechanism for increasingthe precision of population coding.
Excitatory interactions in sensory microcircuits. Multineu-ron intracellular recordings, photostimulation, and optical im-aging have been performed extensively in slice preparations ofrodent sensory cortex to elucidate cortical microcircuitry. Wefound a number of similarities between cortical and ELpconnectivity patterns. Synapses in both circuits are character-ized by short-term depression (De Pasquale and Sherman 2011;Perin et al. 2011; Reig et al. 2006; Reyes et al. 1998). Theprobability of a chemical excitatory connection between adja-cent cortical pyramidal neurons is similar to ELp, �10–20%(Markram et al. 1997; Yoshimura et al. 2005), and theseconnection probabilities also decrease with distance (Perin etal. 2011). In addition, bidirectional synaptic connections inELp were significantly stronger than unidirectional connec-tions and bidirectional connection strengths were correlated,both of which are also features of cortical microcircuitry (Songet al. 2005).
Cortical pyramidal neurons tend to cluster into highly con-nected assemblies of a few dozen neurons each (Perin et al.2011; Song et al. 2005; Yoshimura et al. 2005). The exactfunctional significance of these assemblies remains unknown,but mounting evidence suggests they play an important role ininformation processing and sensory perception: stimulation ofsingle cortical neurons can have wide-ranging effects on cor-tical activity in vivo (Kwan and Dan 2012), and this caninfluence sensory perception (Houweling and Brecht 2008),evoke movements (Brecht et al. 2004), and modify global brainstate (Li et al. 2009). Furthermore, neurons in visual cortex thathave the same orientation tuning are significantly more likelyto share a connection than neurons with orthogonal orientationtuning (Ko et al. 2011). Although we cannot yet determinewhether similar assemblies exist within ELp, our results sug-gest this is likely.
Variation in synaptic strength in both ELp and cortex con-forms to a log-normal distribution, in which weak synapses arecommon and strong synapses are rare (Song et al. 2005). Alog-normal distribution of synaptic connection strengths maybe a natural consequence of the activity-dependent rules gov-erning long-term synaptic plasticity (Song et al. 2005). Indeed,the existence of NMDA receptors at the synapses between ELpneurons raises the intriguing possibility of spike timing-depen-dent plasticity in the circuit (Bell et al. 1997b; Dan and Poo2004; Shouval et al. 2002). It will be interesting to determinewhether long-term plasticity occurs in ELp and, if so, its timecourse and behavioral relevance to the processing of electriccommunication signals. Although our understanding of ELpmicrocircuitry clearly lags far behind our understanding ofcortical microcircuitry, the mormyrid system has the advantagethat it is more straightforward to draw links between neuronalactivity in vitro and its relevance to behavior and sensoryprocessing in vivo (Baker et al. 2013).
Electrical coupling in sensory microcircuits. We also foundextensive electrical coupling among ELp neurons, based onboth paired recordings and dye coupling. Electrical connectionprobabilities decreased steeply with distance, from as high as50% at distances of �5 �m to 0% beyond 35 �m. The effectsof these apparent gap junctions on voltages at the soma were
ELaSmall Cells
Low-PassNeurons
Band-PassNeurons
High-PassNeurons
A
B
IPI
Res
pons
e
plus all inputsbaseline plus similarly tuned inputs
plus differently tuned inputs
Fig. 9. Schematics summarizing local excitatory network connectivity in ELpand the hypothesized role for network interactions in shaping IPI tuning.A: schematic summarizing the excitatory network topology of ELp. Small cellsfrom ELa project topographically to ELp, synapsing onto ELp neuronsthroughout its anterior-posterior extent (Friedman and Hopkins 1998). Indi-vidual ELp neurons are more likely to provide excitatory input to nearbyneurons (Fig. 5C), they are more likely to provide excitatory input to similarlytuned neurons (Fig. 5A), and their excitatory connections with similarly tunedneurons are stronger than their excitatory connections with differently tunedneurons (Fig. 5B). B: hypothesized role of local excitatory interactions inshaping IPI tuning. Three low-pass neurons are shown, and they all have thesame IPI tuning in the absence of local excitatory inputs. This baseline IPItuning could arise because of local inhibitory input or short-term depression ofexcitatory input from ELa (Baker et al. 2013; George et al. 2011). Each neuronreceives strong excitatory input from 3 low-pass neurons and weak excitatoryinput from 2 high-pass neurons, each with a different tuning curve. Relative tobaseline tuning, the strong excitatory inputs are scaled to 0.6 and the weakexcitatory inputs are scaled to 0.3 to simulate the effects of these inputs on IPItuning. The strong excitatory inputs from similarly tuned neurons reinforce thelow-pass tuning of each neuron but also contribute to variation in the shape oftheir tuning curves. The weak excitatory inputs from differently tuned neuronscontribute to variation in tuning curve shape without changing the basic patternof tuning. Each neuron has a distinct tuning curve because they each receivea unique combination of local excitatory inputs.
466 EXCITATORY NETWORKS AND TEMPORAL PROCESSING
J Neurophysiol • doi:10.1152/jn.00145.2013 • www.jn.org
at Washington U
niv on July 16, 2013http://jn.physiology.org/
Dow
nloaded from

relatively small in all but one case. Although they may notstrongly influence somatic voltage individually, their effects onlocal synaptic integration within dendritic arbors could stillshape information processing by ELp neurons, as suggested bythe effects of silencing electrically coupled neurons on IPItuning. For example, weak electrical synapses could enhanceor sharpen the temporal precision of coincidence detection indendrites (Harnett et al. 2012; Takahashi et al. 2012) or shaperesponses to the temporal sequence in which different dendriticinputs are activated (Branco et al. 2010; Branco and Häusser2011). Furthermore, it is likely that large numbers of electricalsynapses from many neurons will be active in response tosensory stimuli, which together could drive spike synchrony ordesynchrony across the network (Vervaeke et al. 2010; Wanget al. 2010) as well as shape longer-term modulations in firingrate (Vandecasteele et al. 2005).
Multiple mechanisms for temporal processing. Temporalsequences are important components of many sensory stimuli,especially communication signals (Pollack 2001). Neuralmechanisms for the processing of temporal sequences havebeen studied in several different vertebrate sensory pathways(Baker et al. 2013; Rose 1986; Rose and Fortune 1999). Acommon theme has emerged, in which timing- or rate-depen-dent shifts in the balance between excitation and inhibition canarise from mechanisms such as short-term synaptic plasticity,temporal summation of synaptic inputs, and differences in therelative timing or durations of synaptic inputs (Edwards et al.2007, 2008; Fortune and Rose 2001; George et al. 2011; Kluget al. 2012; Rose et al. 2011). Passive and active membraneproperties can also contribute to temporal filtering (Carlson andKawasaki 2006; Fortune and Rose 1997, 2003). However, outof practical necessity, these studies have largely focused onsynaptic integration and cellular physiology in individual cells,and not on the underlying network architecture that establishesvariation in synaptic inputs. In the present study, we reveal thatlocal excitatory interactions can also influence the processingof temporal sequences.
Each excitatory synapse was characterized by rate-depen-dent short-term depression (Zucker and Regehr 2002). Theattenuation of EPSPs at short IPIs would seem to establishlow-pass tuning in the circuit (Baker et al. 2013). However, wedo not yet know the nature of short-term plasticity at ELa-to-ELp synapses, or in the inhibitory pathways to ELp neurons, sothe balance between depression of excitation and inhibitionremains unknown. In addition, a large number of excitatoryinputs are activated in response to sensory stimulation orstimulation of incoming ELa axons (Carlson 2009; George etal. 2011), resulting in spatial summation. The effects of tem-poral summation on these spatially summated EPSPs contrib-ute substantially to IPI tuning (George et al. 2011). We suggestthat short-term depression, temporal summation, and variationin the relative timing of synaptic inputs establish temporalfiltering through synaptic integration within ELp neurons, andthat network interactions among ELp neurons serve to enhanceand diversify this temporal filtering (Fig. 9). Thus the IPItuning of an individual neuron reflects both the IPI tuning of itsinputs as well as the spatiotemporal integration of those inputs.
The coding of multiple stimulus features. In many sensorysystems, lateral interactions between neurons are important inspatial analysis (Bell et al. 1997a; Hartline 1969; Khosravi-Hashemi et al. 2011; Sachdev et al. 2012). By directly stimu-
lating the afferent inputs to ELp, we effectively mimickedsensory stimulation of the entire body surface, allowing us tofocus on the role of network interactions in temporal process-ing. However, these interactions may also be involved in thespatial analysis of electric signals. During natural communica-tion behavior, the spatial extent of electrosensory stimulationon the receiving fish’s body will vary as the relative locationand orientation of the signaling fish change (Schluger andHopkins 1987). In addition to their IPI tuning, ELp neuronsrecorded in vivo respond selectively to pulse duration andintensity as well as the location and orientation of signalingfish (Amagai 1998). The initial analysis of these otherfeatures appears to be performed in ELa (Friedman andHopkins 1998). Small cells, the only ELa output neurons,project topographically to ELp (Friedman and Hopkins1998). They traverse the border between ELa/ELp to thedistal edge of ELp while maintaining their medio-lateralposition, giving off en passant synaptic boutons onto den-drites throughout their length (Friedman and Hopkins 1998).The topographic input from small cells suggests there maybe a spatial representation of electric signal features in ELp,but we do not yet know whether small cells actually repre-sent stimulus information topographically. They receiveexcitatory input from elongated axons that follow a convo-luted path through ELa (Friedman and Hopkins 1998),making it unlikely for there to be any precise mapping oftemporal or spatial features (Xu-Friedman and Hopkins1999). However, the inhibitory input to small cells is moredirect (Friedman and Hopkins 1998), and this could con-tribute to a spatial representation of stimulus information inELa.
Toward a network model of temporal processing. Our find-ings were facilitated by the development of an in vitrowhole brain preparation in a model system that allows forsimultaneous intracellular recording from multiple neurons,precisely timed synaptic stimulation, and pharmacologicalmanipulation, all while keeping neuronal circuitry intact.Furthermore, the unique characteristics of this sensory path-way allow us to directly relate temporal patterns of synapticstimulation to the processing of natural stimuli (Carlson2009; George et al. 2011). This preparation will facilitatefuture technical directions including simultaneous record-ings from more than two neurons, “blind” recordings fromdeep neurons combined with visualized recordings fromsuperficial neurons, simultaneous recordings from neuronsin ELa and ELp, calcium imaging of cell populations anddendritic integration, detailed anatomical studies of func-tional variation in synaptic morphology and location alongdendritic arbors, and spatially precise neurotransmitter ag-onist and antagonist delivery. Combining these approacheswill eventually allow us to construct a comprehensive modelof electric signal processing that incorporates the morphol-ogy and synaptic and cellular physiology of individualneurons along with the network interactions among thoseneurons.
ACKNOWLEDGMENTS
Thanks to Dianne Duncan and Elizabeth Haswell for assistance withconfocal imaging.
467EXCITATORY NETWORKS AND TEMPORAL PROCESSING
J Neurophysiol • doi:10.1152/jn.00145.2013 • www.jn.org
at Washington U
niv on July 16, 2013http://jn.physiology.org/
Dow
nloaded from
GRANTS
This work was supported by a grant from the National Science Foundation(IOS-1050701 to B. A. Carlson) and a fellowship from the Japan Society forthe Promotion of Science (G2205 to T. Kohashi).
DISCLOSURES
No conflicts of interest, financial or otherwise, are declared by the author(s).
AUTHOR CONTRIBUTIONS
Author contributions: X.M., T.K., and B.A.C. conception and design ofresearch; X.M., T.K., and B.A.C. performed experiments; X.M. and B.A.C.analyzed data; X.M., T.K., and B.A.C. interpreted results of experiments;X.M., T.K., and B.A.C. edited and revised manuscript; X.M., T.K., and B.A.C.approved final version of manuscript; B.A.C. prepared figures; B.A.C. draftedmanuscript.
REFERENCES
Ahrens MB, Keller PJ. Whole-brain functional imaging at cellular resolutionusing light-sheet microscopy. Nat Methods 10: 413–420, 2013.
Amagai S. Time coding in the midbrain of mormyrid electric fish. II. Stimulusselectivity in the nucleus exterolateralis pars posterior. J Comp Physiol A182: 131–143, 1998.
Andreasen M, Lambert JD, Jensen MS. Direct demonstration of an N-methyl-D-aspartate receptor mediated component of excitatory synaptic transmission inarea CA1 of the rat hippocampus. Neurosci Lett 93: 61–66, 1988.
Andreasen M, Lambert JD, Jensen MS. Effects of new non-N-methyl-D-aspartate antagonists on synaptic transmission in the in vitro rat hippocam-pus. J Physiol 414: 3147–3336, 1989.
Arnegard ME, Carlson BA. Electric organ discharge patterns during grouphunting by a mormyrid fish. Proc Biol Sci 272: 1305–1314, 2005.
Averbeck BB, Latham PE, Pouget A. Neural correlations, population codingand computation. Nat Rev Neurosci 7: 358–366, 2006.
Baker C, Kohashi T, Lyons-Warren A, Ma X, Carlson B. Multiplexedtemporal coding of electric communication signals in mormyrid fishes. JExp Biol. In press.
Bell CC, Caputi A, Grant K. Physiology and plasticity of morphologicallyidentified cells in the mormyrid electrosensory lobe. J Neurosci 17: 6409–6423, 1997a.
Bell CC, Han VZ, Sugawara Y, Grant K. Synaptic plasticity in a cerebel-lum-like structure depends on temporal order. Nature 387: 278–281, 1997b.
Branco T, Clark BA, Häusser M. Dendritic discrimination of temporal inputsequences in cortical neurons. Science 329: 1671–1675, 2010.
Branco T, Häusser M. Synaptic integration gradients in single corticalpyramidal cell dendrites. Neuron 69: 885–892, 2011.
Brecht M, Schneider M, Sakmann B, Margrie TW. Whisker movementsevoked by stimulation of single pyramidal cells in rat motor cortex. Nature427: 704–710, 2004.
Brown SP, Hestrin S. Intracortical circuits of pyramidal neurons reflect theirlong-range axonal targets. Nature 457: 1133–1136, 2009.
Carlson BA. Electric signaling behavior and the mechanisms of electric organdischarge production in mormyrid fish. J Physiol (Paris) 96: 405–419,2002a.
Carlson BA. Neuroanatomy of the mormyrid electromotor control system. JComp Neurol 454: 440–455, 2002b.
Carlson BA. A neuroethology of electrocommunication: senders, receivers,and everything in between. In: Communication in Fishes, edited by LadichF, Collin SP, Moller P, Kapoor BG. Enfield, NH: Science Publishers, 2006,p. 805–848.
Carlson BA. Temporal-pattern recognition by single neurons in a sensorypathway devoted to social communication behavior. J Neurosci 29: 9417–9428, 2009.
Carlson BA, Kawasaki M. Stimulus selectivity is enhanced by voltage-dependent conductances in combination-sensitive neurons. J Neurophysiol96: 3362–3377, 2006.
Dan Y, Poo MM. Spike timing-dependent plasticity of neural circuits. Neuron44: 23–30, 2004.
Daw N, Stein P, Fox K. The role of NMDA receptors in informationprocessing. Annu Rev Neurosci 16: 207–222, 1993.
De Pasquale R, Sherman SM. Synaptic properties of corticocortical connec-tions between the primary and secondary visual cortical areas in the mouse.J Neurosci 31: 16494–16506, 2011.
Duguid IC, Smart TG. Retrograde activation of presynaptic NMDA receptorsenhances GABA release at cerebellar interneuron-Purkinje cell synapses.Nat Neurosci 7: 525–533, 2004.
Edwards CJ, Leary CJ, Rose GJ. Counting on inhibition and rate-dependentexcitation in the auditory system. J Neurosci 27: 13384–13392, 2007.
Edwards CJ, Leary CJ, Rose GJ. Mechanisms of long-interval selectivity inmidbrain auditory neurons: roles of excitation, inhibition, and plasticity. JNeurophysiol 100: 3407–3416, 2008.
Feldmeyer D, Lübke J, Sakmann B. Efficacy and connectivity of intraco-lumnar pairs of layer 2/3 pyramidal cells in the barrel cortex of juvenile rats.J Physiol 575: 583–602, 2006.
Feldmeyer D, Lübke J, Silver RA, Sakmann B. Synaptic connectionsbetween layer 4 spiny neurone-layer 2/3 pyramidal cell pairs in juvenile ratbarrel cortex: physiology and anatomy of interlaminar signalling within acortical column. J Physiol 538: 803–822, 2002.
Fino F, Yuste R. Dense inhibitory connectivity in neocortex. Neuron 69:1188–1203, 2011.
Forsythe ID, Westbrook GL. Slow excitatory postsynaptic currents mediatedby N-methyl-D-aspartate receptors on cultured mouse central neurones. JPhysiol 396: 515–533, 1988.
Fortune ES, Rose GJ. Passive and active membrane properties contribute tothe temporal filtering properties of midbrain neurons in vivo. J Neurosci 17:3815–3825, 1997.
Fortune ES, Rose GJ. Short-term synaptic plasticity as a temporal filter.Trends Neurosci 24: 381–385, 2001.
Fortune ES, Rose GJ. Voltage-gated Na� channels enhance the temporalfiltering properties of electrosensory neurons in the torus. J Neurophysiol 90:924–929, 2003.
Friedman MA, Hopkins CD. Neural substrates for species recognition in thetime-coding electrosensory pathway of mormyrid electric fish. J Neurosci18: 1171–1185, 1998.
George AA, Lyons-Warren AM, Ma X, Carlson BA. A diversity of synapticfilters are created by temporal summation of excitation and inhibition. JNeurosci 31: 14721–14734, 2011.
Gill T. On the West African genus Hemichromis and description of newspecies in the museums of the Academy and Smithsonian Institution. ProcNatl Acad Sci Phila 14: 134–139, 1862.
Grillner SG, Markram H, De Schutter E, Silberberg G, LeBeau FE.Microcircuits in action—from CPGs to neocortex. Trends Neurosci 28:525–533, 2005.
Harnett MT, Makara JK, Spruston N, Kath WL, Magee JC. Synapticamplification by dendritic spines enhances input cooperativity. Nature 491:599–602, 2012.
Hartline HK. Visual receptors and retinal interaction. Science 164: 270–278,1969.
Hopkins CD, Bass AH. Temporal coding of species recognition signals in anelectric fish. Science 212: 85–87, 1981.
Houweling AR, Brecht M. Behavioural report of single neuron stimulation insomatosensory cortex. Nature 451: 65–68, 2008.
Kampa B, Letzkus J, Stuart G. Cortical feed-forward networks for bindingdifferent streams of sensory information. Nat Neurosci 9: 1472–1473, 2006.
Khosravi-Hashemi N, Fortune ES, Chacron MJ. Coding movement direc-tion by burst firing in electrosensory neurons. J Neurophysiol 106: 1954–1968, 2011.
Klug A, Borst JG, Carlson BA, Kopp-Scheinpflug C, Klyachko VA,Xu-Friedman MA. How do short-term changes at synapses fine-tuneinformation processing? J Neurosci 32: 14058–14063, 2012.
Ko H, Hofer SB, Pichler B, Buchanan KA, Sjöström PJ, Mrsic-Flogel TD.Functional specificity of local synaptic connections in neocortical networks.Nature 473: 87–91, 2011.
Kwan AC, Dan Y. Dissection of cortical microcircuits by single-neuronstimulation in vivo. Curr Biol 22: 1459–1467, 2012.
Li CY, Poo MM, Dan Y. Burst spiking of a single cortical neuron modifiesglobal brain state. Science 324: 643–646, 2009.
Liu SJ, Lachamp P. The activation of excitatory glutamate receptors evokesa long-lasting increase in the release of GABA from cerebellar stellate cells.J Neurosci 26: 9332–9339, 2006.
Lübke J, Markram H, Frotscher M, Sakmann B. Frequency and dendriticdistribution of autapses established by layer 5 pyramidal neurons in thedeveloping rat neocortex: comparison with synaptic innervation of adjacentneurons of the same class. J Neurosci 16: 3209–3218, 1996.
Lyons-Warren AM, Hollmann M, Carlson BA. Sensory receptor diversityestablishes a peripheral population code for stimulus duration at low inten-sities. J Exp Biol 215: 2586–2600, 2012.
468 EXCITATORY NETWORKS AND TEMPORAL PROCESSING
J Neurophysiol • doi:10.1152/jn.00145.2013 • www.jn.org
at Washington U
niv on July 16, 2013http://jn.physiology.org/
Dow
nloaded from

Markram H, Lübke J, Frotscher M, Roth A, Sakmann B. Physiology andanatomy of synaptic connections between thick tufted pyramidal neurones inthe developing rat neocortex. J Physiol 500: 409–440, 1997.
Mathew SS, Hablitz JJ. Presynaptic NMDA receptors mediate IPSC poten-tiation at GABAergic synapses in developing rat neocortex. PLoS One 6:e17311, 2011.
McBain CJ, Mayer ML. N-methyl-D-aspartic acid receptor structure andfunction. Physiol Rev 74: 723–760, 1994.
Mishchenko Y, Hu T, Spacek J, Mendenhall J, Harris KM, ChklovskiiDB. Ultrastructural analysis of hippocampal neuropil from the connectomicsperspective. Neuron 67: 1009–1020, 2010.
Perin R, Berger TK, Markram H. A synaptic organizing principle forcortical neuronal groups. Proc Natl Acad Sci USA 108: 5419–5424, 2011.
Pollack GS. Analysis of temporal patterns of communication signals. CurrOpin Neurobiol 11: 734–738, 2001.
Poulet JF, Petersen CC. Internal brain state regulates membrane potentialsynchrony in barrel cortex of behaving mice. Nature 454: 881–885, 2008.
Reig R, Gallego R, Nowak L, Sanchez-Vives MV. Impact of cortical networkactivity on short-term synaptic depression. Cereb Cortex 16: 688–695,2006.
Reyes A, Lujan R, Rozov A, Burnashev N, Somogyi P, Sakmann B.Target-cell-specific facilitation and depression in neocortical circuits. NatNeurosci 1: 279–285, 1998.
Rose G. A temporal-processing mechanism for all species? Brain Behav Evol28: 134–144, 1986.
Rose GJ, Fortune ES. Mechanisms for generating temporal filters in theelectrosensory system. J Exp Biol 202: 1281–1289, 1999.
Rose GJ, Leary CJ, Edwards CJ. Interval-counting neurons in the anuranauditory midbrain: factors underlying diversity of interval tuning. J CompPhysiol A 197: 97–108, 2011.
Sachdev RN, Krause MR, Mazer JA. Surround suppression and sparsecoding in visual and barrel cortices. Front Neural Circuits 6: 1–14, 2012.
Schluger JH, Hopkins CD. Electric fish approach stationary signal sources byfollowing electric current lines. J Exp Biol 130: 359–367, 1987.
Shouval HZ, Bear MF, Cooper LN. A unified model of NMDA receptor-dependent bidirectional synaptic plasticity. Proc Natl Acad Sci USA 99:10831–10836, 2002.
Song S, Sjostrom P, Reigl M, Nelson S, Chlovskii DB. Highly nonrandomfeatures of synaptic connectivity in local cortical circuits. PLoS Biol 3: e68,2005.
Szuts TA, Fadeyev V, Kachiguine S, Sher A, Grivich MV, Agrochão M,Hottowy P, Dabrowski D, Lubenov EV, Siapas AG, Uchida N, LitkeAM, Meister M. A wireless multi-channel neural amplifier for freelymoving animals. Nat Neurosci 14: 263–269, 2011.
Takahashi N, Kitamura K, Matsuo N, Mayford M, Kano M, Matsuki N,Ikegaya Y. Locally synchronized synaptic inputs. Science 335: 353–356,2012.
Thivierge JP, Marcus GF. The topographic brain: from neural connectivity tocognition. Trends Neurosci 30: 251–259, 2007.
Vandecasteele M, Glowinski J, Venance L. Electrical synapses betweendopaminergic neurons of the substantia nigra pars compacta. J Neurosci 25:291–298, 2005.
Vervaeke K, Lörincz A, Gleeson P, Farinella M, Nusser Z, Silver RA.Rapid desynchronization of an electrically coupled interneuron networkwith sparse excitatory synaptic inputs. Neuron 67: 435–451, 2010.
von der Emde G. Active electrolocation of objects in weakly electric fish. JExp Biol 202: 1205–1215, 1999.
Wang Y, Barakat A, Zhou H. Electrotonic coupling between pyramidalneurons in the neocortex. PLoS One 5: e10253, 2010.
Wang Y, Gupta A, Toledo-Rodriguez M, Wu CZ, Markram H. Ana-tomical, physiological, molecular and circuit properties of nest basketcells in the developing somatosensory cortex. Cereb Cortex 12: 395–410, 2002.
Wong RY, Hopkins CD. Electrical and behavioral courtship displays in themormyrid fish Brienomyrus brachyistius. J Exp Biol 210: 2244 –2252,2007.
Xu-Friedman MA, Hopkins CD. Central mechanisms of temporal analysis inthe knollenorgan pathway of mormyrid electric fish. J Exp Biol 202:1311–1318, 1999.
Yoshimura Y, Dantzker JLM, Callaway E. Excitatory cortical networksform fine-scale functional networks. Nature 433: 868–873, 2005.
Zucker RS, Regehr WG. Short-term synaptic plasticity. Annu Rev Physiol 64:355–405, 2002.
469EXCITATORY NETWORKS AND TEMPORAL PROCESSING
J Neurophysiol • doi:10.1152/jn.00145.2013 • www.jn.org
at Washington U
niv on July 16, 2013http://jn.physiology.org/
Dow
nloaded from