external financing and insurance cycles · pdf filefinance at the kellogg graduate ......
TRANSCRIPT

This PDF is a selection from an out-of-print volume from the National Bureauof Economic Research
Volume Title: The Economics of Property-Casualty Insurance
Volume Author/Editor: David F. Bradford, editor
Volume Publisher: University of Chicago Press
Volume ISBN: 0-226-07026-3
Volume URL: http://www.nber.org/books/brad98-1
Publication Date: January 1998
Chapter Title: External Financing and Insurance Cycles
Chapter Author: Anne Gron, Deborah J. Lucas
Chapter URL: http://www.nber.org/chapters/c6937
Chapter pages in book: (p. 5 - 28)

1 External Financing and Insurance Cycles Anne Gron and Deborah Lucas
1.1 Introduction
The property-casualty insurance industry is characterized by an “insurance cycle”-periods of high prices and rationing followed by periods of expanding coverage and lower prices. One might expect that the high-price, restricted- supply phase would be short lived due to competition between insurers for profitable new business. In fact, this phase is persistent enough that it can be observed in annual data. A number of possible explanations for this phenome- non have been suggested. In this paper we test the hypothesis that these epi- sodes are due to .temporary capital shortages that reduce the industry’s ability to back risk (Winter 1988; Gron 1990). Such shocks to industry net work may arise either from reductions in asset value (e.g., a drop in the stock market) or from unanticipated increases in claims payments.
Past empirical studies of the cycle provide evidence that is consistent with the capital shortage hypothesis: industry capacity measures have a significant, negative relationship with price-claims margins, and large increases in price- claims margins are followed by increases in industry capacity as measured by net worth (Winter 1991a; Gron 1994a, 1994b). Yet this evidence does not ex- plain why capital shortages would not be quickly corrected by an infusion of new capital, particularly when profit margins are high. Unlike many industries, there appears to be no reason for a significant lag between the arrival of new capital and increased capacity. That is, the required “time to build” is short
Anne Gron is assistant professor of management and strategy at the Kellogg Graduate School of Management, Northwestern University. Deborah Lucas is Household International Professor of Finance at the Kellogg Graduate School of Management, Northwestern University, and a research associate of the National Bureau of Economic Research.
The authors thank Susan Chaplinsky, Robert Korajczyk, Mitchell Petersen, and participants at the 1994 Franco-American Economics Conference for helpful comments, and Kate Evert and Dino Faleschetti for careful research assistance. Bob Spatz provided valuable technical assistance.
5

6 Anne Gron and Deborah Lucas
because financial capital serves primarily as a buffer against high claims costs or poor asset performance.' This intuition is captured in models of insurance pricing without capital market frictions where price is equal to the present value of expected claims (see, e.g., Fairley 1979; Hill 1979; Myers and Cohn 1987). In order to explain periods of unusually high profitability, any model of capital constraints for this industry must rely on some mechanism that delays capital inflows when industry net worth is low.2
A primary reliance on internally generated funds to finance business expan- sion is not special to the property-casualty industry. Most firms prefer to use internally generated funds since they avoid the costs associated with external financing. Models attempting to explain this phenomenon typically postulate that capital market imperfections such as asymmetric information increase the cost of external funds. Thus, even if insurers can earn what ?ppear to be abnor- mal returns on new policies, the cost of raising external funds may exceed the potential benefits from the high returns earned on new policies. The question, then, is whether plausible issue costs can explain the persistence of high- price periods.
To date there has been little empirical research that systematically examines insurer financing decisions in relation to periods with and without likely capi- tal shortages. This paper provides such an overview of insurer financing behav- ior and its relation to the cycle. In particular, we look for evidence that might support the notion that the cost of external capital for the property-casualty industry is sufficiently high to explain the persistence of high-price, con- strained-output periods. Much of our focus is on stock insurers since these insurers should have greater access to external capital and because of data availability:
Section 1.2 begins with a description of the cyclic nature of the insurance industry over the period 1967-90, using aggregate industry and financial statis- tics for a sample of stock insurers. Since reducing cash payments to stockhold- ers is an alternative to issuing debt or equity, we look for evidence of changes in payout policy over the cycle. In section 1.3 we describe the sample of public debt and equity issues used in the analysis of external financing and summarize the evidence on how much insurers raise in the capital markets, what types of instruments are used, whether reliance on external sources has changed over time, and how financing varies with the relative abundance of capital in the industry and overall market conditions.
Evidence on the cost of external financing is examined in section 1.4. A key indicator of this cost is the stock price reaction to a security issue announce- ment since it reflects the revision in the market's expectations about the value of an issuing firm. To evaluate the hypothesis that external finance is unusually
1. It has been suggested, however, that in the aftermath of a major disaster, the disruption in
2. See also the models of insurance pricing with possible capital shortages by Cummins and established policyholder relationships may result in a longer time to build.
Danzon (1991). Cagle and Hanington (1995), and Doherty and G w e n (1995).
7 External Financing and Insurance Cycles
costly for the property-casualty industry, we measure the stock price reaction to insurer announcements of equity issues and debt issues and compare these price changes to those for other industries. We focus primarily on equity issues since these are a relatively costly form of external finance. Asquith and Mullins (1986) find that industrial firms announcing an equity issue experience a stock price decline of 2-3 percent on average, which for a typical issuer represents a drop in market value equal to about 20 percent of the total cash r a i ~ e d . ~ If stock price reactions to stock issues by property-casualty insurers are unusu- ally negative, this would provide evidence that insurers face a relatively high cost of external funds.4 Section 1.5 concludes with a discussion of explanations for the insurance cycle that are alternatives to the capital shortage hypothesis.
1.2 Industry Measures
In this section we summarize the performance of stock property-casualty insurers over the period 1967-90. Using data from a variety of sources, the time path of profitability, capital structure, and payout policy is related to the insurance cycle.
1.2.1
Insurance market conditions are usually described in terms of accounting profitability. Industry profitability, measured as net income divided by reve- nues, is graphed in figure l. l for the 1967-93 p e r i ~ d . ~ A change from declining to increasing profitability marks the beginning of a high-price, restricted- output period.6 During these years, there are three episodes of high price and restricted output: 1969-70, 1975-76, and 1985-86. Premium price changes, net worth series, and stock indexes follow a similar pattern. Gron (1994b) finds that large increases in price-claims indexes coincide with changes from de-
Measures of Profitability, Capacity, and Prices
3. One explanation for the price drop is that the riskiness of equity exacerbates problems of asymmetric information since purchasers anticipate issues by predominantly overvalued firms (Myers and Majluf 1984).
4. This research also contributes to the literature on the link between firm financing and real market outcomes, much of which explores the effect of decreased liquidity on real firm decisions. Recent theoretical and empirical work (e.g., Fazzari, Hubbard, and Petersen 1988; Chevalier and Scharfstein 1994) suggests that competition among firms is weaker, and price-noncapital cost margins are higher, when firms and the industry are more liquidity constrained. A similar pattern is observed in the property-casualty industry: when industry capacity is low the price of insurance relative to noncapital costs is higher, perhaps reflecting a temporary increase in the opportunity cost of capital.
5. Unless otherwise noted, the data described here are from Best’s Aggregates and Averages (A. M. Best Company, various years).
6. Price and quantity data would be preferable for describing market conditions, but they are not available. Other profitability series show the same time-series pattern (Stewart 1984). Due to accounting practices, income from insurance premiums tends to reflect pricing conditions for the previous as well as the current accounting period. Therefore, the greatest increase in profitability will not necessarily coincide with the largest increase in prices. Anecdotal evidence confirms that pricing changes occur around the time accounting profitability changes. Gron (1994a) and Cum- mins and Outreville (1986) provide useful discussions of insurance accounting.

8 Anne Gron and Deborah Lucas
Fig. 1.1
+t+ 67 71 75 79 83 87 91
69 73 77 81 85 89 93 Year
Industry operating income
9 1.4
$ 1.3 m - .- L
3, 1.2 .- J= L m 1.1
Year
Fig. 1.2 Industry capacity
creasing to increasing accounting profitability. Large increases in the price- claims margin occur in 1969-70, 1975-76, and 1985.
Capacity is related to the volume of policies that can be supported by the industry's capital base. Although a precise regulatory measure of capacity does not exist, the time-series pattern of various proxies for industry capacity are consistent with the capital shortage hypothesis (see fig. 1.2). For instance, here industry capacity is measured as the ratio of industry net worth to its five-year historical average. The series has relative minima at 1969, 1974, and 1984, suggesting that capacity is low immediately before price-claims margins rise. The figure also reveals that large declines in capacity immediately precede low-capacity years.7
7. Net worth divided by a historical average is also used in Winter (1991) and in Gron (1994b). A different measure of capacity, industry net worth divided by GNF', displays a similar pattern and

9 External Financing and Insurance Cycles
Fig. 1.3 Property-casualty stock returns, 1970-87
Finally, figure 1.3 displays annual returns for A. M. Best's property-casualty company stock index for the years 1970-87.8 Data for more recent years are unavailable. The stock return series shows a pattern similar to the other indus- try aggregates: returns of property-casualty firms reach relative minima in 1974 and 1984, with substantial increases in annual returns in the years imme- diately following these relative minima.
For comparison to the above aggregates, we also collected data on a sample of large property-casualty and multiline insurers listed in quarterly and/or an- nual Compustat for the 1970-92 period. Data for 38 different insurers are available from this source, but not all insurers were listed for the entire period. Data for 1970-72 are particularly sparse, and for the remainder of the 1970s there are an average of 21 observations per year. Observations per year increase to about 30 in the early 1980s and to 35 by the end of the period.
Figure 1.4 shows the annual means of income normalized by sales or assets for this Compustat sample. The pattern found in the aggregate industry ratios is also seen here. Clearly, 1985 was a year of particularly low income. Income was relatively low as well in 1970 and 1974. The mean annual ratio of liabili- ties to assets is generally increasing over the period. While the ratio declines somewhat in the latter part of the 1970s, there is really only one distinct fea- ture, which is the significant increase in liabilities relative to assets in 1985.
1.2.2 Payout Policy
Internally generated funds represent by far the largest source of capital for U.S. corporations.I0 The primary advantage of internal financing is that it
is used in Gron (1994a, 1994b). For a more detailed exploration of the capacity-price time-series relationship, see Gron (1994b).
8. Stock index data are from van Aartrijk (1985) and A. M. Best Company (1988). 9. Two firms had negative equity for one year: Mission Insurance in 1985 and Ambase in 1990.
Mission was declared insolvent and liquidated in 1985. Ambase was reorganized in 1990. These observations were dropped from the sample.
10. The OECD reports that internal funds comprise almost 80 percent of financing for U.S. firms in the period 1984-88.

10 Anne Gron and Deborah Lucas
1 0.12
0.08
1 0.06
i! 0.04 g 0.02
e
- 0
..............................................................
.............
69 70 11 12 7374 15 76 n l 0 7 9 00 01 02 03 04 05 06 'el 'eS'e9'WQI' Year
....................................................................
..................................
avoids the direct and indirect costs associated with issuing new securities. Clearly, one way for firms to increase available internal funds is to cut back on payouts to shareholders, that is, by reducing dividends or repurchases. While stock repurchases are considered discretionary, managers appear reluctant to reduce dividends except when under strong financial pressure to do so, in part because of the negative stock price reaction to dividend cuts. As a result, we expect to see an overall reduction in dividend growth rates and repurchase activity during periods of industry-wide capital shortages, with a potentially larger response of repurchases than of dividends.
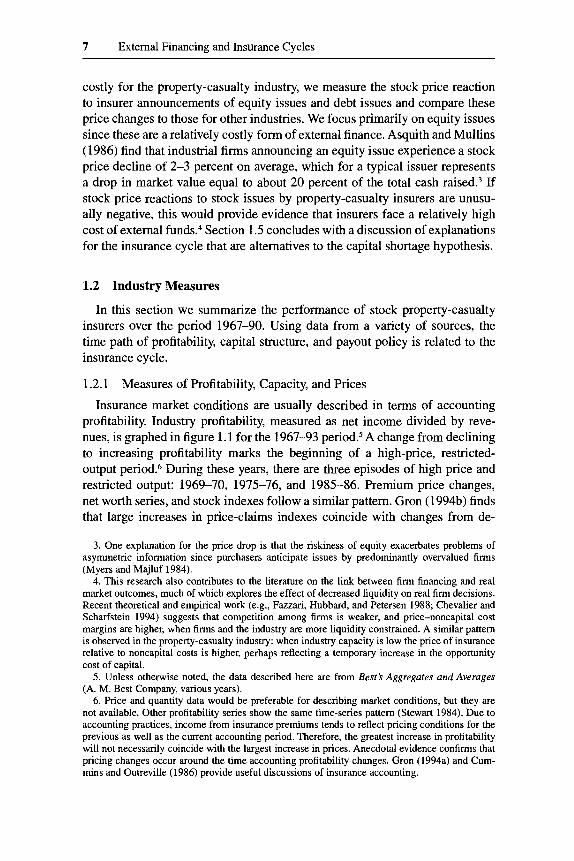
One measure of dividend policy is the payout ratio, which measures the dollar dividend per share divided by earnings per share. Figure 1.5 plots the payout ratio for the period 1972-90 using data from quarterly Compustat on property-casualty insurers, as described above. Notice that the payout ratio
11 External Financing and Insurance Cycles
140 :: 5
n 0 100
* 80
60
40
20
0 72 75 78 81 84 87 90
Year
Fig. 1.5 Dividend payout ratio
Fig. 1.6 Growth in stockholder dividends
hovers between 25 and 60 percent for most of this period, with a noticeable increase in the payout ratio in the two years preceding the earnings crash of 1984-85. As in other industries, it appears that insurers follow a fairly smooth payout policy. The exception to this was the period 1984-85, at which time dividends clearly fell by much less than earnings. If 1975-76 and 1985-86 are taken to be periods of capital shortage, the graph is consistent with the idea that payout ratios were somewhat reduced in the years immediately following these episodes, perhaps in an effort to rebuild capital. Similar conclusions can be drawn from the time-series behavior of the dividend yield (dividend divided by price).
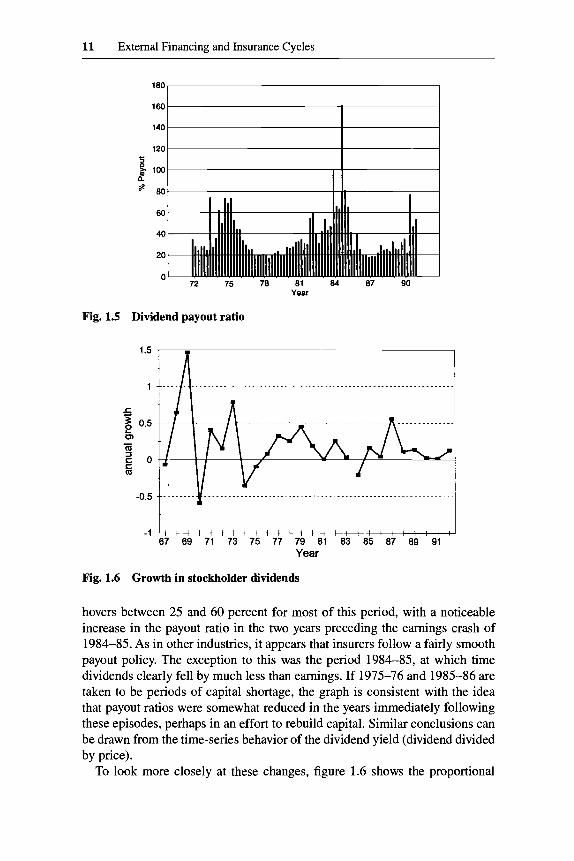
To look more closely at these changes, figure 1.6 shows the proportional

12 Anne Gron and Deborah Lucas
-7 ' I 72 75 70 01 04 07 90
Year
Fig. 1.7 Repurchases (as percentage of stock outstanding)
changes in aggregate stockholder dividends over the 1967-92 period." Consis- tent with the idea that dividends are only reduced under duress, negative growth is rarely observed. In fact, years with dividend cuts coincide with turn- ing points in the cycle-1970, 1974-75, and 1984-suggesting some attempt was made to conserve scarce capital.
As discussed above, an alternative to dividends is to use share repurchases to distribute cash. Although still less important than dividends, the volume of repurchases by U.S. firms has grown steadily over the past several decades. Figure 1.7 plots equity repurchases and issues over the 1972-90 period, also using data from quarterly Compustat for firms classified as property-casualty insurers. The data again support the idea that insurers were trying to rebuild capital following the 1984-85 shock. In particular, no repurchases for the 32 firms in the sample were reported from 1985-87, but repurchase activity re- sumed in 1988 and thereafter. Interpreting repurchase activity for the earlier period is more problematic because repurchases are less prevalent and because data are available for only 12 firms. The increase in repurchase activity in 1983-84 is consistent with the rise in dividend payout ratios in the same years, but it is somewhat surprising in light of the drop in net worth that appears at about the same time.
1.3 Firm Financing Behavior
The statistics presented in the previous section suggest that profitability in the property-casualty industry has varied markedly over time, with episodes of high prices and restricted output in 1969-70, 1975-76, and most notably in
11. The data are from BestSAggregutes undAveruges. The pre-1983 series consists of aggregate stock company measures. The post-1983 series consists of consolidated data for all insurers. The large increase in 1969 is most likely a one-time adjustment due to the passage of the Holding Company Act.

13 External Financing and Insurance Cycles
1985-86. Although payouts to shareholders grew at a slower rate in the high- price, restricted-output phases, the large fluctuations in capital do not appear to be substantially offset by efforts to conserve internally generated funds via changes in payout policy.
An alternative to financing with retained earnings is to raise capital exter- nally. Here we focus on public debt and equity issues as sources of external funds and examine how the volume of new issues in the property-casualty in- dustry has varied over time and with market conditions. We concentrate on debt and equity because of data availability and because these sources are likely to account for a large fraction of external financing. It should be noted, however, that other sources of external finance, including bank loans, private placements of debt and equity, and other types of securities such as convertible bonds or warrants, are also potential sources of capital.
1.3.1 Data
We obtained all SEC-registered debt and equity announcement and issue dates for the property-casualty industry from the Securities Data Company (SDC). Since 1970, this sample includes 171 equity issues by 100 different property-casualty companies, reinsurers, and holding companies, totaling over $1 1.5 billion. We also obtained information on companies in these categories for 142 debt issues that yielded over $13.6 billion. The data obtained include the total value of the issue, the number of shares issued in the case of equity, and the type of debt or equity issued (e.g., preferred, common, subordinated). For companies with a listed issue date but no announcement date, the an- nouncement date was obtained when possible from the Wall Street Journal Zndex. The sample does not include companies that announce an issue but then do not follow through with it.
1.3.2 Volume of Equity Issues over Time
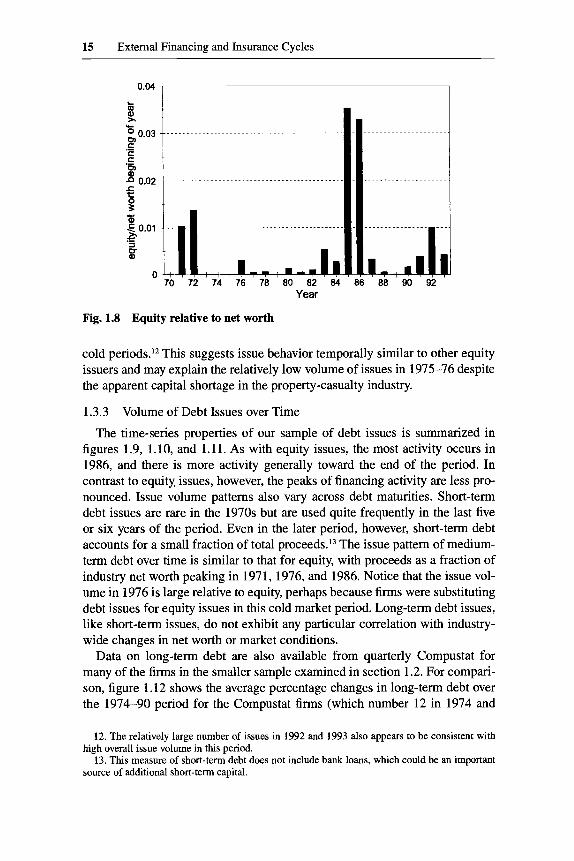
The time-series pattern of external financing in the property-casualty indus- try can be related to potentially explanatory variables such as changes in firm and industry net worth, stock market returns, and economy-wide financing be- havior. Table 1.1 shows the number of firms issuing equity each year and the total dollar value of issues, while figure 1.8 shows the annual dollar volume of equity issues as a fraction of industry net worth. For all series the data display two peaks: a larger peak at 1985-86 and a smaller peak at 1971-72. These correspond to two of the three periods of high price and restricted output. In the third period in which industry data suggest a capital shortage, 1975-76, there is not such a clear peak. While total equity offered relative to industry net worth increases slightly in 1976, the number of firms issuing equity is not significantly different from other years. As with the earlier series, the activity during the 1980s is significantly greater than that of the preceding period.
The question arises of whether insurers issue more during certain periods because of conditions particular to the property-casualty industry, or whether

14 Anne Gron and Deborah Lucas
Table 1.1 Equity and Debt Issues
No. of Value of Equity Issues No. of Debt Value of Debt Issues Year Equity Issues (million $) Issues (million $)
1970 1 3.5 3 172.2 1971 14 191.9 2 26.1 1972 18 313.1 5 130 1973 1 0.6 3 213.3 1974 0 0 2 200.4 1975 0 0 1 0.4 1976 2 78.8 3 1 05 1977 4 15.6 4 103.6 1978 5 23.1 4 157.3 1979 0 0 2 22.7 1980 4 72 3 66.9 1981 2 35.2 3 116 1982 2 71.5 5 241.5 1983 7 404.5 4 322.8 1984 4 222.7 2 99.8 1985 29 2,787.9 9 947.5 1986 29 3,067.5 15 1,816.6 1987 6 386 12 1,369.7 1988 4 69.5 13 1,443 1989 1 15.5 7 1,445.3 1990 4 272 1 99.9 1991 6 669.3 15 1,813 1992 14 1,968.5 11 1,338.2 1993 14 860.9 13 1,408.6
they were simply following broad-based financing trends in the market. For industrial firms, the volume of equity issues varies substantially over time, with the bulk of issues clustered in “hot” market periods. One prominent character- istic of hot market periods is that aggregate stock market returns are above av- erage.
To examine whether property-casualty issues are clustered with those of in- dustrial issuers, we use the classification of historical hot and cold market peri- ods identified by Bayless and Chaplinsky (1994). For their sample of industrial firms they find that 60 percent of the issues occur in hot periods (28 percent of the months considered) while only 13 percent of the issues occur in cold peri- ods (29 percent of these months). Why this pronounced clustering of equity issues occurs remains somewhat mysterious; some have attributed it to tempo- ral variations in adverse selection while others point to fads in financing mech- anisms and waves of market optimism. Whatever the explanation, the average stock price drop for industrial firms is lower during hot periods by about 2 percent, a substantial cost differential that appears to benefit hot.market issuers (Bayless and Chaplinsky 1994). For the 137 issues in our sample that occurred over this time period, 66 occurred in hot periods while only 10 occurred in
15 External Financing and Insurance Cycles
0.04 1 I
Year
Fig. 1.8 Equity relative to net worth
cold periods.I2 This suggests issue behavior temporally similar to other equity issuers and may explain the relatively low volume of issues in 1975-76 despite the apparent capital shortage in the property-casualty industry.
1.3.3 Volume of Debt Issues over Time
The time-series properties of our sample of debt issues is summarized in figures 1.9, 1.10, and 1.11. As with equity issues, the most activity occurs in 1986, and there is more activity generally toward the end of the period. In contrast to equity issues, however, the peaks of financing activity are less pro- nounced. Issue volume patterns also vary across debt maturities. Short-term debt issues are rare in the 1970s but are used quite frequently in the last five or six years of the period. Even in the later period, however, short-term debt accounts for a small fraction of total pr0~eeds.l~ The issue pattern of medium- term debt over time is similar to that for equity, with proceeds as a fraction of industry net worth peaking in 1971, 1976, and 1986. Notice that the issue vol- ume in 1976 is large relative to equity, perhaps because firms were substituting debt issues for equity issues in this cold market period. Long-term debt issues, like short-term issues, do not exhibit any particular correlation with industry- wide changes in net worth or market conditions.
Data on long-term debt are also available from quarterly Compustat for many of the firms in the smaller sample examined in section 1.2. For compari- son, figure 1.12 shows the average percentage changes in long-term debt over the 1974-90 period for the Compustat firms (which number 12 in 1974 and
12. The relatively large number of issues in 1992 and 1993 also appears to be consistent with
13. This measure of short-term debt does not include bank loans, which could be an important high overall issue volume in this period.
source of additional short-term capital.

16 Anne Gron and Deborah Lucas
16 1 I
b 0
$ 6
E z 4 2
0
.................................................
..............................................
..............................................
Year
Fig. 1.9 Debt issues
= 0.015
5 I E
8 2
+ 0.01 v) 'D al
q.005
0 70 72 74 76 70 00 02 04 86 08 90 92
Year
Fig. 1.10 Debt issues relative to net worth
increase to 28 firms in 1989). As for the larger SDC sample, on average changes to debt were positive but show no particular pattern in relation to the insurance cycle. Notice that the large percentage increases in the earlier part of the period reflect the low base of debt at that time. Figure 1.13 shows the ratio of long-term debt to total assets over the same period, where total assets is measured as the sum of market equity and book liabilities. In this graph the increase in the ratio of debt to value in 1984-85 primarily reflects the drop in stock price rather than an increase in debt.
As in the case of equity issues, it is difficult to disentangle increases in exter- nal financing due to events particular to the property-casualty industry from increases due to broader market trends. The growth of debt financing in the

17 External Financing and Insurance Cycles
-20
0.014
0.011
0.01
0
I = 0.WB
B
j
c g 0.m Ti
3 0.m
0.w;
C
I
Fig. 1.11 Debt by maturity
+msdium tam debt
40
30
b 20'
6 $ 10
0
-10 '- I
I I l l
Fig. 1.12 Changes in debt
middle to late 1980s is consistent with large economy-wide increases in lever- age, due in part to the more favorable tax treatment of debt following the Tax Reform Act of 1986.
1.3.4 Evaluating the Importance of External Finance
As we have seen, the observed pattern of debt and equity issues is consistent with the idea that insurers use external finance to offset reductions in capital,

18 Anne Gron and Deborah Lucas
-.--
0.07
0.06
0.05
0.04
0.03
0.02
0.01
-
-
-
-
-
-
-
0- 75 76 77 70 79 00 01 02 03 84 05 06 07 00 09
Year
Fig. 1.13 Long-term debt (as fraction of firm value)
i 0.3
-0.3 67- 69 71 73 75 77 79 a1 a3 as a7 89 97 93
Year
Fig. 1.14 Growth in industry net worth
but it could also be attributed to broader market trends. To evaluate the quanti- tative importance of external finance in offsetting the cycle, we compare the total amount of externally generated financing to changes in total net worth. The annual growth in real net worth for the industry is shown in figure 1.14. Negative-growth years are 1969, 1973, 1974, 1981, 1984, 1990, 1992, where the last two are quite close to zero. High-growth years generally follow those with negative growth and include 1971, 1972, 1975, 1976, 1985, and 1986. The use of external financing is actually greater in these high-growth years, which might be explained by the lead time needed to arrange an issue. The delay could also arise if insurers wait for the market to recognize the potential for profitable expansion before issuing. Interestingly, the amount of total capi- tal raised in equity and debt markets is not large relative to the total increase in net worth in these years. The ratio of total debt and equity funds generated

19 External Financing and Insurance Cycles
to the increase in stock insurers’ net worth is 13 percent in 1970,4 percent in 1976, and 33.6 percent in 1985. Of course, the amounts raised represent a much larger fraction of the net worth of the issuing firms.
To evaluate whether the relationship between issues and capacity is statisti- cally significant, we performed the regression analysis presented in table 1.2. For both equity and debt issues, we examined three measures: the number of issues, the real value of funds issued, and the value of funds issued relative to industry net worth at the beginning of the year. Our explanatory variables are capacity at the beginning of the year, measured as industry net worth as of the beginning of the year divided by the five-year historical average, and the ratio of industry liabilities to assets, as of the beginning of the year.I4 The results in table 1.2 show there is a negative relationship between industry capacity and the various measures of equity financing. This relationship is generally sig- nificant at or above the 15 percent confidence level. In addition, there is a positive relationship between measures of equity financing and the ratio of liabilities to assets at the beginning of the period, although this relationship is less precisely measured. On the other hand, there is no statistically significant relationship between capacity and measures of debt financing. Debt financing, like equity financing, is positively related to industry leverage as measured by liabilities relative to assets.
An often-cited “capacity” statistic in the industry is the ratio of premium revenue to net worth. This ratio reflects the industry’s leverage in terms of pre- mium revenue. Under the assumption that premium revenue primarily reflects the expectation of uncertain claims costs, this ratio reflects expected costs rela- tive to the funds available if realized costs exceed their expectations. If there is some maximum ratio of premium revenue to net worth and if insurers are at or near that limit after declines in net worth, then the percentage increase in net worth following a security issue translates into the same percentage increase in premium revenue supported. As seen from the discussion above, the increase in premium revenue that can be supported by the externally generated funds is relatively small for all years but 1985-87.
1.4 The Announcement Effect of Equity and Debt Issues
As discussed earlier, there are significant direct and indirect costs to security issues that can discourage firms from financing otherwise attractive investment opportunities. Direct costs include underwriters’ fees, SEC filing require- ments, distribution costs, bank charges, and so on. The largest indirect cost, usually associated with the issue of risky securities such as equity, is the nega- tive market price reaction to the announcement of an issue. The argument that high-price, restricted-output periods in the property-casualty industry are due to capital shortages implicitly rests on the idea that raising capital is prohibi-
14. Industry data are from Best‘s Aggregates and Averages, as described in section 1.2.

Table 1.2 External Financing and Industry Capacity
Dependent Variables
No. of Real Value of Value of Equity Issues / No. of Real Value of Value of Debt Issues / Explanatory Variable Equity Issues Equity Issues Net Worth Debt Issues Debt Issues Net Worth
Capacity -13.54 - 1,47 1.68 -.017 -3.50 -455.30 - ,006 (-1.54) (-1.69) (- 1.72) (-31) ( - .82) (- 1.12)
Liability / assets 49.58 7,612.00 .06 58.61 6,530.88 .03
R2 .13 .2 1 .16 .33 .21 .ll
(1.33) (2.06) ( 1.45) (3.20) (2.79) (1.43)
Nores: Numbers in parentheses are t-statistics. All regressions have 24 observations.

21 External Financing and Insurance Cycles
tively expensive as a result of these direct and indirect costs. To see whether there is evidence of unusually high financing costs, in this section we measure the stock price reaction to insurance company issues of debt and equity and compare the reaction to that for other financial and industrial firms.
1.4.1 Equity Issues
We focus primarily on equity issues because they provide capital in a form that is clearly acceptable to regulators and because they are a relatively expen- sive form of financing. Not only are there significant direct costs involved in equity issues, estimated to range from 1 to 5 percent of the value issued, but issuers typically experience a significant drop in their stock price as well.
One commonly accepted explanation for the announcement-day price drop is that asymmetric information between managers and potential shareholders creates an adverse selection problem (Myers and Majluf 1984). Firms that real- ize their stock is overvalued have an incentive to issue additional stock since their current shareholders will benefit at the expense of the new buyers. Simi- larly, managers who believe their stock is undervalued will avoid issuing eq- uity. Potential buyers, realizing these incentives, react to the announcement of an equity issue as a signal that the stock is overvalued, and hence the market price falls. Consequently, many firms whose stock is not undervalued would forgo or postpone valuable investment opportunities or rely more on internal financing rather than issue equity at a depressed price.15
Empirical studies of stock price behavior around equity issues ( e g , Masulis and Korwar 1986; Mikkelson and Partch 1986; Korajczyk, Lucas, and McDon- ald 1990) reveal a number of regularities that are consistent with this basic adverse selection story. For industrial firms, stock prices fall an average of 2-3 percent at the announcement of an issue. Following this, there is a further drop of about 0.5 percent for firms that follow through with an issue. Studies have also found that issuing firms have abnormally high returns in the months pre- ceding the announcement of an issue, an observation that also can be explained by the impact of adverse selection in a multiperiod setting (Lucas and McDon- ald 1990). More recent evidence suggests that issuing firms experience nega- tive abnormal returns in the three to five years after they issue, suggesting that the price drop at announcement underestimates the bad news associated with the average issue (Loughran and Ritter 1996).
The price behavior for financial firms and utilities is somewhat different. For instance, the announcement-day stock price drop for public utilities is con- siderably lower than for industrial firms. The differential may be due to the facts that utilities issue more frequently so the announcement is more likely to be anticipated and that they have more easily observable investment projects.
15. This argument presumes that undervalued firms have no way to credibly and inexpensively convey this information to the market. One might also argue that the price drop does not represent a cost to firms that are overvalued. Even for this group, however, firms acting in the interests of shareholders who would prefer to see their stock at a higher price will be reluctant to issue.

22 Anne Gron and Deborah Lucas
The fact that their rate of return is regulated may also have an impact. In a study of the banking industry, Cornett and Tehranian (1994) conjecture that the stock price reaction to equity issues by commercial banks will be more pronounced for “voluntary” than for “involuntary” issues, and they find some evidence supporting this claim. An involuntary issue is defined as occumng when the issuing bank is in violation of regulatory capital adequacy require- ments. l 6
On a priori grounds it is not clear how the indirect costs of equity issues should be expected to change over the insurance cycle. In analogy to the case of commercial banks studied by Cornett and Tehranian (1994), one might ex- pect the stock price reaction to equity issues to be less negative during the high-price, constrained-supply phase because investors can observe the need for capital and the potential for profitable investment. This suggests that insur- ers would face relatively low costs of issuing equity in these periods, making it more puzzling that supply shortages persist. On the other hand, insurance is an information-intensive business, and it is plausible that managers have a much better idea of the value of their assets and liabilities than does the market. Even during a high-price, constrained-output phase, an equity issue could re- veal that a firm was hit with a particularly large number of costly claims or low asset returns, forcing it to go to the equity market.
Results
To assess the market price reaction to an insurer equity issue, we calculate abnormal returns over the 20-day window surrounding the announcement of an equity issue. The abnormal return is calculated as the daily return of the issuing company minus the daily return of a value-weighted market index.I7 These returns are taken from the Center for Research on Security Prices (CRSP) data tapes, which provide information on NYSE/AMEX and NASDAQ stocks. Of the 171 equity issue events obtained from SDC and after excluding brokerages, we were able to match 113 to CRSP data using CUSIP identification numbers. Cumulative abnormal returns were calculated by com- pounding the average daily abnormal returns over the 20-day window.
On day 0 (the announcement day) the average price drop across the 113 events for which data were available was 1.1 percent, with a standard deviation of 2.69 percent. Although the drop is not statistically significant, it is much larger than the typical daily abnormal return in other days in the event window, which never exceeds 0.45 percent. In contrast to previous studies on industrial firms, no apparent price drop is observed on day -1, suggesting little informa- tion leakage prior to the announcement. The standard deviation of abnormal returns is fairly constant over the event window. Figure 1.15 summarizes the
16. A parallel experiment for property-casualty insurers is complicated by the absence of a well- specified regulatory capital requirement.
17. The results are unchanged if an equally weighted index is used to calculate abnormal returns. It is also possible to calculate P-adjusted abnormal returns, but this requires more financial data and generally makes little difference in this type of event study.

23 External Financing and Insurance Cycles
0.02 Y)
5 0.01 E .- P o
z -0.01 la - 0
-0.041 " " " " " " " " " ' -10 -8 -6 -4 -2 0 2 4 6 8 10
days (relative to announcement)
Fig. 1.15 Equity issues (cumulative abnormal returns)
behavior of abnormal returns for issuing firms. As a robustness check, we also calculated the price reaction excluding firms that were classified as primarily brokerages or health and accident and including all firms for which data were available. The price drop and variance for the different samples were almost identical.
Because of the small sample size, it is hard to draw strong conclusions about how this price reaction compares to that for other industries. It appears, how- ever, that the price drop is relatively small compared to the experience of indus- trial firms, which typically drop 2-3 percent in value. It is more similar to the price drop in response to bank equity issues of 1.56 percent for voluntary issues and 0.64 percent for involuntary issues found by Cornett and Tehranian (1994). This relatively small price drop exacerbates the puzzle of why insurers do not rely more on external financing during the high-price, constrained-supply phase of the insurance cycle.
The Effect of Market Climate
Recall that many property-casualty industry issues occur during economy- wide hot market periods, and that for industrial firms the price drop is lower at these times. To see whether insurers issuing in hot markets also gain a price advantage, we divide the sample between "hot" and "not hot" issuers, again using the date classifications suggested by Bayless and Chaplinsky (1994)Y
Hot Not Hot
11/8(M3/84 07/85-09/87 04/88- 10/88
03/69-10/80 04/84-06/85 10/87-03/88 11188-10/89
18. Because of the small number of issue events in each year, it is not possible to identify systematic changes in the price drop over time more finely.

24 Anne Gron and Deborah Lucas
In our sample 52 announcements occur in identified hot periods and 26 an- nouncements occur in not hot periods. Consistent with the findings for indus- trial firms, the average price drop for the hot market issuers was only 0.7 percent while for not hot market issuers the drop was 1.6 percent. For the unclassified post-October 1989 period, the average price drop for the 36 events in our sample is 1 percent. In none of the subperiods is the price drop statisti- cally significantly different from zero, although (with the exception of the hot market group) they are at least twice as large as the average price change on any other day in the 20-day window.I9
Cross-Sectional InJuences
The price drop at issue announcement is potentially affected by cross- sectional factors such as the size of the issue. In a regression of the price drop on issue size, however, no significant relationship was detected.
1.4.2 Debt Issues
In comparison to most other companies insurers have little ordinary debt in their capital structure. One explanation for this is that policyholders already have debtlike claims on a firm’s cash flows, making additional fixed obligations less attractive. Still, issuing debt that is junior to the claims of policyholders is a viable way to increase capital, particularly as a short-term measure. For most firms issuing debt is a less costly alternative to issuing equity because of both lower direct costs and lower indirect costs. Indirect costs are lower because it is fairly easy for management and the market to agree on the value of a low- risk security such as debt. This implies that one would not expect to see a large price drop on the announcement of a debt issue, a conjecture that has been confirmed by earlier empirical work on industrial firm issues.
To see how the market responds to property-casualty industry debt issues we follow the methodology of the previous section, computing average abnormal returns in the 20-day window centered on debt issue announcement days (see fig. 1.16). For the 82 debt issues for which announcement days could be matched to stock return data, the price drop on the announcement day averaged 0.5 percent. As expected, the drop was statistically insignificant and similar in magnitude to abnormal returns on other days in the window. It appears that the market receives property-casualty debt issues similarly to those of other firms.
1.5 Concluding Remarks
In this paper we have explored the conjecture that the periodic episodes of high prices and constrained supply in the property-casualty industry are the
19. It would be interesting to compare these statistics to the price response to issues in high- price, constrained-supply periods that do not correspond the hot market periods. Unfortunately only a few of the issues fall into this category, so no meaningful comparison can be made.

25 External Financing and Insurance Cycles
0.04
0.03
0.02 E = 0.01 z 3 0 - s i -0.01 a -0.02
0.03
-0.04 -10 -8 -6 -4 -2 0 2 4 6 8 10
days (relative to announcement)
Fig. 1.16 Debt issues (cumulative abnormal returns)
result of temporary capital shortages. To do this we looked for increases in activities aimed at increasing capital at these times: dividend cuts, repurchase cuts, equity issues, and debt issues. We also looked for evidence that the costs of raising external capital are unusually high relative to other industries by examining the market price response to security issues.
There is some evidence of payout policy changes in the expected direction, and also of an increased volume of debt and equity issues following low- capacity periods. The total amount of capital obtained by security issues or reduced payouts, however, appears to be small relative to the observed drops in net worth, suggesting that insurers rely primarily on future retained earnings to rebuild their capital positions. When property-casualty insurers do go to the capital markets we find no evidence that they receive an unusually poor recep- tion. In fact, the market price reaction to equity issues appears to be consider- ably less negative than for industrial issuers, but similar to that for banks and utilities.
These findings make the seeming reluctance of property-casualty insurers to rely more heavily on external capital markets somewhat surprising and suggest several possibilities to be explored in future research. One interpretation of our evidence is that the cycle should not be attributed to periodic shortages of capital, but instead to another factor(s) that remains to be identified. For in- stance, one explanation of the cycle that does not rely on capital market imper- fections is that premiums rise in response to new information about expected cost increases. Changes in loss distributions produce large reductions in indus- try net worth, and insurers update their estimates of expected claims and in- crease prices accordingly. Since current cost data do not fully reflect this new information, the relation between industry capacity and operating margins temporarily shifts. Under this alternative hypothesis, we would not expect in- surers’ cost of external financing to be unusually high, nor would insurance prices necessarily increase with low capital.
On the other hand, although the incorporation of new public information

26 Anne Gron and Deborah Lucas
into prices may be a factor in the cycle, new information alone is unlikely to explain a number of phenomena that appear to be related to the cost of capital or other asymmetric information problems. For one, periods of high prices also appear to be periods of rationing. The fact that insurers temporally concentrate their equity issues during periods in which other firms are issuing equity and in periods following an increase in industry profitability also suggests that asymmetric information is a factor.
A second possibility is that the costs of raising external capital are much higher than the observed price reactions to equity issues suggest, particularly for the firms that choose not to issue securities. A shortcoming of our method is that we can only observe costs for the firms that find it profitable to go ahead with an issue, and even in this case we rely on an indirect measure of the costs (i.e., the market price response). Several aspects of the data do point toward high costs: the propensity of firms to issue in hot markets, the somewhat higher cost of issuing in cold markets, and the small volume of equity and debt is- sues overall.
Finally, an interesting trend in the data is the significant increase in the use of debt and equity issues by insurers over time. If capital availability did play a major role in past fluctuations, we would expect to see less pronounced cycles in the future as the size and informational efficiency of capital markets continue to increase.
References
A. M. Best Company. Various years. Best’s aggregates and averages: Property-casualty. Oldwick, N.J.: A. M. Best Company.
. 1988. 1987 Insurance stock trends. BestS Review: Property-Casualty Insur- ance Edition 88 (11): 34-38,42.
Asquith, Paul, and David W. Mullins, Jr. 1986. Equity issues and offering dilution. Journal of Financial Economics 15 (JanuaryFebruary): 61-89.
Bayless, Mark, and S. Chaplinsky. 1994. Favorable pricing and hot and cold equity issue markets. Working paper. Evanston, Ill.: Northwestern University.
Cagle, Julie A. B., and Scott E. Hanington. 1995. Insurance supply with endogenous insolvency risk. Journal of Risk and Uncertainty 11:219-32.
Chevalier, J., and D. Scharfstein. 1994. Capital market imperfections and countercycli- cal markups: Theory and evidence. NBER Working Paper no. 4614. Cambridge, Mass.: National Bureau of Economic Research, January.
Cornett, M. M., and H. Tehranian. 1994. An examination of voluntary versus involun- tary security issuances by commercial banks. Journal of Financial Economics
Cummins, J. David, and Patricia Danzon. 1991. Price shocks and capital flows in liabil- ity insurance. In Cycles and crises in propertykasualty insurance: Causes and impli- cations forpublic policy, ed. J. D. Cummins, S. E. Hanington, and R. W. Klein. Kan- sas City, Mo.: National Association of Insurance Commissioners.
Cummins, J. David, and J. FranGois Outreville. 1986. An international analysis of un-
35:99-122.

27 External Financing and Insurance Cycles
derwriting cycles in property-liability insurance. Journal of Risk and Insurance
Doherty, Neil, and James Garven. 1995. Insurance cycles: Interest rates and the capacity constraint model. Journal of Business 68:383-404.
Fairley, William B. 1979. Investment income and profit margins in property-liability insurance. Bell Journal of Economics 10 (spring): 192-210.
Fazzari, F. M., R. G. Hubbard, and B. C. Petersen. 1988. Financing constraints and cor- porate investment. Brookings Papers on Economic Activity, no. 1, 141-95.
Gron, Anne. 1990. Property-casualty insurance cycles, capacity constraints, and empiri- cal results. Ph.D. diss., Massachusetts Institute of Technology, Cambridge.
. 1994a. Capacity constraints and cycles in property-casualty insurance markets. Rand Journal of Economics 25: 110-27.
. 1994b. Evidence of capacity constraints in property-casualty insurance. Jour- nal of Law and Economics 37:349-77.
Hill, R. D. 1979. Profit regulation in property-liability insurance. Bell Journal of Eco- nomics 10 (spring): 172-91.
Korajczyk, R., D. Lucas, and R. McDonald. 1990. Understanding stock price behavior around the time of equity issues. In Asymmetric information, corporate jnance, and investment, ed. R. Glenn Hubbard. Chicago: University of Chicago Press.
Loughran, Tim, and Jay Ritter. 1996. Long-term market overreaction: The effect of low- priced stocks. Journal of Finance 51: 1959-70.
Lucas, Deborah, and Robert L. McDonald. 1990. Equity issues and stock price dynam- ics. Journal of Finance 45 (4): 1019-43.
Masulis, Ronald W., and Ashok N. Konvar. 1986. Seasoned equity offerings: An empir- ical investigation. Journal of Financial Economics 15 (JanuarylFebruary): 91-1 18.
Mikkelson, Wayne H., and M. Megan Partch. 1986. Valuation effects of security offer- ings and the issuance process. Journal of Financial Economics 15 (JanuaryPebru-
Myers, S. C., and R. A. Cohn. 1987. A discounted cash flow approach to property- liability rate regulation. In Fair rate of return in property-liability insurance, ed. J. D. Cummins and S. E. Harrington. Boston: Kluwer Nijhoff.
Myers, Stewart C., and Nicholas S. Majluf. 1984. Corporate financing and investment decisions when firms have information that investors do not have. Journal of Finan- cial Economics 13:187-221.
Stewart, Barbara D. 1984. Profit cycles in property-liability insurance. In Issues in in- surance, vol. 2, ed. John D. Long and Everett D. Randall. Malvern, Pa.: American Institute for Property and Liability Underwriters.
van Aartrijk, Peter. 1985. 1984 Insurance stock trends. Best’s Review: Property- Casualty Insurance Edition 85 (10): 13-15, 103-4.
Winter, Ralph A. 1988. The liability crisis and the dynamics of competitive insurance markets. Yale Journal on Regulation 5455-500.
. 1991. The dynamics of competitive insurance markets. Toronto: University of Toronto. Mimeograph.
54:246-62.
q): 31-60.

This Page Intentionally Left Blank